Embed Size (px)
Citation preview
ISSN 1392–3730 print / ISSN 1822–3605 online
http:/www.jcem.vgtu.lt
49
JOURNAL OF CIVIL ENGINEERING AND MANAGEMENT
2008
14(1): 49–60
SHRINKAGE IN REINFORCED CONCRETE STRUCTURES:
A COMPUTATIONAL ASPECT
Viktor Gribniak1
, Gintaris Kaklauskas2
, Darius Bacinskas3
Dept of Bridges and Special Structures, Vilnius Gediminas Technical University,
Saulėtekio al. 11, LT-10223 Vilnius, Lithuania
E-mail: 1
Received 14 Dec. 2007; accepted 31 Jan. 2008
Abstract. This paper introduces the recent state of research on shrinkage of concrete. It reviews prediction models of
shrinkage strain and curvature analysis methods of reinforced concrete members. New test data on concrete shrinkage has
been presented. Various factors that influence shrinkage have been discussed. A calculation technique on short-term de-
formations of cracked reinforced concrete members including shrinkage has been introduced. The technique is based on
layer model and smeared crack approach. Shrinkage influence on behaviour of reinforced concrete beams was investi-
gated numerically and compared with test data reported in the literature. It has been shown that shrinkage has significantly
reduced the cracking resistance and leads to larger deflections.
Keywords: shrinkage, reinforced concrete, cracking, short-term loading, creep.
1. Introduction
Mechanical loading, deleterious reactions, and envi-
ronment loading can result in the development of tensile
stresses in concrete structures. Furthermore, concrete
shrink as it dries under ambient conditions. Tensile
stresses occur when free shrinkage is restrained. The
combination of high tensile stresses with low fracture
resistance of concrete often results in cracking. This
cracking reduces the durability of a concrete structure.
Effects of shrinkage and accompanying creep of
concrete along with cracking provide the major concern
to the structural designer because of the inaccuracies and
unknowns that surround them. In general, these effects
are taken into account of long-term deformation and
prestress loss analysis of reinforced concrete (RC) struc-
tures. Though considered as long-term effects, shrinkage
and creep also have influence on crack resistance and
deformations of RC members subjected to short-term
loading.
This paper introduces the recent state of research on
shrinkage of concrete and reviews the prediction models.
Factors that influence the behaviour of the shrunk rein-
forced concrete members are discussed. Shrinkage influ-
ence on short-term behaviour of reinforced concrete
beams has been investigated numerically and compared
with test data reported in the literature.
2. Factors, affecting shrinkage of concrete
Four main types of shrinkage associated with con-
crete are plastic shrinkage, autogenous shrinkage, car-
bonation shrinkage, and drying shrinkage. Plastic shrink-
age is associated with moisture loss from freshly poured
concrete into the surrounding environment. Autogenous
shrinkage is the early shrinkage of concrete caused by
loss of water from capillary pores due to the hydration of
cementitious materials, without loss of water into the
surrounding environment. This type of shrinkage tends to
increase at lower water to cementitious materials ratio
and at a higher cement content of a concrete mixture.
Carbonation shrinkage is caused by the chemical reac-
tions of various cement hydration products with carbon
dioxide present in the air. Drying shrinkage can be de-
fined as the volumetric change due to the drying of hard-
ened concrete. This type of shrinkage is caused by the
diffusion of water from hardened concrete into the sur-
rounding environment. Drying shrinkage is a volumetric
change caused by the movement and the loss of water
squeezing out from the capillary pores resulting in the
development of tensile stresses, since the internal humid-
ity attempts to make uniform with a lower environmental
humidity. More recent investigation on various aspects of
shrinkage is given in reference (Gribniak et al. 2007).
The magnitude of shrinkage deformations depends
on concrete mixture proportions and material properties,
method of curing, ambient temperature and humidity
conditions, and geometry of the concrete element. In the
analysis of concrete structures two components, i.e. dry-
ing and autogenous shrinkage, are taken into account.
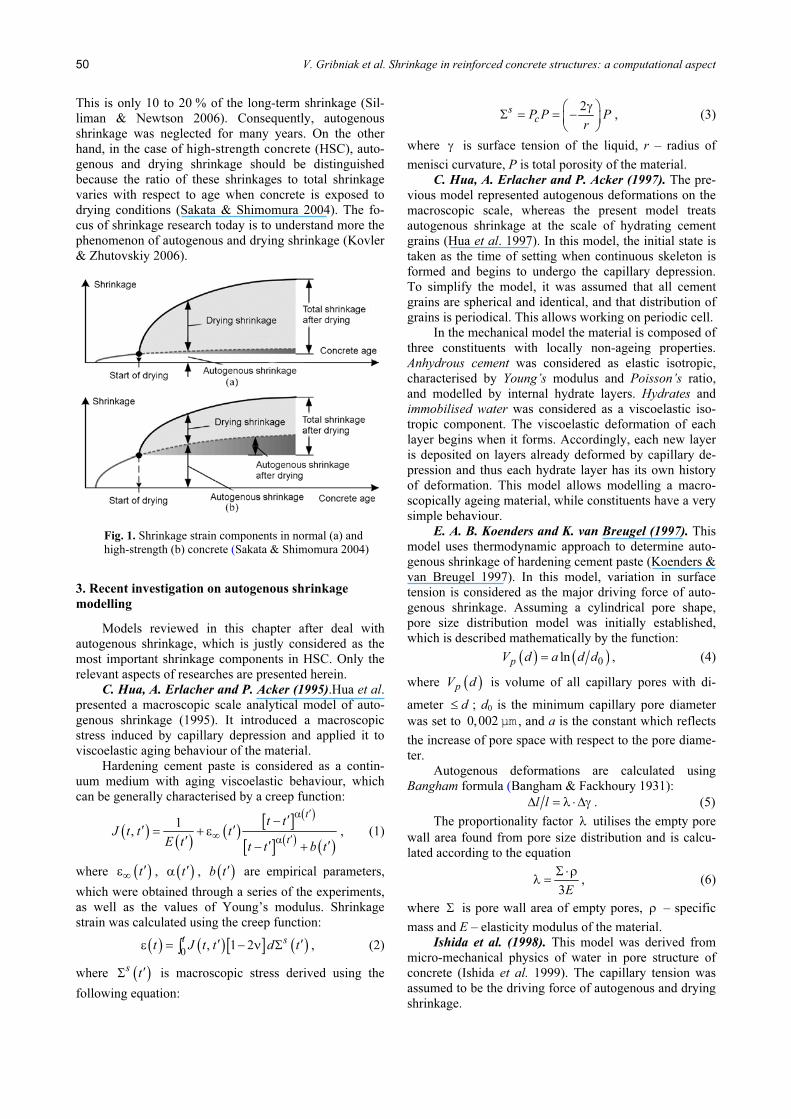
The ratio of autogenous and drying shrinkage in total
shrinkage of concrete is schematically illustrated in Fig. 1
(Sakata & Shimomura 2004). In the case of normal-
strength concrete, it is not a problem if shrinkage is
treated without distinguishing between autogenous and
drying shrinkage because for such concrete autogenous
shrinkage strain varies between 20 and 110 micro-strains.
V. Gribniak et al. Shrinkage in reinforced concrete structures: a computational aspect 50
This is only 10 to 20 % of the long-term shrinkage (Sil-
liman & Newtson 2006). Consequently, autogenous
shrinkage was neglected for many years. On the other
hand, in the case of high-strength concrete (HSC), auto-
genous and drying shrinkage should be distinguished
because the ratio of these shrinkages to total shrinkage
varies with respect to age when concrete is exposed to
drying conditions (Sakata & Shimomura 2004). The fo-
cus of shrinkage research today is to understand more the
phenomenon of autogenous and drying shrinkage (Kovler
& Zhutovskiy 2006).
Fig. 1. Shrinkage strain components in normal (a) and
high-strength (b) concrete (Sakata & Shimomura 2004)
3. Recent investigation on autogenous shrinkage
modelling
Models reviewed in this chapter after deal with
autogenous shrinkage, which is justly considered as the
most important shrinkage components in HSC. Only the
relevant aspects of researches are presented herein.
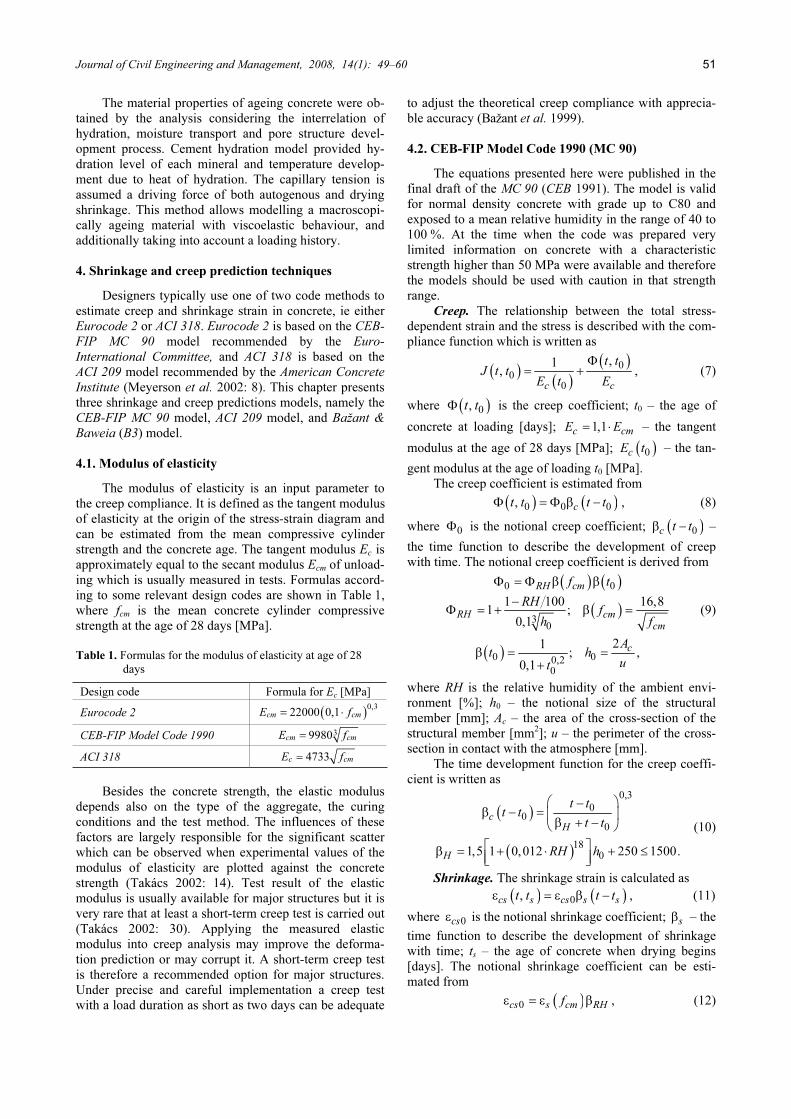
C. Hua, A. Erlacher and P. Acker (1995).Hua et al.
presented a macroscopic scale analytical model of auto-
genous shrinkage (1995). It introduced a macroscopic
stress induced by capillary depression and applied it to
viscoelastic aging behaviour of the material.
Hardening cement paste is considered as a contin-
uum medium with aging viscoelastic behaviour, which
can be generally characterised by a creep function:
( )
( )
( )
[ ]( )
[ ]( )
( )
1
,
t
t
t t
J t t t
E tt t b t
′α
∞′α
′−
′ ′= + ε
′′ ′− +
, (1)
where ( )t∞
′ε , ( )t′α , ( )b t′ are empirical parameters,
which were obtained through a series of the experiments,
as well as the values of Young’s modulus. Shrinkage
strain was calculated using the creep function:
( ) ( )[ ] ( )0
, 1 2
t s
t J t t d t′ ′ε = − ν Σ∫ , (2)
where ( )s
t′Σ is macroscopic stress derived using the
following equation:
2s
c
P P P
r
γ⎛ ⎞Σ = = −
⎜ ⎟⎝ ⎠
, (3)
where γ is surface tension of the liquid, r – radius of
menisci curvature, P is total porosity of the material.
C. Hua, A. Erlacher and P. Acker (1997). The pre-
vious model represented autogenous deformations on the
macroscopic scale, whereas the present model treats
autogenous shrinkage at the scale of hydrating cement
grains (Hua et al. 1997). In this model, the initial state is
taken as the time of setting when continuous skeleton is
formed and begins to undergo the capillary depression.
To simplify the model, it was assumed that all cement
grains are spherical and identical, and that distribution of
grains is periodical. This allows working on periodic cell.
In the mechanical model the material is composed of
three constituents with locally non-ageing properties.
Anhydrous cement was considered as elastic isotropic,
characterised by Young’s modulus and Poisson’s ratio,
and modelled by internal hydrate layers. Hydrates and
immobilised water was considered as a viscoelastic iso-
tropic component. The viscoelastic deformation of each
layer begins when it forms. Accordingly, each new layer
is deposited on layers already deformed by capillary de-
pression and thus each hydrate layer has its own history
of deformation. This model allows modelling a macro-
scopically ageing material, while constituents have a very
simple behaviour.
E. A. B. Koenders and K. van Breugel (1997). This
model uses thermodynamic approach to determine auto-
genous shrinkage of hardening cement paste (Koenders &
van Breugel 1997). In this model, variation in surface
tension is considered as the major driving force of auto-
genous shrinkage. Assuming a cylindrical pore shape,
pore size distribution model was initially established,
which is described mathematically by the function:
( ) ( )0
lnp
V d a d d= , (4)
where ( )p
V d is volume of all capillary pores with di-
ameter d≤ ; d0 is the minimum capillary pore diameter
was set to 0,002 µm , and a is the constant which reflects
the increase of pore space with respect to the pore diame-
ter.
Autogenous deformations are calculated using
Bangham formula (Bangham & Fackhoury 1931):
l l∆ = λ ⋅∆γ . (5)
The proportionality factor λ utilises the empty pore
wall area found from pore size distribution and is calcu-
lated according to the equation
3E
Σ ⋅ρ
λ = , (6)
where Σ is pore wall area of empty pores, ρ – specific
mass and E – elasticity modulus of the material.
Ishida et al. (1998). This model was derived from
micro-mechanical physics of water in pore structure of
concrete (Ishida et al. 1999). The capillary tension was
assumed to be the driving force of autogenous and drying
shrinkage.
Journal of Civil Engineering and Management, 2008, 14(1): 49–60 51
The material properties of ageing concrete were ob-
tained by the analysis considering the interrelation of
hydration, moisture transport and pore structure devel-
opment process. Cement hydration model provided hy-
dration level of each mineral and temperature develop-
ment due to heat of hydration. The capillary tension is
assumed a driving force of both autogenous and drying
shrinkage. This method allows modelling a macroscopi-
cally ageing material with viscoelastic behaviour, and
additionally taking into account a loading history.
4. Shrinkage and creep prediction techniques
Designers typically use one of two code methods to
estimate creep and shrinkage strain in concrete, ie either
Eurocode 2 or ACI 318. Eurocode 2 is based on the CEB-
FIP MC 90 model recommended by the Euro-
International Committee, and ACI 318 is based on the
ACI 209 model recommended by the American Concrete
Institute (Meyerson et al. 2002: 8). This chapter presents
three shrinkage and creep predictions models, namely the
CEB-FIP MC 90 model, ACI 209 model, and Bažant &
Baweia (B3) model.
4.1. Modulus of elasticity
The modulus of elasticity is an input parameter to
the creep compliance. It is defined as the tangent modulus
of elasticity at the origin of the stress-strain diagram and
can be estimated from the mean compressive cylinder
strength and the concrete age. The tangent modulus Ec is
approximately equal to the secant modulus Ecm
of unload-
ing which is usually measured in tests. Formulas accord-
ing to some relevant design codes are shown in Table 1,
where fcm
is the mean concrete cylinder compressive
strength at the age of 28 days [MPa].
Table 1. Formulas for the modulus of elasticity at age of 28
days
Design code Formula for Ec [MPa]
Eurocode 2 ( )0,3
22000 0,1cm cm
E f= ⋅
CEB-FIP Model Code 19903
9980cm cm
E f=
ACI 318 4733c cm
E f=
Besides the concrete strength, the elastic modulus
depends also on the type of the aggregate, the curing
conditions and the test method. The influences of these
factors are largely responsible for the significant scatter
which can be observed when experimental values of the
modulus of elasticity are plotted against the concrete
strength (Takács 2002: 14). Test result of the elastic
modulus is usually available for major structures but it is
very rare that at least a short-term creep test is carried out
(Takács 2002: 30). Applying the measured elastic
modulus into creep analysis may improve the deforma-
tion prediction or may corrupt it. A short-term creep test
is therefore a recommended option for major structures.
Under precise and careful implementation a creep test
with a load duration as short as two days can be adequate
to adjust the theoretical creep compliance with apprecia-
ble accuracy (Bažant et al. 1999).
4.2. CEB-FIP Model Code 1990 (MC 90)
The equations presented here were published in the
final draft of the MC 90 (CEB 1991). The model is valid
for normal density concrete with grade up to C80 and
exposed to a mean relative humidity in the range of 40 to
100 %. At the time when the code was prepared very
limited information on concrete with a characteristic
strength higher than 50 MPa were available and therefore
the models should be used with caution in that strength
range.
Creep. The relationship between the total stress-
dependent strain and the stress is described with the com-
pliance function which is written as
( )
( )
( )0
0
0
,1
,
c c
t t
J t t
E t E
Φ
= + , (7)
where ( )0
,t tΦ is the creep coefficient; t0 – the age of
concrete at loading [days]; 1,1c cm
E E= ⋅ – the tangent
modulus at the age of 28 days [MPa]; ( )0c
E t – the tan-
gent modulus at the age of loading t0 [MPa].
The creep coefficient is estimated from
( ) ( )0 0 0
,
c
t t t tΦ = Φ β − , (8)
where 0
Φ is the notional creep coefficient; ( )0c
t tβ − –
the time function to describe the development of creep
with time. The notional creep coefficient is derived from
( ) ( )
( )
( )
0 0
3
0
0 00,2
0
1 100 16,8
1 ;
0,1
21
; ,
0,1
RH cm
RH cm
cm
c
f t
RH
f
h f
A
t h
ut
Φ = Φ β β
−
Φ = + β =
β = =
+
(9)
where RH is the relative humidity of the ambient envi-
ronment [%]; h0 – the notional size of the structural
member [mm]; Ac – the area of the cross-section of the
structural member [mm2
]; u – the perimeter of the cross-
section in contact with the atmosphere [mm].
The time development function for the creep coeffi-
cient is written as
( )
( )
0,3
0
0
0
18
01,5 1 0,012 250 1500.
c
H
H
t t
t t
t t
RH h
⎛ ⎞−β − = ⎜ ⎟
β + −⎝ ⎠
⎡ ⎤β = + ⋅ + ≤
⎢ ⎥⎣ ⎦
(10)
Shrinkage. The shrinkage strain is calculated as
( ) ( )0
,
cs s cs s s
t t t tε = ε β − , (11)
where 0cs
ε is the notional shrinkage coefficient; s
β – the
time function to describe the development of shrinkage
with time; ts – the age of concrete when drying begins
[days]. The notional shrinkage coefficient can be esti-
mated from
( )0cs s cm RH
fε = ε β , (12)
V. Gribniak et al. Shrinkage in reinforced concrete structures: a computational aspect 52
where
( ) ( )6
3
1
1
160 10 9 0,1 10
1,55 1 , 99 %
100
0,25, 99 %,
s cm sc cm
s
RH
s
f f
RH
RH
RH
−
⎡ ⎤ε = + β − ⋅⎣ ⎦
⎧ ⎡ ⎤⎛ ⎞
⎪ ⎢ ⎥− ⋅ − < β ⋅⎪ ⎜ ⎟β = ⎢ ⎥⎝ ⎠⎨
⎣ ⎦⎪
≥ β ⋅⎪⎩
(13)
where sc
β is a coefficient which depends on the cement
type, 4 for slowly hardening cement, 5 for normal and
rapid hardening cement and 8 for rapid hardening high
strength cement; factor 1s
β was assumed equal to 1,0. RH
in Eq (13) should be not less than 40 %.
The development of shrinkage with time is given by
( )2
00,035
s
s s
s
t t
t t
h t t
−
β − =
⋅ + −
. (14)
The influence of mean temperature other than 20° C
can be also taken into account. With the decreasing tem-
perature both the notional creep coefficient and the notio-
nal shrinkage coefficient are decreasing and their deve-
lopment with time are decelerated.
4.3. The 1999 update of the CEB-FIP MC 1990
The models were published in the fib Bulletin (FIB
1999). The primary intention with the update was to im-
prove the prediction models for high-strength concrete
and further extend the validity of the models to high-
performance concrete.
Creep. The updated creep model was in fact first
published in Eurocode 2 (CEN 2001). It is closely related
to the model in the MC 90 (CEB 1991), but three strength
dependent coefficients were introduced into the original
model. The extended model is valid for both normal
strength concrete and high performance concrete up to
concrete cylinder strength of 110 MPa. Three coefficients
were introduced into the MC 90 model:
0,7 0,2 0,5
1 2 3
35 35 35
; ; .
cm cm cm
f f f
⎛ ⎞ ⎛ ⎞ ⎛ ⎞
α = α = α =⎜ ⎟ ⎜ ⎟ ⎜ ⎟
⎝ ⎠ ⎝ ⎠ ⎝ ⎠
(15)
Coefficients 1
α and 2
α are meant to adjust the no-
tional creep coefficient through the RH
Φ term. Coeffi-
cient 3
α is meant to be the adjustment for the time de-
pendency function. Eqs (9) and (10) have been rearranged
in following form:
( )
2 13
18
0 3 3
1 100
1 ;
0,1
1,5 1 0,012 250 1500 .
RH
H
RH
h
RH h
⎛ ⎞−Φ = α +α⎜ ⎟
⎜ ⎟⎝ ⎠
⎡ ⎤β = + + α ≤ α
⎢ ⎥⎣ ⎦
(16)
Shrinkage. The shrinkage model represents a major
change. The total shrinkage is subdivided into the auto-
genous shrinkage component and the drying shrinkage
component. With this approach it was possible to formu-
late a model which is valid for both normal strength con-
crete and high performance concrete having compressive
strength up to 120 MPa.
The total shrinkage strain at time t is calculated as
( ) ( ) ( ), ,
cs s cas cds st t t t tε = ε + ε (17)
with
( ) ( ) ( )
( ) ( ) ( ) ( )
0
0, ,
cas cas cm as
cds s cds cm RH ds s
t f t
t t f RH t t
ε = ε ⋅β
ε = ε ⋅β ⋅β −
(18)
where ( )cas
tε and ( ),
cds st tε are the autogenous and
drying shrinkage strain at time t, respectively;
( )0cas cm
fε and ( )0cds cm
fε are the notional autogenous
and drying shrinkage coefficients, respectively; ( )as
tβ
and ( )ds s
t tβ − are the time development function for
autogenous and drying shrinkage, respectively;
( )RH
RHβ is the coefficient taking into account the ef-
fect of relative humidity on drying; t – the concrete age
[days]; ts – the age of concrete, when drying begins
[days]; s
t t− – the duration of drying [days].
The formulations for estimating the autogenous
shrinkage are written as
( )
( )
2,5
6
0
0,2
0,1
10
6 0,1
1 ,
cm
cas cm as
cm
t
as
f
f
f
t e
−
−
⎛ ⎞⋅ε = −α ⋅⎜ ⎟
+ ⋅⎝ ⎠
β = −
(19)
where as
α is a coefficient which depends on the cement
type, 800 for slowly hardening cement, 700 for normal
and rapidly hardening cement and 600 for rapidly harden-
ing high-strength cement.
In Eurocode 2 (CEN 2001) autogenous shrinkage is
calculated using the following equation:
( ) ( )6
02,5 10 10
cas ck ckf f
−
ε = − − ⋅ . (20)
The formulations for estimating the drying shrinkage
are written as
( ) ( )
( )
20,1 6
0 1
0,1
1
220 110 10
35 ,
ds cmf
cds cm ds
s cm
f e
f
− α −⎡ ⎤ε = + α ⋅⎣ ⎦
β =
(21)
where 1ds
α is a coefficient which depends on the cement
type, 3 for slowly hardening cement, 4 for normal and
rapidly hardening cement and 6 for rapidly hardening
high-strength cement; 2ds
α is a coefficient which de-
pends on the cement type, 0,13 for slowly hardening ce-
ment, 0,11 for normal and rapidly hardening cement and
0,12 for rapidly hardening high-strength cement. Coeffi-
cients RH
β and ( )s s
t tβ − are derived according to for-
mulas (13) and (14) using factor 1s
β calculated by
Eq (21). The effect of ageing on the elastic modulus can
be taken into account using the following equation:
( ) ( )c E c
E t t E= β , (22)
where ( )c
E t is the modulus of elasticity of the concrete
at age of t days [MPa], ( )E
tβ – the time development
function for the elastic modulus. This function can be
derived from the relationship
Journal of Civil Engineering and Management, 2008, 14(1): 49–60 53
( )28
exp 1E
t s
t
α
⎛ ⎞⎧ ⎫⎡ ⎤⎪ ⎪⎜ ⎟β = −⎢ ⎥⎨ ⎬⎜ ⎟⎢ ⎥⎪ ⎪⎣ ⎦⎩ ⎭⎝ ⎠
, (23)
where t is the concrete age [day]; s – a coefficient which
depends on the cement type, 0,20 for rapid hardening
high-strength cement, 0,25 for normal and rapid harden-
ing cement and 0,38 for slowly hardening cement; α is
parameter assumed equal to 0,3.
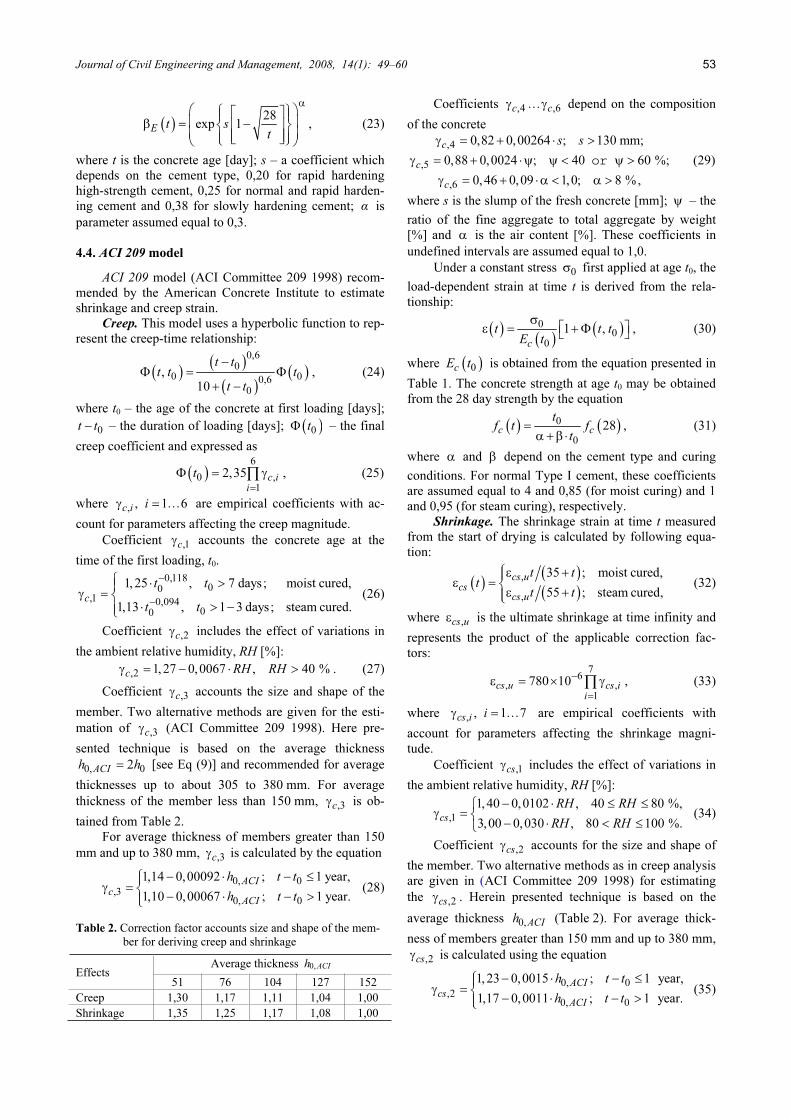
4.4. ACI 209 model
ACI 209 model (ACI Committee 209 1998) recom-
mended by the American Concrete Institute to estimate
shrinkage and creep strain.
Creep. This model uses a hyperbolic function to rep-
resent the creep-time relationship:
( )
( )
( )
( )
0,6
0
0 00,6
0
,
10
t t
t t t
t t
−
Φ = Φ
+ −
, (24)
where t0 – the age of the concrete at first loading [days];
0t t− – the duration of loading [days]; ( )
0tΦ – the final
creep coefficient and expressed as
( )
6
0 ,
1
2,35c i
i
t
=
Φ = γ∏ , (25)
where ,
, 1 6c i
iγ = … are empirical coefficients with ac-
count for parameters affecting the creep magnitude.
Coefficient ,1c
γ accounts the concrete age at the
time of the first loading, t0.
0,118
00
,10,094
00
1, 25 , 7 days; moist cured,
1,13 , 1 3 days; steam cured.
c
t t
t t
−
−
⎧ ⋅ >⎪γ = ⎨
⋅ > −⎪⎩
(26)
Coefficient ,2c
γ includes the effect of variations in
the ambient relative humidity, RH [%]:
,2
1,27 0,0067 , 40 %c
RH RHγ = − ⋅ > . (27)
Coefficient ,3c
γ accounts the size and shape of the
member. Two alternative methods are given for the esti-
mation of ,3c
γ (ACI Committee 209 1998). Here pre-
sented technique is based on the average thickness
0, 02
ACIh h= [see Eq (9)] and recommended for average
thicknesses up to about 305 to 380 mm. For average
thickness of the member less than 150 mm, ,3c
γ is ob-
tained from Table 2.
For average thickness of members greater than 150
mm and up to 380 mm, ,3c
γ is calculated by the equation
0, 0
,3
0, 0
1,14 0,00092 ; 1 year,
1,10 0,00067 ; 1 year.
ACI
c
ACI
h t t
h t t
− ⋅ − ≤⎧⎪γ = ⎨
− ⋅ − >⎪⎩
(28)
Table 2. Correction factor accounts size and shape of the mem-
ber for deriving creep and shrinkage
Average thickness 0,ACIh
Effects
51 76 104 127 152
Creep 1,30 1,17 1,11 1,04 1,00
Shrinkage 1,35 1,25 1,17 1,08 1,00
Coefficients ,4 ,6c c
γ γ… depend on the composition
of the concrete
,4
,5
,6
0,82 0,00264 ; 130 mm;
0,88 0,0024 ; 40 60 %;
0,46 0,09 1,0; 8 %,
c
c
c
s sγ = + ⋅ >
γ = + ⋅ψ ψ < ψ >
γ = + ⋅α < α >
or (29)
where s is the slump of the fresh concrete [mm]; ψ – the
ratio of the fine aggregate to total aggregate by weight
[%] and α is the air content [%]. These coefficients in
undefined intervals are assumed equal to 1,0.
Under a constant stress 0
σ first applied at age t0, the
load-dependent strain at time t is derived from the rela-
tionship:
( )
( )
( )0
0
0
1 ,
c
t t t
E t
σ
⎡ ⎤ε = +Φ⎣ ⎦
, (30)
where ( )0c
E t is obtained from the equation presented in
Table 1. The concrete strength at age t0 may be obtained
from the 28 day strength by the equation
( ) ( )0
0
28c c
t
f t f
t
=
α +β⋅
, (31)
where α and β depend on the cement type and curing
conditions. For normal Type I cement, these coefficients
are assumed equal to 4 and 0,85 (for moist curing) and 1
and 0,95 (for steam curing), respectively.
Shrinkage. The shrinkage strain at time t measured
from the start of drying is calculated by following equa-
tion:
( )
( )
( )
,
,
35 ; moist cured,
55 ; steam cured,
cs u
cs
cs u
t t
t
t t
⎧ε +⎪ε = ⎨
ε +⎪⎩
(32)
where ,cs u
ε is the ultimate shrinkage at time infinity and
represents the product of the applicable correction fac-
tors:
7
6
, ,
1
780 10cs u cs i
i
−
=
ε = × γ∏ , (33)
where ,
, 1 7cs i
iγ = … are empirical coefficients with
account for parameters affecting the shrinkage magni-
tude.
Coefficient ,1cs
γ includes the effect of variations in
the ambient relative humidity, RH [%]:
,1
1,40 0,0102 , 40 80 %,
3,00 0,030 , 80 100 %.cs
RH RH
RH RH
− ⋅ ≤ ≤⎧γ = ⎨
− ⋅ < ≤⎩
(34)
Coefficient ,2cs
γ accounts for the size and shape of
the member. Two alternative methods as in creep analysis
are given in (ACI Committee 209 1998) for estimating
the ,2cs
γ . Herein presented technique is based on the
average thickness 0,ACIh (Table 2). For average thick-
ness of members greater than 150 mm and up to 380 mm,
,2cs
γ is calculated using the equation
0, 0
,2
0, 0
1,23 0,0015 ; 1 year,
1,17 0,0011 ; 1 year.
ACI
cs
ACI
h t t
h t t
− ⋅ − ≤⎧⎪γ = ⎨
− ⋅ − >⎪⎩
(35)
V. Gribniak et al. Shrinkage in reinforced concrete structures: a computational aspect 54
Coefficients ,3 ,7cs cs
γ γ… depend on the composi-
tion of the concrete
,3
,4
,5
,6
0,89 0,00161 ; 130 mm;
0,30 0,014 ; 50 %;
0,90 0,002 ; 50 %;
0,95 0,008 ; 8 %;
0,75 0,00061 ,
cs
cs
cs
cs
s s
c
γ = + ⋅ >
+ ⋅ψ ψ ≤⎧γ = ⎨
+ ⋅ψ ψ >⎩
γ = + ⋅α α >
γ = + ⋅
(36)
where c is cement content in concrete [kg/m3
]; other pa-
rameters are analogous to Eq (29). These coefficients in
undefined intervals are assumed equal to 1,0.
Table 3. Shrinkage correction factor accounts for initial moist
curing period
Curing period, days 1 3 7 14 28 90
,7cs
γ 1,2 1,1 1,0 0,93 0,86 0,75
Coefficient ,7cs
γ accounts for variations in the pe-
riod of initial moist curing and is presented in Table 3.
For a concrete which is steam cured for a period of be-
tween one and three days ,7
1,0cs
γ = .
4.5. Bažant & Baweia (B3) model
The complete description of the B3 model can be
found in (Bažant & Baweja 1995a, 1995b).
Creep. An important feature of the B3 creep model
is that the compliance function is decomposed into the
instantaneous response, the compliance function for basic
creep and the additional compliance function for drying
creep. The creep compliance is written as
( ) ( ) ( )0 0 0 0
0
1
, , , ,d s
J t t C t t C t t t
E
= + + , (37)
where E0 is the so-called asymptotic modulus; ( )
0 0,C t t
and ( )0
, ,
d sC t t t are the compliance function for basic
and drying creep, respectively.
The instantaneous response is defined with the so-
called asymptotic modulus, E0, which is not the same as
the conventional static modulus. The asymptotic modulus
is considered age independent. Its value is higher than the
real elastic modulus and it can be estimated as
01,5E E≈ . According to Bažant, it is more convenient to
use the asymptotic modulus because concrete exhibits a
pronounced creep even after a short loading.
Shrinkage. The shrinkage strain at time t is defined
as:
( ) ( )0
,
cs cs RHt t k S t
∞
ε = −ε , (38)
where
( )
( ) ( )
2 2,1 0,28 6
1 2
0
1,9 10 270 10 ,
tanh ,
cs cm
sh
w f
S t t t
− − −
∞
ε = α α × + ×
= − τ
(39)
where cs∞
ε is the ultimate shrinkage; ( )S t – the time
function for shrinkage; 1
α and 2
α are the correlation
terms for effects of cement type and curing conditions,
respectively; w – the water content; kRH
– humidity de-
pendence factor; t – the age of concrete; t0 – the age,
when during begins; shτ – the size dependence factor.
The B3 model takes into account the influence of the
material composition directly. Besides model parameters,
which are considered in previously reviewed models, the
cement content, the water-cement ratio, the aggregate-
cement ratio and the water content are taken into account.
5. Experimental investigations of concrete shrinkage
An important but often overlooked property of creep
and shrinkage prediction models is the expected error of
the prediction. Creep and shrinkage are among the most
uncertain mechanical properties of concrete. The theo-
retical models only predict the mean tendencies based on
observations in available experimental data. In any par-
ticular prediction the effect of a certain parameter may be
overestimated or underestimated (Takács 2002: 17). This
chapter introduces experimental shrinkage measurements
performed by the authors and performs a comparison
with the predictions by Eurocode 2 and ACI 209 predic-
tions against these data.
Table 4. Mix proportion of the experimental specimens
Explanation Measure Amount
Sand, 0/4 mm kg/m3
905 ± 2 %
Crushed aggregate, 5/8 mm kg/m3
388 ± 1 %
Crushed aggregate, 11/16 mm kg/m3
548 ± 1 %
Cement CEM I 42,5 N kg/m3
400 ± 0,5 %
Water kg/m3
123,8 ± 5 %
Concrete plasticiser Muraplast kg/m3
2 ± 2 %
The tests were performed in the laboratory of Vil-
nius Gediminas Technical University in 2005. The ex-
perimental specimens were cured under the laboratory
conditions at average relative humidity (RH) 64,7 % and
average temperature 13,1 °C. Concrete mix proportion is
given in Table 4. The ordinary Portland cement and
crushed aggregate (16 mm maximum nominal size) were
used. Water/cement and aggregate/cement ratio by weight
were taken as 0,42 and 2,97, respectively.
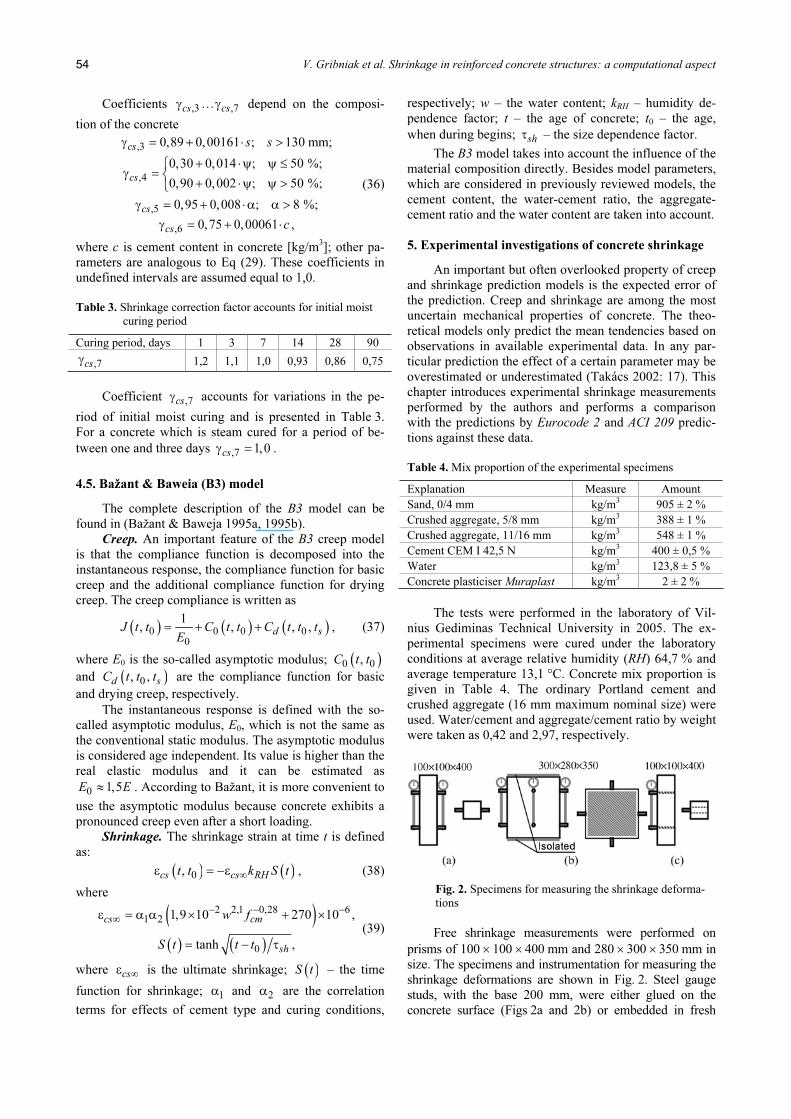
Fig. 2. Specimens for measuring the shrinkage deforma-
tions
Free shrinkage measurements were performed on
prisms of 100 × 100 × 400 mm and 280 × 300 × 350 mm in
size. The specimens and instrumentation for measuring the
shrinkage deformations are shown in Fig. 2. Steel gauge
studs, with the base 200 mm, were either glued on the
concrete surface (Figs 2a and 2b) or embedded in fresh
Journal of Civil Engineering and Management, 2008, 14(1): 49–60 55
concrete (Fig. 2c). In the latter case, free shrinkage meas-
urements were initiated in 24 h after casting, whereas
measurements on other prisms were started in 3-4 days.
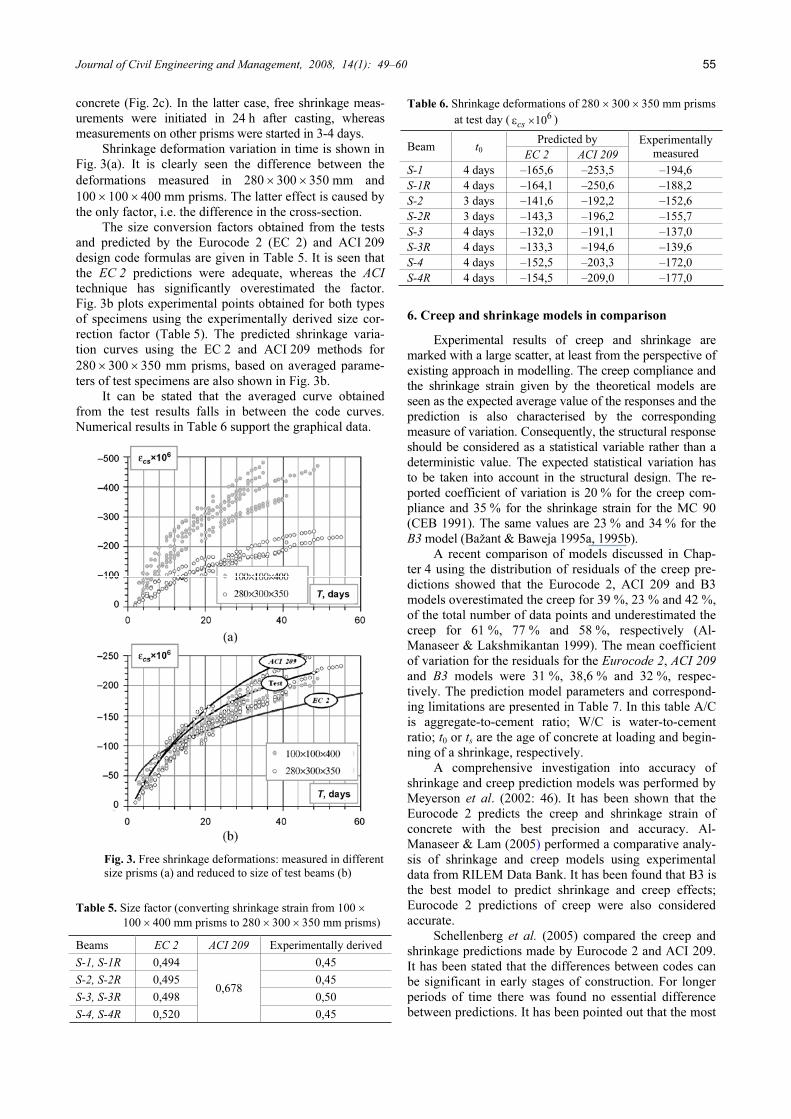
Shrinkage deformation variation in time is shown in
Fig. 3(a). It is clearly seen the difference between the
deformations measured in 280 × 300 × 350 mm and
100 × 100 × 400 mm prisms. The latter effect is caused by
the only factor, i.e. the difference in the cross-section.
The size conversion factors obtained from the tests
and predicted by the Eurocode 2 (EC 2) and ACI 209
design code formulas are given in Table 5. It is seen that
the EC 2 predictions were adequate, whereas the ACI
technique has significantly overestimated the factor.
Fig. 3b plots experimental points obtained for both types
of specimens using the experimentally derived size cor-
rection factor (Table 5). The predicted shrinkage varia-
tion curves using the EC 2 and ACI 209 methods for
280 × 300 × 350 mm prisms, based on averaged parame-
ters of test specimens are also shown in Fig. 3b.
It can be stated that the averaged curve obtained
from the test results falls in between the code curves.
Numerical results in Table 6 support the graphical data.
Fig. 3. Free shrinkage deformations: measured in different
size prisms (a) and reduced to size of test beams (b)
Table 5. Size factor (converting shrinkage strain from 100 ×
100 × 400 mm prisms to 280 × 300 × 350 mm prisms)
Beams EC 2 ACI 209 Experimentally derived
S-1, S-1R 0,494 0,45
S-2, S-2R 0,495 0,45
S-3, S-3R 0,498 0,50
S-4, S-4R 0,520
0,678
0,45
Table 6. Shrinkage deformations of 280 × 300 × 350 mm prisms
at test day (6
10cs
ε × )
Predicted by
Beam t0
EC 2 ACI 209
Experimentally
measured
S-1 4 days –165,6 –253,5 –194,6
S-1R 4 days –164,1 –250,6 –188,2
S-2 3 days –141,6 –192,2 –152,6
S-2R 3 days –143,3 –196,2 –155,7
S-3 4 days –132,0 –191,1 –137,0
S-3R 4 days –133,3 –194,6 –139,6
S-4 4 days –152,5 –203,3 –172,0
S-4R 4 days –154,5 –209,0 –177,0
6. Creep and shrinkage models in comparison
Experimental results of creep and shrinkage are
marked with a large scatter, at least from the perspective of
existing approach in modelling. The creep compliance and
the shrinkage strain given by the theoretical models are
seen as the expected average value of the responses and the
prediction is also characterised by the corresponding
measure of variation. Consequently, the structural response
should be considered as a statistical variable rather than a
deterministic value. The expected statistical variation has
to be taken into account in the structural design. The re-
ported coefficient of variation is 20 % for the creep com-
pliance and 35 % for the shrinkage strain for the MC 90
(CEB 1991). The same values are 23 % and 34 % for the
B3 model (Bažant & Baweja 1995a, 1995b).
A recent comparison of models discussed in Chap-
ter 4 using the distribution of residuals of the creep pre-
dictions showed that the Eurocode 2, ACI 209 and B3
models overestimated the creep for 39 %, 23 % and 42 %,
of the total number of data points and underestimated the
creep for 61 %, 77 % and 58 %, respectively (Al-
Manaseer & Lakshmikantan 1999). The mean coefficient
of variation for the residuals for the Eurocode 2, ACI 209
and B3 models were 31 %, 38,6 % and 32 %, respec-
tively. The prediction model parameters and correspond-
ing limitations are presented in Table 7. In this table A/C
is aggregate-to-cement ratio; W/C is water-to-cement
ratio; t0 or t
s are the age of concrete at loading and begin-
ning of a shrinkage, respectively.
A comprehensive investigation into accuracy of
shrinkage and creep prediction models was performed by
Meyerson et al. (2002: 46). It has been shown that the
Eurocode 2 predicts the creep and shrinkage strain of
concrete with the best precision and accuracy. Al-
Manaseer & Lam (2005) performed a comparative analy-
sis of shrinkage and creep models using experimental
data from RILEM Data Bank. It has been found that B3 is
the best model to predict shrinkage and creep effects;
Eurocode 2 predictions of creep were also considered
accurate.
Schellenberg et al. (2005) compared the creep and
shrinkage predictions made by Eurocode 2 and ACI 209.
It has been stated that the differences between codes can
be significant in early stages of construction. For longer
periods of time there was found no essential difference
between predictions. It has been pointed out that the most
V. Gribniak et al. Shrinkage in reinforced concrete structures: a computational aspect 56
important thing is taking the shrinkage and creep effects
into consideration, while it is only of a secondary impor-
tance which code is applied.
Table 7. Models variables and limitations
Variable EC 2 ACI 209 B3
fcm
[MPa] 20–120 – 17–69
A/C – – 2,5–13,5
Cement [kg/m3
] – – 160–720
W/C – – 0,35–0,85
RH [%] 40–100 40–100 40–100
Cement type I, II or III I or III I, II or III
t0 or t
s (moist cured) – 7≥ days
0s
t t≤
t0 or t
s (steam cured) – 1 3≥ − days
0s
t t≤
7. Influence of shrinkage and creep on deformations
of RC structures
Under restraining conditions, shrinkage is always as-
sociated with creep which relieves the stresses induced by
shrinkage. In general, shrinkage and creep are taken into
account of long-term deformation and prestress loss
analysis of concrete structures (Zamblauskaitė et al.
2005). Though considered as a long-term effect, shrink-
age may significantly reduce crack resistance and in-
crease deformations of RC members subjected to short-
term loading (Bischoff 2001; Sato et al. 2007). However,
most of the known techniques do not include these effects
in a short-term analysis.
To better understand how volumetric changes of
hardened concrete can result in cracking, Fig. 4(a) com-
pares the time dependent strength (cracking resistance)
development with the time dependent residual stresses that
develop. If strength and residual stress development are
plotted as shown in Fig. 4(a), it is likely that the specimen
will crack when these two lines intersect. Similarly, it fol-
lows that if strength of the concrete is always greater than
the developed stresses, no cracking will occur.
The residual stress that develops in concrete as a re-
sult of restraint may sometimes be difficult to quantify.
This residual stress cannot be computed directly by mul-
tiplying the free shrinkage strain by the elastic modulus
(ie Hooke’s Law) since stress relaxation occurs. Stress
relaxation is similar to creep. However, while creep can
be thought of as the time dependent deformation due to a
sustained load, stress relaxation is a term used to describe
the reduction in stress under a constant deformation. This
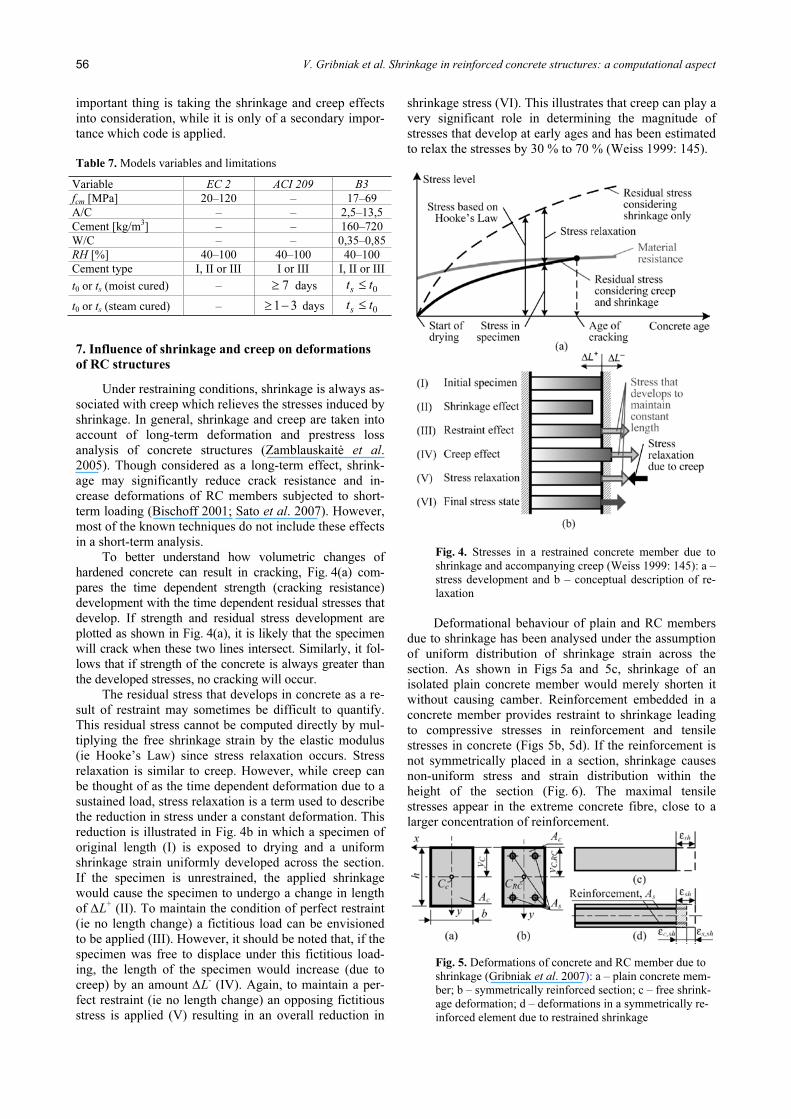
reduction is illustrated in Fig. 4b in which a specimen of
original length (I) is exposed to drying and a uniform
shrinkage strain uniformly developed across the section.
If the specimen is unrestrained, the applied shrinkage
would cause the specimen to undergo a change in length
of ∆L+
(II). To maintain the condition of perfect restraint
(ie no length change) a fictitious load can be envisioned
to be applied (III). However, it should be noted that, if the
specimen was free to displace under this fictitious load-
ing, the length of the specimen would increase (due to
creep) by an amount ∆L-
(IV). Again, to maintain a per-
fect restraint (ie no length change) an opposing fictitious
stress is applied (V) resulting in an overall reduction in
shrinkage stress (VI). This illustrates that creep can play a
very significant role in determining the magnitude of
stresses that develop at early ages and has been estimated
to relax the stresses by 30 % to 70 % (Weiss 1999: 145).
Fig. 4. Stresses in a restrained concrete member due to
shrinkage and accompanying creep (Weiss 1999: 145): a –
stress development and b – conceptual description of re-
laxation
Deformational behaviour of plain and RC members
due to shrinkage has been analysed under the assumption
of uniform distribution of shrinkage strain across the
section. As shown in Figs 5a and 5c, shrinkage of an
isolated plain concrete member would merely shorten it
without causing camber. Reinforcement embedded in a
concrete member provides restraint to shrinkage leading
to compressive stresses in reinforcement and tensile
stresses in concrete (Figs 5b, 5d). If the reinforcement is
not symmetrically placed in a section, shrinkage causes
non-uniform stress and strain distribution within the
height of the section (Fig. 6). The maximal tensile
stresses appear in the extreme concrete fibre, close to a
larger concentration of reinforcement.
Fig. 5. Deformations of concrete and RC member due to
shrinkage (Gribniak et al. 2007): a – plain concrete mem-
ber; b – symmetrically reinforced section; c – free shrink-
age deformation; d – deformations in a symmetrically re-
inforced element due to restrained shrinkage
Journal of Civil Engineering and Management, 2008, 14(1): 49–60 57
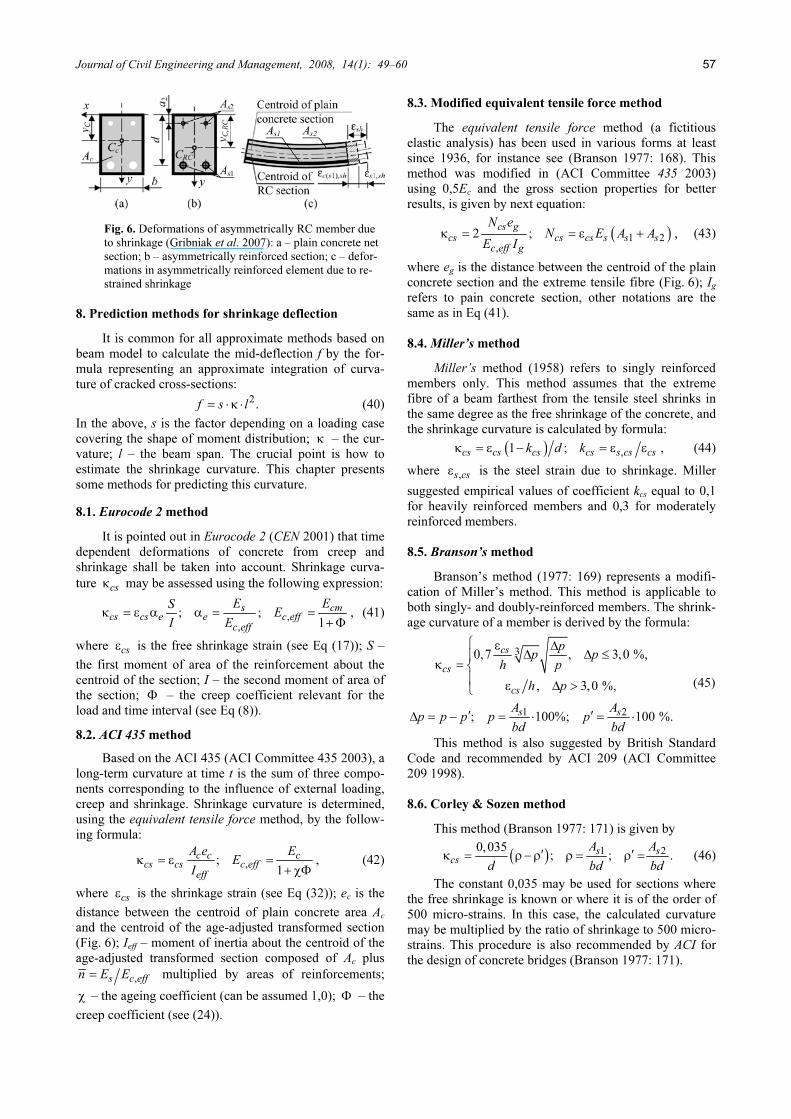
Fig. 6. Deformations of asymmetrically RC member due
to shrinkage (Gribniak et al. 2007): a – plain concrete net
section; b – asymmetrically reinforced section; c – defor-
mations in asymmetrically reinforced element due to re-
strained shrinkage
8. Prediction methods for shrinkage deflection
It is common for all approximate methods based on
beam model to calculate the mid-deflection f by the for-
mula representing an approximate integration of curva-
ture of cracked cross-sections:
2
.f s l= ⋅ κ ⋅ (40)
In the above, s is the factor depending on a loading case
covering the shape of moment distribution; κ – the cur-
vature; l – the beam span. The crucial point is how to
estimate the shrinkage curvature. This chapter presents
some methods for predicting this curvature.
8.1. Eurocode 2 method
It is pointed out in Eurocode 2 (CEN 2001) that time
dependent deformations of concrete from creep and
shrinkage shall be taken into account. Shrinkage curva-
ture cs
κ may be assessed using the following expression:
,
,
; ;
1
s cm
cs cs e e c eff
c eff
E ES
E
I E
κ = ε α α = =
+Φ
, (41)
where cs
ε is the free shrinkage strain (see Eq (17)); S –
the first moment of area of the reinforcement about the
centroid of the section; I – the second moment of area of
the section; Φ – the creep coefficient relevant for the
load and time interval (see Eq (8)).
8.2. ACI 435 method
Based on the ACI 435 (ACI Committee 435 2003), a
long-term curvature at time t is the sum of three compo-
nents corresponding to the influence of external loading,
creep and shrinkage. Shrinkage curvature is determined,
using the equivalent tensile force method, by the follow-
ing formula:
,
;
1
c c c
cs cs c eff
eff
A e E
E
I
κ = ε =
+ χΦ
, (42)
where cs
ε is the shrinkage strain (see Eq (32)); ec is the
distance between the centroid of plain concrete area Ac
and the centroid of the age-adjusted transformed section
(Fig. 6); Ieff
– moment of inertia about the centroid of the
age-adjusted transformed section composed of Ac plus
,s c effn E E= multiplied by areas of reinforcements;
χ – the ageing coefficient (can be assumed 1,0); Φ – the
creep coefficient (see (24)).
8.3. Modified equivalent tensile force method
The equivalent tensile force method (a fictitious
elastic analysis) has been used in various forms at least
since 1936, for instance see (Branson 1977: 168). This
method was modified in (ACI Committee 435 2003)
using 0,5Ec and the gross section properties for better
results, is given by next equation:
( )1 2
,
2 ;
cs g
cs cs cs s s s
c eff g
N e
N E A A
E I
κ = = ε + , (43)
where eg is the distance between the centroid of the plain
concrete section and the extreme tensile fibre (Fig. 6); Ig
refers to pain concrete section, other notations are the
same as in Eq (41).
8.4. Miller’s method
Miller’s method (1958) refers to singly reinforced
members only. This method assumes that the extreme
fibre of a beam farthest from the tensile steel shrinks in
the same degree as the free shrinkage of the concrete, and
the shrinkage curvature is calculated by formula:
( ),
1 ;cs cs cs cs s cs cs
k d kκ = ε − = ε ε , (44)
where ,s cs
ε is the steel strain due to shrinkage. Miller
suggested empirical values of coefficient kcs
equal to 0,1
for heavily reinforced members and 0,3 for moderately
reinforced members.
8.5. Branson’s method
Branson’s method (1977: 169) represents a modifi-
cation of Miller’s method. This method is applicable to
both singly- and doubly-reinforced members. The shrink-
age curvature of a member is derived by the formula:
3
1 2
0,7 , 3,0 %,
, 3,0 %,
; 100%; 100 %.
cs
cs
cs
s s
p
p p
h p
h p
A A
p p p p p
bd bd
⎧ ε ∆
∆ ∆ ≤⎪κ = ⎨
⎪ε ∆ >
⎩
′ ′∆ = − = ⋅ = ⋅
(45)
This method is also suggested by British Standard
Code and recommended by ACI 209 (ACI Committee
209 1998).
8.6. Corley & Sozen method
This method (Branson 1977: 171) is given by
( )1 2
0,035
; ; .s s
cs
A A
d bd bd
′ ′κ = ρ−ρ ρ = ρ = (46)
The constant 0,035 may be used for sections where
the free shrinkage is known or where it is of the order of
500 micro-strains. In this case, the calculated curvature
may be multiplied by the ratio of shrinkage to 500 micro-
strains. This procedure is also recommended by ACI for
the design of concrete bridges (Branson 1977: 171).
V. Gribniak et al. Shrinkage in reinforced concrete structures: a computational aspect 58
9. Analysis of shrinkage effect on deformational
behaviour of RC beams
Two numerical analyses of shrinkage effect on de-
formational behaviour of RC beams are presented in this
chapter. The test results reported by Фигаровский [Figa-
rovskij] (1962) are used for this purpose. The experimen-
tal beams were cured under the laboratory conditions at
average relative humidity (RH) 53 %. The beams of rec-
tangular section, 3,0 m in span, were tested during 29
days under a four point bending system with 1,0 m pure
bending zone. Basic parameters of the beams employed
in the analyses are presented in Table 8.
Table 8. Parameters of test beams (Фигаровский [Figarovskij]
1962)
h d b a2 A
s1 A
s2 p f
c,cube200 f
y E
s
Beams
mm mm2
% MPa GPa
P1-1Kk 251 228 179 15 149,4 56,5 0,37 28,0 389 210
P2-2Pk 252 232 179 15 221,5 56,5 0,53 30,9 428 200
P3-2Pd 250 230 180 15 364,5 56,5 0,88 35,3 437 200
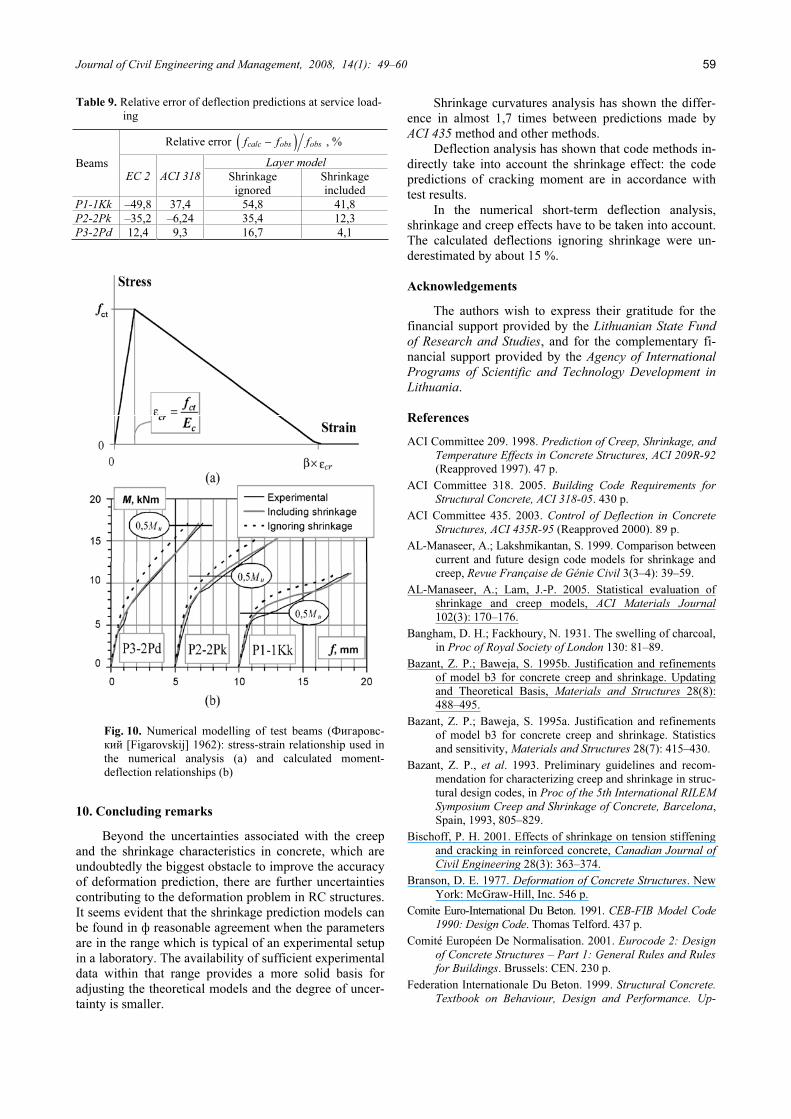
9.1. Prediction of shrinkage curvature
This sub-chapter presents a comparative analysis of
predictions made by the methods discussed in Chapter 8.
Shrinkage curvature of beam P3-2Pd (Table 8) was cal-
culated. The calculation results are presented in Fig. 7.
Fig. 7 also shows (by dashed vertical lines) shrinkage
deformations calculated for the beam using the Eurocode
2 and the ACI 209 methods.
Fig. 7. Shrinkage curvatures of the beam P3-2Pd
(Фигаровский [Figarovskij] 1962)
It can be noted that predictions made by most of the
methods, ie Eurocode 2, Modified equivalent tensile for-
ce, Branson’s and Corley & Sozen, are very close. The
curvatures calculated (for a normative value of shrinkage
strain) using these methods were 437, 493, 417 and
404 × 10-6
m-1
, respectively. In contrast to this, the predic-
tion by the ACI 435 method was 256 × 10-6
m-1
.
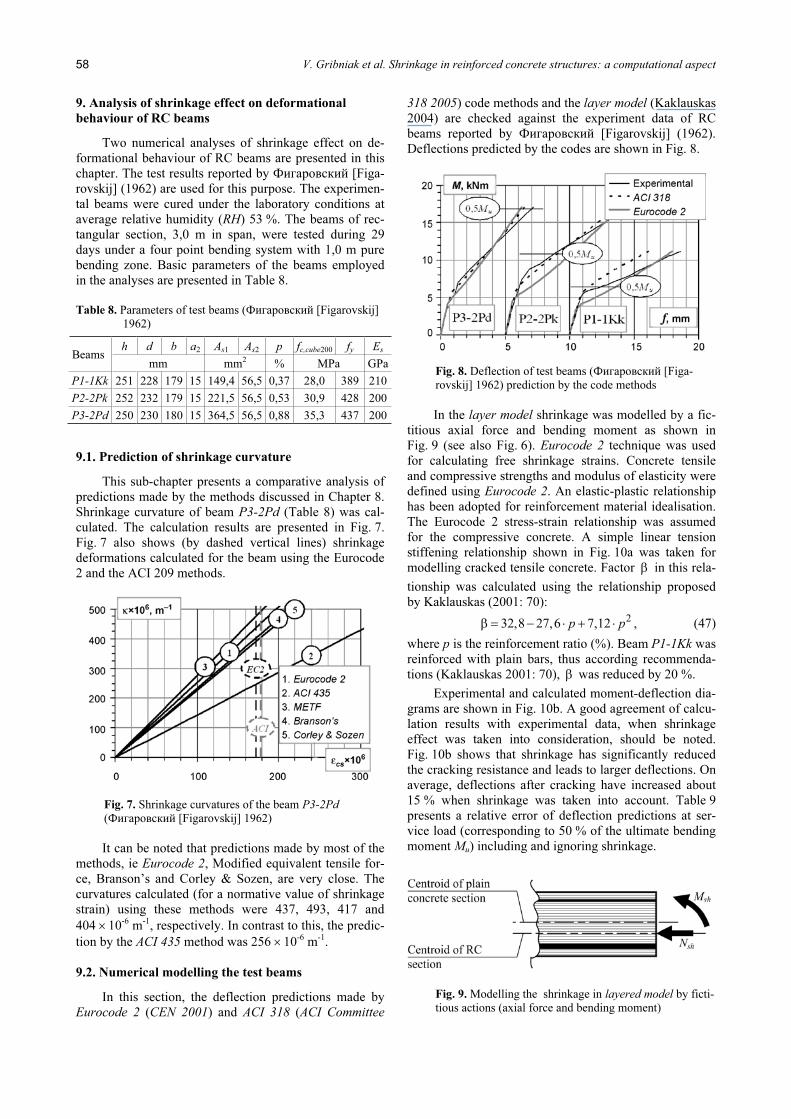
9.2. Numerical modelling the test beams
In this section, the deflection predictions made by
Eurocode 2 (CEN 2001) and ACI 318 (ACI Committee
318 2005) code methods and the layer model (Kaklauskas
2004) are checked against the experiment data of RC
beams reported by Фигаровский [Figarovskij] (1962).
Deflections predicted by the codes are shown in Fig. 8.
Fig. 8. Deflection of test beams (Фигаровский [Figa-
rovskij] 1962) prediction by the code methods
In the layer model shrinkage was modelled by a fic-
titious axial force and bending moment as shown in
Fig. 9 (see also Fig. 6). Eurocode 2 technique was used
for calculating free shrinkage strains. Concrete tensile
and compressive strengths and modulus of elasticity were
defined using Eurocode 2. An elastic-plastic relationship
has been adopted for reinforcement material idealisation.
The Eurocode 2 stress-strain relationship was assumed
for the compressive concrete. A simple linear tension
stiffening relationship shown in Fig. 10a was taken for
modelling cracked tensile concrete. Factor β in this rela-
tionship was calculated using the relationship proposed
by Kaklauskas (2001: 70):
2
32,8 27,6 7,12p pβ = − ⋅ + ⋅ , (47)
where p is the reinforcement ratio (%). Beam P1-1Kk was
reinforced with plain bars, thus according recommenda-
tions (Kaklauskas 2001: 70), β was reduced by 20 %.
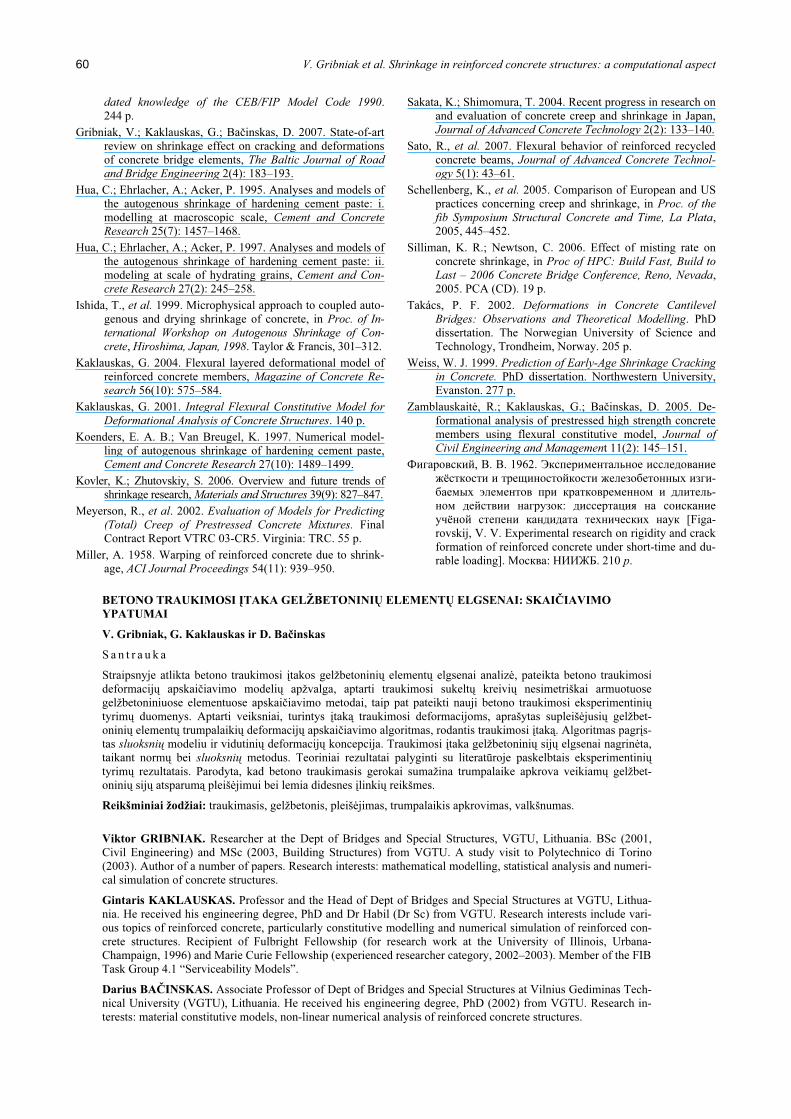
Experimental and calculated moment-deflection dia-
grams are shown in Fig. 10b. A good agreement of calcu-
lation results with experimental data, when shrinkage
effect was taken into consideration, should be noted.
Fig. 10b shows that shrinkage has significantly reduced
the cracking resistance and leads to larger deflections. On
average, deflections after cracking have increased about
15 % when shrinkage was taken into account. Table 9
presents a relative error of deflection predictions at ser-
vice load (corresponding to 50 % of the ultimate bending
moment Mu) including and ignoring shrinkage.
Fig. 9. Modelling the shrinkage in layered model by ficti-
tious actions (axial force and bending moment)
Journal of Civil Engineering and Management, 2008, 14(1): 49–60 59
Table 9. Relative error of deflection predictions at service load-
ing
Relative error ( )calc obs obsf f f− , %
Layer model Beams
EC 2 ACI 318 Shrinkage
ignored
Shrinkage
included
P1-1Kk –49,8 37,4 54,8 41,8
P2-2Pk –35,2 –6,24 35,4 12,3
P3-2Pd 12,4 9,3 16,7 4,1
Fig. 10. Numerical modelling of test beams (Фигаровс-
кий [Figarovskij] 1962): stress-strain relationship used in
the numerical analysis (a) and calculated moment-
deflection relationships (b)
10. Concluding remarks
Beyond the uncertainties associated with the creep
and the shrinkage characteristics in concrete, which are
undoubtedly the biggest obstacle to improve the accuracy
of deformation prediction, there are further uncertainties
contributing to the deformation problem in RC structures.
It seems evident that the shrinkage prediction models can
be found in ф reasonable agreement when the parameters
are in the range which is typical of an experimental setup
in a laboratory. The availability of sufficient experimental
data within that range provides a more solid basis for
adjusting the theoretical models and the degree of uncer-
tainty is smaller.
Shrinkage curvatures analysis has shown the differ-
ence in almost 1,7 times between predictions made by
ACI 435 method and other methods.
Deflection analysis has shown that code methods in-
directly take into account the shrinkage effect: the code
predictions of cracking moment are in accordance with
test results.
In the numerical short-term deflection analysis,
shrinkage and creep effects have to be taken into account.
The calculated deflections ignoring shrinkage were un-
derestimated by about 15 %.
Acknowledgements
The authors wish to express their gratitude for the
financial support provided by the Lithuanian State Fund
of Research and Studies, and for the complementary fi-
nancial support provided by the Agency of International
Programs of Scientific and Technology Development in
Lithuania.
References
ACI Committee 209. 1998. Prediction of Creep, Shrinkage, and
Temperature Effects in Concrete Structures, ACI 209R-92
(Reapproved 1997). 47 p.
ACI Committee 318. 2005. Building Code Requirements for
Structural Concrete, ACI 318-05. 430 p.
ACI Committee 435. 2003. Control of Deflection in Concrete
Structures, ACI 435R-95 (Reapproved 2000). 89 p.
AL-Manaseer, A.; Lakshmikantan, S. 1999. Comparison between
current and future design code models for shrinkage and
creep, Revue Française de Génie Civil 3(3–4): 39–59.
AL-Manaseer, A.; Lam, J.-P. 2005. Statistical evaluation of
shrinkage and creep models, ACI Materials Journal
102(3): 170–176.
Bangham, D. H.; Fackhoury, N. 1931. The swelling of charcoal,
in Proc of Royal Society of London 130: 81–89.
Bazant, Z. P.; Baweja, S. 1995b. Justification and refinements
of model b3 for concrete creep and shrinkage. Updating
and Theoretical Basis, Materials and Structures 28(8):
488–495.
Bazant, Z. P.; Baweja, S. 1995a. Justification and refinements
of model b3 for concrete creep and shrinkage. Statistics
and sensitivity, Materials and Structures 28(7): 415–430.
Bazant, Z. P., et al. 1993. Preliminary guidelines and recom-
mendation for characterizing creep and shrinkage in struc-
tural design codes, in Proc of the 5th International RILEM
Symposium Creep and Shrinkage of Concrete, Barcelona,
Spain, 1993, 805–829.
Bischoff, P. H. 2001. Effects of shrinkage on tension stiffening
and cracking in reinforced concrete, Canadian Journal of
Civil Engineering 28(3): 363–374.
Branson, D. E. 1977. Deformation of Concrete Structures. New
York: McGraw-Hill, Inc. 546 p.
Comite Euro-International Du Beton. 1991. CEB-FIB Model Code
1990: Design Code. Thomas Telford. 437 p.
Comité Européen De Normalisation. 2001. Eurocode 2: Design
of Concrete Structures – Part 1: General Rules and Rules
for Buildings. Brussels: CEN. 230 p.
Federation Internationale Du Beton. 1999. Structural Concrete.
Textbook on Behaviour, Design and Performance. Up-
V. Gribniak et al. Shrinkage in reinforced concrete structures: a computational aspect 60
dated knowledge of the CEB/FIP Model Code 1990.
244 p.
Gribniak, V.; Kaklauskas, G.; Bačinskas, D. 2007. State-of-art
review on shrinkage effect on cracking and deformations
of concrete bridge elements, The Baltic Journal of Road
and Bridge Engineering 2(4): 183–193.
Hua, C.; Ehrlacher, A.; Acker, P. 1995. Analyses and models of
the autogenous shrinkage of hardening cement paste: i.
modelling at macroscopic scale, Cement and Concrete
Research 25(7): 1457–1468.
Hua, C.; Ehrlacher, A.; Acker, P. 1997. Analyses and models of
the autogenous shrinkage of hardening cement paste: ii.
modeling at scale of hydrating grains, Cement and Con-
crete Research 27(2): 245–258.
Ishida, T., et al. 1999. Microphysical approach to coupled auto-
genous and drying shrinkage of concrete, in Proc. of In-
ternational Workshop on Autogenous Shrinkage of Con-
crete, Hiroshima, Japan, 1998. Taylor & Francis, 301–312.
Kaklauskas, G. 2004. Flexural layered deformational model of
reinforced concrete members, Magazine of Concrete Re-
search 56(10): 575–584.
Kaklauskas, G. 2001. Integral Flexural Constitutive Model for
Deformational Analysis of Concrete Structures. 140 p.
Koenders, E. A. B.; Van Breugel, K. 1997. Numerical model-
ling of autogenous shrinkage of hardening cement paste,
Cement and Concrete Research 27(10): 1489–1499.
Kovler, K.; Zhutovskiy, S. 2006. Overview and future trends of
shrinkage research, Materials and Structures 39(9): 827–847.
Meyerson, R., et al. 2002. Evaluation of Models for Predicting
(Total) Creep of Prestressed Concrete Mixtures. Final
Contract Report VTRC 03-CR5. Virginia: TRC. 55 p.
Miller, A. 1958. Warping of reinforced concrete due to shrink-
age, ACI Journal Proceedings 54(11): 939–950.
Sakata, K.; Shimomura, T. 2004. Recent progress in research on
and evaluation of concrete creep and shrinkage in Japan,
Journal of Advanced Concrete Technology 2(2): 133–140.
Sato, R., et al. 2007. Flexural behavior of reinforced recycled
concrete beams, Journal of Advanced Concrete Technol-
ogy 5(1): 43–61.
Schellenberg, K., et al. 2005. Comparison of European and US
practices concerning creep and shrinkage, in Proc. of the
fib Symposium Structural Concrete and Time, La Plata,
2005, 445–452.
Silliman, K. R.; Newtson, C. 2006. Effect of misting rate on
concrete shrinkage, in Proc of HPC: Build Fast, Build to
Last – 2006 Concrete Bridge Conference, Reno, Nevada,
2005. PCA (CD). 19 p.
Takács, P. F. 2002. Deformations in Concrete Cantilevel
Bridges: Observations and Theoretical Modelling. PhD
dissertation. The Norwegian University of Science and
Technology, Trondheim, Norway. 205 p.
Weiss, W. J. 1999. Prediction of Early-Age Shrinkage Cracking
in Concrete. PhD dissertation. Northwestern University,
Evanston. 277 p.
Zamblauskaitė, R.; Kaklauskas, G.; Bačinskas, D. 2005. De-
formational analysis of prestressed high strength concrete
members using flexural constitutive model, Journal of
Civil Engineering and Management 11(2): 145–151.
Фигаровский, В. В. 1962. Экспериментальное исследование
жёсткости и трещиностойкости железобетонных изги-
баемых элементов при кратковременном и длитель-
ном действии нагрузок: диссертация на соискание
учёной степени кандидата технических наук [Figa-
rovskij, V. V. Experimental research on rigidity and crack
formation of reinforced concrete under short-time and du-
rable loading]. Москва: НИИЖБ. 210 p.
BETONO TRAUKIMOSI ĮTAKA GELŽBETONINIŲ ELEMENTŲ ELGSENAI: SKAIČIAVIMO
YPATUMAI
V. Gribniak, G. Kaklauskas ir D. Bačinskas
S a n t r a u k a
Straipsnyje atlikta betono traukimosi įtakos gelžbetoninių elementų elgsenai analizė, pateikta betono traukimosi
deformacijų apskaičiavimo modelių apžvalga, aptarti traukimosi sukeltų kreivių nesimetriškai armuotuose
gelžbetoniniuose elementuose apskaičiavimo metodai, taip pat pateikti nauji betono traukimosi eksperimentinių
tyrimų duomenys. Aptarti veiksniai, turintys įtaką traukimosi deformacijoms, aprašytas supleišėjusių gelžbet-
oninių elementų trumpalaikių deformacijų apskaičiavimo algoritmas, rodantis traukimosi įtaką. Algoritmas pagrįs-
tas sluoksnių modeliu ir vidutinių deformacijų koncepcija. Traukimosi įtaka gelžbetoninių sijų elgsenai nagrinėta,
taikant normų bei sluoksnių metodus. Teoriniai rezultatai palyginti su literatūroje paskelbtais eksperimentinių
tyrimų rezultatais. Parodyta, kad betono traukimasis gerokai sumažina trumpalaike apkrova veikiamų gelžbet-
oninių sijų atsparumą pleišėjimui bei lemia didesnes įlinkių reikšmes.
Reikšminiai žodžiai: traukimasis, gelžbetonis, pleišėjimas, trumpalaikis apkrovimas, valkšnumas.
Viktor GRIBNIAK. Researcher at the Dept of Bridges and Special Structures, VGTU, Lithuania. BSc (2001,
Civil Engineering) and MSc (2003, Building Structures) from VGTU. A study visit to Polytechnico di Torino
(2003). Author of a number of papers. Research interests: mathematical modelling, statistical analysis and numeri-
cal simulation of concrete structures.
Gintaris KAKLAUSKAS. Professor and the Head of Dept of Bridges and Special Structures at VGTU, Lithua-
nia. He received his engineering degree, PhD and Dr Habil (Dr Sc) from VGTU. Research interests include vari-
ous topics of reinforced concrete, particularly constitutive modelling and numerical simulation of reinforced con-
crete structures. Recipient of Fulbright Fellowship (for research work at the University of Illinois, Urbana-
Champaign, 1996) and Marie Curie Fellowship (experienced researcher category, 2002–2003). Member of the FIB
Task Group 4.1 “Serviceability Models”.
Darius BAČINSKAS. Associate Professor of Dept of Bridges and Special Structures at Vilnius Gediminas Tech-
nical University (VGTU), Lithuania. He received his engineering degree, PhD (2002) from VGTU. Research in-
terests: material constitutive models, non-linear numerical analysis of reinforced concrete structures.


![Regionalization amidst 'State-Shrinkage' [p.p. 5-28]](https://img.dokumen.tips/doc/110x75/631b937b3e8acd9977057dea/regionalization-amidst-state-shrinkage-pp-5-28.jpg)


