Embed Size (px)
Citation preview

Freeze-dried microfluidic monodisperse microbubbles as a new
generation of ultrasound contrast agents Ugur Soysal,1,*,† Pedro N. Azevedo,1,2,3,* Flavien Bureau,2 Alexandre Aubry,2 Marcio S. Carvalho,3 Amanda C.
S. N. Pessoa,4 Lucimara G. De la Torre,4 Olivier Couture,5 Arnaud Tourin,2 Mathias Fink,2 Patrick Tabeling1
1 Microfluidique, MEMS et Nanostructures, IPGG, ESPCI Paris, Université PSL, CNRS, France;
2Institut Langevin, ESPCI Paris, Université PSL, CNRS, France; 3Department of Mechanical Engineering, PUC-Rio, Brazil;
4School of Chemical Engineering, University of Campinas, Brazil; 5LIB, Sorbonne Université, CNRS, INSERM, France;
* These authors contributed equally to the work.
† Corresponding author: email [email protected]
Abstract - In the paper, we succeeded to freeze-dry monodisperse microbubbles without degrading their size and acoustic
properties. We used microfluidic technology to generate highly monodisperse (coefficient of variation, CV<5%)
microbubbles and optimized their formulation along with a cryoprotectant. By using a specific technique of retrieval of the
bubble, we showed that freeze-drying the microbubbles does not alter their size distribution (CV≤6). To compare the
fundamental resonance properties of the bubbles, we performed backscattered acoustic characterization measurements. Our
experimental results revealed that the freeze-drying process conserved the acoustic properties of the bubbles. The maximum
backscattering power amplitude of fresh and freeze-dried monodisperse PVA bubbles was around ten eight times higher
than that of SonoVue at a similar concentration in vitro. By solving the question of storage and transportation of
monodisperse bubbles, our work facilitates their penetration in the domain of UCAs, for performing new tasks and
developing novel non-invasive measurements, such as pressure, unaccessible to the existing commercialized bubbles.
Key Words: Microfluidic, monodisperse, PVA microbubble, freeze-drying, ultrasound.
INTRODUCTION
Since the first use of free gas bubbles as ultrasound contrast agents (UCAs) in 1968 (Gramiak and Shah
1968), significant efforts have been made to improve UCAs’ stability, safety, and echogenicity. Today, UCAs
are stabilized with a shell that encapsulates a heavy gas produced by sonication and agitation of a solution of
surfactants; lipids, proteins, polymers. (Frinking et al. 2020). Current manufacturing techniques succeed in
producing the appropriate structure but, on the other hand, provide limited size control of microbubbles, leading
to polydisperse contrast agents, typically from 1 to 10 μm in diameter (Stride et al. 2020).
Polydisperse microbubbles have a clear and practical advantage: the same product covers low and high
frequencies, enabling the image of the deep or shallow structure, respectively. This way, a single product can
have multiple uses. However, limitations induced by size polydispersity have been underlined over the last years.
In polydisperse UCAs, the resonance frequency of the microbubbles being, according to Minnaert law, inversely
proportional to their size (Minnaert 1933), the resonance spectrum will be broad (Tremblay-Darveau et al. 2014)
(Hoff et al. 2000). Ultrasound scanners used in clinics deliver acoustic pulses with a narrow frequency
bandwidth, leading to the excitation of only a small portion of the bubbles near their resonance in a polydisperse
population (Segers et al. 2016). Thus, polydispersity is not optimal, from the signal-to-noise ratio perspective
(Stride et al. 2020); it also hampers to fully benefit from the non-linear characteristics, which enables minimizing
shadowing effects in deep tissue imaging (Segers et al. 2018b).
Moreover, the use of polydisperse bubbles prevents performing quantitative measurements that could
be relevant for clinical applications, such as measuring local pressure (Fairbank and Scully 1977) (Ishihara et
al. 1988) (Tremblay-Darveau et al. 2014) (Segers et al. 2018a). Local pressure affects, according to Minnaert
law, the resonance frequency. Should we have a monodisperse population of bubbles, there could be a pathway

leading from resonance measurements to local pressure. However, polydisperse bubbles produce a broad
spectrum, from which it remains difficult to extract quantitative information on the pressure. For example, the
required clinical sensitivity for portal vein hypertension diagnosis is (±2 kPa), and the measurements are
expected to be reproducible with a monodisperse population, namely with a coefficient of variation (CV) of 6%
(Tremblay-Darveau et al. 2014). Attempts using subharmonics were also proposed (Shi et al. 1999) (Esposito
et al. 2020), but from a purely empirical basis that may weaken the reliability of the measurement.
In molecular diagnosis, the bubbles were functionalized to develop an affinity with specific antigens
(Leong-Poi Howard et al. 2003). In the bloodstream, the bubbles preferentially settle in specific areas, revealing
the presence of the targeted molecules. The number of bubbles reaching their targets is low and thus generates
weak echoes (Frinking et al. 2012). The high sensitivity of resonance frequency shift on the discrimination of
freely circulation and bound bubbles is a necessary condition not met by polydisperse bubbles (Overvelde et al.
2011).
Microbubbles were also used to transport drugs, genes, or therapeutic gases (Hernot and Klibanov 2008)
(Sutton et al. 2014). When bubbles reach specific areas, they can locally release the charge by bursting.
Nevertheless, polydisperse bubbles require high ultrasonic intensities to achieve efficient bursting, which can
cause clinical problems. Thus the use of monodisperse bubbles provides controlled and efficient release
(Roovers et al. 2019). Therapeutic applications such as sonothrombolysis (Dixon et al. 2019) and blood-brain
opening (Choi et al. 2010) can also be optimized owing to the precise control of monodisperse bubbles.
Recently,phospholipid-shelled microfluidic monodisperse microbubbles were characterized with 2-3
orders of magnitude higher acoustic sensitivity than that of polydisperse microbubbles in vitro (Segers et al.
2018b). Likewise, the acoustic sensitivity of monodisperse bubbles was 10 times in rats and 15 times in pigs
higher than that of polydisperse counterparts, such as SonoVue, Definity, and Optison (Helbert et al. 2020).
From these studies, one may conclude that monodisperse bubbles in clinical applications are highly
advantageous. In some cases, monodisperse bubbles open new avenues in diagnostics, delivery, and therapy.
Highly monodisperse bubbles are currently produced with microfluidics. However, to transport and store them,
they need to be freeze-dried without degradation of their properties, which, today, represents a challenge. In this
case, uncontrolled dynamics generated in the freeze-drying process induce rearrangement, coalescence, and
ripening phenomena that degrade monodispersity. In fact, freeze-drying without degradation is the major
bottleneck to unlock, allowing monodisperse microfluidic bubbles in clinics.
In the past, alternatives to freeze-drying were proposed. It consisted of, first, producing monodisperse
droplets with ink-jet printing (Böhmer et al. 2006) or microfluidics (Song et al. 2018), using oil-water or air-oil-
water emulsions (Lee et al. 2011). These droplets were either freeze-dried or evaporated to obtain gas-filled
microbubbles coated with polymer shells. All these techniques require, at some point, a toxic solvent (e.g.
dichloromethane, cyclododecane, dodecane) to be removed. This procedure is a delicate task, which is never
guaranteed to be fully completed, raising regulatory issues. Besides, the current polydisperse bubbles were size-
filtered in different manners such as mechanical filtration (Streeter et al. 2010), centrifuge (Feshitan et al. 2009),
or acoustic sorting (Segers et al. 2018b) and obtained relatively narrow size distributions, between CV of 10%
to 20%. To date, there are no clinically approved either size-filtered bubbles or a size-filtering device available.
Although the filtration method may be sufficient to optimize the bursting phenomenon in drug delivery or
therapeutic applications, highly monodisperse bubbles, CV<6, are required for non-invasive pressure
measurements. Thus, microfluidic production is a necessity. Therefore, we are left with the only pathway to
freeze-dry shell encapsulated monodisperse microfluidic bubbles without using any solvent.
In this article, we succeeded in unlocking the bottleneck. We produced freeze-dried microfluidic-
generated monodisperse microbubbles in a wide beneficial range that can benefit in different fields, including
domains pertinent for UCA applications (from 4 to 50 µm in diameter) nanometric PVA shell-protected, without
degrading monodispersity. We thus propose here a new generation of contrast agents, in the form of a stable
lyophylisate, that can be stored for months and transported at any place, be resuspended, and used directly in
clinical applications.
MATERIALS AND METHODS

Microbubble formulation
Among the shell materials, polymer-shelled microbubbles such as poly(vinyl alcohol) (PVA) as UCAs
holds an excellent potential due to their high echogenicity (Grishenkov et al. 2011) and stability (Oddo et al.
2017) in comparison to lipid-based UCAs; the material is FDA approved, and series of preclinical tests showed
no toxicity (Cerroni et al. 2018). Perfluorohexane (C6F14) or sulfur hexafluoride (SF6) was used as the gas phase
of the system and thereby the bubbles filled with C6F14 or SF6. Such gases are highly hydrophobic, less soluble,
and heavier than air in aqueous solutions and were selected in the second generation microbubbles (Podell et al.
1999), (Schneider 1999). As the permeable shell leads to a rapid escape of soluble gases, such as air, the use of
heavy and less soluble gaseous enhances the lifetime of the bubbles. The liquid phase is an aqueous solution of
polyvinyl alcohol (PVA) (Mw 13,000-23,000, 87-89% hydrolyzed, Sigma-Aldrich) at a concentration of 8 wt.
% in 10 mM Phosphate-Buffered Saline (PBS) solution in Milli-Q water. PVA was stirred in the aqueous
solution at 80°C overnight for being used as the continuous phase. The surfactant allows for the formation of a
shell around the bubbles; thus, PVA acts as a surfactant and shell material. To facilitate the freeze-drying of the
bubbles, a cryoprotectant is required to avoid the destruction of the bubbles during the harsh and freeze-drying
process, which is associated with freezing, dehydration, and solid-liquid interfacial stresses (Abdelwahed et al.
2006), (Date et al. 2010), (Mensink et al. 2017). The external fluid includes both the cryoprotectant and
surfactant. In our novel easy-to-prepare formulation, PVA acts both as a surfactant and a cryoprotectant.
Although PVA is not currently used as a cryoprotectant for freeze-drying of microbubbles, it received attention
as an emerging cryoprotectant for droplets (Song et al. 2018) and pharmaceutical products (Mitchell et al. 2019).
Description of the device and production of the’ fresh’ microbubbles
The device shown in Fig. 1 was realized with soft lithography technology (Tabeling 2005). In short, the
mold was fabricated using double-layer conventional lithography. PDMS (PolydiMethyl Siloxane) was poured
into the mold and baked at 70°C for 30 min. Then, the inlet and outlets were punched through the PDMS, and
the microfluidic channel was sealed with a microscopic glass slide by applying O2 plasma with a plasma cleaner
(The CUTE, Femto Science Inc., Republic of Korea). Finally, plastic tubings were connected to the inlet and
outlet of the device.
The device of Fig. 1 contains two inlets for liquid injection, two outlets for the recovery of excessive
material (i.e., anti-clogging system), one gas inlet, and one bubble outlet for collecting the generated bubbles.
The bubble outlet consists of a lateral tube aligned along the axis of the collection channel to avoid coalescence
phenomena (e.g., lateral collection). It also includes an entry (e.g., pusher) that allows to increase the flow rate
of the continuous phase and tune the bubble concentration. This step favors the high throughput and reliability
of the process. The bubbles with 5 µm in diameter were produced with the flow-focusing method. The width
and height of the flow-focusing geometry are 5 µm. This structure is accompanied by a step-emulsification
geometry that enables enlarging the structure with an upward step-like channel (height of 20 µm) to reduce the
hydrodynamic resistance. An anti-clogging system (so-called river channels) was included to avoid large
aggregates or contaminants clogging the channels to ensure a prolonged stable generation (Malloggi et al. 2010).
Note that the large bubbles, such as 44 µm, were generated with a typical flow-focusing device without adding
the river channels to the design as the nozzle diameter larger than 20 µm is usually less prone to clogging.
The liquid and gas flows were pressure-driven, pliquid, and pgas, using an MFCS-100 pressure controller
system (Fluigent) at pressures from 1.2 to 3.5 bars. In turn, also taking into account the aforementioned
geometrical features of the device, the microfluidic system enabled us to generate 5 µm in diameter
microbubbles (CV <5%) with up to 10 kHz generation frequency, relatively high throughput (~6×10⁵
bubbles/min) (see Fig. 1). In situ microbubble generation was recorded using a high-speed camera (Photron
SA3, Japan)-connected optical microscope (Zeiss Observer A1, USA) at 20x and 40x magnifications. The
recordings were analyzed to obtain the size distribution and the generation rate of the bubbles in MATLAB.

Fig.1. Microfluidic generation of 5 µm in diameter PVA ‘fresh’ microbubbles (i.e., directly coming out of the microfluidic
device and thereby not resuspended from a lyophilisate). (Left) Monodisperse bubbles were generated in the central channel
located between river channels and after the gas channel. Bubbles exited the device without any coalescence. (Right)
Freshly generated bubbles were collected in a monolayer manner on a glass slide. The inset shows the size distribution of
the collected bubbles showing average sizes, standard deviation, and CV are 5.4 µm, 0.3 µm, and 5.5%, respectively.
Method of acoustic characterization of microbubbles
The acoustic characterization setup, instrumentation, example of typically emitted signals, received
echoes, and resonance spectra for the backscattered acoustic measurements of nearly stationary microbubbles
are shown in Fig. 2. We used a small PDMS-based structure as a measurement chamber (35mm×10mm×1mm).
The thickness of the walls of the PDMS container is 10 mm, more than ten times larger than the initial
wavelength. This ensures propagation of the initial wave deep in the system and produces echoes from the
container walls. The structure was replicated with PDMS from a mold.
A focused ultrasound transducer (with a central frequency of 2.25 MHz, a relative bandwidth of ~50%,
a quality factor of ~2, and a 38-mm focal length) was used as an emitter and a receiver of echoes (see Fig. 2A).
The Minnaert resonance frequency for an uncoated 5.4 µm in diameter bubble is around 1.2 MHz and calculated
as follows (Minnaert 1933):
fo×do = 6.6(MHz×µm) (1)
Where fo is the resonance frequency and do is the diameter. A shell-coated bubble is expected to resonate to
ultrasound at a frequency higher than the Minnaert resonance frequency. For thin polymer-shelled microbubbles,
where the shell thickness was 5% of the bubble radius, the linearized Church model (Church 1995) was
developed by (Hoff et al. 2000). In this model, the shell increases the resonance frequency by increasing the
stiffness through the shear modulus while the ratio between shell thickness and bubble radius is assumed to be
constant during the bubble oscillation (see Eq. 2).
𝑓𝑜 =1
2𝜋𝑑𝑟√
1
𝜌𝐿(3𝜅𝜌𝑜 + 12𝐺𝑠
𝑑𝑆𝑒
𝑑𝑟) (2)
Where dr is bubble radius, ρL is the density of the liquid, κ is polytropic constant, ρo is the hydrostatic pressure
in the surrounding liquid, Gs is the shear modulus, and dSe is shell thickness. Based on this model, (Hoff et al.
2000) estimated the shell shear modulus of thin polymer-shelled UCAs between 10.6 and 12.9 MPa. Later on,
(Grishenkov et al. 2009) estimated the shear modulus of PVA bubbles ranging between 3.5 MPa and 5.7 MPa
based on a similar approach that (Hoff et al. 2000) developed. We may assume that the shear modulus of our
PVA bubbles will be in the same order of magnitude. Based on the Church-Hoff model, we analytically
estimated that the expected resonance frequency of 5.4 µm in diameter monodisperse PVA bubbles (shell
thickness of ~70 nm, see Results section) with the shear modulus from 3 to 12 MPa results in 2.1 MHz to 3.7

MHz that lies within the bandwidth of the transducer which covers the frequencies from ~1.1 MHz to ~3.4 MHz.
Thus, the selected transducer is compatible and may directly target the resonance frequency of the monodisperse
PVA bubbles.
We used a function generator (Tektronix AFG 2021) to generate a Sinusoidal 1-cycle burst signal with
a 1-ms pulse repetition period (see Fig. 2B). The peak negative acoustic pressure, as measured by a hydrophone
(see Fig. 2C), was fixed to 134 kPa. A PicoScope (5242D) was used for data acquisition, and its dedicated
software was used to monitor and record the detected signal. It acquired 1 waveform/45ms and one waveform
(i.e., echo) consists of 3125 data points. Typically, each measurement presented here took 45s, yielding 1000
waveforms. Each echo was taken from the focal point, as the region of interest (i.e., ROI typically consists of
350 points and is around 60µs from the initial wave due to the delay of the propagation in the solid PDMS
structure). Its Fourier transform is then calculated (via an FFT algorithm) and averaged with a MATLAB
program.
When there was no bubble but water in the measurement chamber, the obtained spectra consisted of
reflections from the measurement chamber (see Fig. 2B and Fig. 2C). Therefore, a metallic plate was placed in
the chamber, rather than placing it in a big water tank, to obtain the transducer response without underestimating
the present experimental boundaries. Thereby, the spectra, consists of the transducer response along with the
reflections from the chamber, were obtained with the metallic plate. Then, it was deconvoluted from the spectra
obtained with the bubbles. The deconvolution process was performed by dividing the bubble spectra (see Fig.
2D, left) by the metallic plate spectra (data not shown). The result of the division was fitted with a Gaussian to
analyze the resonance frequency along with the standard deviation (see Fig. 2D, right).
The resonance measurements were compared as a function of a number of microbubbles semi-
quantitatively determined from 108 to 106 with dilution ratios of 1:1 to 1:100 for SonoVue in up to 500 µl liquid.
Although the concentration of SonoVue was roughly estimated, it still gives an insight for the comparison with
monodisperse bubbles. The number of freshly generated 5 µm in diameter bubbles (same bubbles as shown in
Fig. 1) was estimated based on the collection time, namely 20min to 30s, to obtain approximately 107 to 105
bubbles. Note that obtaining a higher number of bubbles than 107 with our current device caused long waiting
times, making the generated bubbles prone to coalescence in a vial. PVA bubbles were diluted with PFC
saturated PBS solution to enhance the stability and gently injected into the measurement container. Although
the injected liquid volume was smaller than that of the container, it remains trapped and intact between the walls
due to the capillarity and therefore did not spread through the channel; thus, air bubbles were avoided (see Fig.
2A).
Fig. 2B shows the obtained echoes from the measurement chamber, filled with Milli-Q water or PBS
(see Fig. 2A), without the presence of the bubbles. The echoes produced from the front wall of the PDMS
container, from the front and back (merged echoes) walls of the measurement chamber, and from the back wall
of the PDMS container are denoted as X, Y, and Z respectively. Our various experiments revealed that echoes
produced by the front and back wall (i.e., merged echoes) of the measurement chamber define the detection limit
of our measurement setup. As shown in Fig. 2C, the merged echo (shown as Y in Fig. 2B) is one order of
magnitude smaller than that of the bubbles, which guarantees a good signal-to-noise ratio. The separation of
these merged echoes is possible and splits the echo from the bubbles and the reflections (see Fig. 2B, echo Y).
However, it requires increasing the channel height that either makes the measurements prone to multiple
scattering (which is neglected since absorption dominates over scattering (Tourin et al. 2000) (Hoff 2001)) or
leads to freely floating bubbles in the chamber. Lowering the concentration of the bubbles, e.g., down to 103 to
102 bubbles, leads the measurement to fall below the detection limit in our setup while freely floating bubbles
easily escape from the focal region hampering repetitive measurements from the same bubble population over
time. This optimized geometry enabled us to robustly demonstrate and compare the backscattered acoustic
response of freshly generated and freeze-dried monodisperse microbubbles. Typical results for a population of
monodispersed ‘fresh’ bubbles, i.e., retrieved from a microfluidic generator, such as in Fig. 1, are shown in Fig.
2C and Fig. 2D.

Fig.2. Acoustic characterization setup and typical acoustic response of fresh bubbles. (A) The acoustic measurement test
bench illustrates a focused transducer with an acoustic gel-filled 3D printed waveguide and a PDMS container where the
bubbles were injected in up to 500µl water. (B) The description of the data acquisition, monitoring, and recording of the
detected signal with a PicoScope (5242D) is shown. It provided an acquisition rate of 1 waveform/45ms, which consists of
3125 data points. An arbitrary wave function generator (Tektronix AFG 2021) generates a Sinusoidal 1-cycle burst signal
with a 1 ms pulse repetition frequency. (C) The backscattered echoes show an acoustic comparison of ~107 and ~105 fresh
PVA monodisperse microbubbles with a reference measurement (where there are no bubbles). The slight misalignment
between echoes originated from the alignment of the transducer to the channel through the acoustic gel in different
experiments. The inset shows an emitted signal with peak negative acoustic pressure of 134 kPa. (D) (Left) The typical
resonance spectrum (average of 1000 spectra) of ~105 and ~107 fresh bubbles with a ~%10 standard deviation from the
Gaussian center is shown. (Right) The deconvoluted spectra (described in materials and methods section) of ~105 and ~107
fresh bubbles show in the order of ~%10 standard deviation from the Gaussian center, for both.
Monolayer bubble collection and freeze-drying protocol
The process is shown in Fig. 3. The generated bubbles were transported along with the lateral outlet
tubing and exited the device. Then, the bubbles formed milky suspension drops at the tip of the tubing. Each 10
µl drop was spread on an O2 plasma-treated hydrophilic glass slide (75 mm x 25 mm). Thus, the bubbles were
collected in a monolayer manner, resulting in individual localized
bubble suspension spots on a glass slide (see Fig. 3).
We typically obtain one hundred monolayer spots on the slide, each of which consists of 104 bubbles with 5
µm in diameter. Each spot results from the deposition of a single droplet (<10 µl). Following the monolayer
collection, the bubbles were pre-freeze for a minimum of 2h at –25°C, far below the glass transition temperature
(Tg) of the used cryoprotectant (∼80°C). Finally, frozen bubbles were transferred to a freeze-dryer (FreeZone
Labconco, USA) with a shelf temperature of -50°C for 4h. Each freeze-dried spot then was hydrated with a gas
saturated PBS solution on the glass slide in a PFS ambient. Should monodisperse microbubbles be collected in
large drops leading to the formation of multilayers, as we did for comparison, bubbles would interact before
being frozen, the lyophilisate would be multilayer, and the resuspended micro-bubble population polydisperse.

Fig.3. An illustration of the microfluidic production of bubbles in a drop and spot-based drop collection on a glass slide.
3. RESULTS
Geometrical characterization of the freeze-dried bubbles
The lyophilisates that we obtained, in the process described in Material and Methods, were uniform in
size, as shown in Fig. 4A and Fig. 4B. In Fig 4A, the bubble diameter is 44 µm. They form a closed-packed
structure. This is because, with the concentrations at hand, the system stands above the jamming transition
(Furuta et al. 2016). Increasing the volume fraction of the bubbles leads to close-packed states, as shown in Fig.
4A. Whereas increasing the volume fraction of the liquid by decreasing the size of the same number of bubbles
unjam the system, as shown in Fig. 4B. The size distribution, measured with a Matlab program, shows a
monodispersity of 10%, thus substantially larger than the 6% dispersion of the initial fresh bubble population,
but still low. The reason originates from the fact that freeze-dried bubbles interact and undergo deformation due
to the close packing. This behavior also indicates that, by forcing bubbles to be collected as a single monolayer
and freeze-dried in such a configuration, even though in-plane interactions exist, they slightly degrade the size
uniformity but do not destroy the monodispersity. However, the origin of in-plane interactions is not fully
understood. Unlike 44 µm bubbles, in Fig. 4B, bubbles are smaller (5 µm), concentration is lower, and the
systems stand below the jamming conditions. Consequently, the lyophilisate is a distribution of well separated,
isolated, 5 µm bubbles.
The environmental scanning electron microscope (ESEM) image shown in Fig. 4C was taken with a 20°
tilt, without metallic coating, to avoid modifications on the shells, but resulted in one side go white due to the
charging effect. The corresponding ESEM images show non-spherical bubbles (as might be expected because
there is no surface tension), the shells look uniform, suggesting acceptable homogeneity of the lyophilization
conditions across the population. The thickness of the shell was estimated as ~70 nm from a broken shell, shown
as an inset in Fig. 4C, a non-tilted and non-coated image, which is consistent with (Poehlmann et al. 2013), who
reported PVA shell thicknesses ranging between 120 nm and 230 nm.
Fig. 4D and Fig. 4E show the same populations after rehydration and resuspension in DI water. The
detachment from the glass slide and, thus, resuspension of the bubbles took only a few seconds after they were
hydrated. Then, the bubbles started to freely float in water. The size distribution was measured when they were
hydrated at the same plane, but it also remains unchanged during the floating. Fig. 4D and Fig. 4E show that the
size distributions of 44µm and 5µm bubbles are 6% and 5.5%, respectively, comparable to the fresh bubbles,
showing that monodispersity of the size is accurately conserved during the process. This is the main result of
the paper. Note that while 44µm bubbles shrunk by 20% in size after freeze-drying, 5µm bubbles shrunk only a
few percent.

Fig.4. The images and size distribution (bars represent the size distribution and dots represent Gaussian fits) of lyophilisates
and resuspended bubbles. (A-B) The optical images of the central part of lyophilisate spots consist of freeze-dried bubbles
deposited onto glass slides. The insets show the size distribution of the lyophilisates 42 µm (standard deviation of 4 and
CV of 9%) and 5.8 (standard deviation of 0.3 and CV of 5%) µm in average diameters of the lyophilisates. (C) ESEM of
the 5 µm lyophilisate. (D-E) Resuspended and floating bubbles and their size distributions (insets) show the average
diameters of the bubbles as 44 µm (standard deviation of 3 and CV of 6%) and 5.4 µm (standard deviation of 0.3 and CV
of 5.5 %). (F) SEM image shows a broken bubble, and the magnified image measures the thickness of the shell as ~70 nm.
Acoustic characterization of resuspended freeze-dried bubbles
The main objective for performing acoustic characterization of freshly generated and freeze-dried
monodisperse PVA bubbles was to investigate possible effects of the freeze-drying process on the physico-
chemical properties of the bubbles, which would ultimately alter the fundamental oscillating properties of the
bubbles, such as resonance frequency and its amplitude. Therefore, we performed in vitro backscattered acoustic
measurements, both for freeze-dried and freshly generated bubbles, under the same experimental conditions.
These experiments were performed in the setup described in Fig. 2A at the similar number of bubbles (~106),
with the same size (5µm as shown in Fig. 1 and Fig. 4E), same gas core (PFC), and same surrounding liquid
(PBS) to uncover the consequence of freeze-drying process only on the oscillating behavior of the bubbles by
acoustical excitation. Fig. 5A shows, in dashed red and dashed black lines, that the acoustic responses of the
freeze-dried and fresh bubbles are indistinguishable. Thus, we may suggest that the freeze-drying process does
not alter the viscoelastic properties of the bubbles. In any case, from a UCA perspective, we may conclude that
freeze-dried and fresh bubbles behave, within experimental error, in the same manner. The conclusion is
confirmed in the spectral space. Fig. 5B shows the resonance spectra, in solid red and black, (both were average
of one thousand measurements) of before and after freeze-dried bubbles.
We observed identical responses, within ±2% in the resonance frequency and ±10% in the maximum
amplitude. Likewise, Fig. 5C shows, in solid red and black, the same data, but deconvoluted according to the
process shown in Material and Methods. Here again, the response of freeze-dried and fresh bubbles, within
experimental error, are undistinguishable. The number of data points that constitute the spectra was limited due
to the resolution limit of our data acquisition. Still, their Gaussian form is clear. The resonance responses of both
fresh (black curve) and freeze-dried PVA bubbles (red curve) were characterized with around 10% standard
deviation, ensuring a narrow bandwidth of monodisperse bubbles. This finding acoustically confirms the
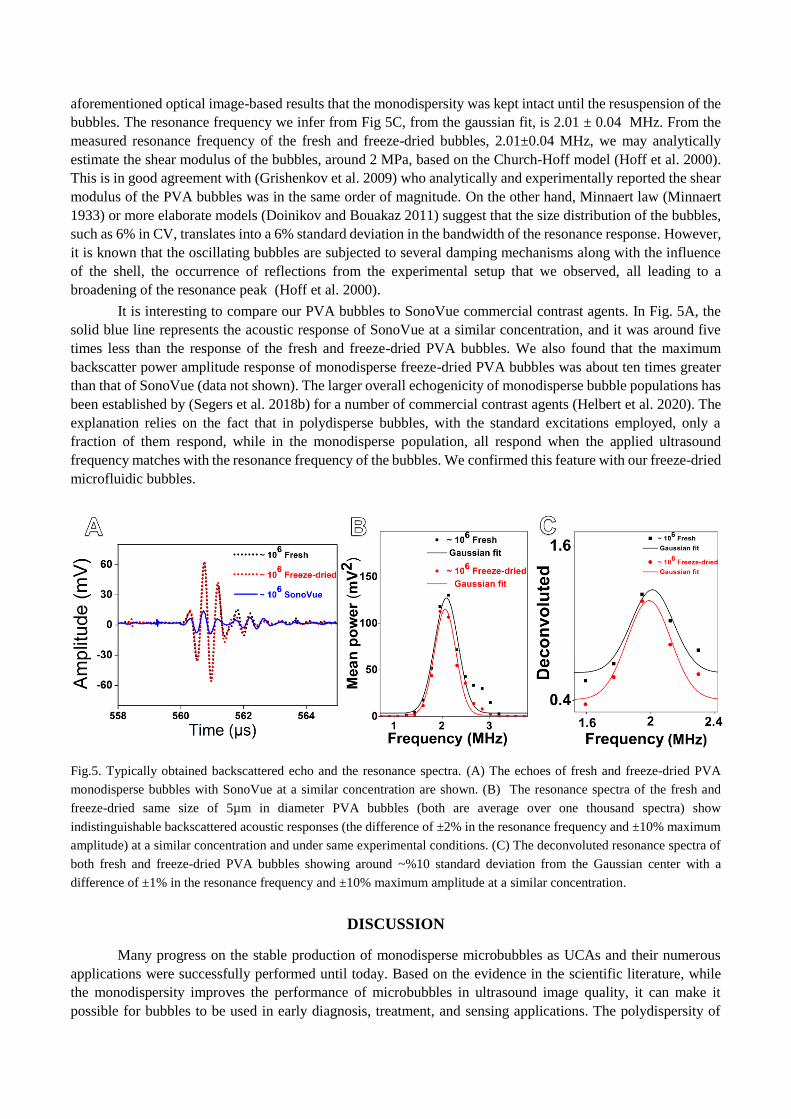
aforementioned optical image-based results that the monodispersity was kept intact until the resuspension of the
bubbles. The resonance frequency we infer from Fig 5C, from the gaussian fit, is 2.01 ± 0.04 MHz. From the
measured resonance frequency of the fresh and freeze-dried bubbles, 2.01±0.04 MHz, we may analytically
estimate the shear modulus of the bubbles, around 2 MPa, based on the Church-Hoff model (Hoff et al. 2000).
This is in good agreement with (Grishenkov et al. 2009) who analytically and experimentally reported the shear
modulus of the PVA bubbles was in the same order of magnitude. On the other hand, Minnaert law (Minnaert
1933) or more elaborate models (Doinikov and Bouakaz 2011) suggest that the size distribution of the bubbles,
such as 6% in CV, translates into a 6% standard deviation in the bandwidth of the resonance response. However,
it is known that the oscillating bubbles are subjected to several damping mechanisms along with the influence
of the shell, the occurrence of reflections from the experimental setup that we observed, all leading to a
broadening of the resonance peak (Hoff et al. 2000).
It is interesting to compare our PVA bubbles to SonoVue commercial contrast agents. In Fig. 5A, the
solid blue line represents the acoustic response of SonoVue at a similar concentration, and it was around five
times less than the response of the fresh and freeze-dried PVA bubbles. We also found that the maximum
backscatter power amplitude response of monodisperse freeze-dried PVA bubbles was about ten times greater
than that of SonoVue (data not shown). The larger overall echogenicity of monodisperse bubble populations has
been established by (Segers et al. 2018b) for a number of commercial contrast agents (Helbert et al. 2020). The
explanation relies on the fact that in polydisperse bubbles, with the standard excitations employed, only a
fraction of them respond, while in the monodisperse population, all respond when the applied ultrasound
frequency matches with the resonance frequency of the bubbles. We confirmed this feature with our freeze-dried
microfluidic bubbles.
Fig.5. Typically obtained backscattered echo and the resonance spectra. (A) The echoes of fresh and freeze-dried PVA
monodisperse bubbles with SonoVue at a similar concentration are shown. (B) The resonance spectra of the fresh and
freeze-dried same size of 5µm in diameter PVA bubbles (both are average over one thousand spectra) show
indistinguishable backscattered acoustic responses (the difference of ±2% in the resonance frequency and ±10% maximum
amplitude) at a similar concentration and under same experimental conditions. (C) The deconvoluted resonance spectra of
both fresh and freeze-dried PVA bubbles showing around ~%10 standard deviation from the Gaussian center with a
difference of ±1% in the resonance frequency and ±10% maximum amplitude at a similar concentration.
DISCUSSION
Many progress on the stable production of monodisperse microbubbles as UCAs and their numerous
applications were successfully performed until today. Based on the evidence in the scientific literature, while
the monodispersity improves the performance of microbubbles in ultrasound image quality, it can make it
possible for bubbles to be used in early diagnosis, treatment, and sensing applications. The polydispersity of

current clinical UCAs hampers the use of bubbles in such emerging applications. But, thus far, no technology
has enabled the storage and transportation of monodisperse microbubbles. The alternative solutions to freeze-
drying are not realistic compared to the clinical UCAs, which are storable and transportable, and easy to use by
non-experts. Beyond commercial and regulation aspects, this may have slowed down the advancement of
monodisperse bubbles through the clinics, despite its superior qualities, concerning several pertinent aspects, in
comparison to commercial polydisperse bubbles.
The successful freeze-drying strategy is composed of two steps. The first is the optimization of
microbubble composition and buffer solution formulation, including selecting a shell molecule, a surfactant, and
a cryoprotectant. While the shell and surfactant improve the stability of the bubbles, cryoprotectant protects the
bubbles during freezing and freeze-drying cycles. In our case, PVA acts as shell material, surfactant, and
cryoprotectant. Second, monolayer and localized freeze-drying of microbubbles guarantee a monodisperse
population through the resuspension of the bubbles. The latter leads to a reduced interaction among the bubbles.
Therefore, the failure of step one leads to destroying the bubbles after freeze-drying, while step two is leading
polydisperse freeze-dried bubbles.
Noteworthy to investigate a number of properties of our lyophilisates along with our resuspended
bubbles that can be relevant for applications. In this spirit, we tracked the resonance frequency of resuspended
PVA bubbles over a few minutes, using the acoustic setup of Fig. 2A. This time represents billions of
oscillations. We did not observe any significant change in the resonance frequency. This behavior suggests
acceptable shell physico-chemical stability since it is known that the shell constitution substantially contributes
to the resonance frequency determination (de Jong et al. 2002). In addition, it turned out that the lyophilisates
were transported around the city to perform acoustic measurements with our collaborators, and we did not
observe any degradation in the acoustic performances. Last but not least, the lifetime of the lyophilisate is at
least one year. This was obtained by using a lyophilisate stored at ambient conditions at room temperature for
one year. In this study, we found that neither morphologies, diameter distributions, nor resonance frequencies
significantly evolved during storage.
It must be mentioned that the microfluidic technology is capable of producing monodisperse
microbubbles tunable in size, e.g. down to 1 µm in diameter (Gnyawali et al. 2017). The small bubbles are to be
addressed to in vivo applications on small animals where high frequencies (e.g. 10-15 MHz) are typically
preferred due to the limited penetration depth. To facilitate the use of large sizes of microbubbles on the small
animals, radial modulation imaging can be used to detect large microbubbles, e.g. 5 µm in diameter, at high
frequency by using dual ultrasonic excitations such as 1 MHz and 15 MHz (Muleki-Seya et al. 2020).
Contrarily to what is sometimes thought, using microfluidic devices for producing monodisperse
bubbles does not jeopardize the possibility of reaching throughputs compatible with research and clinical needs
on a world scale. Rough estimates of world productions of contrast agent microbubbles are on the order of 1017
per year. A microfluidic device working continuously at a frequency of 10 kHz, by avoiding perturbation in the
production with the anti-clogging system (see Fig. 1), produces 1011 bubbles per year. By parallelizing one
thousand times, this would lead to 1014 per year. Besides, obtaining 1 million microbubbles per second from a
single microfluidic device would only lead to the use of a few devices (van Elburg et al. 2021). If we add that
when monodisperse bubbles are used, one hundred times fewer bubbles are needed, owing to their high
echogenicity (see Fig. 5A) and (Segers et al. 2018b), (Sirsi et al. 2010), (Helbert et al. 2020) the production we
can realize with microfluidic devices is compatible with the needs of the domain, on a world scale. Indeed,
before freeze-drying, we need to spread the bubbles on surfaces, which may be space-consuming. However,
calculations show that, in an industrial process where bubbles are produced, then brought to the freeze-drier, the
area needed to spread the bubbles would be extremely limited.
CONCLUSIONS
For the first time, we freeze-dried monodisperse microbubbles without degrading their monodispersity.
This strategy unlocks the bottleneck of transportation and storage of monodisperse microbubbles in the form of

a lyophilisate, i.e., a powder. We solved this problem by developing two different aspects. The first is the
optimization of bubble formulation along with a cryoprotectant. The second is maintaining the bubbles, during
collection, pre-freezing, and freeze-drying steps, in the form of monolayer spots deposited on a glass surface.
Although we developed this method on a polymer-shelled microbubble, in principle, our method can be applied
for obtaining freeze-dried monodisperse lipid or protein-shelled microbubbles.
In our experiments, fresh and freeze-dried PVA bubbles, having the same size and gas core, were
acoustically characterized under the same experimental conditions. In such conditions, we observed, within
experimental error, the same backscattered acoustic response. These measurements complete the optical
observations of sizes and morphologies across the freeze-drying process and lead to conclude that freeze-drying,
in the way we proceed, conserves the bubble properties.
Moreover, the lyophilisates were stored over a year-long time at room temperature and transported to
other laboratories around the city to perform acoustic measurements. We did not observe any geometrical nor
acoustical degradation due to the storage and transportation of the lyophilisates. Moreover, we compared the
backscattered acoustic response of SonoVue and monodisperse PVA bubbles and found that the maximum
acoustic backscattered response of monodisperse bubbles was around ten times higher than that of SonoVue
bubbles at a similar concentration. Our work might facilitate the penetration of monodisperse bubbles in the
domain of UCAs, for performing new tasks and developing novel non-invasive measurements.
Acknowledgments - We gratefully thank the Institut Pierre Gilles de Gennes (IPGG), CARNOT IPGG, ESPCI, CNRS, PSL-
Valorisation, and Coordenação de Aperfeiçoamento de Pessoal de Nível Superior – Brasil (CAPES- Institutional
Internationalization Program – Print) for their financial support. We are grateful to Elian Martin, Gilles Renault, Etienne
Coz, Pierre Garneret, Maria Russo, Igor Braga de Paula for discussions and help.
REFERENCES
Abdelwahed W, Degobert G, Fessi H. Investigation of nanocapsules stabilization by amorphous excipients
during freeze-drying and storage. European Journal of Pharmaceutics and Biopharmaceutics
2006;63:87–94.
Böhmer MR, Schroeders R, Steenbakkers JAM, de Winter SHPM, Duineveld PA, Lub J, Nijssen WPM,
Pikkemaat JA, Stapert HR. Preparation of monodisperse polymer particles and capsules by ink-jet
printing. Colloids and Surfaces A: Physicochemical and Engineering Aspects 2006;289:96–104.
Cerroni B, Cicconi R, Oddo L, Scimeca M, Bonfiglio R, Bernardini R, Palmieri G, Domenici F, Bonanno E,
Mattei M, Paradossi G. In vivo biological fate of poly(vinylalcohol) microbubbles in mice. Heliyon
2018 [cited 2019 Nov 20];4. Available from:
https://www.ncbi.nlm.nih.gov/pmc/articles/PMC6143702/
Choi JJ, Feshitan JA, Baseri B, Wang S, Tung Y-S, Borden MA, Konofagou EE. Microbubble-Size
Dependence of Focused Ultrasound-Induced Blood–Brain Barrier Opening in Mice In Vivo. IEEE
Transactions on Biomedical Engineering 2010;57:145–154.
Church CC. The effects of an elastic solid surface layer on the radial pulsations of gas bubbles. The Journal of
the Acoustical Society of America Acoustical Society of America, 1995;97:1510–1521.
Date PV, Samad A, Devarajan PV. Freeze Thaw: A Simple Approach for Prediction of Optimal
Cryoprotectant for Freeze Drying. AAPS PharmSciTech 2010;11:304–313.
de Jong N, Bouakaz A, Frinking P. Basic acoustic properties of microbubbles. Echocardiography
2002;19:229–240.

Dixon AJ, Li J, Rickel J-MR, Klibanov AL, Zuo Z, Hossack JA. Efficacy of Sonothrombolysis Using
Microbubbles Produced by a Catheter-Based Microfluidic Device in a Rat Model of Ischemic Stroke.
Ann Biomed Eng 2019;47:1012–1022.
Doinikov AA, Bouakaz A. Review of shell models for contrast agent microbubbles. IEEE Transactions on
Ultrasonics, Ferroelectrics, and Frequency Control 2011;58:981–993.
Esposito C, McDonald ME, Machado P, Savage M, Fischman D, Mehrotra P, Cohen I, Ruggiero N, Walinsky
P, Dickie K, Davis M, Forsberg F, Dave JK. Estimating Central Cardiac Pressures Noninvasively in
Patients Using Ultrasound Contrast Agents. 2020 IEEE International Ultrasonics Symposium (IUS)
2020. pp. 1–4.
Fairbank WM, Scully MO. A New Noninvasive Technique for Cardiac Pressure Measurement: Resonant
Scattering of Ultrasound from Bubbles. IEEE Transactions on Biomedical Engineering 1977;BME-
24:107–110.
Feshitan JA, Chen CC, Kwan JJ, Borden MA. Microbubble size isolation by differential centrifugation.
Journal of Colloid and Interface Science 2009;329:316–324.
Frinking P, Segers T, Luan Y, Tranquart F. Three Decades of Ultrasound Contrast Agents: A Review of the
Past, Present and Future Improvements. Ultrasound in Medicine & Biology 2020;46:892–908.
Frinking PJA, Tardy I, Théraulaz M, Arditi M, Powers J, Pochon S, Tranquart F. Effects of Acoustic
Radiation Force on the Binding Efficiency of BR55, a VEGFR2-Specific Ultrasound Contrast Agent.
Ultrasound in Medicine and Biology Elsevier, 2012;38:1460–1469.
Furuta Y, Oikawa N, Kurita R. Close relationship between a dry-wet transition and a bubble rearrangement in
two-dimensional foam. Sci Rep 2016;6:37506.
Gnyawali V, Moon B-U, Kieda J, Karshafian R, Kolios MC, Tsai SSH. Honey, I shrunk the bubbles:
microfluidic vacuum shrinkage of lipid-stabilized microbubbles. Soft Matter The Royal Society of
Chemistry, 2017;13:4011–4016.
Gramiak R, Shah P. Echocardiography of the Aortic Root. Investigative Radiology 1968;3:356–366.
Grishenkov D, Kari L, Brodin L-Å, Brismar TB, Paradossi G. In vitro contrast-enhanced ultrasound
measurements of capillary microcirculation: Comparison between polymer- and phospholipid-shelled
microbubbles. Ultrasonics 2011;51:40–48.
Grishenkov D, Pecorari C, Brismar TB, Paradossi G. Characterization of Acoustic Properties of PVA-Shelled
Ultrasound Contrast Agents: Linear Properties (Part I). Ultrasound in Medicine & Biology
2009;35:1127–1138.
Helbert A, Gaud E, Segers T, Botteron C, Frinking P, Jeannot V. Monodisperse versus Polydisperse
Ultrasound Contrast Agents: In Vivo Sensitivity and safety in Rat and Pig. Ultrasound in Medicine &
Biology 2020;46:3339–3352.
Hernot S, Klibanov AL. Microbubbles in ultrasound-triggered drug and gene delivery. Advanced Drug
Delivery Reviews 2008;60:1153–1166.
Hoff L. Acoustic Characterization of Contrast Agents for Medical Ultrasound Imaging. Springer Science &
Business Media, 2001.
Hoff L, Sontum PC, Hovem JM. Oscillations of polymeric microbubbles: Effect of the encapsulating shell.
The Journal of the Acoustical Society of America Acoustical Society of America, 2000;107:2272–
2280.

Ishihara K, Kitabatake A, Tanouchi J, Fujii K, Uematsu M, Yoshida Y, Kamada T, Tamura T, Chihara K,
Shirae K. New Approach to Noninvasive Manometry Based on Pressure Dependent Resonant Shift of
Elastic Microcapsules in Ultrasonic Frequency Characteristics. Jpn J Appl Phys IOP Publishing,
1988;27:125.
Lee D, Sehgal CM, Lee MH. Microfluidic-based generation of functionalized microbubbles for ultrasound
imaging and therapy. 2011 [cited 2021 Jun 21]. Available from:
https://patents.google.com/patent/WO2011017524A1/en
Leong-Poi Howard, Christiansen Jonathan, Klibanov Alexander L., Kaul Sanjiv, Lindner Jonathan R.
Noninvasive Assessment of Angiogenesis by Ultrasound and Microbubbles Targeted to αv-Integrins.
Circulation American Heart Association, 2003;107:455–460.
Malloggi F, Pannacci N, Attia R, Monti F, Mary P, Willaime H, Tabeling P, Cabane B, Poncet P.
Monodisperse Colloids Synthesized with Nanofluidic Technology. Langmuir American Chemical
Society, 2010;26:2369–2373.
Mensink MA, Frijlink HW, van der Voort Maarschalk K, Hinrichs WLJ. How sugars protect proteins in the
solid state and during drying (review): Mechanisms of stabilization in relation to stress conditions.
European Journal of Pharmaceutics and Biopharmaceutics 2017;114:288–295.
Minnaert MM. XVI. On musical air-bubbles and the sounds of running water. The London, Edinburgh, and
Dublin Philosophical Magazine and Journal of Science Taylor & Francis, 1933;16:235–248.
Mitchell DE, Fayter AER, Deller RC, Hasan M, Gutierrez-Marcos J, Gibson MI. Ice-recrystallization
inhibiting polymers protect proteins against freeze-stress and enable glycerol-free cryostorage. Mater
Horiz The Royal Society of Chemistry, 2019;6:364–368.
Muleki-Seya P, Xu K, Tanter M, Couture O. Ultrafast Radial Modulation Imaging. IEEE Trans Ultrason
Ferroelectr Freq Control 2020;67:598–611.
Oddo L, Cerroni B, Domenici F, Bedini A, Bordi F, Chiessi E, Gerbes S, Paradossi G. Next generation
ultrasound platforms for theranostics. Journal of Colloid and Interface Science 2017;491:151–160.
Overvelde M, Garbin V, Dollet B, de Jong N, Lohse D, Versluis M. Dynamics of Coated Microbubbles
Adherent to a Wall. Ultrasound in Medicine & Biology 2011;37:1500–1508.
Podell S, Burrascano C, Gaal M, Golec B, Maniquis J, Mehlhaff P. Physical and biochemical stability of
Optison®, an injectable ultrasound contrast agent. Biotechnology and Applied Biochemistry
1999;30:213–223.
Poehlmann M, Grishenkov D, Kothapalli SVVN, Härmark J, Hebert H, Philipp A, Hoeller R, Seuss M,
Kuttner C, Margheritelli S, Paradossi G, Fery A. On the interplay of shell structure with low- and
high-frequency mechanics of multifunctional magnetic microbubbles. Soft Matter The Royal Society
of Chemistry, 2013;10:214–226.
Roovers S, Segers T, Lajoinie G, Deprez J, Versluis M, De Smedt SC, Lentacker I. The Role of Ultrasound-
Driven Microbubble Dynamics in Drug Delivery: From Microbubble Fundamentals to Clinical
Translation. Langmuir American Chemical Society, 2019;35:10173–10191.
Schneider M. Characteristics of SonoVueTM. Echocardiography 1999;16:743–746.
Segers T, de Jong N, Versluis M. Uniform scattering and attenuation of acoustically sorted ultrasound contrast
agents: Modeling and experiments. The Journal of the Acoustical Society of America Acoustical
Society of America, 2016;140:2506–2517.

Segers T, Gaud E, Versluis M, Frinking P. High-precision acoustic measurements of the nonlinear dilatational
elasticity of phospholipid coated monodisperse microbubbles. Soft Matter 2018a;14:9550–9561.
Segers T, Kruizinga P, Kok MP, Lajoinie G, de Jong N, Versluis M. Monodisperse Versus Polydisperse
Ultrasound Contrast Agents: Non-Linear Response, Sensitivity, and Deep Tissue Imaging Potential.
Ultrasound in Medicine & Biology 2018b;44:1482–1492.
Shi W, Forsberg F, Raichlen J, Needleman L, Goldberg B. Pressure dependence of subharmonic signals from
contrast microbubbles. Ultrasound in Medicine and Biology Elsevier, 1999;25:275–283.
Sirsi S, Feshitan J, Kwan J, Homma S, Borden M. Effect of Microbubble Size on Fundamental Mode High
Frequency Ultrasound Imaging in Mice. Ultrasound Med Biol 2010;36:935–948.
Song R, Peng C, Xu X, Wang J, Yu M, Hou Y, Zou R, Yao S. Controllable Formation of Monodisperse
Polymer Microbubbles as Ultrasound Contrast Agents. ACS Appl Mater Interfaces 2018;10:14312–
14320.
Streeter JE, Gessner R, Miles I, Dayton PA. Improving Sensitivity in Ultrasound Molecular Imaging by
Tailoring Contrast Agent Size Distribution: In Vivo Studies. Mol Imaging 2010;9:87–95.
Stride E, Segers T, Lajoinie G, Cherkaoui S, Bettinger T, Versluis M, Borden M. Microbubble Agents: New
Directions. Ultrasound in Medicine & Biology 2020;46:1326–1343.
Sutton J, Raymond J, Verleye M, Pyne-Geithman G, Holland C. Pulsed ultrasound enhances the delivery of
nitric oxide from bubble liposomes to ex vivo porcine carotid tissue. Int J Nanomedicine
2014;9:4671–4683.
Tabeling P. Introduction to Microfluidics. OUP Oxford, 2005.
Tourin A, Derode A, Peyre A, Fink M. Transport parameters for an ultrasonic pulsed wave propagating in a
multiple scattering medium. The Journal of the Acoustical Society of America Acoustical Society of
America, 2000;108:503–512.
Tremblay-Darveau C, Williams R, Burns PN. Measuring Absolute Blood Pressure Using Microbubbles.
Ultrasound in Medicine and Biology Elsevier, 2014;40:775–787.
van Elburg B, Collado-Lara G, Bruggert G-W, Segers T, Versluis M, Lajoinie G. Feedback-controlled
microbubble generator producing one million monodisperse bubbles per second. Review of Scientific
Instruments American Institute of Physics, 2021;92:035110.


