Embed Size (px)
Citation preview
Journal of Food Engineering 114 (2013) 99–105
Contents lists available at SciVerse ScienceDirect
Journal of Food Engineering
journal homepage: www.elsevier .com/ locate / j foodeng
Mathematical modeling of eggplant drying: Shrinkage effect
Antonio Brasiello a,⇑, Giuseppina Adiletta a, Paola Russo a, Silvestro Crescitelli b, Donatella Albanese a,Marisa Di Matteo a
a Department of Industrial Engineering, University of Salerno, Via Ponte Don Melillo, 84084 Fisciano (SA), Italyb Department of Chemical Engineering, University of Naples Federico II, Piazzale Tecchio, 80, 80125 Napoli, Italy
a r t i c l e i n f o
Article history:Received 30 March 2012Received in revised form 14 July 2012Accepted 28 July 2012Available online 5 August 2012
Keywords:Mathematical modelDryingShrinkageEggplant
0260-8774/$ - see front matter � 2012 Elsevier Ltd. Ahttp://dx.doi.org/10.1016/j.jfoodeng.2012.07.031
⇑ Corresponding author. Tel.: +39 0817682537; faxE-mail address: [email protected] (A. Brasiello).
a b s t r a c t
In this paper two mathematical models with shrinkage effect describing eggplant drying are developedand discussed. The models are both modified diffusion equations and take differently into accountchanges of eggplant slice structure during drying. In the first model a diffusion coefficient variable withthe water content is considered while in the second model a fictitious convective term is introduced. Thetwo models are both suitable to describe the analyzed drying processes. Moreover, their equivalence isanalytically demonstrated. Parameters values are estimated through a nonlinear regression procedureby comparison with the drying experiments carried out at different temperatures. Information aboutthickness evolution, derived from the models, are found to be in agreement with experimental data.
� 2012 Elsevier Ltd. All rights reserved.
1. Introduction
Eggplants are vegetables whose shelf-life at temperature of 10–15 �C is about 10 days (Hu et al., 2010). The limited shelf-life con-stitutes a heavy drawback for commercial purpose. Several studiesdeal with the possibility of prolonging shelf-life (Arvanitoyanniset al., 2005; Hu et al., 2010; Jha and Matsuoka, 2002; Wu et al.,2008, 2009; Zhang and Chen, 2006), using several techniques.Since they are common ingredients in preparation of dry long-lifemixtures, the shelf-life can be profitably prolonged through drying.
Drying is a very important technology to improve food preserva-tion (Sagar and Kumar, 2010). Moisture’s removal preserves foodsfrom deterioration due to growth of microorganisms (Ansari andDatta, 2003), action of enzymes, and oxidation’s reactions (Raitioet al., 2011). Moreover, it provides lighter weight and smallervolumes for transportation and storage. Common applications ofdrying technologies are in use for various vegetables conservation.In some cases vegetables are consumed dried (e.g. dried fruits) orrehydration is delegated to the end consumers as in dry soups.
The main objective to be reached during drying is to keep al-most constant the nutritional and organoleptic properties. More-over, many parameters (e.g. color, texture, global aspect,roughness) influence the overall aspect of the end product, andtherefore the consumer acceptability. These properties dependwidely on drying conditions.
ll rights reserved.
: +39 0815936936.
From this viewpoint, the development of suitable mathematicalmodels, providing temporal evolution of state variables, is a matterof practical interest to achieve the optimal process conditionsfor extending shelf-life of product. In literature several studiesinvestigating industrial drying processes of vegetables, supportedby mathematical models, are available. They are mainly based ontwo different approaches: theoretical or empirical (Datta,2007a,b). Theoretical models are generally based on Fick’s secondlaw of diffusion and were usefully applied for drying processes ofmany food products such as rice (Basunia and Abe, 2001), hazelnut(Ozdemir and Devres, 1999), Amelie mango (Dissa et al., 2008), ra-peseed (Crisp and Woods, 1994), and potato (Akpinar et al., 2003).Despite of computational drawbacks, they provide useful informa-tion about physical mechanisms involved in drying process andassure good predictions of temporal evolution of state variableswhen the process conditions change. Moreover, they are oftenexploitable in a wide class of food products.
In contrast, empirical models are either derived by series expan-sions of theoretical models’ general solutions or, more often, arepure kinetic formulas depending on process conditions. The empir-ical models are easy to deal with, but they do not provide anyphysical information and their use is restricted to specific processconditions. The most widespread empirical models in literature arethose of Newton, Page, Henderson and Pabis, Wang and Singh(Akpinar and Bicer, 2005; Ertekin and Yaldiz, 2004), and were ap-plied to the description of several aspects of drying processes (Kha-lloufi et al., 2009, 2010) for many foodstuffs e.g. quince (Koc et al.,2008), eggplant (Doymaz, 2011; Ertekin and Yaldiz, 2004), cherrytomato (Heredia et al., 2007), apricot (Togrul and Pehlivan,
Nomenclature
Used notations are reported in the following.c differential dimensionless water content at the position
x and time td(c) diffusion coefficient (function of c) (cm2/s)D effective diffusion coefficient (constant) (cm2/s)G equilibrium constanth mass transport coefficient (1/cm)Km overall mass transfer coefficient (1/cm)L eggplant slices thickness (cm)m mass of the differential element at the position x and
time tM total dimensionless water contentn number of experimental dataP absolute pressure (Pa)r pore radius (lm)S surface area of the sample (mm2)t time (s)T temperatureu shrinkage velocity (cm/s)us estimated mean value of shrinkage velocity (cm/s)x spatial coordinate (cm)
b slope of d(c) (cm2/s)c surface tension (dyne/cm)d intercept of d(c) (cm2/s)e void fraction# contact angle (�)m volume of water per unit area (mm)n parameter linking u and the spatial derivative of c
(cm2/s)
Subscripts0 initial value1 final valueb basisg gas phasel lateral
Superscripts^ numerical derived value
100 A. Brasiello et al. / Journal of Food Engineering 114 (2013) 99–105
2003), mushroom (Hernando et al., 2008), and black tea(Panchariya et al., 2002).
Air-drying of food materials is often followed by physical andchemical changes which dramatically influence the process itself(Senadeera, 2008). One of the most important consequences ofthese changes is shrinkage: a volume reduction, coupled withshape and porosity changes and hardness increase. Such phenom-ena could also be followed by surface cracking. Another negativeeffect of shrinkage is, for instance, the reduction of rehydrationcapability as demonstrated by several authors (Jayaraman et al.,1990; Mcminn and Magee, 1997a,b). Therefore, shrinkage has tobe avoided because such physical changes contribute in generalto reduce the quality perceived by the end consumer of dehydratedproducts, traditionally consumed fresh. Obvious exceptions arerepresented by foods, like dried plums and dates, usually eatenshrunken.
Since shrinkage influences drying and consequently rehydra-tion, it has to be taken into account in mathematical modeling ofsuch processes. Several types of models predicting volume changesare available in literature as, for example, reviewed by Khalloufiet al. (2009), Mayor and Sereno (2004).
Based on two different approaches, two different mathematicalmodels for isothermal eggplants air drying, based on Fick’s secondlaw of mass diffusion, are here developed and discussed. Parame-ters of the models are calculated on the basis of isothermal exper-imental data at different temperatures, by means of a suitabledeveloped nonlinear regression algorithm. The models provideuseful information about shrinkage phenomena supplementingthat obtained through experiments.
2. Materials and methods
Drying experiments are conducted on slices of eggplants (Sola-num Melongena, Longo cultivar). Vegetables are washed andpeeled. Cylindrical slices with diameter of 30 mm and thicknessof 6 mm are prepared sampling the material from the whole vege-table using a suitable steel mould. The initial water content (kg/kgon dry-weight basis) is 12.704 ± 0.04. Dehydration procedure is thefollowing: eggplant slices are placed over a metal grating in a con-vective oven (mod. Zanussi FCV/E6L3) operating at constant tem-
perature. Drying experiments are carried out at temperatures 40,50, 60, 70 �C. These temperatures are usually used in food indus-tries. At suitable time intervals some slices are removed from theoven and their weight loss is measured by means of a digital bal-ance (mod. Gibertini E42, Italia). The procedure is repeated untilthe weight remains constant for 30 min. This corresponds to dryingtime of 270 min at 40 �C, 225 min at 50 �C, 165 min at 60 �C, e135 min at 70 �C.
The pore structure of eggplant samples is analyzed by mercuryintrusion porosimetric technique with the instruments Pascal 140and Pascal 240 (Thermo Finnigan) operating in the pressure rangefrom sub ambient up to 200 MPa. The technique is based on themercury property to behave as non-wetting liquid with a lot of so-lid materials. Thanks to this property, mercury penetrates throughthe open pores of a solid sample under the effect of an increasingpressure. The relation between the pore size and the applied pres-sure, assuming the shape of pores is cylindrical, is expressed as:
P � r ¼ �2ccos# ð1Þ
where r is the pore radius, c the Hg surface tension, # is the contactangle and P is absolute applied pressure. Eq. (1) is the well-knownWashburn equation (Washburn, 1921). It provides a simple andconvenient relationship between applied pressure and pore size.Pore size distributions are therefore obtained generated by moni-toring the amount of non-wetting mercury intruded into pores asa function of the increasing applied pressure.
The pressure range investigated allows to cover the pore diam-eter range from 0.0075 up to 100 lm. Thus, the pressure is suffi-cient to ensure intrusion of mercury in most of the mesopores(0.002–0.05 lm) and of the macropores (0.05–100 lm). However,majority of the micropores would remain not intruded.
Values of 141.3� and 480 dyne/cm are used for the contact angleand mercury surface tension, respectively (Chesson et al., 1997;Karathanos et al., 1996). Tests are carried out on fresh and driedeggplant samples. Mercury intrusion porosimetric tests are carriedout in triplicate to ensure adequate accuracy of the results.
In order to study the effect of the different drying conditions onstructural changes occurring also on length-scales greater than100 lm, the microstructure of dried samples is analyzed usingSEM technique. Eggplant samples are coated with a thin layer
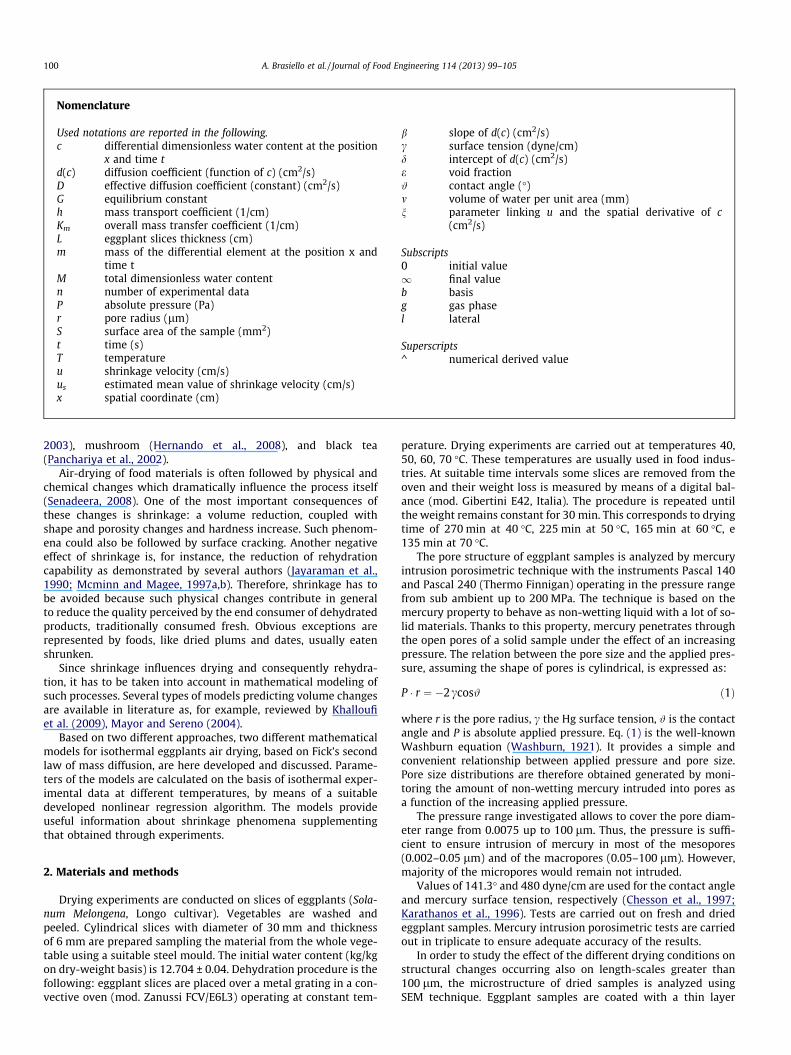
Fig. 1. Water content profile in eggplant slice.
A. Brasiello et al. / Journal of Food Engineering 114 (2013) 99–105 101
(25 nm) of gold in a sputter coater (AGAR Auto Sputter Coater,mod.108 A, England), for 150 s. Finally, different images of eachsample are captured using a scanning electron microscope (SEM)(Zeiss Sigma VP with Gemini column).
3. Results and discussion
3.1. Mathematical model
The mathematical models of the eggplant drying process arebased on the following assumptions: The eggplant slices consistof a continuous, homogeneous, and isotropic solid phase and ofuniformly distributed pores; the characteristic time of thermaltransient is far less than that of mass transport; the time of masstransport along thickness is far less than that of mass transportalong radius. The first assumption is supported by experimentalevidences, while the last one comes from the sample geometry(disc with 2Sb/Sl = 2.5). This means that the drying process maybe regarded as evolving along one-dimensional flow, and takingplace under isothermal conditions as observed in previous works(Di Matteo et al., 2000, 2003).
Eggplant samples show structure modifications during dryingwhich appear visually both as a volume reduction and as a modifi-cation of the external surface area caused by a changing in poresize distribution.
Two practices are usually adopted in literature to take intoaccount the effects of structural changes into the model. In the firstone such details are considered in an effective diffusion coefficient,since the diffusion is a process depending on pore size distributionand shape (Bird et al., 2007). The second approach allows takinginto account the macroscopic effect of shrinkage phenomenon.According to Carslaw and Jaeger (1959), Karim and Hawlader(2005), and Datta (2007a), it consists of the addition of a convec-tive term which mimics the effect of volume reduction on trans-port phenomena.
In the case of the first approach, and assuming a dependence ofthe effective diffusion coefficient d from the dimensionless watercontent, the mathematical model consists of the following modi-fied diffusion equation:
@c@t¼ @
@xdðcÞ @c
@x
� �ð2Þ
where t is time, x is the space variable along slice thickness, this lastassumed to be constant during drying, while c is the dimensionlesswater content defined, for each differential spatial element dx andtemporal element dt, as c ¼ mass of removed water
mass of removable water ¼m�m1
m0�m1. m is the mass
of the element during drying while the subscripts 0 and 1 refer toits initial and final value, respectively.
The simplest case can be obtained by assuming a linear depen-dence of the diffusion term from the variable c and is hereconsidered:
dðcÞ ¼ d� bc ð3Þ
Boundary conditions are:
@c@x
����x¼0¼ 0 ð4Þ
@c@x
�� ����x¼L
2
¼ �hcG
�� ���x¼L
2
ð5Þ
G is the constant of the relationship c = G�cg linking the watercontent at both sides of the interface between eggplant and theenvironment, assumed to be at thermodynamical equilibrium,while h is a transport coefficient. Eq. (5) can be rewritten asfollows:
@c@x
� �����x¼L
2
¼ �km cjx¼L2
ð6Þ
where Km ¼ hG stands for an overall mass transfer coefficient through
the interface between eggplant and the environment, which can beconsidered independent of temperature. Eq. (6) imposes the func-tional form of the derivative at the interface between sample andthe environment.
A water content profile in the eggplant pulp as well as in thegaseous bulk is schematically shown in Fig. 1.
In the second approach, the equation describing mass transportduring drying is the following diffusion–convection equation:
@c@tþ @uc@x¼ @
@xD@c@x
� �ð7Þ
With Eqs. (4) and (6) as boundary conditions.The parameter u in Eq. (7) is the shrinkage velocity, here intro-
duced to take into account shrinkage phenomena (Carslaw andJaeger, 1959). Assuming u = 0 it results in a pure diffusion equation.D is a diffusion coefficient. Unlike the previous case this parameteris now assumed to be constant during process but variable withtemperature according to the following law:
D ¼ D0 e exp�ERT
� �ð8Þ
The parameter e in Eq. (8) is the void fraction of the sample atthe end of the drying process. It is assumed to be dependent ontemperature in accordance with the linear law e1 þ e2T .
In order to take into account the volume reduction due tochanges in pore size distribution, the following dependence ofthe parameter u from the dimensionless water content c is intro-duced in Eq. (7):
u ¼ n � @c@x
ð9Þ
In the range of temperatures analyzed, a linear dependence of nwith temperature is assumed:
n ¼ n1 þ n2T ð10Þ

Table 1Void fraction and average pore diameter of fresh and dried eggplant samples atdifferent temperatures obtained by Hg intrusion porosimetric technique.
Sample Void fraction (%) Average pore diameter (lm)
Fresh 42 110Dried at 50 �C 78 40Dried at 60 �C 83 74Dried at 70 �C 95 64
Table 2Predicted parameters related to voidfraction vs. temperature dependence.
Parameter Value
e1 �1.98e2 0.0085 (1/K)
102 A. Brasiello et al. / Journal of Food Engineering 114 (2013) 99–105
In both approaches, uniform initial water content profiles areimposed, hence:
c x;0ð Þ ¼ 1 8x 2 � L2;L2
� �ð11Þ
The functional forms adopted for d(c) in Eq. (2) and for u in Eq.(7) have, as a result, the equivalence of the two models.
It can be easily proved by writing Eq. (2) as follows:
@c@t¼ @d@x� @c@xþ d
@2c@x2 ð12Þ
It is equivalent to:
@c@t¼ @d@c� @c@x
� �2
þ d@2c@x2 ð13Þ
And by substituting Eq. (3) in Eq. (13):
@c@t¼ �b � @c
@x
� �2
þ d� bcð Þ @2c@x2 ð14Þ
This can be rearranged as follows:
@c@tþ b � @c
@x
� �2
þ bc@2c@x2 ¼ d
@2c@x2 ð15Þ
Hence:
@c@tþ @
@xb@c@x� c
� �¼ d
@2c@x2 ð16Þ
which is equal to Eq. (7) with b = n and d = D.
Fig. 2. Scanning electron microscope images (250�) of a fresh
3.2. Experimental results
In Table 1 the void fraction and average pore diameter by mer-cury porosimetry for fresh and dried samples at fixed temperaturesare reported. As already mentioned, results refer to pore diametersfrom 0.0075 up to 100 lm.
Void fraction of dried samples are in general higher than thatrelated to the fresh one, because of the evaporation of water frompores. The effect of shrinkage causes a reduction of void fraction indried samples and a reduction of the average pore diameter withrespect to the fresh one. Dried sample at 50 �C shows the lowestpore diameter and the lower void fraction with respect to the otherdried samples. On the other hand, in the dried sample at 70 �C areduction of the average pore diameter and an increasing void frac-tion are observed. The dried sample at 60 �C shows an intermediatebehavior among the previous and a minor structural collapse. SEManalysis provides further useful information on structural changesduring drying.
In Fig. 2, SEM images of dried samples at 50, 60 and 70 �C arereported and compared with the fresh one. This figure gives a clearevidence of the shrinkage phenomena occurred also on the fractionof pores with diameter greater than 100 lm. It can be observedthat the dried sample at 60 �C shows, despite of the presence ofpores, a structure similar to that of the fresh sample. Samples at50 and 70 �C show more wrinkled structure with respect to thatof the fresh sample. In particular, the dried sample at 70 �C is com-pletely broken up. This, in our opinion, could be due to the occur-rence of chemical reactions (which depends highly on processtemperature) that deeply modify the structure causing the harden-ing and the consequent damage (Fernando et al., 2008). The anal-ysis of these issues is outside the scope of the present work.
eggplant sample and of dried samples at 50, 60 and 70 �C.
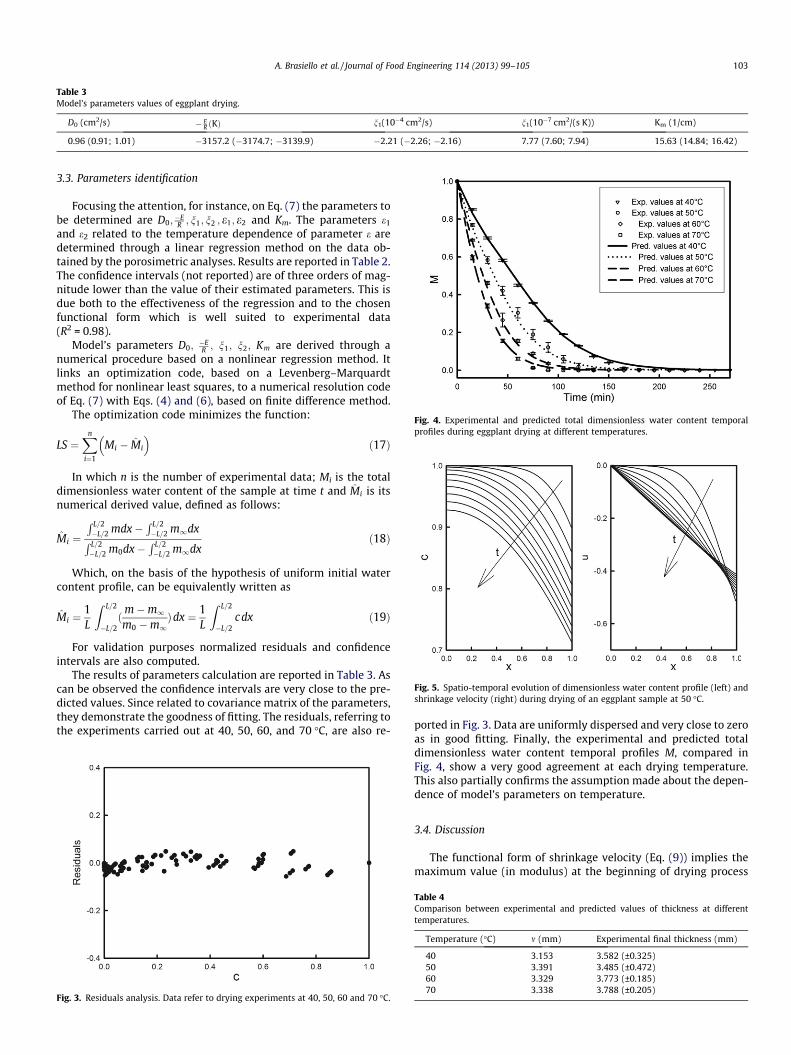
Table 3Model’s parameters values of eggplant drying.
D0 (cm2/s) � ER ðKÞ n1(10�4 cm2/s) n1(10�7 cm2/(s K)) Km (1/cm)
0.96 (0.91; 1.01) �3157.2 (�3174.7; �3139.9) �2.21 (�2.26; �2.16) 7.77 (7.60; 7.94) 15.63 (14.84; 16.42)
Fig. 5. Spatio-temporal evolution of dimensionless water content profile (left) andshrinkage velocity (right) during drying of an eggplant sample at 50 �C.
Fig. 4. Experimental and predicted total dimensionless water content temporalprofiles during eggplant drying at different temperatures.
A. Brasiello et al. / Journal of Food Engineering 114 (2013) 99–105 103
3.3. Parameters identification
Focusing the attention, for instance, on Eq. (7) the parameters tobe determined are D0;
�ER ; n1; n2 ; e1; e2 and Km. The parameters e1
and e2 related to the temperature dependence of parameter e aredetermined through a linear regression method on the data ob-tained by the porosimetric analyses. Results are reported in Table 2.The confidence intervals (not reported) are of three orders of mag-nitude lower than the value of their estimated parameters. This isdue both to the effectiveness of the regression and to the chosenfunctional form which is well suited to experimental data(R2 = 0.98).
Model’s parameters D0;�ER ; n1; n2; Km are derived through a
numerical procedure based on a nonlinear regression method. Itlinks an optimization code, based on a Levenberg–Marquardtmethod for nonlinear least squares, to a numerical resolution codeof Eq. (7) with Eqs. (4) and (6), based on finite difference method.
The optimization code minimizes the function:
LS ¼Xn
i¼1
Mi � M̂i
� �ð17Þ
In which n is the number of experimental data; Mi is the totaldimensionless water content of the sample at time t and M̂i is itsnumerical derived value, defined as follows:
M̂i ¼R L=2�L=2 mdx�
R L=2�L=2 m1dxR L=2
�L=2 m0dx�R L=2�L=2 m1dx
ð18Þ
Which, on the basis of the hypothesis of uniform initial watercontent profile, can be equivalently written as
M̂i ¼1L
Z L=2
�L=2ðm�m1m0 �m1
Þdx ¼ 1L
Z L=2
�L=2c dx ð19Þ
For validation purposes normalized residuals and confidenceintervals are also computed.
The results of parameters calculation are reported in Table 3. Ascan be observed the confidence intervals are very close to the pre-dicted values. Since related to covariance matrix of the parameters,they demonstrate the goodness of fitting. The residuals, referring tothe experiments carried out at 40, 50, 60, and 70 �C, are also re-
Fig. 3. Residuals analysis. Data refer to drying experiments at 40, 50, 60 and 70 �C.
ported in Fig. 3. Data are uniformly dispersed and very close to zeroas in good fitting. Finally, the experimental and predicted totaldimensionless water content temporal profiles M, compared inFig. 4, show a very good agreement at each drying temperature.This also partially confirms the assumption made about the depen-dence of model’s parameters on temperature.
3.4. Discussion
The functional form of shrinkage velocity (Eq. (9)) implies themaximum value (in modulus) at the beginning of drying process
Table 4Comparison between experimental and predicted values of thickness at differenttemperatures.
Temperature (�C) m (mm) Experimental final thickness (mm)
40 3.153 3.582 (±0.325)50 3.391 3.485 (±0.472)60 3.329 3.773 (±0.185)70 3.338 3.788 (±0.205)
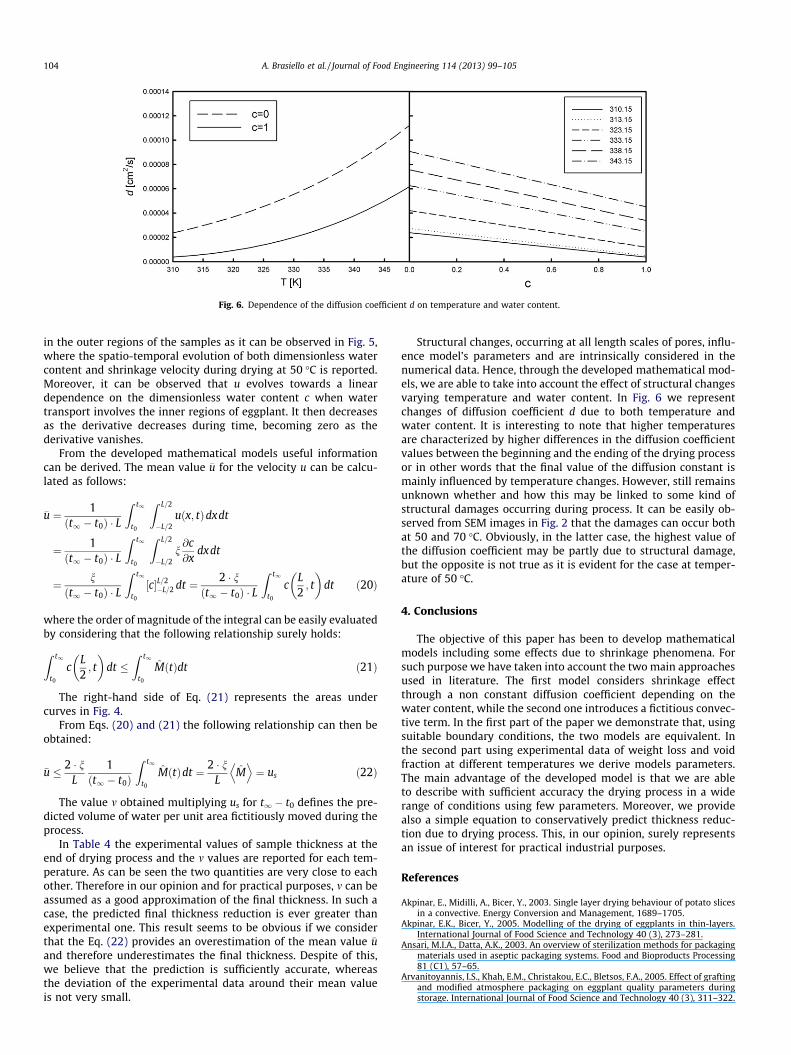
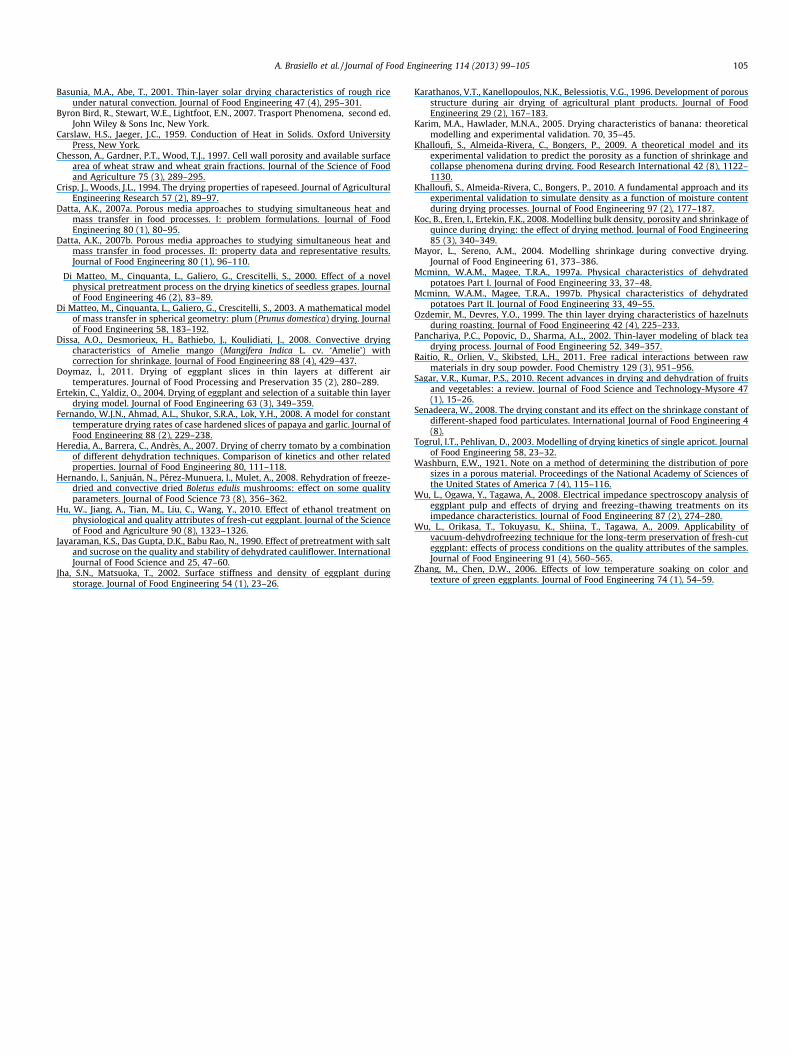
Fig. 6. Dependence of the diffusion coefficient d on temperature and water content.
104 A. Brasiello et al. / Journal of Food Engineering 114 (2013) 99–105
in the outer regions of the samples as it can be observed in Fig. 5,where the spatio-temporal evolution of both dimensionless watercontent and shrinkage velocity during drying at 50 �C is reported.Moreover, it can be observed that u evolves towards a lineardependence on the dimensionless water content c when watertransport involves the inner regions of eggplant. It then decreasesas the derivative decreases during time, becoming zero as thederivative vanishes.
From the developed mathematical models useful informationcan be derived. The mean value �u for the velocity u can be calcu-lated as follows:
�u ¼ 1ðt1 � t0Þ � L
Z t1
t0
Z L=2
�L=2uðx; tÞdxdt
¼ 1ðt1 � t0Þ � L
Z t1
t0
Z L=2
�L=2n@c@x
dxdt
¼ nðt1 � t0Þ � L
Z t1
t0
½c�L=2�L=2 dt ¼ 2 � n
ðt1 � t0Þ � L
Z t1
t0
cL2; t
� �dt ð20Þ
where the order of magnitude of the integral can be easily evaluatedby considering that the following relationship surely holds:
Z t1
t0
cL2; t
� �dt �
Z t1
t0
M̂ tð Þdt ð21Þ
The right-hand side of Eq. (21) represents the areas undercurves in Fig. 4.
From Eqs. (20) and (21) the following relationship can then beobtained:
�u � 2 � nL
1t1 � t0ð Þ
Z t1
t0
M̂ tð Þdt ¼ 2 � nL
M̂D E
¼ us ð22Þ
The value m obtained multiplying us for t1 � t0 defines the pre-dicted volume of water per unit area fictitiously moved during theprocess.
In Table 4 the experimental values of sample thickness at theend of drying process and the m values are reported for each tem-perature. As can be seen the two quantities are very close to eachother. Therefore in our opinion and for practical purposes, m can beassumed as a good approximation of the final thickness. In such acase, the predicted final thickness reduction is ever greater thanexperimental one. This result seems to be obvious if we considerthat the Eq. (22) provides an overestimation of the mean value �uand therefore underestimates the final thickness. Despite of this,we believe that the prediction is sufficiently accurate, whereasthe deviation of the experimental data around their mean valueis not very small.
Structural changes, occurring at all length scales of pores, influ-ence model’s parameters and are intrinsically considered in thenumerical data. Hence, through the developed mathematical mod-els, we are able to take into account the effect of structural changesvarying temperature and water content. In Fig. 6 we representchanges of diffusion coefficient d due to both temperature andwater content. It is interesting to note that higher temperaturesare characterized by higher differences in the diffusion coefficientvalues between the beginning and the ending of the drying processor in other words that the final value of the diffusion constant ismainly influenced by temperature changes. However, still remainsunknown whether and how this may be linked to some kind ofstructural damages occurring during process. It can be easily ob-served from SEM images in Fig. 2 that the damages can occur bothat 50 and 70 �C. Obviously, in the latter case, the highest value ofthe diffusion coefficient may be partly due to structural damage,but the opposite is not true as it is evident for the case at temper-ature of 50 �C.
4. Conclusions
The objective of this paper has been to develop mathematicalmodels including some effects due to shrinkage phenomena. Forsuch purpose we have taken into account the two main approachesused in literature. The first model considers shrinkage effectthrough a non constant diffusion coefficient depending on thewater content, while the second one introduces a fictitious convec-tive term. In the first part of the paper we demonstrate that, usingsuitable boundary conditions, the two models are equivalent. Inthe second part using experimental data of weight loss and voidfraction at different temperatures we derive models parameters.The main advantage of the developed model is that we are ableto describe with sufficient accuracy the drying process in a widerange of conditions using few parameters. Moreover, we providealso a simple equation to conservatively predict thickness reduc-tion due to drying process. This, in our opinion, surely representsan issue of interest for practical industrial purposes.
References
Akpinar, E., Midilli, A., Bicer, Y., 2003. Single layer drying behaviour of potato slicesin a convective. Energy Conversion and Management, 1689–1705.
Akpinar, E.K., Bicer, Y., 2005. Modelling of the drying of eggplants in thin-layers.International Journal of Food Science and Technology 40 (3), 273–281.
Ansari, M.I.A., Datta, A.K., 2003. An overview of sterilization methods for packagingmaterials used in aseptic packaging systems. Food and Bioproducts Processing81 (C1), 57–65.
Arvanitoyannis, I.S., Khah, E.M., Christakou, E.C., Bletsos, F.A., 2005. Effect of graftingand modified atmosphere packaging on eggplant quality parameters duringstorage. International Journal of Food Science and Technology 40 (3), 311–322.
A. Brasiello et al. / Journal of Food Engineering 114 (2013) 99–105 105
Basunia, M.A., Abe, T., 2001. Thin-layer solar drying characteristics of rough riceunder natural convection. Journal of Food Engineering 47 (4), 295–301.
Byron Bird, R., Stewart, W.E., Lightfoot, E.N., 2007. Trasport Phenomena, second ed.John Wiley & Sons Inc, New York.
Carslaw, H.S., Jaeger, J.C., 1959. Conduction of Heat in Solids. Oxford UniversityPress, New York.
Chesson, A., Gardner, P.T., Wood, T.J., 1997. Cell wall porosity and available surfacearea of wheat straw and wheat grain fractions. Journal of the Science of Foodand Agriculture 75 (3), 289–295.
Crisp, J., Woods, J.L., 1994. The drying properties of rapeseed. Journal of AgriculturalEngineering Research 57 (2), 89–97.
Datta, A.K., 2007a. Porous media approaches to studying simultaneous heat andmass transfer in food processes. I: problem formulations. Journal of FoodEngineering 80 (1), 80–95.
Datta, A.K., 2007b. Porous media approaches to studying simultaneous heat andmass transfer in food processes. II: property data and representative results.Journal of Food Engineering 80 (1), 96–110.
Di Matteo, M., Cinquanta, L., Galiero, G., Crescitelli, S., 2000. Effect of a novelphysical pretreatment process on the drying kinetics of seedless grapes. Journalof Food Engineering 46 (2), 83–89.
Di Matteo, M., Cinquanta, L., Galiero, G., Crescitelli, S., 2003. A mathematical modelof mass transfer in spherical geometry: plum (Prunus domestica) drying. Journalof Food Engineering 58, 183–192.
Dissa, A.O., Desmorieux, H., Bathiebo, J., Koulidiati, J., 2008. Convective dryingcharacteristics of Amelie mango (Mangifera Indica L. cv. ‘Amelie’) withcorrection for shrinkage. Journal of Food Engineering 88 (4), 429–437.
Doymaz, _I., 2011. Drying of eggplant slices in thin layers at different airtemperatures. Journal of Food Processing and Preservation 35 (2), 280–289.
Ertekin, C., Yaldiz, O., 2004. Drying of eggplant and selection of a suitable thin layerdrying model. Journal of Food Engineering 63 (3), 349–359.
Fernando, W.J.N., Ahmad, A.L., Shukor, S.R.A., Lok, Y.H., 2008. A model for constanttemperature drying rates of case hardened slices of papaya and garlic. Journal ofFood Engineering 88 (2), 229–238.
Heredia, A., Barrera, C., Andrès, A., 2007. Drying of cherry tomato by a combinationof different dehydration techniques. Comparison of kinetics and other relatedproperties. Journal of Food Engineering 80, 111–118.
Hernando, I., Sanjuán, N., Pérez-Munuera, I., Mulet, A., 2008. Rehydration of freeze-dried and convective dried Boletus edulis mushrooms: effect on some qualityparameters. Journal of Food Science 73 (8), 356–362.
Hu, W., Jiang, A., Tian, M., Liu, C., Wang, Y., 2010. Effect of ethanol treatment onphysiological and quality attributes of fresh-cut eggplant. Journal of the Scienceof Food and Agriculture 90 (8), 1323–1326.
Jayaraman, K.S., Das Gupta, D.K., Babu Rao, N., 1990. Effect of pretreatment with saltand sucrose on the quality and stability of dehydrated cauliflower. InternationalJournal of Food Science and 25, 47–60.
Jha, S.N., Matsuoka, T., 2002. Surface stiffness and density of eggplant duringstorage. Journal of Food Engineering 54 (1), 23–26.
Karathanos, V.T., Kanellopoulos, N.K., Belessiotis, V.G., 1996. Development of porousstructure during air drying of agricultural plant products. Journal of FoodEngineering 29 (2), 167–183.
Karim, M.A., Hawlader, M.N.A., 2005. Drying characteristics of banana: theoreticalmodelling and experimental validation. 70, 35–45.
Khalloufi, S., Almeida-Rivera, C., Bongers, P., 2009. A theoretical model and itsexperimental validation to predict the porosity as a function of shrinkage andcollapse phenomena during drying. Food Research International 42 (8), 1122–1130.
Khalloufi, S., Almeida-Rivera, C., Bongers, P., 2010. A fundamental approach and itsexperimental validation to simulate density as a function of moisture contentduring drying processes. Journal of Food Engineering 97 (2), 177–187.
Koc, B., Eren, I., Ertekin, F.K., 2008. Modelling bulk density, porosity and shrinkage ofquince during drying: the effect of drying method. Journal of Food Engineering85 (3), 340–349.
Mayor, L., Sereno, A.M., 2004. Modelling shrinkage during convective drying.Journal of Food Engineering 61, 373–386.
Mcminn, W.A.M., Magee, T.R.A., 1997a. Physical characteristics of dehydratedpotatoes Part I. Journal of Food Engineering 33, 37–48.
Mcminn, W.A.M., Magee, T.R.A., 1997b. Physical characteristics of dehydratedpotatoes Part II. Journal of Food Engineering 33, 49–55.
Ozdemir, M., Devres, Y.O., 1999. The thin layer drying characteristics of hazelnutsduring roasting. Journal of Food Engineering 42 (4), 225–233.
Panchariya, P.C., Popovic, D., Sharma, A.L., 2002. Thin-layer modeling of black teadrying process. Journal of Food Engineering 52, 349–357.
Raitio, R., Orlien, V., Skibsted, L.H., 2011. Free radical interactions between rawmaterials in dry soup powder. Food Chemistry 129 (3), 951–956.
Sagar, V.R., Kumar, P.S., 2010. Recent advances in drying and dehydration of fruitsand vegetables: a review. Journal of Food Science and Technology-Mysore 47(1), 15–26.
Senadeera, W., 2008. The drying constant and its effect on the shrinkage constant ofdifferent-shaped food particulates. International Journal of Food Engineering 4(8).
Togrul, I.T., Pehlivan, D., 2003. Modelling of drying kinetics of single apricot. Journalof Food Engineering 58, 23–32.
Washburn, E.W., 1921. Note on a method of determining the distribution of poresizes in a porous material. Proceedings of the National Academy of Sciences ofthe United States of America 7 (4), 115–116.
Wu, L., Ogawa, Y., Tagawa, A., 2008. Electrical impedance spectroscopy analysis ofeggplant pulp and effects of drying and freezing–thawing treatments on itsimpedance characteristics. Journal of Food Engineering 87 (2), 274–280.
Wu, L., Orikasa, T., Tokuyasu, K., Shiina, T., Tagawa, A., 2009. Applicability ofvacuum-dehydrofreezing technique for the long-term preservation of fresh-cuteggplant: effects of process conditions on the quality attributes of the samples.Journal of Food Engineering 91 (4), 560–565.
Zhang, M., Chen, D.W., 2006. Effects of low temperature soaking on color andtexture of green eggplants. Journal of Food Engineering 74 (1), 54–59.


![Regionalization amidst 'State-Shrinkage' [p.p. 5-28]](https://img.dokumen.tips/doc/110x75/631b937b3e8acd9977057dea/regionalization-amidst-state-shrinkage-pp-5-28.jpg)