Embed Size (px)
Citation preview
Freeze-Drying Manufacturing Process Optimization:
Technology Transfer and Scale-Up
Carolina Cipriano Carvalho
Thesis to obtain the Master of Science Degree in
Pharmaceutical Engineering
Supervisors: Eng. Samuel Mendes Geraldes Camocho
Prof. Maria Cristina de Carvalho Silva Fernandes
Examination Committee
Chairperson: Prof. José Monteiro Cardoso de Menezes
Supervisor: Eng. Samuel Mendes Geraldes Camocho
Members of the Committee: Prof. João Fernandes de Abreu Pinto
November 2019


i
I declare that this document is an original work of my own and that it fulfills all the requirements of the
Code of Conduct and Good Practices of the Universidade de Lisboa.

ii

iii
PREFACE
The work presented in this thesis was performed at the company Hikma Pharmaceuticals (Terrugem,
Portugal), during the period February-July 2019, under the supervision of Eng. Samuel Camocho. The
thesis was co-supervised at Instituto Superior Técnico by Prof. Maria Cristina Fernandes.

iv
v
ACKNOWLEDGMENTS
I would first like to thank to my supervisor, Eng. Samuel Camocho, for giving me the opportunity of
achieving this work at Hikma Pharmaceuticals and for his guidance and knowledge, that were
fundamental. I also thank to Prof. Maria Cristina Fernandes for her support and orientation through this
work. Particular thanks to Ana Rita Martins, Joana Henriques and Telma Ferreira for their daily work
support through my internship at Hikma Pharmaceuticals, as well as for being extraordinary colleagues
whose friendship I hope to take through my life. To all the lyophilization production team, thank you for
welcoming me as part of the team. My thanks are also extended to the Validation, Regulatory Affairs
and Technical Services teams for providing me the knowledge and documentation for my research and
writing.
To my old friends, I would like to thank for their friendship and presence in my life.
Finally, I would like to express my gratitude and love to my family, who supported me during my entire
life. A special thanks to my mom, Carlos and my brother Martim, for giving me continuous
encouragement throughout my years of study. This accomplishment would not have been possible
without them. Thank you.

vi
vii
ABSTRACT
The main goal of this work is to contribute to the knowledge about scale-up and technology transfer of
the manufacturing process of lyophilized injectable pharmaceutical products.
An effective process validation approach must be implemented to ensure that the manufacturing process
is under control and consistently delivers a product within specifications during its lifecycle. Knowledge
management and identification of critical process parameters and critical quality attributes enable to
assess the level of risk and their impact on the product and process. Based on the risk assessment, an
effective control strategy is established.
Aseptic processing is inherent to the manufacture of lyophilized injectable drug products. Aseptic
operations are conducted by qualified personnel in classified areas according to the level of
contamination risk. Containers and closures are sterilized before contact with the sterile product. Aseptic
processing is validated through process simulations with microbiological growth medium, to ensure the
sterility of lyophilized injectable product to be delivered to patients.
A new lyophilized product to be manufactured in Hikma Portugal and commercialized to US market is
presented. The respective manufacturing process is described. The process optimization for this product
comprises a line transfer and a scale-up. Therefore, risk assessment and validation activities were
carried out and the results discussed.
Keywords: Process validation, technology transfer, scale-up, risk assessment, lyophilization

viii
ix
RESUMO
O objetivo principal da tese é contribuir para o conhecimento sobre o aumento de escala e transferência
de tecnologia do processo de produção de medicamentos liofilizados injetáveis.
Uma abordagem de validação de processo é implementada para garantir que o processo de produção
está sob controlo e que produz consistentemente um produto dentro de especificações durante o seu
ciclo de vida. A gestão do conhecimento e identificação de parâmetros críticos do processo e de
atributos de qualidade críticos permitem a análise do nível de risco e respetivo impacto no produto e no
processo. Com base na análise de risco, é estabelecida uma estratégia de controlo.
Processamento assético é inerente à produção de medicamentos liofilizados injetáveis. Operações
asséticas são efetuadas por pessoal qualificado em áreas classificadas de acordo com o nível de risco
de contaminação. A embalagem primária é esterilizada antes de entrar em contacto com o produto
estéril. O processo assético é validado através de simulações do processo com meio de cultura
microbiológico, de forma a garantir a esterilidade do produto liofilizado injetável a ser administrado aos
pacientes.
Um novo produto liofilizado a ser produzido na fábrica Hikma em Portugal e comercializado para o
mercado dos Estados Unidos é apresentado. A otimização do processo para este produto inclui uma
transferência de linha e um aumento de escala, o que implica uma análise de risco e atividades de
validação, cujos resultados são discutidos.
Palavras-chave: Validação de processo, transferência de tecnologia, aumento de escala, análise de
risco, liofilização

x
xi
TABLE OF CONTENTS 1 Introduction .................................................................................................................................... 1
2 Literature review ............................................................................................................................ 3
2.1 Process validation ................................................................................................................. 3
2.1.1 Definition and concepts ............................................................................................ 3
2.1.2 Validation approaches .............................................................................................. 3
2.1.3 Process validation stages ......................................................................................... 4
2.1.4 Regulatory requirements for process validation ....................................................... 8
2.1.5 Connection of Process Validation, Pharmaceutical Quality System and Quality Risk
Management .......................................................................................................................... 8
2.1.6 Documentation ........................................................................................................ 13
2.1.7 Technology transfer as part of process validation .................................................. 13
2.2 Sterile drug products manufacturing ................................................................................... 15
2.2.1 Aseptic processing .................................................................................................. 15
2.2.2 Room classification ................................................................................................. 15
2.2.3 Personnel qualification............................................................................................ 16
2.2.4 Containers and closures sterilization ...................................................................... 16
2.2.5 Filtration validation .................................................................................................. 16
2.2.6 Microbiological testing ............................................................................................ 17
2.2.7 Validation of aseptic processing ............................................................................. 17
3 Hikma lyophilization production department overview ........................................................... 19
3.1 Production lines ................................................................................................................... 19
3.2 Lyophilization process ......................................................................................................... 20
3.3 Technology transfer from line 1 to line 9 ............................................................................. 21
4 Submission of new lyophilized product A ................................................................................ 27
4.1 Product submission and approval for US market ................................................................ 27
4.2 Product and process specifications ..................................................................................... 28
4.3 Manufacturing process ........................................................................................................ 29
5 Product A launch and scale-up in line 1 ................................................................................... 31
5.1 Risk assessment and control............................................................................................... 31
5.2 Process validation activities and results in line 1 ................................................................ 33
5.3 Validated parameters for product A in line 1 ....................................................................... 38
xii
6 Process optimization: scale-up and transfer to line 9 ............................................................. 39
6.1 Process validation activities and results in line 9 ................................................................ 39
6.2 Validated parameters for product A in line 9 ....................................................................... 44
6.3 Deviations during validation batch ....................................................................................... 45
6.3.1 Investigation to OOS bioburden analysis ............................................................... 45
6.3.2 Investigation to OOS colour of solution .................................................................. 46
6.4 Corrective Actions and Preventive Actions (CAPA) ............................................................ 47
7 Conclusion ................................................................................................................................... 49
7.1 Contributions ....................................................................................................................... 49
7.2 Future work .......................................................................................................................... 50
References ........................................................................................................................................... 51
Annexes .................................................................................................................................................. A
Annex A – Risk management tool FMECA for process validation of product A .............................. A
Annex B – Sampling plan for process validation of scale-up of product A in line 1 ........................ C
Annex C – Sampling plan for process validation of product A transfer to line 9 ............................. E
xiii
LIST OF FIGURES
Figure 1. Process validation lifecycle approach. (CQAs – Critical Quality Attributes; CPPs – Critical
Process Parameters) ............................................................................................................................... 4
Figure 2. Overview of a typical quality risk management process. Adapted from [9]............................. 9
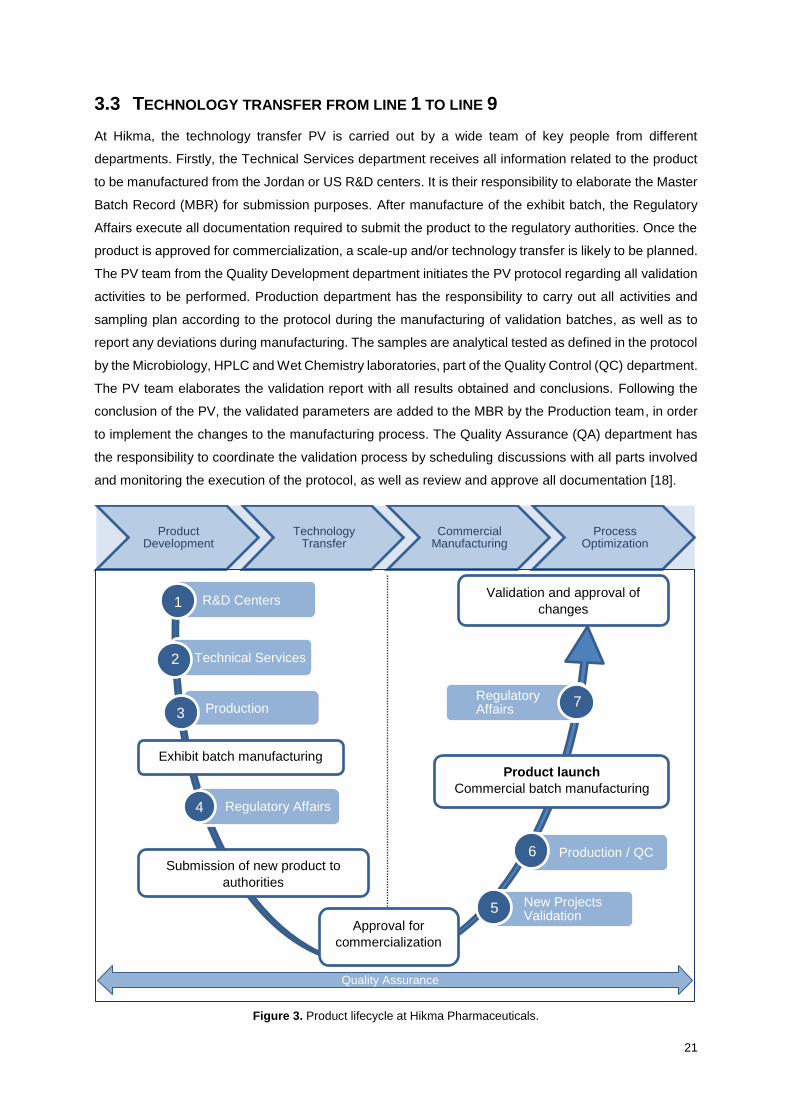
Figure 3. Product lifecycle at Hikma Pharmaceuticals. ........................................................................ 21
Figure 4. Product A lifecycle at Hikma Pharmaceuticals. ..................................................................... 27
Figure 5. Manufacturing process of product A...................................................................................... 30
Figure 6. Sampling plan for process validation of scale-up of product A on line 1................................. C
Figure 7. Sampling plan for process validation of product A transfer to line 9. ...................................... E

xiv
xv
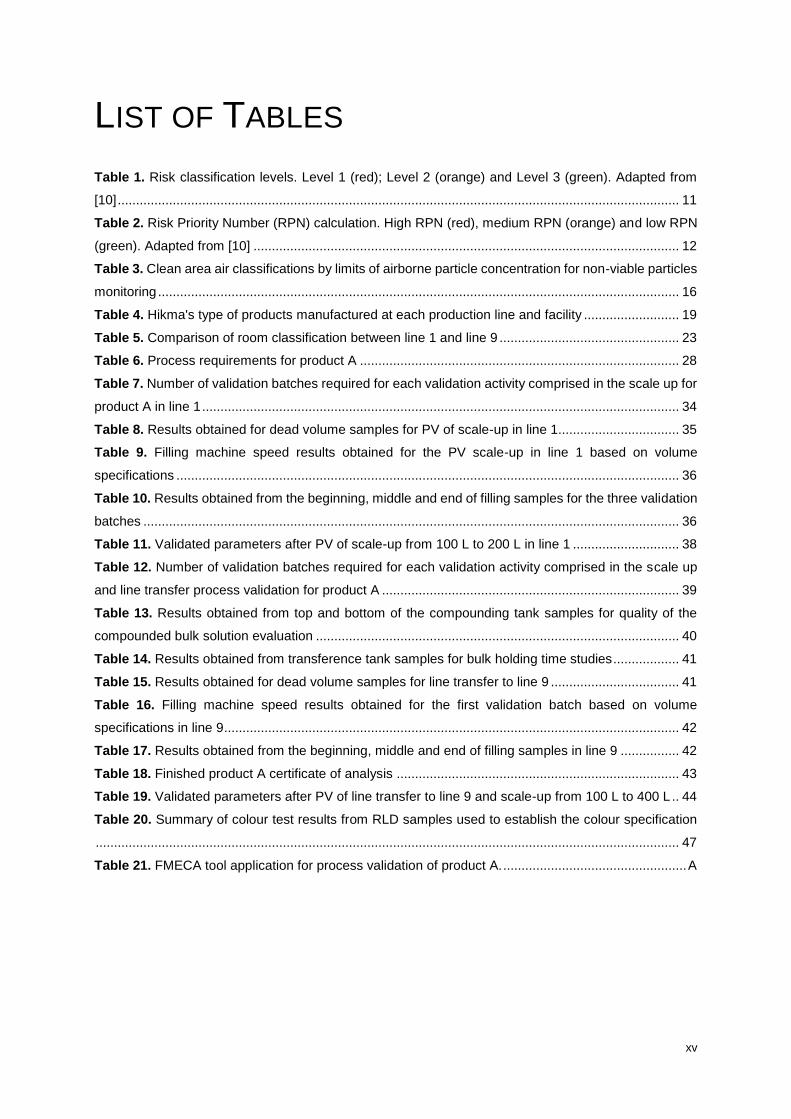
LIST OF TABLES
Table 1. Risk classification levels. Level 1 (red); Level 2 (orange) and Level 3 (green). Adapted from
[10] ......................................................................................................................................................... 11
Table 2. Risk Priority Number (RPN) calculation. High RPN (red), medium RPN (orange) and low RPN
(green). Adapted from [10] .................................................................................................................... 12
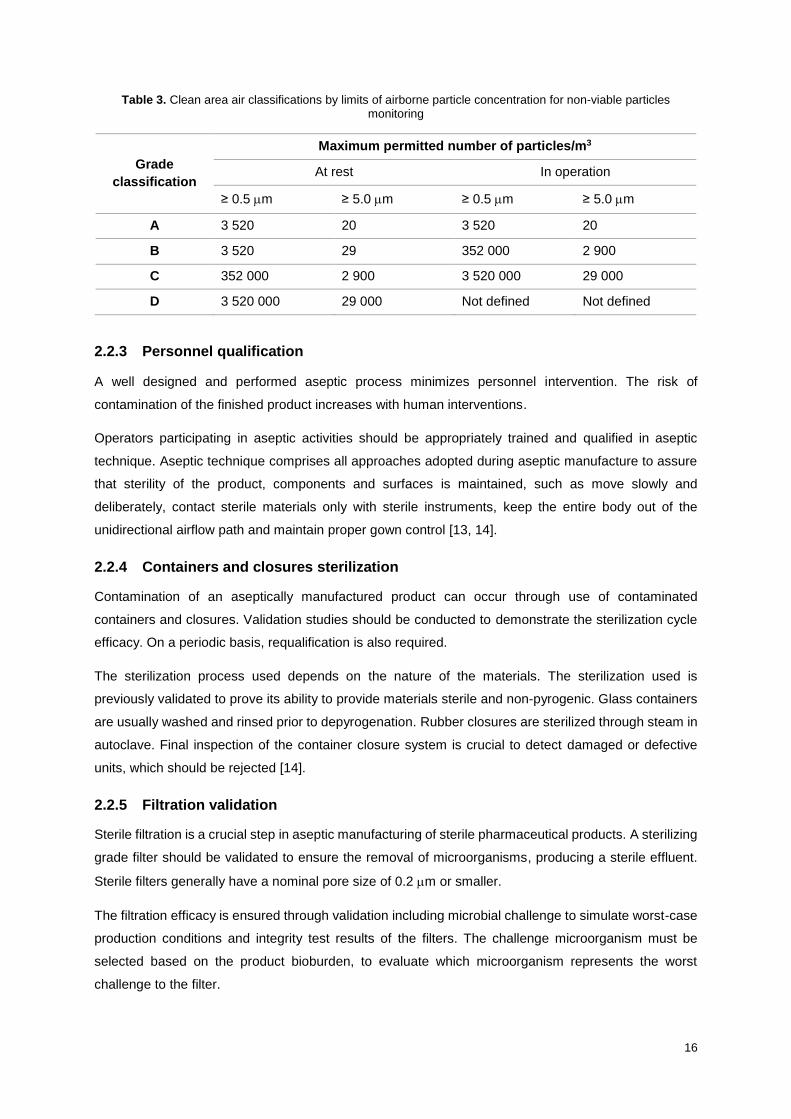
Table 3. Clean area air classifications by limits of airborne particle concentration for non-viable particles
monitoring .............................................................................................................................................. 16
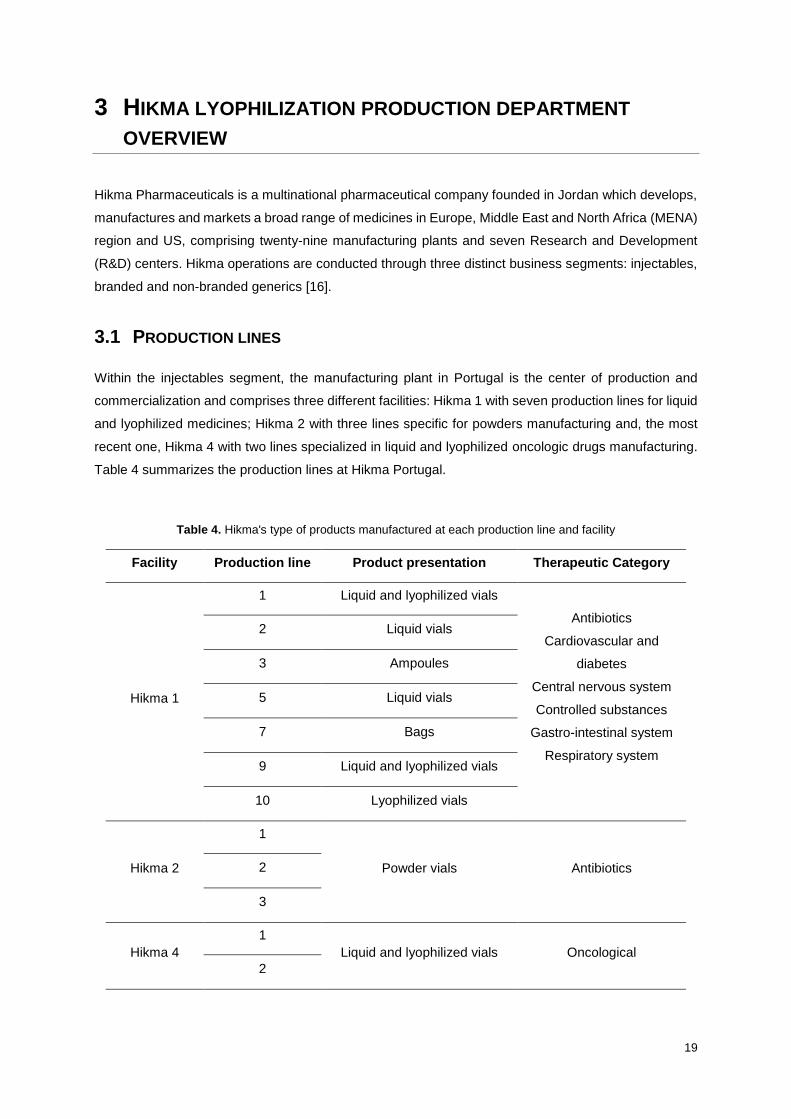
Table 4. Hikma's type of products manufactured at each production line and facility .......................... 19
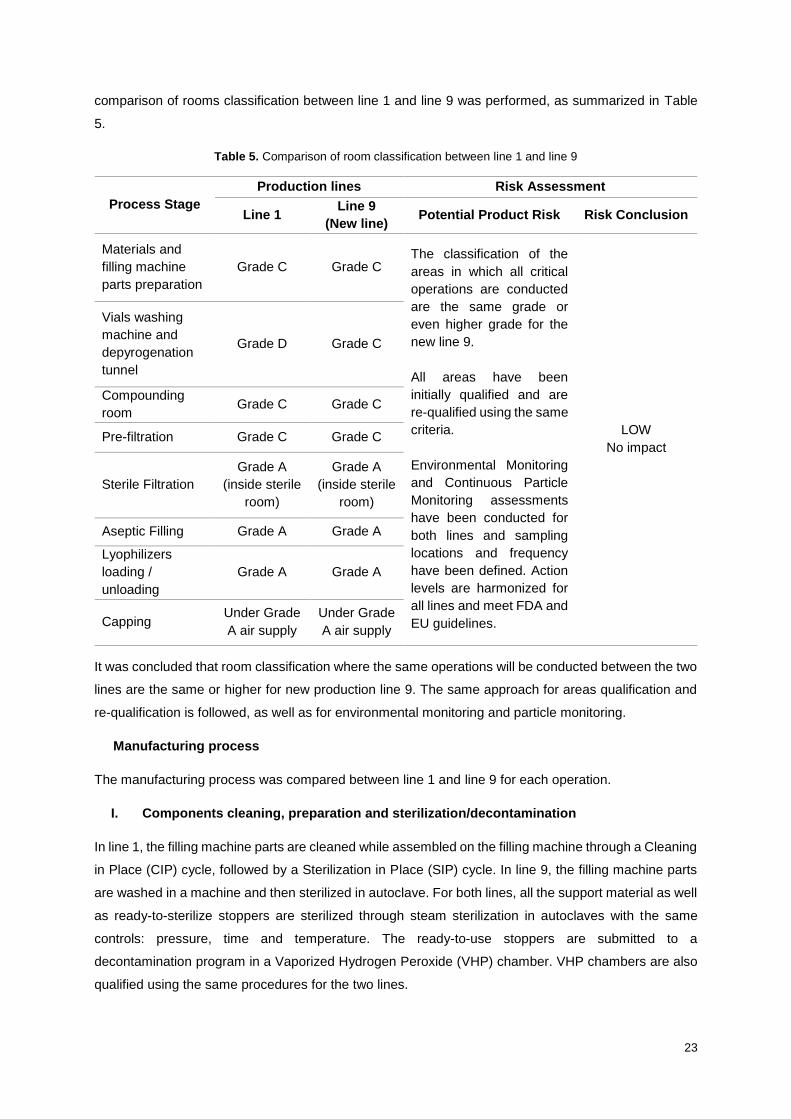
Table 5. Comparison of room classification between line 1 and line 9 ................................................. 23
Table 6. Process requirements for product A ....................................................................................... 28
Table 7. Number of validation batches required for each validation activity comprised in the scale up for
product A in line 1 .................................................................................................................................. 34
Table 8. Results obtained for dead volume samples for PV of scale-up in line 1................................. 35
Table 9. Filling machine speed results obtained for the PV scale-up in line 1 based on volume
specifications ......................................................................................................................................... 36
Table 10. Results obtained from the beginning, middle and end of filling samples for the three validation
batches .................................................................................................................................................. 36
Table 11. Validated parameters after PV of scale-up from 100 L to 200 L in line 1 ............................. 38
Table 12. Number of validation batches required for each validation activity comprised in the scale up
and line transfer process validation for product A ................................................................................. 39
Table 13. Results obtained from top and bottom of the compounding tank samples for quality of the
compounded bulk solution evaluation ................................................................................................... 40
Table 14. Results obtained from transference tank samples for bulk holding time studies .................. 41
Table 15. Results obtained for dead volume samples for line transfer to line 9 ................................... 41
Table 16. Filling machine speed results obtained for the first validation batch based on volume
specifications in line 9 ............................................................................................................................ 42
Table 17. Results obtained from the beginning, middle and end of filling samples in line 9 ................ 42
Table 18. Finished product A certificate of analysis ............................................................................. 43
Table 19. Validated parameters after PV of line transfer to line 9 and scale-up from 100 L to 400 L .. 44
Table 20. Summary of colour test results from RLD samples used to establish the colour specification
............................................................................................................................................................... 47
Table 21. FMECA tool application for process validation of product A. .................................................. A

xvi

xvii
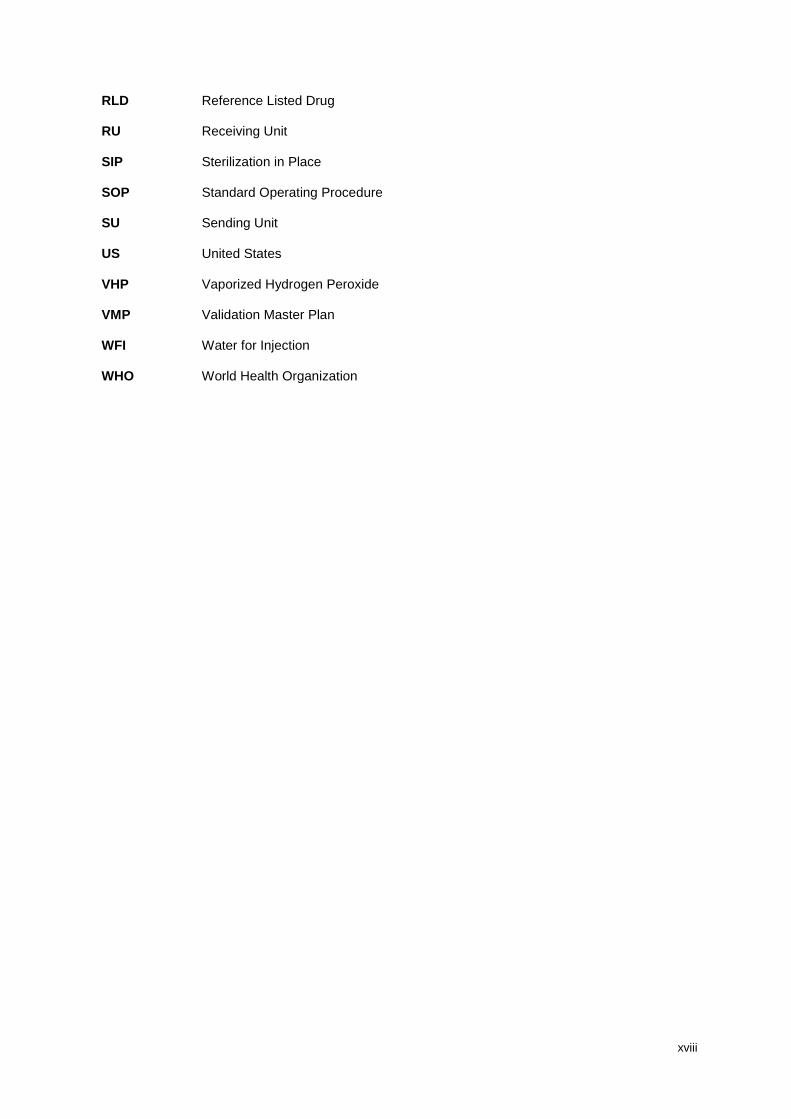
LIST OF ACRONYMS
ANDA API CAPA CGMP CIP CMA CPP CQA
Abbreviated New Drug Application Active Pharmaceutical Ingredient Corrective Action and Preventive Action Current Good Manufacturing Practices Cleaning in Place Critical Material Attribute Critical Process Parameter Critical Quality Attribute
DOE Design of Experiments FDA FMEA FMECA
Food and Drug Administration Failure Mode Effects Analysis Failure Mode, Effects and Criticality Analysis
ICH IPC MBR MENA NMT OOS PAT
International Conference on Harmonization In Process Control Master Batch Record Middle East and North Africa Not More Than Out of Specification Process Analytical Technology
PPQ PQ PT
Process Performance Qualification Process Qualification Portugal
PV QA QC QS RABS R&D
Process Validation Quality Assurance Quality Control Quantum Sufficit Restricted Access Barrier System Research and Development
xviii
RLD RU SIP SOP SU US VHP VMP WFI WHO
Reference Listed Drug Receiving Unit Sterilization in Place Standard Operating Procedure Sending Unit United States Vaporized Hydrogen Peroxide Validation Master Plan Water for Injection World Health Organization
1
1 INTRODUCTION
Process Validation (PV) provides assurance that a process is capable of effectively and consistently
delivering a product meeting its intended quality attributes. A planned process optimization, such as
technology transfer or scale-up of a product, implies a PV approach to guarantee the new process
performance and product quality.
The aim of this work is to contribute to the knowledge about manufacturing of lyophilized injectable
pharmaceutical products. Specifically, about PV regarding scale-up and technology transfer between
production lines at Hikma Pharmaceuticals manufacturing site in Portugal.
The first chapter of this thesis is a literature review focused on PV concepts and principles of aseptic
processing for the manufacture of sterile drug products, with the purpose of providing the required
background to understand the matters presented in the next chapters. The literature review is based on
guidelines and documentation from Food and Drug Administration (FDA), International Council for
Harmonization (ICHs) and World Health Organization (WHO).
The following chapter is an overview of the lyophilization production department at Hikma, including a
description of the lyophilization process, as well as the general principles of technology transfer between
production line 1 and line 9.
In the next chapter the product approached in this thesis is presented, along with its submission for
commercialization in United States (US) market, its manufacturing process and requirements. The two
following chapters focus on the PV for scale-up and line transfer of the product between production lines
1 and 9. The validation activities performed, together with the respective results of the manufactured
batches are presented. Investigations conducted to deviations detected during the manufacturing of
validation batches are described, as well as the Corrective Actions, Preventive Actions (CAPA) adopted.
As final chapter, conclusions and future work perspectives are presented.

2
3
2 LITERATURE REVIEW
2.1 PROCESS VALIDATION
2.1.1 Definition and concepts
Process validation is defined by FDA, European Commission and ICH as the collection and evaluation
of data throughout the product lifecycle that provides documented scientific evidence that a process is
capable of effectively and consistently delivering a product meeting its intended quality attributes.
Validation is usually preceded by qualification and both follow similar underlying principles. Quality must
be designed and built into the product through its lifecycle but cannot be properly assured by testing into
the product. Validation and qualification should be performed for new equipment and utilities, systems,
methods or processes or when changes are planned. Both should be executed in compliance with
regulatory requirements and quality risk management principles must be applied. Appropriate
personnel, financing and time resources are needed in order to plan and execute validation and
qualification activities [1, 2].
The lifecycle concept connects product and process development, validation of the commercial
manufacturing process and maintenance of the process in a state of control during routine commercial
production, which means that the defined set of controls consistently provides assurance of the process
performance and product quality [1, 3].
2.1.2 Validation approaches
Validation can be performed through four different approach types: prospective, concurrent,
retrospective and revalidation [4].
Prospective validation consists in establishing documented evidence of the process performance and
reproducibility prior to its implementation, based on pre-planned protocols. It is normally applied during
the development stage to validate the process before routine commercial manufacturing and is carried
based on a risk analysis of the process, which is separated into individual steps. These steps are
evaluated regarding experience to determine if they may lead to critical situations.
Concurrent validation is exceptional performed during routine production with the intent for
commercialization when data from replicate production is still not available. In this case, thorough
monitoring and testing of the produced batches is performed and if evidence is provided on the process
reproducibility, individual batches may be released prior to completion of the validation [2, 5].
Both prospective and concurrent validation are based on evidence obtained through testing. The testing
may include extensive sampling to demonstrate intra- and inter-batch homogeneity and worst-case tests
to determine the robustness of the process. Simulation process trials may be performed to validate, as
4
example, the aseptic filling of parenteral products such as lyophilized products that cannot be terminally
sterilized. [4, 6].
Retrospective validation is acceptable for well-established processes, since it relies on the analysis
of historical data. The results from in-process and final product testing are combined with available
historical data and treated statistically. The trend analysis performed enables to conclude on the extent
which the process parameters are within the acceptable range and will indicate whether the process is
under control or not.
Whenever possible, prospective validation is preferred. Retrospective validation is not encouraged and
is not applicable to the manufacturing of sterile products [4, 6].
Revalidation is a repeated validation of a previously validated process to ensure continued compliance
with the established requirements. This approach is adopted when there is the need to prove that
planned or unplanned changes in the process do not affect the process performance nor the product
quality. These changes may include changes to the product, the manufacturing process, the equipment
or technology transfers [2].
2.1.3 Process validation stages
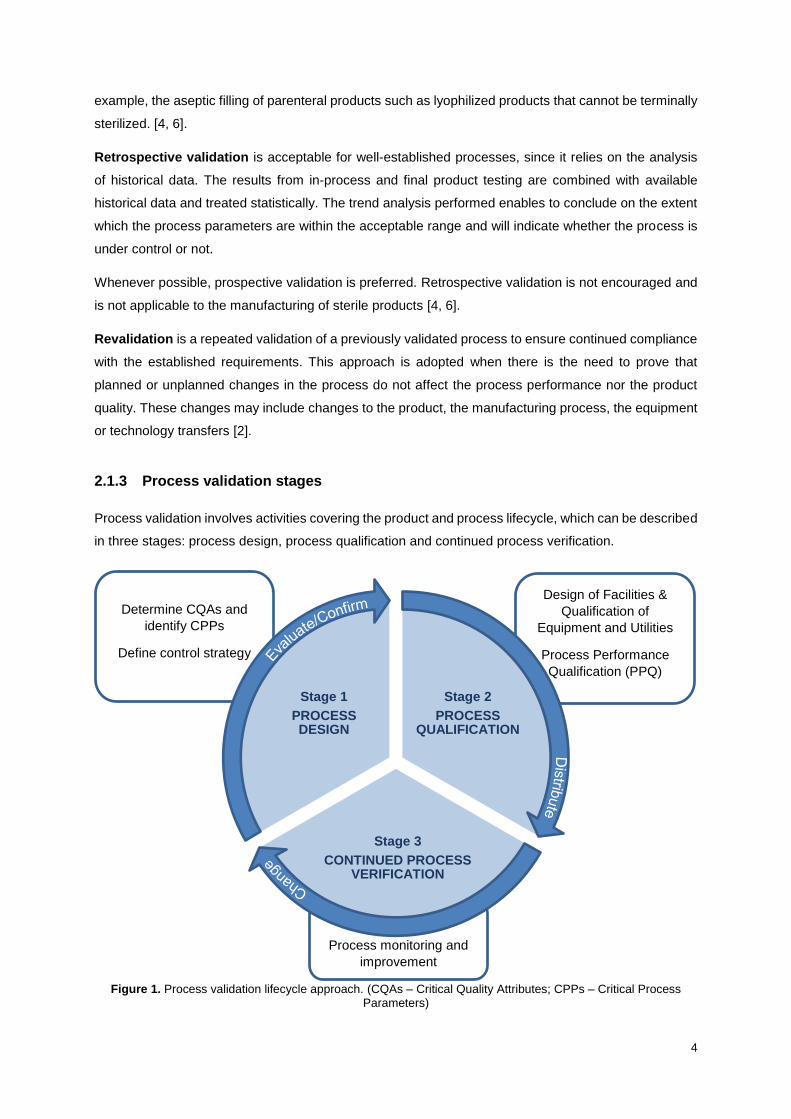
Process validation involves activities covering the product and process lifecycle, which can be described
in three stages: process design, process qualification and continued process verification.
Figure 1. Process validation lifecycle approach. (CQAs – Critical Quality Attributes; CPPs – Critical Process Parameters)
Process monitoring and
improvement
Design of Facilities &
Qualification of
Equipment and Utilities
Process Performance
Qualification (PPQ)
Determine CQAs and
identify CPPs
Define control strategy
Stage 2
PROCESS QUALIFICATION
Stage 3
CONTINUED PROCESS VERIFICATION
Stage 1
PROCESS DESIGN
5
I. Process design
The aim of process design is to define a manufacturing process suitable for routine commercial
manufacturing that consistently delivers a product meeting its quality attributes.
It is not obligatory to follow the current Good Manufacturing Practices (cGMP) requirements for the initial
process design experiments, although they must be conducted according to good documentation
practices and scientific methods and principles. The controls defined during this stage must be
adequately documented and justified, since documentation must reflect the basis for decisions made
about the process, considering its value for use and adaptation throughout the product lifecycle.
A crucial step in process design is to build and capture process knowledge and understanding.
Information provided from product development activities such as intended dosage form, quality
attributes and a manufacturing process overview represents key inputs to the process design stage. All
sources of variation such as functionality and limitations of equipment, different components batches,
production operators and measurement systems must be contemplated in the process design stage. All
information enhancing the process understanding must be documented, since it is useful for process
qualification and continued process verification stages.
An effective process control strategy is based on the process knowledge and understanding.
Manufacturers should understand the sources, the level and the impact of variation on the process and
product attributes to be able to control the variation in a proportional manner with the risk it represents
to the process and product. Design of Experiments (DOE) studies help building process knowledge by
revealing relationships between variable inputs – Critical Material Attributes (CMAs) and Critical Process
Parameters (CPPs) - and the resulting outputs – Critical Quality Attributes (CQAs). Risk assessment
can be performed to evaluate potential variables for DOE studies. The results of this type of studies
provide an explanation for establishing ranges of incoming component quality, equipment parameters
and in-process material quality attributes. Laboratory or pilot scale experiments and computer models
can also contribute to process knowledge enhancement.
Process control strategies may be designed to reduce input variation, adjust for input variation during
manufacturing or a combination of both. FDA expects controls to include examination of material quality
and equipment monitoring. It is necessary to have a special process control when the product attribute
is not readily measurable due to limitations of sampling or detectability or when intermediates and
products cannot be highly characterized and well-defined quality attributes cannot be identified. The
established controls are included in master production record.
The designed process at the end of this stage, including the operational limits and process control
strategy must be transferred to the next stage of process validation [1].
6
II. Process qualification
The goal of process qualification (PQ) stage is to evaluate and determine if the process design is capable
of reproducible commercial manufacture. This stage must be followed through current GMP procedures
and completed before commercial distribution. It involves two principles:
- Facility design and utilities and equipment qualification;
- Process Performance Qualification (PPQ).
The activities required to determine that utilities and equipment are suitable for their expected use and
perform properly must precede production at commercial scale. Qualification activities consist of
selection of construction materials, verification that utilities and equipment are installed in compliance
with the design specifications and operate according with process requirements in all anticipated
operating ranges, which must be shown capable of being held during routine production.
The qualification plan must contemplate the studies or tests to be completed, timing of qualification
activities, suitable criteria to evaluate outcomes, responsibilities of each department and procedures for
documentation and approval of qualification.
After the facility, utilities and equipment are qualified, it is necessary to confirm and demonstrate that
the commercial manufacturing process designed performs as intended through PPQ stage.
At PPQ stage, commercial-scale batches (denominated validation batches in Hikma) are manufactured
in order to provide data that supports the decision to start commercial distribution. The batches
manufactured at this stage require a higher level of sampling and testing than the one performed during
routine commercial production, in order to confirm the product quality uniformity throughout all
manufacturing steps. The goal is to obtain a sufficient level of process knowledge and to provide
adequate assurance that the commercial manufacturing process performs as expected.
Manufacturing conditions, controls, sampling and testing during this stage are specified in a written PPQ
protocol stating how activities will be conducted during the validation batches manufacturing. The
protocol must approach the qualification of utilities, equipment and personnel, the validation status of
analytical methods to be used, tests to be performed and acceptance criteria. The sampling plan
includes sampling points and frequency and the number of samples, which should be proper to provide
a high confidence level of intra-batch and inter-batch quality. The protocol is reviewed and approved by
the relevant departments and quality unit.
Deviations to the protocol are allowed when properly justified and approved by all relevant departments
and the quality unit before implementation. The validation batches must be manufactured under normal
operating conditions regarding utility systems, material, personnel and manufacturing conditions.
After realization of all validation activities established in the protocol, a PPQ report must be issued. This
report must include a summary and analysis of the data collected, evaluation of unexpected
observations or deviations to the protocol as well as a description of corrective actions to be
implemented to the existing procedures and controls. The knowledge gained from the design stage
7
through the process qualification stage must be compiled to state a clear conclusion if the process met
the established conditions and is in a state of control. If that is not verified, the report must include what
should be done before reaching that conclusion. Review and approval of the report by relevant
departments and quality unit is required [1].
Release of PPQ batches:
The manufacture of the initial validation batches should be successfully completed prior to commercial
distribution, except under special circumstances where concurrent release may be acceptable. These
circumstances include short shelf-life products and orphan drug products that are not frequently
manufactured. In such cases, product distribution may occur concurrently with the release.
Advanced control strategies such as Process Analytical Technology (PAT) that continuously monitor,
evaluate and adjust the manufacturing process using validated in-process measurements, tests,
controls, and process endpoints can provide a high level of quality assurance. Manufacturing processes
developed and controlled in such a manner may not require the manufacture of multiple validation
batches prior to initial distribution [1, 7].
III. Continued process verification
Continued process verification stage consists of providing ongoing assurance that the defined routine
commercial manufacturing process maintains the validated state. Assuming good development of the
process, identification of potential variation and an effective control strategy, the manufacturer must
maintain the process under control over the product lifetime. This stage comprises the routine
commercial manufacturing under similar conditions as demonstrated in process qualification stage.
Although a good process design implies anticipation and appropriate detection of sources of variability,
it is probable for a process to encounter sources of variation that were not previously detected or to
which the process was not exposed.
A continuous program to collect and analyse product and process data including relevant process trends
and quality of incoming materials or components, in-process material and finished products must be
established. The collected data should be statistically trended and reviewed to detect unplanned process
variability and conclude about necessary adjustments of monitoring levels and process improvement
changes.
Variation can also be detected through defect complaints, Out-of-specification (OOS) findings, process
yield variations, adverse event reports or by provided feedback on process performance from production
line operators and quality unit.
Maintenance of the facility, equipment and utilities is just as important to ensure the remaining state of
process control [1].
8
2.1.4 Regulatory requirements for process validation
Process validation of manufacturing processes for finished pharmaceuticals and components is a legal
requirement by the current cGMP regulations. It requires manufacturing processes to be designed and
controlled to assure that in-process materials and the finished product consistently and reliably meet
predetermined quality attributes [1, 7].
Procedures for process control must be defined to provide assurance that the product has the identity,
strength, quality and purity it is intended to. These procedures must be reviewed and approved by the
quality unit and should include the following elements:
- The batch must be formulated with the purpose to provide not less than 100 percent of the
labelled amount of active ingredient;
- Components shall be weighted, measured or subdivided as appropriate and the containers must
be properly identified;
- Weighing, measuring or subdividing operations must be supervised;
- Each component must be added to the batch by one person and verified by a second person.
The cGMP regulations for sampling require that samples must be representative of the batch under
analysis, the sampling plan must result in statistical confidence and the batch must meet its
predetermined specifications.
When establishing in-process specifications, these must be consistent with finished product
specifications and shall be derived from previous acceptable process average and process variability
estimates. These requirements determine the need for manufacturers to control in-process material to
assure that the finished product will meet its quality attributes and to evaluate process performance and
control batch variability.
The cGMP regulations also require information and data regarding product quality and process
knowledge to be periodically reviewed to determine if any changes to the established process are
assured.
Facilities and equipment proper design, construction and location are also a cGMP regulatory
requirement, in order to facilitate proper operations within the manufacturing process [1, 8].
2.1.5 Connection of Process Validation, Pharmaceutical Quality System and Quality
Risk Management
The Pharmaceutical Quality System (PQS) consists of a management system to direct and control a
pharmaceutical company regarding quality. Process validation within PQS is defined as assurance
based on evidence that a process consistently produces a product meeting its predetermined
specifications.
9
Implementation of an effective PQS over the product lifecycle (pharmaceutical development, technology
transfer, commercial manufacturing and product discontinuation) should result in a well-established and
maintained state of control and should facilitate innovation and continual improvement.
An essential element of the PQS is the CAPA system. Following investigations of complaints, product
rejections, non-conformances, deviations, audits, regulatory inspections or trends from process
performance, is inherent the application of a CAPA approach. This methodology should result in product
and process improvements and an enhanced product and process knowledge.
Quality Risk Management (QRM) and knowledge management are enablers to an effective
implementation of PQS. Knowledge management consists of a systematic approach to acquire, analyse,
store and disseminate information related to product, manufacturing process and components [3].
QRM is integral to an effective PQS. It can provide a proactive and systematic approach to assess,
control, review and communicate potential risks to quality and facilitate continual improvement of
process performance and product quality over the product lifecycle. QRM supplies reproducible
methods to assess the probability, severity and detectability of the risk [3, 9].
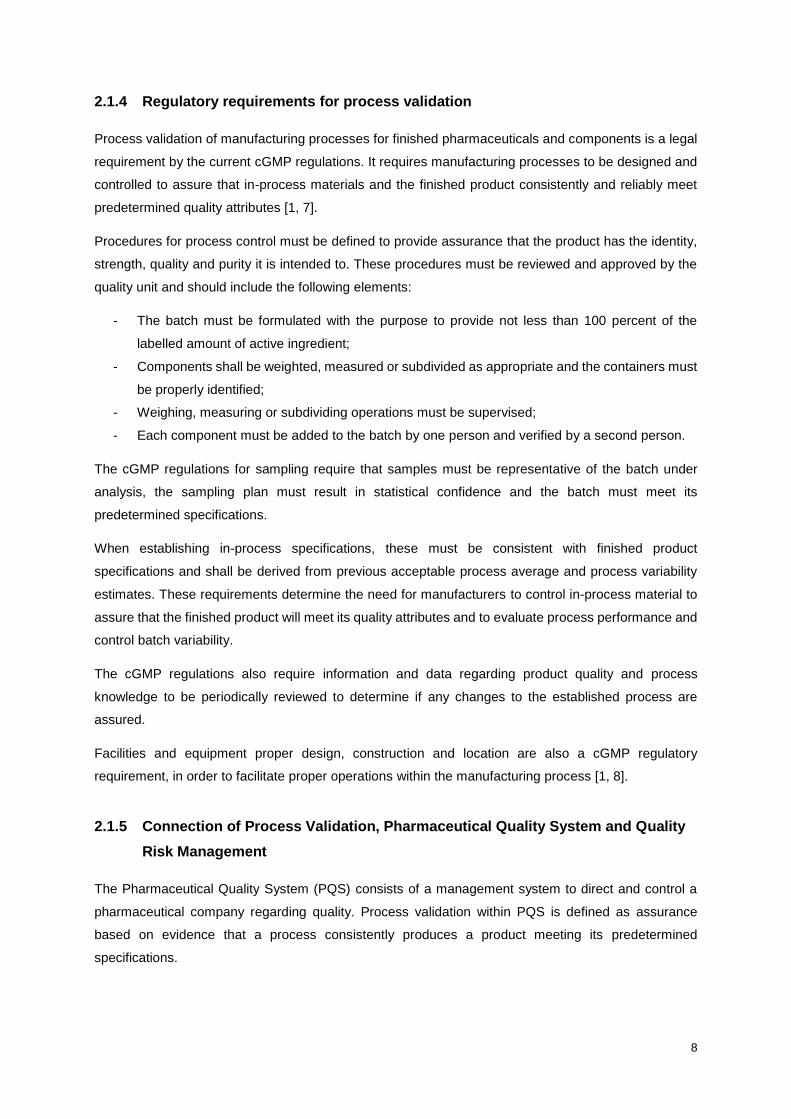
A risk is defined as the combination of the probability of occurrence of harm and the severity of that
harm. The evaluation of risk to quality should be based on scientific knowledge and ultimately linked to
the protection of the patient. The level of scrutiny and documentation of the QRM process should be
commensurate with the risk level. Figure 2 shows a model for QRM process presented in ICH Q9
guidance [9].
Figure 2. Overview of a typical quality risk management process. Adapted from [9].
10
RISK ASSESSMENT includes the identification of hazards and the analysis and evaluation of risks
associated with exposure to those hazards. It begins with a well-defined problem description that allows
to identify the most appropriate risk management tool and to answer the questions “What might go
wrong?”, “What is the likelihood it will go wrong?” and “What are the consequences (severity)?”.
I. Risk identification answers the first question of risk assessment. The hazards are identified
through a systematic use of information including historical data, theoretical analysis, informed
opinions and concerns of stakeholders.
II. Risk analysis is the estimation of the risk associated with the identified hazards. A risk
management tool is applied in order to qualitatively or quantitatively link the likelihood of
occurrence with the severity of harms. For each risk, the probability, severity and detectability
should be identified.
Frequency of probability may be rated from 1 to 3 according to its likelihood:
- Level 1 (Low): the frequency of the event occurring is perceived to be once per ten
thousand transactions;
- Level 2 (Medium): the frequency of the event occurring is perceived to be once per
thousand transactions;
- Level 3 (High): the frequency of the event occurring is perceived to be once per hundred
transactions.
Severity of the potential effect of the failure requires considering the impact of the event on the
product quality. The impact of the consequence may also be rated from 1 to 3:
- Level 1 (Low): expected to have a minor negative impact; the damage is not expected to
have a long-term detrimental effect;
- Level 2 (Medium): expected to have a moderate impact; the impact can be expected to
have a short to medium term detrimental effect;
- Level 3 (High): expected to have a very high significant negative impact; the impact could
be expected to have significant long-term effects and potentially catastrophic short-term
effects.
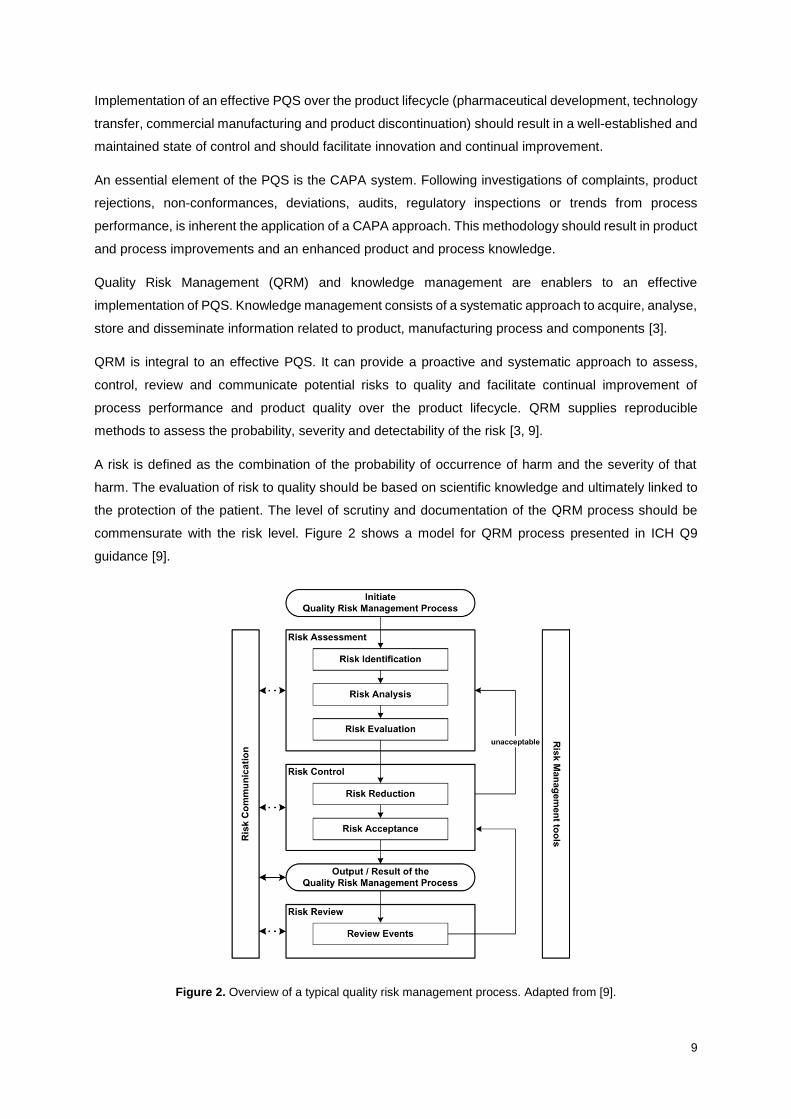
The risk is classified by multiplication of probability with severity. It is divided in three levels, as
shown in Table 1.
- Level 1 indicates that the probability of the failure occurs and the impact on product quality
are both high or medium;
- Level 2 indicates a moderate impact on product quality;
- Level 3 indicates that practically there is not impact on product quality.
11
Table 1. Risk classification levels. Level 1 (red); Level 2 (orange) and Level 3 (green). Adapted from [10]
Probability
Severity
1 (Low) 2 (Medium) 3 (High)
3 (High) 3 6 9
2 (Medium) 2 4 6
1 (Low) 1 2 3
The detectability aims to identify if the risk can be recognized or detected by other means in the
system. It is rated from 1 to 3 according to the risk detection possibilities:
- Level 1: a reliable detection device is continuously used on the system for direct parameter
measurement and leads to alarm activation or automatic system safe reconfiguration in
case of threshold overrunning (secured);
- Level 2: a reliable detection procedure is systematically applied however, it gives delayed
results. Another option is the use of an indirect measuring device, or a direct measuring
device in line with no alarm (insufficient secured);
- Level 3: no reliable detection device is used nor detection procedure as part of the system
operation or monitoring (not secured).
III. Risk evaluation consists of comparing the identified and analysed risk against the acceptable
risk level. In this step of risk assessment, the strength of evidence of the three questions is
considered [9, 10].
The output of a risk assessment is either a quantitative estimate of risk or a qualitative description of a
range of risk. When risk is expressed quantitatively, a numerical probability is used. Alternatively, risk
can be expressed using qualitative descriptors, such as “high”, “medium”, or “low”, which should be
defined in as much detail as possible. After risk assessment is concluded, the risk management process
continues to risk control and risk review.
RISK CONTROL implies decision making to reduce and/or accept risks. It aims to reduce the risk to an
acceptable level. The effort applied to risk control should be commensurate to the significance of the
risk.
I. Risk reduction addresses the mitigation or avoidance of risk when it exceeds an acceptable
level. Measures to mitigate the severity and likelihood of harm or to improve the detectability of
hazards may be applied.
II. Risk acceptance can be a formal decision to accept the residual risk or a passive decision in
which residual risks are not specified.
RISK REVIEW aims the need to run over the output of risk management process to consider new
obtained knowledge and experience which can lead to reconsideration of the determined risk
acceptance. The frequency of review should be proportional to the risk level.
12
RISK COMMUNICATION involves sharing the risk management output with all interested parts at any
stage of the risk management process. The communication is essential to facilitate trust and
understanding about the risks [9].
Risk assessment tools are useful to assess and manage risk. For the presented work in this thesis, the
Failure Mode, Effects and Criticality Analysis (FMECA) will be applied.
FMECA is an extension of the Failure Mode Effects Analysis (FMEA) risk assessment tool. FMEA
provides for an evaluation of potential failure modes for processes and their likely effects on the process
performance, based on product and process understanding. It methodically breaks down the analysis
of complex processes into manageable steps and enables the identification of potential failure modes,
their causes and likely effects. The application of FMEA tool implies the classification of each failure
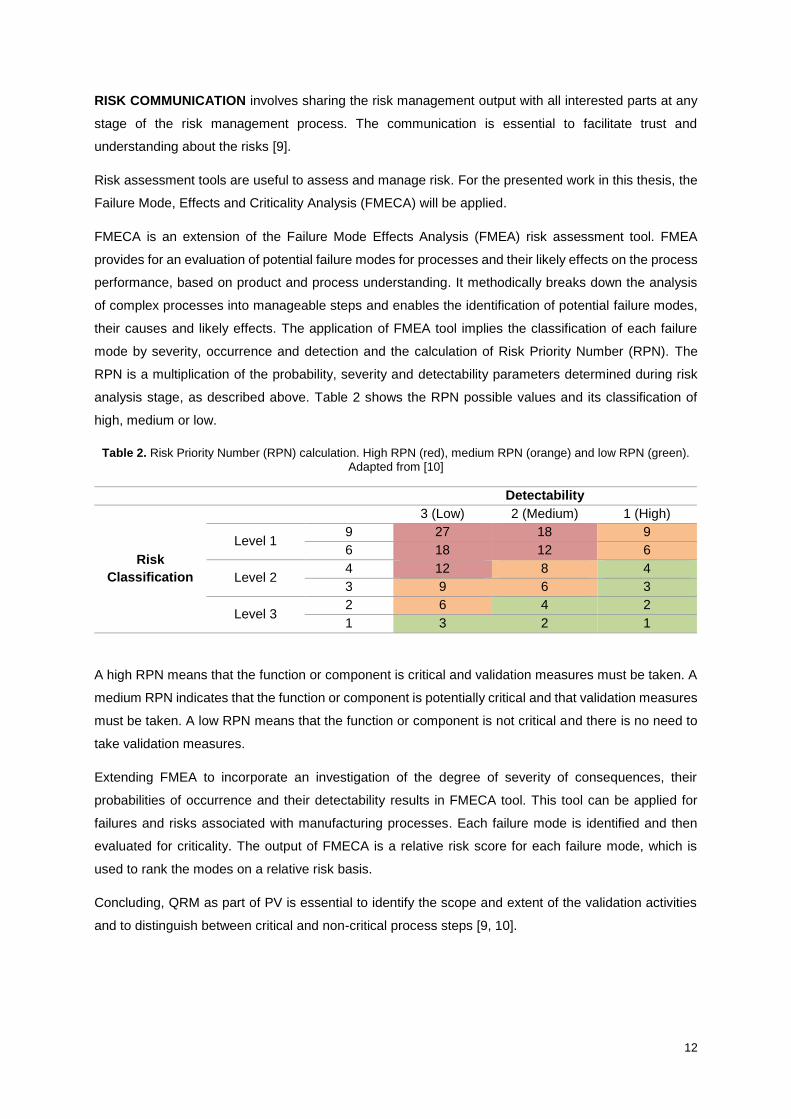
mode by severity, occurrence and detection and the calculation of Risk Priority Number (RPN). The
RPN is a multiplication of the probability, severity and detectability parameters determined during risk
analysis stage, as described above. Table 2 shows the RPN possible values and its classification of
high, medium or low.
Table 2. Risk Priority Number (RPN) calculation. High RPN (red), medium RPN (orange) and low RPN (green). Adapted from [10]
Detectability
Risk
Classification
3 (Low) 2 (Medium) 1 (High)
Level 1 9 27 18 9
6 18 12 6
Level 2 4 12 8 4
3 9 6 3
Level 3 2 6 4 2
1 3 2 1
A high RPN means that the function or component is critical and validation measures must be taken. A
medium RPN indicates that the function or component is potentially critical and that validation measures
must be taken. A low RPN means that the function or component is not critical and there is no need to
take validation measures.
Extending FMEA to incorporate an investigation of the degree of severity of consequences, their
probabilities of occurrence and their detectability results in FMECA tool. This tool can be applied for
failures and risks associated with manufacturing processes. Each failure mode is identified and then
evaluated for criticality. The output of FMECA is a relative risk score for each failure mode, which is
used to rank the modes on a relative risk basis.
Concluding, QRM as part of PV is essential to identify the scope and extent of the validation activities
and to distinguish between critical and non-critical process steps [9, 10].
13
2.1.6 Documentation
Validation and qualification must be performed in accordance with written procedures. Nevertheless,
documenting properly each performed validation and qualification activity is fundamental so that
knowledge gained about a product and process is accessible to others involved in each stage of the
lifecycle.
The type and extent of documentation required by cGMP varies according to the process validation
stage. Documentation requirements are more extensive during process qualification and continued
process verification stages.
When performing a PV program for the full-scale process, flow diagrams of the process describing each
unit operation, its placement in the overall process, monitoring and control points and sampling
requirements should be generated [1].
The documentation required may include the validation protocols and reports, standard operating
procedures (SOPs), specifications, risk assessment outcomes, training records, sampling plans, testing
plans and methods and the plan for ensuring review and maintenance of a validation state [2].
Validation Master Plan (VMP)
The VMP is a succinct and clear document that reflects the key elements of the validation program. It
should refer at least the validation policy and approach, responsibilities, resources, qualification of
utilities and equipment, the plan and schedule for validation activities and documents required.
The VMP should be reviewed periodically and updated according to cGMP [2].
Validation protocol
A document describing the activities to be performed during a validation process, including the
acceptance criteria for the approval of a process or system for intended use.
Validation report
A document in which the records, results and evaluation of validation are assembled and summarized.
It may also contain proposals for the improvement of the process. The validation report should reflect
the protocols and procedures followed and include a conclusion stating the outcome of PV. Any
deviations found during the PV should be managed and documented, as well as corrective actions
should be considered [2, 6].
2.1.7 Technology transfer as part of process validation
Technology transfer is defined as a logical procedure that controls the transfer of any process together
with its documentation and professional expertise between development and manufacture or between
manufacture sites. It occurs at some stage of the product lifecycle, from development, scale-up,
manufacturing and launch to the post-approval phase [11].
14
The aim of technology transfer activities is to transfer not only the product but also the process
knowledge. This knowledge is the basis for the manufacturing process, control strategy, process
validation approach and continual improvement [3].
As part of the product lifecyle, a technology transfer implies a PV approach. Revalidation is conducted
in case of transfer between production lines, scale-up or any other process changes. A technology
transfer process validation can be performed along with the product launch batches or afterwards. It is
common to have a technology transfer process validation associated to a scale-up process validation
[12].
Usually there is a sending unit (SU), a receiving unit (RU) and the unit managing the process, which
may or may not be a separate entity. Technology transfer requires a documented and planned approach
using trained personnel working within a quality system, and the demonstrated capability of the RU to
accomplish the critical elements of the transferred technology and fulfil all regulatory requirements.
To reach a successful technology transfer, the following requirements must be accomplished:
• The project plan should encompass the quality aspects of the project and be based upon the
principles of quality risk management;
• The capabilities of the SU and at the RU should be similar and facilities and equipment should
operate according to similar operating principles;
• A comprehensive technical gap analysis between the SU and RU including technical risk
assessment and potential regulatory gaps, should be performed as needed;
• Adequately trained personnel should be involved;
• Regulatory requirements in the countries of the SU and the RU, and in any countries where the
product is intended to be supplied, should be considered and interpreted consistently.
Technology transfer can be considered successful if there is documented evidence that the RU can
routinely reproduce the transferred product, process or method against a predefined set of specifications
as agreed with the SU.
Along with a technology transfer validation, a cleaning validation is also required in order to minimize
the risk of contamination of the product. An adequate cleaning strategy implies information on solubility
of Active Pharmaceutical Ingredient (API), excipients and vehicles; minimum therapeutic doses of API;
therapeutic category and toxicological assessment and already existing cleaning procedures.
A technology transfer summary report should be issued stating the documented evidence that the
process has been considered successful. The report should include the extent of the transfer, the critical
parameters and the conclusions [11].
15
2.2 STERILE DRUG PRODUCTS MANUFACTURING
2.2.1 Aseptic processing
The sterility of a drug product is defined as the complete absence of viable microorganisms. A sterile
drug product can be achieved using aseptic processing or terminal sterilization [13].
Aseptic processing implies the sterilization of components, containers and closures prior to filling of the
drug product. The glass containers are usually subjected to wash and rinse cycles, prior to dry heat
sterilization. The rubber closures can be sterilized by steam or irradiation methods and the bulk solution
is subjected to a sterilizing filtration. The product is filled and sealed in an extremely controlled high-
quality environment, since there is no sterilization of the product in its final container.
Terminal sterilization manufacture takes place under controlled environmental conditions to minimize
the microbial and particulate content of the in-process product and to guarantee success of the
subsequent sterilization. The product in its final container is subjected to a sterilization method as steam
or radiation [13,14].
Aseptic processing is more challenging than terminal sterilization. Therefore, the European
Pharmacopeia defines terminal sterilization as the method to be used whenever possible and the aseptic
processing as the last resort. However, certain critical processes such as lyophilization demand the use
of aseptic processing due to degradation of the product or loss of performance when exposed to heat
or radiation. All activities that may compromise the sterility of the product or material need to be
considered as extensions of aseptic processing. The lyophilization equipment and its processes should
be designed in a manner that ensures the maintenance of the product and materials sterility during filling
and until end of the lyophilization process. Loading and unloading of the lyophilizer should take place
under grade A environment and the lyophilizer should be sterilized before each load [15].
Sterility assurance in aseptic processing depends on the rooms, personnel, sterilization methods,
microbiological monitoring and validation of the aseptic filling process.
2.2.2 Room classification
Separated or defined areas of operation in an aseptic manufacturing facility should be appropriately
monitored to assure the appropriate airflow and pressure according to the operation conducted. Clean
areas should be supplied with filtered air and achieve a proper airflow from higher cleanliness areas to
adjacent less clean areas [14].
Each manufacturing operation requires an appropriate environmental cleanliness level in order to
minimize the risk of particulate or microbial contamination of the product. Four grades of clean room can
be distinguished. Grade A corresponds to high risk operations such as filling and aseptic connections.
Grade B is the background environment for the grade A zone. Grades C and D are clean areas where
less critical operations take place, such as materials preparation and capping [13, 15]. Table 3 presents
the clean room classifications for non-viable particles monitoring.
16
Table 3. Clean area air classifications by limits of airborne particle concentration for non-viable particles monitoring
Grade
classification
Maximum permitted number of particles/m3
At rest In operation
≥ 0.5 m ≥ 5.0 m ≥ 0.5 m ≥ 5.0 m
A 3 520 20 3 520 20
B 3 520 29 352 000 2 900
C 352 000 2 900 3 520 000 29 000
D 3 520 000 29 000 Not defined Not defined
2.2.3 Personnel qualification
A well designed and performed aseptic process minimizes personnel intervention. The risk of
contamination of the finished product increases with human interventions.
Operators participating in aseptic activities should be appropriately trained and qualified in aseptic
technique. Aseptic technique comprises all approaches adopted during aseptic manufacture to assure
that sterility of the product, components and surfaces is maintained, such as move slowly and
deliberately, contact sterile materials only with sterile instruments, keep the entire body out of the
unidirectional airflow path and maintain proper gown control [13, 14].
2.2.4 Containers and closures sterilization
Contamination of an aseptically manufactured product can occur through use of contaminated
containers and closures. Validation studies should be conducted to demonstrate the sterilization cycle
efficacy. On a periodic basis, requalification is also required.
The sterilization process used depends on the nature of the materials. The sterilization used is
previously validated to prove its ability to provide materials sterile and non-pyrogenic. Glass containers
are usually washed and rinsed prior to depyrogenation. Rubber closures are sterilized through steam in
autoclave. Final inspection of the container closure system is crucial to detect damaged or defective
units, which should be rejected [14].
2.2.5 Filtration validation
Sterile filtration is a crucial step in aseptic manufacturing of sterile pharmaceutical products. A sterilizing
grade filter should be validated to ensure the removal of microorganisms, producing a sterile effluent.
Sterile filters generally have a nominal pore size of 0.2 m or smaller.
The filtration efficacy is ensured through validation including microbial challenge to simulate worst-case
production conditions and integrity test results of the filters. The challenge microorganism must be
selected based on the product bioburden, to evaluate which microorganism represents the worst
challenge to the filter.
17
The bioburden of the unsterilized bulk solution must be determined to trend the characteristics of
potentially contaminating organisms. The process controls should minimize the bioburden of the
unfiltered product.
During routine production, identical filters to the ones validated must be used. The filters must be
discarded after manufacturing of a single batch and integrity test, such as bubble point, must be
performed before and after use. In the bubble point test, it is determined the pressure at which the
diffusive gas flows to the free flow via pores that are no longer wetted. The gas pressure is increased
continuously or in stages on the unsterile side and a check is made to see when the pressure decreases
disproportionately [13, 14].
2.2.6 Microbiological testing
Bioburden and endotoxins testing are crucial elements of an aseptic process. Endotoxin contamination
of an injectable product can be caused by poor cGMP controls and lead to pyrogenic reactions in certain
patient populations. These clinical concerns reinforce the need to implement adequate cGMP controls
during aseptic processing to prevent bioburden and generation of endotoxins.
Adequate cleaning, drying and storage of equipment controls bioburden and prevents contribution of
endotoxin load. The bioburden assay should be performed for each batch, considering working limits on
contamination immediately before sterilization, related to the efficiency of the method to be used [14].
The type of contamination allows to conclude about the contamination source. Therefore, an efficient
microbiological monitoring program must be established. The monitoring program should be defined as
a SOP and include description of sampling locations, sampling frequency and duration, alert and action
limits and measures to be taken when these limits are exceeded [13].
2.2.7 Validation of aseptic processing
To ensure the sterility of products, aseptic processing must be adequately validated. An aseptic process
should be validated through process simulations, also known as media fill, where a microbiological
growth medium is filled instead of the product.
A media fill program should include the contamination risk factors of routine production and evaluation
of the state of control. This is achieved by simulating the aseptic process that the product itself
undergoes. The containers filled with the microbiological medium are then incubated to detect microbial
contamination and assess the potential risk of a unit to become contaminated during routine operations.
It is recommended by FDA that the media fill program incorporates issues such as operators’ fatigue,
representative number and type of routine and non-routine interventions, lyophilization, aseptic
assembling, shift changes, line speed and container closure systems.
For initial qualification of a production line, individual media fills runs should be repeated to ensure
consistency of the results, since a single run is inconclusive of the state of process control. Routine
semi-annual qualification is required for each production line.
18
The duration of aseptic process is also qualified through media fill programs. It should be determined
based on the time required to incorporate manipulations and interventions. The simulation run size
should be representative of the commercial manufacturing process. An acceptable run size is in the
range between 5 000 and 10 000 units.
For lyophilization process, unsealed containers should be exposed to partial evacuation of the chamber,
simulating the process. However, the vials should not be frozen and the aerobic state of the medium
must be ensured.
A batch record should be prepared for each media fill run, documenting the production conditions and
simulations performed. The rationale behind the simulated activities during media fill should be clearly
defined [13, 14].
19
3 HIKMA LYOPHILIZATION PRODUCTION DEPARTMENT
OVERVIEW
Hikma Pharmaceuticals is a multinational pharmaceutical company founded in Jordan which develops,
manufactures and markets a broad range of medicines in Europe, Middle East and North Africa (MENA)
region and US, comprising twenty-nine manufacturing plants and seven Research and Development
(R&D) centers. Hikma operations are conducted through three distinct business segments: injectables,
branded and non-branded generics [16].
3.1 PRODUCTION LINES
Within the injectables segment, the manufacturing plant in Portugal is the center of production and
commercialization and comprises three different facilities: Hikma 1 with seven production lines for liquid
and lyophilized medicines; Hikma 2 with three lines specific for powders manufacturing and, the most
recent one, Hikma 4 with two lines specialized in liquid and lyophilized oncologic drugs manufacturing.
Table 4 summarizes the production lines at Hikma Portugal.
Table 4. Hikma's type of products manufactured at each production line and facility
Facility Production line Product presentation Therapeutic Category
Hikma 1
1 Liquid and lyophilized vials
Antibiotics
Cardiovascular and
diabetes
Central nervous system
Controlled substances
Gastro-intestinal system
Respiratory system
2 Liquid vials
3 Ampoules
5 Liquid vials
7 Bags
9 Liquid and lyophilized vials
10 Lyophilized vials
Hikma 2
1
Powder vials Antibiotics 2
3
Hikma 4
1
Liquid and lyophilized vials Oncological
2
20
3.2 LYOPHILIZATION PROCESS
Lyophilization or freeze-drying is a process that can be used to obtain dry products from aqueous
solutions or dispersions. It is mainly used to preserve the stability and increase shelf life of sensitive
substances such as hormones, antibiotics, enzymes, proteins and others.
The desired final product of a lyophilization process is a highly porous cake that promotes rapid and
complete reconstitution after addition of the solvent [13].
For a successful lyophilization process, the following requisites must be accomplished:
• Complete solidification of the solution/dispersion by freezing;
• Application of vacuum;
• Controlled supply of heat;
• Removal of water vapour.
The lyophilization process consists of three phases: freezing, primary drying and secondary drying. The
freezing phase is used to solidify the product before sublimation can occur. The product is frozen by the
controllable process of cooling the shelves of the lyophilizer and holding the product at that temperature.
The freezing conditions determine the size and shape of ice crystals formed, that affects drying
performance.
After completion of the freezing phase, vacuum is applied to start sublimation. The primary drying
(sublimation) phase is the longest one. The driving force for sublimation occurs is that the pressure
developed by the water molecules in the surrounding atmosphere (freeze-dryer chamber) is lower than
the vapour pressure at the sublimation interface in the product. The ice vapour pressure is directly
proportional to the temperature of the product. During this phase the temperature is increased, and the
pressure adjusted to the respective setpoints and then hold for the required duration.
At the end of primary drying, the temperature of the shelves is increased and, consequently, the
temperature of the product progressively rises. Along with a low enough pressure, the desorption
(secondary drying) phase begins. The goal of this phase is to remove remaining traces of moisture in
the product due to adsorption of water molecules in the dry structure. The shelves temperature is
increased to the highest possible temperature compatible with the product stability and the chamber
pressure is low [13, 17].
The complex technology that is inherent to the manufacturing of sterile lyophilized pharmaceutical
products implies rigorous regulatory requirements, since the absence of microbiological contamination
must be ensured. Activities such as an improvement of the lyophilization cycle and transfer and scale-
up of the process to a larger scale lyophilizer must be conducted under the scope of a well-established
process validation protocol.
21
3.3 TECHNOLOGY TRANSFER FROM LINE 1 TO LINE 9
At Hikma, the technology transfer PV is carried out by a wide team of key people from different
departments. Firstly, the Technical Services department receives all information related to the product
to be manufactured from the Jordan or US R&D centers. It is their responsibility to elaborate the Master
Batch Record (MBR) for submission purposes. After manufacture of the exhibit batch, the Regulatory
Affairs execute all documentation required to submit the product to the regulatory authorities. Once the
product is approved for commercialization, a scale-up and/or technology transfer is likely to be planned.
The PV team from the Quality Development department initiates the PV protocol regarding all validation
activities to be performed. Production department has the responsibility to carry out all activities and
sampling plan according to the protocol during the manufacturing of validation batches, as well as to
report any deviations during manufacturing. The samples are analytical tested as defined in the protocol
by the Microbiology, HPLC and Wet Chemistry laboratories, part of the Quality Control (QC) department.
The PV team elaborates the validation report with all results obtained and conclusions. Following the
conclusion of the PV, the validated parameters are added to the MBR by the Production team, in order
to implement the changes to the manufacturing process. The Quality Assurance (QA) department has
the responsibility to coordinate the validation process by scheduling discussions with all parts involved
and monitoring the execution of the protocol, as well as review and approve all documentation [18].
Figure 3. Product lifecycle at Hikma Pharmaceuticals.
Product Development
Technology Transfer
Commercial Manufacturing
Process Optimization
New Projects Validation
Production / QC
Regulatory Affairs
Approval for
commercialization
1
2
Validation and approval of
changes
5
6 Submission of new product to
authorities
7
Quality Assurance
R&D Centers
Technical Services
Regulatory Affairs
Exhibit batch manufacturing
3
4
Production
Product launch
Commercial batch manufacturing

22
Initially, Hikma plant had only line 1 for the manufacturing of lyophilized products. Based on the market
demand, lyophilization capacity had to be increased and therefore two new lines (lines 9 and 10) were
installed in 2017 for this purpose.
Each production line has two freeze-dryers and the two new lines have an improvement in the loading
and unloading system of freeze dryers, which is fully automatic, contrary to line 1 where this system is
semi-automatic. In order to optimize and rationalize production, some of the lyophilized products
manufactured in line 1 were transferred to lines 9 and 10.
Technology transfer of lyophilized products from line 1 to line 9 was evaluated by comparing the
equipment, the manufacturing areas grade classification, the manufacturing process and the quality
systems of the two lines. A risk assessment was performed to evaluate the impact on the validated
status of the products and the actions required for the transfer of products from line 1 to the new
production line [19, 20].
All products manufactured in line 1 have undergone a process validation where testing of the drug
components, container/closure preparation, compounding, filtration, filling, lyophilization, stoppering,
inspection, labeling, packaging and all critical process parameters (CPPs) have been evaluated and
validated. For each product to be transferred from line 1 to line 9, a new process validation protocol is
issued with the sampling requirements needed to complete the validation. The parameters considered
equivalent for the manufacturing are not required to be re-validated on a product basis. A process
validation report is issued for each product to summarize the results obtained in the new line and
confirming a robust and controlled process for manufacturing high quality lyophilized products.
Freeze-dryers comparison
The two freeze-dryers installed in the new line 9 were considered equivalent to the ones of line 1, except
for the automatic loading and unloading system. The condenser capacity of the freeze-dryers in line 9
is 800 kg, while in line 1 is 342 kg.
For the initial qualification of freeze-dryers a shelf mapping study is performed to verify the temperature
uniformity and distribution profile on the shelves of the freeze-dryer chamber. Five thermocouples are
assembled in each shelf to monitor the temperature inside the freeze-dryer chamber and evaluate the
disparity of each location in the same shelf and between shelves. The acceptance criteria of the study
is that the deviation between the maximum average temperature and the minimum average temperature
is less or equal to 2 ºC on each shelf and between all the shelves. For both freeze-dryers from line 1
and from line 9, the shelves temperature distribution inside the chamber was shown to be homogeneous
by shelf mapping studies. Therefore, the freeze-dryers were considered qualified.
Rooms classification
Classification within each line assures that the level of air quality and pressurization increases from the
least to the most critical area, in order to prevent an inward flow of potential contaminants. Components
preparation and air locks separate the sterile core from all other areas where non-sterile activities are
performed. All critical operations are conducted in classified areas. A risk assessment for the
23
comparison of rooms classification between line 1 and line 9 was performed, as summarized in Table
5.
Table 5. Comparison of room classification between line 1 and line 9
Process Stage
Production lines Risk Assessment
Line 1 Line 9
(New line) Potential Product Risk Risk Conclusion
Materials and
filling machine
parts preparation
Grade C Grade C The classification of the
areas in which all critical
operations are conducted
are the same grade or
even higher grade for the
new line 9.
All areas have been
initially qualified and are
re-qualified using the same
criteria.
Environmental Monitoring
and Continuous Particle
Monitoring assessments
have been conducted for
both lines and sampling
locations and frequency
have been defined. Action
levels are harmonized for
all lines and meet FDA and
EU guidelines.
LOW
No impact
Vials washing
machine and
depyrogenation
tunnel
Grade D Grade C
Compounding
room Grade C Grade C
Pre-filtration Grade C Grade C
Sterile Filtration
Grade A
(inside sterile
room)
Grade A
(inside sterile
room)
Aseptic Filling Grade A Grade A
Lyophilizers
loading /
unloading
Grade A Grade A
Capping Under Grade
A air supply
Under Grade
A air supply
It was concluded that room classification where the same operations will be conducted between the two
lines are the same or higher for new production line 9. The same approach for areas qualification and
re-qualification is followed, as well as for environmental monitoring and particle monitoring.
Manufacturing process
The manufacturing process was compared between line 1 and line 9 for each operation.
I. Components cleaning, preparation and sterilization/decontamination
In line 1, the filling machine parts are cleaned while assembled on the filling machine through a Cleaning
in Place (CIP) cycle, followed by a Sterilization in Place (SIP) cycle. In line 9, the filling machine parts
are washed in a machine and then sterilized in autoclave. For both lines, all the support material as well
as ready-to-sterilize stoppers are sterilized through steam sterilization in autoclaves with the same
controls: pressure, time and temperature. The ready-to-use stoppers are submitted to a
decontamination program in a Vaporized Hydrogen Peroxide (VHP) chamber. VHP chambers are also
qualified using the same procedures for the two lines.
24
The vials washing is done in line with depyrogenation. The washing machines use Water for Injection
(WFI) and then the vials are dried with compressed air and automatically transported to the
depyrogenation tunnel. The depyrogenation is conducted in laminar flow hot air tunnels according to
validated parameters for each vial size and consists on a pre-heating zone, a sterilizing zone and a
cooling zone. Both machines are equivalent in line 1 and line 9.
II. Compounding
The utilities available in compounding rooms are the same for each line: WFI, compressed air, nitrogen,
cold and hot water and pure steam. All utilities are qualified following the same procedures as per
guidelines. The portable tanks are shared between the two lines and each line has a 2000 L fixed tank.
All tanks follow the same cleaning procedures.
If the tanks already used in line 1 are to be used in line 9, it is ensured that all processes are equivalent
from compounding, holding times and sampling perspective. A technology transfer that implies changing
the compounding tank or a change on the compounding batch size requires specific validation activities,
which are further described in the respective validation protocol.
III. Filtration
For both lines, the filtration occurs from grade C to grade A through a filter using nitrogen pressure.
When applicable, pre-filtration may occur having a pre-filter installed in grade C. Filter validation studies
are performed for each product covering the filtration train to be used. Filtration is performed in line with
filling.
IV. Aseptic Filling
The filling machine in line 9 is from the same manufacturer and equivalent to the one in line 1. The surge
tank, the stoppers loading system, the filling needles and the type of tubes are the same for the two
lines. Both filling lines include Restricted Access Barrier Systems (RABS) to provide a controlled
environment with high level of protection to process materials through small openings and reduce
interventions into the critical filling zone.
In process control (IPC) is performed during filling for volume and particles. The rubber stoppers are
transported through a sterilized track and placed in the vials with a mechanical piston in the two lines.
The filling machine speed needs to be evaluated individually for each product to be transferred from line
1 to line 9.
V. Lyophilization
Automatic loading and unloading of the freeze-dryers for line 9 represents an improvement compared
to line 1 by reducing aseptic handling. The vials are stoppered inside the freeze-dryer by shelves
lowering. Although the freeze-dryers are equivalent, further activities for each product are required to
ensure that the transference of the lyophilization cycle does not have impact on the quality of the finished
product and to validate the process.

25
VI. Capping
The capping machines are different in each line, so validation activities are required.
VII. Inspection
Visual inspection is performed offline, in the same inspection areas and using the same equipment for
both lines.
Aseptic process simulation (Media Fill)
The two lines share the same media fill rational to validate the aseptic filling process. For initial
qualification a minimum of three media fill runs is performed per line. Routine media fill runs are
conducted every six months for each line.
All interventions, holding times and filling duration are qualified for each line. Routine and non-routine
interventions are included and need to be qualified per line. Some interventions are considered
equivalent from aseptic handling and therefore, operators qualified on these specific interventions in one
of the two lines are considered qualified to perform the same interventions in the other line.
As an overall conclusion, manufacturing lines 1 and 9 were considered to have a similar design and
process. The differences found along the evaluation show an improvement to the current design of line
1. The risk was found as low, thus no risk analysis through FMEA is required.
The activities identified as medium and high risk are performed for each product transfer from line 1 to
line 9, as follows:
- Transfer of the lyophilization cycle from the current freeze-dryers in line 1 to the new ones in line 9,
determining the cycle parameters per product. Process validation including results of inspection and
side-by-side comparison with batches manufactured in line 1 is required, as well as stability studies;
- Assessment of the current process parameters validated for the filtration train in line 1 in order to
determine if filter validation studies are required to enable the filling of the same products in line 9;
- Evaluation of the filling process covering the filling variables per line and product (dead volume,
filling machine speed, volume variation and line stoppages);
- Evaluation of the capping process;
- Evaluation of the compounding process in case of change of batch size or compounding tank.

26
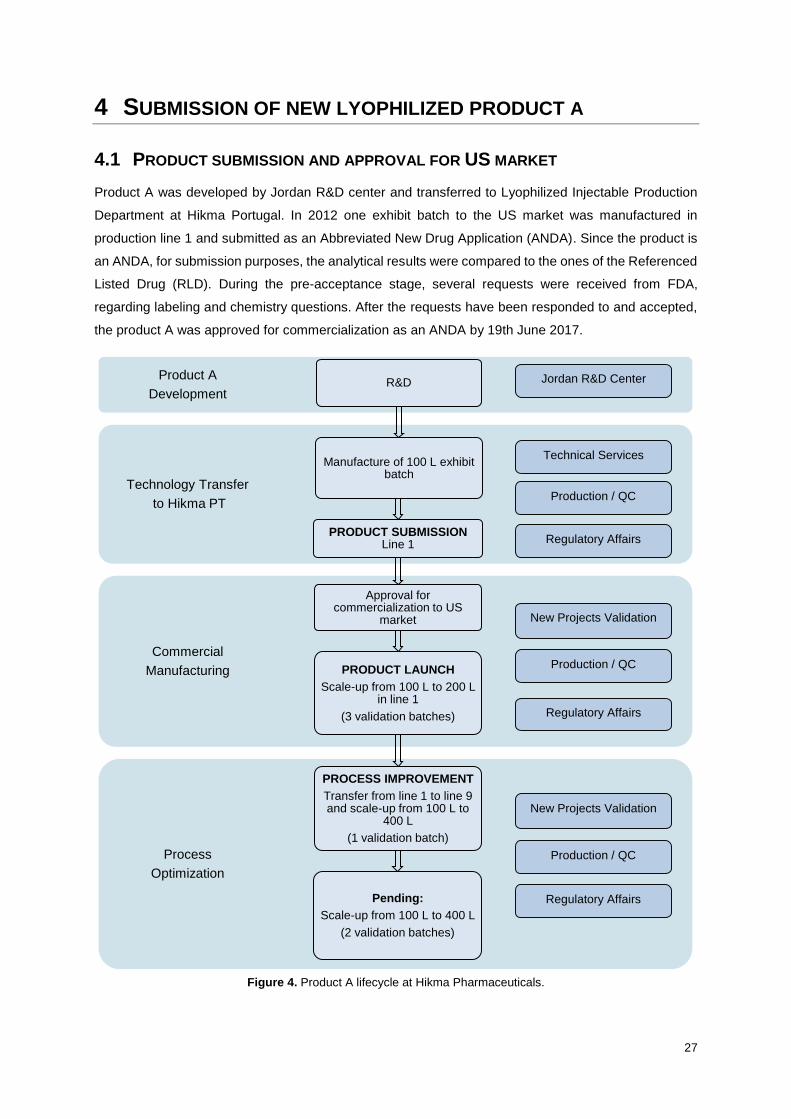
27
4 SUBMISSION OF NEW LYOPHILIZED PRODUCT A
4.1 PRODUCT SUBMISSION AND APPROVAL FOR US MARKET
Product A was developed by Jordan R&D center and transferred to Lyophilized Injectable Production
Department at Hikma Portugal. In 2012 one exhibit batch to the US market was manufactured in
production line 1 and submitted as an Abbreviated New Drug Application (ANDA). Since the product is
an ANDA, for submission purposes, the analytical results were compared to the ones of the Referenced
Listed Drug (RLD). During the pre-acceptance stage, several requests were received from FDA,
regarding labeling and chemistry questions. After the requests have been responded to and accepted,
the product A was approved for commercialization as an ANDA by 19th June 2017.
Figure 4. Product A lifecycle at Hikma Pharmaceuticals.
Process
Optimization
Commercial
Manufacturing
Technology Transfer
to Hikma PT
Product A
DevelopmentR&D
Manufacture of 100 L exhibit batch
PRODUCT SUBMISSION Line 1
Approval for commercialization to US
market
PRODUCT LAUNCH
Scale-up from 100 L to 200 L in line 1
(3 validation batches)
PROCESS IMPROVEMENT
Transfer from line 1 to line 9 and scale-up from 100 L to
400 L
(1 validation batch)
Pending:
Scale-up from 100 L to 400 L
(2 validation batches)
Technical Services
Regulatory Affairs
Jordan R&D Center
New Projects Validation
Production / QC
Regulatory Affairs
Production / QC
Regulatory Affairs
New Projects Validation
Production / QC
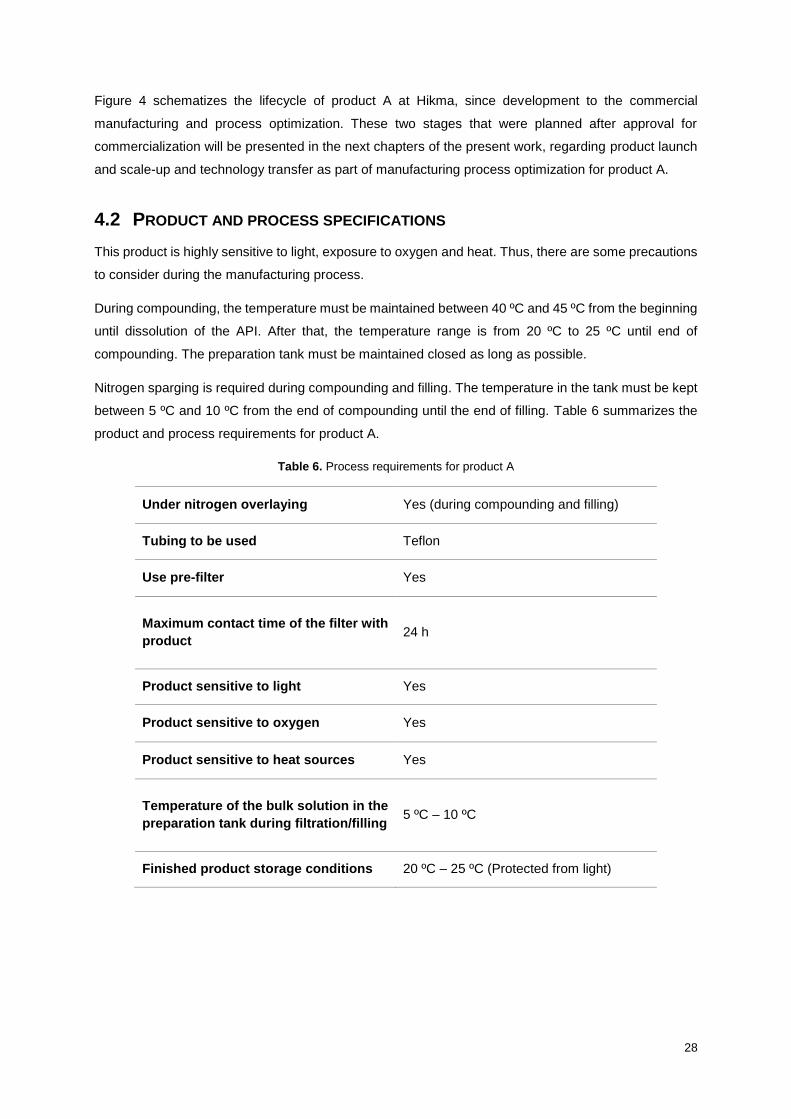
28
Figure 4 schematizes the lifecycle of product A at Hikma, since development to the commercial
manufacturing and process optimization. These two stages that were planned after approval for
commercialization will be presented in the next chapters of the present work, regarding product launch
and scale-up and technology transfer as part of manufacturing process optimization for product A.
4.2 PRODUCT AND PROCESS SPECIFICATIONS
This product is highly sensitive to light, exposure to oxygen and heat. Thus, there are some precautions
to consider during the manufacturing process.
During compounding, the temperature must be maintained between 40 ºC and 45 ºC from the beginning
until dissolution of the API. After that, the temperature range is from 20 ºC to 25 ºC until end of
compounding. The preparation tank must be maintained closed as long as possible.
Nitrogen sparging is required during compounding and filling. The temperature in the tank must be kept
between 5 ºC and 10 ºC from the end of compounding until the end of filling. Table 6 summarizes the
product and process requirements for product A.
Table 6. Process requirements for product A
Under nitrogen overlaying Yes (during compounding and filling)
Tubing to be used Teflon
Use pre-filter Yes
Maximum contact time of the filter with
product 24 h
Product sensitive to light Yes
Product sensitive to oxygen Yes
Product sensitive to heat sources Yes
Temperature of the bulk solution in the
preparation tank during filtration/filling 5 ºC – 10 ºC
Finished product storage conditions 20 ºC – 25 ºC (Protected from light)
29
4.3 MANUFACTURING PROCESS
The manufacturing process for product A includes preparation and sterilization of the filling machine
parts and components, compounding of the bulk solution, pre-filtration through a 0.45 m filter, filtration
through a sterilizing 0.22 m filter, filling into a 100 mL vial presentation, stoppering, lyophilization,
capping and visual inspection.
The container closure components for the manufacturing process of this product include 20 mm rubber
stoppers, 20 mm red aluminium flip-off and 100 mL vials.
In production line 1, the filling machine parts are transferred to the sterile area through a VHP chamber
and submitted to a bio decontamination program. In the sterile area, the machine parts are assembled
and then a CIP and SIP cycle is performed to the filling machine.
The stoppering system, the rubber stoppers and all the support material are sterilized through autoclave
from the grade C area to the grade A room. The vials are washed and sterilized through a washing
machine and a depyrogenation tunnel. The bulk solution is compounded in grade C and then filtered
directly from the compounding tank to the filling line. The pre-filter is assembled on the CIP/SIP panel
in grade C, while the filter is assembled in the grade A filling room.
Along with filling, the vials are partially stoppered and then nested in trays, which are previous sterilized
in the autoclave. The trays are manually loaded in the freeze-dryer. When the lyophilization cycle ends,
the vials are fully stoppered by the shelves lowering.
The trays are manually unloaded from the freeze-dryer and transported in stainless steel trolleys to the
capping room. After capping process is completed, the vials proceed to inspection and secondary
packaging.
The difference for the manufacturing process in line 9 is that the filling machine parts are sterilized in
autoclave prior to assembling and the pre-filter is assembled directly to the compounding tank in the
grade C area. The loading and unloading of the freeze-dryers is automatic [21, 22].
The manufacturing process is presented in Figure 5.
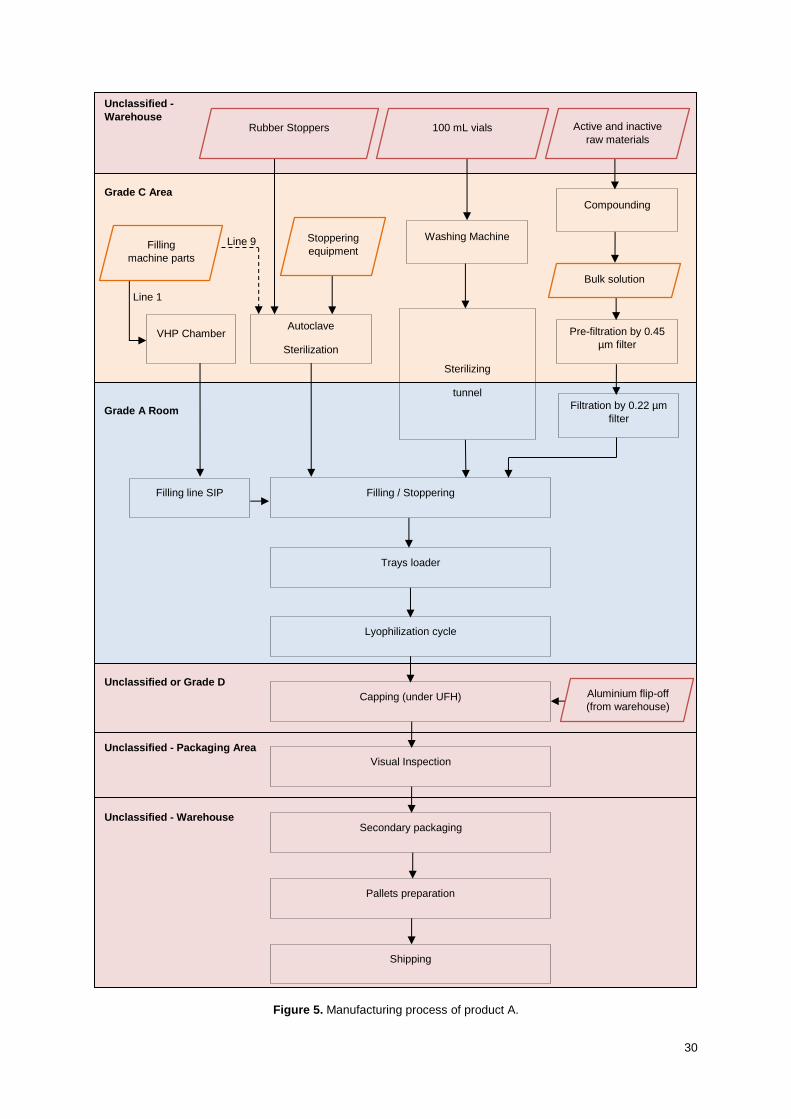
30
Figure 5. Manufacturing process of product A.
Compounding
Pre-filtration by 0.45
µm filter
Filtration by 0.22 µm
filter
Washing Machine
Sterilizing
tunnel
Filling / Stoppering
Autoclave
Sterilization
Trays loader
Lyophilization cycle
Capping (under UFH)
Visual Inspection
Secondary packaging
Pallets preparation
Shipping
Filling line SIP
VHP Chamber
Grade C Area
Grade A Room
Unclassified - Warehouse
Unclassified - Packaging Area
Unclassified -
Warehouse
Unclassified or Grade D
Rubber Stoppers 100 mL vials Active and inactive
raw materials
Stoppering
equipment Filling
machine parts
Bulk solution
Aluminium flip-off
(from warehouse)
Line 9
Line 1

31
5 PRODUCT A LAUNCH AND SCALE-UP IN LINE 1
The 100 L exhibit batch was manufactured in production line 1 in 2012. By the time of the product
approval for commercialization, it was planned a scale-up from 100 L to 200 L in line 1 along with the
product launch.
In order to validate the scale-up process, a PV protocol was elaborated. The protocol had the purpose
to define the activities and sampling requirements intended to validate the proposed change.
Three validation batches were manufactured. The number of proposed validation batches for a scale up
and line transfer can be defined based on the following rationale: product characteristics which might
impact the filtration and filling process; light, heat and oxygen sensitive; bulk strength/number of
presentations.
All activities required for qualification of facilities, equipment and systems to be used in the process were
previously made and approved. All validation batches were manufactured using qualified facilities,
equipment and systems and tested using validated analytical methods. The aseptic filling was validated
through media fill.
5.1 RISK ASSESSMENT AND CONTROL
The CPPs in the manufacture of the product A were evaluated and the parameters identified as potential
process failures were further evaluated based on risk management tool FMECA.
The parameters identified as potential process failures were dissolved oxygen, temperature along
compounding, API dissolution, pH measurement, final weight, bulk exposure to air, filtration, filling,
lyophilization and inspection. These parameters were evaluated based on the risk management tool
FMECA.
Severity and probability are classified in level 1 (low), level 2 (medium) and level 3 (high). Detection is
categorized in level 1 (high), level 2 (medium) and level 3 (low). A multiplication of these three
parameters results in RPN, which can be critical – 12, 18 and 27; medium – 6, 8 and 9 or low – 1, 2, 3
and 4.
For each CPP, a level of severity, probability and detection was established. After that, the RPN for each
CPP was calculated. Annex A – Risk Management Tool FMECA for process validation of product A –
summarizes the results.
It was concluded that the temperature along compounding, the API dissolution, the final weight, the bulk
exposure to air, the filtration, improper nitrogen headspace purging and an inadequate lyophilization
cycle design represent a medium risk for the process. Only a power failure during lyophilization was
determined to represent a high risk for the process.
32
Temperature along compounding:
Product A is highly sensitive to heat sources. If the temperature is not maintained in the defined ranges,
which can be caused by a chiller malfunction, the potential effect may be API degradation. To control
this risk, the compounding tanks have calibrated temperature sensors so an increase of temperature
will be immediately noticed.
API dissolution:
A human error on the calculations for API and excipients can lead to a not complete dissolution of the
API and, consequently, a non-homogeneous product. This will result in OOS results for the product
assay and batch failure. As a control, this step of the process is double verified.
Final weight:
Both human error or a balance mal function may cause low or high assay and result in batch failure. As
a risk control, the balance is calibrated and verified prior to each compounding and this step is also
double verified.
Bulk exposure to air:
Since the product is sensitive to oxygen, an uncontrolled exposure of the bulk solution to air can cause
API degradation. Therefore, nitrogen overlaying of the bulk solution during compounding and filling is
applied.
Filtration:
Incompatibility of the filter membrane with the product can cause low assay, high related substances or
particle formation. As control, filter validation studies were performed on the previously exhibit batch
manufactured in line 1 to assure compatibility with the filter and sterility of the bulk solution.
Improper nitrogen headspace purging:
An improper nitrogen purging during filling may cause product degradation. This risk is controlled by
nitrogen flushing during filling.
Inadequate lyophilization cycle:
If the lyophilization cycle design is not adequate, it may not dry the product properly, which compromises
the quality of the batch. Lyophilization cycle optimization is tested prior to production and samples are
collected for lyophilization uniformity and finished product testing.
Power failure during lyophilization:
A power failure during the lyophilization cycle may cause the cycle to go back to freezing phase, which
can affect the product characteristics and result in batch failure. To overcome this risk, the freeze-dryers
have alarms, specifically one alarm indicating that the cycle went back to freezing phase. In this case,
the lyophilization cycle can be forced to step forward after proper evaluation by the relevant key persons.
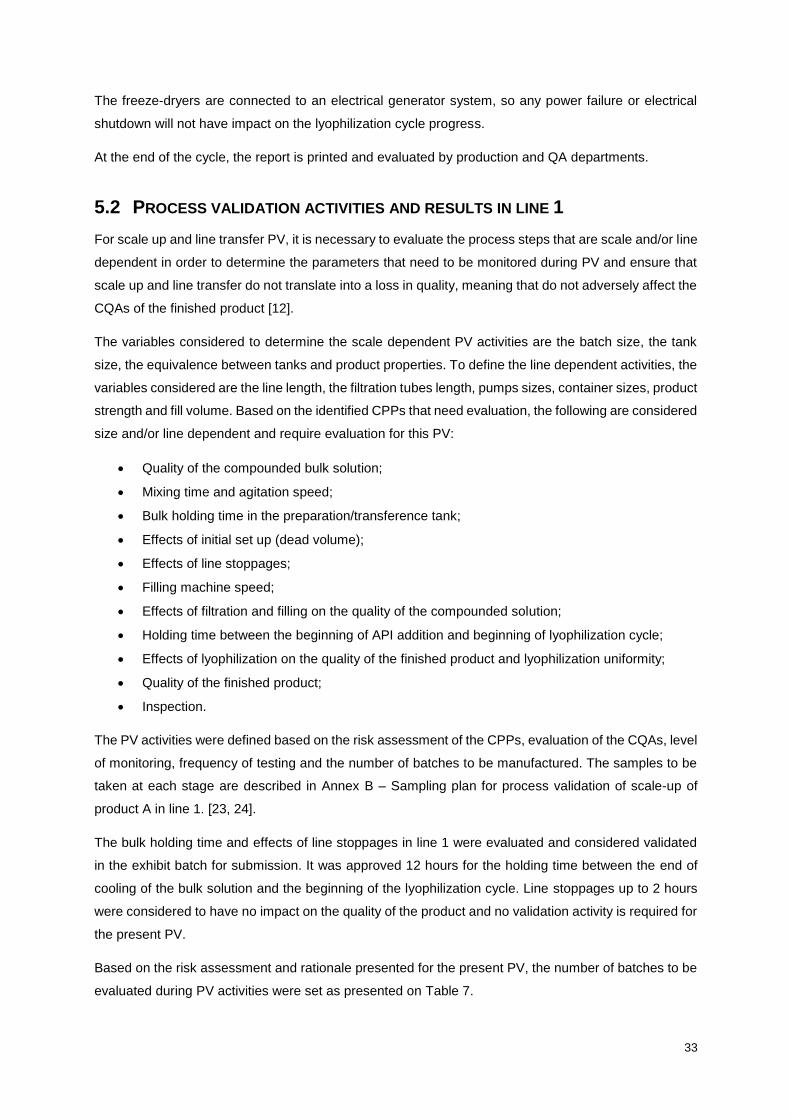
33
The freeze-dryers are connected to an electrical generator system, so any power failure or electrical
shutdown will not have impact on the lyophilization cycle progress.
At the end of the cycle, the report is printed and evaluated by production and QA departments.
5.2 PROCESS VALIDATION ACTIVITIES AND RESULTS IN LINE 1
For scale up and line transfer PV, it is necessary to evaluate the process steps that are scale and/or line
dependent in order to determine the parameters that need to be monitored during PV and ensure that
scale up and line transfer do not translate into a loss in quality, meaning that do not adversely affect the
CQAs of the finished product [12].
The variables considered to determine the scale dependent PV activities are the batch size, the tank
size, the equivalence between tanks and product properties. To define the line dependent activities, the
variables considered are the line length, the filtration tubes length, pumps sizes, container sizes, product
strength and fill volume. Based on the identified CPPs that need evaluation, the following are considered
size and/or line dependent and require evaluation for this PV:
• Quality of the compounded bulk solution;
• Mixing time and agitation speed;
• Bulk holding time in the preparation/transference tank;
• Effects of initial set up (dead volume);
• Effects of line stoppages;
• Filling machine speed;
• Effects of filtration and filling on the quality of the compounded solution;
• Holding time between the beginning of API addition and beginning of lyophilization cycle;
• Effects of lyophilization on the quality of the finished product and lyophilization uniformity;
• Quality of the finished product;
• Inspection.
The PV activities were defined based on the risk assessment of the CPPs, evaluation of the CQAs, level
of monitoring, frequency of testing and the number of batches to be manufactured. The samples to be
taken at each stage are described in Annex B – Sampling plan for process validation of scale-up of
product A in line 1. [23, 24].
The bulk holding time and effects of line stoppages in line 1 were evaluated and considered validated
in the exhibit batch for submission. It was approved 12 hours for the holding time between the end of
cooling of the bulk solution and the beginning of the lyophilization cycle. Line stoppages up to 2 hours
were considered to have no impact on the quality of the product and no validation activity is required for
the present PV.
Based on the risk assessment and rationale presented for the present PV, the number of batches to be
evaluated during PV activities were set as presented on Table 7.

34
Table 7. Number of validation batches required for each validation activity comprised in the scale up for product A in line 1
Process Validation Activities Number of validation batches
Evaluation of quality of the compounded bulk
solution 3
Evaluation of the effects of initial set up (dead
volume) 1
Evaluation of filling machine speed 1
Evaluation of the effects of filtration and filling
on the quality of the compounded solution 3
Evaluation of the effects of lyophilization on the
quality of the filled vials and lyophilization
uniformity
3
Evaluation of the quality of the finished product 3
Evaluation of the results of visual inspection of
the vials 3
Evaluation of quality of the compounded bulk solution
The dissolution should be complete, and the solution should be uniform. The compounding parameters
mixing and dissolution times were previously evaluated for the 100 L batch. However, the new batch
size to be validated is 200 L and the batch is compounded in a different tank, therefore a range of mixing
speeds and times were validated to assure that complete dissolution occurs under all approved
compounding conditions. The CPPs mixing time and speed were manipulated to their defined limits,
ensuring the physicochemical integrity of the product is challenged throughout the range of previously
established manufacturing conditions.
For the first validation batch, the defined mixing speed was 296 rpm during all compounding steps. For
second and third validation batches, the mixing speed was 317 rpm and 447 rpm, respectively. The
mixing time varied depending on the compounding step.
Samples from the top and bottom of the preparation tank were collected after the final mixing step has
been completed. The samples were analysed for description, pH, identification by HPLC, assay, related
substances, bacterial endotoxins and bioburden. All results were within the established specifications.
It was concluded that the compounding process parameters used for the manufacturing of product A
allow obtaining a product meeting the established specifications. The validated mixing speed was
between 296 rpm and 447 rpm.
Evaluation of the effects of initial set up (dead volume)
An initial quantity of filled units is typically discarded as part of initial line set up. The goal of this PV
activity is to establish the minimum amount of product that needs to be discarded prior to start filling.
The process validation batches have the same bulk formulation and strength and will be filled in the
same filling line as the exhibit batch. The dead volume was already evaluated and considered validated
in line 1 and it was concluded that a discarded volume of 1189 mL (29 vials) as part of initial line set up
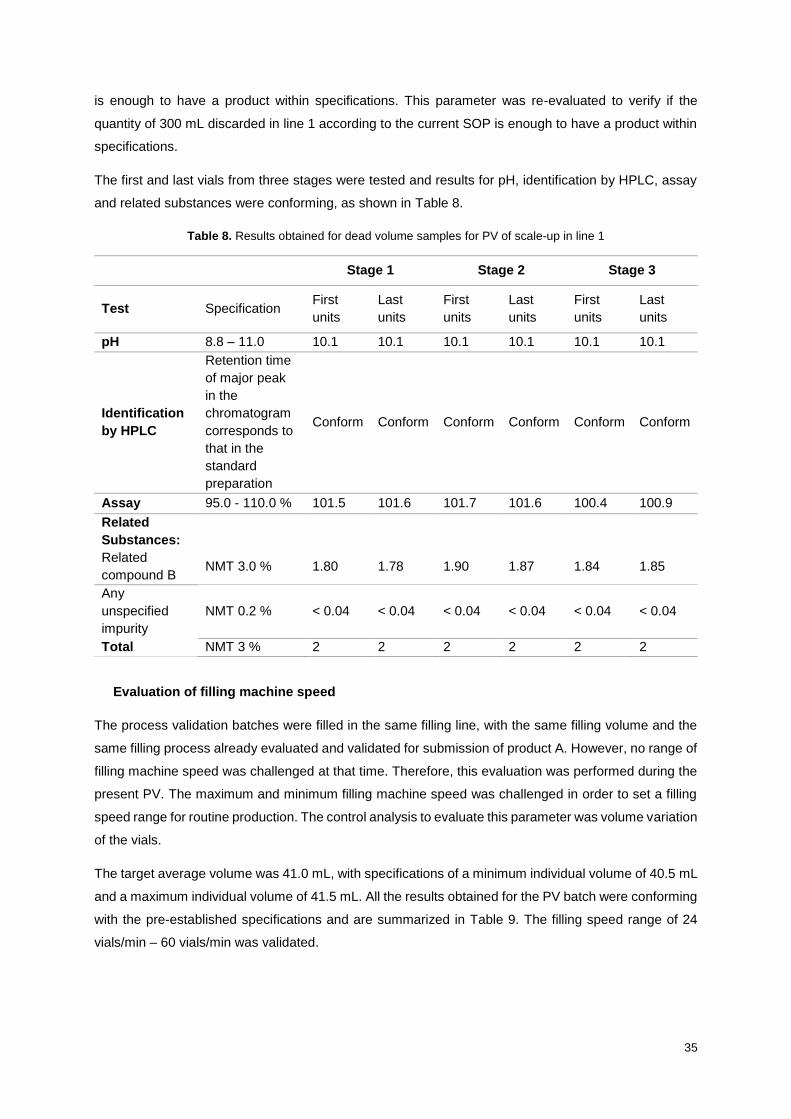
35
is enough to have a product within specifications. This parameter was re-evaluated to verify if the
quantity of 300 mL discarded in line 1 according to the current SOP is enough to have a product within
specifications.
The first and last vials from three stages were tested and results for pH, identification by HPLC, assay
and related substances were conforming, as shown in Table 8.
Table 8. Results obtained for dead volume samples for PV of scale-up in line 1
Stage 1 Stage 2 Stage 3
Test Specification First
units
Last
units
First
units
Last
units
First
units
Last
units
pH 8.8 – 11.0 10.1 10.1 10.1 10.1 10.1 10.1
Identification
by HPLC
Retention time
of major peak
in the
chromatogram
corresponds to
that in the
standard
preparation
Conform Conform Conform Conform Conform Conform
Assay 95.0 - 110.0 % 101.5 101.6 101.7 101.6 100.4 100.9
Related
Substances:
Related
compound B NMT 3.0 % 1.80 1.78 1.90 1.87 1.84 1.85
Any
unspecified
impurity
NMT 0.2 % < 0.04 < 0.04 < 0.04 < 0.04 < 0.04 < 0.04
Total NMT 3 % 2 2 2 2 2 2
Evaluation of filling machine speed
The process validation batches were filled in the same filling line, with the same filling volume and the
same filling process already evaluated and validated for submission of product A. However, no range of
filling machine speed was challenged at that time. Therefore, this evaluation was performed during the
present PV. The maximum and minimum filling machine speed was challenged in order to set a filling
speed range for routine production. The control analysis to evaluate this parameter was volume variation
of the vials.
The target average volume was 41.0 mL, with specifications of a minimum individual volume of 40.5 mL
and a maximum individual volume of 41.5 mL. All the results obtained for the PV batch were conforming
with the pre-established specifications and are summarized in Table 9. The filling speed range of 24
vials/min – 60 vials/min was validated.
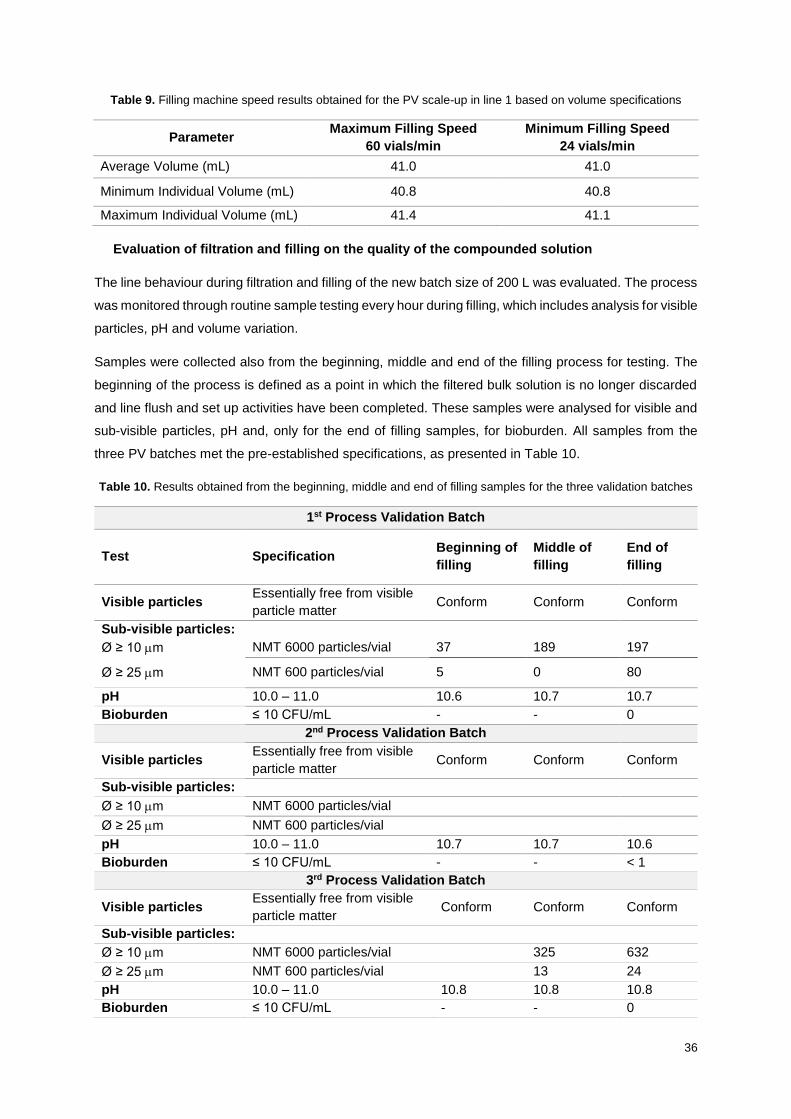
36
Table 9. Filling machine speed results obtained for the PV scale-up in line 1 based on volume specifications
Parameter Maximum Filling Speed
60 vials/min
Minimum Filling Speed
24 vials/min
Average Volume (mL) 41.0 41.0
Minimum Individual Volume (mL) 40.8 40.8
Maximum Individual Volume (mL) 41.4 41.1
Evaluation of filtration and filling on the quality of the compounded solution
The line behaviour during filtration and filling of the new batch size of 200 L was evaluated. The process
was monitored through routine sample testing every hour during filling, which includes analysis for visible
particles, pH and volume variation.
Samples were collected also from the beginning, middle and end of the filling process for testing. The
beginning of the process is defined as a point in which the filtered bulk solution is no longer discarded
and line flush and set up activities have been completed. These samples were analysed for visible and
sub-visible particles, pH and, only for the end of filling samples, for bioburden. All samples from the
three PV batches met the pre-established specifications, as presented in Table 10.
Table 10. Results obtained from the beginning, middle and end of filling samples for the three validation batches
1st Process Validation Batch
Test Specification Beginning of
filling
Middle of
filling
End of
filling
Visible particles Essentially free from visible
particle matter Conform Conform Conform
Sub-visible particles:
Ø ≥ 10 m NMT 6000 particles/vial 37 189 197
Ø ≥ 25 m NMT 600 particles/vial 5 0 80
pH 10.0 – 11.0 10.6 10.7 10.7
Bioburden ≤ 10 CFU/mL - - 0
2nd Process Validation Batch
Visible particles Essentially free from visible
particle matter Conform Conform Conform
Sub-visible particles:
Ø ≥ 10 m NMT 6000 particles/vial
Ø ≥ 25 m NMT 600 particles/vial
pH 10.0 – 11.0 10.7 10.7 10.6
Bioburden ≤ 10 CFU/mL - - < 1
3rd Process Validation Batch
Visible particles Essentially free from visible
particle matter Conform Conform Conform
Sub-visible particles:
Ø ≥ 10 m NMT 6000 particles/vial 325 632
Ø ≥ 25 m NMT 600 particles/vial 13 24
pH 10.0 – 11.0 10.8 10.8 10.8
Bioburden ≤ 10 CFU/mL - - 0
37
Evaluation of lyophilization on the quality of the filled vials and lyophilization uniformity
The selected lyophilizer can be considered a worst case from a loading distance perspective.
Lyophilized vials were collected and analysed to evaluate the effects of the lyophilization cycle on the
quality of the filled vials as well as lyophilization uniformity.
Eight samples of lyophilized vials were collected from five different positions for the first, middle and last
shelf of the lyophilizer, making a total of 120 samples. The samples were tested for appearance of the
cake with specification of an orange to yellowish lyophilized powder in 100 mL vial, reconstitution time
(NMT 90 seconds) and water content (NMT 3.0 %). All the results were conforming with the
specifications and aligned between them, which indicates that there is uniformity within lyophilizer.
Evaluation of the quality of the finished product
Results from the three validation batches were evaluated to ensure the product quality as per pre-
defined specifications for finished product. Capped vials were taken from the beginning, middle and end
of the validation batch for physicochemical and microbiological testing as per finished product criteria.
All results were within specifications.
Evaluation of the results of visual inspection of the vials
To ensure repeatability of the data gathered after inspection, random lyophilized vials from the three
validation batches were submitted to visual inspection for defects and particles in a semi-automatic
machine. From a total of 9701 inspected vials within the three batches, 208 vials were found with defects.
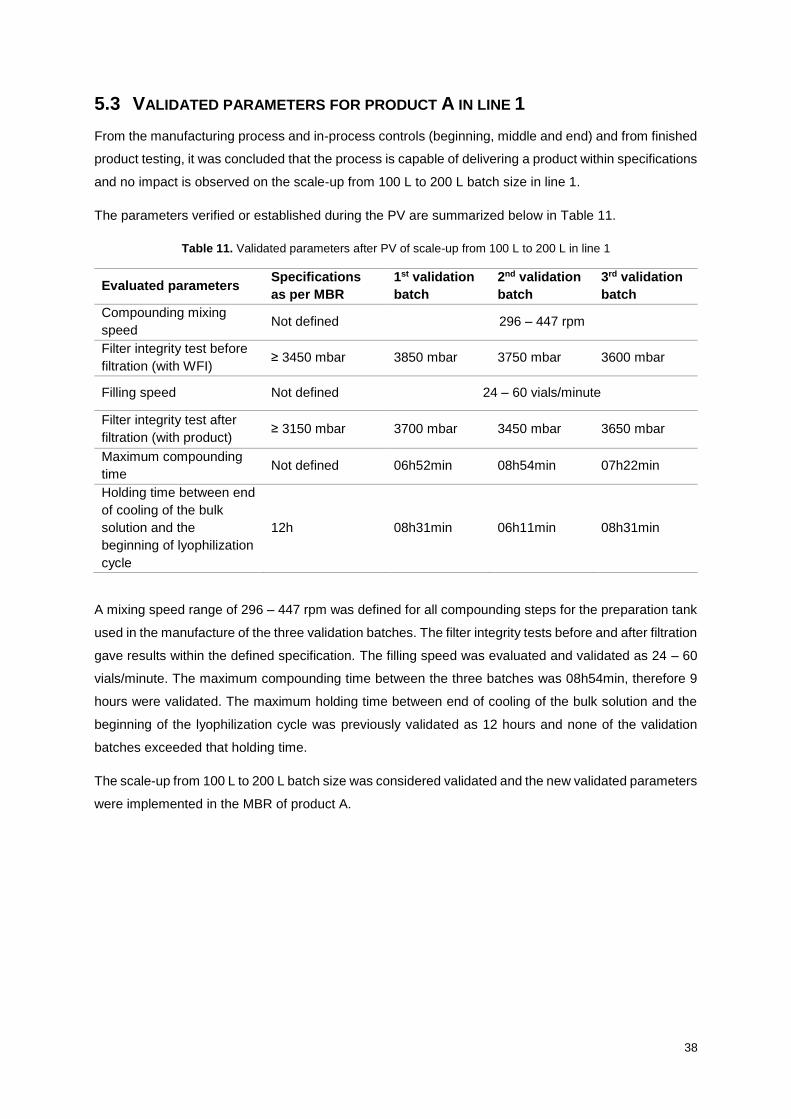
38
5.3 VALIDATED PARAMETERS FOR PRODUCT A IN LINE 1
From the manufacturing process and in-process controls (beginning, middle and end) and from finished
product testing, it was concluded that the process is capable of delivering a product within specifications
and no impact is observed on the scale-up from 100 L to 200 L batch size in line 1.
The parameters verified or established during the PV are summarized below in Table 11.
Table 11. Validated parameters after PV of scale-up from 100 L to 200 L in line 1
Evaluated parameters Specifications
as per MBR
1st validation
batch
2nd validation
batch
3rd validation
batch
Compounding mixing
speed Not defined 296 – 447 rpm
Filter integrity test before
filtration (with WFI) ≥ 3450 mbar 3850 mbar 3750 mbar 3600 mbar
Filling speed Not defined 24 – 60 vials/minute
Filter integrity test after
filtration (with product) ≥ 3150 mbar 3700 mbar 3450 mbar 3650 mbar
Maximum compounding
time Not defined 06h52min 08h54min 07h22min
Holding time between end
of cooling of the bulk
solution and the
beginning of lyophilization
cycle
12h 08h31min 06h11min 08h31min
A mixing speed range of 296 – 447 rpm was defined for all compounding steps for the preparation tank
used in the manufacture of the three validation batches. The filter integrity tests before and after filtration
gave results within the defined specification. The filling speed was evaluated and validated as 24 – 60
vials/minute. The maximum compounding time between the three batches was 08h54min, therefore 9
hours were validated. The maximum holding time between end of cooling of the bulk solution and the
beginning of the lyophilization cycle was previously validated as 12 hours and none of the validation
batches exceeded that holding time.
The scale-up from 100 L to 200 L batch size was considered validated and the new validated parameters
were implemented in the MBR of product A.
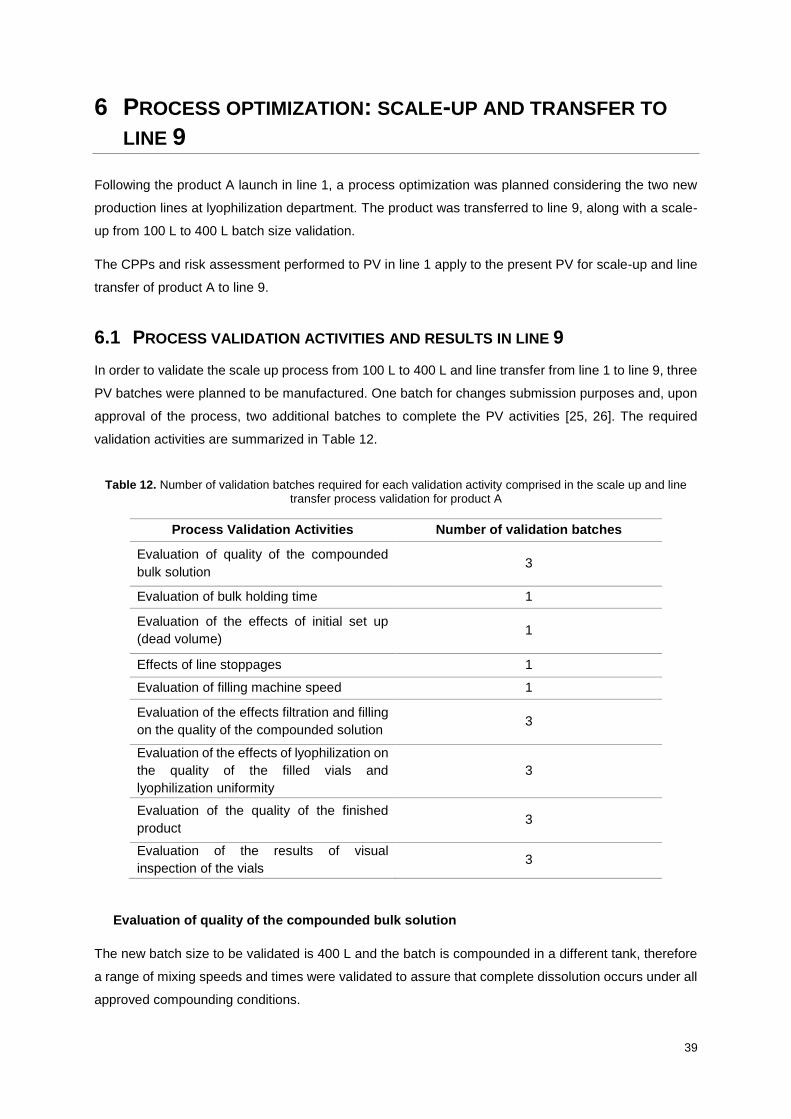
39
6 PROCESS OPTIMIZATION: SCALE-UP AND TRANSFER TO
LINE 9
Following the product A launch in line 1, a process optimization was planned considering the two new
production lines at lyophilization department. The product was transferred to line 9, along with a scale-
up from 100 L to 400 L batch size validation.
The CPPs and risk assessment performed to PV in line 1 apply to the present PV for scale-up and line
transfer of product A to line 9.
6.1 PROCESS VALIDATION ACTIVITIES AND RESULTS IN LINE 9
In order to validate the scale up process from 100 L to 400 L and line transfer from line 1 to line 9, three
PV batches were planned to be manufactured. One batch for changes submission purposes and, upon
approval of the process, two additional batches to complete the PV activities [25, 26]. The required
validation activities are summarized in Table 12.
Table 12. Number of validation batches required for each validation activity comprised in the scale up and line transfer process validation for product A
Process Validation Activities Number of validation batches
Evaluation of quality of the compounded
bulk solution 3
Evaluation of bulk holding time 1
Evaluation of the effects of initial set up
(dead volume) 1
Effects of line stoppages 1
Evaluation of filling machine speed 1
Evaluation of the effects filtration and filling
on the quality of the compounded solution 3
Evaluation of the effects of lyophilization on
the quality of the filled vials and
lyophilization uniformity
3
Evaluation of the quality of the finished
product 3
Evaluation of the results of visual
inspection of the vials 3
Evaluation of quality of the compounded bulk solution
The new batch size to be validated is 400 L and the batch is compounded in a different tank, therefore
a range of mixing speeds and times were validated to assure that complete dissolution occurs under all
approved compounding conditions.
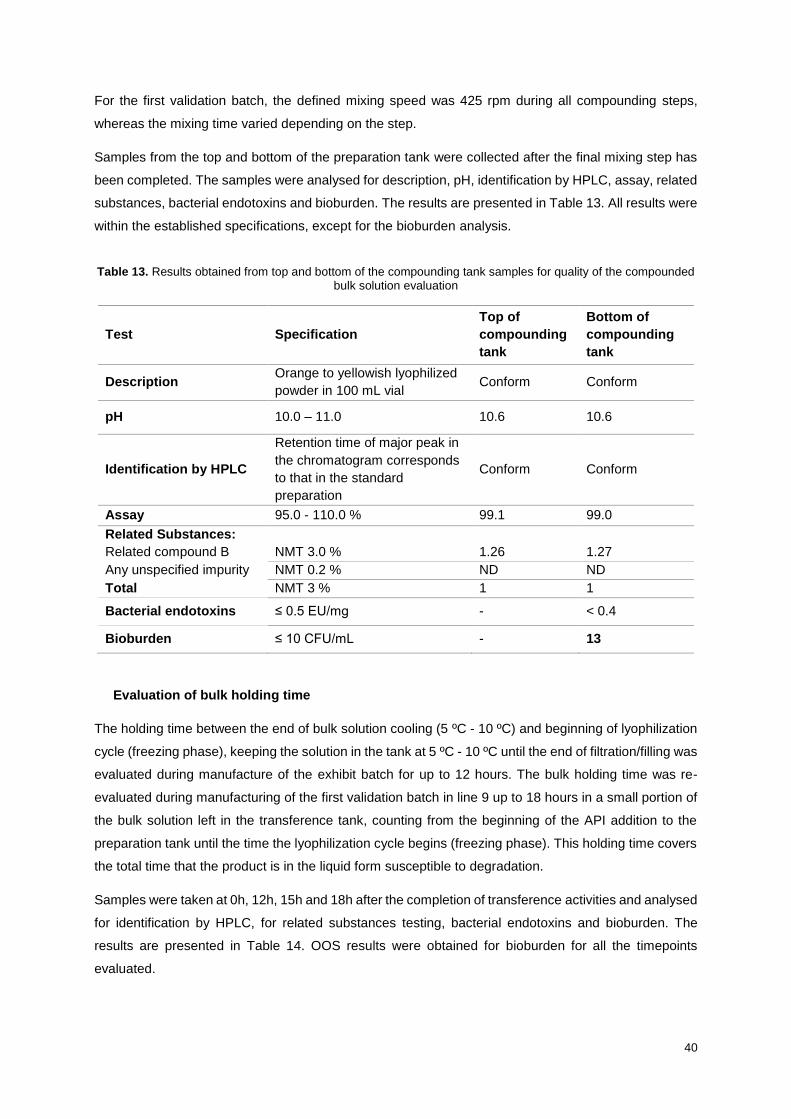
40
For the first validation batch, the defined mixing speed was 425 rpm during all compounding steps,
whereas the mixing time varied depending on the step.
Samples from the top and bottom of the preparation tank were collected after the final mixing step has
been completed. The samples were analysed for description, pH, identification by HPLC, assay, related
substances, bacterial endotoxins and bioburden. The results are presented in Table 13. All results were
within the established specifications, except for the bioburden analysis.
Table 13. Results obtained from top and bottom of the compounding tank samples for quality of the compounded bulk solution evaluation
Test Specification
Top of
compounding
tank
Bottom of
compounding
tank
Description Orange to yellowish lyophilized
powder in 100 mL vial Conform Conform
pH 10.0 – 11.0 10.6 10.6
Identification by HPLC
Retention time of major peak in
the chromatogram corresponds
to that in the standard
preparation
Conform Conform
Assay 95.0 - 110.0 % 99.1 99.0
Related Substances:
Related compound B NMT 3.0 % 1.26 1.27
Any unspecified impurity NMT 0.2 % ND ND
Total NMT 3 % 1 1
Bacterial endotoxins ≤ 0.5 EU/mg - < 0.4
Bioburden ≤ 10 CFU/mL - 13
Evaluation of bulk holding time
The holding time between the end of bulk solution cooling (5 ºC - 10 ºC) and beginning of lyophilization
cycle (freezing phase), keeping the solution in the tank at 5 ºC - 10 ºC until the end of filtration/filling was
evaluated during manufacture of the exhibit batch for up to 12 hours. The bulk holding time was re-
evaluated during manufacturing of the first validation batch in line 9 up to 18 hours in a small portion of
the bulk solution left in the transference tank, counting from the beginning of the API addition to the
preparation tank until the time the lyophilization cycle begins (freezing phase). This holding time covers
the total time that the product is in the liquid form susceptible to degradation.
Samples were taken at 0h, 12h, 15h and 18h after the completion of transference activities and analysed
for identification by HPLC, for related substances testing, bacterial endotoxins and bioburden. The
results are presented in Table 14. OOS results were obtained for bioburden for all the timepoints
evaluated.
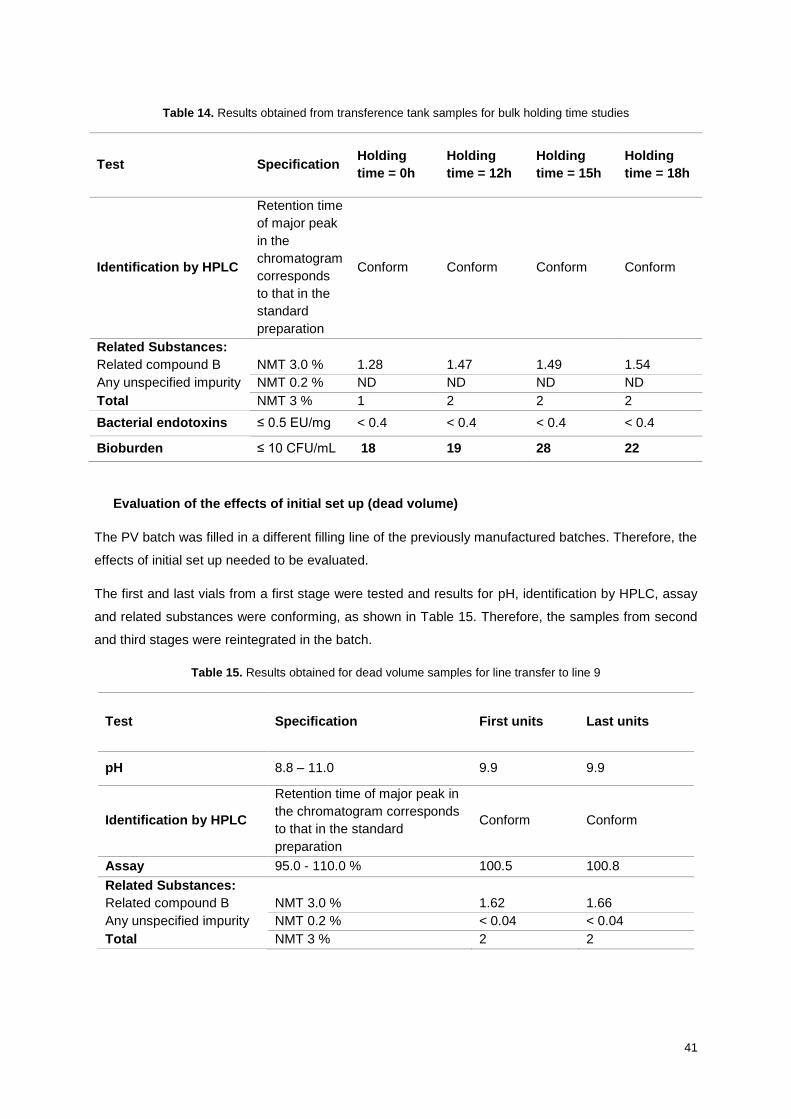
41
Table 14. Results obtained from transference tank samples for bulk holding time studies
Test Specification Holding
time = 0h
Holding
time = 12h
Holding
time = 15h
Holding
time = 18h
Identification by HPLC
Retention time
of major peak
in the
chromatogram
corresponds
to that in the
standard
preparation
Conform Conform Conform Conform
Related Substances:
Related compound B NMT 3.0 % 1.28 1.47 1.49 1.54
Any unspecified impurity NMT 0.2 % ND ND ND ND
Total NMT 3 % 1 2 2 2
Bacterial endotoxins ≤ 0.5 EU/mg < 0.4 < 0.4 < 0.4 < 0.4
Bioburden ≤ 10 CFU/mL 18 19 28 22
Evaluation of the effects of initial set up (dead volume)
The PV batch was filled in a different filling line of the previously manufactured batches. Therefore, the
effects of initial set up needed to be evaluated.
The first and last vials from a first stage were tested and results for pH, identification by HPLC, assay
and related substances were conforming, as shown in Table 15. Therefore, the samples from second
and third stages were reintegrated in the batch.
Table 15. Results obtained for dead volume samples for line transfer to line 9
Test Specification First units Last units
pH 8.8 – 11.0 9.9 9.9
Identification by HPLC
Retention time of major peak in
the chromatogram corresponds
to that in the standard
preparation
Conform Conform
Assay 95.0 - 110.0 % 100.5 100.8
Related Substances:
Related compound B NMT 3.0 % 1.62 1.66
Any unspecified impurity NMT 0.2 % < 0.04 < 0.04
Total NMT 3 % 2 2
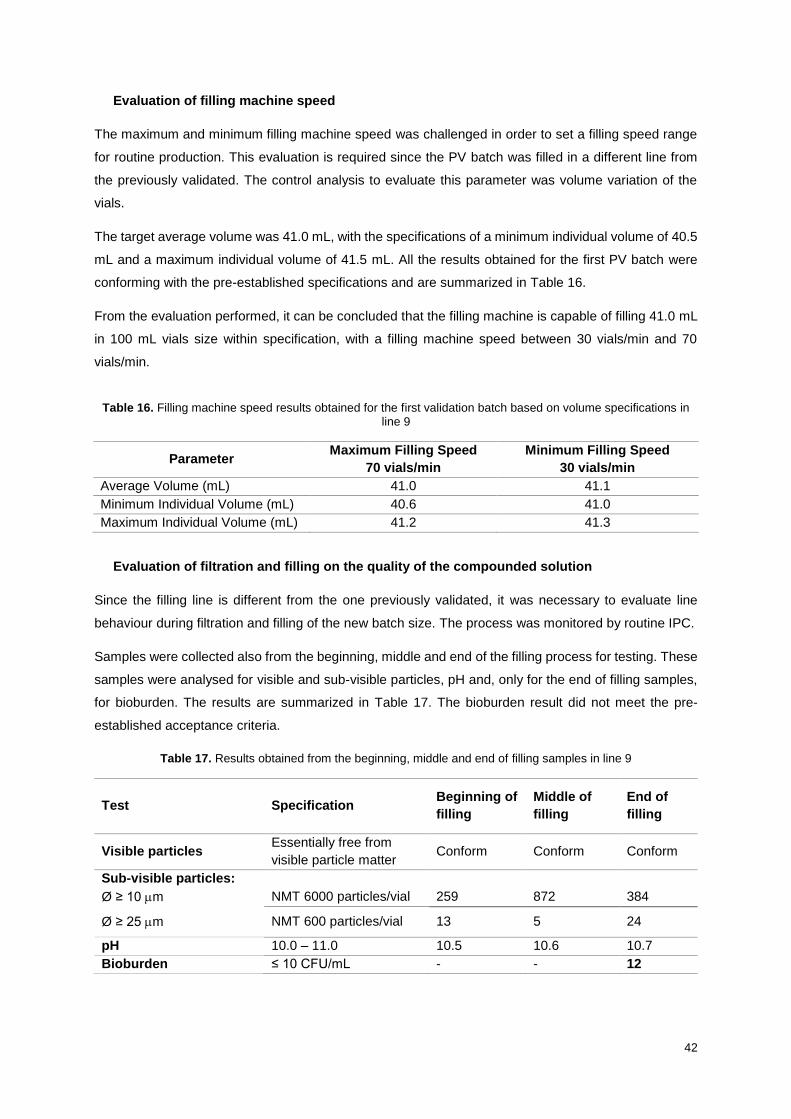
42
Evaluation of filling machine speed
The maximum and minimum filling machine speed was challenged in order to set a filling speed range
for routine production. This evaluation is required since the PV batch was filled in a different line from
the previously validated. The control analysis to evaluate this parameter was volume variation of the
vials.
The target average volume was 41.0 mL, with the specifications of a minimum individual volume of 40.5
mL and a maximum individual volume of 41.5 mL. All the results obtained for the first PV batch were
conforming with the pre-established specifications and are summarized in Table 16.
From the evaluation performed, it can be concluded that the filling machine is capable of filling 41.0 mL
in 100 mL vials size within specification, with a filling machine speed between 30 vials/min and 70
vials/min.
Table 16. Filling machine speed results obtained for the first validation batch based on volume specifications in line 9
Parameter Maximum Filling Speed
70 vials/min
Minimum Filling Speed
30 vials/min
Average Volume (mL) 41.0 41.1
Minimum Individual Volume (mL) 40.6 41.0
Maximum Individual Volume (mL) 41.2 41.3
Evaluation of filtration and filling on the quality of the compounded solution
Since the filling line is different from the one previously validated, it was necessary to evaluate line
behaviour during filtration and filling of the new batch size. The process was monitored by routine IPC.
Samples were collected also from the beginning, middle and end of the filling process for testing. These
samples were analysed for visible and sub-visible particles, pH and, only for the end of filling samples,
for bioburden. The results are summarized in Table 17. The bioburden result did not meet the pre-
established acceptance criteria.
Table 17. Results obtained from the beginning, middle and end of filling samples in line 9
Test Specification Beginning of
filling
Middle of
filling
End of
filling
Visible particles Essentially free from
visible particle matter Conform Conform Conform
Sub-visible particles:
Ø ≥ 10 m NMT 6000 particles/vial 259 872 384
Ø ≥ 25 m NMT 600 particles/vial 13 5 24
pH 10.0 – 11.0 10.5 10.6 10.7
Bioburden ≤ 10 CFU/mL - - 12
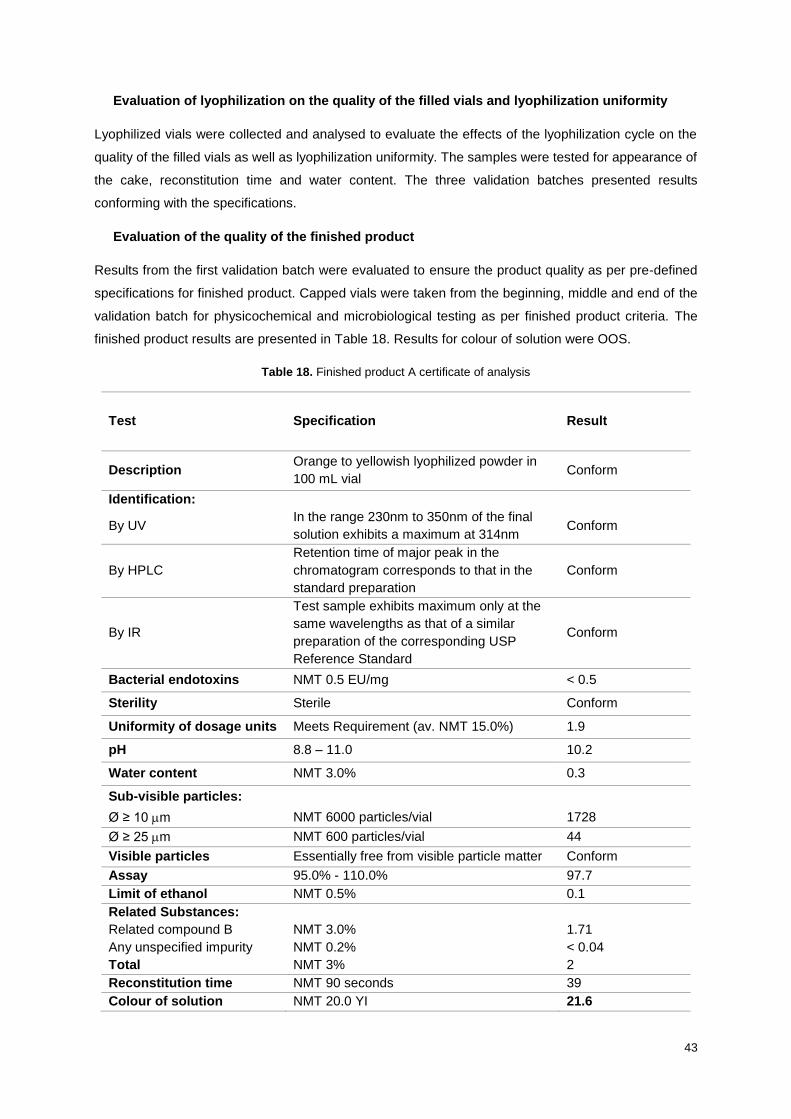
43
Evaluation of lyophilization on the quality of the filled vials and lyophilization uniformity
Lyophilized vials were collected and analysed to evaluate the effects of the lyophilization cycle on the
quality of the filled vials as well as lyophilization uniformity. The samples were tested for appearance of
the cake, reconstitution time and water content. The three validation batches presented results
conforming with the specifications.
Evaluation of the quality of the finished product
Results from the first validation batch were evaluated to ensure the product quality as per pre-defined
specifications for finished product. Capped vials were taken from the beginning, middle and end of the
validation batch for physicochemical and microbiological testing as per finished product criteria. The
finished product results are presented in Table 18. Results for colour of solution were OOS.
Table 18. Finished product A certificate of analysis
Test Specification Result
Description Orange to yellowish lyophilized powder in
100 mL vial Conform
Identification:
By UV In the range 230nm to 350nm of the final
solution exhibits a maximum at 314nm Conform
By HPLC
Retention time of major peak in the
chromatogram corresponds to that in the
standard preparation
Conform
By IR
Test sample exhibits maximum only at the
same wavelengths as that of a similar
preparation of the corresponding USP
Reference Standard
Conform
Bacterial endotoxins NMT 0.5 EU/mg < 0.5
Sterility Sterile Conform
Uniformity of dosage units Meets Requirement (av. NMT 15.0%) 1.9
pH 8.8 – 11.0 10.2
Water content NMT 3.0% 0.3
Sub-visible particles:
Ø ≥ 10 m NMT 6000 particles/vial 1728
Ø ≥ 25 m NMT 600 particles/vial 44
Visible particles Essentially free from visible particle matter Conform
Assay 95.0% - 110.0% 97.7
Limit of ethanol NMT 0.5% 0.1
Related Substances:
Related compound B NMT 3.0% 1.71
Any unspecified impurity NMT 0.2% < 0.04
Total NMT 3% 2
Reconstitution time NMT 90 seconds 39
Colour of solution NMT 20.0 YI 21.6
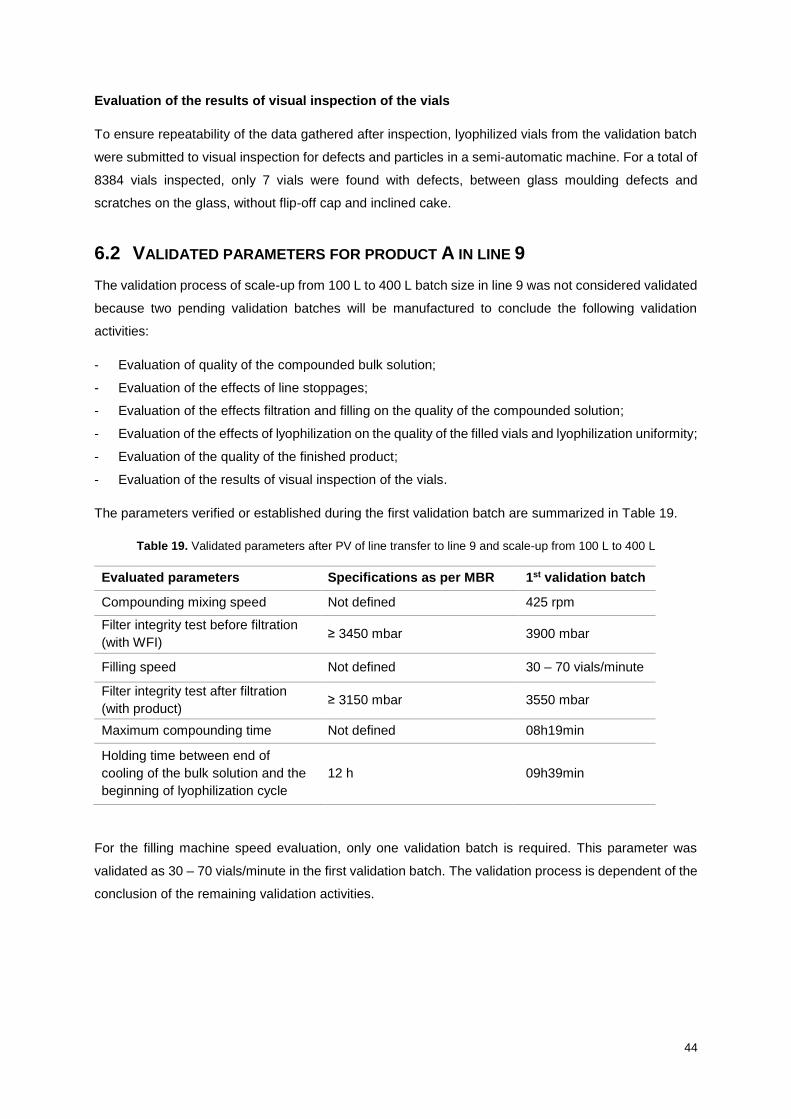
44
Evaluation of the results of visual inspection of the vials
To ensure repeatability of the data gathered after inspection, lyophilized vials from the validation batch
were submitted to visual inspection for defects and particles in a semi-automatic machine. For a total of
8384 vials inspected, only 7 vials were found with defects, between glass moulding defects and
scratches on the glass, without flip-off cap and inclined cake.
6.2 VALIDATED PARAMETERS FOR PRODUCT A IN LINE 9
The validation process of scale-up from 100 L to 400 L batch size in line 9 was not considered validated
because two pending validation batches will be manufactured to conclude the following validation
activities:
- Evaluation of quality of the compounded bulk solution;
- Evaluation of the effects of line stoppages;
- Evaluation of the effects filtration and filling on the quality of the compounded solution;
- Evaluation of the effects of lyophilization on the quality of the filled vials and lyophilization uniformity;
- Evaluation of the quality of the finished product;
- Evaluation of the results of visual inspection of the vials.
The parameters verified or established during the first validation batch are summarized in Table 19.
Table 19. Validated parameters after PV of line transfer to line 9 and scale-up from 100 L to 400 L
Evaluated parameters Specifications as per MBR 1st validation batch
Compounding mixing speed Not defined 425 rpm
Filter integrity test before filtration
(with WFI) ≥ 3450 mbar 3900 mbar
Filling speed Not defined 30 – 70 vials/minute
Filter integrity test after filtration
(with product) ≥ 3150 mbar 3550 mbar
Maximum compounding time Not defined 08h19min
Holding time between end of
cooling of the bulk solution and the
beginning of lyophilization cycle
12 h 09h39min
For the filling machine speed evaluation, only one validation batch is required. This parameter was
validated as 30 – 70 vials/minute in the first validation batch. The validation process is dependent of the
conclusion of the remaining validation activities.
45
6.3 DEVIATIONS DURING VALIDATION BATCH
Regarding the non-conforming results obtained for bioburden and colour of solution analysis,
investigations were performed to determine the root cause of these deviations and establish preventive
and/or corrective actions.
6.3.1 Investigation to OOS bioburden analysis
As an outcome of the bioburden testing for the bulk solution, a result of 12 CFU/mL has been obtained
for the sample taken from the end of filling. However, all the samples of the holding times gave bioburden
results with contamination, including the sample from the bottom of the compounding tank.
An investigation was conducted to determine the root cause of the OOS results, where the following
aspects were reviewed:
- Environmental monitoring;
- Analysts that performed the tests;
- Bioburden data from the exhibit batch;
- Raw materials bioburden;
- WFI bioburden trend analysis;
- Product sterilizing filtration;
- Finished product testing for bacterial endotoxins and sterility.
During the bioburden tests it was performed environmental monitoring and all results gave 0 CFU/mL,
except for the fingerprints of the right hand of the analyst. It was concluded that there is no correlation
between the obtained bioburden results and the analyst that performed the test, since the bioburden
testing was performed on different days by different analysts. Moreover, the analyst also did bioburden
tests for other products manufactured on other production lines and all the results were conforming.
Based on the data from the exhibit batch in 2012, it seems to be indicative that the product is associated
with a trend of high bioburden results. During manufacture of the exhibit batch, it was found bioburden
results above the specified limit from the sample of the bottom of the compounding tank. At that time,
the bioburden specification was NMT 10 CFU/100mL, which was further updated to NMT 10 CFU/mL.
The bioburden testing for the raw materials used in the preparation of the validation batch, as well as
for the WFI use points in the compounding room for the day the preparation was performed, gave
conforming results. The environmental monitoring of the compounding room was also evaluated for the
day the validation batch was compounded and no OOS results were found.
Product A is an aseptically filled product, filtered through a 0.45 m filter and a 0.22 m sterilizing filter.
According to the bacterial retention validation of the sterilizing grade 0.22 m filter in the presence of
product A, the filtration area used for the manufactured batch of 400 L enable to retain the highest
bioburden found in the bulk of the batch (13 CFU/mL).
Moreover, bacterial endotoxins tests for the bulk solution holding time studies and the finished product
gave all conforming results, as well as the sterility test for the finished product.
46
It was concluded that the most probable root cause for the high bioburden results is product related due
to the historic of bioburden results obtained for the exhibit batch, the fact that the product does not have
any bactericide or bacteriostatic activity and the incremental results along the bulk holding time studies,
which indicate that the product may even promote the bacterial growth.
The impact of having bioburden results above the specified action limit of 10 CFU/mL in the bulk
preparation on the quality of the finished product was evaluated, as follows:
- Product A is aseptically filled and the integrity test performed on the 0.22 m sterile filter used on
the filtration of the batch showed conforming results;
- The obtained bacterial endotoxins result on the bulk were within specification, which indicates that
no spore forming microorganisms were found on the bulk;
- Filter validation is done including bacterial retention studies to assure that the 0.22 m filter is
capable to retain the increased bioburden in the bulk;
- The results of bacterial endotoxins and sterility for the finished product were conform.
Therefore, the risk of having contamination on the finished product due to bioburden action results on
the bulk is considered very low and does not have any impact on the quality and sterility assurance of
the finished product. Additionally, there is a maximum bulk bioburden limit of 100 CFU/mL above which
the batch should be rejected.
The following preventive measures were established in order to avoid the re-occurrence of high
bioburden results for this product:
- A bioburden reduction step will be included as part of the filtration process, which will require the
inclusion of a pre-filter of 0.22 m to the filtration train to be used for this product. The pre-filter will
be assembled at the exit of the preparation tank in series with the pre-filter of 0.45 m and the final
filter of 0.22 m;
- Samples for bioburden determination will be collected before the pre-filter of 0.45 m both at the
end of compounding and immediately before the end of filling.
6.3.2 Investigation to OOS colour of solution
For the OOS colour of solution results for beginning, middle, end of capping and composite samples an
investigation was conducted in order to identify the root cause.
As a corrective action, the investigation included a re-testing of freshly samples and the OOS result was
confirmed. The obtained results were aligned with the initial results and both were above specifications
for all the samples tested.
During the investigation, the OOS result was confirmed in all generated data for the manufactured batch,
meaning that the root cause is product related. The procedure for colour of solution testing was reviewed
and no analytical error was detected. According to product history, colour of solution was not part of the
product specifications by the time of manufacture of the exhibit batch in 2012. Therefore, there were no
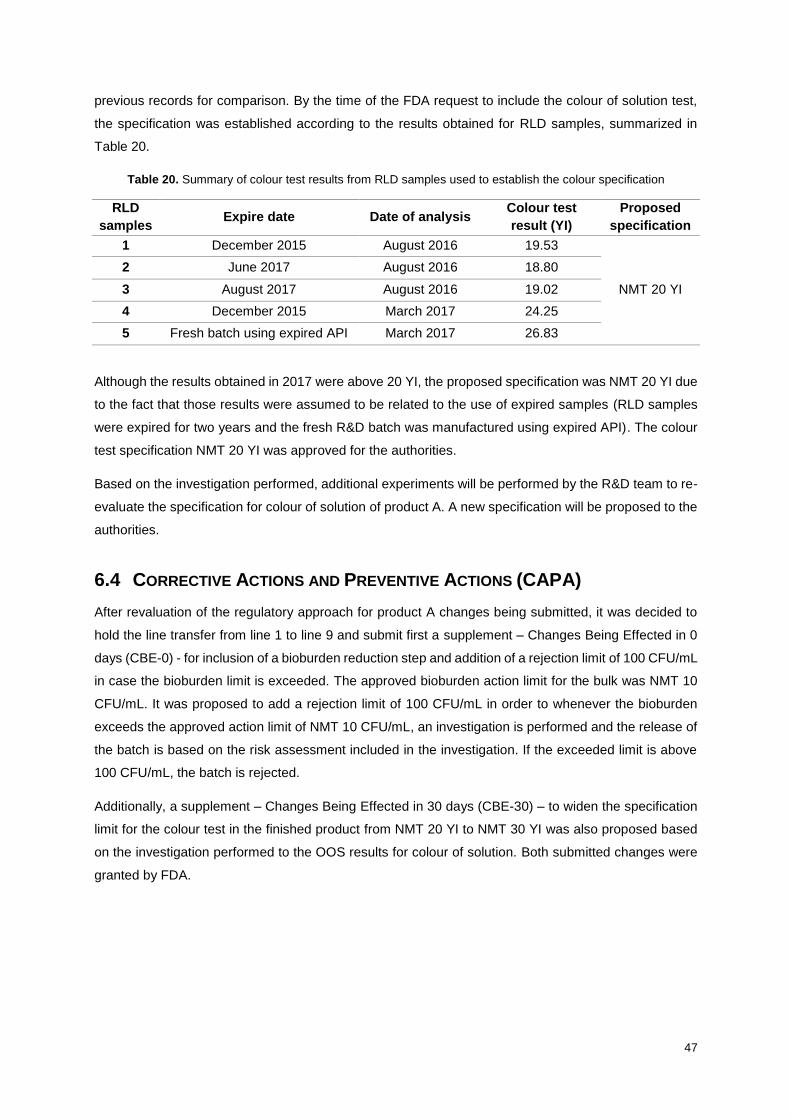
47
previous records for comparison. By the time of the FDA request to include the colour of solution test,
the specification was established according to the results obtained for RLD samples, summarized in
Table 20.
Table 20. Summary of colour test results from RLD samples used to establish the colour specification
RLD
samples Expire date Date of analysis
Colour test
result (YI)
Proposed
specification
1 December 2015 August 2016 19.53
NMT 20 YI
2 June 2017 August 2016 18.80
3 August 2017 August 2016 19.02
4 December 2015 March 2017 24.25
5 Fresh batch using expired API March 2017 26.83
Although the results obtained in 2017 were above 20 YI, the proposed specification was NMT 20 YI due
to the fact that those results were assumed to be related to the use of expired samples (RLD samples
were expired for two years and the fresh R&D batch was manufactured using expired API). The colour
test specification NMT 20 YI was approved for the authorities.
Based on the investigation performed, additional experiments will be performed by the R&D team to re-
evaluate the specification for colour of solution of product A. A new specification will be proposed to the
authorities.
6.4 CORRECTIVE ACTIONS AND PREVENTIVE ACTIONS (CAPA)
After revaluation of the regulatory approach for product A changes being submitted, it was decided to
hold the line transfer from line 1 to line 9 and submit first a supplement – Changes Being Effected in 0
days (CBE-0) - for inclusion of a bioburden reduction step and addition of a rejection limit of 100 CFU/mL
in case the bioburden limit is exceeded. The approved bioburden action limit for the bulk was NMT 10
CFU/mL. It was proposed to add a rejection limit of 100 CFU/mL in order to whenever the bioburden
exceeds the approved action limit of NMT 10 CFU/mL, an investigation is performed and the release of
the batch is based on the risk assessment included in the investigation. If the exceeded limit is above
100 CFU/mL, the batch is rejected.
Additionally, a supplement – Changes Being Effected in 30 days (CBE-30) – to widen the specification
limit for the colour test in the finished product from NMT 20 YI to NMT 30 YI was also proposed based
on the investigation performed to the OOS results for colour of solution. Both submitted changes were
granted by FDA.

48
49
7 CONCLUSION
7.1 CONTRIBUTIONS
Optimization of a manufacturing process may consist in a technology transfer and scale-up of the
process. These changes to the process require a PV approach to ensure that the process remains in a
state of control, operating within established parameters, and capable of providing a medicinal finished
product meeting its predetermined specifications and quality attributes.
A lyophilized pharmaceutical sterile product demands aseptic processing due to degradation of the
product or loss of performance when exposed to terminal sterilization through heat or radiation. Aseptic
processing implies a set of controls that include room´s classification, personnel training and
qualification, containers and closures sterilization, filtration efficacy and microbiological testing. Each
step of aseptic processing must be designed to ensure the sterility during all process.
Hikma manufacturing plant in Sintra is the center of production and commercialization within the
injectables segment and is divided in three separate facilities. One of them specialized in liquid and
lyophilized products manufacturing, other in powder injectable products and the most recent one,
specialized in oncologic products manufacturing.
In a technology transfer from production line 1 to line 9 certain parameters are validated and considered
equivalent between the two lines, thus do not require a PV approach on a product basis. The parameters
that must be validated for each product to be transferred are the lyophilization cycle, the filtration train,
the filling process including dead volume, filling machine speed and line stoppages and the capping
process. In case of change of batch size or compounding tank, the compounding process must also be
validated.
A new lyophilized product approved by FDA for commercialization in US market was presented in this
thesis. For product launch, it was designed a scale-up from 100 L to 200 L in line 1, the initial production
line where the exhibit batch was manufactured. Three validation batches were manufactured. The
quality of the compounded bulk solution was re-evaluated and all results were within specification.
Effects of initial set up were evaluated and the quantity of 300 mL discarded in line 1 before filling was
concluded to be enough to have a product within specifications. Filling machine speed range of 24
vials/min – 60 vials/min was validated. The effects of filtration and filling were evaluated and all results
conforming, as well as the lyophilization uniformity. The finished product tests were all within
specifications. Based on the results obtained, it was possible to conclude that the three validation
batches manufactured in line 1 were successfully manufactured and considered validated.
In order to optimize the process for commercial manufacturing, a scale-up from 100 L to 400 L and a
line transfer from line 1 to line 9 were planned. One validation batch was manufactured in line 9 and
previously defined validation activities were performed. The quality of the compounded bulk solution
was evaluated and OOS results were found for bioburden. The bulk holding time was evaluated up to
18 hours, but non-conforming bioburden results were obtained for each time point evaluated. The
50
holding time was maintained 12 hours, as previously validated in the exhibit batch. The effects of initial
set up were also evaluated and filling machine speed was validated as a minimum of 30 vials/min and
a maximum of 70 vials/min. Samples from beginning, middle and end of filling were analyzed to evaluate
the effects of filtration and filling. All results were conforming, except for bulk bioburden analysis. The
lyophilization uniformity and quality of the finished product were evaluated. In the finished product
analysis, the test for colour of solution was OOS.
Investigations to the non-conforming results were conducted. The OOS bioburden results were
concluded to be product related, but with no negative impact on the quality of the finished product. As
CAPA measures, inclusion of a bioburden reduction step as part of the filtration process and addition of
a rejection limit of 100 CFU/mL were submitted to the authorities and approved. The root cause for the
non-conforming result for colour of solution on the finished product analysis was not determined, but
R&D studies were presented to FDA to widen the specification limit from NMT 20 YI to NMT 30 YI and
this change was also approved.
At the present time, a supplement – Changes Being Effected in 30 days (CBE-30) - regarding the
addition of the new aseptic filling line 9 was submitted to the authorities and was already granted by 30th
September.
7.2 FUTURE WORK
Following the presented work in this thesis, it is important that the production department manufactures
the two pending validation batches of product A in line 9 to complete the scale-up from 100L to 400L
validation process. Along with the line transfer to line 9, the process would be optimized to the maximum
capacity in that production line.
Moreover, it would be interesting to follow closely the results and deviations observed during validation
and commercial manufacturing in order to establish a trend and identify the most frequent problems
detected.
51
REFERENCES
[1] FDA, (CDER, CBER, CVM), “Guidance for Industry Process Validation: General Principles and
Practices”, January 2011.
[2] WHO Expert Committee on Specifications for Pharmaceutical Preparations, “Good manufacturing
practices: guidelines on validation”. Fifty-third report, Annex 3. WHO Technical Report Series, No. 1019,
pp. 121-132, Geneva, 2019.
[3] ICH Expert Working Group, “Pharmaceutical Quality System Q10”, pp. 1-9, June 2008.
[4] WHO Expert Committee on Specifications for Pharmaceutical Preparations, “Good manufacturing
practices: guidelines on the validation of manufacturing processes”. Thirty-fourth report, Annex 6. WHO
Technical Report Series, No. 863, pp. 80-90, Geneva, 1996.
[5] Ostrove S., “Introduction to Process Validation”, How to Validate a Pharmaceutical Process,
Academic Press, pp. 3-7, 2016.
[6] WHO Expert Committee on Specifications for Pharmaceutical Preparations, “Supplementary
guidelines on good manufacturing practices: validation”. Fortieth report, Annex 4. WHO Technical
Report Series, No. 937, pp. 108-115, Geneva, 2006.
[7] FDA, “Process Validation Requirements for Drug Products and Active Pharmaceutical Ingredients
Subject to Pre-Market Approval”, Compliance Policy Guide Sec. 490.100, March 2004.
[8] FDA, “21 Code of Federal Regulations (CFR), Parts 210 and 211”, pp. 1-3, 15-16, 22-28, August
1996.
[9] ICH Expert Working Group, “Quality Risk Management Q9”, November 2005.
[10] Hikma Pharmaceuticals, “Guidance Document to Risk Management Approach”, SOP Hikma
Pharmaceuticals, 2007.
[11] WHO Expert Committee on Specifications for Pharmaceutical Preparations, “Guidelines on transfer
of technology in pharmaceutical manufacturing”. Forty-fifth report, Annex 7. WHO Technical Report
Series, No. 961, pp. 285-300, 306, Geneva, 2011.
[12] C. Pipa and A. Pinto, “Process Validation Approach of Hikma Farmacêutica S.A. for New Products
and Commercial Products”, Hikma Pharmaceuticals, 2017.
[13] R. Brandes, M. Mayer, Dr. H. Seyfarth and Dr. M. Gieseler, “Manufacturing Sterile Products to Meet
EU and FDA Guidelines”, Maas & Peither AG – GMP Publishing, pp. 75-107, 2014.
[14] FDA, (CDER, CBER, ORA), “Guidance for Industry Sterile Drug Products Produced by Aseptic
Processing – Current Good Manufacturing Practice”, pp. 4-28, September 2004.

52
[15] European Commission, “Annex 1: Manufacture of Sterile Medicinal Products. Revision draft.”, EU
Guidelines to Good Manufacturing Practice Medicinal Products for Human and Veterinary Use, pp. 3-
13, 33-34, 2017.
[16] Hikma website, [Online]. Available: https://www.hikma.com/investors/understanding-hikma/our-
business-model/ [Accessed: August 2019].
[17] Ph. Larrat, “Freeze Drying”, Société USIFROID, pp. 3-13, April 1993.
[18] A. Pinto and C. Pipa, “Process Validation Policy for Drug Products”, Hikma Pharmaceuticals, 2017.
[19] Hikma Pharmaceuticals, “Validation Master Plan for Line 9”, 2017.
[20] Hikma Pharmaceuticals, “General Protocol for Technology Transfer of Products from Line 1 to Line
9 and Line 10”, pp 1-10, 2017.
[21] C. Carvalho and A. R. Martins, “Process description of aseptic manufacture of solutions and
lyophilized products – Line 1”, SOP Hikma Pharmaceuticals, 2019.
[22] C. Carvalho and A. R. Martins, “Manufacturing process description – Line 9 and Line 10”, SOP
Hikma Pharmaceuticals, 2019.
[23] C. Sambado and S. Rodrigues, “Process Validation Protocol for Product A scale-up from 100L to
200L batch size in line 1”, Hikma Pharmaceuticals, 2019.
[24] C. Sambado and S. Rodrigues, “Process Validation Report for Product A scale-up from 100L to
200L batch size in line 1”, Hikma Pharmaceuticals, 2019.
[25] C. Pipa and S. Rodrigues, “Process Validation Protocol for Product A scale-up from 100L to 400L
batch size and line transfer from Line 1 to Line 9”, Hikma Pharmaceuticals, 2019.
[26] S. Baptista and S. Rodrigues, “Process Validation Report for Product A scale-up from 100L to 400L
batch size and line transfer from Line 1 to Line 9”, Hikma Pharmaceuticals, 2019.
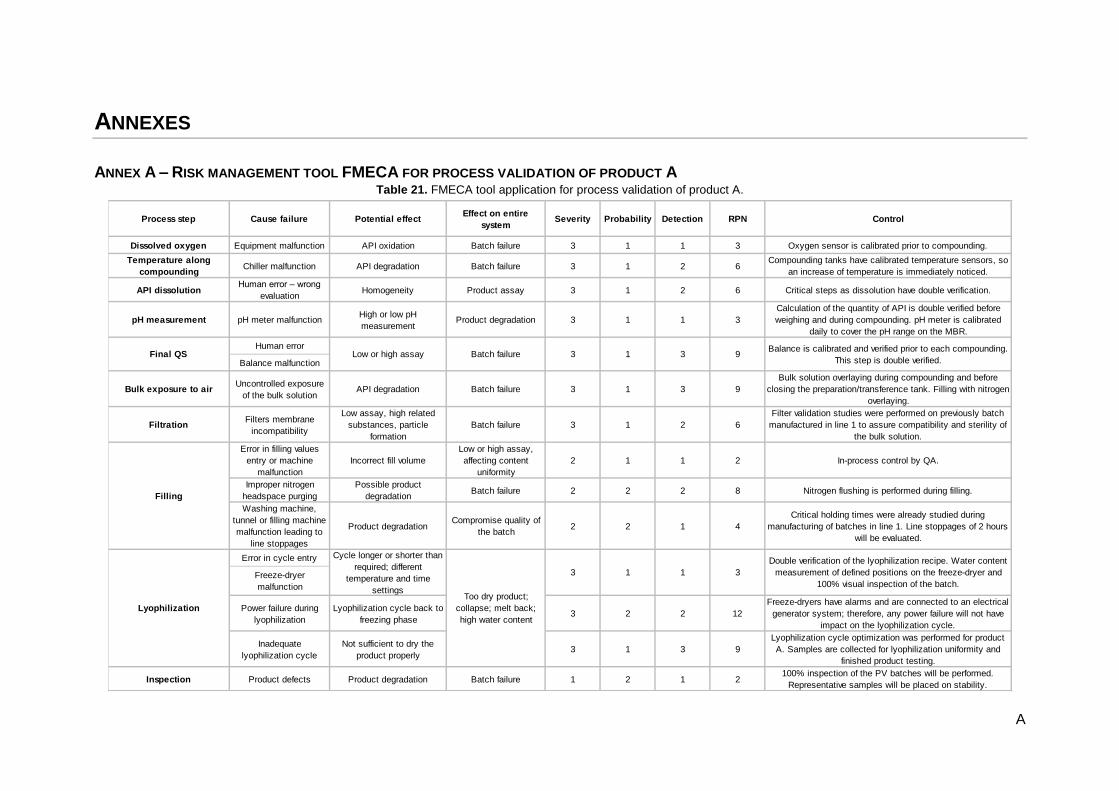
A
ANNEXES
ANNEX A – RISK MANAGEMENT TOOL FMECA FOR PROCESS VALIDATION OF PRODUCT A Table 21. FMECA tool application for process validation of product A.
Process step Cause failure Potential effectEffect on entire
systemSeverity Probability Detection RPN Control
Dissolved oxygen Equipment malfunction API oxidation Batch failure 3 1 1 3 Oxygen sensor is calibrated prior to compounding.
Temperature along
compoundingChiller malfunction API degradation Batch failure 3 1 2 6
Compounding tanks have calibrated temperature sensors, so
an increase of temperature is immediately noticed.
API dissolutionHuman error – wrong
evaluationHomogeneity Product assay 3 1 2 6 Critical steps as dissolution have double verification.
pH measurement pH meter malfunctionHigh or low pH
measurementProduct degradation 3 1 1 3
Calculation of the quantity of API is double verified before
weighing and during compounding. pH meter is calibrated
daily to cover the pH range on the MBR.
Human error
Balance malfunction
Bulk exposure to airUncontrolled exposure
of the bulk solutionAPI degradation Batch failure 3 1 3 9
Bulk solution overlaying during compounding and before
closing the preparation/transference tank. Filling with nitrogen
overlaying.
FiltrationFilters membrane
incompatibility
Low assay, high related
substances, particle
formation
Batch failure 3 1 2 6
Filter validation studies were performed on previously batch
manufactured in line 1 to assure compatibility and sterility of
the bulk solution.
Error in filling values
entry or machine
malfunction
Incorrect fill volume
Low or high assay,
affecting content
uniformity
2 1 1 2 In-process control by QA.
Improper nitrogen
headspace purging
Possible product
degradationBatch failure 2 2 2 8 Nitrogen flushing is performed during filling.
Washing machine,
tunnel or filling machine
malfunction leading to
line stoppages
Product degradationCompromise quality of
the batch2 2 1 4
Critical holding times were already studied during
manufacturing of batches in line 1. Line stoppages of 2 hours
will be evaluated.
Error in cycle entry
Freeze-dryer
malfunction
Power failure during
lyophilization
Lyophilization cycle back to
freezing phase3 2 2 12
Freeze-dryers have alarms and are connected to an electrical
generator system; therefore, any power failure will not have
impact on the lyophilization cycle.
Inadequate
lyophilization cycle
Not sufficient to dry the
product properly3 1 3 9
Lyophilization cycle optimization was performed for product
A. Samples are collected for lyophilization uniformity and
finished product testing.
Inspection Product defects Product degradation Batch failure 1 2 1 2100% inspection of the PV batches will be performed.
Representative samples will be placed on stability.
Double verification of the lyophilization recipe. Water content
measurement of defined positions on the freeze-dryer and
100% visual inspection of the batch.
9Balance is calibrated and verified prior to each compounding.
This step is double verified.
Filling
Lyophilization
Cycle longer or shorter than
required; different
temperature and time
settingsToo dry product;
collapse; melt back;
high water content
3 1 1 3
Final QS Low or high assay Batch failure 3 1 3

B
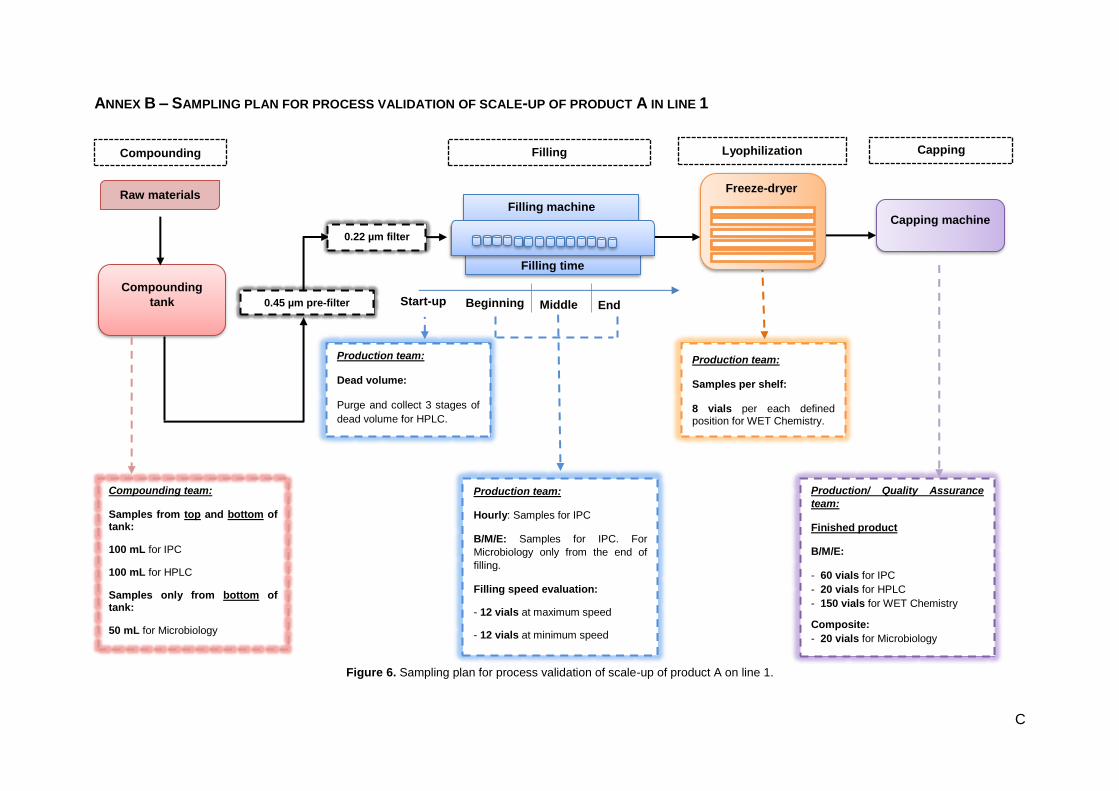
C
ANNEX B – SAMPLING PLAN FOR PROCESS VALIDATION OF SCALE-UP OF PRODUCT A IN LINE 1
Figure 6. Sampling plan for process validation of scale-up of product A on line 1.
Compounding Filling
Compounding
tank Beginning End
Lyophilization
Capping
Capping machine
Production/ Quality Assurance
team:
Finished product
B/M/E:
- 60 vials for IPC
- 20 vials for HPLC
- 150 vials for WET Chemistry
Composite:
- 20 vials for Microbiology
Filling machine
Filling time
Middle
Production team: Samples per shelf: 8 vials per each defined position for WET Chemistry.
Production team:
Dead volume:
Purge and collect 3 stages of
dead volume for HPLC.
Compounding team:
Samples from top and bottom of tank:
100 mL for IPC
100 mL for HPLC
Samples only from bottom of tank:
50 mL for Microbiology
0.22 µm filter
Ref.
CVGL71TP3
Freeze-dryer
0.45 µm pre-filter
Production team:
Hourly: Samples for IPC
B/M/E: Samples for IPC. For
Microbiology only from the end of
filling.
Filling speed evaluation:
- 12 vials at maximum speed
- 12 vials at minimum speed
Start-up
Raw materials

D
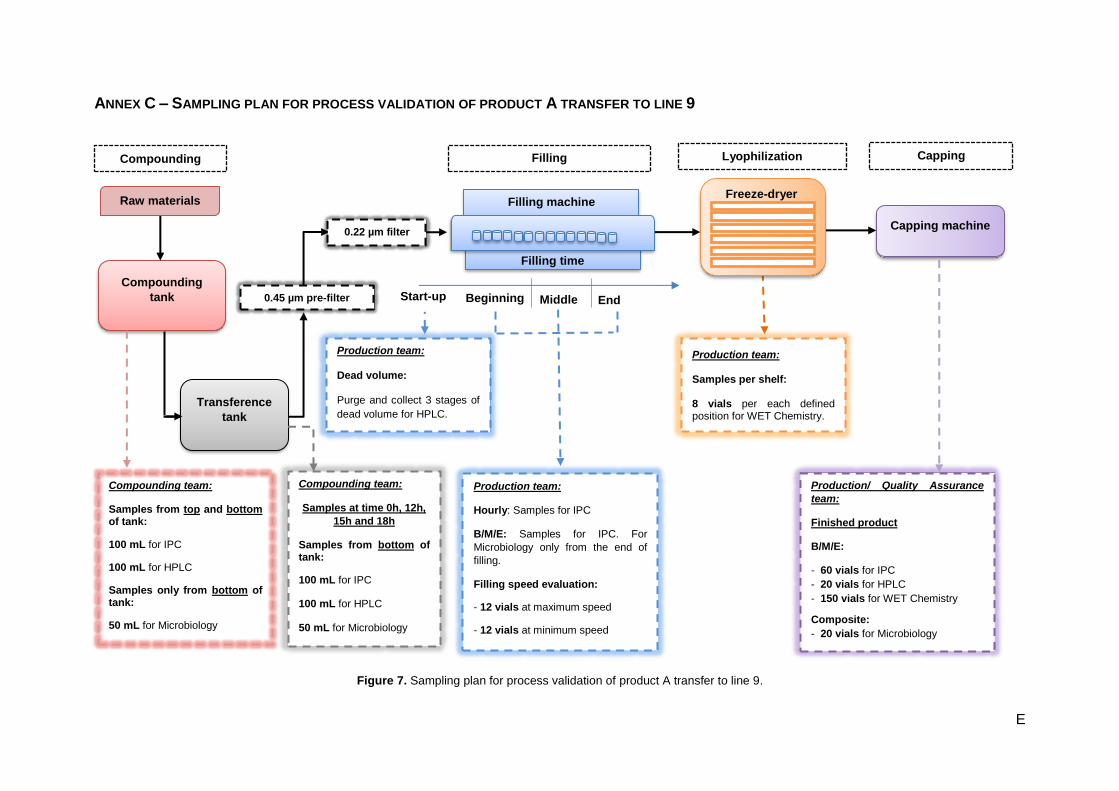
E
ANNEX C – SAMPLING PLAN FOR PROCESS VALIDATION OF PRODUCT A TRANSFER TO LINE 9
Figure 7. Sampling plan for process validation of product A transfer to line 9.
Compounding Filling
Compounding
tank Beginning End
Lyophilization
Capping
Capping machine
Production/ Quality Assurance
team:
Finished product
B/M/E:
- 60 vials for IPC
- 20 vials for HPLC
- 150 vials for WET Chemistry
Composite:
- 20 vials for Microbiology
Filling machine
Filling time
Middle
Production team: Samples per shelf: 8 vials per each defined position for WET Chemistry.
Production team:
Dead volume:
Purge and collect 3 stages of
dead volume for HPLC.
Compounding team:
Samples from top and bottom of tank:
100 mL for IPC
100 mL for HPLC
Samples only from bottom of tank:
50 mL for Microbiology
0.22 µm filter
Ref.
CVGL71TP3
Freeze-dryer
0.45 µm pre-filter
Production team:
Hourly: Samples for IPC
B/M/E: Samples for IPC. For
Microbiology only from the end of
filling.
Filling speed evaluation:
- 12 vials at maximum speed
- 12 vials at minimum speed
Start-up
Transference
tank
Raw materials
Compounding team:
Samples at time 0h, 12h,
15h and 18h
Samples from bottom of tank:
100 mL for IPC
100 mL for HPLC
50 mL for Microbiology