Embed Size (px)
Citation preview

P
Nf
JWa
Bb
c
d
B
a
ARRAA
KNIFPC
1
apsdbep
T
h0
Journal of Pharmaceutical and Biomedical Analysis 97 (2014) 39–46
Contents lists available at ScienceDirect
Journal of Pharmaceutical and Biomedical Analysis
j o ur na l ho mepage: www.elsev ier .com/ locate / jpba
harmaceutical Applications
IR spectroscopy for the in-line monitoring of a multicomponentormulation during the entire freeze-drying process
uan G. Rosasa,∗, Hans de Waardb, Thomas De Beerd, Chris Vervaetc, Jean Paul Remonc,outer L.J. Hinrichsb, Henderik W. Frijlinkb, Marcel Blancoa
Grupo de Quimiometría Aplicada, Departament de Química, Unitat de Química Analítica, Universitat Autònoma de Barcelona, E-08193 Bellaterra,arcelona, SpainDepartment of Pharmaceutical Technology and Biopharmacy, University of Groningen, Antonius Deusinglaan 1, 9713 AV Groningen, The NetherlandsLaboratory of Pharmaceutical Technology, Ghent University, Harelbekestraat 72, 9000 Ghent, BelgiumLaboratory of Pharmaceutical Process Analytical Technology, Department of Pharmaceutical Analysis, Ghent University, Harelbekestraat 72, 9000 Ghent,elgium
r t i c l e i n f o
rticle history:eceived 24 December 2013eceived in revised form 3 April 2014ccepted 8 April 2014vailable online 18 April 2014
eywords:IR
n-line monitoringreeze-dryingrincipal component analysisorrelation coefficient
a b s t r a c t
Freeze drying is a complex, time consuming and thus expensive process, hence creating a need for under-standing the material behaviour in the process environment and for process optimization. Near-infrared(NIR) spectroscopy offers the opportunity to monitor physicochemical changes of the formulation duringfreeze-drying. The aim of this work was to examine whether NIR spectroscopy allows in-line monitoringof all components during the entire freeze-drying process of a multi-component pharmaceutical formu-lation (a solution of fenofibrate and mannitol in a mixture of tertiary-butyl alcohol, and water). To extractuseful information of all components in the formulation from the large multivariate data-sets obtainedduring in-line spectroscopic monitoring, several spectral pre-processing techniques and spectral dataanalysis techniques such as the mean of selected wavenumbers (Mws), the correlation coefficient (Cor-rCoef) and principal component analysis (PCA) have been evaluated and compared. To find out whetherthese chemometric techniques are also able to differentiate between changes in the process settingsinfluencing the freeze-drying process of the formulation, freeze-drying processes were performed atfour different conditions. Results demonstrated that in-line measurements using NIR spectroscopy were
possible in an icy environment and that a further process understanding could be obtained. Data-analysisrevealed the crystallization behaviour of each of the four components. In addition, using the three pre-processing techniques allowed observe the sublimation of the solvents. Mws and CorrCoef have proven tobe adequate methods for monitoring the main physicochemical changes of product during the processes;this affirmation was confirmed by observing the outputs of PCA for entire processes.© 2014 Elsevier B.V. All rights reserved.
. Introduction
Freeze-drying is a widely used but complex, time consumingnd hence for industries expensive pharmaceutical multi-steproduction process, during which the starting material (mostly aolution) undergoes several transformations leading to a porousry end product [1]. A better understanding of the process can
e used to optimize the process, e.g. the process duration andnergy input, as well as the quality of the final product. To increaserocess understanding and to develop freeze-drying process∗ Corresponding author. Tel.: +32 9 2648097; fax: +32 9 2228236.E-mail addresses: [email protected] (J.G. Rosas),
[email protected] (T. De Beer).
ttp://dx.doi.org/10.1016/j.jpba.2014.04.010731-7085/© 2014 Elsevier B.V. All rights reserved.
monitoring and control strategies, several univariate and multi-variate process analytical technology (PAT) tools have been used(Table 1). However, most of these classically used technologies[2–12] might disturb the process and the product behaviour duringfreeze-drying and do not allow monitoring of all critical processaspects. Furthermore, the cited techniques cannot characterize theproduct itself during freeze-drying [13].
In contrast, in-line vibrational spectroscopic techniques [13–21]such as near-infrared (NIR) and Raman have been recently shownto be able to provide product information during the entirefreeze-drying process. These spectroscopic techniques are fast,
non-destructive and non-invasive, and do not require samplepreparation. The first applications of vibrational spectroscopyduring freeze-drying were based on in situ and invasive FT-IR [14]and NIR spectroscopy [15]. Afterwards, non-invasive monitoring
40 J.G. Rosas et al. / Journal of Pharmaceutical and Biomedical Analysis 97 (2014) 39–46
Table 1Process analytical technologies used for freeze-drying monitoring.
Technology Measurement Invasive Year Reference
(a) Classical technologiesMass spectrometry or residual gas analysis (RGA) Residual gas Non 1980 2Dewpoint sensor Moisture content Yes 1989 3Resistance thermal detectors Product temperature Yes 1997 4Pressure measurement systems (Pirani gauges, capacitancemanometers, and thermocouple gauges)
Chamber pressure Non 1997 4
Manometric temperature measurement (MTM) Product temperature Non 1997 5Thermodynamic lyophilization control (TLC) Ice temperature Non 2000 6Weighing systems (microbalance) Loss of weight of sample Non 2001 7Tunable diode laser absorption spectroscopy (TDLAS) Absorption of radiation Non 2006 8Thermocouples Product temperature Yes 2008 9Temperature remote interrogation system (TEMPRIS) Product temperature Yes 2009 10Plasma emission spectroscopy (cold plasma ionization device) Chamber moisture content Non 2009 11Dynamic parameters estimation (DPE) model Product temperature Non 2009 10Soft-sensor (Kalman filters) Product temperature Yes 2009 10Neuro-evolutive technique Temperature and the residual ice content Non 2012 12
Objectives Chemometricmethoda
Year Reference
(b) Vibrational spectroscopic (only in-line and non-invasive approaches)Raman To evaluate the feasibility of Raman spectroscopy for monitor
crystallization and polymorphic transformations of mannitol duringfreeze-drying
PCA 2007 13
Raman To evaluate the suitability of the technique for the in-line andreal-time monitoring of freeze-drying processes
PCAMCR
2007 16
Raman and NIR To use Raman and NIR spectroscopy simultaneously for the in-line andreal-time monitoring of a freeze-drying process.
PCAMCR
2009 17
Raman and NIR To demonstrate the importance of using complementary processanalysers (PAT tools) for the process monitoring, analysis, andunderstanding of freeze drying
PCAMCR
2009 11
Raman To elucidate the mechanisms of controlled crystallization duringfreeze-drying.
PCA 2010 18
NIR To assess whether NIRS may provide relevant information on proteinstability and on the influence of lyoprotectants during freeze-drying
AWA 2012 19
NIR To evaluate the feasibility of using multipoint NIR spectroscopy forin-line moisture content quantification during a freeze-drying process
PLS 2013 20
Raman To use Raman spectroscopy coupled microscale platform forfreeze-drying and real time analysis of aqueous mannitol solutions
PCACLS
2013 21
rent w
atosciialcslc
aietcauimsacs
and semiquantitative analyze of its solid-state.
a Principal component analysis (PCA); multivariate curve resolution (MCR); appa
pproaches based on Raman [11,13,16–18,21] and NIR spec-roscopy [11,16,17,19,20] have been used. One of the advantagesf Raman spectroscopy over NIR spectroscopy is that Ramanpectra generally contain sharp bands by which the individualomponents of the measured product can easily be distinguishedn the spectra, making it relatively easy to obtain information onndividual components during processing. However, liquid waternd ice are weak Raman scatterers making Raman spectroscopyess suitable for gaining information on liquid water and icehanges during processing. As ice produces strong signals in NIRpectra (often overwhelming the signals of the freeze-dried formu-ation), Raman and NIR spectroscopy can be considered as usefulomplementary tools for monitoring freeze-drying processes.
The aim of this work is to examine whether NIR spectroscopyllows in-line monitoring of the behaviour of all components dur-ng the entire freeze-drying process of a multi-component system,ven during the freezing phase where ice is expected to overwhelmhe signals from the other components in the spectra. In order tohallenge the analytical technology, a multi-component system of
previously developed process was used [18,22]. This process wassed to prepare drug nanocrystals from lipophilic drugs in order to
mprove their dissolution behaviour. During this process, a complexulti-component system comprising, fenofibrate (model drug sub-
tance), tertiary-butyl alcohol (solvent), mannitol (matrix material)nd water (solvent) was used. To extract useful information of allomponents in the formulation from the large multivariate data-ets obtained during in-line NIRS spectroscopic monitoring, several
ater absorbance (AWA); partial least squares (PLS); classical least-squares (CLS).
spectral pre-processing techniques and spectral data analysis tech-niques, such as mean of selected wavenumbers (Mws), correlationcoefficient (CorrCoef) and principal component analysis (PCA) havebeen examined and compared. Freeze-drying was performed atfour different process conditions to investigate whether the applieddata-analysis methods were able to differentiate between changesin the process settings influencing the freeze-drying process of theformulation.
2. Materials and methods
2.1. Materials
Fenofibrate and tertiary-butyl alcohol (TBA) were obtained fromSigma–Aldrich Chemie (B.V. Zwijndrecht, The Netherlands). Man-nitol was purchased from VWR international (Fontenay sous Bois,France).
2.2. Process description
The freeze-drying experiments were performed using an AmscoFINN-AQUA GT4 freeze dryer (GEA, Köln, Germany). Fenofibratewas dissolved in TBA (25 mg/ml) and mannitol in water (31 mg/ml).
Both solutions were then heated to approximately 60 ◦C and 2.4 mlof the aqueous solution was mixed with 1.6 ml of the TBA solution.Immediately after mixing, the vials were frozen by either shelf-ramped freezing (slow freezing) or by placing them on a pre-cooled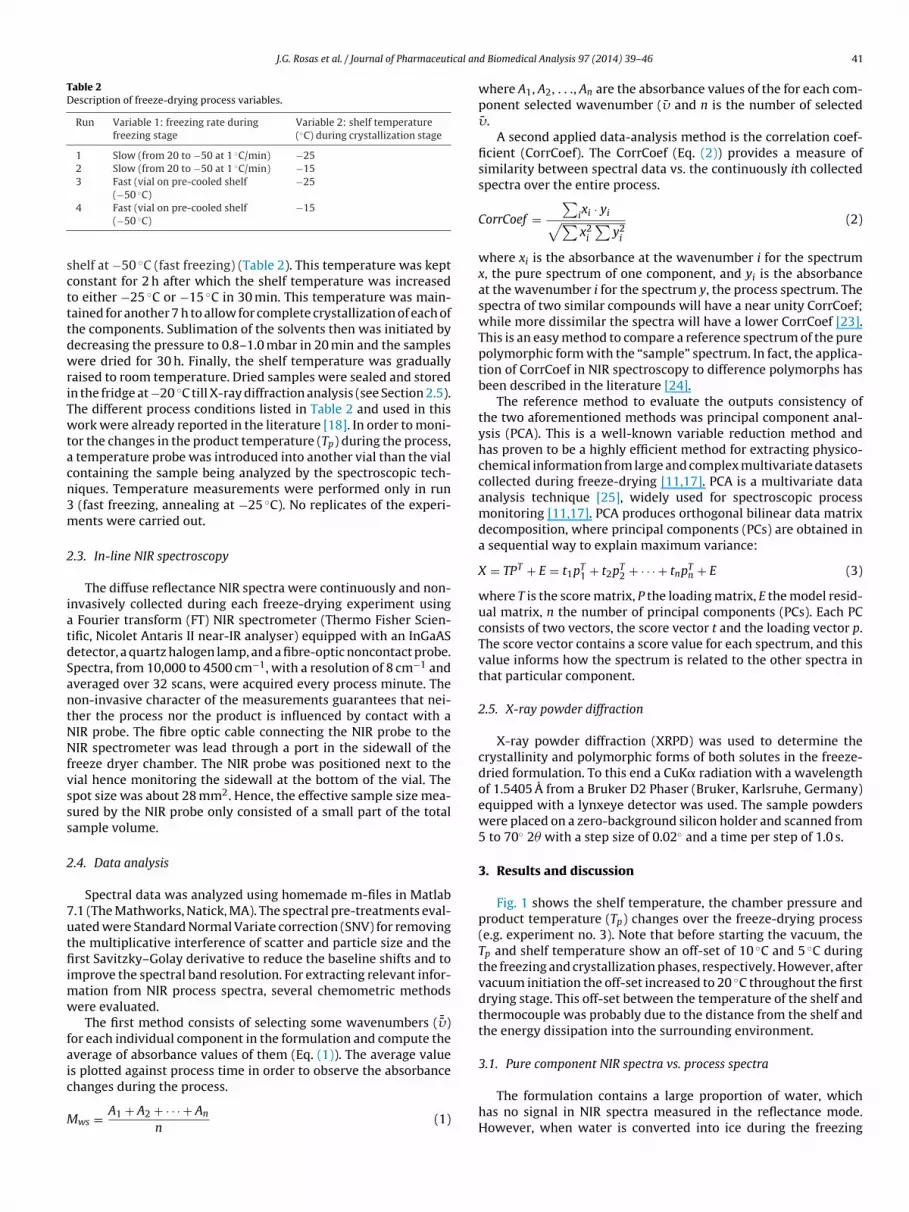
J.G. Rosas et al. / Journal of Pharmaceutical an
Table 2Description of freeze-drying process variables.
Run Variable 1: freezing rate duringfreezing stage
Variable 2: shelf temperature(◦C) during crystallization stage
1 Slow (from 20 to −50 at 1 ◦C/min) −252 Slow (from 20 to −50 at 1 ◦C/min) −153 Fast (vial on pre-cooled shelf
(−50 ◦C)−25
sctttdwriTwtacn3m
2
iatdSantNNfvsss
2
7utfiimw
faic
M
4 Fast (vial on pre-cooled shelf(−50 ◦C)
−15
helf at −50 ◦C (fast freezing) (Table 2). This temperature was keptonstant for 2 h after which the shelf temperature was increasedo either −25 ◦C or −15 ◦C in 30 min. This temperature was main-ained for another 7 h to allow for complete crystallization of each ofhe components. Sublimation of the solvents then was initiated byecreasing the pressure to 0.8–1.0 mbar in 20 min and the samplesere dried for 30 h. Finally, the shelf temperature was gradually
aised to room temperature. Dried samples were sealed and storedn the fridge at −20 ◦C till X-ray diffraction analysis (see Section 2.5).he different process conditions listed in Table 2 and used in thisork were already reported in the literature [18]. In order to moni-
or the changes in the product temperature (Tp) during the process, temperature probe was introduced into another vial than the vialontaining the sample being analyzed by the spectroscopic tech-iques. Temperature measurements were performed only in run
(fast freezing, annealing at −25 ◦C). No replicates of the experi-ents were carried out.
.3. In-line NIR spectroscopy
The diffuse reflectance NIR spectra were continuously and non-nvasively collected during each freeze-drying experiment using
Fourier transform (FT) NIR spectrometer (Thermo Fisher Scien-ific, Nicolet Antaris II near-IR analyser) equipped with an InGaASetector, a quartz halogen lamp, and a fibre-optic noncontact probe.pectra, from 10,000 to 4500 cm−1, with a resolution of 8 cm−1 andveraged over 32 scans, were acquired every process minute. Theon-invasive character of the measurements guarantees that nei-her the process nor the product is influenced by contact with aIR probe. The fibre optic cable connecting the NIR probe to theIR spectrometer was lead through a port in the sidewall of the
reeze dryer chamber. The NIR probe was positioned next to theial hence monitoring the sidewall at the bottom of the vial. Thepot size was about 28 mm2. Hence, the effective sample size mea-ured by the NIR probe only consisted of a small part of the totalample volume.
.4. Data analysis
Spectral data was analyzed using homemade m-files in Matlab.1 (The Mathworks, Natick, MA). The spectral pre-treatments eval-ated were Standard Normal Variate correction (SNV) for removinghe multiplicative interference of scatter and particle size and therst Savitzky–Golay derivative to reduce the baseline shifts and to
mprove the spectral band resolution. For extracting relevant infor-ation from NIR process spectra, several chemometric methodsere evaluated.
The first method consists of selecting some wavenumbers ( ¯�)or each individual component in the formulation and compute theverage of absorbance values of them (Eq. (1)). The average values plotted against process time in order to observe the absorbance
hanges during the process.ws = A1 + A2 + · · · + An
n(1)
d Biomedical Analysis 97 (2014) 39–46 41
where A1, A2, . . ., An are the absorbance values of the for each com-ponent selected wavenumber ( � and n is the number of selected�.
A second applied data-analysis method is the correlation coef-ficient (CorrCoef). The CorrCoef (Eq. (2)) provides a measure ofsimilarity between spectral data vs. the continuously ith collectedspectra over the entire process.
CorrCoef =∑
ixi · yi√∑x2
i
∑y2
i
(2)
where xi is the absorbance at the wavenumber i for the spectrumx, the pure spectrum of one component, and yi is the absorbanceat the wavenumber i for the spectrum y, the process spectrum. Thespectra of two similar compounds will have a near unity CorrCoef;while more dissimilar the spectra will have a lower CorrCoef [23].This is an easy method to compare a reference spectrum of the purepolymorphic form with the “sample” spectrum. In fact, the applica-tion of CorrCoef in NIR spectroscopy to difference polymorphs hasbeen described in the literature [24].
The reference method to evaluate the outputs consistency ofthe two aforementioned methods was principal component anal-ysis (PCA). This is a well-known variable reduction method andhas proven to be a highly efficient method for extracting physico-chemical information from large and complex multivariate datasetscollected during freeze-drying [11,17]. PCA is a multivariate dataanalysis technique [25], widely used for spectroscopic processmonitoring [11,17]. PCA produces orthogonal bilinear data matrixdecomposition, where principal components (PCs) are obtained ina sequential way to explain maximum variance:
X = TPT + E = t1pT1 + t2pT
2 + · · · + tnpTn + E (3)
where T is the score matrix, P the loading matrix, E the model resid-ual matrix, n the number of principal components (PCs). Each PCconsists of two vectors, the score vector t and the loading vector p.The score vector contains a score value for each spectrum, and thisvalue informs how the spectrum is related to the other spectra inthat particular component.
2.5. X-ray powder diffraction
X-ray powder diffraction (XRPD) was used to determine thecrystallinity and polymorphic forms of both solutes in the freeze-dried formulation. To this end a CuK� radiation with a wavelengthof 1.5405 A from a Bruker D2 Phaser (Bruker, Karlsruhe, Germany)equipped with a lynxeye detector was used. The sample powderswere placed on a zero-background silicon holder and scanned from5 to 70◦ 2� with a step size of 0.02◦ and a time per step of 1.0 s.
3. Results and discussion
Fig. 1 shows the shelf temperature, the chamber pressure andproduct temperature (Tp) changes over the freeze-drying process(e.g. experiment no. 3). Note that before starting the vacuum, theTp and shelf temperature show an off-set of 10 ◦C and 5 ◦C duringthe freezing and crystallization phases, respectively. However, aftervacuum initiation the off-set increased to 20 ◦C throughout the firstdrying stage. This off-set between the temperature of the shelf andthermocouple was probably due to the distance from the shelf andthe energy dissipation into the surrounding environment.
3.1. Pure component NIR spectra vs. process spectra
The formulation contains a large proportion of water, whichhas no signal in NIR spectra measured in the reflectance mode.However, when water is converted into ice during the freezing
42 J.G. Rosas et al. / Journal of Pharmaceutical an
1 2 3 4 5 6
0 50 0 1000 15 00 200 0 25000
200
400
600
800
1000
Time (min )
Set
cha
mbe
r pre
ssur
e (m
bar)
-40
-20
0
20
40
60
Chambe r pressure
Temp. shel f
Temp. produc t
Temperature (ºC
)
Fig. 1. Plot of the process conditions (shelf temperature and chamber pressure)combined with Tp (temperature of product) during an entire freeze-drying pro-cess (experiment no. 3). Process phases: 1 – freezing, 2 – ramping to crystallizationtemperature, 3 – crystallization, 4 – primary drying, 5 – secondary drying, and 6 –program end.
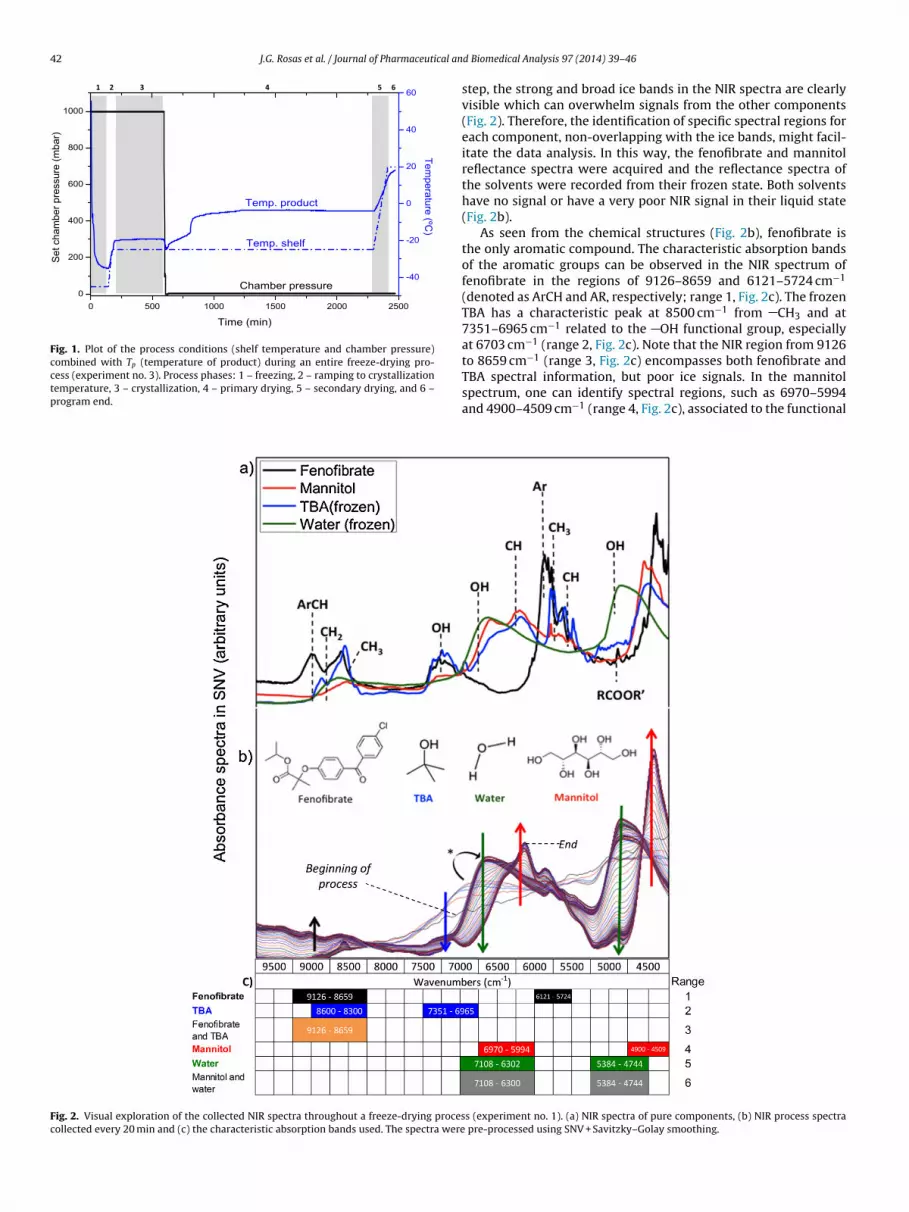
Fig. 2. Visual exploration of the collected NIR spectra throughout a freeze-drying procescollected every 20 min and (c) the characteristic absorption bands used. The spectra were
d Biomedical Analysis 97 (2014) 39–46
step, the strong and broad ice bands in the NIR spectra are clearlyvisible which can overwhelm signals from the other components(Fig. 2). Therefore, the identification of specific spectral regions foreach component, non-overlapping with the ice bands, might facil-itate the data analysis. In this way, the fenofibrate and mannitolreflectance spectra were acquired and the reflectance spectra ofthe solvents were recorded from their frozen state. Both solventshave no signal or have a very poor NIR signal in their liquid state(Fig. 2b).
As seen from the chemical structures (Fig. 2b), fenofibrate isthe only aromatic compound. The characteristic absorption bandsof the aromatic groups can be observed in the NIR spectrum offenofibrate in the regions of 9126–8659 and 6121–5724 cm−1
(denoted as ArCH and AR, respectively; range 1, Fig. 2c). The frozenTBA has a characteristic peak at 8500 cm−1 from CH3 and at7351–6965 cm−1 related to the OH functional group, especiallyat 6703 cm−1 (range 2, Fig. 2c). Note that the NIR region from 9126to 8659 cm−1 (range 3, Fig. 2c) encompasses both fenofibrate and
TBA spectral information, but poor ice signals. In the mannitolspectrum, one can identify spectral regions, such as 6970–5994and 4900–4509 cm−1 (range 4, Fig. 2c), associated to the functionals (experiment no. 1). (a) NIR spectra of pure components, (b) NIR process spectra pre-processed using SNV + Savitzky–Golay smoothing.
J.G. Rosas et al. / Journal of Pharmaceutical and Biomedical Analysis 97 (2014) 39–46 43
F d (b) sS resena
gmae6
di�saadntpr
3p
ehaf7w(oS
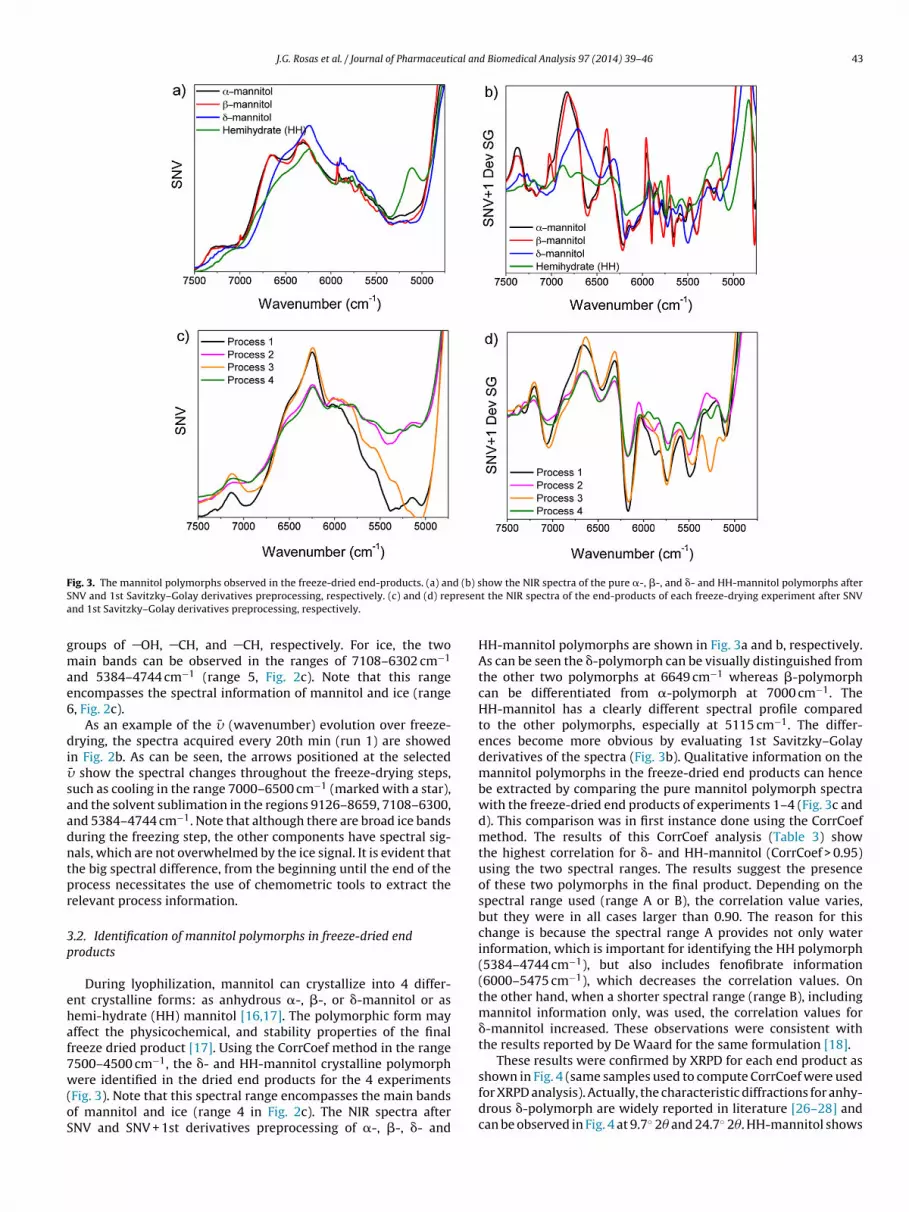
ig. 3. The mannitol polymorphs observed in the freeze-dried end-products. (a) anNV and 1st Savitzky–Golay derivatives preprocessing, respectively. (c) and (d) repnd 1st Savitzky–Golay derivatives preprocessing, respectively.
roups of OH, CH, and CH, respectively. For ice, the twoain bands can be observed in the ranges of 7108–6302 cm−1
nd 5384–4744 cm−1 (range 5, Fig. 2c). Note that this rangencompasses the spectral information of mannitol and ice (range, Fig. 2c).
As an example of the � (wavenumber) evolution over freeze-rying, the spectra acquired every 20th min (run 1) are showed
n Fig. 2b. As can be seen, the arrows positioned at the selected¯ show the spectral changes throughout the freeze-drying steps,uch as cooling in the range 7000–6500 cm−1 (marked with a star),nd the solvent sublimation in the regions 9126–8659, 7108–6300,nd 5384–4744 cm−1. Note that although there are broad ice bandsuring the freezing step, the other components have spectral sig-als, which are not overwhelmed by the ice signal. It is evident thathe big spectral difference, from the beginning until the end of therocess necessitates the use of chemometric tools to extract theelevant process information.
.2. Identification of mannitol polymorphs in freeze-dried endroducts
During lyophilization, mannitol can crystallize into 4 differ-nt crystalline forms: as anhydrous �-, �-, or �-mannitol or asemi-hydrate (HH) mannitol [16,17]. The polymorphic form mayffect the physicochemical, and stability properties of the finalreeze dried product [17]. Using the CorrCoef method in the range500–4500 cm−1, the �- and HH-mannitol crystalline polymorph
ere identified in the dried end products for the 4 experimentsFig. 3). Note that this spectral range encompasses the main bandsf mannitol and ice (range 4 in Fig. 2c). The NIR spectra afterNV and SNV + 1st derivatives preprocessing of �-, �-, �- and
how the NIR spectra of the pure �-, �-, and �- and HH-mannitol polymorphs aftert the NIR spectra of the end-products of each freeze-drying experiment after SNV
HH-mannitol polymorphs are shown in Fig. 3a and b, respectively.As can be seen the �-polymorph can be visually distinguished fromthe other two polymorphs at 6649 cm−1 whereas �-polymorphcan be differentiated from �-polymorph at 7000 cm−1. TheHH-mannitol has a clearly different spectral profile comparedto the other polymorphs, especially at 5115 cm−1. The differ-ences become more obvious by evaluating 1st Savitzky–Golayderivatives of the spectra (Fig. 3b). Qualitative information on themannitol polymorphs in the freeze-dried end products can hencebe extracted by comparing the pure mannitol polymorph spectrawith the freeze-dried end products of experiments 1–4 (Fig. 3c andd). This comparison was in first instance done using the CorrCoefmethod. The results of this CorrCoef analysis (Table 3) showthe highest correlation for �- and HH-mannitol (CorrCoef > 0.95)using the two spectral ranges. The results suggest the presenceof these two polymorphs in the final product. Depending on thespectral range used (range A or B), the correlation value varies,but they were in all cases larger than 0.90. The reason for thischange is because the spectral range A provides not only waterinformation, which is important for identifying the HH polymorph(5384–4744 cm−1), but also includes fenofibrate information(6000–5475 cm−1), which decreases the correlation values. Onthe other hand, when a shorter spectral range (range B), includingmannitol information only, was used, the correlation values for�-mannitol increased. These observations were consistent withthe results reported by De Waard for the same formulation [18].
These results were confirmed by XRPD for each end product as
shown in Fig. 4 (same samples used to compute CorrCoef were usedfor XRPD analysis). Actually, the characteristic diffractions for anhy-drous �-polymorph are widely reported in literature [26–28] andcan be observed in Fig. 4 at 9.7◦ 2� and 24.7◦ 2�. HH-mannitol shows
44 J.G. Rosas et al. / Journal of Pharmaceutical and Biomedical Analysis 97 (2014) 39–46
Table 3CorrCoef analysis results for mannitol polymorph identification in the freeze-dried end-products (significance at CorrCoef > 0.95).
Spectral range (cm−1) Run Correlation coefficients (in SNV mode)
�-Mannitol �-Mannitol �-Mannitol HH-Mannitol
Range A7500–4500
1 0.91 0.91 0.95 0.902 0.88 0.87 0.90 0.973 0.87 0.87 0.93 0.854 0.87 0.86 0.88 0.96
1 0.87 0.87 0.99 0.96
ctamttaaHtafto�f
3v
cnwHcmcs
FHr
Range B7145–6160
2 0.88
3 0.79
4 0.86
haracteristic diffraction signals at 9.6◦ 2� and 18◦ 2� [27,28]. Fromhese XRPD profiles, one can observe that �-mannitol is present inll end-products and HH-mannitol is found in significant amounts,ainly in the end products of experiments 2 and 4. This indicates,
hat the temperature rise from −50 ◦C to −15 ◦C, independently ofhe freezing rate used, promotes the formation of both �-mannitolnd HH-mannitol. Two other characteristic diffractions at 14.6◦ 2�nd 16.8◦ 2� that one may attribute to �-mannitol were found [28].owever, these peaks correspond also with fenofibrate diffrac-
ions (X-ray diffractions of fenofibrate and mannitol polymorphsre available in De Waard et al. [18]). In the NIR spectra of the dif-erent polymorphs (Fig. 3a) on the other hand, it is clearly observedhat �- and �-mannitol have a peak at 6750 cm−1. This peak is notbserved in the finished products, indicating that there is no �- or-mannitol present and that the two XRPD peaks are originating
rom fenofibrate.
.3. Analysis of in-line collected NIR spectra during freeze-dryingia different data-analysis approaches
Since NIR signals are difficult to be assigned to an individualomponent in a formulation – because of broad overlapping sig-als and complicated combinations of vibrational modes – oneavenumber evaluation of NIR spectra is often unsatisfactory.owever, as aforementioned in Fig. 2, some specific bands for each
omponent in the formulation could be observed. Therefore, theean of specific �, Mws (Eq. (1)) was used to observe the spectralhanges of each component over the freeze-drying processes. Theelected � for each component of the formulation are summarized
ig. 4. The X-ray diffractograms of the 4 freeze-dried end-products, where � andH indicate the characteristic diffraction peaks for delta and hemihydrate mannitol,
espectively.
0.89 0.99 0.970.80 0.96 0.920.86 0.98 0.96
in Table 4. These � were selected in basis on their main chemicalfunctional group in each compound.
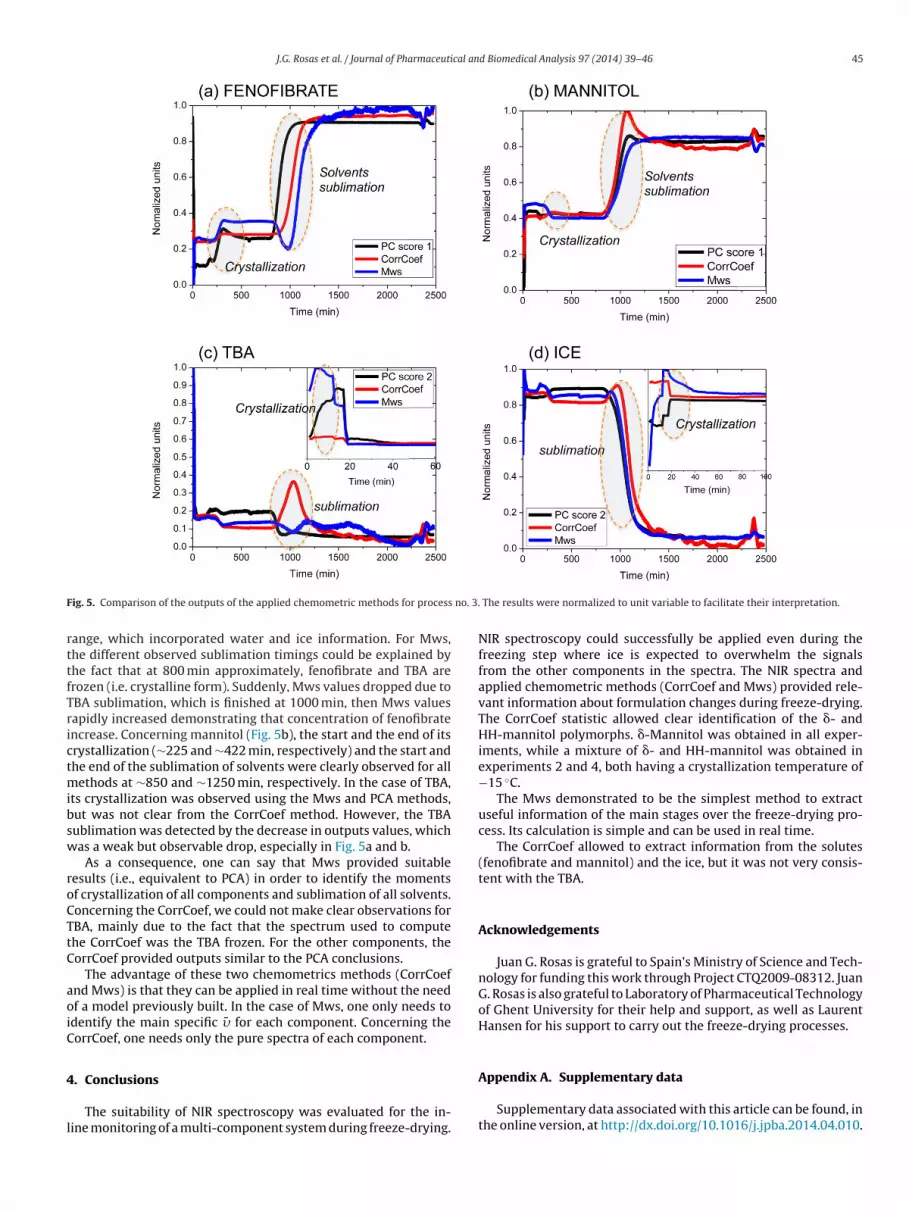
The in-line NIR spectra collected during the four differentfreeze-drying processes were analyzed via different data-analysisapproaches, such as the mean wavenumber (Mws), the CorrCoefand PCA. The exploration of these data-analysis methods intends toevaluate their strengths and weaknesses for analysing the in-linecollected data. The PCA was considered as the reference method,since it is the most widely used multivariate method to extractrelevant information from spectral data. The most importantplots from PCA are showed in the Figs. S1–S3 (SupplementaryMaterial). PCA to extract information of mannitol and ice wereperformed using the spectral range 6 and the others PCAs toextract information on fenofibrate and TBA were performed usingthe spectral ranges 1 and 3 (see Fig. 2 for more details on thesespectral ranges). The plots showed correspond to process no. 3.As can be seen in Fig. S1, the two first loadings explaining morethat 98% of variance are clearly correlated to the pure componentsof formulation. In the scores scatter plots of two first components(Fig. S2) one can observe the main stages of process, and especiallythe moment at which the TBA and water crystallise. Furthermore,the moment at which the solutes crystallizes can be also observed.In order to even better identify the moment at which the sol-vents and solutes crystallise, the product temperature and thescore values were simultaneously plotted (Fig. S3). Note that thecrystallization is observed by an increase of product temperature.As observed, plotting the scores values over the process progressgives information about the physicochemical changes occurringduring the freeze-drying process. These scores values were usedto evaluate the performance of the outputs of Mws and CorrCoefmethods. In order to compare the methods, their outputs werenormalized to variance unit and plotted simultaneously againstprocess time (Fig. 5). The example shown corresponds to processno. 3 and for all components of formulation. As aforementionedfor PCA, the main stages of freeze-drying process were clearlyobserved such as the crystallization of the solvents (i.e. when thesolvent froze) and crystallization of the solutes. The sublimationof solvents was also clearly observed in the plots. Note that usingthe information related to Fenofibrate (Fig. 5a) the beginning ofsolvent sublimation was observed at different times. This is caused
by the fact that PCA model was built only with the fenofibrateand TBA spectral ranges. In the case of CorrCoef, the informationof sublimation was taken into account from a larger spectralTable 4The selected wavenumbers for each component.
Component Wavenumber (cm−1)
Fenofibrate 8910 (ArCH ), 6028, (Ar ) 5940 (CH3 ) and 5809 (CH )Mannitol 6541 (CH ), 6237 (CH3 ), 5897 (CH ) and 4678 (OH )Ice 6707 (OH ) and 5099 (OH )TBA 8427 (CH3 ), 7247 (OH ) and 6977 (OH )
J.G. Rosas et al. / Journal of Pharmaceutical and Biomedical Analysis 97 (2014) 39–46 45
F no. 3.
rttfTrictmibsw
roCTtC
aoiC
4
l
ig. 5. Comparison of the outputs of the applied chemometric methods for process
ange, which incorporated water and ice information. For Mws,he different observed sublimation timings could be explained byhe fact that at 800 min approximately, fenofibrate and TBA arerozen (i.e. crystalline form). Suddenly, Mws values dropped due toBA sublimation, which is finished at 1000 min, then Mws valuesapidly increased demonstrating that concentration of fenofibratencrease. Concerning mannitol (Fig. 5b), the start and the end of itsrystallization (∼225 and ∼422 min, respectively) and the start andhe end of the sublimation of solvents were clearly observed for all
ethods at ∼850 and ∼1250 min, respectively. In the case of TBA,ts crystallization was observed using the Mws and PCA methods,ut was not clear from the CorrCoef method. However, the TBAublimation was detected by the decrease in outputs values, whichas a weak but observable drop, especially in Fig. 5a and b.
As a consequence, one can say that Mws provided suitableesults (i.e., equivalent to PCA) in order to identify the momentsf crystallization of all components and sublimation of all solvents.oncerning the CorrCoef, we could not make clear observations forBA, mainly due to the fact that the spectrum used to computehe CorrCoef was the TBA frozen. For the other components, theorrCoef provided outputs similar to the PCA conclusions.
The advantage of these two chemometrics methods (CorrCoefnd Mws) is that they can be applied in real time without the needf a model previously built. In the case of Mws, one only needs todentify the main specific � for each component. Concerning theorrCoef, one needs only the pure spectra of each component.
. Conclusions
The suitability of NIR spectroscopy was evaluated for the in-ine monitoring of a multi-component system during freeze-drying.
The results were normalized to unit variable to facilitate their interpretation.
NIR spectroscopy could successfully be applied even during thefreezing step where ice is expected to overwhelm the signalsfrom the other components in the spectra. The NIR spectra andapplied chemometric methods (CorrCoef and Mws) provided rele-vant information about formulation changes during freeze-drying.The CorrCoef statistic allowed clear identification of the �- andHH-mannitol polymorphs. �-Mannitol was obtained in all exper-iments, while a mixture of �- and HH-mannitol was obtained inexperiments 2 and 4, both having a crystallization temperature of−15 ◦C.
The Mws demonstrated to be the simplest method to extractuseful information of the main stages over the freeze-drying pro-cess. Its calculation is simple and can be used in real time.
The CorrCoef allowed to extract information from the solutes(fenofibrate and mannitol) and the ice, but it was not very consis-tent with the TBA.
Acknowledgements
Juan G. Rosas is grateful to Spain’s Ministry of Science and Tech-nology for funding this work through Project CTQ2009-08312. JuanG. Rosas is also grateful to Laboratory of Pharmaceutical Technologyof Ghent University for their help and support, as well as LaurentHansen for his support to carry out the freeze-drying processes.
Appendix A. Supplementary data
Supplementary data associated with this article can be found, inthe online version, at http://dx.doi.org/10.1016/j.jpba.2014.04.010.
4 cal an
R
[
[
[
[
[
[
[
[
[
[
[
[
[
[
[
[
[
[
6 J.G. Rosas et al. / Journal of Pharmaceuti
eferences
[1] T. De Beer, A. Burggraeve, M. Fonteyne, L. Saerens, J.P. Remon, C. Vervaet, Nearinfrared and Raman spectroscopy for the in-process monitoring of pharmaceu-tical production processes, Int. J. Pharm. 417 (2011) 32–47.
[2] T. Jennings, J. Parenter, Residual gas analysis and vacuum freeze drying, Drug.Assoc. 34 (1980) 62–69.
[3] M. Roy, M. Pikal, Process control in freeze drying: determination of the endpoint of sublimation drying by an electronic moisture sensor, J. Parenter. Sci.Technol. 43 (1989) 60–66.
[4] N. Milton, M.J. Pikal, M.L. Roy, S.L. Nail, Evaluation of manometric temper-ature measurement as a method of monitoring product temperature duringlyophilization, PDA J. Pharm. Sci. Technol. 51 (1997) 7–16.
[5] P. Cameron, Good Pharmaceutical Freeze-Drying Practice, Interpharm PressInc., New York, 1997.
[6] G. Oetjen, P. Haseley, K. Klutsch, M. Leineweber, in, United States Patent Num-ber 6163979, 2000.
[7] C. Roth, G. Winter, G. Lee, Continuous measurement of drying rate of crystallineand amorphous systems during freeze-drying using an in situ microbalancetechnique, J. Pharm. Sci. 90 (2001) 1345–1355.
[8] M. Druy, From laboratory technique to process gas sensor: the maturation oftunable diode laser absorption spectroscopy, Spectroscopy 1 (2006) 1–4.
[9] S. Schneid, H. Gieseler, Evaluation of a new wireless temperature remote inter-rogation system (TEMPRIS) to measure product temperature during freezedrying, AAPS PharmSciTech 9 (2008) 729–739.
10] S. Velardi, H. Hammouri, In-line monitoring of the primary drying phase of thefreeze-drying process in vial by means of a Kalman filter based observer, Chem.Eng. Res. Des. 87 (2009) 1409–1419.
11] T.R.M. De Beer, M. Wiggenhorn, R. Veillon, C. Debacq, Y. Mayeresse, B. Moreau,A. Burggraeve, T. Quinten, W. Friess, G. Winter, C. Vervaet, J.P. Remon, W.R.G.Baeyens, Importance of using complementary process analyzers for the processmonitoring, analysis and understanding of freeze drying, Anal. Chem. 81 (2009)7639–7649.
12] E. Dragoi, S. Curteanu, D. Fissore, Freeze-drying modeling and monitoring usinga new neuro-evolutive technique, Chem. Eng. Sci. 72 (2012) 195–204.
13] S. Romero-Torres, H. Wikström, E. Grant, L. Taylor, Monitoring of mannitolphase behavior during freeze-drying using non-invasive Raman spectroscopy,PDA J. Pharm. Sci. Technol. 61 (2007) 131–145.
14] R. Remmele, C. Stushnoff, J. Carpenter, Real-time in situ monitoring of lysozyme
during lyophilization using infrared spectroscopy dehydration stress in thepresence of sucrose, Pharm. Res. 14 (1997) 1548–1555.15] M. Brülls, S. Folestad, A. Sparen, A. Rasmuson, In-situ near-infrared spec-troscopy monitoring of the lyophilization process, Pharm. Res. 20 (2003)494–499.
[
d Biomedical Analysis 97 (2014) 39–46
16] T.R.M. De Beer, M. Allesø, F. Goethals, A. Coppens, Y. Vander Heyden, H. LopezDe Diego, J. Rantanen, F. Verpoort, C. Vervaet, J.P. Remon, W.R.G. Baeyens,Implementation of a process analytical technology system in a freeze-dryingprocess using Raman spectroscopy for in-line process monitoring, Anal. Chem.79 (2007) 7992–8003.
17] T.R.M. De Beer, P. Vercruysse, A. Burggraeve, T. Quinten, J. Ouyang, X. Zhang, C.Vervaet, J.P. Remon, W.R. Baeyens, In-line and real-time process monitoring ofa freeze drying process using Raman and NIR spectroscopy as complementaryprocess analytical technology (PAT) tools, J. Pharm. Sci. 98 (2009) 3430–3446.
18] H. de Waard, T. De Beer, W.L.J. Hinrichs, C. Vervaet, J.-P. Remon, H.W. Frijlink,Controlled crystallization of the lipophilic drug fenofibrate during freeze-drying: elucidation of the mechanism by in-line Raman spectroscopy, AAPSJ. (2010).
19] S. Pieters, T. De Beer, J.C. Kasper, D. Boulpaep, O. Waszkiewicz, M. Goodarzi,C. Tistaert, W. Friess, J.P. Remon, C. Vervaet, Y. Van der Heyden, Near-infraredspectroscopy for in-line monitoring of protein unfolding and its interactionswith lyoprotectants during freeze-drying, Anal. Chem. 84 (2012) 947–955.
20] A. Kauppinen, M. Toiviainen, O. Korhonen, J. Aaltonen, K. Järvinen, J. Paaso, M.Juuti, J. Ketolainen, In-line multipoint near-infrared spectroscopy for moisturecontent quantification during freeze-drying, Anal. Chem. 85 (2013) 2377–2384.
21] A. Kauppinen, M. Toiviainen, J. Aaltonen, O. Korhonen, K. Jarvinen, M. Juuti, R.Pellinen, J. Ketolainen, Microscale freeze-drying with Raman spectroscopy as atool for process development, Anal. Chem. 85 (2013) 2109–2116.
22] H. de Waard, W.L.J. Hinrichs, H.W. Frijlink, Preparation of drug nanocrystalsby controlled crystallization: application of a 3-way nozzle to prevent prema-ture crystallization for large scale production, J. Control. Release 128 (2008)179–183.
23] A.G. Asuero, A. Sayago, A.G. Gonzalez, The correlation coefficient: an overview,Crit. Rev. Anal. Chem. 36 (2006) 41–59.
24] M. Blanco, M. Alcala, J.M. González, E. Torras, NIR spectroscopy in the study ofpolymorphic transformations, Anal. Chim. Acta 567 (2006) 262–268.
25] D.L. Massart, B.G.M. Vandeginste, L.M.C. Buydens, S. De Jong, P.J. Lewis, J.Smeyers-Verbeke, Handbook of Chemometrics and qualimetrics: Part A, Else-vier, Amsterdam, 1997.
26] L. Yu, N. Milton, E.G. Groleau, D.S. Mishra, R.E. Vansickle, Existence of a mannitolhydrate during freeze-drying and practical implications, J. Pharm. Sci. 88 (1999)196–198.
27] Y. Xie, W. Cao, S. Krishnan, H. Lin, N. Cauchon, Characterization of mannitolpolymorphic forms in lyophilized protein formulations using a multivariate
curve resolution (MCR)-based Raman spectroscopic method, Pharm. Res. 25(2008) 2292–2301.28] H. Grohganz, D. Gildemyn, E. Skibsted, J.M. Flink, J. Rantanen, Rapid solid-stateanalysis of freeze-dried protein formulations using NIR and Raman spectros-copies, J. Pharm. Sci. 100 (2011) 2871–2875.


