Embed Size (px)
Citation preview
THE STRUCTURE AND CONDUCT OF THE MARKET FOR COOKING BANANAS IN KAMPALA CITY,
UGANDA
BYWILBER MIGAYO AINEBYONA
L, ,vVs a $ $ £ -
th*#i# aubmittad in part fulfilmant lor • dagr* of Haatar of Solano* of th* Univaraity of Nairobi
Hay 1968
university OF NA!RQ«'ijpqaRV

P S C L A H A T l O M
I, Wllb*r fflgayo Ainebyona, de-alarm- that this Thesie le
my original work and hie not b M n presented Tor a degrwe
In any other linlveralty.
Signed
This thesis has been subaltted Tor examination with ourapproval b b University Supervisors
Signed . . . ..... .Ov . . . 1
Signed.
Dr. S. e. ffbogoh tUniversity Supervisor)
Dr. N. K ‘ Haiiritis(University Supervisor)

A C K N O W L E D G E M E N T
In the preparation of this study, a great deal of support vas given by various Individuals and Institutions.
My highest gratitude is to ay University Supervisors, Dr. S. O. N bog oh and Dr. H. 1C. Harltla, whose untiring efforts and wealth of knowledge were of Invaluable benefit to are. 1 also appreciate the Inspiration given to ae by other aeabere of staff and graduate studentB of the DepBrtaent of Agricultural Economics, University of Nairobi.
The staff of the Ministry of Agriculture, Entebbe, Uganda, extended Invaluable help to me. To all of thee, 1 owe a debt of gratitude.
The United States Agency for International Development tUSATD) offered me a scholarship at the University of Nairobi and supported me during the study period. The Government of the Republic cf Uganda nominated are for the scholarship and granted are a study leave. It also supported my family while 1 was away. 1 am very grateful for all this.

I would alio lik* t_o txttnd httrlltlt th>nki t.o ay wlfa
Flormncm, for h»r during the period stayed at hoae In
unfailing inspiration and her patience I woe B«ey In Nairobi, Keoya while- she Entebbe, Uganda.
C O N T E N T S
P«flg
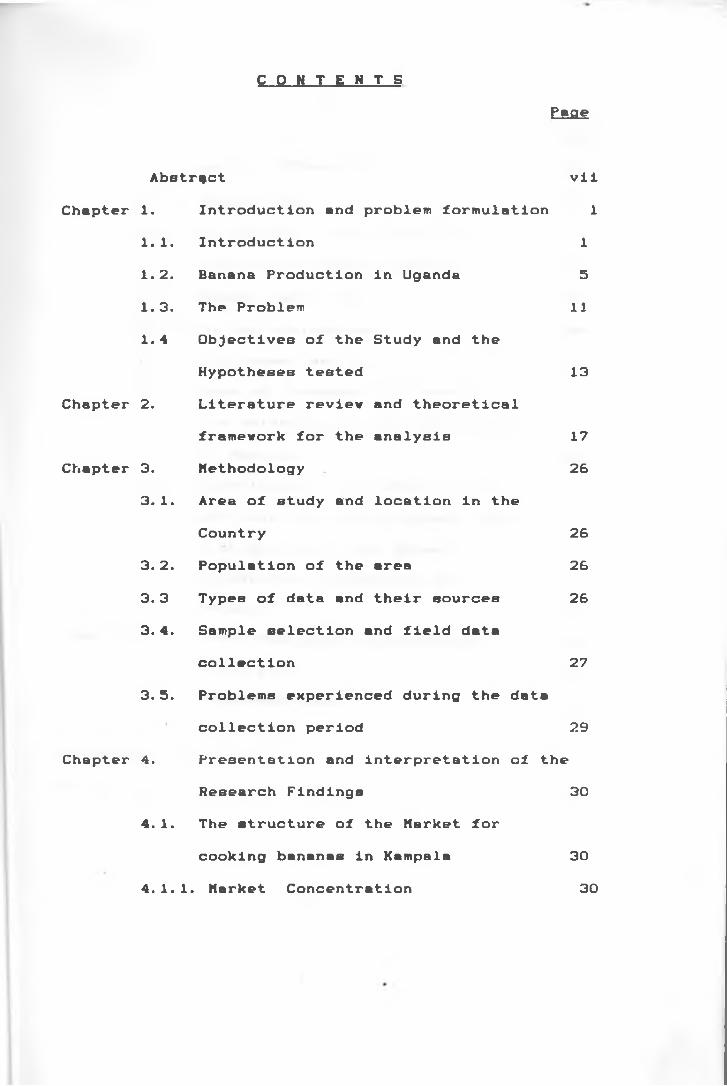
Abstract viiChapter 1. Introduction and problem formulation 1
1.1. Introduction 11.2. Banana Production in Uganda 51.3. The Problem 111.4 Objectives of the Study and the
Hypotheses tested 13Chapter 2. Literature review and theoretical
framework for the analysis 17Chapter 3. Methodology 26
3.1. Area of study and location in theCountry 26
3.2. Population of the area 263.3 Types of data and their sources 263.4. Sample selection and field data
collection 273.5. Problems experienced during the data
collection period 29Chapter 4. Presentation and interpretation of the
Research Findings 304.1. The structure of the Market for
cooking bananas in Kampala 304. 1.1. Market Concentration 30
ii
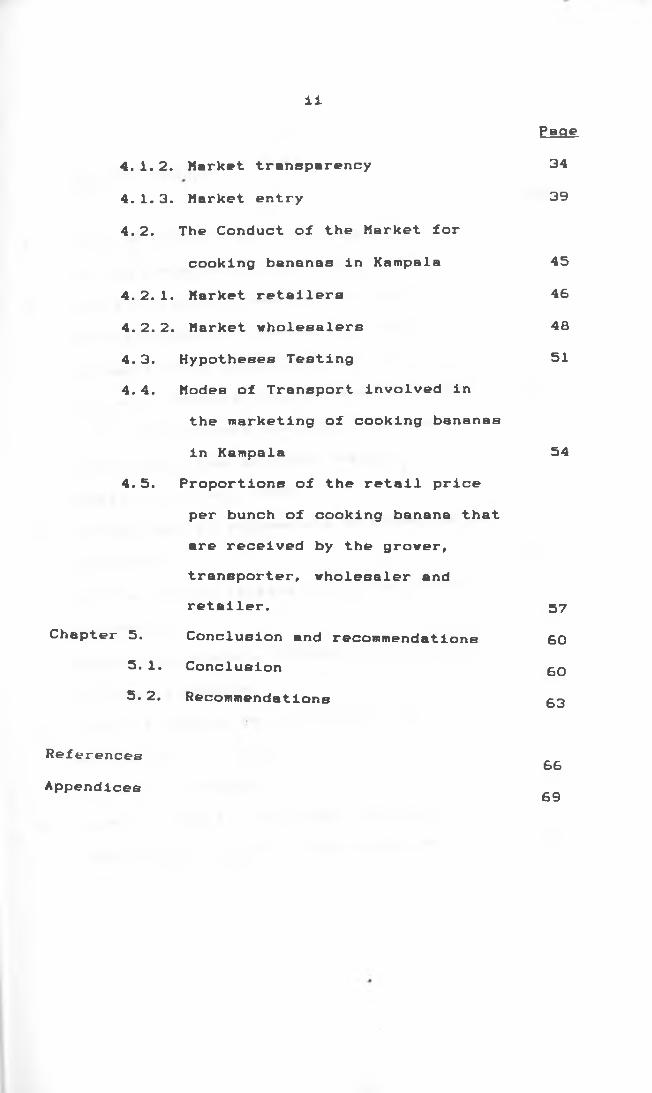
4.1.2. Market transparency 344. 1. 3. Market entry 394.2. The Conduct of the Market for
cooking bananas in Kampala 454.2.1. Market retailers 464.2.2. Market wholesalers 484.3. Hypotheses Testing 514.4. Modes of Transport involved in
the marketing of cooking bananas in Kampala 54
4.5. Proportions of the retail priceper bunch of cooking banana that are received by the grower, transporter, wholesaler and retailer. 5 7
Chapter 5. Conclusion and recommendations SO5.1. Conclusion gg5.2. Recommendations gg
References68
Appendices
Page
69
iii
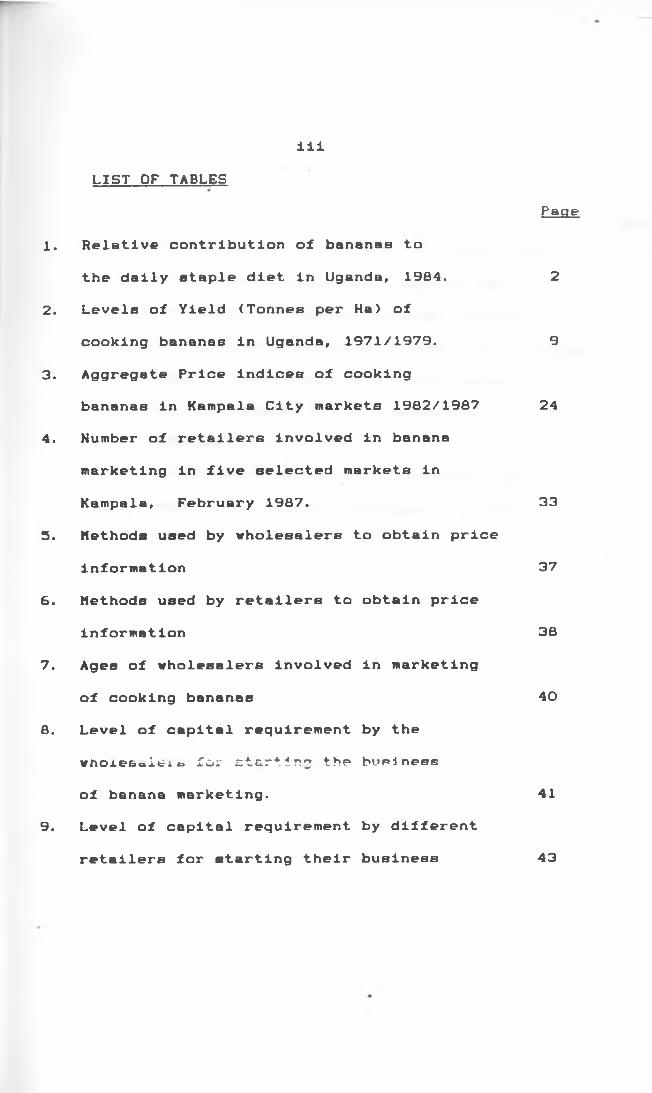
1 . Relative contribution of bananas tothe daily staple diet in Uganda, 1984. 2
2. Levels of Yield (Tonnes per Ha) ofcooking bananas in Uganda, 1971/1979. 9
3. Aggregate Price indices of cookingbananas in Kampala City markets 1982/1987 24
4. Humber of retailers involved in banana marketing in five selected markets inKampala, February 1987. 33
5. Methods used by wholesalers to obtain priceinformation 37
6 . Methods used by retailers to obtain priceinformation 3B
7. Ages of wholesalers involved in marketingof cooking bananas 40
8. Level of capital requirement by the wnoxesaltifa for starting the businessof banana marketing. 41
9. Level of capital requirement by different
LIST OF TABLESPage
retailers for starting their business 43
iv
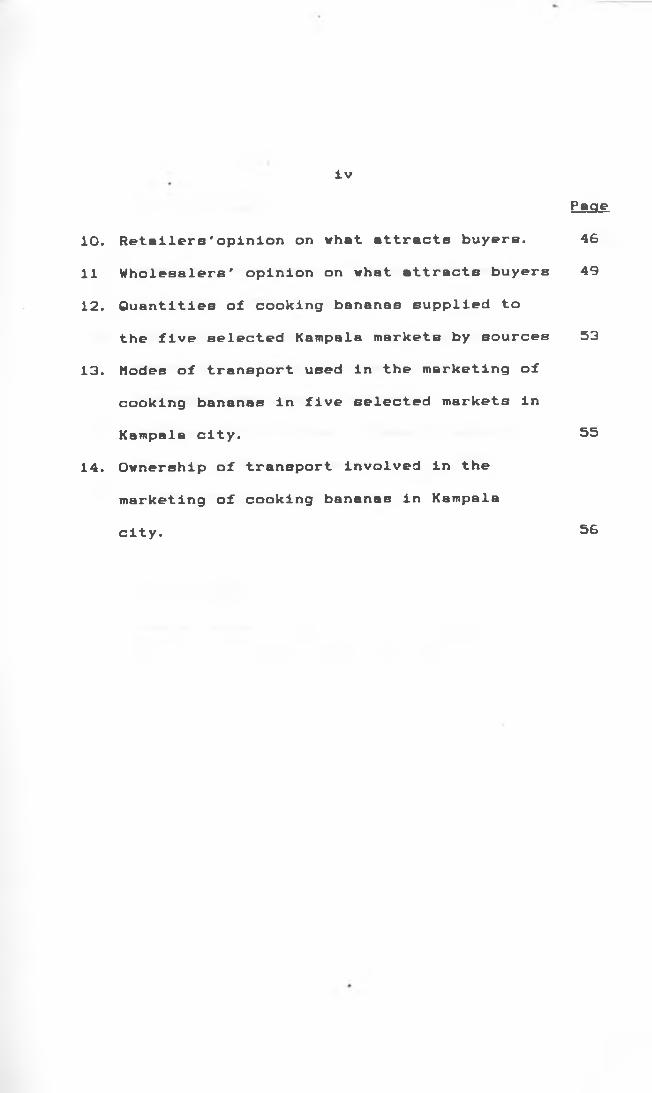
10. Retailers'opinion on what attracts buyers. 4611 Wholesalers' opinion on what attracts buyers 491 2 . Quantities of cooking bananas supplied to
the five selected Kampala markets by sources 5313. Modes of transport used in the marketing of
cooking bananas in five selected markets in Kampala city. 55
14. Ownership of transport involved in the marketing of cooking bananas in Kampalacity. 56
Page
V
Page
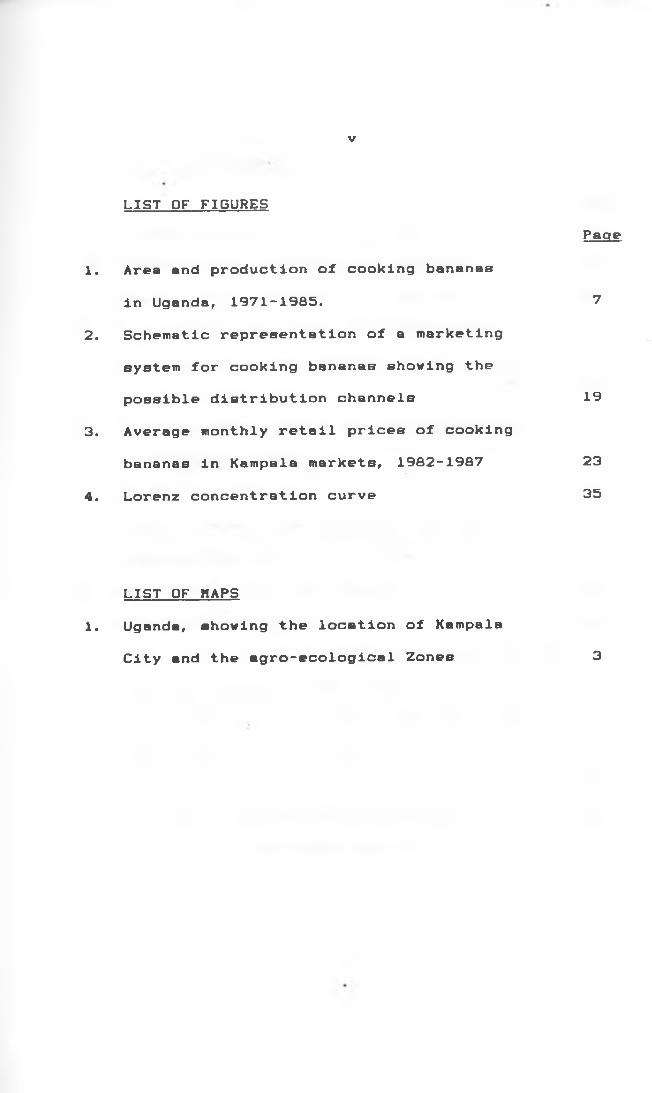
1. Area and production of cooking bananasin Uganda, 1971-1985. 7
2. Schematic representation of a marketingsystem for cooking bananas showing the possible distribution channels 19
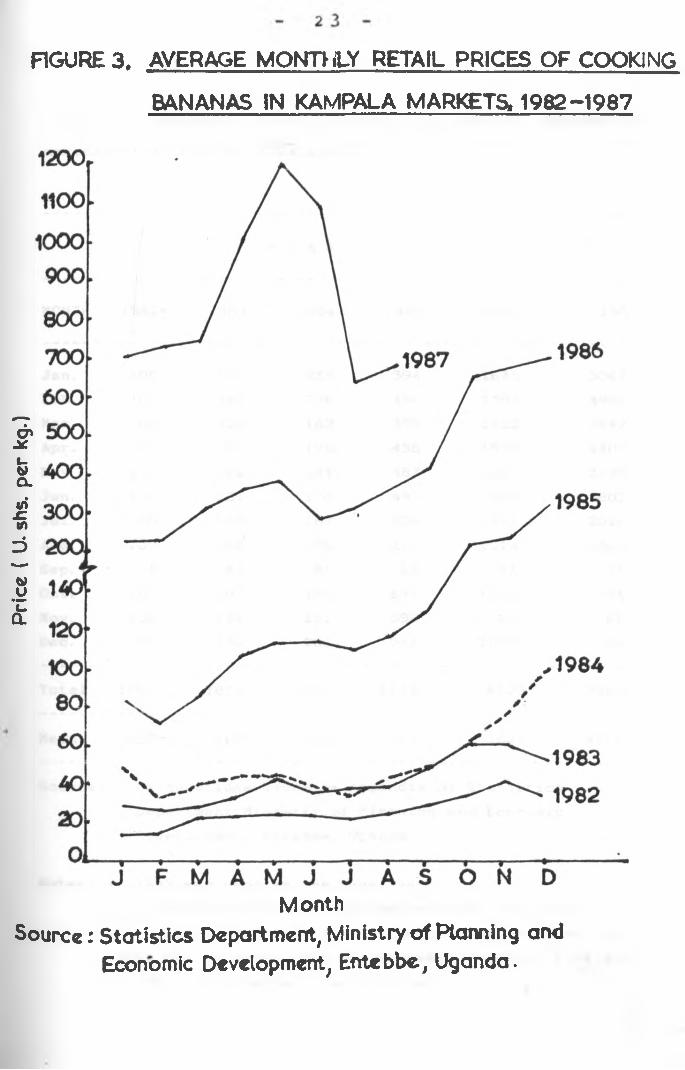
3. Average monthly retail prices of cookingbananas in Kampala markets, 1982-1987 23
4. Lorenz concentration curve 35
LIST OF MAPS1. Uganda, showing the location of Kampala
City and the agro-ecological Zones 3
LIST OF FIGURES
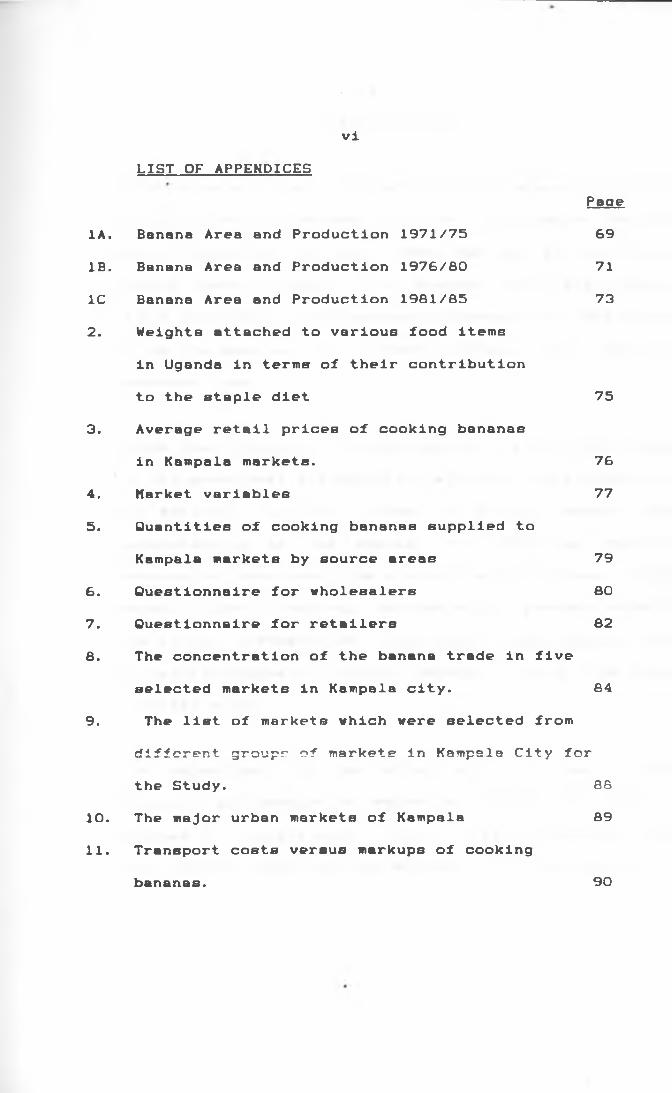
IA. Banana Area and Production 1971/75 69IB. Banana Area and Production 1976/80 711C Banana Area and Production 1981/85 732. Weights attached to various food items
in Uganda in terms of their contributionto the staple diet 75
3. Average retail prices of cooking bananasin Kampala markets. 76
4. Market variables 775. Quantities of cooking bananas supplied to
Kampala markets by source areas 796 . Questionnaire for wholesalers 807. Questionnaire for retailers 828 . The concentration of the banana trade in five
selected markets in Kampala city. 849. The list of markets which were selected from
different group? of markets in Kampala City for the Study. 88
10. The major urban markets of Kampala 8911. Transport costs versus markups of cooking
viLIST OF APPENDICES
Page
bananBB. 90
A B S T R A C T
Cooking bananas are the most Important staple food crop in Uganda with 33 percent of the population in the contry depending on them. There has been an out cry of rising banana prices. For example, the retail price for a bunch of cooking bananas in Kampala City was found to be the same as the minimum official wage rate in November 1986.
Since the prices of cooking bananas are not controlled by the government and marketing system of this commodity is entirely in the hands of private sector, an understanding of the system for marketing cookingbananas is important from a policy point of view. Highretail prices of cooking bananas could greately affect
0
the living standards of those people whose staple diet is mainly composed of cooking bananas. Hence the need for this study.
The objectives of the study were to examine the structure and conduct of marketing system for cooking bananas in Kampala City, with a view to understanding the problems underlying the system. Market structure
vii
v a nVIe evaluated m trrae or M r k r l concentration, tranaparenc^ and barrlera to aarket entry. Barket conduct. of both the wholesalers and retailers w b e
examined. The study also tried to establish the supptly areas and the modes of transport used In the marketing of cooking bananas, so as to be able to assess or underetnad the relationship to prices.
The study relied on both primary and secondary data. Secondary data were obtained from publications and reports of the Blnlstries of Agriculture and Forestry and Planning and Economic Development . Primary datB were obtained through Interviews of traders at different market places In Kampala
The results of the study indicated that:-1. Bany traders are Involved at wholesale level In the
marketing of cooking bananas.:2. Transparency m the market for cooking bananas was
poor.
3. Ho serious barriers to entry exist in the market for cooking bananas.
4. Both the wholesalers and the retailers were determining the prices of cooking bananas throughbargaining
lx3. Trie- banana Market was characterized by collusive
tendencies.
6. Transportation In the Marketing or cooking bananas Involved hired lorries.
7. flasaka District vas found to be the main supplier or cooking bananas to the Kaspala Markets.
It is recoMMended that price m r o r a a t l o n should be dlsseMlnated to all those involved In the Marketing or
cooking bananas. There is need to introduce some
Measures or standards for grading or cooking bananas. This is because the results or the study indicated that
there was no basis for the comparison or bunches or
cooking bananas, other than sere observation.
Evaluation or pricing erriclency was very dirricult
particularly because no unlforu weights and Measures
were used m the marketing process.
Lastly, It was recommended that Toracre who produce cooking bananas should be encouraged to r or m cooperative societies, so as to Increase their bargaining power. This would enable them to market their bananas directly to the retailers, and also benerit Trom any cost savings related to large turnovers, especially rrom transportation.
THE STRUCTURE AND CONDUCT OF THE MARKET
FOR COOKING BANANAS IN KAMPALA CITY. UGANDA
CHAPTER ONE
INTRODUCTION AND PROBLEM FORMULATION
1.1 INTRODUCTION
Agriculture playB a major role in the Ugandan economy. Most of the production takes place in the smallholder sector. The Agricultural sector gives a livelihood to over 80 percent of the population. One of the key objectives of the agricultural sector in Uganda is to increase national food security (Uganda, 1984,p.1).
The main staple food crops grown in Uganda are bananas (Musa Spp.), cassava, fingermillet, maize, sorghum and Bveet potatoes. Bananas are the most important staple food crop, with 33 percent of the population in the country depending on them (Table 1)
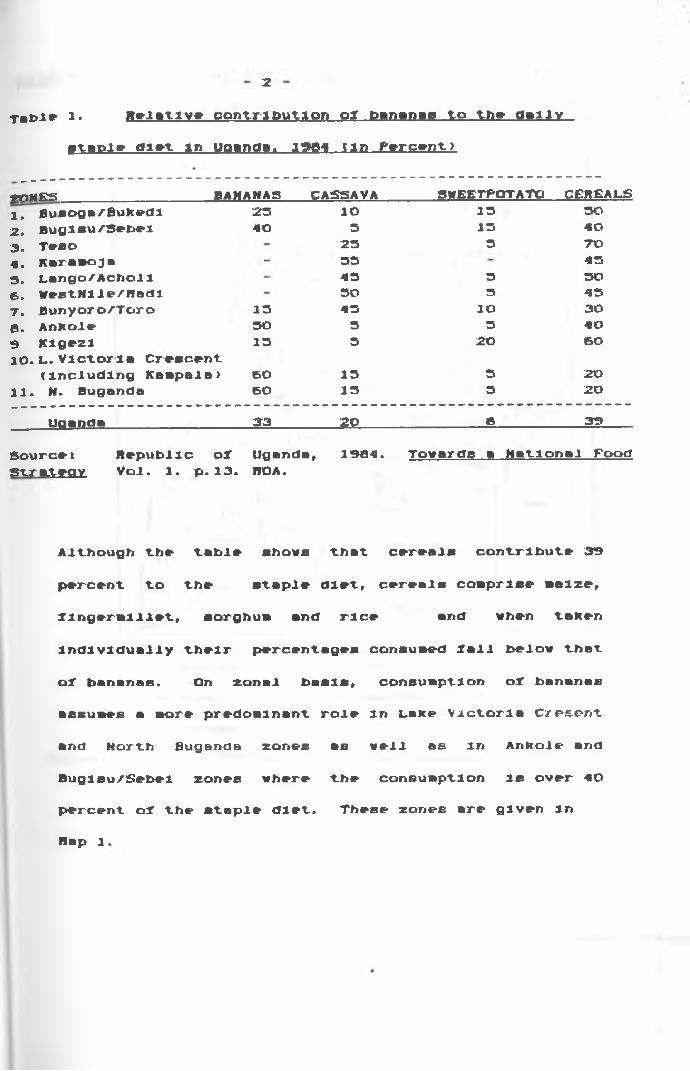
2Table a. Relative contribution oar bananas to the daily
ataple d m in Uganda, 1364 (in Percent)
mttES ______ BAHAMAS___ CASSAVA_______SWEETPOTATP__CEREALS1. Busoga/Bukedl 23 IO 13 302. BuglBu/Setel 40 3 13 403. Teso 23 3 TO4. fCaraeoja - 33 433. Lango/Achol1 43 3 306. NestNlle/Hadl 30 3 43V. Bunyoro/Toro 13 43 IO 306. Ankole 30 3 3 409 Klgezl 13 3 20 60io. L. Victoria Crescent
tlncludlng Kampala) SO 13 3 2011. N. Buganda 60 13 3 20
Uganda_________________ 33 __22_ 8 39Sourcei Republic oX Uganda, 1964. Towards a National FoodStrategy Vol. 1. p. 13. HOA.
Although the table shows that cereals contribute 39percent to the staple diet. cereals comprise maize.Xlngermlllet, sorghum and1 rice and when taken
Individually their percentages consumed Tall below that
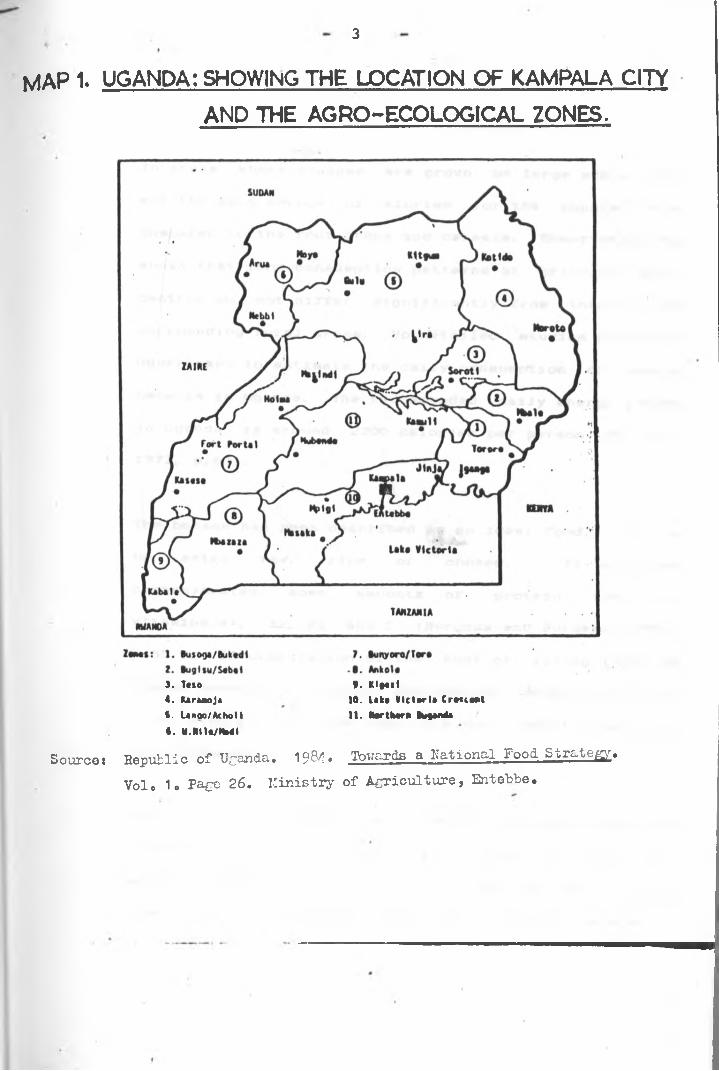
ol bananas. On zonal basis. consumption ol bananasassumes a more predominant role in Lake Victoria Cresentand North Buganda zones as well as in Ankole andBuglsu/Sebel zones where the consumption is over 40percent oX the staple diet. These zones are given InRap 1
3
MAP 1. UGANDA: SHOWING THE LOCATION OF KAMPALA CITY
AND THE AGRO-ECOLOG1CAL ZONES.
J. Tcto4. brtaoji5. Unoo/fkholt i. N.ant/nu<
9. Kl««it10. It k * Vic tort. C ra iiM it
It. Nortlttrli M u r f t
Source! Republic o f Uganda. 1984. Tovards a N ation al Food S tr a te g y .
Vole 1o Page 26 . M in is try o f A g r ic u ltu r e , Entebbe.
4
In areas vhrr» M n a n e e ar* grown on large ccale, they are- the sain source of calories lor the population as compared to the root crops and cereals. Observation has shown that food consumption patterns of principal urban centres do not differ significantly from those of the surrounding rural areas. Ho detailed studies have been undertaken to estimate the dally consumption of cooking bananas m Uganda. The recommended dally energy intake In Uganda Is around 2200 calories per person (Kc Crae, 1972, p. 60).
The banana has been described as an Ideal food. It can be eaten rtw, ripe or cooked. It contains carbohydrates, some amounts of protein, fats and vitamins Al, A2, B2 and C (Burgess and Burgess, 1972, p. 33. ). In computation of the cost of living Index In Uganda bananas are given the heaviest weight of 20 and other staple food cropB take up a very small proportion (see Appendix 2).
The dally consumption of cooking bananas In Buganda where Kampala city Is located was quoted as 2.23 - 2.7 kg per person per day (Purseglove, 1983, p. 346). Since every 1OO g. of the edible portion of cooking bananas
3
c o n t a i n lOO calories ol energy (Burgess el el, 1972, p.33), 11 can be deduced that m e amount ol energy obtained from m e consuapllon ol cooking bananas is around 2230 -2700 calories per person per day.Therefore, cooking bananas which Is the predoalnanl staple, provides an adequate source of energy lor the local population In Kampala City. The present study exaalnes the structure and conduct ol the aerket lor cooking bananas In Kampala City.1.2. BAHAMA PRODUCTION IN UGANDAClimatic Conditions in'Relation to Banana Production Production ol bananas requires a reliable and continuous water supply. The length ol the dry season lnlluences their production (Jameson, 1370, p.133). The mostlavourable areas lor banana production In Uganda are those around Lake Victoria and any other areas which receive over 300 mm ol ralnlall annually. Banana production requires relatively little labour and the leek ol any marked dry season ensures an all year rood supply (Oloya and Poleman, 1372, p.£). However, bananasare liable to damage by strong winds. Therelore exposed sites have to be avoided. Otherwise It would benecessary to provide a windbreak.
4

e
V i r i m w ox b an an a s grown in Ufl»rm»
In Uganda, four major groups of varl»tl»s oX bananas nave been identified (Janeson, 1970, p. H I ). These are* cooking, beer, roasting and dessert bananas.
1. Cooking bananas are by Tar the most widely grown group o! bananas. The fruit is noriBlly cooked by steaalng. Tbe green fruit Is occasionally roasted while tbe ripe Xrult way be eaten uncooked, but sucb usage Is quite rare.
2. Beer bananas are aalnly used Xor local beer brewing. i
3. Roasting bananas are aalnly used Xor roasting. Quite oXten they may be boiled when green or ripe before being consumed.
4. Dessert bananas tbelr ripe Xrults are usually eaten uncooked
Trends In Production r»x bpnunpp inFigure 1 shows developments In tbe area devoted to tbe cultivation ox cooking bananas In Uganda, including tbe level oX production, over tbe 19T1 - 1983 period tseealso Appendix 1). Although tbe area under cookingbananas has remained close to 1.2 million hectares, production has declined sharply Xrom tbe highest
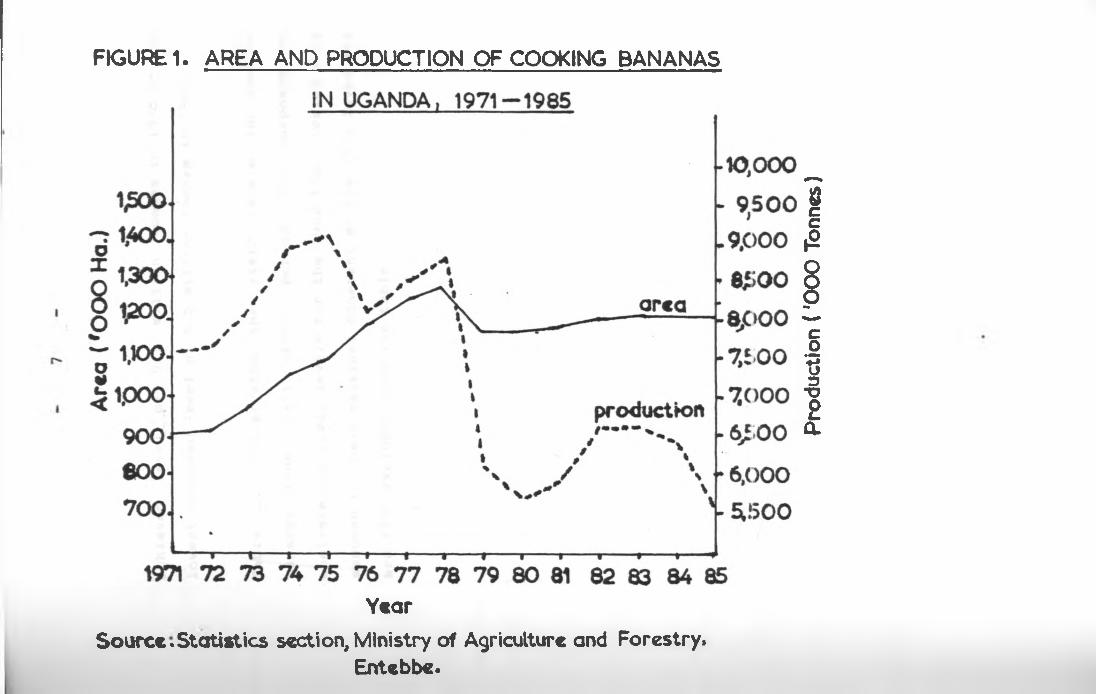
FIGURE 1. AREA AND PRODUCTION OF COOKING BANANAS
Y«ar
Source .Statistics section, Ministry of Agriculture and Forestry.Entebbe.
Prod
ucti
on (
'00
0 T
onne
s)

a
achieved level of 9.1 million tonnea in 1975 to the lowest recorded level of 5.5 million tonnes in 1985.
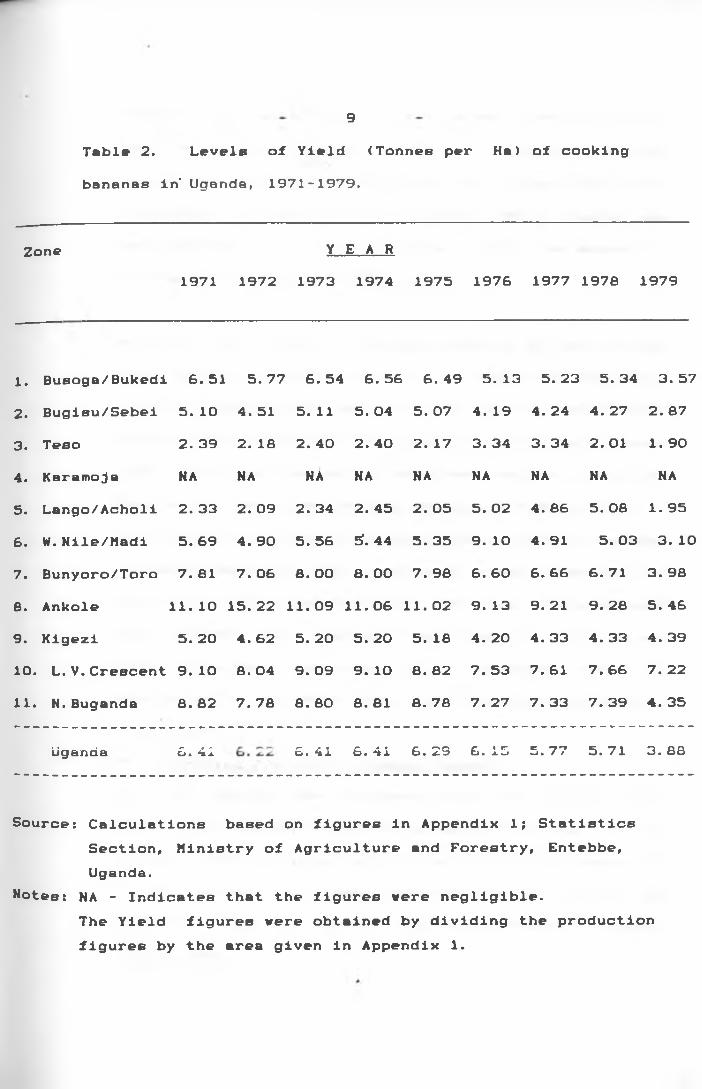
Table 2 illustrates the yield levels for cooking bananas from 1971 -1979 period. For purposes ofanalysis,the yield levels for the 1960-1985 period were assumed to have remained constant at the 1979 level and
are thus excluded from the table.
9Table 2. Levels of Yield (Tonnes per Ha) of cooking bananas in' Uganda, 1971-1979.
Zone1971 1972
Y1973
E A R1974 1975 1976 1977 1978 1979
1 . Busoga/Bukedi 6 . 51 5. 77 6 . 54 6 . 56 6 . 49 5. 13 5. 23 5. 34 3. 57
2 . Bugisu/Sebei 5. 10 4. 51 5. 11 5. 04 5. 07 4. 19 4. 24 4. 27 2. 87
3. Teso 2. 39 2 . 18 2. 40 2. 40 2. 17 3. 34 3. 34 2 . 01 1. 90
4. Karamoja NA NA NA NA NA NA NA NA NA
5. Lango/Acholi 2. 33 2. 09 2. 34 2. 45 2. 05 5. 02 4. 86 5. 08 1. 95
6 . W.Nile/Madi 5. 69 4. 90 5. 56 5̂. 44 5. 35 9. 10 4. 91 5. 03 3. 10
7. Bunyoro/Toro 7. 81 7. 06 8 . 00 8 . 00 7. 98 6 . 60 6 . 66 6 . 71 3. 98
8. Ankole 1 1 . 10 15. 22 11. 09 1 1 . 06 1 1 . 02 9. 13 9. 21 9. 28 5. 469. Kigezl 5. 20 4. 62 5. 20 5. 20 5. 18 4. 20 4. 33 4. 33 4. 391 0. L.V.Crescent 9. 10 6 . 04 9. 09 9. 10 8 . 82 7. 53 7. 61 7. 66 7. 221 1 . N.Buganda 8 . 82 7. 78 8 . 80 8 . 81 8 . 78 7. 27 7. 33 7. 39 4. 35
Uganda 6. 41 6. 41 6. 41 6. 23 6. 15 e *7 tO. / / 5. 71 3. 88
Source: Calculations based on figures in Appendix 1; Statistics Section, Ministry of Agriculture and Forestry, Entebbe, Uganda.
Notes: NA - Indicates that the figures were negligible.The Yield figures were obtained by dividing the production figures by the area given in Appendix 1.
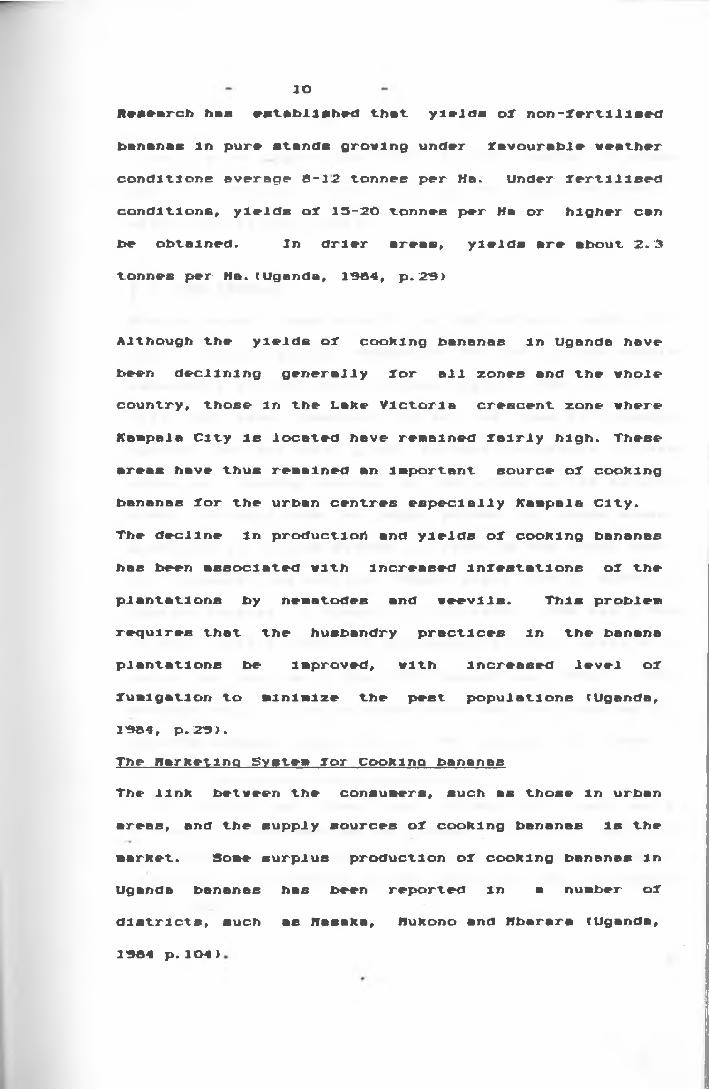
IDR t u t r c h has MtabllihKf that. yields of non-fertilised bananae In pure stands growing under favourable weather conditions average 8-3.2 tonnes per M b . Under fertilised conditions, yields of 13-20 tonnes per Ha or higher can be obtained. In drier areas, yields are about 2.3tonnes per Ha. (Uganda, 1984, p.23)
Although the yields of cooking bananas m Uganda nave been declining generally for all zones and the whole country, those In the bake Victoria crescent zone where Kampala City Is located have remained fairly high. These areas have thus remained an Important source of cooking bananas for the urban centres especially Kampala City. The decline In production and yields of cooking bananas has been associated with increased infestations of the plantations by nematodes and weevils. This problem requires that the husbandry practices In the banana plantations be improved, with increased level of fumigation to minimize the pest populations (Uganda, 1984, p.29>.The Harketlno System for Cooking bananasThe link between the consumers, such as those m urban areas, and the supply sources of cooking bananas Is the market. Some surplus production of cooking bananas in Uganda bananas has been reported in a number of districts, such as Ifasaka, Mukono and Hbarara (Uganda,1984 p. 304)
11
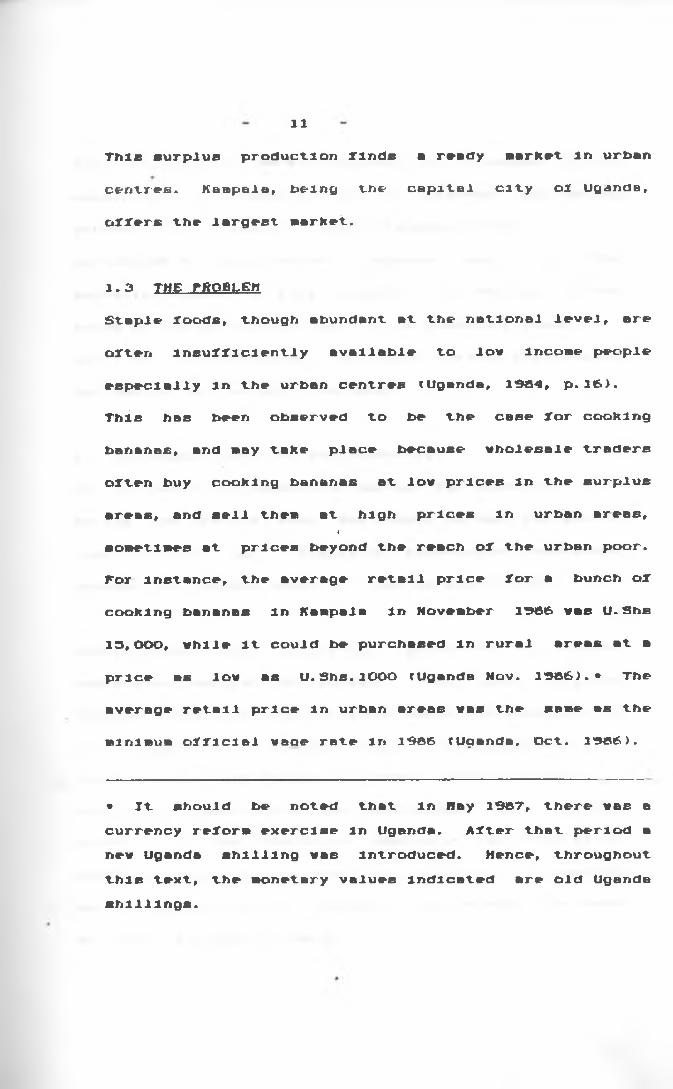
This surplus production finds • ready market in urban centres. Keapaia, being the capital city ol Uganda, offers the largest market.
1.3 THE PftOBLEWStaple foods, though abundant at the national level, are often insufficiently available to lou Income people especially in the urban centres 'Uganda, 13*4, p.16). This has been observed to be the case for cooking bananas, and may take place because wholesale traders often buy cooking bananas at low prices in the surplus areas, and sell them at high prices in urban areas,
lsometimes at prices beyond the reach of the urban poor. Tor Instance, the average retail price for a bunch of cooking bananas in Kampala In Movember 1986 was U.Shs 13,000, while It could be purchased In rural areas at a price as low as U.Shs.1000 'Uganda Nov. 19S6).* The average retail price In urban areas was the same as the minimum official waoe rate In 19«6 'Uganda. Oct. 1386.).
• It should be noted that in Nay 19B7, there was a currency reform exercise in Uganda. After that period a new Uganda shilling was Introduced. Hence, throughout this text, the monetary values indicated are old Uganda shillings.
12
Froi Tabl» 1, 1t can b* obearved that 60 parcant of thectapla diet in Kampala city le composed of cooking bananas. Tha prices of cooking bananas are not. controlled by the government (Uganda, 19M, p.4). The marketing system of this commodity is entirely In the hands of the private sector. For a commodity whose price Is not controlled, the price levels are usually Influenced by two mBjor factors s-
1) The supply level of the commodity.2) The level of competition amongst the traders.During the period when the supply Is low, the pricesltend to shoot up. Similarly Inadequate competitionamongst the traders tends to push up the prices.
Apart from the information generated by studies undertaken earlier by Rukwaya (1962) and Oloya and Poleman Kl'972>, little Is krown about the marketing of Cuc.iilr«g t ia i ja r ia b i n K n c p s l n c i t y . An u n d e r s t a n d i n g o f
the structure and conduct of this marketing e y s t e s I s
crucial In Identifying the bottlenecks affecting the trade. It was therefore considered that this studywould be useful through its contribution to information on the cooking bananas market in Uganda,and this couldbe useful to policy makers
13
1.4 p^JgcriYSS . OF TjfE Siupr AMP Ttf£ ..nrroTtfPSES t e s t e d
The purpose or The study was to examine the structure and conduct of the market Tor cooking bananas In Kampala City. Market structure refers to those organizational characteristics oX a market which Influence relations oX buyers and sellers and exert strategic influence upon price and the character of competition Uiaritlm, 1962) Elements of Market structure are market concentration, information and entry into the business. Market conduct involves pricing mechanisms, forms of competition by the traders and occurrence of any collusion tendencies. These concepts are reviewed further In chapter two. TheIspecific objectives weres-
1.4.1 To examine the structure and conduct of the market for cooking bananas m Kampala City, with special attention being paid to the volume of trade and the number of retBllere and wholesalers Involved In thebusiness.
1.4.2 To establish the supply areas of cooking bananas, modes of transport used and transport costs In orderto gauge the price differences between the buying price in the supply areas and the selling price at wholesale level, with a view to assessing the margins accruing to
-14-THE HYPOTHESES AND HOW THEY WERE TESTEDWith regard to objective 1.4.1, two hypotheses wereteBted.1) There Is no single wholesaler that is controlling
the market. This hypothesis was tested byestimating the wholesalers Lorenz concentration curve for the cooking banana trade and by examining the volume of the trade controlled by the largest 10,20, 50 and 80 percent of the wholesalers. If thebusinesB is concentrated within a few traders,
they can easily influence the retail prices through the monopoly tendencies. Even if the supply is adequate, the wholesalers, through monopoly tendencies, can push dp the prices to the disadvantage of the consumers. If on the other hand there is free competition, none of the wholesalers would be able to influence the selling price.
2) The retail price of cooking bananas is influenced by the levels ol producer prices. This hypothesis is tested by trying to establish whether the producer price had any significant influence on the level of retail prices of cooking bananas. For purposes ofthe analysis, the wholesalers' purchase will be
assumed to be the producer or farmgate price. A simple regression analysis will be carried out and
-15-the Student's t-Statistic will be used a basisfor establishing the level of significance of the influence of * producer price on the level of the retail price.The regression equation to be estimated is :
X, * a ♦ bXt where,
Xt = consumer or retail price Xi * producer price
If the producer prices have a significant influenceon the level of retail prices, then this would
suggest that the wholesalers are likely to beinfluencing the retail prices.
With regard to objective 1.4.2, 1 two hypotheses were also tested:1 . The areas around Kampala City are no longer the
main source of Cooking bananas for the city markets. The areas around Kampala City which used to be the main source of cooking bananas in the 1960's and 1970's were located in Mukono District. According to studies carried out by Mukwaya (1962) and Oloya and Poleman (1972), Mukono District alone used to account for 80 percent of the cooking bananas supplied to the Kampala City markets, while Masaka District came second with about 10 percent of the quantities supplied. The other 10 percent came from various minor sources, such as Mbale and Mbarara Districts. The present study is toestablish if the same situation still exists.

162. Price markups lor the cooking banana wholesalers are Influenced by the transport costs. A simple regression analysis will be carried out and the level of significance for this hypothesis will be established by using the Student's t-Statistic.The regression equation to be estimated is:
X* = a ♦ bX,where,
X. = price markupX, * transport cost
If the price markups are significantly influenced by the transport costs, then this could be an indicator that the wholesalers may have some collusive tendencies in the determination of wholesale prices for cooking bananas.
17CHAPTER TWO
LITERATURE REVIEW AND THEORETICAL FRAMEWORK FOR THE ANALYSIS
The theoretical framework adopted in the analysis of data 1 b based on the concept of the structure and conduct of the market for any given product. Kariungi (1976), Schmidt (1979) and Maritim (1982) used the Structure, Conduct and Preformance method to study the system of maize marketing in Kenya. Mbogoh (1976) used the same method to study the marketing system for Irish potatoes in Kenya. The Struqture and Conduct method was adopted for this study in order to understand the marketing system for cooking bananas in Kampala City.
In this method, the market structure is primarily analysed in terms of market concentration, transparency (information) and barriers to market entry. Market concentration involves the study of the number and size of the market participants (wholesalers and retailers). If there are few traders in the business, then they can influence the prices by say withholding supplies; but if tha traders are many, then it provides for competitive conditions. Market transparency refers to information flow within the marketing system which aids both the producers and the traders in* their decision making process. Market information can be disseminated through
la
the irtBB media, such as newspapers and the radio. Thestudy of market entry involves the examination of
various barriers which prohibit traders from entering a marketing system. They include managerial know-how, lack of capital, legal barriers, such as licensing, and aggressive reactions to newcomers by those already in business.
Analysis of market conduct involves the examination of the buying and selling behaviour of the traders (both the wholesalers and retailers), forms of payment, level of activity and actions to avoid competition by, say,
Icollusion and other unethical practices.There is little information available in connection with the marketing system for cooking bananas in Kampala or Uganda in general . The following literature will however highlight some areas of interest in the current study.
Three types of channels exist for the marketing of food crops in Uganda (Uganda, 1984, p. 57). The Produce Marketing Board (PMB) and the Co-operative UnionB mainly handle dry produce. The third channel, consisting of private traders, is the one mainly engaged in the marketing of cooking bananas. Hays (1975, p. 10) has reviewed the marketing system for food grains in Northern Nigeria, showing the possible distribution
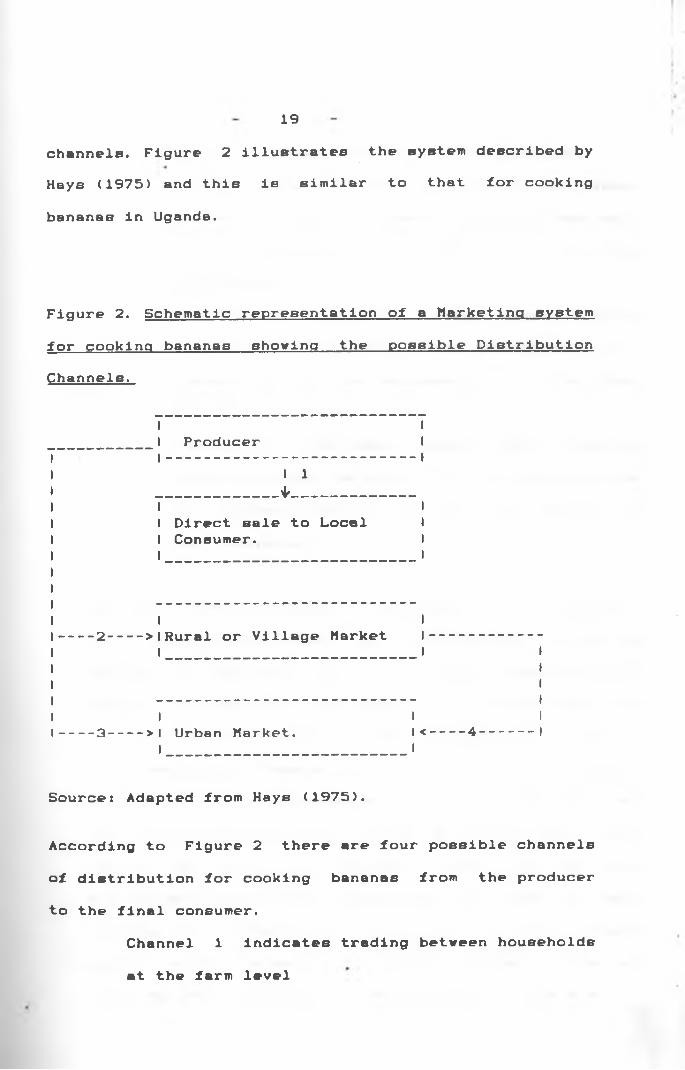
19channels. Figure 2 illustrates the system described by Hays (1975) and this is similar to that for cooking bananas in Uganda.
Figure 2. Schematic representation of a Marketing system for cooking bananas shoving the possible Distribution Channels.
I II Producer II------------------------------ I
I 1
______________ I_______________I It Direct sale to Local II Consumer. II I
I I----2---- > I Rural or Village Market I
I _ I
I I----3---- >1 Urban Market. I <--- 4 -------
I __ I
Source: Adapted from Hays (1975).
According to Figure 2 there are four possible channels of distribution for cooking bananas from the producer to the final consumer.
Channel 1 indicates trading between householdsat the farm level
20Channel 2 Involves moving cooking bananas from the farmers to the rural market. The farmer may sell the cooking bananas himself or may sell to a middleman vho also sells to thewholesalers.Channel 3 illustrates cases where cookingbananas may be bought directly from farmers and transported by the wholesalers to the urban markets.Channel 4 illustrates cases where cookingbananas may also be moved from the rural markets (or assembly points) to the urban markets bylthe wholesalers.
Mukwaya .(1962, p. 643-666) reviewed the production, collection,transportation and distribution of cooking bananas in Kampala City. He found that the lorrytraders provided their own money for this business from
+i~r. of harvest to the time of distribution in the final markets in Kampala City. He reported that Kar.paia City had Just over 20 markets where bananas were sold at both wholesale and retail levels. No single market was solely for retail or wholesale trade nor was any significant quantity of bananas sold in shops. In these markets, the bananas were sold while laid out on bare ground, either spreadout qr heaped together. Host of these markets were found to have permanent roofs and
21could be locked up at night. Oloya et al (1972,p.47) reported that the number of markets in Kampala City had risen to 49 by 1972, which had resulted into more selling points for the cooking bananas.
A study on the marketing of bananas as a subsidiary staple food in Dar-es-Salaam carried out by Kascarenhas and Mbilinyi (1968) indicated that the bananas had first to be channeled through the Kariokoo city market for the Dar-es-Salaam consumers.However, the studies by Mukwaya (1962) and Oloya et al (1972) indicated that cooking bananas could be supplied directly to any market in Kampala City, without going through an assembly point or market.
Oloya et al (1972, p. 28) contended that the purpose of any marketing system should be to provide efficient marketing services at minimum costs so that the farmers can make pi ofit and .cvard the resources used in production. Nyiti (1976, p. 12) noted that smell ccaie farmers responded favourably to product prices in deciding what to produce.
In a competitive market, the farmers get fair prices because the competing marketing agents bid the prices up to a level where the .margin between the agents' purchase price (which is the producer price) and the
22agents' sales price Just covers their costs and leaves a ■normal" profit. Figure 3, which is based on Appendix 3, shows that the prices of cooking bananas in Uganda have increased tremendously between 1982 and 1987. This can also be noted from Table 3. Oloya et al (1972,p.46) noted that there v b b little exchange of information between the markets in Kampala City as regards prices of cooking bananas and that the farmers were at abargaining disadvantage with regard to the sale of their produce. This was caused by both costly transport and ignorance of market conditions which could lead to collusion by the wholesalers and retailers. Hence market information was inadequatp, suggesting that thestructure of the market for cooking bananas in Kampala City at that time was not as competitive as would be desirable.
Helmberger, Campbell and Dobson (1981, p. 504) and Hays (1975, p. 58) have reviewed the marketing margins for various farm products. The farmer's share oi the retail price has been found to vary across products and over time but on average it has been found to oscillate around 40 percent. The findings of Mukwaya (1962,p.664) revealed that the farmer's share of the retail price of cooking bananas in Uganda v b b about 44 percent. However, the study by Hays (1975) gave a larger farmers' share of the retail price of- about 68 percent for the millet and sorghum producers in Northern Nigeria. According to this study,the transporters' margins
Pric
e (
U. s
hs.
per
kg.)
FIGURE 3. AVERAGE MONTHLY RETAIL PRICES OF COOKING
BANANAS IN KAMPALA M A RKETS 1982 H 9 8 7
MonthSource: Statistics Department, Ministry of Planning and
Economic Development, Entebbe, Uganda.
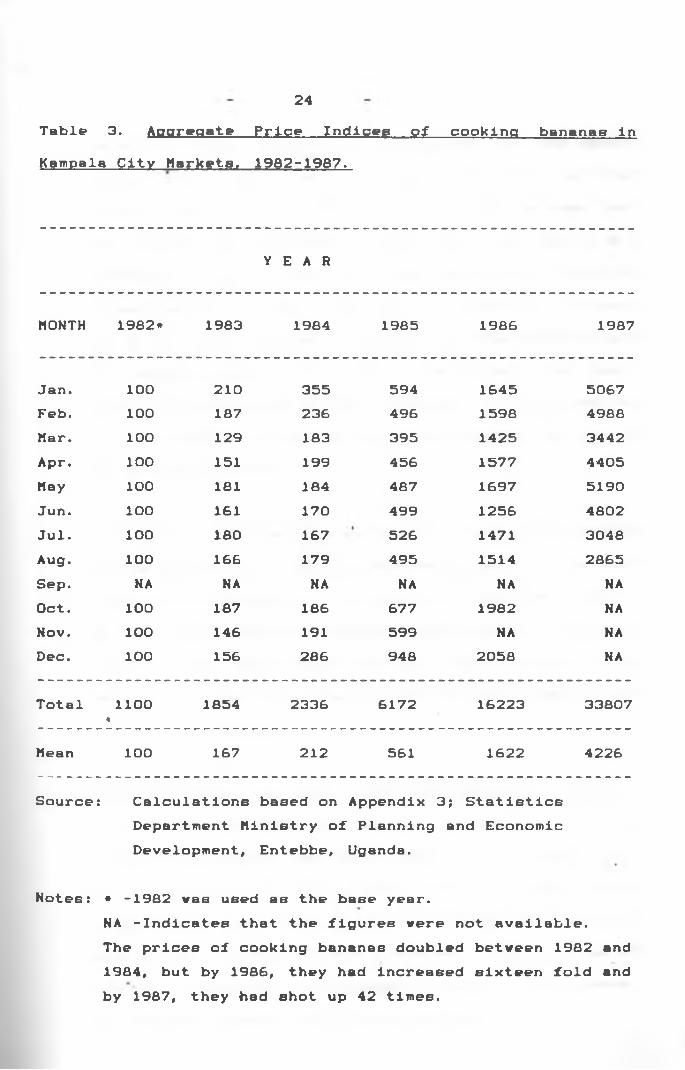
24Table 3. Aggregate Price Indices of cooking bananas In Kampala City Markets. 1982-1987.
Y E A R
MONTH 1982* 1983 1984 1985 1986 1987
Jan. 100 210 355 594 1645 5067Feb. 100 187 236 496 1598 4988Mar. 100 129 183 395 1425 3442Apr. 100 151 199 456 1577 4405May 100 181 184 487 1697 5190Jun. 100 181 170 499 1256 4802Jul. 100 180 167 526 1471 3048Aug. 100 168 179 495 1514 2865Sep. NA NA NA NA NA NAOct. 100 187 186 677 1982 NANov. 100 146 191 599 NA NADec. 100 156 286 948 2058 NA
Total 1100■* 1854 2336 6172 16223 33807
Mean 100 167 212 561 1622 4226
Source: Calculations based on Appendix 3; StatisticsDepartment Ministry of Planning and Economic Development, Entebbe, Uganda.
Notes: * -1982 was used as the base year.NA -Indicates that the figures were not available.The prices of cooking bananas doubled between 1982 and 1984, but by 1986, they had increased sixteen fold and by 1987, they had shot up 42 times.
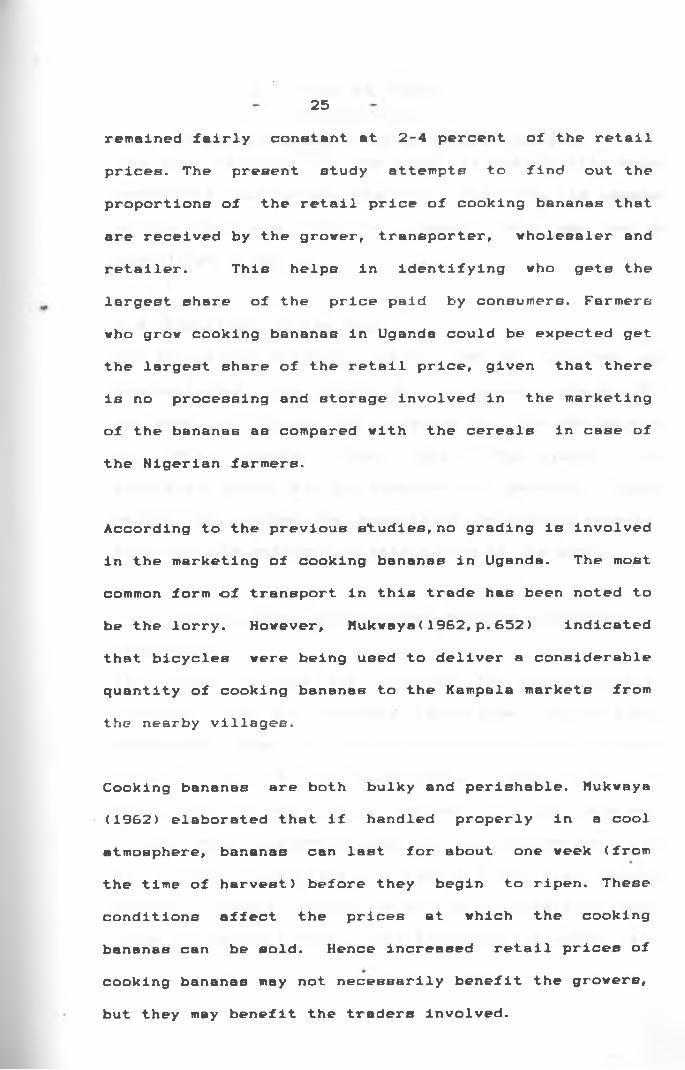
25remained fairly constant at 2-4 percent of the retail prices. The present study attempts to find out the proportions of the retail price of cooking bananas that are received by the grower, transporter, wholesaler and retailer. This helps in identifying who gets the largest share of the price paid by consumers. Farmers who grow cooking bananas in Uganda could be expected get the largest share of the retail price, given that there is no processing and storage involved in the marketing of the bananas as compared with the cereals in case of the Nigerian farmers.
According to the previous studies,no grading is involved in the marketing of cooking bananas in Uganda. The most common form of transport in this trade has been noted to be the lorry. However, Mukwaya<1962,p.652) indicated that bicycles were being used to deliver a considerable quantity of cooking bananas to the Kampala markets from the nearby villages.
Cooking bananas are both bulky and perishable. Mukwaya (1962) elaborated that if handled properly in a cool atmosphere, bananas can last for about one week (from the time of harvest) before they begin to ripen. These conditions affect the prices at which the cooking bananas can be sold. Hence Increased retail prices of cooking bananas may not necessarily benefit the growers, but they may benefit the traders involved.
26CHAPTER THREEMETHODOLOGY,
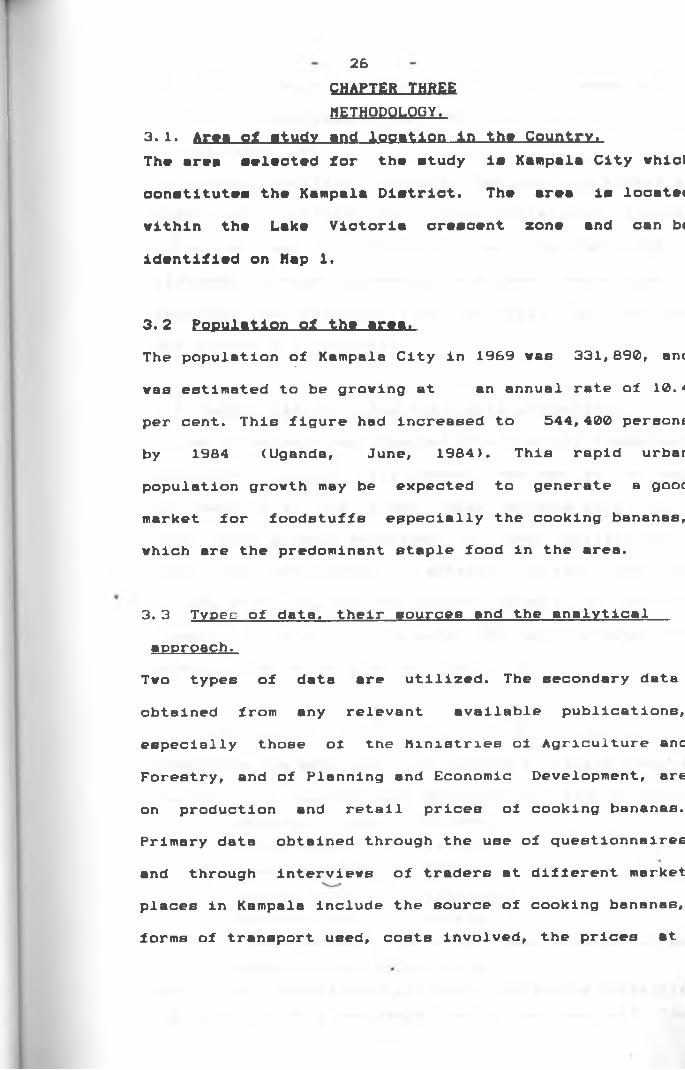
3.l. Araa of atudv and location in tha Country.The area selected for the study Is Kampala City vhlo)constitutes the Kampala District. The area is locatecwithin the Lake Victoria cresoent zone and can b<identified on Hap 1.
3.2 Population of the area,The population of Kampala City in 1969 v b b 331,890, anc was estimated to be growing at an annual rate of 10 .*
per cent. This figure had increased to 544,400 persons by 1984 (Uganda, June, 1984). This rapid urbar population growth may be expected to generate a gooc market for foodstuffs especially the cooking bananas, which are the predominant staple food in the area.
3.3 Typer of data, their sources and the analytical approach.
Two types of data are utilized. The secondary data obtained from any relevant available publications, especially those of the Ministries of Agriculture and Forestry, and of Planning and Economic Development, are on production and retail prices of cooking bananas. Primary data obtained through the use of questionnaires and through interviews of traders at different market places in Kampala include the source of cooking bananas, forms of transport used, costs Involved, the prices at
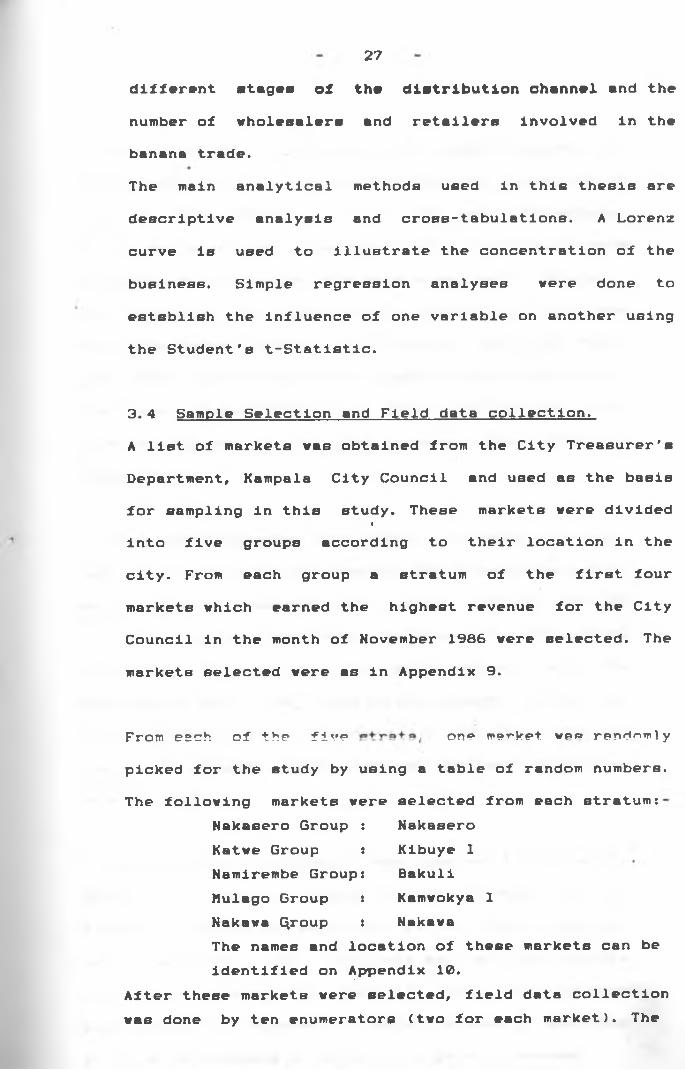
27different stages of the distribution channel and the number of wholesalers and retailers Involved in the banana trade.The main analytical methods used in this thesis are descriptive analysis and cross-tabulations. A Lorenz curve is used to illustrate the concentration of the business. Simple regression analyses were done to establish the influence of one variable on another using the Student's t-Statistic.
3.4 Sample Selection and Field data collection.A list of markets was obtained from the City Treasurer's Department, Kampala City Council and used as the basis for sampling in this study. These markets were divided
t
into five groups according to their location in the city. From each group a stratum of the first four markets which earned the highest revenue for the City Council in the month of November 1986 were selected. The markets selected were as in Appendix 9.
From esch of the five one merket wee randomlypicked for the study by using a table of random numbers.The following markets were selected from each stratum:
Nakasero Kibuye 1 Bakuli Kamwokya 1 Nakawa
The names and location of these markets can be identified on Appendix 10.
After these markets were selected, field data collection was done by ten enumerators (two for each market). The
Nakasero Group : Katwe Group : Namirembe Group: Mulago Group : Nakawa C^roup :
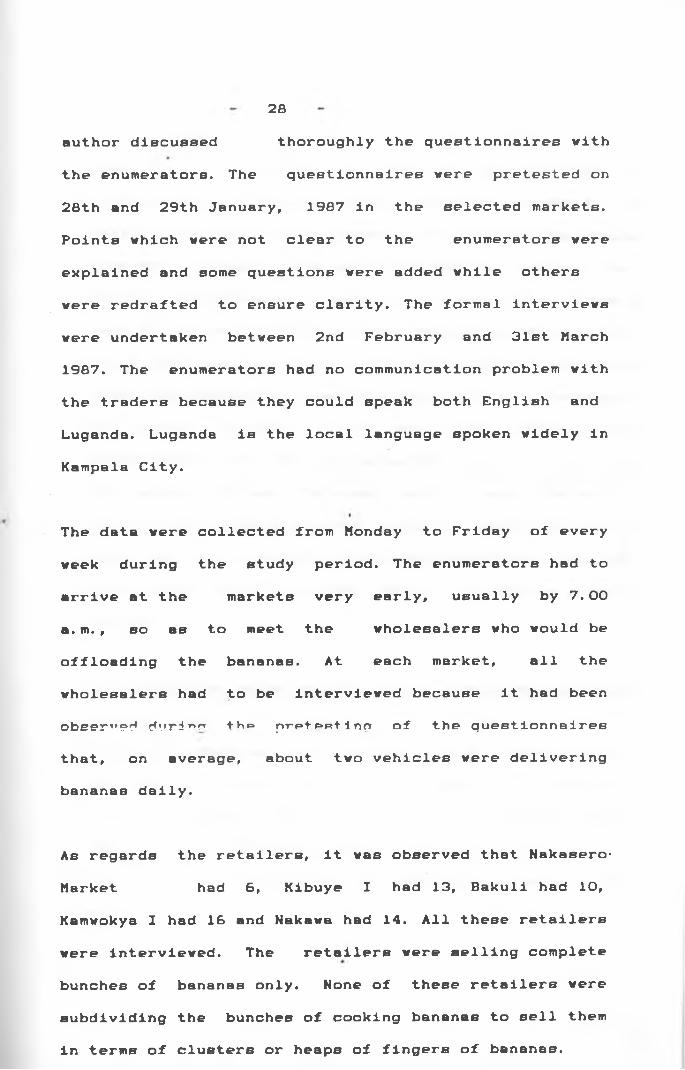
28author discussed thoroughly the questionnaires withthe enumerators. The questionnaires were pretested on 28th and 29th January, 1987 in the selected markets. Points which were not clear to the enumerators were explained and some questions were added while others were redrafted to ensure clarity. The formal interviews were undertaken between 2nd February and 31st March 1987. The enumerators had no communication problem with the traders because they could speak both English and Luganda. Luganda is the local language spoken widely in Kampala City.
The data were collected from Monday to Friday of every week during the study period. The enumerators hBd to arrive at the markets very early, usually by 7.00 a. m. , so as to meet the wholesalers who would be offloading the bananas. At each market, all the wholesalers had to be interviewed because it had been observed durian the pretesting of the questionnaires that, on average, about two vehicles were delivering bananas daily.
As regards the retailers, it was observed that Hakasero- Market had 6, Kibuye I had 13, Bakuli had 10,Kamwokya I had 16 and Nakawa hBd 14. All these retailers were interviewed. The retailers were selling complete bunches of bananas only. None of these retailers were subdividing the buncheB of cooking bananas to sell them in terms of clusters or heaps of fingers of bananas.

29
Every week, the author reviewed the data collected by enumerators at a meeting they would have to attend. The enumerators would also present the problems they would have met. Throughout the period of data collection, the author visited every enumerator at least three times a week to ensure that the work was being done as expected. Since the study carried out by Oloya et al (1972) had noted that there are seasonal variations in the supply of cooking bananas , with peak supply months being between March and June and a marked drop in quantity of bananas between December and January, the author assumed that cooking bananas supplies would be fairly steady during the months of February and March, and that is why data were collected during the February/March period.
3-5. Probity __gxpyrltngyd__during__thy ggllggtlgnperiod.During the month of March, there was a temporary fuel shortage in Uganda and this affected the prices of cooking bananas. During that month, the banana supply was reduced. Therefore only the data collected during the month of February are utilized for analysis in thisstudy.
30
CHAFTER FOUR
PRESENTATION AND INTERPRETATION OF THE RESEARCH FINPINBS
The research findings are presented and interpreted in sections 4.1 and 4.2 below. Section 4.3 deals with the hypotheses testing. The modes of transport involved in the marketing of cooking bananas in Kampala City are considered in section 4.4. Lastly, section 4.5 examines the proportions of the retail price per bunch of cooking bananas that are received by the grower, transporter,
Iwholesaler and retailer.
4.1. THE STRUCTURE OF THE MARKET FOR COOKING BANANAS__UL
KAMPALA CITY.Market structure refers to those characteristics of the market organization which influence the nature of competition and pricing within the market. The elements of market structure examined in this study were thedegree of market concentration, market transparency or information and barriers to market entry.
4.1.1 Market ConcentrationSaleB of cooking bananas can take place at farmers' holdings, rural collection centres, roadsides or in the established market places. The degree of the market
31concentration may be expected to vary at each of these sales points. Due to lack of sufficient data on actual sales that take place at farm holdings, rural collection centres and roadsides, the degree of marketconcentration at these sales points was not considered. This study only considered the degree of market concentration in Kampala City markets.
4.1.1.1. The number of wholesalers and retailers involved in the marketing of cooking bananas in Kampala Cltv
Both lorries and pickups were being used for delivering cooking bananas to the Kampala City markets. Lorries had capacities of 5-10 tonnes while the pickups' capacities ranged from 0. 5 to 2.0 tonnes.
The wholesaler had to travel to the countryside himself or send a representative to start buying and gathering bunches of cooking bananas before a vehicle would be sent there. This task needed 1-5 days and on average took 2. 5 days as reported by the wholesalers. Then when the wholesaler would have gathered enough bunches of cooking bananas for a trip to Kampala City (depending upon the capacity of the vehicle), the Journey would take an average of 1.5 days, with a range of 1-3 days.

32
During the month of February, a total of 111 trips were recorded. The results of the study carried out in the markets of Nakasero, Kibuye I, Bakull, Kamvokya I and Nakawa indicated that the number of wholesalers who were engaged in the marketing of cooking bananas in Kampala City in the same period were 267. This number of wholesalers may seem to be high, but this was due to the nature of the business. Only 40 wholesalers operated individually, while the other 227 wholesalers had partnerships ranging from two to seven. This was because the wholesalers in most cases had to get together andlcontribute funds for operating the business. Forcomputational purposes, only the number of trips will be taken into consideration. Further, it is to be assumed that for every trip recorded, there was one wholesaler. In any case, only one wholesaler was interviewed for every trip recorded.
The number of retailers who were selling bunches of cooking bananas in the area of study are indicated inTable 4.
33
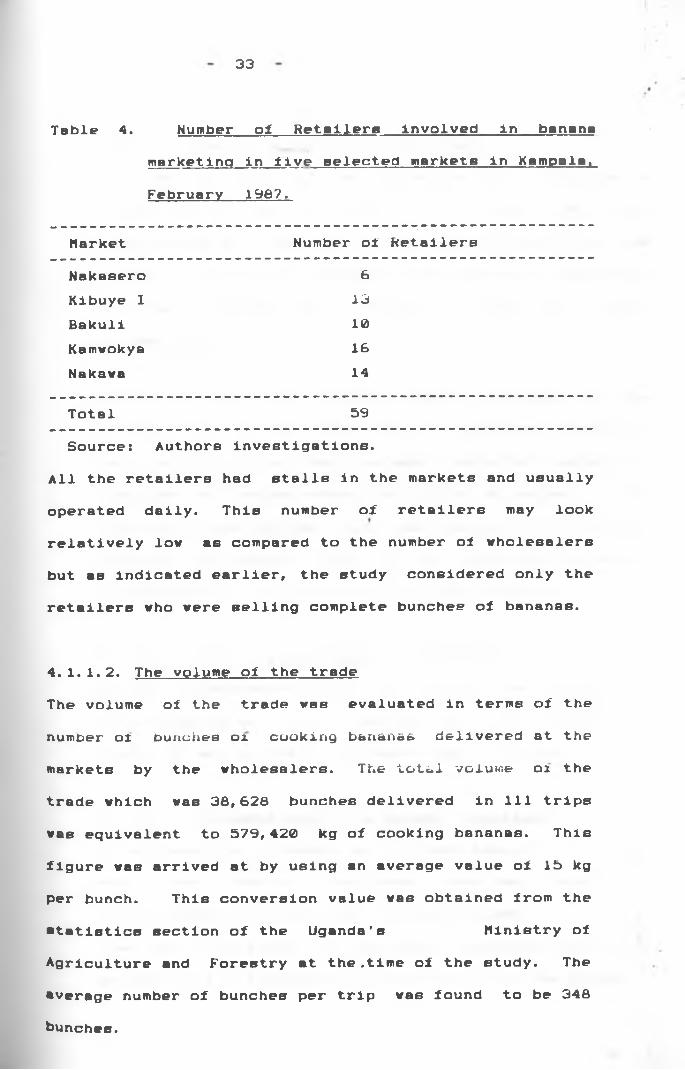
Table 4. Number of Retailers involved in bananamarketina in five selected markets in Kampala.February 1987.
Market Number of RetailersNakasero 6Kibuye 1 13Bakull 10Kamwokya 16Nakawa 14
Total 59Sources Authors Investigations.
All the retailers had stalls in the markets and usually operated daily. This number of retailers may look relatively low as compared to the number oi wholesalers but as indicated earlier, the study considered only the retailers who were selling complete bunches of bananas.
4.1.1.2. The volume of the tradeThe volume of the trade was evaluated in terms of the number ox bunches ox cooking bananas delivered at the markets by the wholesalers. The total volume ox the trade which was 38,628 bunches delivered in 111 trips was equivalent to 579,420 kg of cooking bananas. This figure was arrived at by using an average value of 15 kg per bunch. This conversion value was obtained from the statistics section of the Uganda's Ministry of Agriculture and Forestry at the .time of the study. The •verage number of bunches per trip was found to be 348bunches.
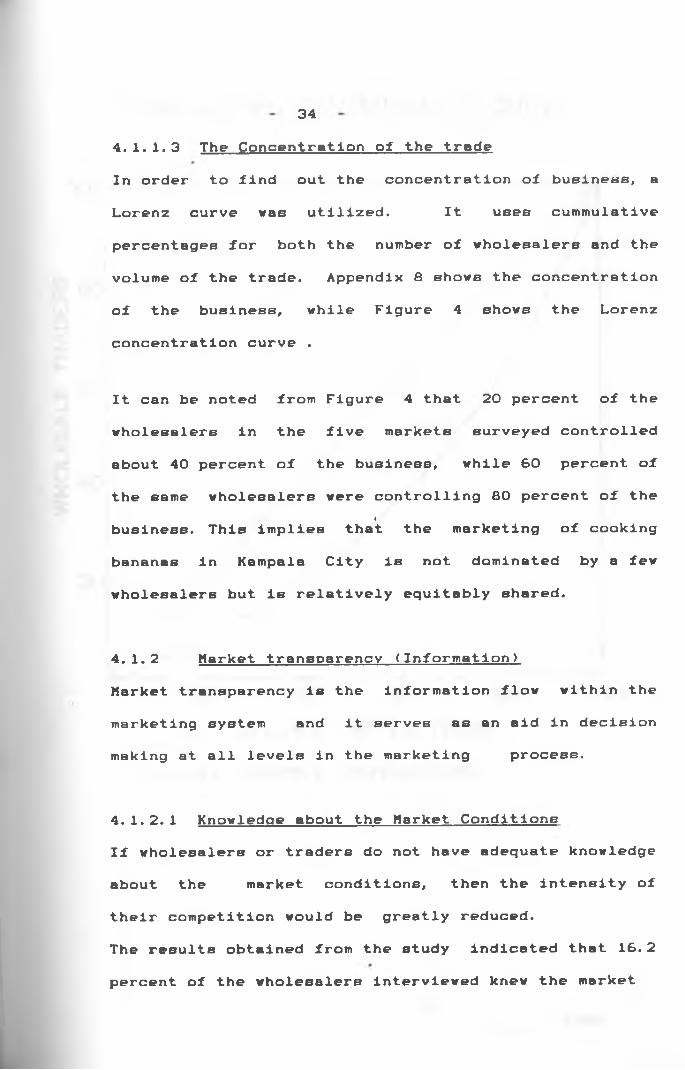
344.1.1.3 The Concentration of the tradeIn order to find out the concentration of business, a Lorenz curve was utilized. It usee cummulativepercentages for both the number of wholesalers and the volume of the trade. Appendix 8 shows the concentration of the business, while Figure 4 shows the Lorenz concentration curve .
It can be noted from Figure 4 that 20 percent of the wholesalers in the five markets surveyed controlled about 40 percent of the business, while 60 percent of the same wholesalers were controlling 80 percent of the
lbusiness. This implies that the marketing of cooking bananas in Kampala City is not dominated by a few wholesalers but is relatively equitably shared.
4.1.2 Market transparency (Information)Market transparency is the information flow within the marketing system and it serves as an aid in decision making at all levels in the marketing process.
4.1.2.1 Knowledge about the Market Conditions If wholesalers or traders do not have adequate knowledge about the market conditions, then the intensity of their competition would be greatly reduced.The results obtained from the study indicated that 16. 2 percent of the wholesalers interviewed knew the market
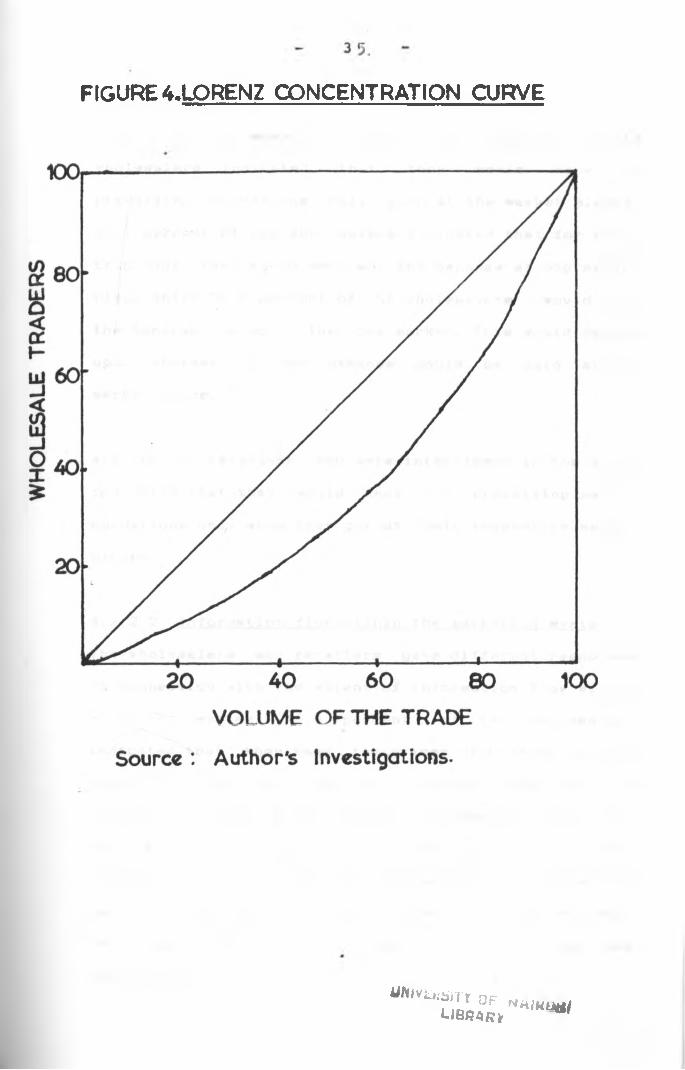
FIGURE 4.LORSNZ CONCENTRATION CURVE
UfHVLk&iTt opl i b r a r y
Mhiuiutij
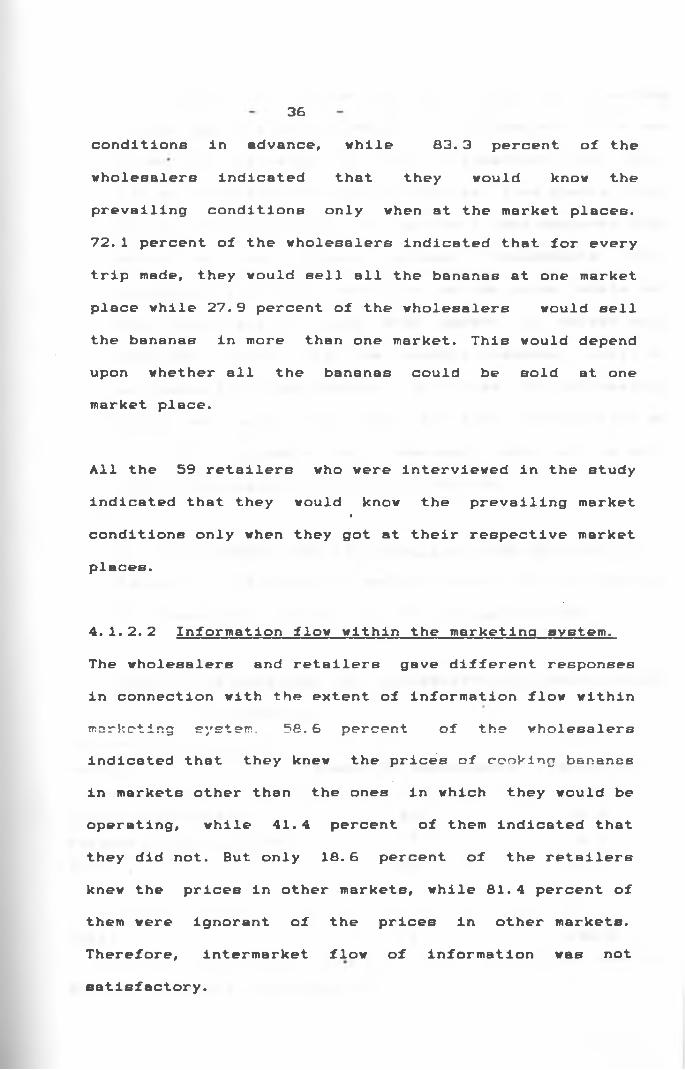
36conditions in advance, while 83.3 percent of the wholesalers indicated that they would know the prevailing conditions only when at the market places.72.1 percent of the wholesalers indicated that for every trip made, they would sell all the bananas at one market place while 27.9 percent of the wholesalers would sell the bananas in more than one market. This would depend upon whether all the bananas could be sold at one market place.
All the 59 retailers who were interviewed in the study indicated that they would know the prevailing marketIconditions only when they got at their respective market places.
4.1.2. 2 Information flow within the marketing system. The wholesalers and retailers gave different responses in connection with the extent of information flow within marketing system. 58.6 percent of the wholesalers indicated that they knew the prices of cooking bananas in markets other than the ones in which they would be operating, while 41.4 percent of them indicated that they did not. But only 18. 6 percent of the retailers knew the prices in other markets, while 81.4 percent of them were ignorant of the prices in other markets. Therefore, intermarket flow of information was not satisfactory.
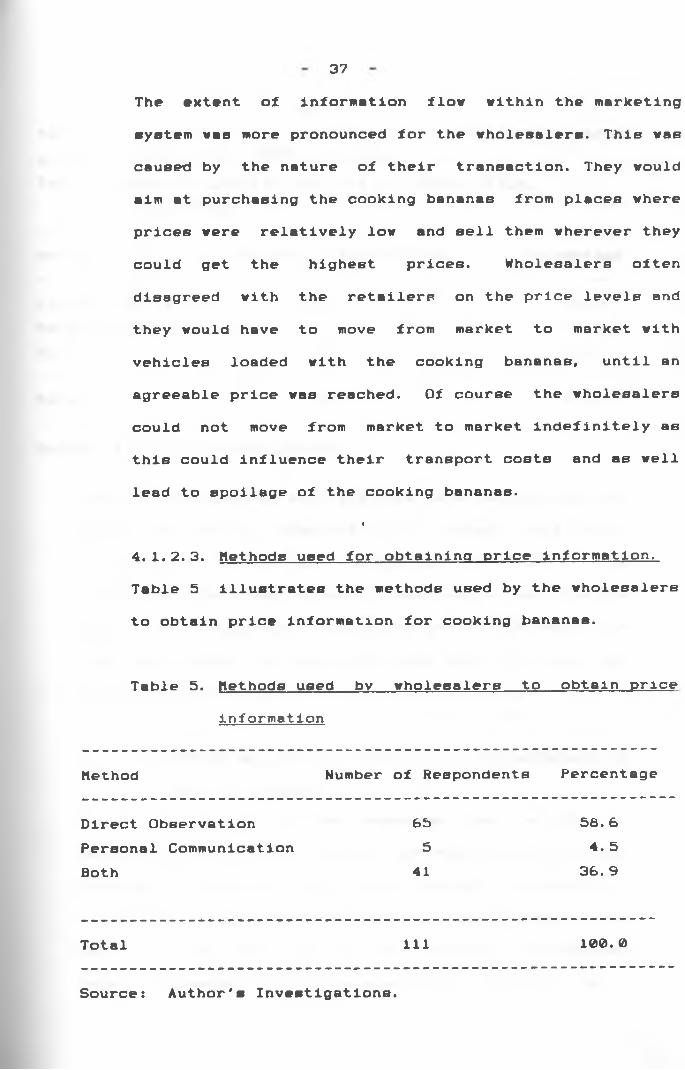
37The extent of information flow within the marketing system was more pronounced for the wholesalers. This was caused by the nature of their transaction. They would aim at purchasing the cooking bananas from places where prices were relatively low and sell them wherever they could get the highest prices. Wholesalers often disagreed with the retailers on the price levels and they would have to move from market to market with vehicles loaded with the cooking bananas, until an agreeable price was reached. Of course the wholesalers could not move from market to market indefinitely as this could influence their transport costs and as well lead to spoilage of the cooking bananas.
•
4.1.2.3. Methods used for obtaining price information. Table 5 illustrates the methods used by the wholesalers to obtain price information for cooking bananas.
Table 5. Methods used by wholesalers to obtain priceinformation
Method Number of Respondents Percentage
Direct Observation 6b 56. 6Personal Communication 5 4. 5Both 41 36. 9
Total 111 100. 0
Source: Author's Investigations.
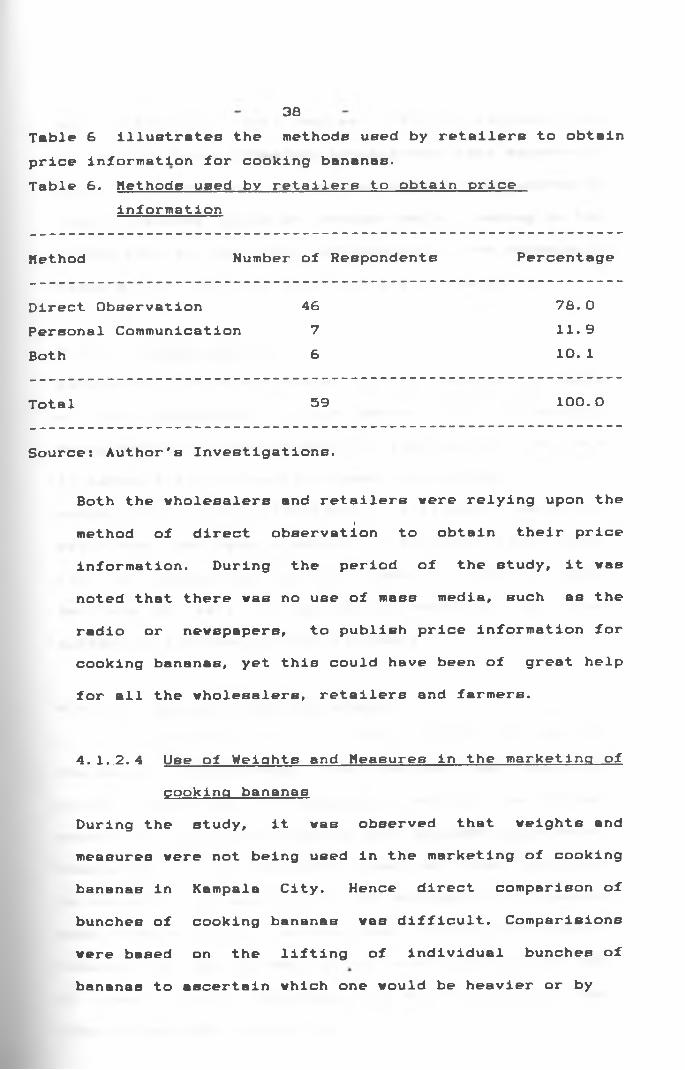
38Table S Illustrates the methods used by retailers to obtain price information for cooking bananas.Table 6. Methods used by retailers to obtain price
information
Method Number of Respondents Percentage
Direct Observation 48 78. 0Personal Communication 7 11.9Both 6 10. 1
Total 59 100. 0
Sources Author's Investigations.
Both the wholesalers and retailers were relying upon theImethod of direct observation to obtain their price
information. During the period of the study, it was noted that there was no use of mass media, such as the radio or newspapers, to publish price information for cooking bananas, yet this could have been of great help for all the wholesalers, retailers and farmers.
4.1.2.4 Use of Weights and Measures in the marketing of cooking bananas
During the study, it was observed that weights and measures were not being used in the marketing of cooking bananas in Kampala City. Hence direct comparison of bunches of cooking bananas w b b difficult. Comparisions were based on the lifting of individual bunches of bananas to ascertain which one would be heavier or by
39mere observation. This implies that the pre-conditions for a high degree of market transparency were apparently poor. In addition, and quite often, the bunches of cooking bananas would be bruised while loading in the buying centres and while offloading in the markets in Kampala City, but that would not affect the sales.
4.1.3 Market entry.Decisions to enter a trade are usually made on the basiB of the prospective traders' perception of the profits being earned by those already in the business. Barriers to market entry reduce the threat of potential competition and therefore influence marketingIefficiency. Barriers to market entry could result from lack of managerial ability, lack of capital, legal barriers as well as aggressive reactions by those already in business to the new-comers.
4.1.3.1 Lack of managerial ability.I t v c c nctcr* i h ^ t r r i b i t r a i n i n g rerjui r e d f o r
the banana wholesalers. The business was learnt by doing. Indicators of managerial ability are formal education, vocational training and business experience. Completion of the first seven years of formal education is assumed to be adequate for the wholesalers to possess some knowhow for a business like marketing of cooking bananas. All the wholesalers indicated that they had had at least primary education while 47.8 percent hBd obtained secondary education.
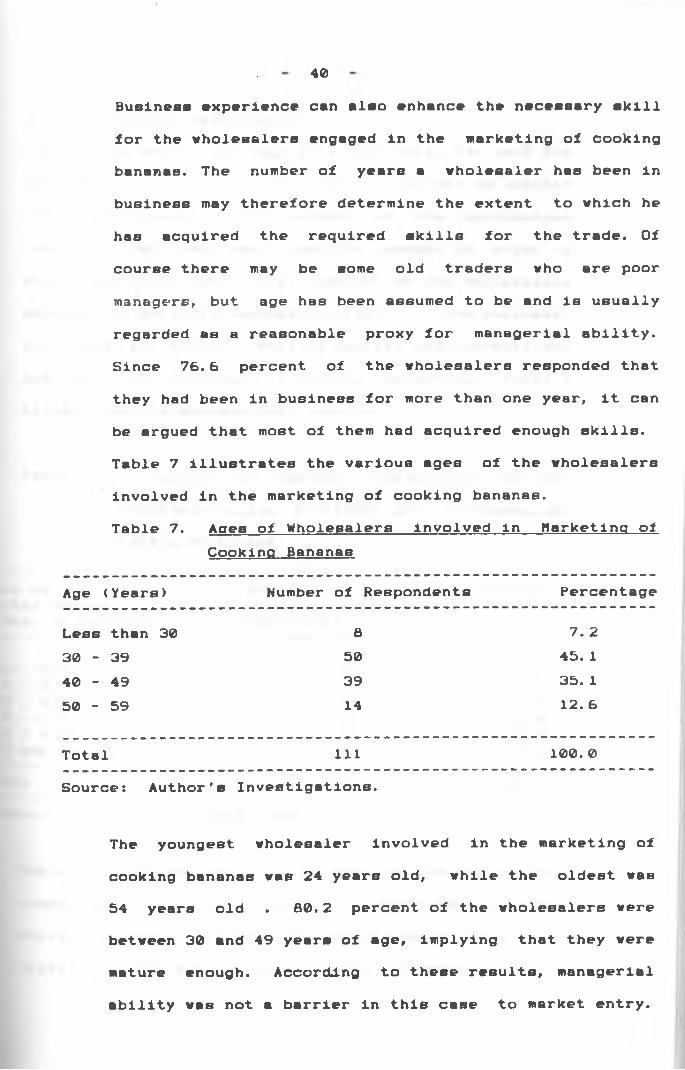
40Business experience can also enhance the necessary skill for the wholesalers engaged in the marketing of cooking bananas. The number of years a wholesaler has been in business may therefore determine the extent to which he has acquired the required skills for the trade. Of course there may be some old traders who are poor managers, but age has been assumed to be and is usually regarded as a reasonable proxy for managerial ability. Since 76.6 percent of the wholesalers responded that they had been in business for more than one year, it can be argued that most of them had acquired enough skills. Table 7 illustrates the various ages of the wholesalers involved in the marketing of cooking bananas.Table 7. Ages of Wholesalers Involved in Marketing of
Cooking Bananas
Age (Years) Number of Respondents Percentage
Less than 30 8 7. 230 - 39 50 45. 140 - 49 39 35. 150 - 59 14 12. 6
Total 111 100. 0
Source: Author's Investigations.
The youngest wholesaler involved in the marketing of cooking bananas was 24 years old, while the oldest was 54 years old . 80. 2 percent of the wholesalers were between 30 and 49 years of age, implying that they were mature enough. According to these results, managerial ability was not a barrier in this case to market entry.
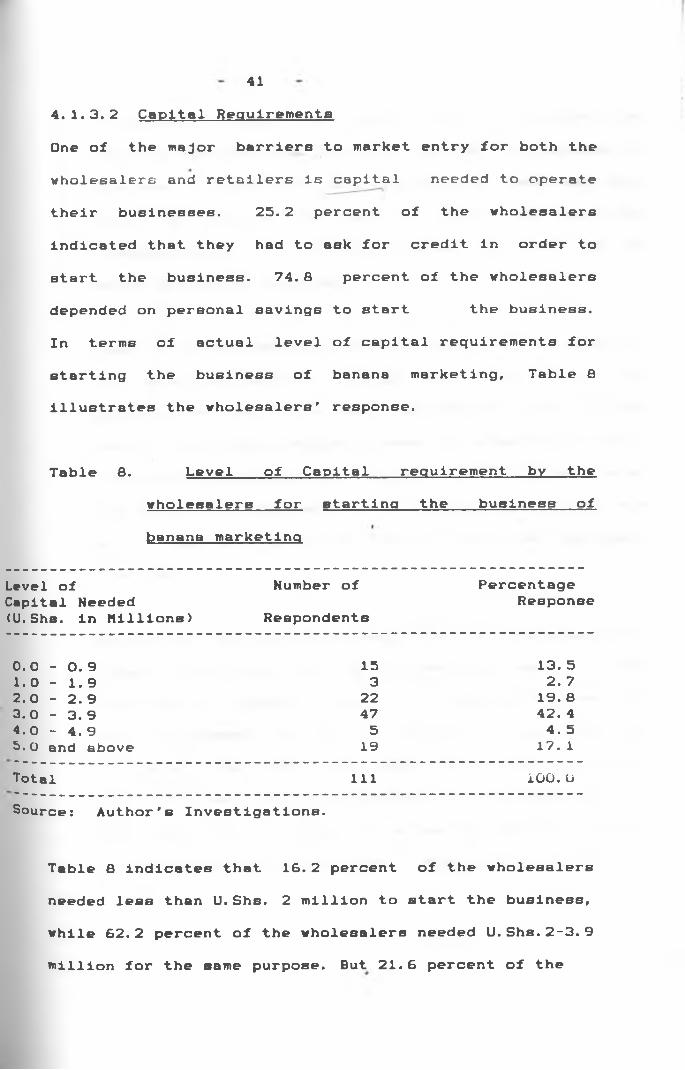
414. 1.3.2 Capital RequirementsOne of the major barriers to market entry for both the wholesalers and retailers is capital needed to operate their businesses. 25.2 percent of the wholesalers indicated that they had to ask for credit in order to start the business. 74.8 percent of the wholesalers depended on personal savings to start the business.In terms of actual level of capital requirements for starting the business of banana marketing, Table 8 illustrates the wholesalers' response.
Table 8. Level of Capital requirement by thewholesalers for starting the business of banana marketing
Level ofCapital Needed(U. Shs. in Millions)
Number of Respondents
PercentageResponse
0. 0 - 0. 9 15 13. 51.0 - 1.9 3 2. 72. 0 - 2. 9 22 19. a3. 0 - 3.9 47 42. 44.0 - 4.9 5 4. 55. 0 and above 19 17. 1Total 111 100. OSource: Author's Investigations.
Table 8 indicates that 16.2 percent of the wholesalers needed less than U.Shs. 2 million to start the business, while 62.2 percent of the wholesalers needed U.Shs.2-3.9 million for the same purpose. But 21.6 percent of the
42wholesalers needed at least U.Shs. 4 million for starting the business. Starting capital Is crucial In business transactions and wholesalers need cash with which to acquire the working stock and pay for transportation of cooking bananas as well as in establishing the business.
Most of the wholesalers indicated that they had acquired the starting capital through their own efforts or personal savings. This could explain why most of them had to form partnerships to raise the starting capital. Since the wholesalers could form partnerships and raise the needed starting capital, it appears that capital was
Inot a barrier to market entry for the wholesale business.
Since the initial capital requirements by retailers are lower than those of the wholesalers, most of them depended on personal or family savings for starting their businesses. Only 13.6 percent of the retailers indicated that they had asked for credit to start their business, while 86.4 percent of the retailers did not need credit. Table 9 shows the level of capital requirements by the retailers to start the business.
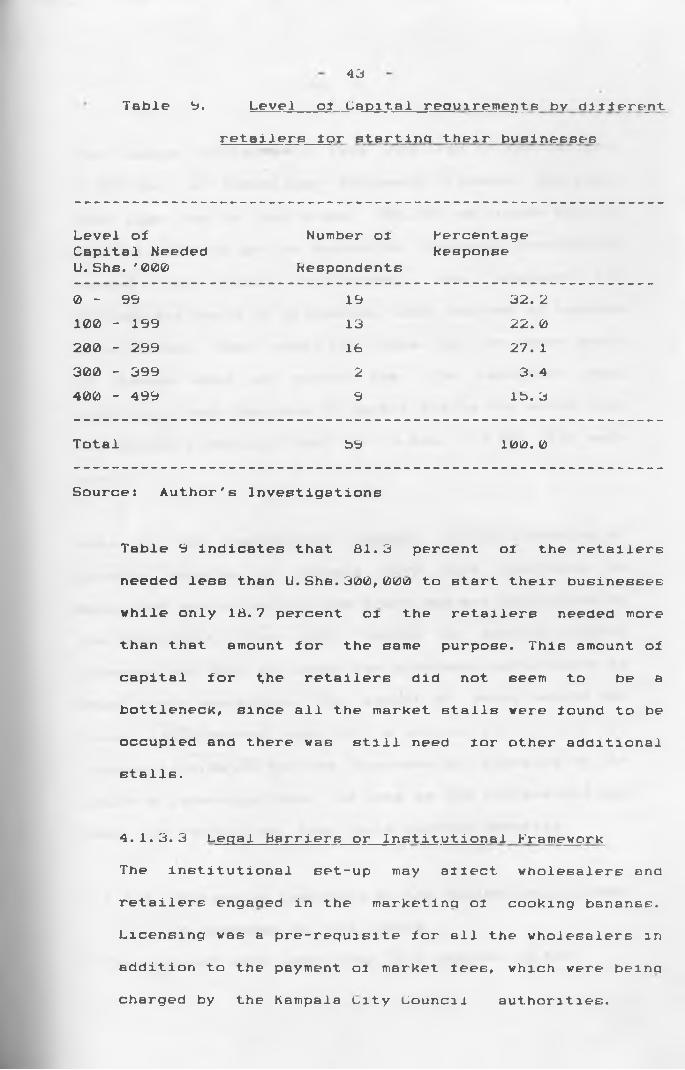
43Table 9. Level oi Capital requirements by dllf erejnt
retailerslor starting their businesses
Level of Capital Needed U. Shs. '000
Number oi Respondents
PercentageResponse
0 - 99 19 32. 2100 - 199 13 22. 0200 - 299 16 27. 1300 - 399 2 3. 4400 - 499 9 lb. 3
Total S9 100. 0
Source: Author's Investigations
Table 9 indicates that 81.3 percent oi the retailers needed less than U. Shs. 3(00, 000 to start their businesses while only 18.7 percent oi the retailers needed more than that amount for the same purpose. This amount oi capital for t,he retailers did not seem to be a bottleneck, since all the market stalls were iound to be occupied and there was still need lor other additional stalls.
4.1.3.3 Legal Barriers or Institutional Framework The institutional set-up may aiiect wholesalers and retailers engaged in the marketing oi cooking bananas. Licensing was a pre-requisite for all the wholesalers in addition to the payment oi market lees, which were beingcharged by the Kampala city Council authorities.
44
The banana wholesalers were required to pay U. Shs. 2,500 for a travelling wholesale licence per year. They also had to pay U.Shs. 500, 000 as income tax per year in order to get an income tax clearance certificate needed for their businesses. And whenever thewholesalers would be offloading their bunches of bananas at a market, they would pay U.Shs. 200 for every bunch of banana sold as market fee. The retailers were operating their business in market stalls for which they had to pay a monthly rent of U.Shs. 13,000 for each stall.
INone of the wholesalers engaged in the marketing of cooking bananas in Kampala City were operating as appointed agents because the trade was not controlled by the government. They only needed to acquire trading licences and have an Income tax clearance certificate to start their operations. The amount of money needed for these legislations was not a serious barrier f z r the traders interested in this business as revealed by the author's investigations. As long as the wholesalers had these pre-requisites, they would operate smoothly.
4.1.3.4 Aggressive reactions bv the Wholesalers already in business to new comers
It has already been noted that 76.6 percent of the
45wholesalers had been In business for more than one year. Only 23. 4 pecent of the wholesalers had been inbusiness for e period less than one year.
From the author's investigations there was no case reported involving aggressive reactions by theestablished wholesalers towards the new comers into the business of marketing cooking bananas.
All the above interplaying factors tended to influence the nature of competition in the market for cooking bananas. A further understanding of the functioning of the market for cooking bananas was obtained by looking at the conduct of both the wholesalers and theretailers.
4. 2. THE CONDUCT OF THE MARKET FOR COOKING BANANAS 1M
KAMPALA
The term conduct refers to the patterns of behaviour)
that market participants follow in adjusting to thebuying or selling conditions in the market place (Maritim 1982). It refers to the nature of pricing policies adopted by the market participants and how the prices are determined. Forms of competition, terms of payment, and actions to avoid competition are alsoconsidered.
46Market conduct of the retailers and wholesalers involved in the marketing of cooking bananas in Kampala City was analysed separately for each group of traders. The conduct of market retailers is considered under subsection 4.2.1, while that of market wholesalers is considered under sub-section 4.2.2.
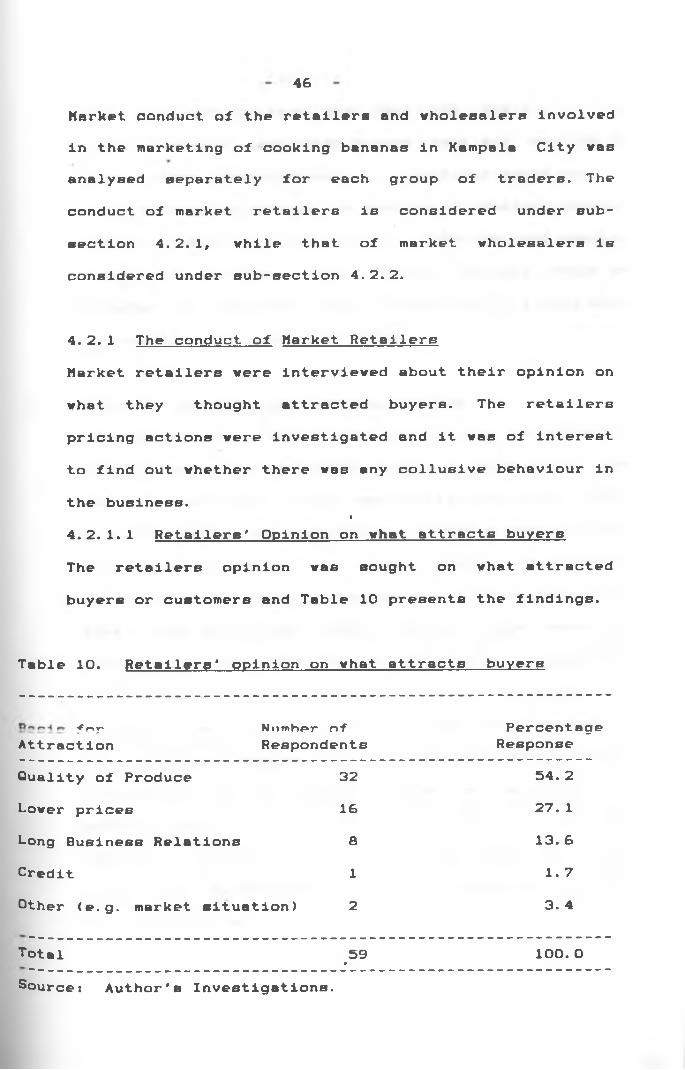
4.2.1 The conduct of Market RetailersMarket retailers were interviewed about their opinion on what they thought attracted buyers. The retailers pricing actions were investigated and it was of interest to find out whether there was any collusive behaviour in the business. I4.2.1.1 Retailers' Opinion on what attracts buyersThe retailers opinion was sought on what attracted buyers or customers and Table 10 presents the findings.
Table 10. Retailers' opinion on what attracts buyers
fr>T Number of PercentageAttraction Respondents Response
Quality of Produce 32 54. 2
Lower prices 16 27. 1
Long Business Relations a 13. 6
Credit 1 1.7
Other (e.g. market situation) 2 3. 4
Total 59• 100. 0Source: Author's Investigations.
47The retailers opinion was that the quality of the cooking bananas attracted buyers most and selling at lower prices ranked second. Although there were noset standards as regards the quality of cooking bananas, regular customers could easily identify good quality bananas for purchase. Good quality bananas would be expected to be mature, easy to peel and of a good size or over 15 kg in weight per bunch.
4.2.1.2 The Retailers' pricing actionsThe retailers were found to be determining the prices of cooking bananas at the market places. In most cases, the retailers aimed at a target margin of about U.She. 2,000
lto 4,000, which they were adding to the purchase prices in order to arrive at the retail prices. The average retail price of cooking bananas in the markets at the time of the study was U.Shs. 17,780. This method of pricing is described as the cost-plus pricing method. This method of pricing would help the retailers to realize e teroet income. About 79.7 percent ofthe retailers indicated that they would not sell their bananas without cash payment since they were also not getting credit termB from the wholesalers. The 20.3 percent of the retailers who indicated that they could offer credit terms would be having personal relationswith the customers.
464.2.1.3 Behaviour of the Market RetalleBNoting that most of the retailers were found to be determining the prices of cooking bananas at the market places, collusive behaviour could be suspected. In addition, 81.4 percent of the retailers indicated that they did not know prices in other markets in KampalaCity, other than the ones in vhich they vould beoperating. This could add to the suspicion of collusive behaviour in their transactions, but this may as veil be a problem associated with lack of adequate market information.
Most of the retailers' purchases were done early in thelmornings when there vould usually be very fev customers. And it vould involve some bargaining vith thevholesalers. The retailers vould thus probably agreebetveen themselves at a range of prices to charge the customers and this could influence the market prices and similarly the market competition.
4. 2. 2 The Conduct of Market Wholesalers or Lorry Traders The market vholesalers vere intervieved about their market opinion on vhat they thought attracted buyers, vho in this case vere the retailers. The vholesalers pricing actions vere investigated as veil as their behaviour in the market places.
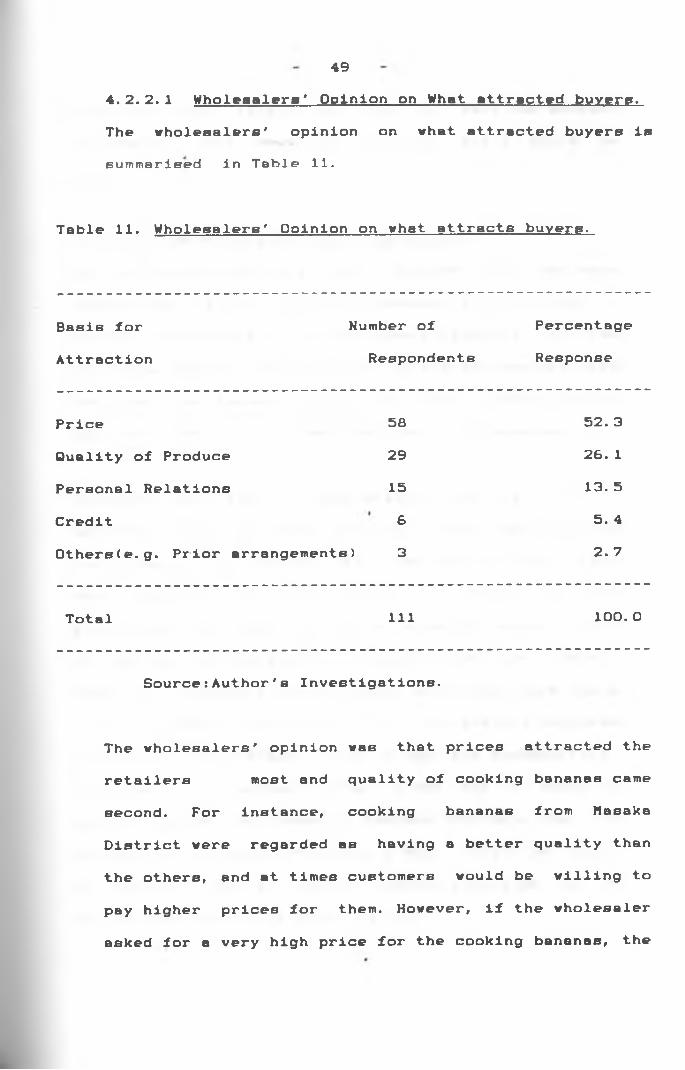
494.2.2.1 Wholesalers' Opl nlon on What attracted buyers. The wholesalers' opinion on what attracted buyers Issummarised in Table 11.
Table 11. Wholesalers' Opinion on what attracts buyers.
Basis for Attraction
Humber ofRespondents
PercentageResponse
Price 58 52. 3
Quality of Produce 29 26. 1
Personal Relations 15 13. 5
Credit S 5. 4
Dthers(e.g. Prior arrangements) 3 2. 7
Total 111 100. 0
Source:Author's Investigations.
The wholesalers' opinion was that prices attracted the retailers most and quality of cooking bananas camesecond. For instance, cooking bananas from Masaka District were regarded as having a better quality than the others, and at times customers would be willing to pay higher prices for them. However, if the wholesaler asked for a very high price for the cooking bananas, the
50retailers would reject the offer and wait for another wholesaler, with whom an agreeable price would be sought.
4.2.2.2 The Wholesalers * pricing actions.Most of the wholesalers also indicated that they were determining prices of cooking bananas at the marketplaces. This usually involved some bargaining with the retailers. However 58.6 per cent of the wholesalers said that they knew banana prices in other markets, other than the ones in which they would sell the bananas.
Like the retailers, the wholesalers aimed at a targetImargin in their pricing actions, which employed the cost-plus pricing method. The wholesalers would take into consideration the transport charges and the purchase price, while aiming at a target margin. 93.7 per cent of the wholesalers indicated that they did not offer the retailers credit terms, since they were using cnch for their operations The wholesalers purchase price was on average L). Shs. 6,180; the transporters' charge was on average U.Shs. 3,400 for a bunch of cooking bananas delivered in Kampala City such that the wholesale price would be about U.Shs. 13, 470 per bunch of cooking bananas, after making provision for a wholesalers' margin of U.Shs. 3,860.
514.2.2.3 Behaviour of the Market Wholesalers.Since the majority of the wholesalers were determining the prices of cooking bananas at the market-places, their behaviour could easily be Influenced by collusive tendencies. In addition their pricing methods which aimed at specific target margins also point to some collusive behaviour. This type of behaviour by the wholesalers was more prevalent in March 1987, when there was a fuel shortage and the banana supply was reduced. In response the prices shot up from an average of U.Shs 17,780 to over U.Shs 30,000 per bunch of cooking bananas. However, this situation was consideredabnormal and is not given much treatment in this thesis.
•
4.3 HYPOTHESES TESTINGFour hypotheses were tested with regard to the objectives of the study.1. To test the hypothesis which states that "There Is no single wholesaler that is controlling the market", a Lorenz concentration curve was estimated and is given on page 35. From this figure, 10 percent of thewholesalers were found to be controlling 24 percent of the business, while 20 percent of them controlled 40 percent of the business. Similarly, 50 percent of the wholesalers controlled 72 percent and 80 percent of them controlled 92 percent of the business.
52This information suggests that the business of cooking bananas in Kampala City is not being controlled by a fev wholesalers. Alternatively it suggests that there iscompetition in the business. Therefore, the hypothesis is not rejected.2. To test the hypothesis which states that "The retail price of cooking bananas is influenced by the level of producer prices ", a simple regression analysis was carried out . The results of the estimate of the regression equation were:
X* * - 4. 49 ♦ 0.599 X, (see Appendix 4) where,
Xt « consumer or retail priceX* * producer price
From Appendix 4, the regression showed a probability of 0.000 and a Student's t-value of 7.689. These resultssuggest that the influence of producer prices on thelevel of retail prices was highly significant. This indicates that the wholesalers are likely to beinfluencing the retail prices in the market. Hence the hypothesis can not be rejected.3. To test the hypothesis which states that " The areas around Kampala are no longer the main source of cooking bananas for the city markets", the information already documented plus the results of this study were used. According to studies conducted by Mukwaya (1962) and Oloya »t al (1972), Hukono District was the main source of cooking bananas for the Kampala City markets: it used to supply about 80 percent, while Masaka
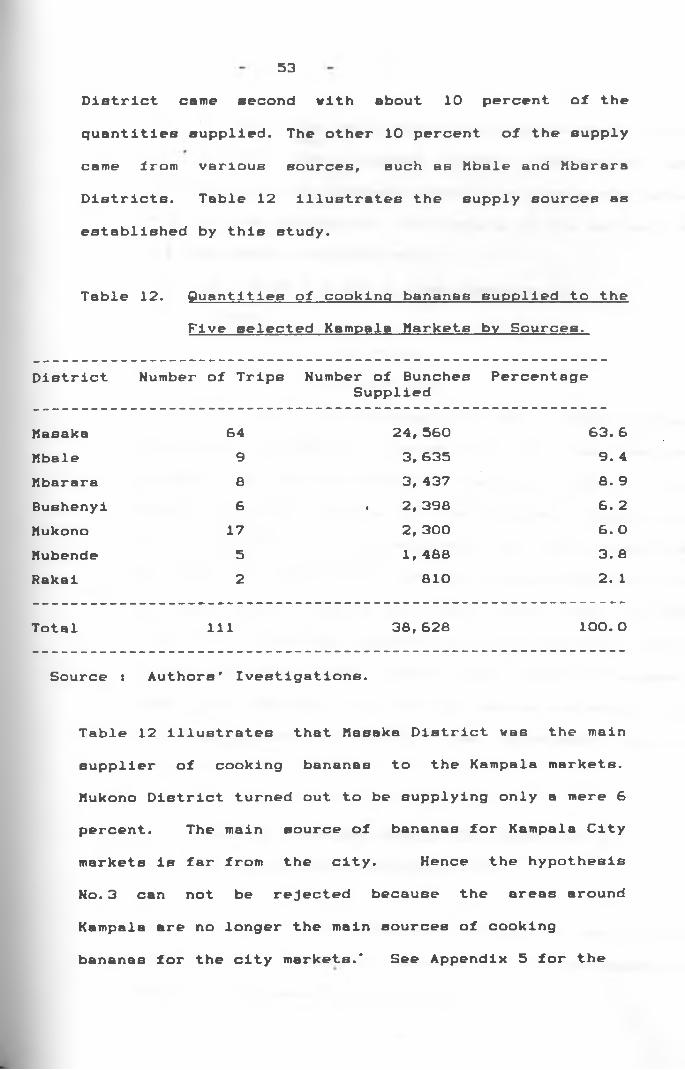
53District came second with about 10 percent of the quantities supplied. The other 10 percent of the supply came from various sources, such as Mbale and Mbarara Districts. Table 12 illustrates the supply sources as established by this Btudy.
Table 12. Quantities of cooking bananas supplied to the Five selected Kampala Markets by Sources.
District Number of Trips Number of Bunches Supplied
Percentage
Masaka 64 24,560 63. 6Mbale 9 3, 635 9. 4Mbarara 6 3, 437 8. 9Bushenyi 6 . 2,398 6. 2Mukono 17 2, 300 6. 0Mubende 5 1, 488 3. aRakai 2 810 2. 1
Total 111 38,628 100. 0
Source s Authors’ Ivestigations.
Table 12 illustrates that Masaka District was the main supplier of cooking bananas to the Kampala markets. Hukono District turned out to be supplying only a mere 6 percent. The main source of bananas for Kampala City markets is far from the city. Hence the hypothesisNo. 3 can not be rejected because the areas around Kampala are no longer the main sources of cooking bananas for the city markets.* See Appendix 5 for the
-54-
4. To test the hypothesis which states that "Price
markups for the cooking banana wholesalers areft
influenced by the transport costs, " a sample regression
analysis was carried out. The results of the estimate of
the regression equation were:
Xt = 0. 06 ♦ 0.8165 Xi (see Appendix 11)
where,
XE = price markup
X, = transport cost
From Appendix 11, the regression showed a probability of
0.000 and a Student's t-value of 12.761. These results
suggest that the influence of transport costs on the
level of price markups for the wholesale traders was
highly significant. This suggests that the wholesalers
may have been determining the price markups based on the
transport costs. Also it was noted else where in the
study that they were aiming at a target margin in their
pricing actions. These ideas would therefore suggest
that the behaviour of the wholesalers was subject to
collusive tendencies. As such, the hypothesis can not bfc
rejected.
4. 4 MODES OF TRANSPORT USED IN THE MARKETING OF
COOKINGI BANANAS IN KAMPALA CITY
Table 13 shows the modes of transport used in the
marketing of cooking bananas in the five selected
markets in Kampala City by sources.
55
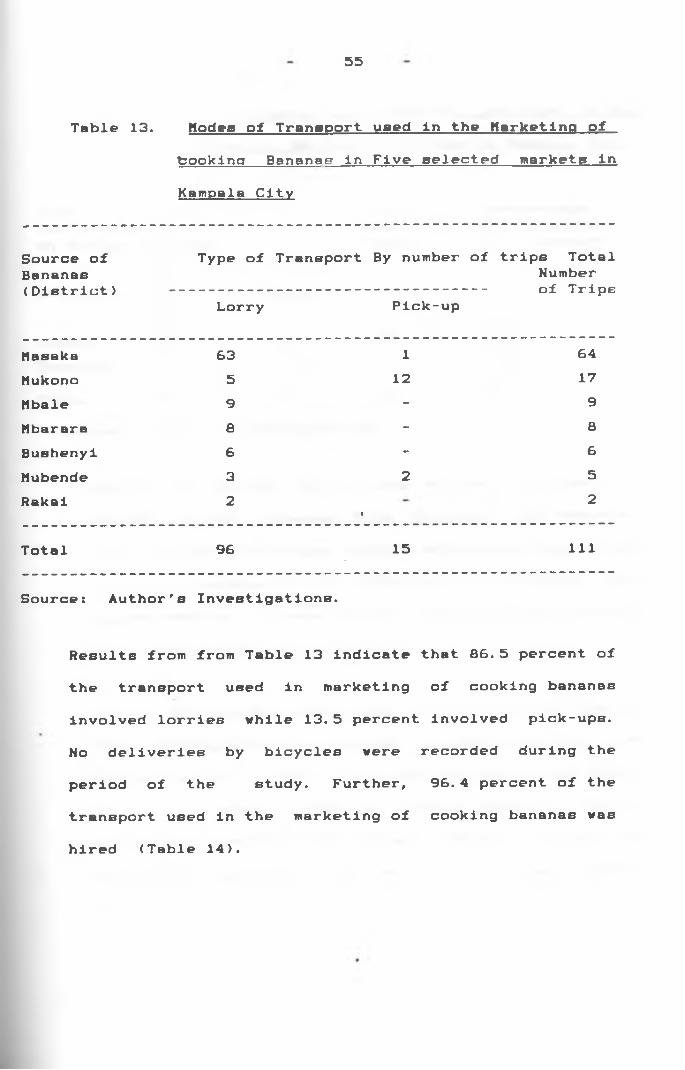
Table 13. Modes of Transport used In the Marketing of booking Bananas In Five selected markets In Kampala City
Source of Type of Transport By number of trips TotalBananas(District)
Numberof Trips
Lorry Pick-up
Hasaka 63 1 64Mukono 5 12 17Mbale 9 - 9Mbarara 6 - 8Bushenyi 6 - 6Mubende 3 2 5Rakai 2 1 2
Total 96 15 111
Source: Author's Investigations.
Results from from Table 13 indicate that 86.5 percent of the transport used in marketing of cooking bananas involved lorrieB while 13. 5 percent involved pick-ups. No deliveries by bicycles were recorded during the period of the study. Further, 96.4 percent of the transport used in the marketing of cooking bananas washired (Table 14).
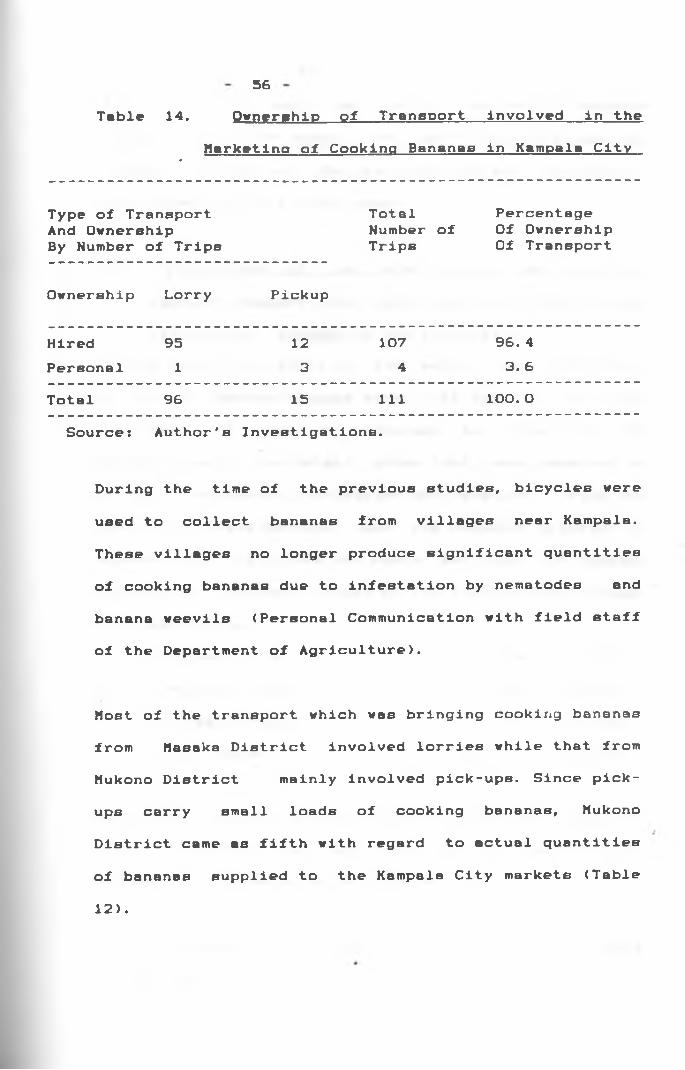
56Table 14. Ownership of Transport involved in the
Marketincr of Cookina Bananas in Kampala Citv•
Type of Transport And Ownership By Humber of Trips
Total Number of Trips
Percentage Of Ownership Of Transport
Ownership Lorry Pickup
Hired 95 12 107 96. 4Personal 1 3 4 3. 6Total 96 15 111 100. O
Source: Author'8 Investigations.
During the time of the previous studies, bicycles wereused to collect bananas from villages near Kampala.
These villages no longer produce significant quantitiesof cooking bananas due to infestation by nematodes and
banana weevils (Personal Communication with field staffof the Department of Agriculture).
Most of the transport which was bringing cooking bananas from Hasaka District involved lorries while that from Mukono District mainly involved pick-ups. Since pickups carry small loads of cooking bananas, Mukono District came as fifth with regard to actual quantities of bananaB supplied to the Kampala City markets (Table
12).
37Agai n pick-ups would be mostly involved in shorter journeys like from Mukono area, particularly because the roads to Masaka and Kbarara Districts were reported by wholesalers to be in poor shape.
4.5 Proportions of the retail price per bunch of Cooking bananas that are received by the grower, transporter, wholesaler and retailer:-
Noting from the results of the study that the retail prices of cooking bananas were quite high for the urban consumers, it was of interest to find out the proportions of the retail price that were received by grower, transporter, wholesaler and retailer. From the author's investigations (see the computer printout in Appendix 4), the prices and costs per bunch of cooking bananas at different stages of the distribution channel were as follows:-
Purchase Price U. Shs. 6, 180.
Transport costs U. She. 3, 430
Wholesale Price « 13, 470
Retell Price « 17,780
Hence the proportions of the retail price per bunch of cooking bananas that were received by the different marketing intermediaries were as belows-
The grower: ( 6180 17,780) x 100 e 34.8percent.
The Transporter! percent.
58■= 19. 3( 3,430 -i- 17,780) x 100
The Wholesaler: ( 3,860 17,780) x 100 * 21.7percent.The Retailer: ( 4,310 17,780) x 100 = 24.2percent.
The results of this analysis suggest that the grower received the highest proportion of the retail price for a bunch of cooking bananas. However, this proportion of 34.8 percent may not all have gone to the grower because, for the purpose of data analysis, the wholesalers' purchase price was assumed to be theIfarmgate price.
Based on Figure 2, one may expect some cooking bananas to be bought by traders from rural markets or assembly points and then be resold later in urban markets. This suggests that the recorded purchase price of U.Shs. 6,180 ray not have been the farmge+e price since there were reports of farmers eelJing bunches of cooking bananas for a price as low as U.Shs. 1,000 (Uganda, New Vision. Nov. 1986).
The proportion received by transporters was 19.3 percent, and this is far above that reported by Hays (1975) for the Nigerian farmers, which was between 2
59and 4 percent of the retail prices. The transporters complained mainly of bad roads (both the trunk and feeder roads) as well as high costs of spare parts for their vehicles to Justify their high transport charges. The results of the study suggest that the marketing intermediaries as a group i.e. the wholesalers, transporters and the retailers, received the largest share of at least 65.2 percent of the retail price of cooking bananas, when they are all considered together. Bananas are vulnerable to spoilage due to their perishability. Banana prices are influenced by this
factor.
CHAPTER FIVE
CONCLUSION AND RECOMMENDATIONS
The conclusion and recommendations oi this study are
presented in sections 5.1 and b.2 respectively.
5.1 CONCLUSION
Many less Developed Countries (LDCs), are characterised
by various marketing problems, such as lack oi market
information, transport, poor roads and shortage oi
suitable market outlets and there is need to improve the
marketing systems in LDCs (Hays, 1S7S). This is true lor
Uganda. A good marketing system can, ior instance,
stimulate production and consumption, create employment
and bring about higher incomes ior farmers, and this
eventually contributes to the overall development oi the
economy.
The marketing system for cooking bananas in Kampala City
in particular and Uganda as a whole was found to be
functioning entirely in the hands oi the private sector.
This entails mobilization oi private capital and
entrepreneurship.
The results oi this study indicate that the marketing oi
cooking bananas in Kampala City is not dominated by a
few wholesalers since 20 percent oi them were
controlling 40 percent oi the business. Market
£1
transparency was noted to be poor. Mass media were not being used to publish price information. Hence dissemination of price information between different markets was minimal.
Barriers to market entry reduce market competition. This can easily result in increased prices and the volume of the business may also be greatly affected. No serious barriers to market entry were noticed with regard to either lack of managerial ability, aggressive reactions by established traders to new-comers or the legal barriers. The majority of the wholesalers and retailers depended on personal or family savings to start their businesses. Those who would manage to get loans would acquire them through private sources.
Quality of the cooking bananas was regarded by the retailers as the most important factor in attracting buyers. Selling the cooking bananas at a lower price was the second attraction. The retailers were using cash for their day to day operations. Most of them indicated that they were determining the prices of cooking bananas at the market places. This factor could easily lead to collusion among themselves.
Prices and quality of the cooking bananas were regarded by the wholesalers as the most important factors for

62attracting their customers, who are the retailers. The wholesalers were also using cash in all their transactions. Collusion among the wholesalers was also suspected since it was found out that they were determining the prices of cooking bananas at the market places. It was also noted that price markups lor the wholesalers involved in this trade were being influenced by the transport costs.
These results lead us to conclude that the volume of trade in cooking bananas in Kampala City was not concentrated in the hands of a few traders while the conduct aspect was subject to collusive tendencies, which could have been the cause of the high prices which prevailed during the period of the study. This situation was, in addition, aggravated by the prevalence of a poor price information dissemination system.
Most of the transport involved in the marketing of cooking bananas was hired and mainly depended on lorries. Masaka District was found to be the main supplier of cooking bananas to the Kampala City markets, having 63.6 percent of the market share.
The marketing Intermediaries, such as the wholesalers, transporters and retailers, were found to be receiving the largest share of the retail price of cooking
63bananas, their combined share being about 65.2 percent. The marketing intermediaries appear to have been taking advantage of the existence of a poor price information dissemination system to charge high prices. Noting thBt cooking bananas were not graded or processed before being marketed, the share of the retail price received by growers could have been expected to be more than what the results show us. This would encourage the growers to produce more and to obtain extra funds for their activities and welfare. Hence there is need, from apolicy point of view, to institute measures which would raise the farmers' share of the retail price.
I5.2. RECOMMENDATIONS.The following suggestions are aimed at improving the marketing system for cooking bananas in Kampala City.
1. Price information needs to be disseminated to all those concerned in the marketing system by all possible means. The radio, newspapers and circulars could be utilized for this purpose. ThiB would help the farmers in their allocative decisions since market prices would be indicative of their expected gains.
2. There is a need to introduce some measures of standards for grading bananas as it was noted that there were no uniform weights and measures involved in the
64marketing of cooking bananas. This would be a long-term plan since these measures would have to be Introduced gradually In all the producing areas where the economy Is still predominantly peasant in nature. Introduction of uniform weights and measures would help to even out price distortions which are largely caused by absence of this facility. If some appropriate packaging would be introduced along with measures of standards, then the quality of the cooking bananas put on the market would be enhanced, through reduced bruising that occurs during handling.
3. Mukono District, which was the main supplier ofl
cooking bananas to the Kampala City markets in the 1960's and early 1970's has been overtaken by other districts, notably Hasaka District. The production of cooking bananas in Mukono District and the other areas around Kampala has been reduced by infestations of banana weevils and nematodes. If any improvement in the production of cooking bananas in these areas is to be expected, then there is need for better husbandry practices and use of modern technology, such as the application of chemical fertilizers, insecticides and nematicides. I
4. Transport used in the marketing of cooking bananas mainly involved lorries which were hired. The hire charges affect the prices at which the bananas are sold
£5to consumers. For instance it was noted that the average transport cost for every bunch of cooking bananasdelivered in a Kampala City market was U.Shs. 3,430. The government or the Cooperative Unions should avail the wholesalers some lorries for hire at cheaper rates. Alternatively, the government or some private authority should carry out a feasibility study to find out the possibility of using rail transport in the marketing of cooking bananas. Bananas are bulky and rail transport would help to move huge loads at a time. But anefficient collection system in the rural areas and an efficient distribution system in Kampala City would have to be established. I
5. Farmers producing cooking bananas should be encouraged to form co-operative societies, so that they can take advantages of size. They can ask for loans to purchase lorries for transporting their bananas through these societies. They would also market their bananas directly, in the final markets, such thet the "'erketfe? intermediaricc would be reduced or eliminatedaltogether. Then the farmers' share of the retail price of cooking bananas would be increased, for their ownadvantage.

-66-
REFEBENCES
1. Burgess A.P. and Burgess H.J.L. 1972. "Nutritional content and value of local foodstuffs". In Nutrition and Food in an African Economy, vol.l. Eds Amman V. F. , Belshav D.G.R. and Stanfield J.P. Makerere University.
2. Hays H. M. 1975. The Marketing and storage of foodgrains in____ Northern Nigeria. Institute ofAgricultural Research . Ahmadu Bello University.
3. Helmberger P.G., Campbell G.R. and Dobson W.D. 1981.I
"Organization and Perfomance of Agricultural Markets".In A survey of Agricultural Economics Literature. ed. Martin L. R. Vol. 3.
4. Jameson J.D. 1970 . Agriculture in Uganda 0.U.P.
5. Kariungi F.T. 1976. " Structure, conduct andperformance of Kitui local Maize Markets". M.Sc.
Thesis U.0.N.
6. Maritim H.K. 1982. "Maize Marketing in Kenya :- An assessment of interregional commodity flow pattern*.Dr. Sc. Dissertation.
677. Mascarenhas A.C. and Mbilinyi S.M. 1966. Research
on Subsidiary staple food marketing in Dar-es- Salaam. Economic Research Bereau Paper 68.16.University College, Dar-eB-Salamm.
8. Mbogoh S.G. 1976. " The Economics of Production andMarketing Potatoes in Meru District, Kenya." M. Sc. Thesis. U. 0. N.
9. Me Crae J.E. 1972. " Food consumption in RuralAreas". In Nutrition and Food in an African Economy. Eds. Amman V.F., Belshav D.G.R. and Stanfield J.P. Makerere University.
10. Mukwaya A.B. 1962. "The marketing of staple foods in Kampala"In Markets in Africa. eds Bohannan P. and Dalton G. North Western University Press.
11 Nyiti 2.A. 1976. "Maize Marketing in Tanga Region,
Tanzania with special reference to illicit
trading". M. Sc. Thesis U.0.N.
12. Oloya J. J. and Poleman T. T. 1972. The Food Supply of Kampala. Makerere Institute of Social Research.
13. Personal Communication: With District AgriculturalOfficers and Field staff of Department ofaAgriculture, Uganda.

6 6
14. Purseglove J.W. 1983. Tropical Crops.Monocotyledons Longman Group.
15. Schmidt G. 1979. Maize and Beans Marketing inKenya. IDS. U. O. N.
16. Republic of Uganda. June 1984. Background to the 1984/85 Budget.Ministry of Planning and Economic Development. Kampala
17. Republic of Uganda. 28th November, 1986. New Vision . Ministry of Information and Broadcasting, Kampala.
16. Republic of Uganda. 22nd October, 1986 "Revision of Salaries and wages”. Circular Standing Instruction No. 7 of 1986. Ministry of Public Service, Entebbe.
19. Republic of Uganda. 1984. Towards a Motions^Food Strategy. Vol. 1 Ministry of Agriculture and Forestry, Entebbe,
I
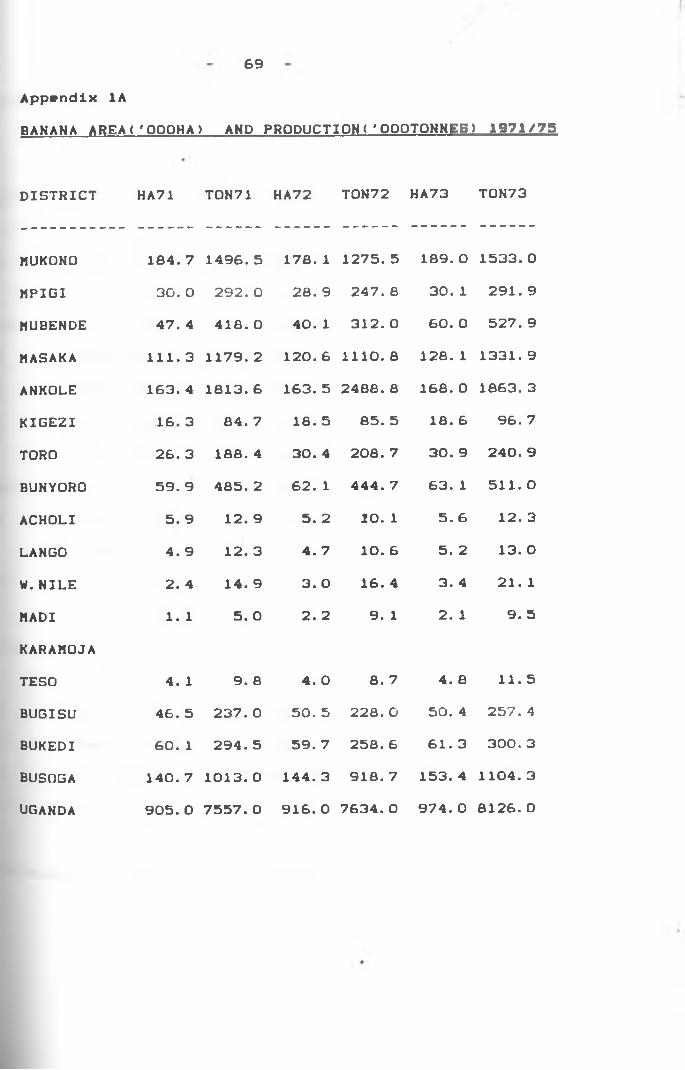
69
BANANA AREA( * OOOHA) AND PRODUCTION( *OOOTONHES) 1971/75Appendix 1A
DISTRICT HA71 T0N71 HA72 T0N72 HA73 T0N73
MUKONO 184. 7 1496.5 178. 1 1275.5 189. 0 1533. 0
MPIGI 30. 0 292. 0 28. 9 247. 8 30. 1 291.9
MUBENDE 47. 4 418. 0 40. 1 312. 0 60. 0 527. 9
MASAKA 111.3 1179.2 120. 6 1110.8 128. 1 1331.9
ANKOLE 163. 4 1813.6 163. 5 2488.8 168. 0 1863.3
KIGE2I 16. 3 84. 7 18. 5 85. 5 18. 6 96. 7
TORO 26. 3 188. 4 30. 4 208. 7 30. 9 240. 9
BUNYORO 59. 9 485. 2 62. 1 444. 7 63. 1 511. 0
ACHOLI 5. 9 12. 9 5. 2 10. 1 5. 6 12. 3
LANGO 4. 9 12. 3 4. 7 10. 6 5. 2 13. 0
W. NILE 2. 4 14. 9 3. 0 16. 4 3. 4 21. 1
MADI 1. 1 5. 0 2. 2 9. 1 2. 1 9. 5
KARAMOJATESO 4. 1 9. 8 4. 0 8. 7 4. 8 11. 5
BUGISU 46. 5 237. 0 50. 5 228. 0 50. 4 257. 4
BUKEDI 60. 1 294. 5 59. 7 258. 6 61. 3 300. 3
BUSOGA 140. 7 1013. 0 144. 3 918. 7 153. 4 1104.3
UGANDA 905. 0 7557.0 916. 0 7634. 0 974. 0 8126. 0
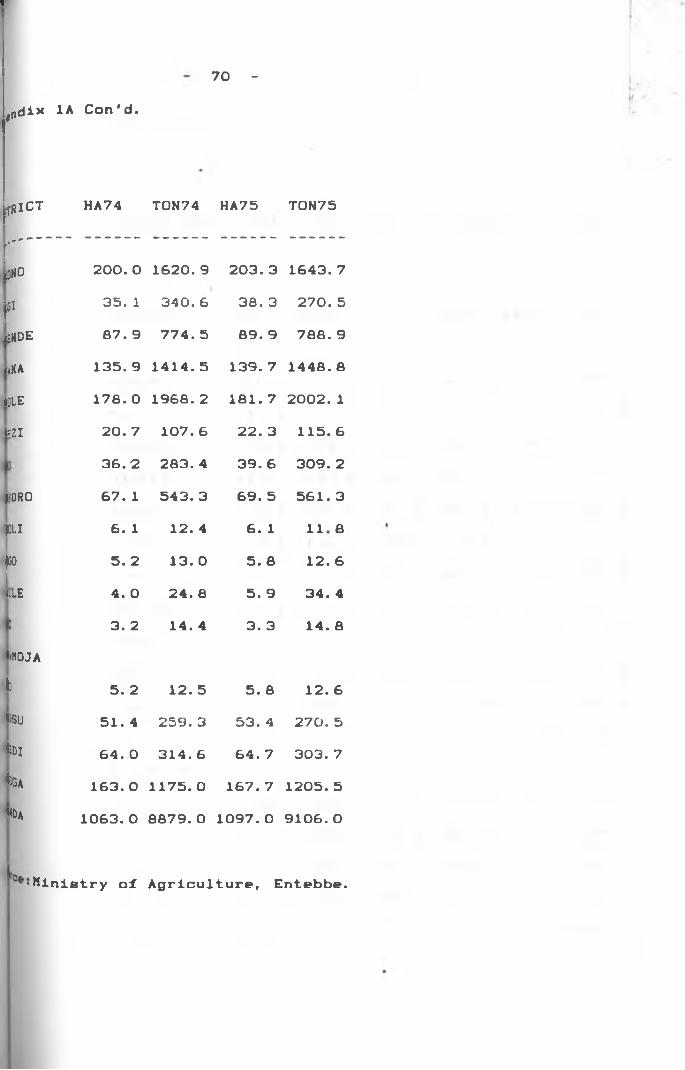
*
70 -
,r>dix 1A Con'd.
jTRICT HA74 T0N74 HA75 T0N75
r"loNO 200. 0 1620.9 203. 3 1643.7
r 35. 1 340. 6 38. 3 270. 5
Iende 87. 9 774. 5 89. 9 788. 9
L a 135. 9 1414.5 139. 7 1448.8
Idle 178. 0 1968.2 181.7 2002.1
L 20. 7 107. 6 22. 3 115. 636.2 283. 4 39. 6 309. 2
I'ORO 67. 1 543. 3 69. 5 561. 3PLI 6. 1 12. 4 6. 1 CO•HH
f5. 2 13. 0 5. 8 12. 6
uLE 4. 0 24. 8 5. 9 34. 4I 3. 2 14. 4 3. 3 14. 8Iuiojajo 5. 2 12. 5 5. 8 12. 6VSU 51. 4 259. 3 53. 4 270. 5Iedi 64. 0 314. 6 64. 7 303. 7Iga 163. 0 1175. 0 167. 7 1205.5Y>k 1063. 0 8879. 0 1097.0 9106.0
Ministry of Agriculture, Entebbe.
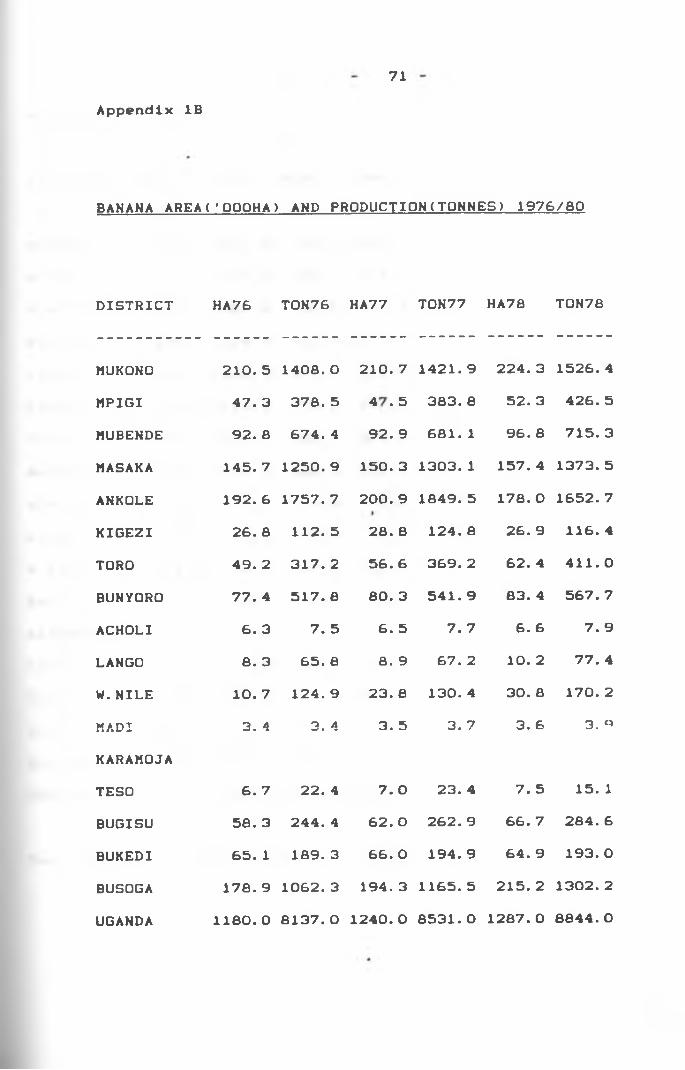
71Appendix IB
BANANA AREA( * OOOHA) AND PRODUCTION(TONNES) 1976/80
DISTRICT HA76 T0N76
MUKONO 210. 5 1408.0MPIGI 47. 3 378. 5MUBENDE 92. 8 674. 4MASAKA 145. 7 1250.9ANKQLE 192. 6 1757. 7KIGEZI 26. 8 112. 5TORO 49. 2 317. 2BUNYORO 77. 4 517. 8ACHOLI 6. 3 7. 5LANGO 8. 3 65. 8W.NILE 10. 7 124. 9KADI 3. 4 3. 4KARAMOJATESO 6. 7 22. 4BUGISU 58. 3 244. 4BUKEDI 65. 1 189. 3BUSOGA 178. 9 1062.3
UGANDA 1180. 0 8137.0
HA77 T0N77 HA78 T0N78
210. 7 1421.9 224. 3 1526.4
in•
* 383. 8 52. 3 426. 592. 9 681. 1 96. 8 715. 3
150. 3 1303. 1 157. 4 1373. 5200. 9 1849.5 178. O 1652.728. 8 124. 8 26. 9 116. 456. 6 369. 2 62. 4 411.080. 3 541. 9 83. 4 567. 7
6. 5 7. 7 6. 6 7. 98. 9 67. 2 10. 2 77. 4
23. 8 130. 4 30. 8 170. 23. 5 3. 7 3. 6 3. «»
7. 0 23. 4 7. 5 15. 162. O 262. 9 66. 7 284. 666. 0 194. 9 64. 9 193. 0194. 3 1165.5 215. 2 1302.2
1240.0 8531.0 1287.0 8844.0
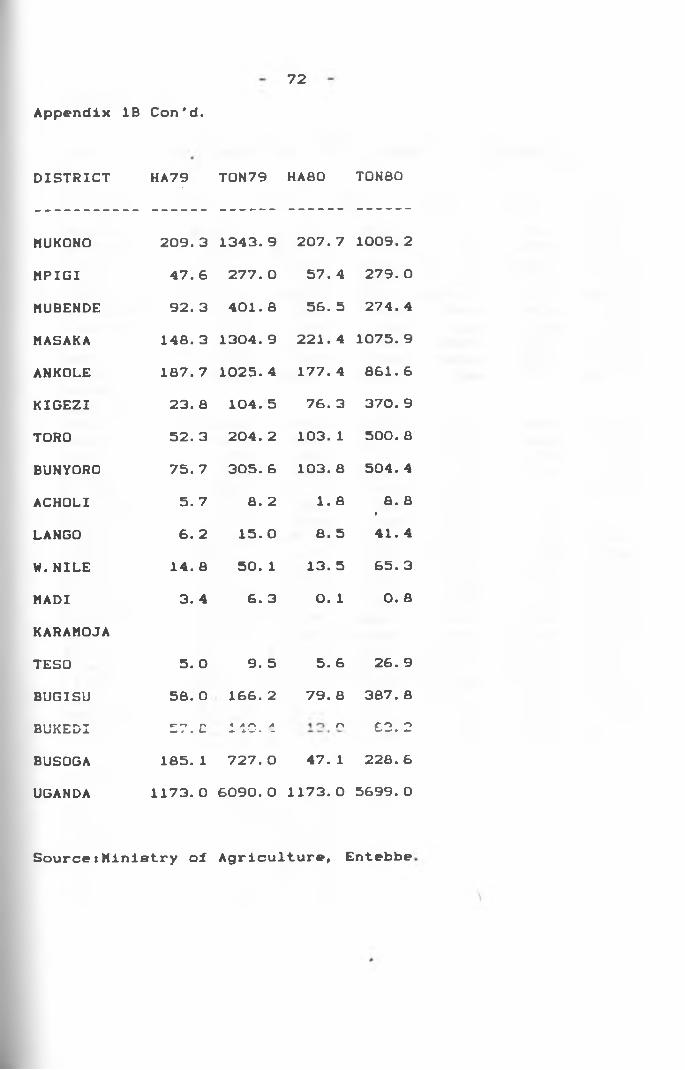
72Appendix IB Con'd.
DISTRICT HA79 T0N79 HA80 T0N80
MUKONO 209. 3 1343. 9 207. 7 1009.2
MPIGI 47. 6 277. 0 57. 4 279. 0
MUBENDE 92. 3 401.8 56. 5 274. 4
MASAKA 148. 3 1304.9 221. 4 1075.9
ANKOLE 187. 7 1025.4 177. 4 861.6
KIGEZI 23. a 104. 5 76. 3 370. 9
TORO 52. 3 204. 2 103. 1 500. a
BUNYORO 75. 7 305. 6 103. a 504. 4
ACHOLI 5. 7 8. 2 l. a a. a1LANGO 6. 2 15. 0 8. 5 41. 4
W.NILE 14. 8 50. 1 13. 5 65. 3
MADI 3. 4 8. 3 0. 1 o. a
KARAMOJATESO 5. 0 9. 5 5. 6 26. 9
BUGISU 58. 0 188. 2 79. 8 387. a
BUKEDI 57. C • a r\ *u. '* w * — r» £3. 2
BUSOGA 185. 1 727. 0 47. 1 228. 6
UGANDA 1173. 0 6090. 0 1173. 0 5699.0
Source:Ministry of Agriculture, Entebbe
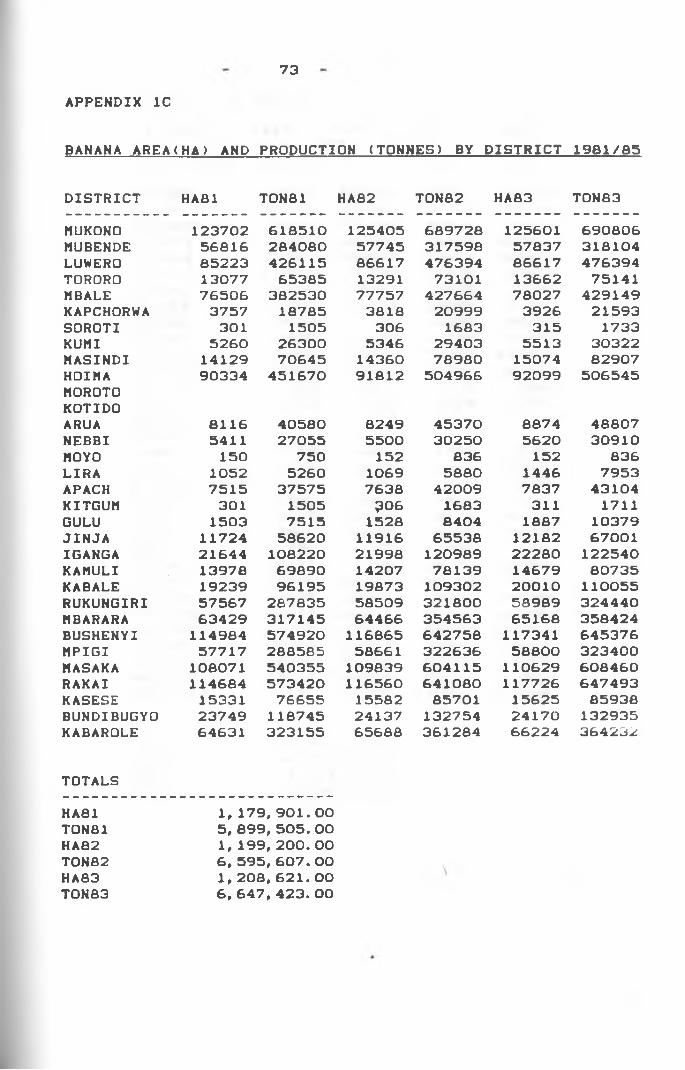
73APPENDIX 1C
BANANA AREA(HA) AND PRODUCTION (TONNES) BY DISTRICT 1961/85
DISTRICT HA81 T0N81 HA82 T0N82 HA83 T0N83MUKONO 123702 618510 125405 689728 125601 690806MUBENDE 56816 284080 57745 317598 57837 318104LUWERD 85223 426115 86617 476394 86617 476394TORORO 13077 65385 13291 73101 13662 75141MBALE 76506 382530 77757 427664 78027 429149KAPCHORWA 3757 18785 3818 20999 3926 21593SORDTI 301 1505 306 1683 315 1733KUMI 5260 26300 5346 29403 5513 30322MASINDI 14129 70645 14360 78980 15074 82907HOIMA 90334 451670 91812 504966 92099 506545MOROTOKOTIDOARUA 8116 40580 6249 45370 8874 48807NEBBI 5411 27055 5500 30250 5620 30910MOYO 150 750 152 836 152 836LIRA 1052 5260 1069 5880 1446 7953APACH 7515 37575 7638 42009 7837 43104KITGUM 301 1505 ?06 1683 311 1711GULU 1503 7515 1528 8404 1887 10379JINJA 11724 58620 11916 65538 12182 67001IGANGA 21644 108220 21998 120989 22280 122540HAMULI 13978 69890 14207 78139 14679 80735KABALE 19239 96195 19873 109302 20010 110055RUKUNGIRI 57567 267835 58509 321800 58989 324440MBARARA 63429 317145 64466 354563 65168 358424BUSHENYI 114984 574920 116865 642758 117341 645376MPIGI 57717 288585 58661 322636 58800 323400HASAKA 108071 540355 109839 604115 110629 608460RAKAI 114664 573420 116560 641080 117726 647493KASESE 15331 76655 15582 85701 15625 85938BUNDIBUGYO 23749 118745 24137 132754 24170 132935KABAROLE 64631 323155 65688 361284 66224 364232
TOTALSHA81 1, 179, 901. 00T0N81 5, 899, 505. 00HA82 1, 199, 200. 00T0N82 6, 595, 607. 00HA83 1, 208, 621. 00T0N83 6, 647, 423. 00
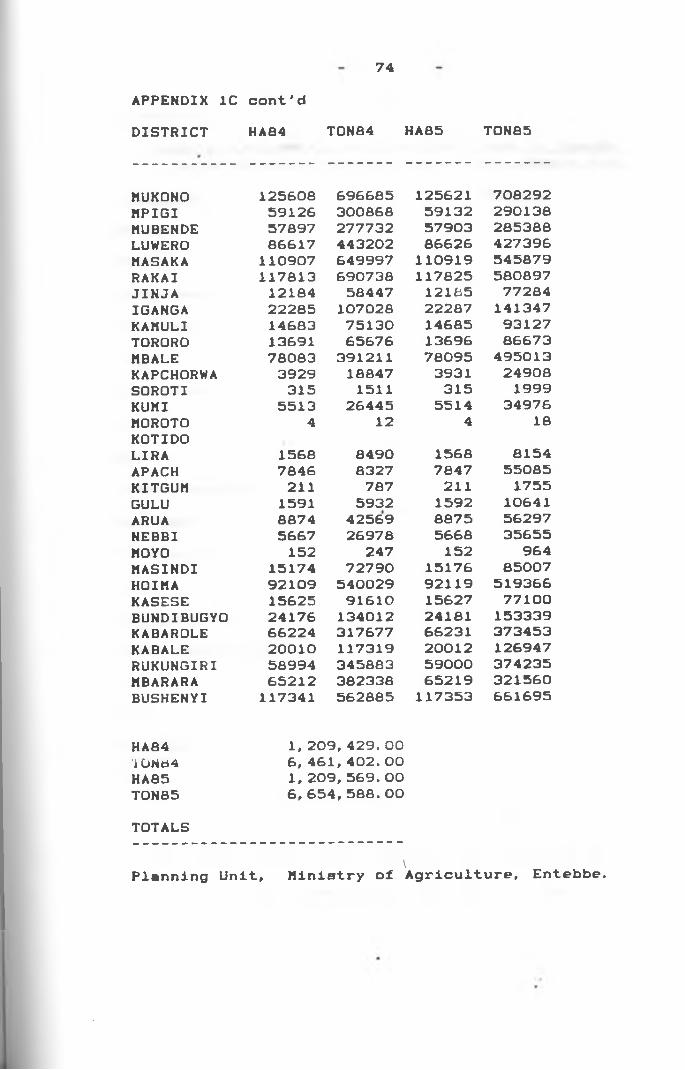
74APPENDIX 1C cont'dDISTRICT HA84 T0N84 HA85 T0N85
MUKONO 125608 696685 125621 708292MPIGI 59126 300868 59132 290138MUBENDE 57897 277732 57903 285388LUWERO 86617 443202 86626 427396MASAKA 110907 649997 110919 545879RAKAI 117813 690738 117825 580897JINJA 12184 58447 12165 77284IGANGA 22285 107028 22287 141347KAMULI 14683 75130 14685 93127TORORO 13691 65676 13696 86673MBALE 78083 391211 78095 495013KAPCHORWA 3929 18847 3931 24908SOROTI 315 1511 315 1999KUMI 5513 26445 5514 34976MOROTO 4 12 4 18KOTIDOLIRA 1568 8490 1568 8154APACH 7846 8327 7847 55085KITGUM 211 787 211 1755GULU 1591 5932 1592 10641ARUA 8874 42569 8875 56297NEBBI 5667 26978 5668 35655MOYO 152 247 152 964MASINDI 15174 72790 15176 85007HOIMA 92109 540029 92119 519366KASESE 15625 91610 15627 77100BUNDIBUGYO 24176 134012 24181 153339KABAROLE 66224 317677 66231 373453KABALE 20010 117319 20012 126947RUKUNGIRI 58994 345883 59000 374235MBARARA 65212 382338 65219 321560BUSHENYI 117341 562885 117353 661695
HA84 1, 209, 429. 00i UNO4 6, 461, 402. 00HA85 1, 209, 569. 00T0N85 6, 654, 588. 00TOTALS
\Ministry of Agriculture, Entebbe.Planning Unit,
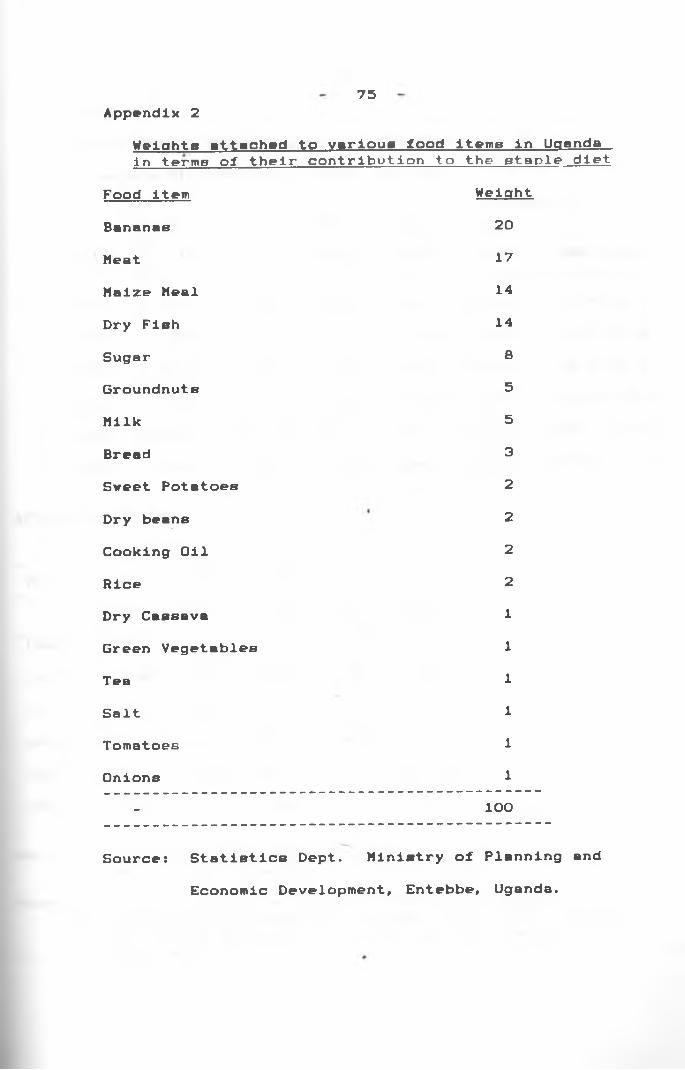
Appendix 275
Weicrhta attached to various food items in UaandaIn terms of their contribution to the staple diet
Food item Weiaht
Bananas 20
Meat 17
Maize Meal 14
Dry Fish 14
Sugar 8
Groundnuts 5
Milk 5
Bread 3
Sweet Potatoes 2
Dry beans 2
Cooking Oil 2
Rice 2
Dry Cassava 1
Green Vegetables 1
Tea 1
Salt 1
Tomatoes 1
Onions 1- 100
Source: Statistics Dept. Ministry of Planning andEconomic Development, Entebbe, Uganda.
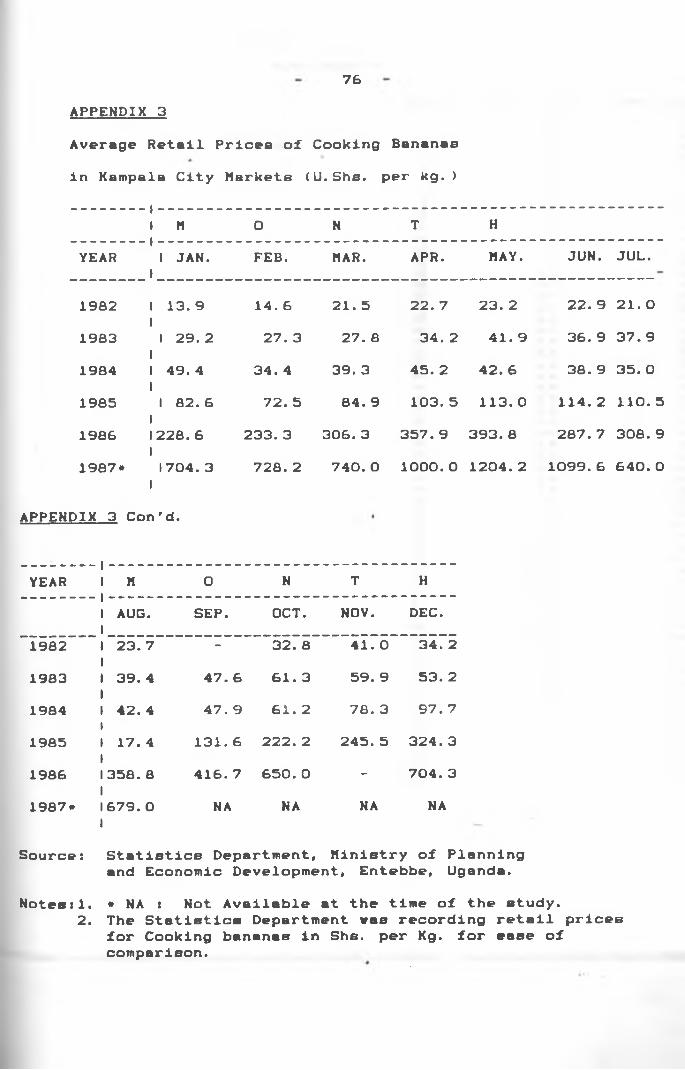
76
Average Retail Prices of Cooking Bantnae in Kampala City Markets (U.Shs. per kg. )
APPENDIX 3
1 M 0 N T HYEAR 1 JAN.
1FEB. MAR. APR. MAY. JUN. JUL.
1982 1 13. 9 14. 6 21. 5 22. 7 23. 2 22. 9 21. 01983
11 29. 2 27. 3 27. 8 34. 2 41. 9 36. 9 37. 9
198411 49. 4 34. 4 39. 3 45. 2 42. 6 38. 9 35. 0
198511 82. 6 72. 5 84. 9 103. 5 113. 0 114. 2 110. 5
1986i1228.6 233. 3 306. 3 357. 9 393. 8 287. 7 308. 9
1987*11704.3 728. 2 740. 0 1000.0 1204. 2 1099.6 640. 0
IAPPENDIX 3 Con'd.
YEAR 1 M 0 N T H1 AUG. SEP. OCT. NOV. DEC.
198211 23. 7 - 32. a 41. 0 34. 2
198311 39. 4 47. 6 61. 3 59. 9 53. 2
198411 42. 4 47. 9 61. 2 78. 3 97. 7
1985 1 17. 4 131. 6 222. 2 245. 5 324. 3
198611358.a 416. 7 650. 0 - 704. 3
1987*11679.0 1
NA NA NA NA
Source: Statistics Department, Ministry of Planningand Economic Development, Entebbe, Uganda.
Notes:1. * NA : Not Available at the time of the study.2. The Statistics Department wbb recording retail prices
for Cooking bananaB in Shs. per Kg. for ease of comparison.
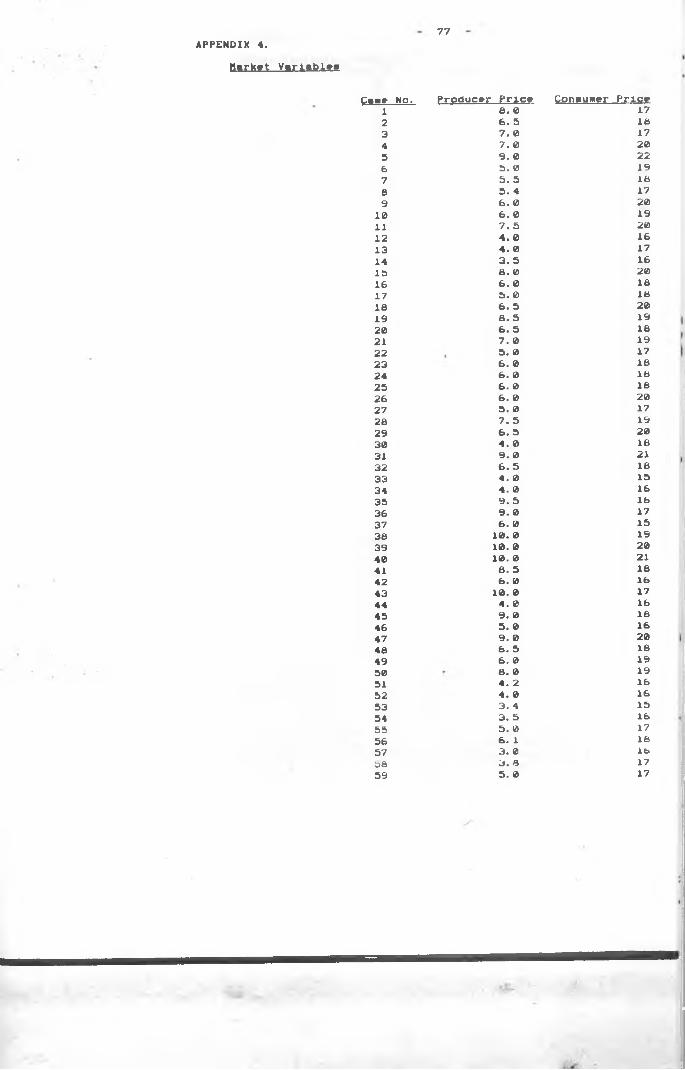
77APPENDIX 4.
Harket VirltblM
gaee No.. Producer Price Consumer Price1 8. 0 172 6. 5 183 7. 0 174 7. 0 205 9. 0 226 5. 0 197 5. 5 168 5. 4 179 6. 0 2010 6. 0 1911 7. 5 2012 4. 0 1613 4. 0 1714 3. 5 1615 8. 0 2016 6. 0 1817 5. 0 1818 6. 5 2019 8. 5 1920 6. 5 1821 7. 0 1922 5. 0 1723 6. 0 1824 6. 0 1825 6. 0 1626 6. 0 2027 5. 0 1728 7. 5 1929 6. 5 2030 4. 0 1631 9. 0 2132 6. 5 1833 4. 0 1534 4. 0 1635 9. 5 1636 9. 0 1737 6. 0 1538 10. 0 1939 10. 0 2040 10. 0 2141 8. 5 1842 6. 0 1643 10. 0 1744 4. 0 1645 9. 0 1646 5. 0 1647 9. 0 2048 6. 5 1649 6. 0 1950 8. 0 1951 4. 2 1652 4. 0 1653 3. 4 1554 3. 5 1655 5. 0 1756 6. i 1657 3. 0 lb58 3. 8 1759 5. 0 17
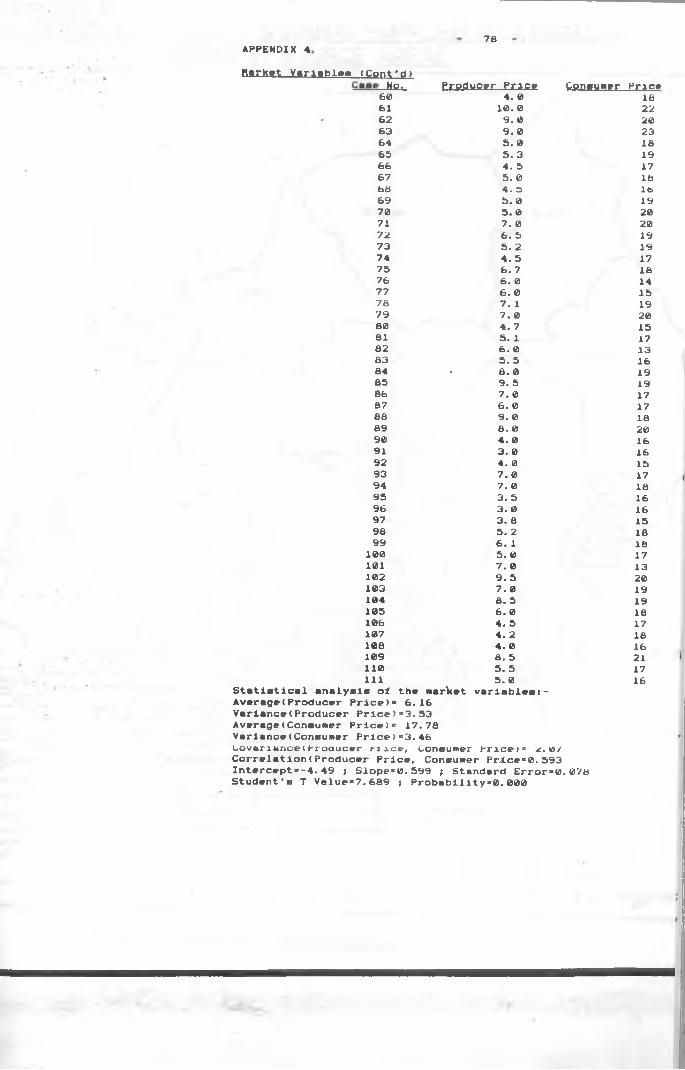
APPENDIX 478
HTk«t V»rl»blM (Cont * d )No. Producer Price Consumer Price
60 4. 0 1861 10. 0 2262 9. 0 2063 9. 0 2364 5. 0 1865 5. 3 1966 4. 5 1767 5. 0 1868 4. a lb69 5. 0 1970 5. 0 2071 7. 0 2072 6. 5 1973 5. 2 1974 4. 5 1775 6. 7 1676 6. 0 1477 6. 0 1578 7. 1 1979 7. 0 2080 4. 7 1581 5. 1 1782 6. 0 1383 5. 5 1684 ■ 8. 0 1985 9. 5 1986 7. 0 1787 6. 0 1788 9. 0 1889 8. 0 2090 4. 0 1691 3. 0 1692 4. 0 1593 7. 0 1794 7. 0 1895 3. 5 1696 3. 0 1697 3. 8 1598 5. 2 1699 6. 1 16100 5. 0 17101 7. 0 13102 9. 5 20103 7. 0 19104 8. 5 19105 6. 0 18106 4. 5 17107 4. 2 18108 4. 0 16109 8. 5 21110 5. 5 17111 5. 0 16
Statistical analyala of the marVet variables)-Average(Producer Price)* 6.16Variance(Producer Price)*3.53Average(Consumer Price)* 17.78Variance(Consumer Price)=3.46Covariance ( Producer nice, consumer Price)* 2. 0/ Correlation(Producer Price, Consumer Price*0.593 Intercept*-4.49 ; Slope*0.599 ; Standard Error*®.078 Student's T Vslue*7.689 ; Probsbility*0.000
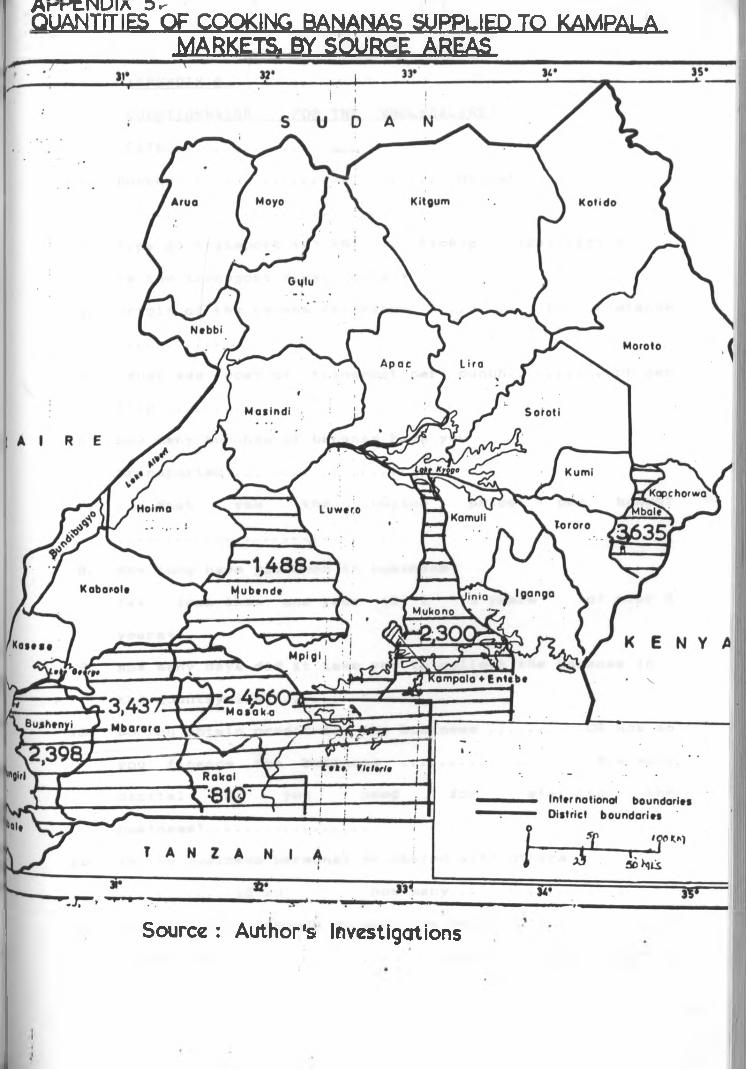
A r r t N U lA O.-QUANTITIES OF COOKING BANANAS SUPPLIED TO KAMPALA
MARKETS. BY SOURCE AREAS
Source : Author's Investigations

ao
APEEHPIX
QUESTIONNAIRE ( FOR THE__WHOLESALERS)DATE...............
2. Type of transport (a) PSV (b) Pickup (c) Lorry *3 Is the transport Hired /owned*4. Origin of the banana (a) Place .......... <b> Distance
5. What was cost of transport per bunch.......... or pert r i p .........
6. How many bunches of bananas have youtransported?......................
7. What was the buying price per bunch?
8. How long have you been in business?(a) less than one year (b) 1 - 5 years (c) over 5
years*9. How many days did it take you to collect the bananas in
the countryside? ...................10. Do you obtain credit for the b u s i n e s s .......... OR How so
you finance the business ................. How muchcapital do you need for starting thebusiness?..................
11. Is the business personal or shared with others ?.............if so how m a n y ....................
12. Do you sell bananas to only one market ? ............ Ifthere are others, which ones ?
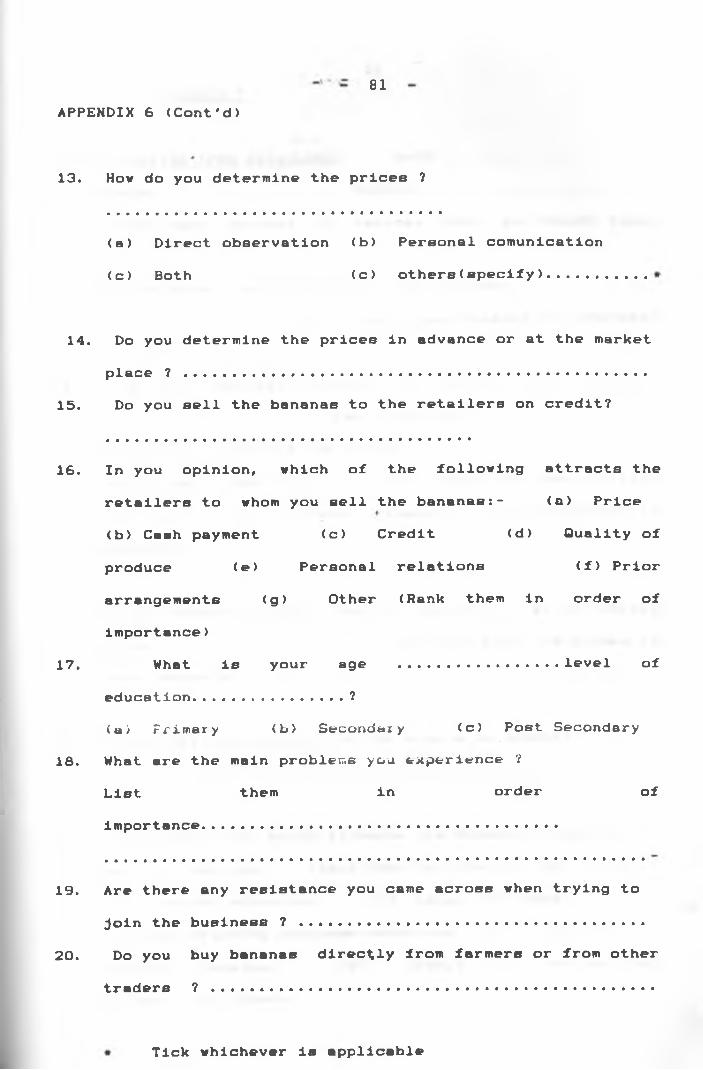
81
APPENDIX 6 (Cont'd)
13. How do you determine the prices ?
(a ) Direct observation (b) Personal comunication
(c) Both (c ) others(specify).........
14. Do you determine the prices in advance or at the marketplace ? .......................................................
15. Do you sell the bananas to the retailers on credit?
16. In you opinion, which of the following attracts theretailers to whom you sell the bananas:- (a) Price(b) Cash payment (c) Credit (d) Quality ofproduce (e) Personal relations (f) Priorarrangements (g) Other (Rank them in order ofimportance)
17. What is your age ...................level ofeducation................. ?(a) Primary (b> Secondary (c) Post Secondary
18. What are the main problems you experience ?
List them in order ofimportance..........................................
19. Are there any resistance you came across when trying tojoin the business ? .........................................
20. Do you buy bananas directly from farmers or from other
traders ? ....................................................
Tick whichever is spplicsbie

82
QUESTIONNAIRE. (FOR RETAILERS) D A T E ...............1. Number .................... Market..........................2. How many bunches of bananas have you bought today
APPENDIX 7
3. Do you obtain any credit for the business ................................... OR How do you finance the business? .....................................................................
4. • Is the business personal or shared with others ?...................... If so, how many ?....................
5. How do you determine the prices(a) Direct observation <b) Personal communication<c> both (d) others .(specify) Tick whichever is applicable.
6. Do you determine the prices in advance or at the marketplace ........................ Do you know the prices inother markets?...............................................
7. Do you sell the bananas to the buyers on credit?
8. In your opinion, which attracts the buyers to whom yousell the bananas:- (Rank them in order of importance), (a) Market situation (b) Large purchases(c) Long-standing business relations (d) Quality of produce (bananas) <e) * Credit (f) Lower sellingprices (g) Others

9. What are the main problems you experience ? List them in order of importance..........
--- #3APPENDIX 7 (Cont'd)
10. Are there any restrictions you come across when trying tojoin the business .............................................
11. How many bunches of bananas do you sell in one day ?.....
12. What is your lowest price per bunch of banana ? .........and the highest price .................................
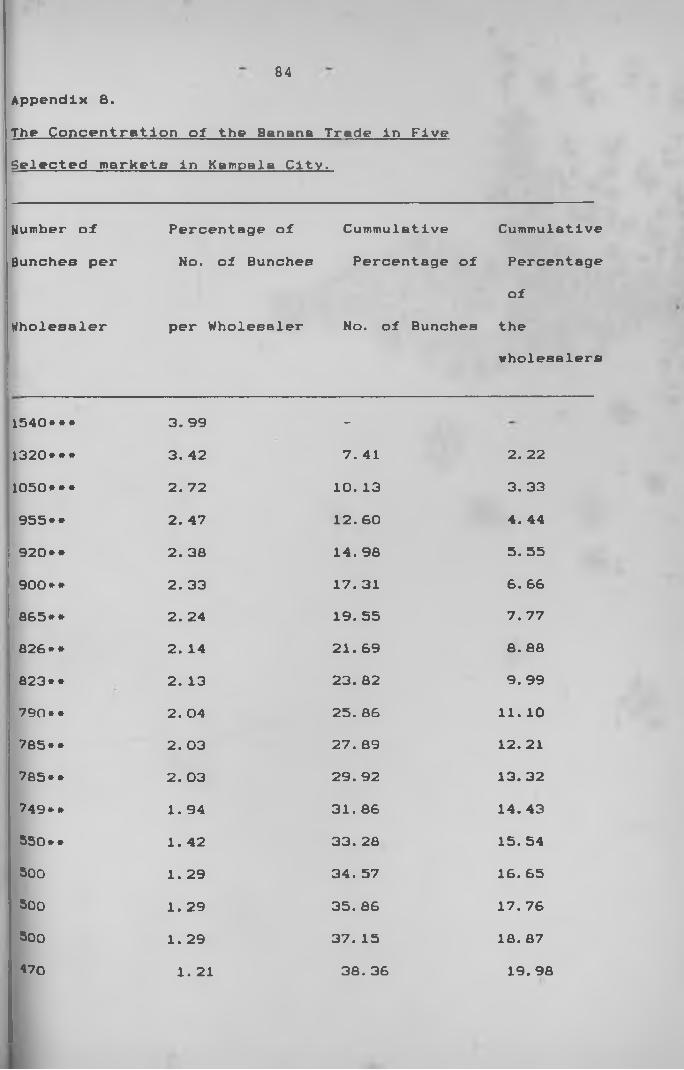
84
The Concentration of the Banana Trade in Five Selected markets in Kampala City.
Appendix 8.
Number of Percentage of Cummulative CummulativeBunches per No. of Bunches Percentage of Percentage
ofWholesaler per Wholesaler No. of Bunches the
wholesalers
1540* * * 3. 99 —1320*** 3. 42 7. 41 2 . 22
1050*** 2. 72 10. 13 3. 33955** 2. 47 1 2 . 60 4. 44920** 2 . 38 14. 98 5. 55900** 2. 33 17. 31 6 . 66
865** 2. 24 19. 55 7. 77826** 2. 14 21.69 8 . 88
823** 2. 13 23. 82 9. 99790** 2. 04 25. 86 1 1 . 10
785* * 2. 03 27. 89 1 2 . 21
785* * 2. 03 29. 92 13. 32749* * 1. 94 31. 86 14. 43550* * 1. 42 33. 28 15. 54500 1. 29 34. 57 16. 65500 1. 29 35. 86 17. 76500 1. 29 37. 15 18. 87470 1 . 21 38. 36 19. 98
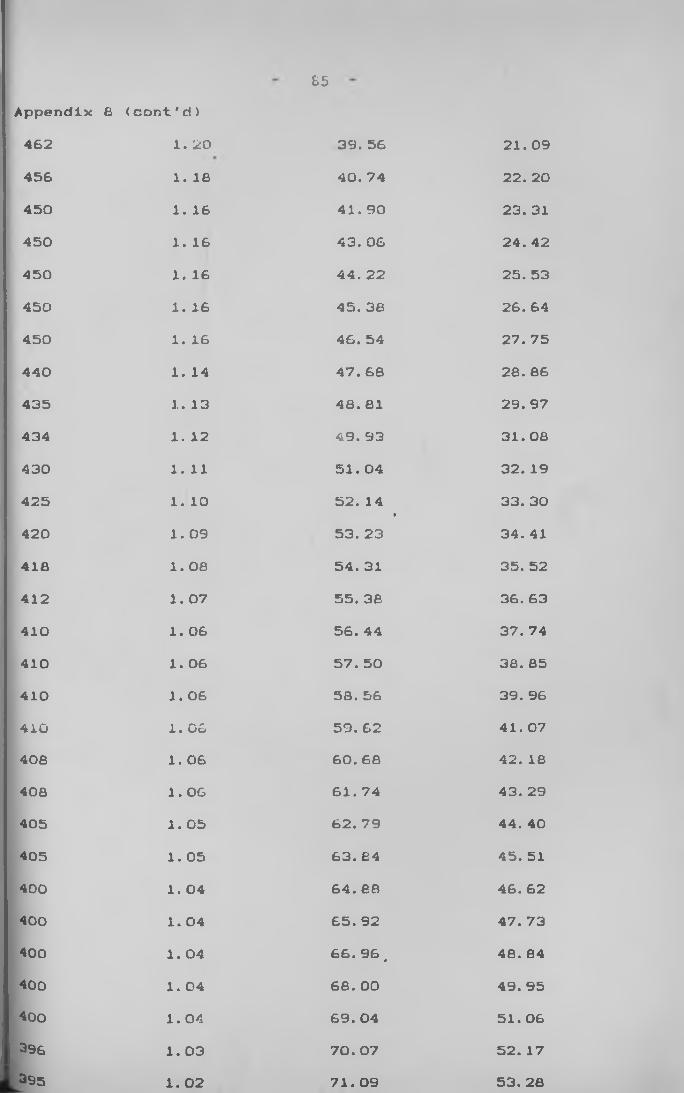
15
Appendix 6 (cont'd)462 1 . 2 0 39. 56 21.09456 1 . 16 40. 74 2 2. 20
450 1 . 16 41.90 23. 31450 1 . 16 43. 06 24. 42450 1 . 16 44. 22 25. 53450 1 . 16 45. 38 26. 64450 1 . 16 46. 54 27. 75440 1. 14 47. 68 28. 66
435 1 . 13 46. 81 29. 97434 1 . 1 2 49. 93 31. 06430 1 . 1 1 51.04 32. 19425 1 . 1 0 52. 14 I 33. 30420 1.09 53. 23 34. 41416 1.06 54. 31 35. 52412 1.07 55. 38 36. 63410 1 . 06 56. 44 37. 74410 1.06 57. 50 38. 85410 1.06 58. 56 39. 964iG 1 . 06 59. 62 41. 07406 1.06 60. 68 42. 18406 1.06 61.74 43. 29405 1.05 62. 79 44. 40405 1.05 63. £4 45. 51400 1. 04 64. ea 46. 62400 1. 04 65. 92 47. 73400 1. 04 6 6 . 96 * 48. 84400 1.04 6 6 . 00 49. 95400 1.04 69. 04 51.06396 1.03 70. 07 52. 17395 1 . 02 71.09 53. 28
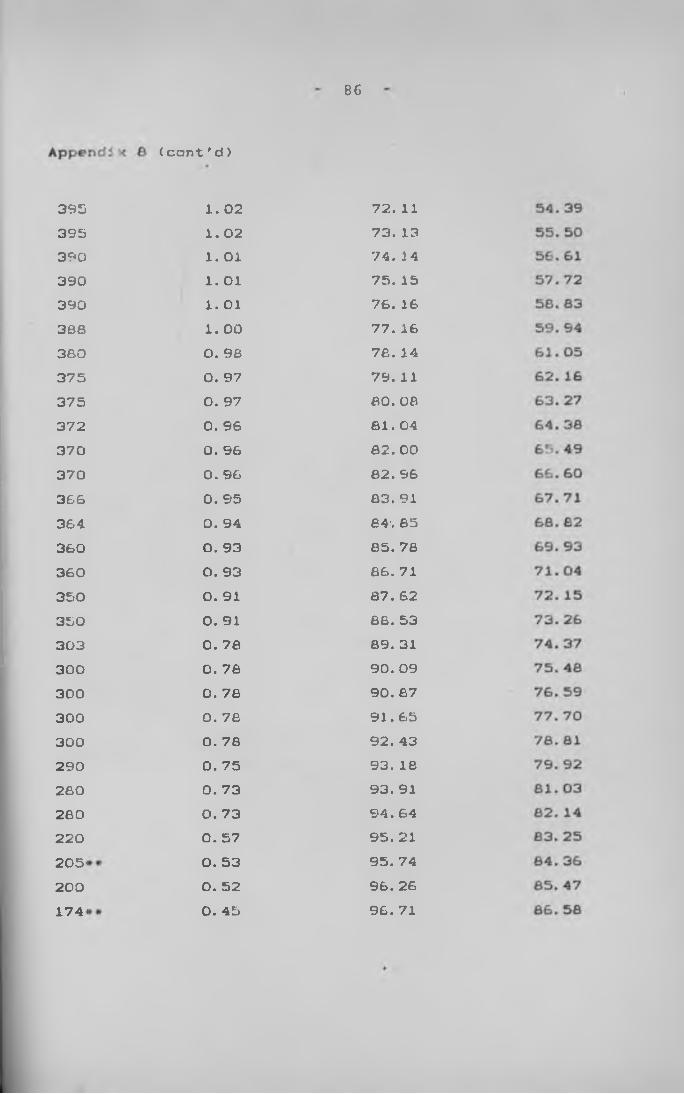
395395390390390388380375375372370370366364360360350350303300300300300290260260220
205<200
174 <
86
( c a n t ' d )
1 . 0 2 72. 111 . 02 73. 131 . Ol 74. 141 . 01 75. 151 . 01 76. 161 . 00 77. 160. 98 78. 140. 97 79. 110. 97 80. 080. 96 81.040. 96 82. 00
0. 96 82. 960. 95 83. 910. 94 84-. 850. 93 85. 780. 93 8 6. 710. 91 87. 620. 91 8 8. 530. 78 89. 310. 76 90. 090. 78 90. 67o. 7e 91.65O. 78 92. 430. 75 9 3. ie0. 73 93. 910. 73 94. 640. 57 95. 210. 53 95. 740. 52 96. 260. 45 96. 71
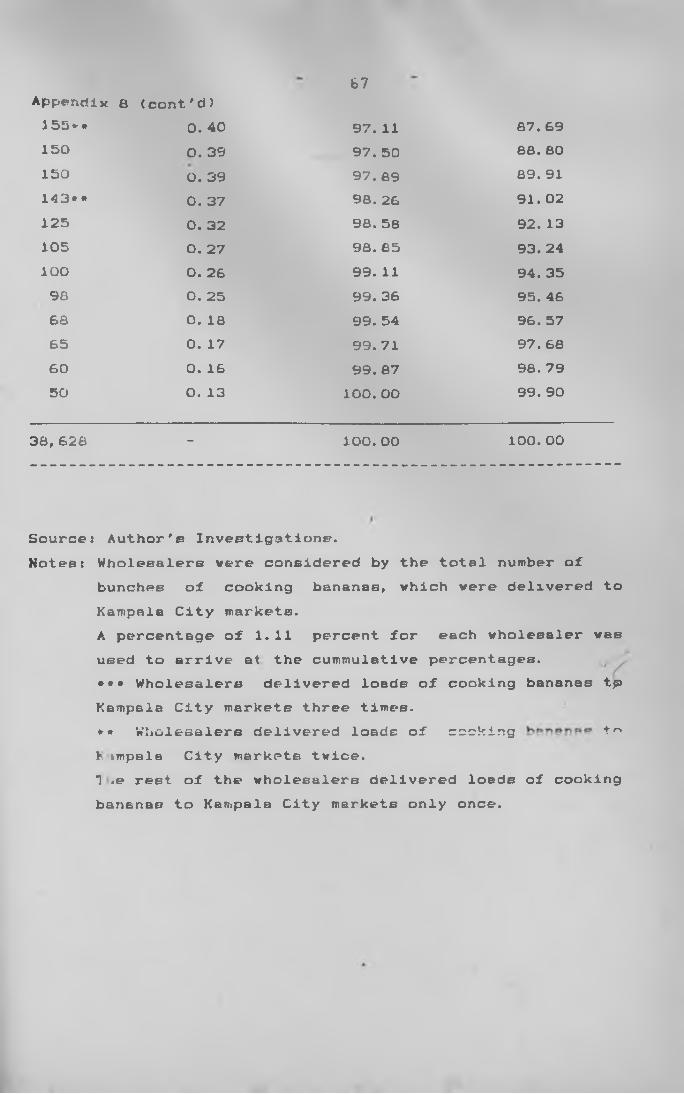
Appendix a (cont'd )67
155*. 0. 40 97. 11 87. 69150 0. 39 97. 50 8 8. 80150 0. 39 97. 89 89. 91143** O. 37 98. 26 91.02125 0. 32 98. 58 92. 13105 O. 27 98. 85 93. 24lOO 0. 26 99. 11 94. 3598 0. 25 99. 36 95. 4666 0 . 18 99. 54 96. 5765 0. 17 99. 71 97. 68
60 0. 16 99. 87 98. 7950 0. 13 1 0 0 . 0 0 99. 90
38,628 - lOO. 00 1 0 0 . 0 0
Source: Author's Investigatione.Notes: Wholesalers vere considered by the total number of
bunches of cooking bananas, which were delivered to Kampala City markets.A percentage of 1.11 percent for each wholesaler was used to arrive at the cummulative percentages.... Wholesalers delivered loads of cooking bananas tp Kampala City markets three times..* Wholesalers delivered loads of cooking t<->Kimpale City markets twice.1 .e rest of the wholesalers delivered loads of cooking bananas to Kampala City markets only once.
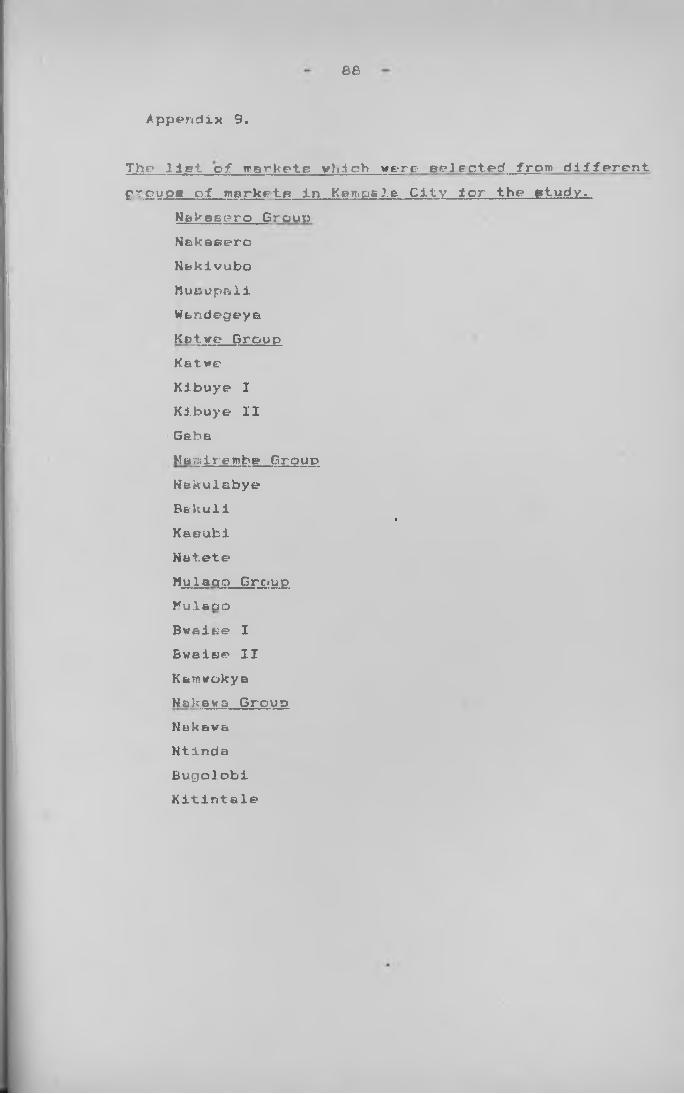
&B
>ppe*ndix 9.
Thr» Ijgt of rrarkrtp vidch werp BeJFcted from different froupg of tnarkrtft In Ken.p&le, City lor the etudv.
Makasgro Group Nekaeero Keklvubo Muoup&li Wtndegeya Ketye? Group Katve Kibuye I Kibuye II GabaHanilrtmbe GroupHskulebyeB e lc u l i (KesubiNat.eteWulacfo Group Mulaao Bwaita© I Bweise II Kewifukya Hakavs Group Nakawa Ntinda BugoJ obi Kitintale
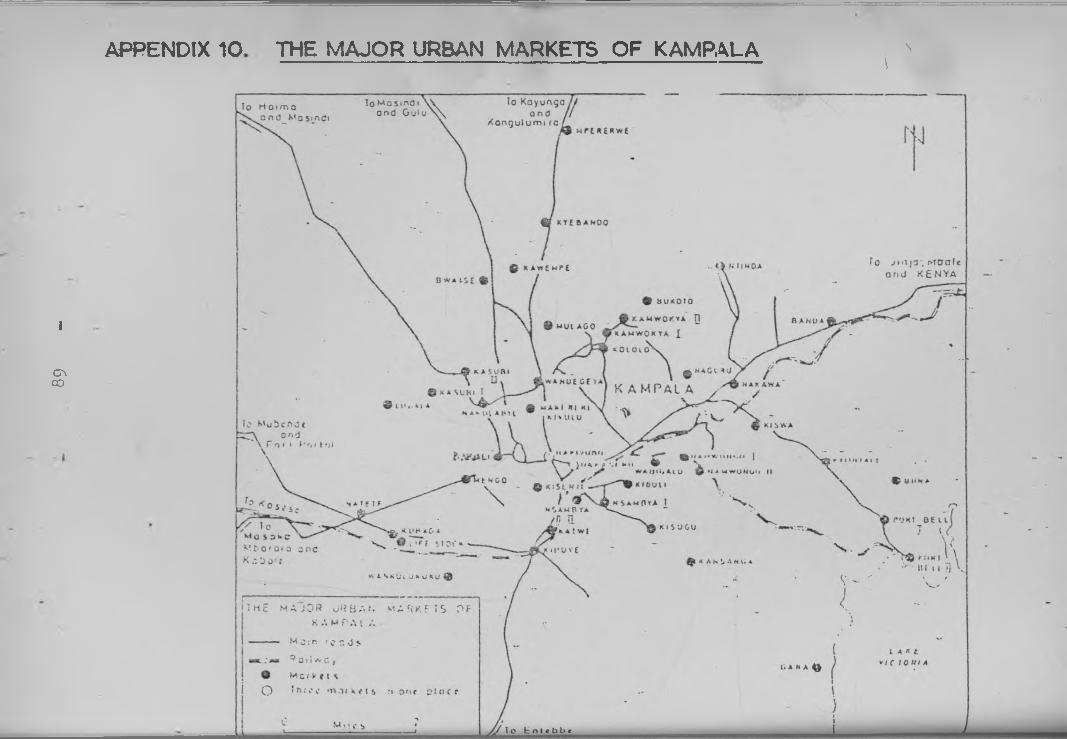
APPENDIX 10 THE M AJO R URBAN M ARKETS OF KAMPALA \\
i
c\CO
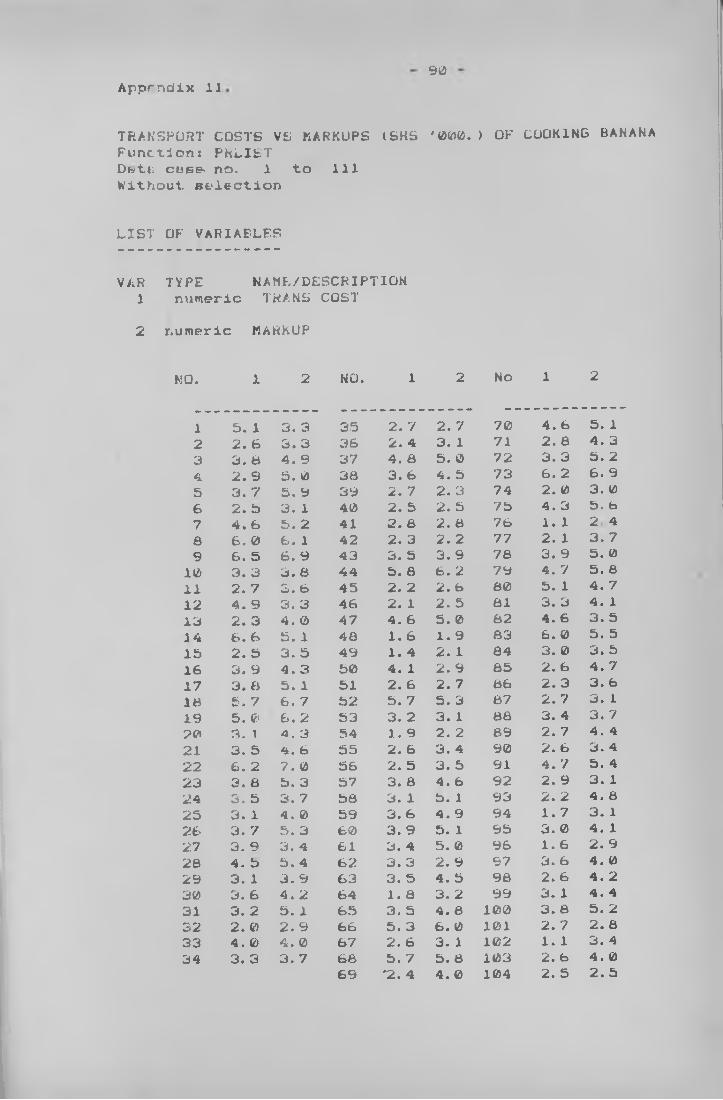
Apprndix 1190
TRANSPORT COSTS VC MARKUPS (SHS '000.) OF COOKING BANANAFunction: PhLISTDfstfc cuse- no. 1 to 111Without, selection
LIST OF VARIABLES
VAR TYPE NAME/DESCRIPTION1 numeric TRANS COST2 numeric MARKUP
MO. 1 2 NO. 1 2 No 1 2
1 5. 1 3. 3 35 2. 7 2. 7 70 4. b 5. 12 2 . 6 3. 3 36 2. 4 3. 1 71 2 . 8 4. 33 3. a 4. 9 37 4. 8 5. 0 72 3. 3 5. 24 2. 9 5. 0 38 3. 6 4. 5 73 6. 2 6 . 95 3. 7 5. 9 39 2. 7 2 . 3 74 2. 0 3. 06 2 . 5 3. 1 40 2. 5 2. 5 75 4. 3 5. 67 4. 6 5. 2 41 2 . 8 2 . 8 7b 1 . 1 2 48 6 . 0 6 . 1 42 2. 3 2 . 2 77 2 . 1 3. 79 6 . 5 6 . 9 43 3. 5 3. 9 78 3. 9 5. 0
10 3. 3 3. a 44 5. a 6 . 2 79 4. 7 5. 81 1 2. 7 3. 6 45 2 . 2 2 . 6 80 5. 1 4. 71 2 4. 9 3. 3 46 2 . 1 2. 5 81 3. 3 4. 113 2 . 3 4. 0 47 4. 6 5. 0 62 4. 6 3. 514 6 . 6 5. 1 40 1 . 6 1. 9 63 6 . 0 5. 5IS 2 . 5 3. 5 49 1. 4 2 . 1 84 3. 0 3. 516 3. 9 4. 3 50 4. 1 2. 9 65 2 . 6 4. 717 3. a 5. 1 51 2 . 6 2. 7 66 2 . 3 3. 618 5. 7 6 . 7 52 5. 7 5. 3 67 2. 7 3. 119 5. 0 6 . 2 53 3. 2 3. 1 66 3. 4 3. 770 3. 1 4. 3 54 1 .9 2 . 2 89 2. 7 4. 42 1 3. 5 4. 6 55 2 . 6 3. 4 90 2 . 6 3. 422 6 . 2 7. 0 56 2. 5 3. 5 91 4. 7 5. 423 3. a 5. 3 57 3. 8 4. 6 92 2. 9 3. 124 3. 5 3. 7 58 3. 1 5. 1 93 2 . 2 4. 625 3. 1 4. 0 59 3. 6 4. 9 94 1.7 3. 126 3. 7 5. 3 60 3. 9 5. 1 95 3. 0 4. 127 3. 9 3. 4 61 3. 4 5. 0 96 1 . 6 2. 926 4. 5 b. 4 62 3. 3 2. 9 97 3. 6 4. 029 3. 1 3. 9 63 3. 5 4. 5 96 2 . 6 4. 230 3. 6 4. 2 64 1 . 8 3. 2 99 3. 1 4. 431 3. 2 b. 1 65 3. 5 4. 8 100 3. 6 5. 232 2 . 0 2. 9 66 5. 3 6 . 0 1 0 1 2. 7 2 . 633 4. 0 4. 0 67 2 . 6 3. 1 1 0 2 1 . 1 3. 434 3. 3 3. 7 68 5. 7 5. 8 103 2. b 4. 0
69 *2. 4 4. 0 104 2. 5 2. 5
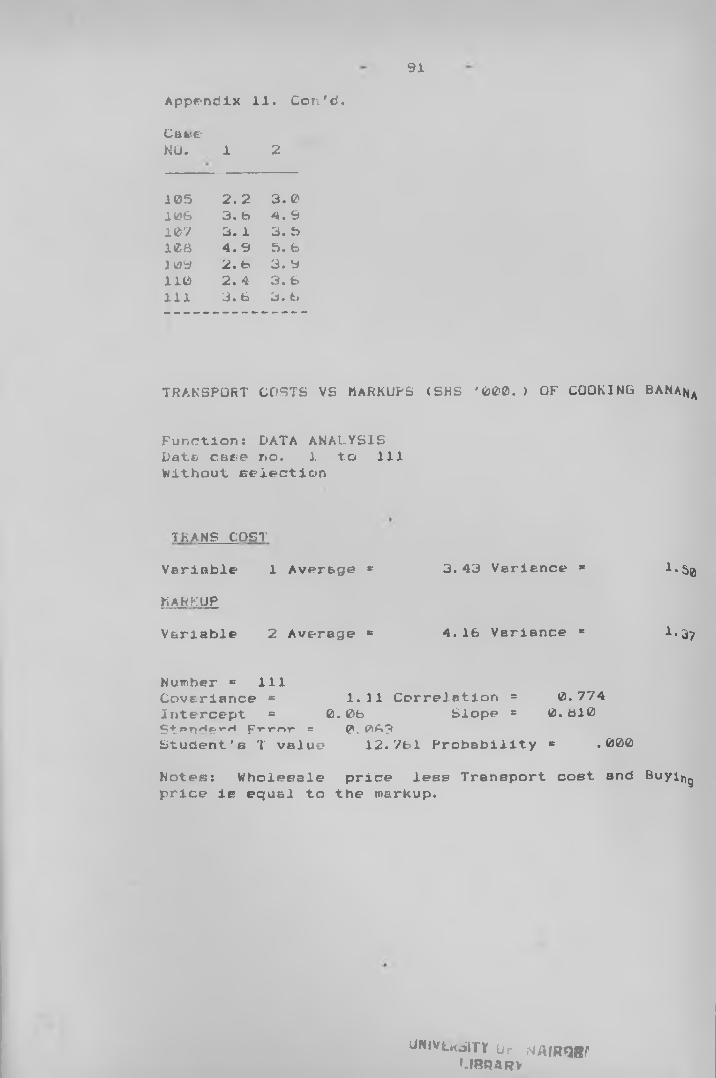
91
Appendix 11. C o n ' d .
CaseNO. 1 2
105 2 . 2 3. 0106 3. 6 4. 9107 3. 1 3. S108 4. 9 5. 61 09 2 . fc> 3. 91 1 0 2. 4 3. 61 1 1 3. 6 3. 6
TRAKSPORT COSTS VS MARKUPS (SHS '000. ) OF COOKING BANana
Function: DATA ANALYSIS Date case no. 1 to 111 Without selection
TRANS COSTVariable 1 Average c 3.43 Variance * l.SgMARKUPVariable 2 Average = 4.16 Variance = 1*37
Number = illCovariance = 1.11 Correlation = 0.774Intercept = 0.0b Slope = 0.610StersHp-^H prrnr = 0 . 063Student's T value 12.7bl Probability « .000Notes: Wholesale price less Transport cost and Buyingprice ie equal to the markup.
dwivt.rt.imr or ^AiRQarUBQARV