Embed Size (px)
Citation preview
Closed-Loop Insulin Delivery in
Adults with Type 1 Diabetes
Kavita Kumareswaran
Wolfson College
Department of Medicine
University of Cambridge
This dissertation is submitted for the degree of
Doctor of Philosophy
Michaelmas 2012
This dissertation is the result of my work and includes nothing which is the
outcome of work done in collaboration except where specifically indicated in the
text. Any errors in this dissertation are mine alone. No part of this work has been
submitted for any other qualification. The length of this dissertation lies within
the word limit set by the Degree Committee of Clinical Medicine.
Acknowledgements
This thesis would not have been possible without the expert knowledge
and inspirational guidance from my supervisors, Dr Mark Evans and Dr
Roman Hovorka. I am grateful for the opportunities I have been given
during the past four years to develop as a researcher in such a stimulating
and supportive environment. I would also like to thank Dr Helen Murphy
for her wonderful enthusiasm and sound advice, on both a personal and
academic level. The mentorship they have all provided, together with the
knowledge and skills I have gained throughout my PhD, will be invalu-
able in my future career.
I would like to acknowledge the friendship and support of all my col-
leagues in the Artificial Pancreas group who have contributed to both
my personal and professional experience at Cambridge over the last four
years. The studies would not have been possible without the hard work
and long hours invested by our clinical team, as well as by the diligent
staff at the Wellcome Trust Clinical Research Facility at Addenbrooke’s
Hospital. I would like to also mention the participants who gave up their
time for research, and without whom I would not have the data presented
in this thesis.
I am grateful for the academic and technical support provided by the Insti-
tute of Metabolic Science University of Cambridge, the laboratory support
provided by the Department of Paediatrics, and the clinical support from
the Wolfson Diabetes & Endocrine clinic at Addenbrooke’s Hospital. I
would like to thank Marianna Nodale for her assistance in preparing the
glucose data presented in Chapter 3, and Kate Westgate for extracting the
activity energy expenditure data presented in Chapters 4 and 5.
I would like to acknowledge the financial support provided by the NIHR
Cambridge Biomedical Research Centre, and Diabetes UK as funder of
the clinical studies.

Above all, I would like to thank my husband for his endless love and
reassuring presence, and my parents for their constant words of encour-
agement and for always believing in me.
“The end of education is character." – Sai Baba
Abstract
Achieving tight glucose control safely in type 1 diabetes with currently
available methods of insulin delivery is challenging. Aggressive regimens
carry an increased risk of hypoglycaemia, particularly overnight. Both al-
cohol consumption and exercise predispose further to low glucose levels.
The demands are even greater in pregnancy where, in addition to limit-
ing hypoglycaemia, avoidance of postprandial hyperglycaemia is critical
to minimising adverse obstetric outcomes. The aim of my studies was to
evaluate feasibility and safety of a closed-loop or ’artificial pancreas’ sys-
tem linking insulin delivery with continuous glucose monitoring (CGM),
in adults with type 1 diabetes in a controlled setting.
Three randomised crossover studies compared closed-loop insulin deliv-
ery with conventional insulin pump therapy on two separate occasions,
matched in meals and activities. During closed-loop visits, CGM values
were entered into a computer containing a model predictive control algo-
rithm which advised on basal insulin infusion for subcutaneous delivery,
every 15 minutes. During control visits, usual insulin pump regimen was
continued. The feasibility study evaluated overnight closed-loop in 12
adults (seven females, mean age 37.7 years, HbA1c 7.8%) following 60g-
carbohydrate evening meal. A follow-up study assessed overnight closed-
loop in 12 further adults (seven females, mean age 37.2 years, HbA1c
7.8%) following 100g-carbohydrate meal and (mean 564 ml) white wine.
The third study evaluated 24 hours of closed-loop in 12 pregnant women
(mean age 32.9 years, 19 to 23 weeks gestation, HbA1c 6.4%) during nor-
mal daily activities, including low and moderate intensity exercise. Ac-
tivity and glucose levels were also measured during free-living. CGM
performance during exercise was evaluated.
Overnight closed-loop insulin delivery in adults, compared with conven-
tional pump therapy, increased time spent with plasma glucose in tar-
get range (3.9 − 8.0 mmol/l) following both standard meal (81% versus
57%; p = 0.012) and large meal accompanied by alcohol (70% versus 46%;
p = 0.012). Glycaemic variability, and time spent in hypo- and hyper-
glycaemia were lowered. In pregnant women, day and night closed-loop
insulin delivery was as effective as usual pump regimen (81% versus 81%
time spent with plasma glucose 3.5 − 7.8 mmol/l; p = 0.754). Hypo-
glycaemia occurred following exercise, although closed-loop prevented
nocturnal episodes. Glycaemic control during free-living was suboptimal,
compared with controlled diet and exercise conditions. Accuracy of CGM
was lower during exercise.
In conclusion, these studies confirm the feasibility and efficacy of overnight
closed-loop insulin delivery in adults with type 1 diabetes. Closed-loop
is safe during pregnancy and may be beneficial in women with subopti-
mal glycaemic control. Meals and physical activity currently limit optimal
daytime use of closed-loop.
Contents
Contents vi
List of Figures xi
List of Tables xiii
List of abbreviations xv
1 Introduction 1
1.1 Glucose regulation . . . . . . . . . . . . . . . . . . . . . . . . . . . . . . . 1
1.2 Diabetes . . . . . . . . . . . . . . . . . . . . . . . . . . . . . . . . . . . . . 1
1.2.1 Definition . . . . . . . . . . . . . . . . . . . . . . . . . . . . . . . . 1
1.2.2 Types . . . . . . . . . . . . . . . . . . . . . . . . . . . . . . . . . . . 2
1.2.3 Prevalence . . . . . . . . . . . . . . . . . . . . . . . . . . . . . . . . 2
1.2.4 Healthcare burden . . . . . . . . . . . . . . . . . . . . . . . . . . . 2
1.3 Monitoring of diabetes . . . . . . . . . . . . . . . . . . . . . . . . . . . . . 2
1.3.1 Conventional methods . . . . . . . . . . . . . . . . . . . . . . . . . 2
1.3.2 Continuous glucose monitoring . . . . . . . . . . . . . . . . . . . 3
1.4 Treatment of diabetes . . . . . . . . . . . . . . . . . . . . . . . . . . . . . . 11
1.4.1 Glucose targets . . . . . . . . . . . . . . . . . . . . . . . . . . . . . 11
1.4.2 Current therapies . . . . . . . . . . . . . . . . . . . . . . . . . . . . 12
1.4.3 Insulin delivery . . . . . . . . . . . . . . . . . . . . . . . . . . . . . 14
1.5 Closed-loop insulin delivery . . . . . . . . . . . . . . . . . . . . . . . . . . 17
1.5.1 Components . . . . . . . . . . . . . . . . . . . . . . . . . . . . . . . 17
1.5.2 Control algorithm . . . . . . . . . . . . . . . . . . . . . . . . . . . 17
1.5.3 Historical overview . . . . . . . . . . . . . . . . . . . . . . . . . . . 19
1.5.4 Measuring performance . . . . . . . . . . . . . . . . . . . . . . . . 20
1.5.5 Body access routes . . . . . . . . . . . . . . . . . . . . . . . . . . . 20
vi
CONTENTS
1.5.6 Clinical testing . . . . . . . . . . . . . . . . . . . . . . . . . . . . . 21
1.6 Thesis outline . . . . . . . . . . . . . . . . . . . . . . . . . . . . . . . . . . 26
2 Feasibility of overnight closed-loop insulin delivery 28
2.1 Background . . . . . . . . . . . . . . . . . . . . . . . . . . . . . . . . . . . 28
2.2 Rationale . . . . . . . . . . . . . . . . . . . . . . . . . . . . . . . . . . . . . 30
2.3 Aim . . . . . . . . . . . . . . . . . . . . . . . . . . . . . . . . . . . . . . . . 31
2.4 Methods . . . . . . . . . . . . . . . . . . . . . . . . . . . . . . . . . . . . . 31
2.4.1 Participants . . . . . . . . . . . . . . . . . . . . . . . . . . . . . . . 31
2.4.2 Study design . . . . . . . . . . . . . . . . . . . . . . . . . . . . . . 31
2.4.3 Measurements . . . . . . . . . . . . . . . . . . . . . . . . . . . . . 35
2.4.4 Statistical analysis . . . . . . . . . . . . . . . . . . . . . . . . . . . 36
2.5 Results . . . . . . . . . . . . . . . . . . . . . . . . . . . . . . . . . . . . . . 37
2.5.1 Primary outcome . . . . . . . . . . . . . . . . . . . . . . . . . . . . 37
2.5.2 Secondary outcomes . . . . . . . . . . . . . . . . . . . . . . . . . . 39
2.5.3 Sensor accuracy . . . . . . . . . . . . . . . . . . . . . . . . . . . . . 50
2.6 Discussion . . . . . . . . . . . . . . . . . . . . . . . . . . . . . . . . . . . . 50
2.7 Conclusion . . . . . . . . . . . . . . . . . . . . . . . . . . . . . . . . . . . . 54
3 Closed-loop insulin delivery after evening meal and alcohol 55
3.1 Background . . . . . . . . . . . . . . . . . . . . . . . . . . . . . . . . . . . 55
3.2 Rationale . . . . . . . . . . . . . . . . . . . . . . . . . . . . . . . . . . . . . 58
3.3 Aim . . . . . . . . . . . . . . . . . . . . . . . . . . . . . . . . . . . . . . . . 59
3.4 Methods . . . . . . . . . . . . . . . . . . . . . . . . . . . . . . . . . . . . . 59
3.4.1 Participants . . . . . . . . . . . . . . . . . . . . . . . . . . . . . . . 59
3.4.2 Study design . . . . . . . . . . . . . . . . . . . . . . . . . . . . . . 59
3.4.3 Measurements . . . . . . . . . . . . . . . . . . . . . . . . . . . . . 62
3.4.4 Statistical analysis . . . . . . . . . . . . . . . . . . . . . . . . . . . 62
3.5 Results . . . . . . . . . . . . . . . . . . . . . . . . . . . . . . . . . . . . . . 64
3.5.1 Primary outcome . . . . . . . . . . . . . . . . . . . . . . . . . . . . 65
3.5.2 Secondary outcomes . . . . . . . . . . . . . . . . . . . . . . . . . . 66
3.5.3 Sensor accuracy . . . . . . . . . . . . . . . . . . . . . . . . . . . . . 76
3.6 Discussion . . . . . . . . . . . . . . . . . . . . . . . . . . . . . . . . . . . . 77
3.7 Conclusion . . . . . . . . . . . . . . . . . . . . . . . . . . . . . . . . . . . . 80
vii
CONTENTS
4 Daytime closed-loop insulin delivery during pregnancy 81
4.1 Background . . . . . . . . . . . . . . . . . . . . . . . . . . . . . . . . . . . 81
4.1.1 Physiology of pregnancy . . . . . . . . . . . . . . . . . . . . . . . 81
4.1.2 Glycaemic control and obstetric outcomes . . . . . . . . . . . . . 81
4.1.3 Hypoglycaemia . . . . . . . . . . . . . . . . . . . . . . . . . . . . . 82
4.1.4 Challenges to daytime glycaemic control . . . . . . . . . . . . . . 83
4.1.5 Glucose monitoring . . . . . . . . . . . . . . . . . . . . . . . . . . 86
4.1.6 Treatment . . . . . . . . . . . . . . . . . . . . . . . . . . . . . . . . 87
4.2 Rationale . . . . . . . . . . . . . . . . . . . . . . . . . . . . . . . . . . . . . 87
4.3 Aim . . . . . . . . . . . . . . . . . . . . . . . . . . . . . . . . . . . . . . . . 88
4.4 Methods . . . . . . . . . . . . . . . . . . . . . . . . . . . . . . . . . . . . . 88
4.4.1 Participants . . . . . . . . . . . . . . . . . . . . . . . . . . . . . . . 88
4.4.2 Study design . . . . . . . . . . . . . . . . . . . . . . . . . . . . . . 89
4.4.3 Measurements . . . . . . . . . . . . . . . . . . . . . . . . . . . . . 93
4.4.4 Statistical analysis . . . . . . . . . . . . . . . . . . . . . . . . . . . 93
4.5 Results . . . . . . . . . . . . . . . . . . . . . . . . . . . . . . . . . . . . . . 94
4.5.1 Primary outcome . . . . . . . . . . . . . . . . . . . . . . . . . . . . 94
4.5.2 Secondary outcomes . . . . . . . . . . . . . . . . . . . . . . . . . . 96
4.5.3 Sensor accuracy . . . . . . . . . . . . . . . . . . . . . . . . . . . . . 105
4.6 Discussion . . . . . . . . . . . . . . . . . . . . . . . . . . . . . . . . . . . . 106
4.6.1 Postprandial periods . . . . . . . . . . . . . . . . . . . . . . . . . . 108
4.6.2 Exercise . . . . . . . . . . . . . . . . . . . . . . . . . . . . . . . . . 109
4.6.3 Strengths and limitations . . . . . . . . . . . . . . . . . . . . . . . 111
4.7 Conclusion . . . . . . . . . . . . . . . . . . . . . . . . . . . . . . . . . . . . 111
5 Energy expenditure and glucose control in pregnancy 113
5.1 Background . . . . . . . . . . . . . . . . . . . . . . . . . . . . . . . . . . . 113
5.1.1 Exercise in type 1 diabetes . . . . . . . . . . . . . . . . . . . . . . 113
5.1.2 Exercise in pregnancy . . . . . . . . . . . . . . . . . . . . . . . . . 115
5.1.3 Glucose control in pregnancy . . . . . . . . . . . . . . . . . . . . . 116
5.2 Rationale . . . . . . . . . . . . . . . . . . . . . . . . . . . . . . . . . . . . . 118
5.3 Aim . . . . . . . . . . . . . . . . . . . . . . . . . . . . . . . . . . . . . . . . 118
5.4 Methods . . . . . . . . . . . . . . . . . . . . . . . . . . . . . . . . . . . . . 118
5.4.1 Study design . . . . . . . . . . . . . . . . . . . . . . . . . . . . . . 118
5.4.2 Measurements . . . . . . . . . . . . . . . . . . . . . . . . . . . . . 119
5.4.3 Statistical analysis . . . . . . . . . . . . . . . . . . . . . . . . . . . 120
viii
CONTENTS
5.5 Results . . . . . . . . . . . . . . . . . . . . . . . . . . . . . . . . . . . . . . 121
5.5.1 Demographic data . . . . . . . . . . . . . . . . . . . . . . . . . . . 121
5.5.2 Activity patterns and energy expenditure . . . . . . . . . . . . . . 121
5.5.3 Glycaemic control . . . . . . . . . . . . . . . . . . . . . . . . . . . 124
5.6 Discussion . . . . . . . . . . . . . . . . . . . . . . . . . . . . . . . . . . . . 127
5.7 Conclusions . . . . . . . . . . . . . . . . . . . . . . . . . . . . . . . . . . . 131
6 Sensor accuracy during exercise in pregnancy 132
6.1 Background . . . . . . . . . . . . . . . . . . . . . . . . . . . . . . . . . . . 132
6.1.1 Utility of CGM in exercise . . . . . . . . . . . . . . . . . . . . . . . 132
6.1.2 CGM performance during exercise . . . . . . . . . . . . . . . . . . 133
6.1.3 CGM in pregnancy . . . . . . . . . . . . . . . . . . . . . . . . . . . 135
6.2 Rationale . . . . . . . . . . . . . . . . . . . . . . . . . . . . . . . . . . . . . 135
6.3 Aim . . . . . . . . . . . . . . . . . . . . . . . . . . . . . . . . . . . . . . . . 135
6.4 Methods . . . . . . . . . . . . . . . . . . . . . . . . . . . . . . . . . . . . . 136
6.4.1 Study design . . . . . . . . . . . . . . . . . . . . . . . . . . . . . . 136
6.4.2 Measurements . . . . . . . . . . . . . . . . . . . . . . . . . . . . . 136
6.4.3 Statistical analysis . . . . . . . . . . . . . . . . . . . . . . . . . . . 137
6.5 Results . . . . . . . . . . . . . . . . . . . . . . . . . . . . . . . . . . . . . . 138
6.5.1 CGM wear . . . . . . . . . . . . . . . . . . . . . . . . . . . . . . . . 138
6.5.2 CGM accuracy . . . . . . . . . . . . . . . . . . . . . . . . . . . . . 138
6.5.3 Rate of change of glucose . . . . . . . . . . . . . . . . . . . . . . . 141
6.6 Discussion . . . . . . . . . . . . . . . . . . . . . . . . . . . . . . . . . . . . 144
6.7 Conclusion . . . . . . . . . . . . . . . . . . . . . . . . . . . . . . . . . . . . 149
7 Conclusions 150
7.1 Summary of results . . . . . . . . . . . . . . . . . . . . . . . . . . . . . . . 150
7.2 Strengths . . . . . . . . . . . . . . . . . . . . . . . . . . . . . . . . . . . . . 152
7.3 Limitations . . . . . . . . . . . . . . . . . . . . . . . . . . . . . . . . . . . . 156
7.4 Future studies . . . . . . . . . . . . . . . . . . . . . . . . . . . . . . . . . . 157
7.5 Closed-loop insulin delivery in clinical practice . . . . . . . . . . . . . . 159
7.5.1 Challenges to implementation . . . . . . . . . . . . . . . . . . . . 159
7.5.2 Patient selection . . . . . . . . . . . . . . . . . . . . . . . . . . . . 161
7.5.3 Stepwise introduction . . . . . . . . . . . . . . . . . . . . . . . . . 162
7.5.4 Practical issues . . . . . . . . . . . . . . . . . . . . . . . . . . . . . 163
7.6 Contribution to knowledge and concluding remarks . . . . . . . . . . . 163
ix
CONTENTS
A Individual glucose & insulin profiles 165
A.1 Feasibility study . . . . . . . . . . . . . . . . . . . . . . . . . . . . . . . . . 166
A.2 Meal and alcohol study . . . . . . . . . . . . . . . . . . . . . . . . . . . . 173
A.3 Pregnancy study . . . . . . . . . . . . . . . . . . . . . . . . . . . . . . . . 179
B Achievements 187
References 191
x
List of Figures
1.1 FreeStyle Navigator continuous glucose monitor showing receiver and
transmitter . . . . . . . . . . . . . . . . . . . . . . . . . . . . . . . . . . . 3
1.2 Clarke error grid . . . . . . . . . . . . . . . . . . . . . . . . . . . . . . . . 4
1.3 Artificial pancreas (closed-loop) system . . . . . . . . . . . . . . . . . . . 17
2.1 Timeline of study procedures . . . . . . . . . . . . . . . . . . . . . . . . . 32
2.2 Participant during closed-loop study . . . . . . . . . . . . . . . . . . . . 34
2.3 Distribution of plasma glucose during closed-loop and CSII . . . . . . . 39
2.4 Plasma glucose profiles during closed-loop and CSII . . . . . . . . . . . 40
2.5 Insulin infusion rates during closed-loop and CSII . . . . . . . . . . . . 46
2.6 Distribution of insulin infusion rates during closed-loop and CSII . . . 47
2.7 Plasma insulin concentration profiles during closed-loop and CSII . . . 48
2.8 Clarke error grid analysis showing accuracy of FreeStyle Navigator
CGM . . . . . . . . . . . . . . . . . . . . . . . . . . . . . . . . . . . . . . . 50
3.1 Timeline of study procedures . . . . . . . . . . . . . . . . . . . . . . . . . 60
3.2 Distribution of plasma glucose during closed-loop and CSII . . . . . . . 66
3.3 Plasma glucose profiles during closed-loop and CSII . . . . . . . . . . . 68
3.4 Insulin infusion rates during closed-loop and CSII . . . . . . . . . . . . 74
3.5 Plasma insulin concentration profiles during closed-loop and CSII . . . 75
3.6 Clarke error grid analysis showing accuracy of FreeStyle Navigator
CGM . . . . . . . . . . . . . . . . . . . . . . . . . . . . . . . . . . . . . . . 77
4.1 Timeline of study procedures . . . . . . . . . . . . . . . . . . . . . . . . . 90
4.2 Actiheart monitor . . . . . . . . . . . . . . . . . . . . . . . . . . . . . . . . 91
4.3 The Borg rating of perceived exertion scale . . . . . . . . . . . . . . . . . 92
4.4 Plasma glucose profiles during closed-loop and CSII . . . . . . . . . . . 95
4.5 Distribution of plasma glucose during closed-loop and CSII . . . . . . . 96
xi
LIST OF FIGURES
4.6 Physical activity energy expenditure during closed-loop and CSII . . . 101
4.7 Insulin infusion rates during closed-loop and CSII . . . . . . . . . . . . 104
4.8 Plasma insulin concentration profiles during closed-loop and CSII . . . 106
4.9 Clarke error grid analysis showing accuracy of FreeStyle Navigator
CGM . . . . . . . . . . . . . . . . . . . . . . . . . . . . . . . . . . . . . . . 107
5.1 Example of Actiheart recording . . . . . . . . . . . . . . . . . . . . . . . . 120
5.2 Physical activity energy expenditure during free-living and controlled
study . . . . . . . . . . . . . . . . . . . . . . . . . . . . . . . . . . . . . . . 125
5.3 Sensor glucose profiles during free-living and controlled study . . . . . 125
6.1 Median relative absolute difference between sensor and plasma glu-
cose pairs for sedentary and exercise periods, by glucose range . . . . . 140
6.2 Bland Altman plots during sedentary and exercise periods . . . . . . . . 142
6.3 Clarke error grid analysis during sedentary and exercise periods . . . . 143
6.4 Plasma and sensor glucose profiles during afternoon and morning ex-
ercise and recovery periods . . . . . . . . . . . . . . . . . . . . . . . . . . 145
6.5 Relationship between sensor bias and rate of change of plasma glucose 146
7.1 Summary of results of closed-loop studies . . . . . . . . . . . . . . . . . 151
xii
List of Tables
1.1 Comparison of accuracy of commercially available CGM devices . . . . 6
1.2 Closed-loop approaches . . . . . . . . . . . . . . . . . . . . . . . . . . . . 22
2.1 Demographics of 12 participants . . . . . . . . . . . . . . . . . . . . . . . 38
2.2 Time spent with plasma glucose in target during closed-loop and CSII,
for overall, overnight and morning periods . . . . . . . . . . . . . . . . . 38
2.3 Plasma glucose outcomes during closed-loop and CSII, for overall,
overnight and morning periods . . . . . . . . . . . . . . . . . . . . . . . . 41
2.4 Sensor glucose outcomes during closed-loop and CSII, for overall, overnight
and morning periods . . . . . . . . . . . . . . . . . . . . . . . . . . . . . . 42
2.5 Plasma glucose values in hypoglycaemic range during closed-loop and
CSII for overall (19:00-08:00) and overnight (00:00-08:00) periods . . . . 43
2.6 Detail of all hypoglycaemia episodes . . . . . . . . . . . . . . . . . . . . . 44
2.7 Summary of plasma insulin and insulin infused during closed-loop
and CSII, for overall, latter, morning and postprandial periods . . . . . 45
2.8 Summary of insulin bolus and peak postprandial glucose for evening
meal and breakfast . . . . . . . . . . . . . . . . . . . . . . . . . . . . . . . 49
2.9 Insulin bolus administered with evening meal for each subject . . . . . 49
3.1 Demographics of 12 participants . . . . . . . . . . . . . . . . . . . . . . . 64
3.2 Time spent with plasma glucose in target during closed-loop and CSII,
for overall, overnight, latter and morning periods . . . . . . . . . . . . . 65
3.3 Plasma glucose outcomes during closed-loop and CSII, for overall,
overnight, latter and morning periods . . . . . . . . . . . . . . . . . . . . 67
3.4 Sensor glucose outcomes during closed-loop and CSII, for overall, overnight,
latter and morning periods . . . . . . . . . . . . . . . . . . . . . . . . . . 69
xiii
LIST OF TABLES
3.5 Plasma glucose values in hypoglycaemic range during closed-loop and
CSII for overall (19:00-08:00), overnight (00:00-08:00), latter (03:00-12:00)
and morning (08:00-12:00) periods . . . . . . . . . . . . . . . . . . . . . . 71
3.6 Detail of all hypoglycaemia episodes . . . . . . . . . . . . . . . . . . . . . 72
3.7 Summary of plasma insulin and insulin infused during closed-loop
and CSII, for overall, overnight, latter, morning and postprandial periods 73
3.8 Carbohydrates consumed and insulin bolus administered with evening
meal for each subject . . . . . . . . . . . . . . . . . . . . . . . . . . . . . . 76
3.9 Summary of plasma ethanol during closed-loop and CSII . . . . . . . . 76
4.1 Demographics of 12 participants . . . . . . . . . . . . . . . . . . . . . . . 95
4.2 Plasma glucose and insulin outcomes during closed-loop and CSII for
overall and overnight periods . . . . . . . . . . . . . . . . . . . . . . . . . 97
4.3 Sensor glucose outcomes during closed-loop and CSII for overall and
overnight periods . . . . . . . . . . . . . . . . . . . . . . . . . . . . . . . . 98
4.4 Plasma glucose outcomes during closed-loop and CSII for afternoon,
evening and morning periods . . . . . . . . . . . . . . . . . . . . . . . . . 100
4.5 Summary of hypoglycaemia episodes . . . . . . . . . . . . . . . . . . . . 102
4.6 Summary of insulin amounts and carbohydrates consumed . . . . . . . 105
5.1 Demographics of 10 participants . . . . . . . . . . . . . . . . . . . . . . . 122
5.2 Physical activity energy expenditure and time spent in sedentary, light
and moderate intensity activity . . . . . . . . . . . . . . . . . . . . . . . . 123
5.3 Sensor glucose outcomes during free-living and controlled study, for
‘day and night’ and overnight periods . . . . . . . . . . . . . . . . . . . . 126
6.1 Summary of sensor accuracy measures during sedentary and exercise
periods . . . . . . . . . . . . . . . . . . . . . . . . . . . . . . . . . . . . . . 139
xiv
List of abbreviations
ANOVA Analysis of variance
AUC Area under the curve
CHO Carbohydrate
CL Closed-loop
CV Coefficient of variation
CGM Continuous glucose monitoring
CSII Continuous subcutaneous insulin infusion
DCCT Diabetes Control and Complications Trial
JDRF Juvenile Diabetes Research Foundation
HbA1c Glycosylated haemoglobin
ISO International Standards Organisation
IQR Interquartile range
RAD Relative absolute difference
MET Metabolic equivalents
MPC Model predictive control
MDI Multiple daily injections
PAEE Physical activity energy expenditure
PID Proportional integral derivative
SMBG Self-monitoring of blood glucose
SD Standard deviation
YSI Yellow Springs Instrument
xv
Chapter 1
Introduction
1.1 Glucose regulation
In health, multiple pancreatic and gastrointestinal hormones act to maintain glucose
within a narrow range.[1] Circulating glucose is derived from two main sources: in-
testinal absorption during the fed state and hepatic metabolism during fasting. In the
fasted state, glucagon produced by alpha cells in the pancreas facilitates glycogenol-
ysis (the breakdown of glycogen or stored glucose) and gluconeogenesis (formation
of glucose from lactate and amino acids), thus promoting appearance of glucose in
the circulation. Following meal ingestion, the rise in glucose levels stimulates the se-
cretion of insulin from pancreatic beta cells, resulting in glucose uptake into skeletal
muscle and storage in the liver as glycogen, thus increasing disposal of circulating
glucose. Amylin, which is co-secreted with insulin from beta cells, acts to delay gas-
tric emptying and suppress appetite following a meal. Both amylin and insulin have
an inhibitory effect on glucagon secretion. Cortisol, epinephrine and growth hor-
mone, known as the counter-regulatory hormones, are released in response to low
glucose levels.
1.2 Diabetes
1.2.1 Definition
Diabetes is a chronic condition characterised by elevated blood glucose levels, result-
ing from a lack of insulin production and/or an inability of the body to respond to
insulin. The current World Health Organisation diagnostic criteria for diabetes are
1
1.3. MONITORING OF DIABETES
fasting plasma glucose ≥ 7.0 mmol/l or two-hour plasma glucose ≥ 11.1 mmol/l.[2]
1.2.2 Types
There are two main forms of diabetes, type 1 and type 2, the latter accounting for
up to 95% of cases. Type 1 diabetes is characterised by autoimmune destruction of
insulin-secreting beta cells in genetically predisposed individuals, resulting in com-
plete or near-complete loss of insulin production.[3] Type 2 diabetes is a combination
of ineffective action of insulin, also known as insulin resistance, and progressive de-
terioration in beta cell function, resulting in inadequate insulin production.
1.2.3 Prevalence
The worldwide prevalence of diabetes (type 1 and 2) was 6.4% in 2010, affecting
285 million adults. This figure is projected to increase to 439 million by 2030, with
the major escalation (69%) in developing nations and 20% in developed countries.[4]
This increase, at a rate of 2.2% per year, is nearly twice the annual growth rate of the
total world adult population. Data from the most recent UK National Health Service
annual audit reported a prevalence of diagnosed diabetes in the UK of 4.35%, almost
10% (0.40%) of which are type 1 diabetes.[5]
1.2.4 Healthcare burden
Diabetes is associated with significant morbidity, resulting in a twofold increased
risk of hospital admission, longer inpatient stays, and reduced life expectancy. The
total global expenditure for diabetes in 2010 was estimated at US$376 − 672 billion,
accounting for 12% of the world’s total health budget.[6] There is a huge disparity
between countries, with the USA spending 52.7% of global health expenditure on
diabetes, and India, the nation with the highest diabetes population in the world,
less than 1%. An estimated 10% of the National Health Service budget in the UK is
spent on treatment of diabetes and its complications.[5]
1.3 Monitoring of diabetes
1.3.1 Conventional methods
Frequent glucose monitoring is imperative to maintaining target glucose levels. The
American Diabetes Association recommends regular fingerprick capillary blood tests
2
1.3. MONITORING OF DIABETES
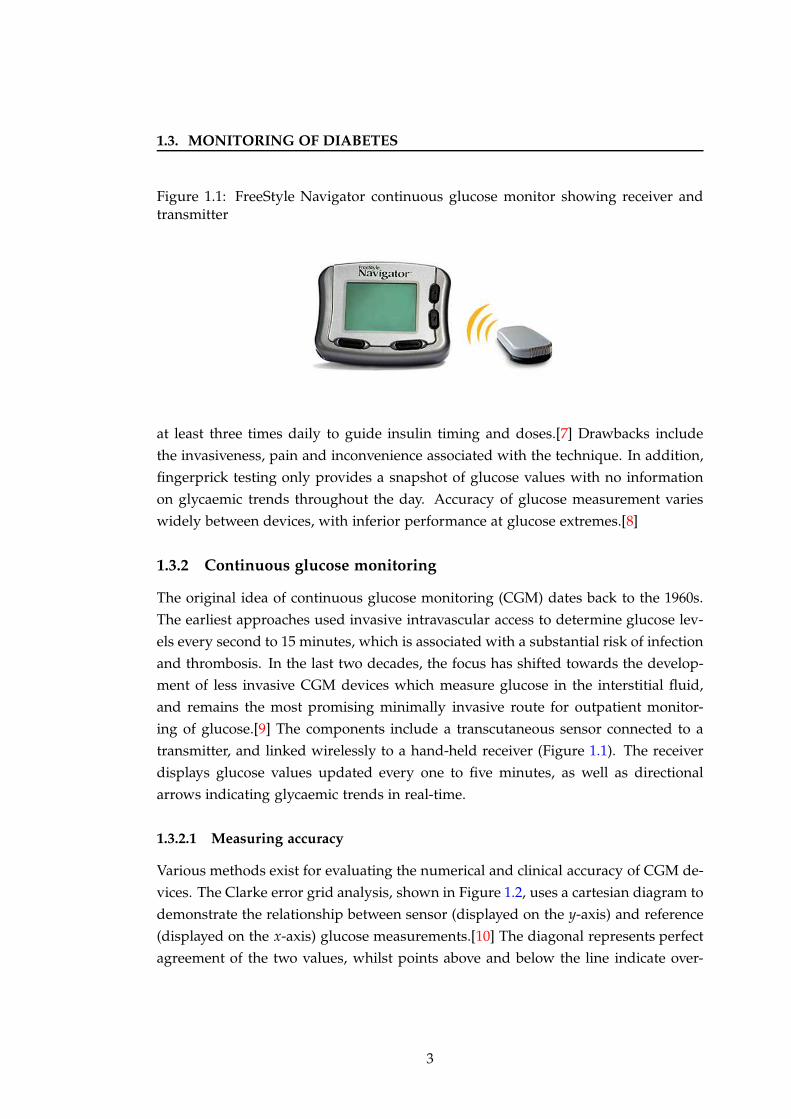
Figure 1.1: FreeStyle Navigator continuous glucose monitor showing receiver andtransmitter
at least three times daily to guide insulin timing and doses.[7] Drawbacks include
the invasiveness, pain and inconvenience associated with the technique. In addition,
fingerprick testing only provides a snapshot of glucose values with no information
on glycaemic trends throughout the day. Accuracy of glucose measurement varies
widely between devices, with inferior performance at glucose extremes.[8]
1.3.2 Continuous glucose monitoring
The original idea of continuous glucose monitoring (CGM) dates back to the 1960s.
The earliest approaches used invasive intravascular access to determine glucose lev-
els every second to 15 minutes, which is associated with a substantial risk of infection
and thrombosis. In the last two decades, the focus has shifted towards the develop-
ment of less invasive CGM devices which measure glucose in the interstitial fluid,
and remains the most promising minimally invasive route for outpatient monitor-
ing of glucose.[9] The components include a transcutaneous sensor connected to a
transmitter, and linked wirelessly to a hand-held receiver (Figure 1.1). The receiver
displays glucose values updated every one to five minutes, as well as directional
arrows indicating glycaemic trends in real-time.
1.3.2.1 Measuring accuracy
Various methods exist for evaluating the numerical and clinical accuracy of CGM de-
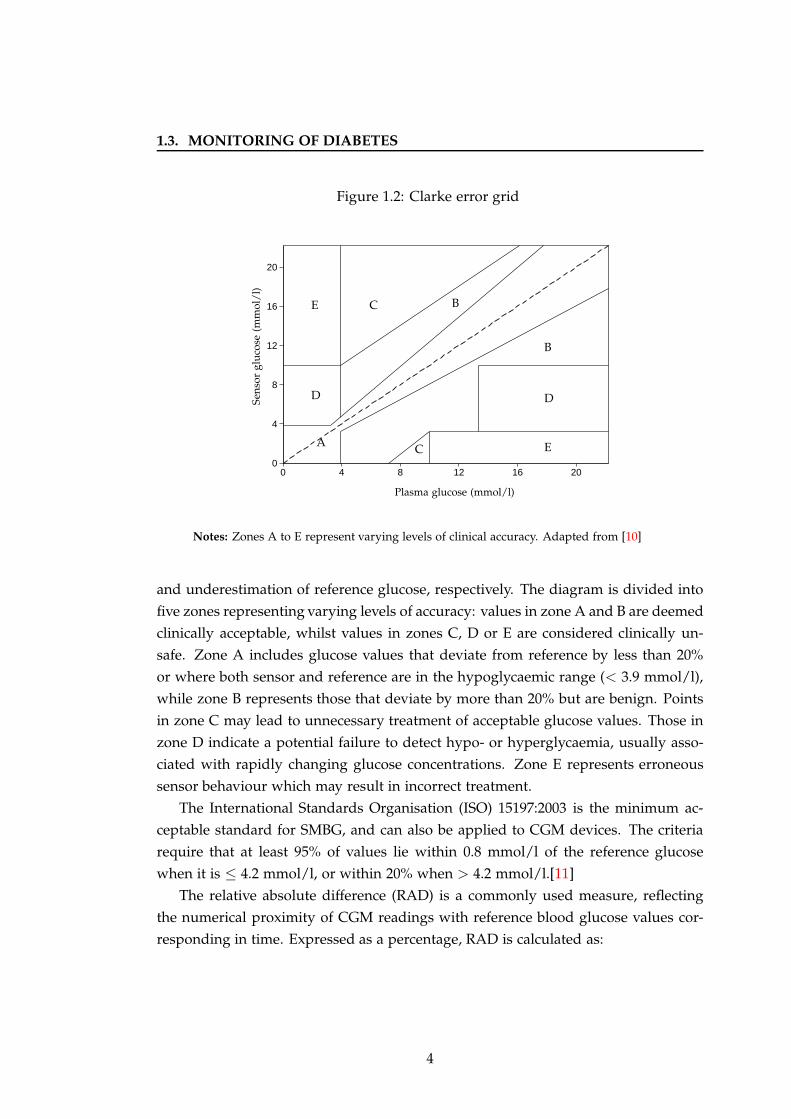
vices. The Clarke error grid analysis, shown in Figure 1.2, uses a cartesian diagram to
demonstrate the relationship between sensor (displayed on the y-axis) and reference
(displayed on the x-axis) glucose measurements.[10] The diagonal represents perfect
agreement of the two values, whilst points above and below the line indicate over-
3
1.3. MONITORING OF DIABETES
Figure 1.2: Clarke error grid
0
4
8
12
16
20
0 4 8 12 16 20
Sen
sor
glu
cose
(mm
ol/
l)
Plasma glucose (mmol/l)
A
B
B
C
C
DD
E
E
Notes: Zones A to E represent varying levels of clinical accuracy. Adapted from [10]
and underestimation of reference glucose, respectively. The diagram is divided into
five zones representing varying levels of accuracy: values in zone A and B are deemed
clinically acceptable, whilst values in zones C, D or E are considered clinically un-
safe. Zone A includes glucose values that deviate from reference by less than 20%
or where both sensor and reference are in the hypoglycaemic range (< 3.9 mmol/l),
while zone B represents those that deviate by more than 20% but are benign. Points
in zone C may lead to unnecessary treatment of acceptable glucose values. Those in
zone D indicate a potential failure to detect hypo- or hyperglycaemia, usually asso-
ciated with rapidly changing glucose concentrations. Zone E represents erroneous
sensor behaviour which may result in incorrect treatment.
The International Standards Organisation (ISO) 15197:2003 is the minimum ac-
ceptable standard for SMBG, and can also be applied to CGM devices. The criteria
require that at least 95% of values lie within 0.8 mmol/l of the reference glucose
when it is ≤ 4.2 mmol/l, or within 20% when > 4.2 mmol/l.[11]
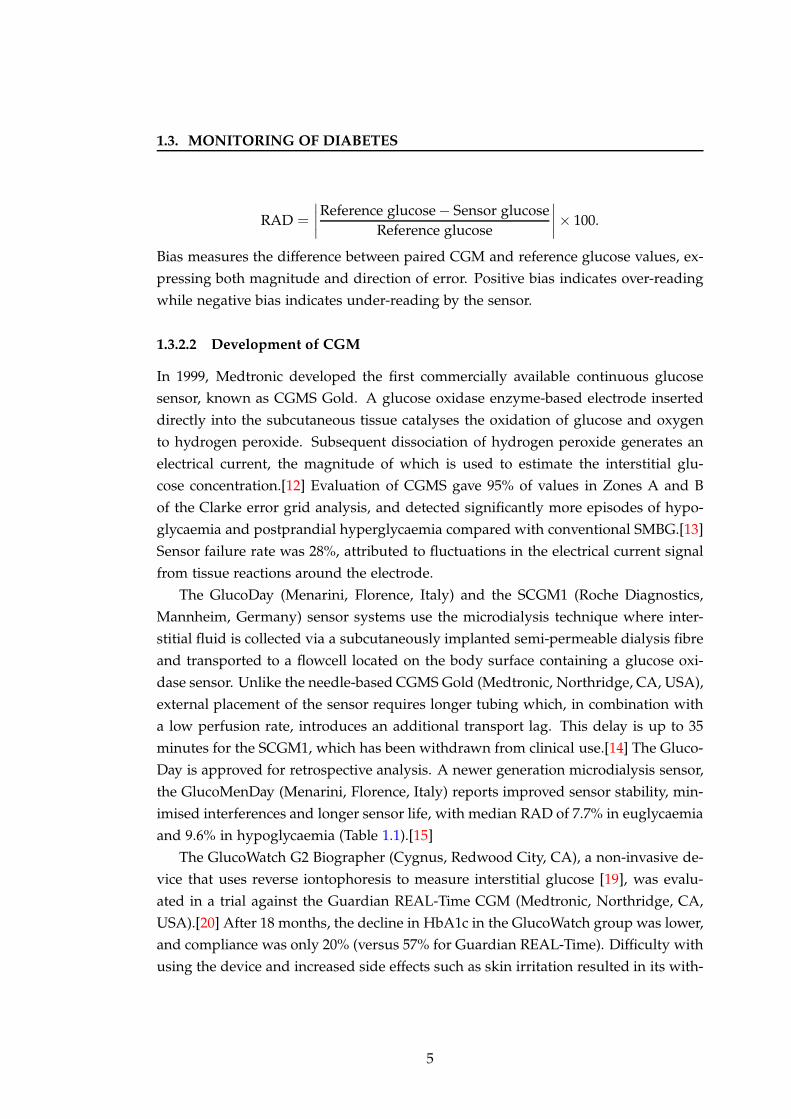
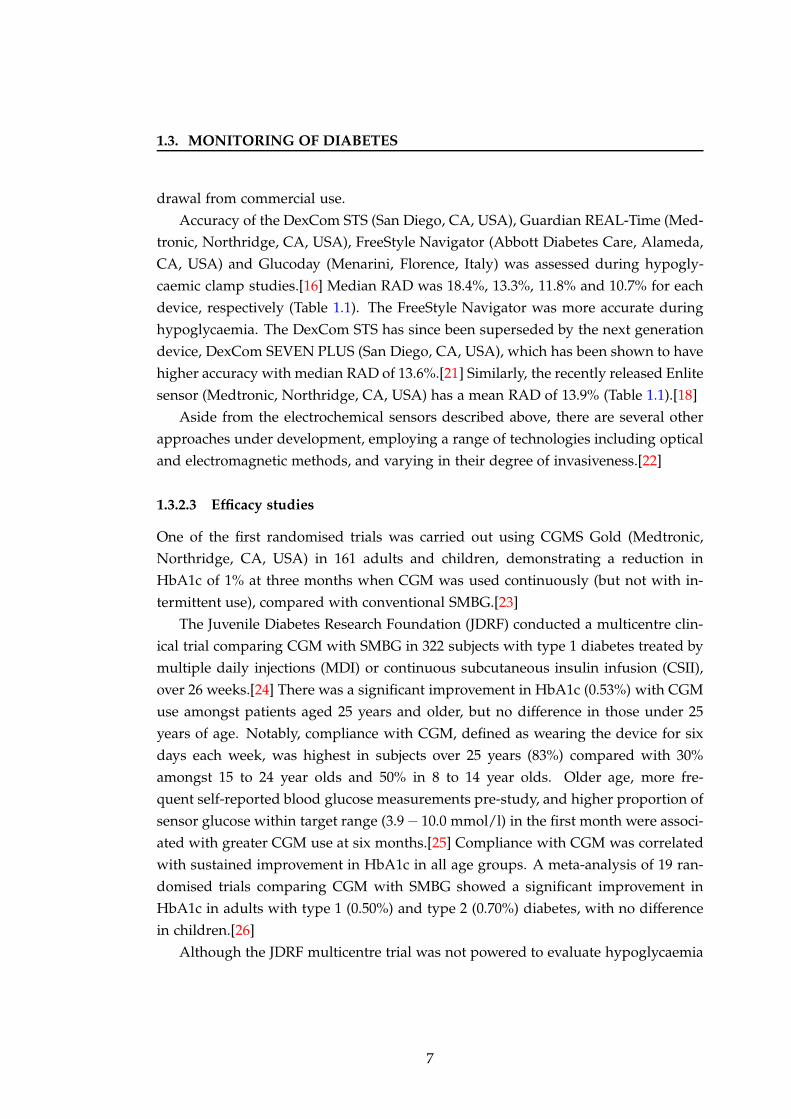
The relative absolute difference (RAD) is a commonly used measure, reflecting
the numerical proximity of CGM readings with reference blood glucose values cor-
responding in time. Expressed as a percentage, RAD is calculated as:
4
1.3. MONITORING OF DIABETES
RAD =
∣∣∣∣
Reference glucose− Sensor glucoseReference glucose
∣∣∣∣× 100.
Bias measures the difference between paired CGM and reference glucose values, ex-
pressing both magnitude and direction of error. Positive bias indicates over-reading
while negative bias indicates under-reading by the sensor.
1.3.2.2 Development of CGM
In 1999, Medtronic developed the first commercially available continuous glucose
sensor, known as CGMS Gold. A glucose oxidase enzyme-based electrode inserted
directly into the subcutaneous tissue catalyses the oxidation of glucose and oxygen
to hydrogen peroxide. Subsequent dissociation of hydrogen peroxide generates an
electrical current, the magnitude of which is used to estimate the interstitial glu-
cose concentration.[12] Evaluation of CGMS gave 95% of values in Zones A and B
of the Clarke error grid analysis, and detected significantly more episodes of hypo-
glycaemia and postprandial hyperglycaemia compared with conventional SMBG.[13]
Sensor failure rate was 28%, attributed to fluctuations in the electrical current signal
from tissue reactions around the electrode.
The GlucoDay (Menarini, Florence, Italy) and the SCGM1 (Roche Diagnostics,
Mannheim, Germany) sensor systems use the microdialysis technique where inter-
stitial fluid is collected via a subcutaneously implanted semi-permeable dialysis fibre
and transported to a flowcell located on the body surface containing a glucose oxi-
dase sensor. Unlike the needle-based CGMS Gold (Medtronic, Northridge, CA, USA),
external placement of the sensor requires longer tubing which, in combination with
a low perfusion rate, introduces an additional transport lag. This delay is up to 35
minutes for the SCGM1, which has been withdrawn from clinical use.[14] The Gluco-
Day is approved for retrospective analysis. A newer generation microdialysis sensor,
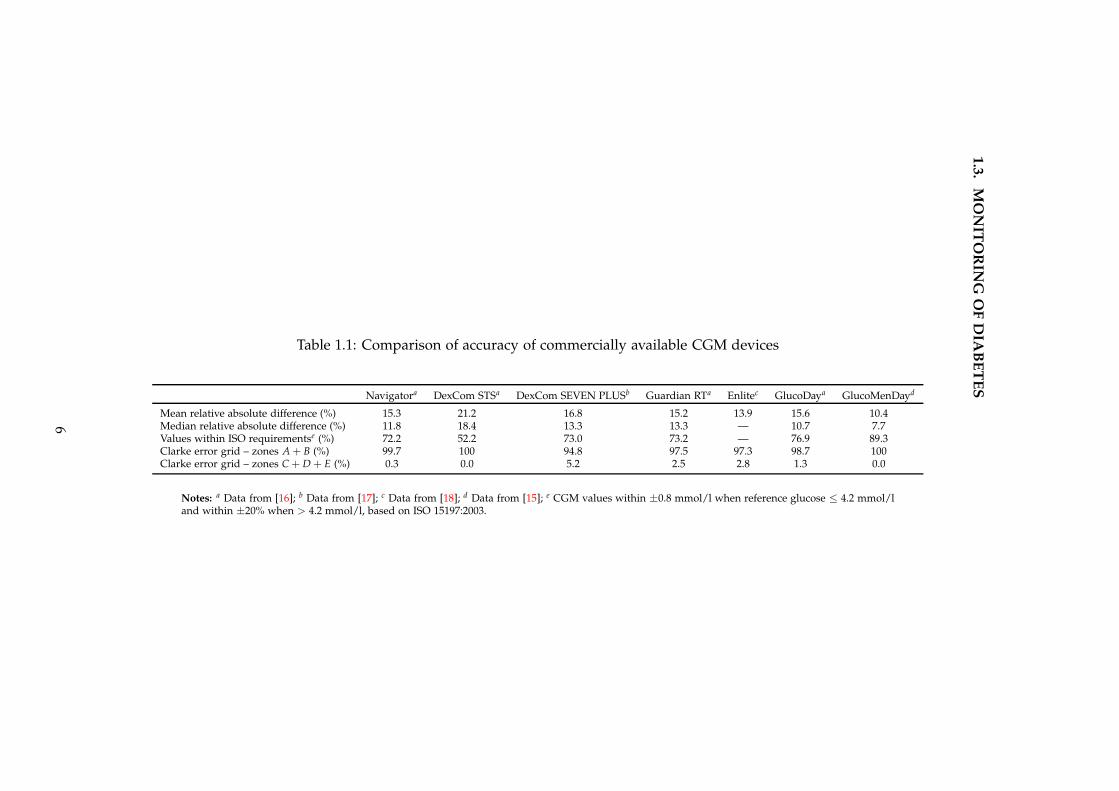
the GlucoMenDay (Menarini, Florence, Italy) reports improved sensor stability, min-
imised interferences and longer sensor life, with median RAD of 7.7% in euglycaemia
and 9.6% in hypoglycaemia (Table 1.1).[15]
The GlucoWatch G2 Biographer (Cygnus, Redwood City, CA), a non-invasive de-
vice that uses reverse iontophoresis to measure interstitial glucose [19], was evalu-
ated in a trial against the Guardian REAL-Time CGM (Medtronic, Northridge, CA,
USA).[20] After 18 months, the decline in HbA1c in the GlucoWatch group was lower,
and compliance was only 20% (versus 57% for Guardian REAL-Time). Difficulty with
using the device and increased side effects such as skin irritation resulted in its with-
5
1.3
.M
ON
ITO
RIN
GO
FD
IAB
ET
ES
Table 1.1: Comparison of accuracy of commercially available CGM devices
Navigatora DexCom STSa DexCom SEVEN PLUSb Guardian RTa Enlitec GlucoDaya GlucoMenDayd
Mean relative absolute difference (%) 15.3 21.2 16.8 15.2 13.9 15.6 10.4Median relative absolute difference (%) 11.8 18.4 13.3 13.3 — 10.7 7.7Values within ISO requirementse (%) 72.2 52.2 73.0 73.2 — 76.9 89.3Clarke error grid – zones A + B (%) 99.7 100 94.8 97.5 97.3 98.7 100Clarke error grid – zones C + D + E (%) 0.3 0.0 5.2 2.5 2.8 1.3 0.0
Notes: a Data from [16]; b Data from [17]; c Data from [18]; d Data from [15]; e CGM values within ±0.8 mmol/l when reference glucose ≤ 4.2 mmol/land within ±20% when > 4.2 mmol/l, based on ISO 15197:2003.
6
1.3. MONITORING OF DIABETES
drawal from commercial use.
Accuracy of the DexCom STS (San Diego, CA, USA), Guardian REAL-Time (Med-
tronic, Northridge, CA, USA), FreeStyle Navigator (Abbott Diabetes Care, Alameda,
CA, USA) and Glucoday (Menarini, Florence, Italy) was assessed during hypogly-
caemic clamp studies.[16] Median RAD was 18.4%, 13.3%, 11.8% and 10.7% for each
device, respectively (Table 1.1). The FreeStyle Navigator was more accurate during
hypoglycaemia. The DexCom STS has since been superseded by the next generation
device, DexCom SEVEN PLUS (San Diego, CA, USA), which has been shown to have
higher accuracy with median RAD of 13.6%.[21] Similarly, the recently released Enlite
sensor (Medtronic, Northridge, CA, USA) has a mean RAD of 13.9% (Table 1.1).[18]
Aside from the electrochemical sensors described above, there are several other
approaches under development, employing a range of technologies including optical
and electromagnetic methods, and varying in their degree of invasiveness.[22]
1.3.2.3 Efficacy studies
One of the first randomised trials was carried out using CGMS Gold (Medtronic,
Northridge, CA, USA) in 161 adults and children, demonstrating a reduction in
HbA1c of 1% at three months when CGM was used continuously (but not with in-
termittent use), compared with conventional SMBG.[23]
The Juvenile Diabetes Research Foundation (JDRF) conducted a multicentre clin-
ical trial comparing CGM with SMBG in 322 subjects with type 1 diabetes treated by
multiple daily injections (MDI) or continuous subcutaneous insulin infusion (CSII),
over 26 weeks.[24] There was a significant improvement in HbA1c (0.53%) with CGM
use amongst patients aged 25 years and older, but no difference in those under 25
years of age. Notably, compliance with CGM, defined as wearing the device for six
days each week, was highest in subjects over 25 years (83%) compared with 30%
amongst 15 to 24 year olds and 50% in 8 to 14 year olds. Older age, more fre-
quent self-reported blood glucose measurements pre-study, and higher proportion of
sensor glucose within target range (3.9 − 10.0 mmol/l) in the first month were associ-
ated with greater CGM use at six months.[25] Compliance with CGM was correlated
with sustained improvement in HbA1c in all age groups. A meta-analysis of 19 ran-
domised trials comparing CGM with SMBG showed a significant improvement in
HbA1c in adults with type 1 (0.50%) and type 2 (0.70%) diabetes, with no difference
in children.[26]
Although the JDRF multicentre trial was not powered to evaluate hypoglycaemia
7
1.3. MONITORING OF DIABETES
outcomes, a reduction in the rate of severe hypoglycaemia was observed in those
patients 25 years and older who continued to use CGM after the randomised phase
of the trial from 21.8 events per 100 person-years to 7.1 events per 100 person-years six
months later.[27] Another randomised trial in 120 children and adults with HbA1c
< 7.5% on intensive insulin therapy for type 1 diabetes demonstrated a reduction
in time spent below 3.5 mmol/l from 0.97 to 0.48 hours per day and prevention of
severe hypoglycaemia with real-time CGM, without any deterioration in HbA1c after
six months.[28]
Two months of CGM use in 16 MDI-treated patients with severe hypoglycaemia
resulted in a reduction in frequency of hypoglycaemia, improved HYPO-scores (com-
posite measure of severe hypoglycaemia episodes over the previous year and a four-
week record of events below 3 mmol/l), and less fear of future hypoglycaemia.[29]
Counter-regulatory responses to hypoglycaemia were evaluated in 11 adolescents
with hypoglycaemia unawareness during hypoglycaemic clamp studies performed
at baseline and four weeks after real-time CGM versus SMBG.[30] CGM resulted in
an improvement in epinephrine responses as well as perceived adrenergic symptom
scores.
Recent Cochrane review of 22 randomised trials in adults and children with type
1 diabetes concluded an added benefit on glycaemic control when CGM was used in
combination with CSII, known as ‘sensor-augmented’ pump therapy: 0.7% reduction
in HbA1c versus 0.2% for CGM alone.[31] In the STAR1 trial, 146 participants aged
12 − 72 years already treated by CSII were randomised to either sensor-augmented
pump therapy or standard pump with SMBG.[32] At 26 weeks there was no differ-
ence in HbA1c between the groups. However, subgroup analysis revealed that pa-
tients with 60% or greater compliance with sensor use had a significant improvement
in HbA1c. The STAR3 study demonstrated a benefit of sensor-augmented pump
therapy over MDI alone in 485 patients with type 1 diabetes: 0.8% versus 0.2% re-
duction in HbA1c at 12 months, respectively.[33] A higher proportion of patients in
the pump group achieved the HbA1c target of < 7% (27% versus 10%), without any
increase in severe hypoglycaemia. Amongst adults, baseline HbA1c > 9.1%, age
above 35 years and longer duration of diabetes (> 18 years) were strong predictors
of benefit from sensor-augmented pump therapy.[34] The SWITCH study evaluated
153 adults and children with CSII-treated type 1 diabetes on sensor ON versus sen-
sor OFF for six months each with a four month washout period, in a randomised
crossover design.[35] HbA1c was 0.43% lower in the sensor ON group in both adults
and children at six months, but reverted to pre-study levels on discontinuation of
8
1.3. MONITORING OF DIABETES
sensor use.[36]
1.3.2.4 Clinical utility
Uninterrupted glucose sensing over 24 hours has several advantages over conven-
tional SMBG. According to a consensus guideline for the use of CGM, these include:
[37]
1. Real-time information about rate and direction of glucose change including
trends that could lead to hypo- or hyperglycaemia;
2. Tighter diabetes control; and
3. Better understanding of the impact of food, exercise, stress and other factors on
glucose.
Although SMBG has superior point accuracy, it does not provide the necessary in-
formation to avoid excursions into hypoglycaemia or hyperglycaemia whilst glucose
is still within normal range. CGM can be used for both diagnostic and therapeutic
purposes, including optimising insulin regimens where tight glycaemic control is cru-
cial, such as during pregnancy. Recent Endocrine Society clinical practice guidelines
recommend real-time CGM use in children, adolescents and adults who are able
to use the devices on a nearly daily basis.[38] Intermittent retrospective CGM use
may be useful in assessing nocturnal hypoglycaemia, dawn phenomenon (morning
hyperglycaemia), postprandial hyperglycaemia, changes in therapy and in patients
with hypoglycaemic unawareness.
Widespread use of CGM has been limited by its relatively high cost in countries
without healthcare reimbursement schemes. Real-time CGM use is covered by most
healthcare plans in the USA. Some European countries, including the Netherlands,
Israel and Sweden, have reimbursement schemes for patients with recurrent severe
hypoglycaemia. But in the majority of other nations, CGM use is limited by high
user costs: US$4380 per person compared with US$550 − 2740 for SMBG.[39] One
cost-benefit analysis of CGM estimated US$100, 000 for each quality adjusted life
year gained.[40] In patients with an HbA1c < 7%, CGM had a benefit on immediate
quality of life and reduction in microvascular complications. No benefit was seen on
long term glucose control or in patients with HbA1c > 7%.
A quality of life survey of CGM users reported reduced fear of hypoglycaemia,
decreased stress, and increased confidence with using CGM to make changes to in-
sulin regimens.[41] Evidence from randomised trials indicates a benefit of CGM on
9
1.3. MONITORING OF DIABETES
glycaemic control, but also highlights the importance of careful patient selection,
which should take into consideration willingness to use the device. Reasons for stop-
ping CGM include cost, bulkiness, adhesive problems and alarms.[41] Participants in
the multicentre JDRF CGM trial reported alarms, body issues (insertion sites and size
of device), and pain with insertion as the major barriers to CGM use.[42] In the same
survey, the ability to see glucose trends was described as being the best aspect of
CGM, with other benefits including ability to self-correct out of range glucose levels,
the large amount of data available, and detection of hypoglycaemia. More frequent
monitoring was associated with higher satisfaction amongst both adults and youth.
1.3.2.5 Barriers to use
The main challenge of CGM devices is in improving their accuracy and reliability,
especially in the hypoglycaemic range. Performance of the commercially available
CGM devices may be affected by calibration errors, sensor artefacts, and physiolog-
ical delays which include a 4 − 20 minute lag of transport of glucose between blood
and interstitial fluid compartments as well as a 5 − 15 minute device-dependent de-
lay associated with sensor signal processing and filtering out measurement noise.
The time lag may be more pronounced when glucose levels are fluctuating or at ex-
tremes of the normal range, affecting accuracy of calibration of some CGM devices.
A delay of 16.8 minutes during rapid glucose fall, compared with 11.7 minutes at
steady glucose levels and 9.9 minutes during rising glucose was observed with the
FreeStyle Navigator (Abbott Diabetes Care, Alameda, CA, USA).[43] Analysis of the
DexCom SEVEN PLUS (San Diego, CA, USA) demonstrated lag times between 4.5
and 5.7 minutes, with no diminution in accuracy when calibrations were done during
rapidly changing glucose.[21] Evaluation of the Enlite next generation sensor (Med-
tronic, Northridge, CA, USA) showed a time lag of 7.9 and 11.7 minutes for sensors
placed in the abdominal and buttock regions, respectively.[18]
Inherent imprecision in the capillary blood glucose meter or glucose strips used
for calibration can affect CGM accuracy. Calibration of the DexCom SEVEN PLUS
(San Diego, CA, USA) with a laboratory standard YSI 2300 analyser reduced the me-
dian RAD from 13.6% to 5.0%.[21] This source of error is minimised in the FreeStyle
Navigator which has a built-in blood glucose meter for calibrations. Accuracy of
CGM may be lower overnight, which may be related to changes in subcutaneous
blood flow and oxygen availability with lack of activity.[44]
Insertion of the sensor itself induces an inflammatory reaction with an increase
10
1.4. TREATMENT OF DIABETES
in metabolically active cells suggesting the glucose concentration in the immediate
vicinity of the sensor is in more rapid equilibrium with blood than the rest of the
interstitial fluid compartment. However over time this process results in encapsula-
tion and protein aggregation around the sensor electrode with subsequent reduced
glucose influx and progressive inactivation of glucose oxidase enzyme. These events,
known as ‘biofouling’ or ‘sensor drift’, may explain the reduced performance towards
the end of the life of each sensor (usually 3 − 7 days). The microdialysis-based sen-
sors, in comparison, appear to be resistant to such processes via continual release
of perfusate into surrounding tissue which dilutes the proteins that stimulate the
foreign body response and thus prevents fibrous capsule formation.[15]
All CGM devices have incorporated safety alarms for detecting low glucose which
may be especially beneficial overnight. However, current sensors are limited by a
high frequency of false alarms and limited audibility. A study in 20 children using
CGM overnight demonstrated a false alarm rate of 55%, with subjects waking to only
29% of alarms.[45] False alarms increase patient anxiety and may lead to unnecessary
treatment of hypoglycaemia or overcorrection of hyperglycaemia due to the time lag
of sensor glucose. At the same time sensor alarms must be robust enough to awaken
patients at night, considering the blunted response to hypoglycaemia that occurs with
type 1 diabetes as well as the reduced auditory response during sleep. Severe hypo-
glycaemia has been shown to be present for up to four hours before a seizure occurs,
hence sensor detection algorithms that incorporate duration of hypoglycaemia may
reduce false positive alarms and thus be more clinically acceptable.[46]
1.4 Treatment of diabetes
1.4.1 Glucose targets
The ultimate goal of insulin therapy is maintenance of adequate glycaemic con-
trol whilst minimising the risk of hypoglycaemia. Optimising glycaemic control
early in the disease may be crucial to reducing the risk of diabetes-related complica-
tions. This may be explained by the ‘metabolic memory’, where early derangements
in glycaemic control are remembered in target organs.[47] Dynamic fluctuation in
blood glucose, known as glycaemic variability, is an independent predictor of worse
outcomes.[48] Chronic hyperglycaemia can induce oxidative stress, resulting in vas-
cular damage.[49] Recurrent episodes of hypoglycaemia may also have a negative ef-
fect on cardiovascular outcomes via reactive increase in counter-regulatory hormones
11
1.4. TREATMENT OF DIABETES
including catecholamines that can induce vasoconstriction and platelet aggregation,
and augment the risk of cardiac arrhythmias.
Intensive therapy is known to prevent or delay both the microvascular (retinopa-
thy, neuropathy and nephropathy) and macrovascular (coronary and peripheral vas-
cular disease) complications of type 1 diabetes.[50; 51; 52; 53] The American Diabetes
Association recommends aiming for an HbA1c as low as can be achieved safely and
generally below 7%.[7] The 2010 UK National Health Service audit showed that 17%
of patients with type 1 diabetes had an HbA1c above 10%, with only 28% achiev-
ing target HbA1c ≤ 7.5% as recommended by the National Institute for Health and
Clinical Excellence.[5]
Intensive insulin therapy however has been linked with weight gain, with asso-
ciated high blood pressure and adverse cholesterol profiles.[54] Tailoring of insulin
regimes to achieve glycaemic targets can be challenging due to inter-subject variabil-
ity in insulin requirements. In addition, insulin sensitivity within the same individ-
ual fluctuates with time of day, stress levels, physical activity, concurrent illness and
meals consumed.
1.4.2 Current therapies
1.4.2.1 Multiple daily injections (MDI)
Patients with type 1 diabetes are dependent on lifelong insulin replacement, admin-
istered into the subcutaneous tissue either by MDI or CSII. MDI therapy is the more
widely available treatment regimen, necessitating administration of a combination of
longer-acting and rapid-acting (prandial) insulin injections. A significant proportion
of patients fail to achieve optimal diabetes control on MDI, predominantly due to
high glucose variability.
1.4.2.2 Continuous subcutaneous insulin infusion (CSII)
Insulin pumps, which deliver rapid-acting insulin in a continuous fashion, have over-
come many of the limitations associated with MDI.[55] They mimic more closely the
pattern of insulin secretion by the pancreas, thus allowing greater lifestyle flexibility.
CSII technology has advanced rapidly since first introduced over 30 years ago. The
newer models have several advanced features including the incorporation of alarms,
bolus calculation wizards and the ability to adjust basal rates with fine precision.
More recently, ‘patch pumps’ are being developed. The first of these to be com-
12
1.4. TREATMENT OF DIABETES
mercially available is the Omnipod Insulin Management System (Insulet Corp, Bed-
ford, MA, USA). Their main advantage is a ‘tube-free’ system as the infusion cannula
is integrated into the pump which attaches to the body with an adhesive patch, hence
overcoming risks of obstruction or detachment of tubing. Patch pumps are slimmer
and more discreet, but limitations include a smaller insulin reservoir, adhesive intol-
erance and high cost of single-use consumables.[56]
A review of all CSII studies by the National Institute for Health and Clinical Ex-
cellence in 2010 concluded that CSII therapy in both children and adults resulted in
improved glycaemic control as reflected by a reduction in HbA1c, with the magni-
tude of decrease correlated with higher HbA1c at baseline, and fewer hypoglycaemic
events.[57] Overall quality of life was improved and there was no increase in diabetic
ketoacidosis. A meta-analysis of 22 studies found a 4.2-fold lower rate of severe hy-
poglycaemia during CSII compared with MDI, with the greatest reduction in those
with highest rates at baseline and those with longest duration of diabetes.[58] Impor-
tantly, glycaemic control was not compromised by the reduction in hypoglycaemia
during CSII, with an improvement in HbA1c of 0.62%. Twenty adults with repeated
non-severe (> four events/week) and severe (> two events in two years) hypoglycae-
mia were evaluated in a pilot study, demonstrating a significant decrease in episodes
of hypoglycaemia and improvement in hypoglycaemic awareness after 24 months of
CSII therapy, with no change in HbA1c.[59]
There is considerable variation in the frequency of pump usage worldwide, pre-
dominantly related to allocation of healthcare funding, ranging from over 25% in
the USA to less than 4% in the UK.[60] Within Europe, pump usage varies from
20% in Norway and Austria to less than 2% in Portugal and Russia.[61] The pump
itself, assuming a four-year life, costs £430 − £720 annually, and consumables are es-
timated at £1, 800 − £2, 000 per year. Compared with MDI, CSII costs an extra £1, 700
per annum.[57] The National Institute for Health and Clinical Excellence published
a guidance on CSII in 2008, reporting an incremental cost-effectiveness ratio rang-
ing from £24, 720 − £37, 712 per quality-adjusted life year gained with CSII compared
with MDI, dependent on baseline HbA1c.[62]
1.4.2.3 Immunomodulatory therapy
Pancreas transplantation is considered the gold standard endocrine replacement ther-
apy, and is associated with improved quality of life and reversal of hypoglycaemia
unawareness.[63] However, major drawbacks are the potential morbidity and mor-
13
1.4. TREATMENT OF DIABETES
tality associated with major surgery, and side-effects from long term immunosup-
pression including deterioration in renal function. Graft survival rates vary from
16% for pancreas transplants alone to 36% for simultaneous pancreas and kidney
transplants. Islet cell transplantation is less invasive, involving placement of trans-
planted cells into the portal vein thus enabling instantaneous glucose detection and
direct insulin secretion. Following the introduction of the Edmonton steroid-free
immunosuppression protocol, early outcomes of islet cell transplantation appeared
promising.[64] However only 10% of patients remained insulin-independent after five
years.[65] Limited availability and viability of islet cells remain major hurdles. Re-
search into alternative sources, such as tissue stem cells and xenografts, is ongoing.
Another approach is the use of immunomodulatory agents in preventing or treat-
ing the autoimmune destruction of beta cells pathognomonic of type 1 diabetes.[66]
Several therapies have been proposed but none have yet received regulatory approval.
1.4.3 Insulin delivery
1.4.3.1 Subcutaneous route
Insulin absorption from subcutaneous tissue is influenced by factors including those
related to insulin preparation (e.g. dose, concentration, type), and local tissue blood
flow (e.g. anatomical site of injection, injection depth, lipodystrophy, age, temper-
ature, exercise). The high variability of insulin absorption can be attributed to a
combination of one or more of these factors. Intra-individual coefficient of variation
of insulin absorption of regular insulin from a single anatomical site under controlled
conditions is reported to range from 15− 25%, whilst inter-individual variability is at
least 10% higher.[67] Less concentrated insulin (U40 versus standard U100 insulin),
higher temperatures and a lower proportion of subcutaneous fat are associated with
enhanced insulin absorption.[68]
Insertion of a CSII infusion catheter results in trauma to subcutaneous tissue,
generating an inflammatory response which may increase capillary permeability and
hence affect absorption of insulin. A study in healthy volunteers demonstrated maxi-
mal local tissue blood flow two days after catheter insertion, with a return to baseline
at 4 days.[69] Although the rate of insulin absorption increased with catheter wear-
time, there was no significant change in peak plasma insulin concentration or total
amount of insulin absorbed. Euglycaemic clamp studies were performed in adoles-
cents with type 1 diabetes on day one and four of insulin catheter wear.[70] Boluses
of rapid acting insulin resulted in an earlier peak and shorter duration of action with
14
1.4. TREATMENT OF DIABETES
longer catheter wear but overall insulin concentration was unchanged.
1.4.3.2 Novel approaches
Formation of insulin hexamers that impede absorption from the subcutaneous depot
contribute to the delays in subcutaneous insulin delivery. Potential solutions include
improving delivery and/or the molecule itself.
The challenge is to develop a form of insulin that is stable enough to be stored
and will not form amyloid fibrils in suboptimal conditions, whilst still being able to
rapidly break down from the hexameric form into monomers that can then enter the
bloodstream. There are at least two new insulin formulations under development.
VIAject (Biodel, Danbury, CT, USA) is a recombinant human insulin formulation
which, on subcutaneous injection, retains insulin in its monomeric form resulting in
a faster onset of action compared with the rapid acting insulin analogues.[71] Ad-
dition of EDTA which pulls zinc away from the insulin molecules and citric acid
which masks the charges on the molecule surface together stimulate increased dis-
sociation of insulin hexamers. Recombinant human hyaluronidase (rHuPH20) is a
genetically engineered version of the enzyme hyaluronidase which cleaves hyaluro-
nan polymers that normally block fluid movement in the interstitium. Bulk fluid
flow is hence increased, facilitating the presentation of injected drugs to blood ves-
sels. Co-administration of rHuPH20 (Halozyme Therapeutics, San Diego, CA, USA)
with lispro or regular human insulin at meal times in patients with type 1 diabetes
resulted in faster onset and higher peak plasma insulin concentrations, with subse-
quent improved postprandial glycaemic control.[72] Tolerability over the long term
is yet to be determined.
Increase in temperature at the site of insulin delivery may increase insulin
absorption.[68] The InsuPatch (InsuLine, Israel) is a local skin heating device that
warms the site of subcutaneous insulin infusion. Concurrent use with prandial in-
sulin boluses in 17 CSII-treated adults demonstrated a faster and greater rise in in-
sulin concentrations with resulting reduction in postprandial glucose excursions.[73]
Another approach to overcome the delay in insulin action is to reduce the
rate of appearance of meal-related glucose. Pramlintide, the synthetic analogue of
the hormone amylin, acts to slow gastric emptying and secretion of digestive en-
zymes in addition to inhibiting release of glucagon and modulating appetite. Co-
administration of pramlintide with insulin at mealtimes may reduce postprandial
hyperglycaemia.[74]
15
1.4. TREATMENT OF DIABETES
1.4.3.3 Alternative routes
The intraperitoneal route more closely mimics physiologic insulin secretion with
most of the insulin delivered directly to the portal circulation, achieving maximal
action within 15 minutes and lower circulating insulin levels. Catheter implantation
requires a surgical procedure which carries an associated risk of infection, fluid accu-
mulation and skin thickening. In the long term, occlusion due to insulin aggregation
may result in insulin under-delivery. Evaluation of the Diaport (Roche Diagnos-
tics, Mannheim, Germany) system in 60 patients demonstrated a reduction in severe
hypoglycaemia but an increased rate of treatment-related complications, compared
with conventional CSII.[75] An observational study of 40 implanted pumps in sub-
jects with type 1 diabetes reported 40 insulin under-delivery events in 24 pumps: 36
due to formation of insulin aggregates, and four due to catheter obstruction from
peritoneal tissue overgrowth. Three pumps were removed prematurely, one because
of electronic failure and two due to infection.[76]
The inhaled route for insulin delivery has had limited success thus far, with pre-
vious formulations being withdrawn from clinical use for reasons including lower
bioavailability, irritation of airways, and variable effect in smokers or patients with
lung disease. Afrezza (Technosphere, MannKind Corp, USA), an ultra rapid insulin
administered via pre-metered inhaler, has a more rapid onset and shorter duration
of action than subcutaneous insulin.[77] The active agent is Technosphere insulin, a
dry powder insulin deposited as insulin monomers, resulting in peak insulin lev-
els within 12 − 14 minutes. When delivered at the start of a meal in patients with
type 2 diabetes, Afrezza resulted in lower postprandial glucose excursions and lower
rates of hypoglycaemia, with lesser or no weight gain compared with rapid acting
subcutaneous insulin.[78]
Intradermal delivery of insulin has also been evaluated. Compared with sub-
cutaneous administration (8mm needle), premeal intradermal injection of regular
human insulin using a 1.5mm steel microneedle lowered postprandial glucose lev-
els, although no difference was seen when lispro rapid acting insulin analogue was
used.[79] Intradermal insulin resulted in faster uptake, higher maximum concentra-
tion and shorter systemic circulating levels of insulin.
16
1.5. CLOSED-LOOP INSULIN DELIVERY
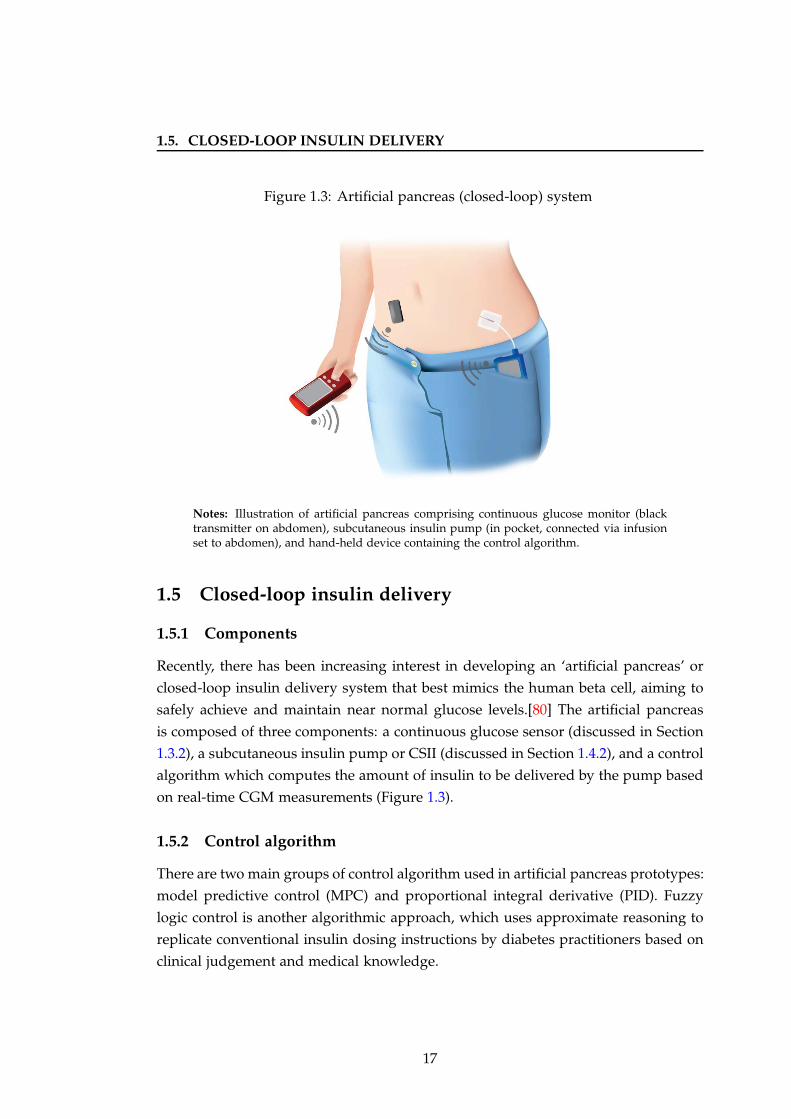
Figure 1.3: Artificial pancreas (closed-loop) system
Notes: Illustration of artificial pancreas comprising continuous glucose monitor (blacktransmitter on abdomen), subcutaneous insulin pump (in pocket, connected via infusionset to abdomen), and hand-held device containing the control algorithm.
1.5 Closed-loop insulin delivery
1.5.1 Components
Recently, there has been increasing interest in developing an ‘artificial pancreas’ or
closed-loop insulin delivery system that best mimics the human beta cell, aiming to
safely achieve and maintain near normal glucose levels.[80] The artificial pancreas
is composed of three components: a continuous glucose sensor (discussed in Section
1.3.2), a subcutaneous insulin pump or CSII (discussed in Section 1.4.2), and a control
algorithm which computes the amount of insulin to be delivered by the pump based
on real-time CGM measurements (Figure 1.3).
1.5.2 Control algorithm
There are two main groups of control algorithm used in artificial pancreas prototypes:
model predictive control (MPC) and proportional integral derivative (PID). Fuzzy
logic control is another algorithmic approach, which uses approximate reasoning to
replicate conventional insulin dosing instructions by diabetes practitioners based on
clinical judgement and medical knowledge.
17
1.5. CLOSED-LOOP INSULIN DELIVERY
1.5.2.1 Model predictive control
The MPC algorithm links insulin delivery and meal ingestion to glucose excursions in
a mathematical model.[81] This can involve a physiological model representing fun-
damental glucoregulatory processes, or a ‘black-box’ model disregarding the physi-
ological insights but learning the insulin-glucose relationships using pattern recog-
nition techniques. This information enables the construction of insulin infusion rates
leading to a predefined ‘target’ glucose excursion. The insulin to be infused is ob-
tained by minimising the difference between the model-predicted glucose concentra-
tion and the target glucose, over a prediction window corresponding to the duration
of insulin action. A moving target range allows gradual normalisation of elevated
glucose and faster normalisation of low glucose values.
MPC has the ability to ‘learn’ usual timing and content of meals and exercise pat-
terns, enabling patient-personalised models to optimise future insulin delivery and
reduce glycaemic variability. It is an adaptive system, whereby current glucose mea-
surements are used to update model parameters such as insulin sensitivity, based on
previous insulin infusion rates and glucose intake, in real-time. Prediction capabil-
ities make MPC a suitable approach to compensate for time delays associated with
subcutaneous glucose sensing and insulin delivery.
1.5.2.2 Proportional integral derivative control
The PID algorithm, used widely in control systems in industrial settings, calculates
insulin delivery based on three terms.[82] The proportional term adjusts insulin de-
livery in response to current glucose levels. The integral component adjusts insulin
according to the area under the curve between measured and target glucose. The
derivative term delivers insulin in response to the rate of change of blood glucose
over time. Total insulin delivery is the sum of all three components, balanced by
three constants, which are set individually. Unlike MPC which is proactive and has
the ability to anticipate future glucose excursions related to the effect of adminis-
tered insulin, meals and physical activity, PID is purely reactive to changes in blood
glucose.
A variation on PID control, which replaces the integral component with a ‘fading
memory’ where more recent glucose levels have a higher weighting than older val-
ues, has been evaluated.[83; 84] Addition of insulin feedback has been proposed to
improve the ability of PID to accommodate delays in insulin absorption.[85]
18
1.5. CLOSED-LOOP INSULIN DELIVERY
1.5.3 Historical overview
In 1964, Kadish proposed and tested a closed-loop system based on an on-off control
algorithm, using continuous glucose sensing with intravenous glucose and insulin
infusions.[86] Albisser et al [87] and Pfeiffer et al [88] developed the first true ‘artifi-
cial endocrine pancreas’ system. The first commercial device, the Biostator, was in-
troduced in 1977.[89] It operates as a fully closed-loop system using the intravenous-
intravenous route, with infusion of insulin when glucose levels are elevated and
dextrose when glucose levels are below target. Glucose is measured from whole
blood via a glucose oxidase sensor in real-time. Biostator was initially developed
to treat acute metabolic derangements such as diabetic ketoacidosis, but has since
been used for research purposes. Limitations of this prototype system include the
lack of portability, simplified algorithms, wastage of venous blood after each glucose
measurement, and an increased risk of infection or thrombosis.
In 2000, a consortium of academic, clinical and industrial partners commenced
work on the Advanced Insulin Infusion using a Control Loop project.[90] This in-
volved stepwise simulation and clinical testing of a system using an intravenous
glucose sensor (with a 30-minute time lag to simulate the delays associated with sub-
cutaneous sampling), a control algorithm operated via a handheld computer, and
a subcutaneous insulin pump. Clinical testing in 11 subjects with type 1 diabetes
demonstrated 84% of glucose readings in the 3.5 − 9.5 mmol/l range.
In 2003, Medtronic developed an ‘external physiologic insulin delivery’ system
using CGMS Gold (Medtronic, Northridge, CA, USA), a PID controller and the
Medtronic 511 Paradigm insulin pump, which was evaluated in ten patients with
type 1 diabetes.[91] Glucose levels were within 3.9 − 10.0 mmol/l for 75% of the
time during closed-loop, compared with 63% during standard CSII with SMBG at
home. There was no difference in episodes of hypoglycaemia. Roche developed
a subcutaneous-subcutaneous closed-loop system with meal announcement utilis-
ing an empirical algorithm to determine insulin delivery based on SCGM1 (Roche
Diagnostics, Mannheim, Germany) and operator input of meal carbohydrates.[92]
Compared with standard multiple daily injections, 32 hours of closed-loop control
reduced the frequency and quantity of carbohydrates required to treat hypoglycae-
mia in 12 subjects with type 1 diabetes.
19
1.5. CLOSED-LOOP INSULIN DELIVERY
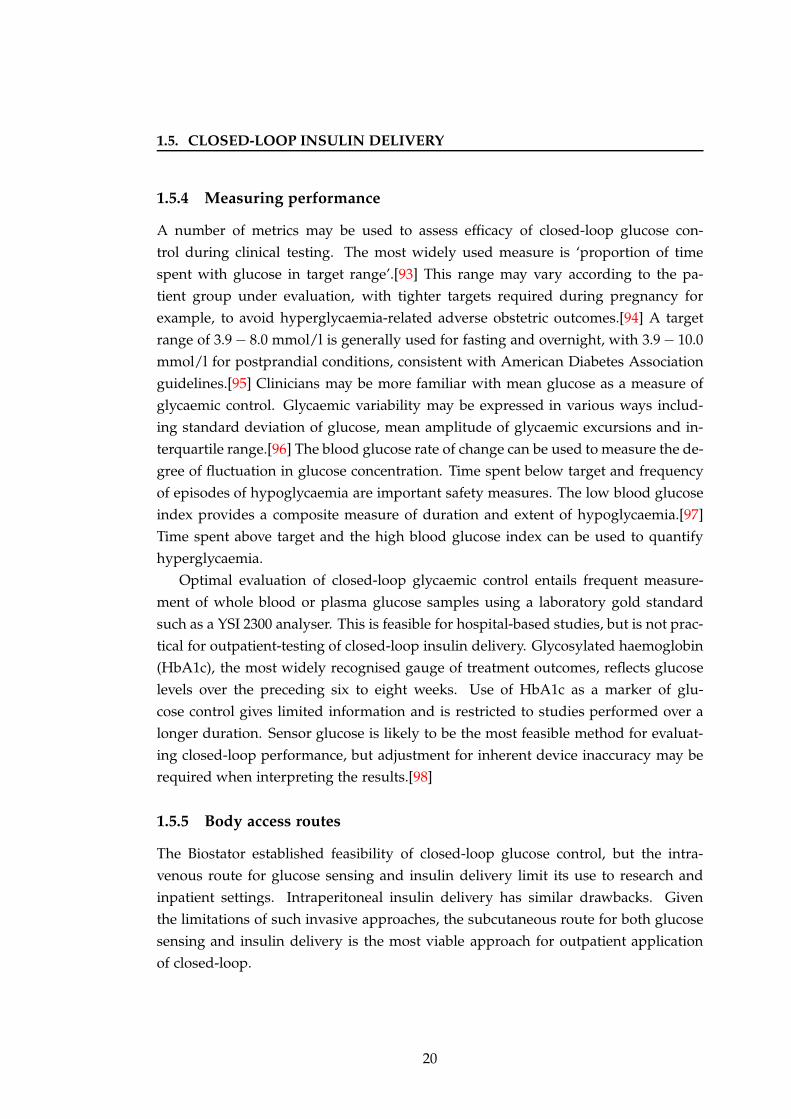
1.5.4 Measuring performance
A number of metrics may be used to assess efficacy of closed-loop glucose con-
trol during clinical testing. The most widely used measure is ‘proportion of time
spent with glucose in target range’.[93] This range may vary according to the pa-
tient group under evaluation, with tighter targets required during pregnancy for
example, to avoid hyperglycaemia-related adverse obstetric outcomes.[94] A target
range of 3.9 − 8.0 mmol/l is generally used for fasting and overnight, with 3.9 − 10.0
mmol/l for postprandial conditions, consistent with American Diabetes Association
guidelines.[95] Clinicians may be more familiar with mean glucose as a measure of
glycaemic control. Glycaemic variability may be expressed in various ways includ-
ing standard deviation of glucose, mean amplitude of glycaemic excursions and in-
terquartile range.[96] The blood glucose rate of change can be used to measure the de-
gree of fluctuation in glucose concentration. Time spent below target and frequency
of episodes of hypoglycaemia are important safety measures. The low blood glucose
index provides a composite measure of duration and extent of hypoglycaemia.[97]
Time spent above target and the high blood glucose index can be used to quantify
hyperglycaemia.
Optimal evaluation of closed-loop glycaemic control entails frequent measure-
ment of whole blood or plasma glucose samples using a laboratory gold standard
such as a YSI 2300 analyser. This is feasible for hospital-based studies, but is not prac-
tical for outpatient-testing of closed-loop insulin delivery. Glycosylated haemoglobin
(HbA1c), the most widely recognised gauge of treatment outcomes, reflects glucose
levels over the preceding six to eight weeks. Use of HbA1c as a marker of glu-
cose control gives limited information and is restricted to studies performed over a
longer duration. Sensor glucose is likely to be the most feasible method for evaluat-
ing closed-loop performance, but adjustment for inherent device inaccuracy may be
required when interpreting the results.[98]
1.5.5 Body access routes
The Biostator established feasibility of closed-loop glucose control, but the intra-
venous route for glucose sensing and insulin delivery limit its use to research and
inpatient settings. Intraperitoneal insulin delivery has similar drawbacks. Given
the limitations of such invasive approaches, the subcutaneous route for both glucose
sensing and insulin delivery is the most viable approach for outpatient application
of closed-loop.
20
1.5. CLOSED-LOOP INSULIN DELIVERY
1.5.6 Clinical testing
Approaches to closed-loop insulin delivery differ by degree of user input, timing of
application, or hormones infused as summarised in Table 1.2.[80]
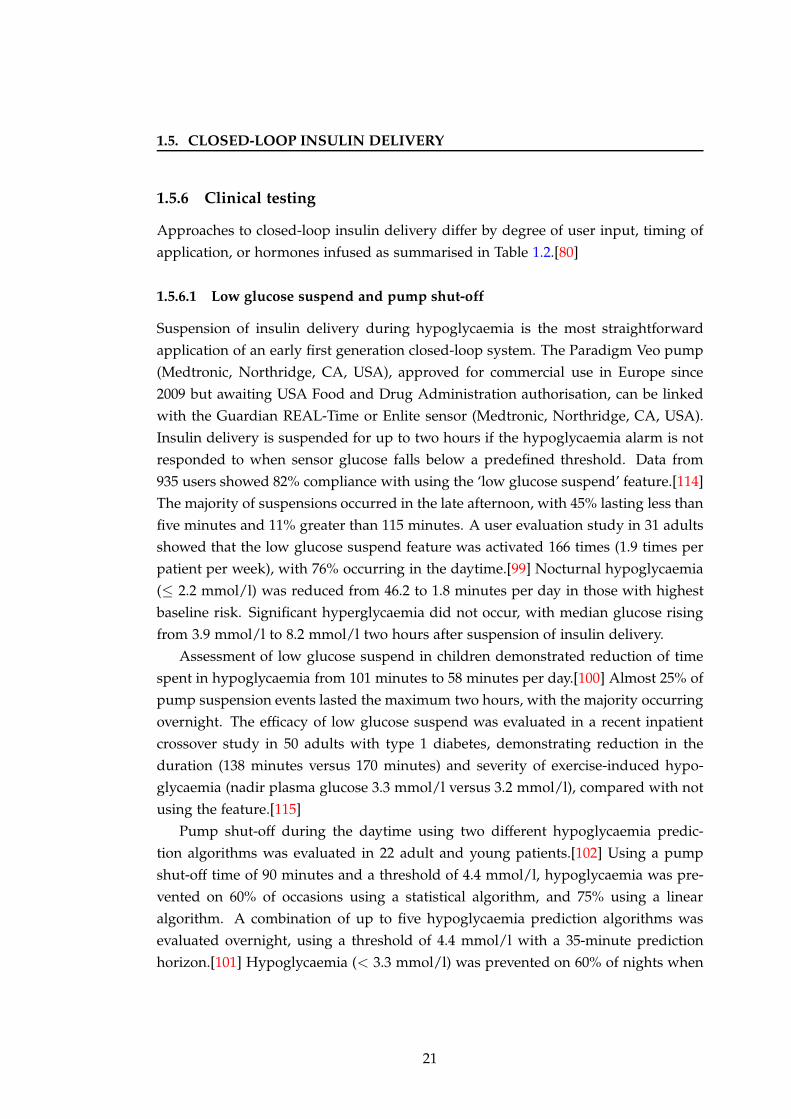
1.5.6.1 Low glucose suspend and pump shut-off
Suspension of insulin delivery during hypoglycaemia is the most straightforward
application of an early first generation closed-loop system. The Paradigm Veo pump
(Medtronic, Northridge, CA, USA), approved for commercial use in Europe since
2009 but awaiting USA Food and Drug Administration authorisation, can be linked
with the Guardian REAL-Time or Enlite sensor (Medtronic, Northridge, CA, USA).
Insulin delivery is suspended for up to two hours if the hypoglycaemia alarm is not
responded to when sensor glucose falls below a predefined threshold. Data from
935 users showed 82% compliance with using the ‘low glucose suspend’ feature.[114]
The majority of suspensions occurred in the late afternoon, with 45% lasting less than
five minutes and 11% greater than 115 minutes. A user evaluation study in 31 adults
showed that the low glucose suspend feature was activated 166 times (1.9 times per
patient per week), with 76% occurring in the daytime.[99] Nocturnal hypoglycaemia
(≤ 2.2 mmol/l) was reduced from 46.2 to 1.8 minutes per day in those with highest
baseline risk. Significant hyperglycaemia did not occur, with median glucose rising
from 3.9 mmol/l to 8.2 mmol/l two hours after suspension of insulin delivery.
Assessment of low glucose suspend in children demonstrated reduction of time
spent in hypoglycaemia from 101 minutes to 58 minutes per day.[100] Almost 25% of
pump suspension events lasted the maximum two hours, with the majority occurring
overnight. The efficacy of low glucose suspend was evaluated in a recent inpatient
crossover study in 50 adults with type 1 diabetes, demonstrating reduction in the
duration (138 minutes versus 170 minutes) and severity of exercise-induced hypo-
glycaemia (nadir plasma glucose 3.3 mmol/l versus 3.2 mmol/l), compared with not
using the feature.[115]
Pump shut-off during the daytime using two different hypoglycaemia predic-
tion algorithms was evaluated in 22 adult and young patients.[102] Using a pump
shut-off time of 90 minutes and a threshold of 4.4 mmol/l, hypoglycaemia was pre-
vented on 60% of occasions using a statistical algorithm, and 75% using a linear
algorithm. A combination of up to five hypoglycaemia prediction algorithms was
evaluated overnight, using a threshold of 4.4 mmol/l with a 35-minute prediction
horizon.[101] Hypoglycaemia (< 3.3 mmol/l) was prevented on 60% of nights when
21

1.5. CLOSED-LOOP INSULIN DELIVERY
Table 1.2: Closed-loop approaches
Approach Study population Clinical studies References(n = number of subjects)
Low glucosesuspend
Adults (n = 31) User evaluation of Paradigm Veo pump+ Guardian REAL-Time sensora
[99]
1 − 18 years (n = 21) User evaluation of Paradigm Veo pump+ Guardian REAL-Time sensora
[100]
12 − 39 years (n = 26) Overnight pump shut-off during hypo-glycaemia using prediction algorithms
[101]
6 − 38 years (n = 22) Daytime pump shut-off during hypo-glycaemia using prediction algorithms
[102]
Overnightclosed-loop
18 − 65 years (n = 24) 13 − 14 hours closed-loop versus openloop (control); randomised
[103]
5 − 18 years (n = 19) 12 hours closed-loop versus open loop(control); randomised
[104]
Adults (n = 20) 15 hours fully closed-loop versus openloop (control)
[105]
5 − 13 years (n = 8) 11 − 14 hours fully automated closed-loop
[106]
Closed-loopwith mealannouncement
12 − 18 years (n = 12) 36 hours closed-loop (+ manual bolus)versus open loop (control); randomised
[107]
Pregnancy (n = 10) 22 hours closed-loop (+ manual bolus)in early versus late gestation
[108]
Pregnancy (n = 12) 22 hours closed-loop (+ manual bolus)versus open loop (control); randomised
[109]
Closed-loopwithout mealannouncement
22 − 60 years (n = 8) 30 hours closed-loop (+ manual primingbolus) versus home open loop
[85]
19 − 30 years (n = 7) 8 − 24 hours fully closed-loop versushome open loop
[110]
13 − 20 years (n = 17) 34 hours semi (+ manual priming bolus)versus fully closed-loop; randomised
[111]
Adults (n = 10) 29 hours fully closed loop versus homeopen loop
[91]
Bi-hormonal(insulin +glucagon)closed-loop
19 − 71 years (n = 11) 27 hours bi-hormonal fully closed-loop [112]
Adults (n = 7) 28 hours bi-hormonal (+ manual prim-ing bolus) versus insulin only (control)closed-loop
[83]
Adults (n = 14) 33 hours bi-hormonal (+ manual prim-ing bolus) comparing two closed-loopalgorithms
[84]
Closed-loop withintra-peritonealinsulin delivery
Adults (n = 8) 48 hours closed-loop (+ manual primingbolus) versus open loop (control); ran-domised
[113]
Notes: aMedtronic, Northridge, CA, USA. System available in Europe for commercial use.
22
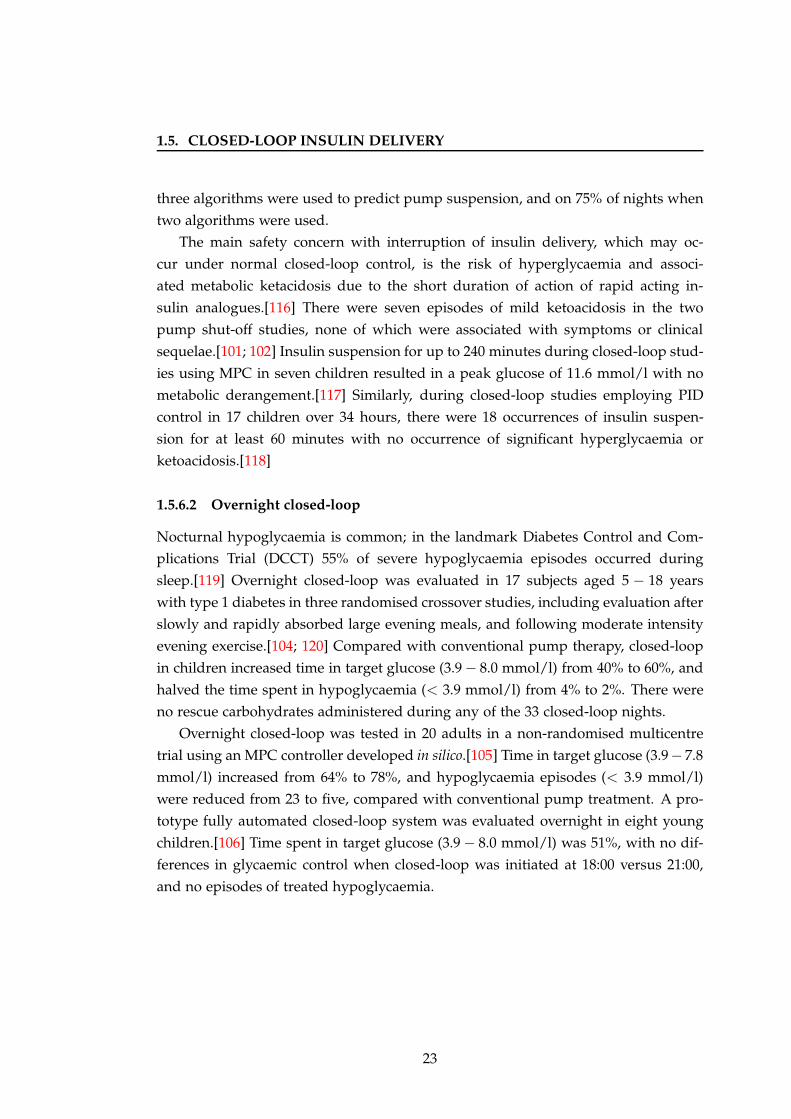
1.5. CLOSED-LOOP INSULIN DELIVERY
three algorithms were used to predict pump suspension, and on 75% of nights when
two algorithms were used.
The main safety concern with interruption of insulin delivery, which may oc-
cur under normal closed-loop control, is the risk of hyperglycaemia and associ-
ated metabolic ketacidosis due to the short duration of action of rapid acting in-
sulin analogues.[116] There were seven episodes of mild ketoacidosis in the two
pump shut-off studies, none of which were associated with symptoms or clinical
sequelae.[101; 102] Insulin suspension for up to 240 minutes during closed-loop stud-
ies using MPC in seven children resulted in a peak glucose of 11.6 mmol/l with no
metabolic derangement.[117] Similarly, during closed-loop studies employing PID
control in 17 children over 34 hours, there were 18 occurrences of insulin suspen-
sion for at least 60 minutes with no occurrence of significant hyperglycaemia or
ketoacidosis.[118]
1.5.6.2 Overnight closed-loop
Nocturnal hypoglycaemia is common; in the landmark Diabetes Control and Com-
plications Trial (DCCT) 55% of severe hypoglycaemia episodes occurred during
sleep.[119] Overnight closed-loop was evaluated in 17 subjects aged 5 − 18 years
with type 1 diabetes in three randomised crossover studies, including evaluation after
slowly and rapidly absorbed large evening meals, and following moderate intensity
evening exercise.[104; 120] Compared with conventional pump therapy, closed-loop
in children increased time in target glucose (3.9 − 8.0 mmol/l) from 40% to 60%, and
halved the time spent in hypoglycaemia (< 3.9 mmol/l) from 4% to 2%. There were
no rescue carbohydrates administered during any of the 33 closed-loop nights.
Overnight closed-loop was tested in 20 adults in a non-randomised multicentre
trial using an MPC controller developed in silico.[105] Time in target glucose (3.9− 7.8
mmol/l) increased from 64% to 78%, and hypoglycaemia episodes (< 3.9 mmol/l)
were reduced from 23 to five, compared with conventional pump treatment. A pro-
totype fully automated closed-loop system was evaluated overnight in eight young
children.[106] Time spent in target glucose (3.9 − 8.0 mmol/l) was 51%, with no dif-
ferences in glycaemic control when closed-loop was initiated at 18:00 versus 21:00,
and no episodes of treated hypoglycaemia.
23
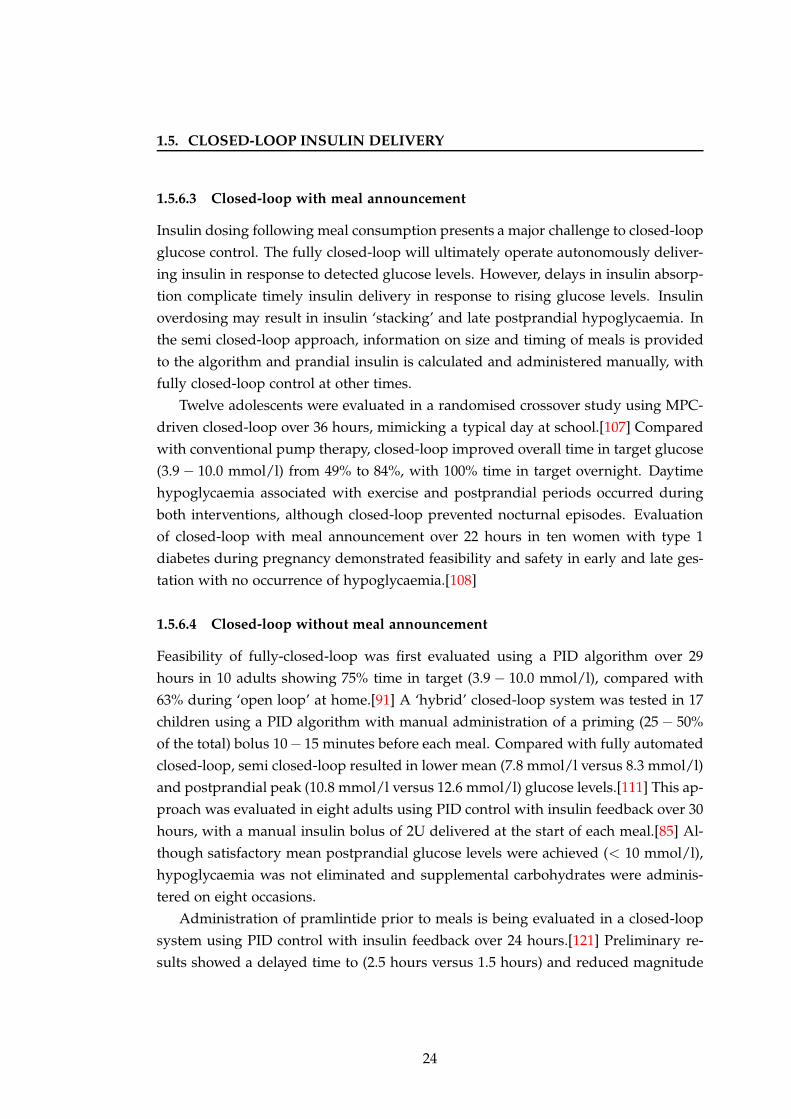
1.5. CLOSED-LOOP INSULIN DELIVERY
1.5.6.3 Closed-loop with meal announcement
Insulin dosing following meal consumption presents a major challenge to closed-loop
glucose control. The fully closed-loop will ultimately operate autonomously deliver-
ing insulin in response to detected glucose levels. However, delays in insulin absorp-
tion complicate timely insulin delivery in response to rising glucose levels. Insulin
overdosing may result in insulin ‘stacking’ and late postprandial hypoglycaemia. In
the semi closed-loop approach, information on size and timing of meals is provided
to the algorithm and prandial insulin is calculated and administered manually, with
fully closed-loop control at other times.
Twelve adolescents were evaluated in a randomised crossover study using MPC-
driven closed-loop over 36 hours, mimicking a typical day at school.[107] Compared
with conventional pump therapy, closed-loop improved overall time in target glucose
(3.9 − 10.0 mmol/l) from 49% to 84%, with 100% time in target overnight. Daytime
hypoglycaemia associated with exercise and postprandial periods occurred during
both interventions, although closed-loop prevented nocturnal episodes. Evaluation
of closed-loop with meal announcement over 22 hours in ten women with type 1
diabetes during pregnancy demonstrated feasibility and safety in early and late ges-
tation with no occurrence of hypoglycaemia.[108]
1.5.6.4 Closed-loop without meal announcement
Feasibility of fully-closed-loop was first evaluated using a PID algorithm over 29
hours in 10 adults showing 75% time in target (3.9 − 10.0 mmol/l), compared with
63% during ‘open loop’ at home.[91] A ‘hybrid’ closed-loop system was tested in 17
children using a PID algorithm with manual administration of a priming (25 − 50%
of the total) bolus 10− 15 minutes before each meal. Compared with fully automated
closed-loop, semi closed-loop resulted in lower mean (7.8 mmol/l versus 8.3 mmol/l)
and postprandial peak (10.8 mmol/l versus 12.6 mmol/l) glucose levels.[111] This ap-
proach was evaluated in eight adults using PID control with insulin feedback over 30
hours, with a manual insulin bolus of 2U delivered at the start of each meal.[85] Al-
though satisfactory mean postprandial glucose levels were achieved (< 10 mmol/l),
hypoglycaemia was not eliminated and supplemental carbohydrates were adminis-
tered on eight occasions.
Administration of pramlintide prior to meals is being evaluated in a closed-loop
system using PID control with insulin feedback over 24 hours.[121] Preliminary re-
sults showed a delayed time to (2.5 hours versus 1.5 hours) and reduced magnitude
24
1.5. CLOSED-LOOP INSULIN DELIVERY
of (4.9 mmol/l versus 6.3 mmol/l) peak glucose following lunch and dinner with the
addition of pramlintide, compared with closed-loop insulin delivery alone.
A feasibility study employing fuzzy logic control in a fully closed-loop system
(MD-Logic Artificial Pancreas system) in seven adults with type 1 diabetes over eight
(12 occasions) or 24 hours (two occasions) demonstrated 73% of sensor values be-
tween 3.9 − 10.0 mmol/l with no symptomatic hypoglycaemia.[110] Further valida-
tion of this approach is forthcoming.
1.5.6.5 Dual hormone closed-loop
Glucagon may reduce the risk of hypoglycaemia more effectively than discontinua-
tion of insulin delivery in a closed-loop system, due to its faster onset of action com-
pared with the offset of insulin action.[122] The glucagon response to low glucose
levels is gradually lost in type 1 diabetes. Co-administration of glucagon as part of a
closed-loop system was evaluated in 11 adults during 24 hours of fully closed-loop
control using an adaptive MPC algorithm.[112] Six subjects achieved mean blood
glucose of 7.8 mmol/l with no hypoglycaemic events. Five subjects experienced hy-
poglycaemia requiring treatment, attributed to slower insulin absorption (time to
peak plasma insulin 117 minutes versus 64 minutes for the other six subjects). Sub-
sequent adjustment of the algorithm’s insulin pharmacokinetic parameters averted
further hypoglycaemia, although at a cost of a higher mean glucose of 9.1 mmol/l.
Dual glucagon and insulin delivery was evaluated in 11 subjects in a semi closed-
loop system under fading memory proportional derivative control with manual de-
livery of 50 − 75% of the bolus pre-meals, demonstrating 63% lower time spent in
hypoglycaemia compared with insulin alone.[83] Compared with low gain, glucagon
delivered using high gain parameters (pulses over five to ten minutes followed by
a 50-minute off period) reduced frequency of hypoglycaemia even further. There
was only one report of nausea and vomiting, during a low gain study. Of note, much
lower doses of glucagon (0.05− 0.1mg) were delivered by closed-loop at any one time,
compared with the 1mg dose used as emergency treatment for hypoglycaemia. Limi-
tations of glucagon use include its instability and tendency to form amyloid fibrils in
solution, which may be reduced by use of an alkaline preparation. Another drawback
is the depletion of liver glycogen stores with repeated administration, which may
limit the ability of glucagon to prevent hypoglycaemia in a closed-loop system.[122]
25
1.6. THESIS OUTLINE
1.5.6.6 Closed-loop intraperitoneal insulin delivery
The major limitations of the subcutaneous-subcutaneous approach are the delays
in insulin delivery and glucose sensing. A closed-loop system combining an im-
plantable intraperitoneal pump with intravenous CGM placed in the superior vena
cava was tested in four patients: sensor failure occurred in one subject, and glucose
levels were maintained between 4.4 − 13.3 mmol/l in the remaining three for 84%
of the time.[123] Closed-loop intraperitoneal insulin delivery using PID control and
subcutaneous glucose sensing was evaluated in a randomised study over two days
in eight adults.[113] Excluding the early postprandial periods, closed-loop improved
time spent in the 4.4 − 6.6 mmol/l range (46% versus 29%) and lowered mean glu-
cose (6.9 mmol/l versus 7.9 mmol/l) with no difference in time spent hypoglycaemic,
compared with conventional CSII.
1.5.6.7 Simulators
Compared with clinical studies, which are time consuming and costly to perform,
computer-based simulated studies enable rapid systems evaluation without require-
ment for ethical or regulatory approvals.[124] Simulators enable evaluation of the
effect of various parameters or scenarios that may be encountered in real life such
as sensor errors, pump occlusion, hypoglycaemic episodes, exercise, errors in car-
bohydrate estimation and unannounced meals. In 2008, the USA Food and Drug
Administration approved an in silico simulation environment as an alternative to an-
imal trials for pre-clinical closed-loop studies.[125]
1.6 Thesis outline
In this thesis, I present the first randomised controlled closed-loop studies in adults
and pregnant women with type 1 diabetes.
Chapter 2 describes a pilot study in 12 adults with type 1 diabetes evaluating
the feasibility of overnight closed-loop insulin delivery. Subjects attended a clinical
research facility for two overnight stays - on one night, closed-loop was commenced
at 19:00 following a standard evening meal (60g carbohydrate) and continued until
08:00 the following morning; on the other night subjects remained on their usual
insulin pump regimen overnight.
Chapter 3 describes a follow-up study in twelve new adults. Following on from
the feasibility study, I wanted to evaluate the efficacy of closed-loop under more chal-
26
1.6. THESIS OUTLINE
lenging situations that people with type 1 diabetes may face in their day to day lives.
One such scenario is consuming a large meal and alcohol on an evening out, associ-
ated with increased risk of postprandial hyperglycaemia and delayed hypoglycaemia,
respectively. Subjects consumed a 100g-carbohydrate evening meal accompanied by
a moderate amount of white wine (mean 564ml) on two occasions. Closed-loop was
applied from 22:00 until lunchtime the next day on one visit, and usual pump therapy
continued on the other visit.
In Chapter 4, I describe the first randomised study in pregnant women with type
1 diabetes comparing closed-loop insulin delivery with conventional CSII, during
normal daily activities. Maintenance of tight glycaemic control during pregnancy
is critical to achieving favourable obstetric outcomes. Daytime control may be es-
pecially challenging as a result of the fluctuations in glucose levels that occur with
meals and physical activity. Twelve women were evaluated over 24 hours on two vis-
its, including meals, snacks, low intensity self-paced walks and moderate intensity
exercise.
As part of the closed-loop study presented in Chapter 4, women were asked to
wear an accelerometer and glucose sensor during study visits and at home for up to
three days, enabling objective collection of data which was analysed retrospectively.
Chapter 5 describes results on activity patterns, physical activity energy expendi-
ture and glucose control in ten pregnant women during free-living, compared with
controlled meals and scheduled exercise during a 24 hour period in hospital.
In Chapter 6, I present an assessment of the accuracy of continuous glucose moni-
toring during moderate intensity exercise in 12 pregnant women with type 1 diabetes,
undertaken as part of the closed-loop study discussed in Chapter 4. Glucose sensor
values were evaluated against plasma glucose (reference) measured during afternoon
and morning sessions of brisk treadmill walking, and compared with sedentary con-
ditions.
Chapter 7 summarises the results of my studies including strengths and limita-
tions, and discusses future plans. I also present the challenges to be overcome prior
to introduction of closed-loop into clinical practice.
27
Chapter 2
Feasibility of overnight closed-loop
insulin delivery
2.1 Background
Maintenance of normal glucose concentrations may significantly reduce diabetes-
related complications. However, tight control is associated with an increased risk of
hypoglycaemia,[50] such that episodes of and/or the fear of hypoglycaemia limit the
ability of patients and their families to achieve target glucose levels.[126] A recent
survey of CSII-treated adults in the UK found that 27% had substantial fear of hy-
poglycaemia, but this was not correlated with higher HbA1c.[127] The experience of
hypoglycaemia can have several negative effects, including a feeling of loss of con-
trol and heightened anxiety. This may lead to over-compensatory behaviours such as
taking less insulin or overeating, resulting in increased blood glucose variability. In
the DCCT, intensive therapy lowered mean absolute HbA1c by 2% and mean blood
glucose by 5 mmol/l, but also increased the risk of severe hypoglycaemia threefold.
Risk factors included low HbA1c, prior history of severe hypoglycaemia, missed
meals and change in insulin dose.[119]
Patients with type 1 diabetes suffer two symptomatic episodes of hypoglycaemia
per week on average and at least one episode of severe hypoglycaemia, defined as
an event requiring assistance of another person to administer rescue treatment, per
year.[128; 129] Risk factors for hypoglycaemia include excess or ill-timed therapeu-
tic insulin, decreased exogenous glucose (e.g. missed meals, overnight), increased
glucose utilisation (e.g. exercise, pregnancy), decreased endogenous glucose pro-
duction (e.g. alcohol ingestion), and changes in insulin sensitivity (e.g. weight loss,
28
2.1. BACKGROUND
exercise).[130]
Hypoglycaemia in healthy individuals is associated with several defence mecha-
nisms including reduced insulin release, and increased glucagon, epinephrine and
cortisol secretion. Onset of neuroglycopaenic symptoms including palpitations,
tremor, sweating and hunger result in carbohydrate ingestion. In type 1 diabetes,
elevated therapeutic insulin levels, an absent rise in glucagon and a higher glycaemic
threshold for release of adrenaline contribute to severely compromised counter-
regulatory responses to hypoglycaemia. In addition, almost 25% of patients develop
hypoglycaemia unawareness, associated with longer disease duration and increased
frequency of hypoglycaemic episodes, where there is loss of the autonomic warn-
ing symptoms of low glucose.[130] The presence of hypoglycaemia unawareness in-
creases the risk of severe hypoglycaemia six-fold.[131] In the DCCT, 36% of all day-
time episodes of severe hypoglycaemia occurred without any warning signs.[119]
Counter-regulatory responses to hypoglycaemia, including epinephrine release,
are reduced during sleep.[132] Hypoglycaemia may impair arousal from sleep,[133]
although this was not observed in a more recent study.[134] In the DCCT, 55% of se-
vere hypoglycaemia events occurred during sleep, predominantly between midnight
and 08:00.[119] Overall, 70% of episodes occurred either during sleep or without
recognition of warning symptoms of hypoglycaemia, with no difference between in-
tensive and standard therapy. In the multicentre JDRF CGM trial, hypoglycaemia
occurred on 8.5% of 36,467 nights, with 23% of episodes lasting two hours or more
and only 3% of patients not experiencing any nocturnal hypoglycaemia.[135] Notably,
there was no difference between MDI and CSII-treated patients. Hypoglycaemia risk
was correlated with lower HbA1c and higher frequency of hypoglycaemia at baseline.
Nocturnal hypoglycaemia may be associated with cardiac rhythm disturbances,
including sinus bradycardia and ectopics.[136] In extreme cases, sudden death may
result. This phenomenon, termed ‘dead in bed’ syndrome, was first described in 1991
and is thought to be responsible for 6% of deaths in patients with type 1 diabetes
younger than 40 years of age.[137] Postulated mechanisms include prolongation of
the cardiac QTc interval, reduction in extracellular potassium, increase in intracellular
calcium, and excess sympathetic activity. The risk of cardiac arrhythmia is increased
in the presence of autonomic neuropathy and pre-existing cardiac disease, and may
be correlated with male gender, elevated HbA1c, high insulin doses and low body
mass index.[138] However, the discordance between prevalence of hypoglycaemia
and sudden death suggests other contributory factors such as genetic predisposition.
Severe hypoglycaemia may infrequently result in seizures.[129] The risk of seizure
29
2.2. RATIONALE
is increased two to four hours after onset of nocturnal hypoglycaemia.[46] The short
and long term consequences of hypoglycaemia on cognitive function are not well un-
derstood. Fatigue and an impaired sense of well-being have been observed the morn-
ing following overnight hypoglycaemia.[139] Although negative long term effects of
hypoglycaemia have been reported,[140] a follow up study to the DCCT found no
evidence of decline in cognitive capacity after 18 years in 85% of enrolled patients,
despite relatively high rates of severe hypoglycaemia.[141]
2.2 Rationale
Improving glucose control whilst asleep, when risk of hypoglycaemia is greatest and
the counter-regulatory response to hypoglycaemia is blunted, may be of considerable
benefit. The emergence of new technologies including smart insulin pumps and CGM
has contributed to improved diabetes care. Despite such advances, existing insulin
replacement regimens commonly fail to achieve optimal glycaemic targets.[55] Fine
tuning of insulin regimens is only feasible during the daytime whilst awake. CGM
provides detailed information in real-time on glucose values and trends, including
direction and rate of change.[37] The benefits gained from CGM are dependent on
compliance with wearing the device as well as the ability of the user to correctly
interpret the glucose values and make appropriate lifestyle and therapy modifica-
tions. This is not practical during the night whilst asleep when the majority of severe
hypoglycaemia events in adults are reported to occur.[119] Despite the ability to set
individual alarms for impending hypoglycaemia, the majority of CGM alarms are
not heard by the wearer during sleep.[45]
Combining insulin pumps and glucose sensors may improve diabetes control.[33]
However, this still demands considerable patient participation and even the most
diligent patients may struggle to achieve optimal glycaemic control. The requirement
for multiple testing and adjustment of insulin infusions may be minimised with an
artificial pancreas or closed-loop insulin delivery system, which combines real-time
continuous glucose sensing with subcutaneous insulin pump delivery, directed by a
control algorithm. Use of closed-loop overnight, when glycaemic control is not com-
plicated by meals or physical activity, may be a realistic first step. Such a system has
been evaluated in young people with type 1 diabetes, demonstrating improvement
in overnight glucose control and reduced nocturnal hypoglycaemia.[104] There are
no randomised studies evaluating closed-loop insulin delivery in adults with type 1
diabetes.
30
2.3. AIM
2.3 Aim
The aim of this study was to assess the feasibility and efficacy of overnight closed-
loop insulin delivery compared with conventional continuous subcutaneous insulin
infusion (CSII) in adults with type 1 diabetes, in a controlled setting.
2.4 Methods
2.4.1 Participants
Between February and July 2009, 13 patients were recruited from the adult diabetes
outpatient clinic at Addenbrooke’s Hospital, Cambridge, UK to take part in the study
conducted at the Wellcome Trust clinical research facility, a purpose-built research
unit at Addenbrooke’s Hospital. The study protocol was approved by the Cam-
bridgeshire Research Ethics Committee, and carried out in accordance with the Dec-
laration of Helsinki. Written informed consent was obtained from each participant.
The eligibility criteria for participation included adults (aged 18 to 65 years in-
clusive) with type 1 diabetes (World Health Organisation definition) for at least six
months, and on insulin pump therapy for at least three months prior to the start of
the study. Patients were excluded if they had non-autoimmune diabetes, major con-
ditions or concurrent medications likely to interfere with interpretation of the results,
clinically significant diabetes-related complications or recurrent severe hypoglycae-
mia.
2.4.2 Study design
The study had a randomised crossover design (Figure 2.1). Once consented, partici-
pants were randomised to the order in which two overnight studies were performed,
during which glucose levels were controlled either by conventional CSII (control), or
by computer-based algorithm (closed-loop). In between study nights, self-adjustment
of CSII was permitted, although not encouraged.
Subjects underwent a period of optimisation of glycaemic control at least two
weeks prior to the first study night, where they were asked to wear a FreeStyle Nav-
igator CGM (Abbott Diabetes Care, Alameda, CA, USA) for up to five days (Figure
1.1). The device was inserted either in the clinic or at the subject’s home, and instruc-
tions on use of the device, including alarms and timing of calibrations, were provided
to each subject. The CGM data was downloaded and reviewed by the pump clinician
31
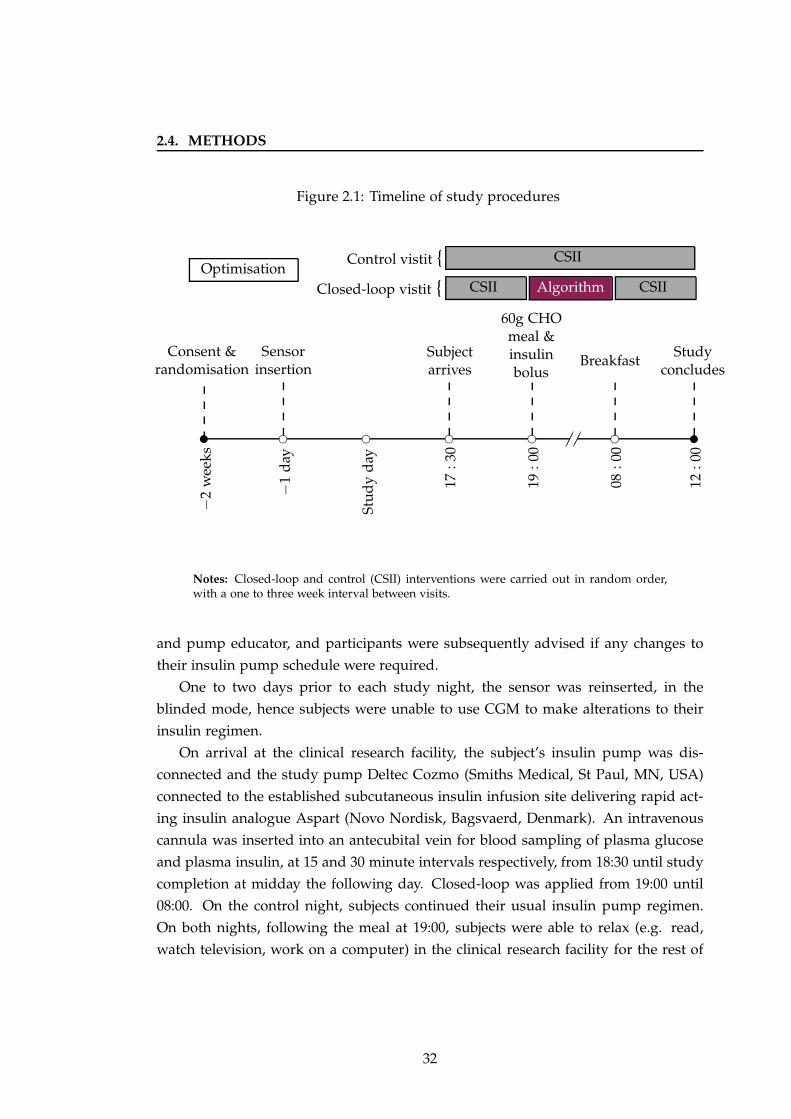
2.4. METHODS
Figure 2.1: Timeline of study procedures−
2w
eeks
✉ ❡
−1
day
❡
Stu
dy
day
❡
17:3
0❡
19:0
0 ✁✁✁✁❡
08:0
0
✉
12:0
0
Consent &randomisation
Sensorinsertion
Subjectarrives
60g CHOmeal &insulinbolus
BreakfastStudy
concludes
OptimisationCSIICSII
CSII
AlgorithmClosed-loop vistit {
Control vistit {
Notes: Closed-loop and control (CSII) interventions were carried out in random order,with a one to three week interval between visits.
and pump educator, and participants were subsequently advised if any changes to
their insulin pump schedule were required.
One to two days prior to each study night, the sensor was reinserted, in the
blinded mode, hence subjects were unable to use CGM to make alterations to their
insulin regimen.
On arrival at the clinical research facility, the subject’s insulin pump was dis-
connected and the study pump Deltec Cozmo (Smiths Medical, St Paul, MN, USA)
connected to the established subcutaneous insulin infusion site delivering rapid act-
ing insulin analogue Aspart (Novo Nordisk, Bagsvaerd, Denmark). An intravenous
cannula was inserted into an antecubital vein for blood sampling of plasma glucose
and plasma insulin, at 15 and 30 minute intervals respectively, from 18:30 until study
completion at midday the following day. Closed-loop was applied from 19:00 until
08:00. On the control night, subjects continued their usual insulin pump regimen.
On both nights, following the meal at 19:00, subjects were able to relax (e.g. read,
watch television, work on a computer) in the clinical research facility for the rest of
32
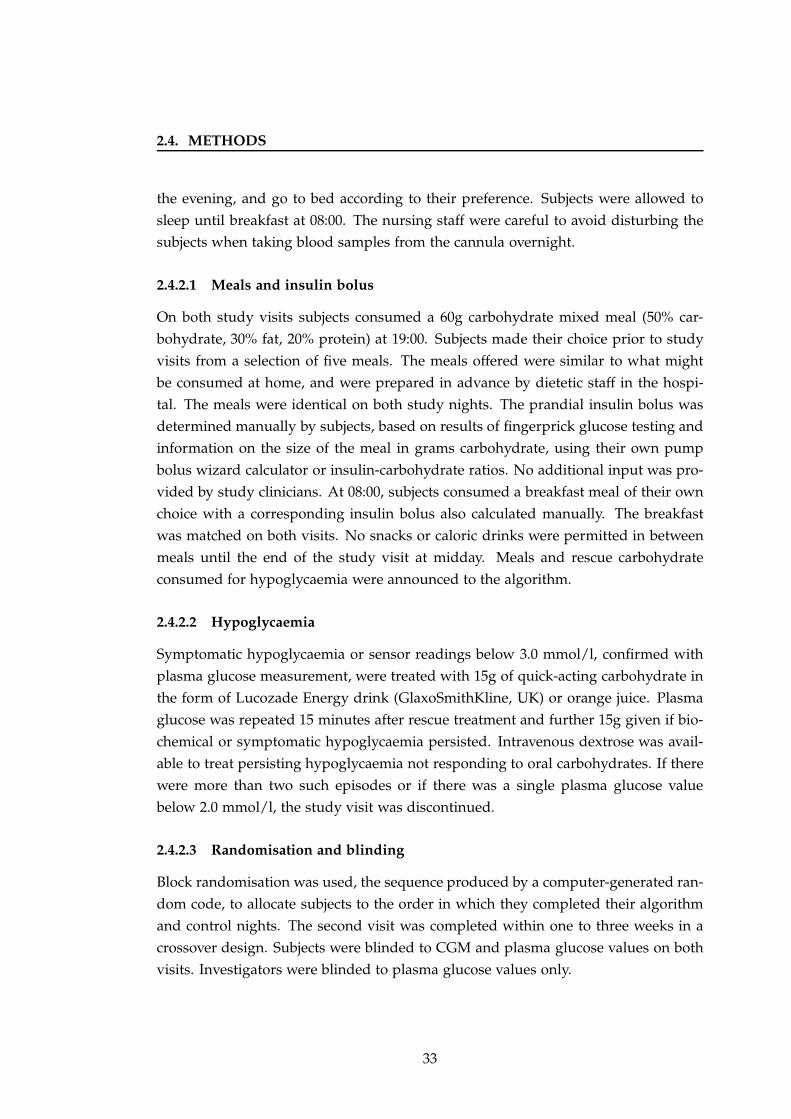
2.4. METHODS
the evening, and go to bed according to their preference. Subjects were allowed to
sleep until breakfast at 08:00. The nursing staff were careful to avoid disturbing the
subjects when taking blood samples from the cannula overnight.
2.4.2.1 Meals and insulin bolus
On both study visits subjects consumed a 60g carbohydrate mixed meal (50% car-
bohydrate, 30% fat, 20% protein) at 19:00. Subjects made their choice prior to study
visits from a selection of five meals. The meals offered were similar to what might
be consumed at home, and were prepared in advance by dietetic staff in the hospi-
tal. The meals were identical on both study nights. The prandial insulin bolus was
determined manually by subjects, based on results of fingerprick glucose testing and
information on the size of the meal in grams carbohydrate, using their own pump
bolus wizard calculator or insulin-carbohydrate ratios. No additional input was pro-
vided by study clinicians. At 08:00, subjects consumed a breakfast meal of their own
choice with a corresponding insulin bolus also calculated manually. The breakfast
was matched on both visits. No snacks or caloric drinks were permitted in between
meals until the end of the study visit at midday. Meals and rescue carbohydrate
consumed for hypoglycaemia were announced to the algorithm.
2.4.2.2 Hypoglycaemia
Symptomatic hypoglycaemia or sensor readings below 3.0 mmol/l, confirmed with
plasma glucose measurement, were treated with 15g of quick-acting carbohydrate in
the form of Lucozade Energy drink (GlaxoSmithKline, UK) or orange juice. Plasma
glucose was repeated 15 minutes after rescue treatment and further 15g given if bio-
chemical or symptomatic hypoglycaemia persisted. Intravenous dextrose was avail-
able to treat persisting hypoglycaemia not responding to oral carbohydrates. If there
were more than two such episodes or if there was a single plasma glucose value
below 2.0 mmol/l, the study visit was discontinued.
2.4.2.3 Randomisation and blinding
Block randomisation was used, the sequence produced by a computer-generated ran-
dom code, to allocate subjects to the order in which they completed their algorithm
and control nights. The second visit was completed within one to three weeks in a
crossover design. Subjects were blinded to CGM and plasma glucose values on both
visits. Investigators were blinded to plasma glucose values only.
33
2.4. METHODS
Figure 2.2: Participant during closed-loop study
Notes: The Deltec Cozmo insulin pump and receiver component of the FreeStyle Navi-gator glucose sensor are shown in the foreground, with the laptop computer running thecontrol algorithm in the background.
2.4.2.4 Closed-loop visit
The closed-loop system, shown in Figure 2.2, was employed for 13 hours in total,
from 19:00 until 08:00 the following day. Every 15 minutes, the sensor glucose value
was read and entered by the research nurse or clinician into a laptop computer at the
subject’s bedside, containing the algorithm. The insulin infusion rate to be delivered
over the next 15 minutes was computed by the algorithm, and subsequently adjusted
manually on the study pump.
• Continuous glucose sensor. The FreeStyle Navigator CGM (Abbott Diabetes
Care, Alameda, CA, USA), calibrated with capillary glucose measurements on
the inbuilt meter as per manufacturers’ instructions, was used. The sensor was
inserted at least 24 hours prior to each study visit, as the device had a run-in
period of 10 hours prior to displaying glucose values.
• Model Predictive Control (MPC) algorithm. An adaptive model predictive
control (MPC) algorithm designed at the University of Cambridge was used.
Versions 0.02.04.0 to 0.02.13.0 were used during the study. The MPC algorithm
employs a compartment model of glucose kinetics representing the effect of
rapid acting insulin and the amount of carbohydrate consumed on sensor glu-
cose excursions.[81] Information regarding subject’s body weight, total daily in-
34
2.4. METHODS
sulin dose, and basal insulin infusion rates are entered into the computer prior
to commencement of the algorithm. In real-time, sensor glucose measurements
are used to update two model parameters: an endogenous glucose flux correct-
ing for errors in model-based predictions, and carbohydrate bioavailability. A
combined model forecasts plasma glucose excursions over a 2.5 hour prediction
horizon. Insulin infusion is calculated to achieve the target glucose, which is set
at 5.8 mmol/l but may increase up to 7.3 mmol/l if model-based predictions
are considered less accurate. Intrinsic safety rules reduce insulin infusion to
prevent overdosing if required.
• Study pump. The Deltec Cozmo pump (Smiths Medical, St Paul, MN, USA)
was used on all study visits. Subjects were asked to replace their usual insulin
infusion set, normally changed every three days, approximately 24 hours prior
to each study visit. The rapid acting insulin analogue aspart (Novo Nordisk,
Bagsvaerd, Denmark) was used for all study visits to ensure comparability.
Subjects usually on insulin lispro (Eli Lilly, Indianapolis, USA) were asked to
switch to aspart at least 24 hours prior to each study visit.
2.4.2.5 CSII visit
On the CSII visit, subjects continued their insulin pump regimen, similar to a night
at home. On arrival for the study visit, usual pre-programmed basal infusion rates
were entered into the study pump which was used for insulin delivery from 19:00
until 12:00 the following day.
2.4.3 Measurements
Whole blood samples for glucose and insulin were immediately centrifuged and
stored frozen for later analysis. Plasma glucose was measured on a Yellow Springs
International YSI 2300 STAT Plus analyser (YSI Ltd, Farnborough, UK). The intra-
assay coefficient of variation (CV), was 1.5% at 4.1 mmol/l. Plasma glucose values
were not used to change insulin doses for delivery during closed-loop, with infu-
sion rates calculated based on sensor glucose readings alone. Plasma insulin was
measured using an immunochemiluminometric assay (Invitron Ltd, Monmouth, UK)
which had a mean intra-assay CV of 4.7% and inter-assay CV of 7.2 − 8.1% between
3.3 − 133 mU/l.
35
2.4. METHODS
2.4.4 Statistical analysis
2.4.4.1 Power calculation
The power calculation was based on results of the study of closed-loop in children
with type 1 diabetes.[104] Assuming a similar standard deviation of 40% and a two
sided significance level of 0.05, a sample size of 12 provided 80% power to detect an
absolute increase in proportion of time spent in target glucose (3.9 − 8.0 mmol/l) of
37% (from 26% during CSII to 63% during closed-loop).
2.4.4.2 Efficacy endpoints
The primary outcome measure was proportion of time spent with plasma glucose
in target range defined as 3.9 − 8.0 mmol/l, between 19:00 and 08:00. Secondary
outcomes were time spent below (< 3.9 mmol/l) and above (> 8.0 mmol/l) tar-
get, mean glucose, and glycaemic variability as measured by standard deviation of
overnight glucose. In addition, the low blood glucose index and high blood glucose
index assessing the duration and extent of hypo- and hyperglycaemia, respectively,
were calculated.[97] Mean basal insulin infusion rate and plasma insulin concentra-
tion were measured to enable comparison of insulin delivery on both study visits,
and provide information on insulin kinetics. Secondary outcomes were calculated
using plasma and sensor (CGM) glucose, for the following time periods:
• Overall period (19:00-08:00). On closed-loop visits, the ‘overall period’ was de-
fined as the interval from commencement of the algorithm at 19:00 with the
evening meal until discontinuation at 08:00 the following morning. On CSII
visits, this was defined as the corresponding period in time when subjects con-
tinued their usual CSII regimen.
• Overnight period (00:00-08:00). On closed-loop visits, the ‘overnight period’
was defined as the period from midnight until discontinuation of the algorithm
at 08:00. This period was chosen as it was several hours after the prandial
insulin bolus, hence allowing evaluation of performance of closed-loop with
minimal influence of bolus insulin. On CSII visits, this was the corresponding
period in time when subjects continued their usual CSII regimen.
• Morning period (08:00-12:00). On closed-loop visits, the ‘morning period’ was
defined from 08:00 when subjects discontinued the algorithm and resumed their
36
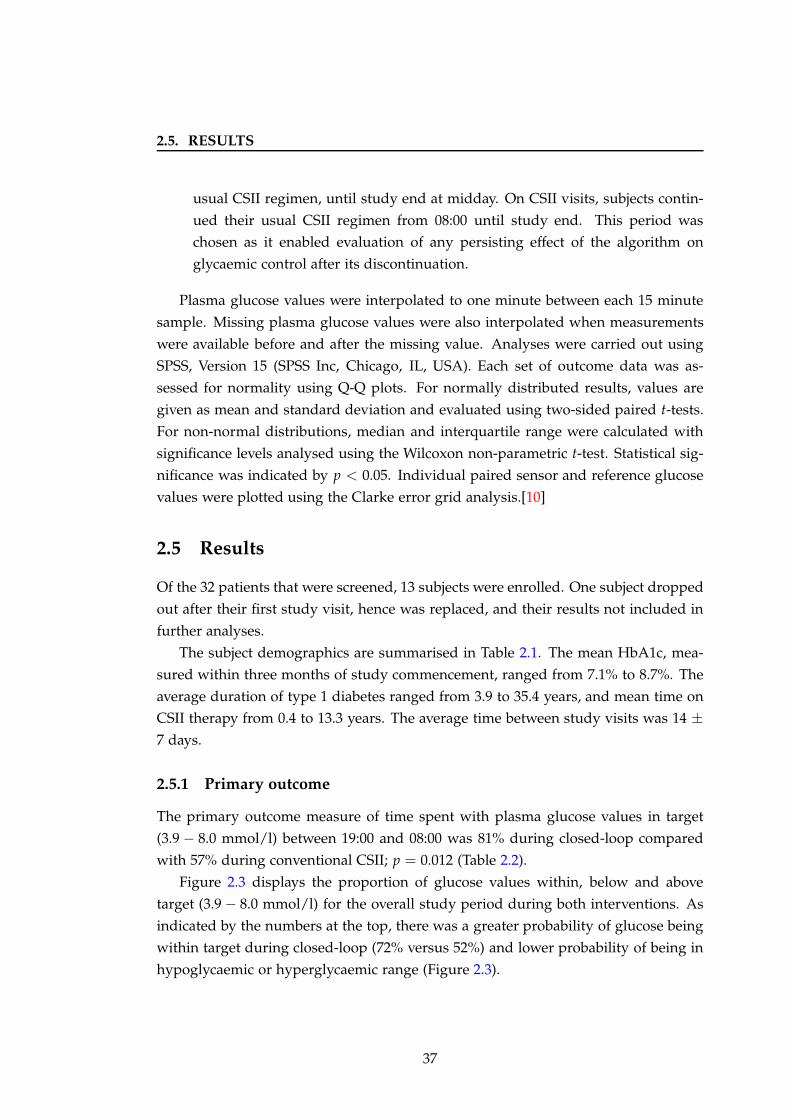
2.5. RESULTS
usual CSII regimen, until study end at midday. On CSII visits, subjects contin-
ued their usual CSII regimen from 08:00 until study end. This period was
chosen as it enabled evaluation of any persisting effect of the algorithm on
glycaemic control after its discontinuation.
Plasma glucose values were interpolated to one minute between each 15 minute
sample. Missing plasma glucose values were also interpolated when measurements
were available before and after the missing value. Analyses were carried out using
SPSS, Version 15 (SPSS Inc, Chicago, IL, USA). Each set of outcome data was as-
sessed for normality using Q-Q plots. For normally distributed results, values are
given as mean and standard deviation and evaluated using two-sided paired t-tests.
For non-normal distributions, median and interquartile range were calculated with
significance levels analysed using the Wilcoxon non-parametric t-test. Statistical sig-
nificance was indicated by p < 0.05. Individual paired sensor and reference glucose
values were plotted using the Clarke error grid analysis.[10]
2.5 Results
Of the 32 patients that were screened, 13 subjects were enrolled. One subject dropped
out after their first study visit, hence was replaced, and their results not included in
further analyses.
The subject demographics are summarised in Table 2.1. The mean HbA1c, mea-
sured within three months of study commencement, ranged from 7.1% to 8.7%. The
average duration of type 1 diabetes ranged from 3.9 to 35.4 years, and mean time on
CSII therapy from 0.4 to 13.3 years. The average time between study visits was 14 ±
7 days.
2.5.1 Primary outcome
The primary outcome measure of time spent with plasma glucose values in target
(3.9 − 8.0 mmol/l) between 19:00 and 08:00 was 81% during closed-loop compared
with 57% during conventional CSII; p = 0.012 (Table 2.2).
Figure 2.3 displays the proportion of glucose values within, below and above
target (3.9 − 8.0 mmol/l) for the overall study period during both interventions. As
indicated by the numbers at the top, there was a greater probability of glucose being
within target during closed-loop (72% versus 52%) and lower probability of being in
hypoglycaemic or hyperglycaemic range (Figure 2.3).
37
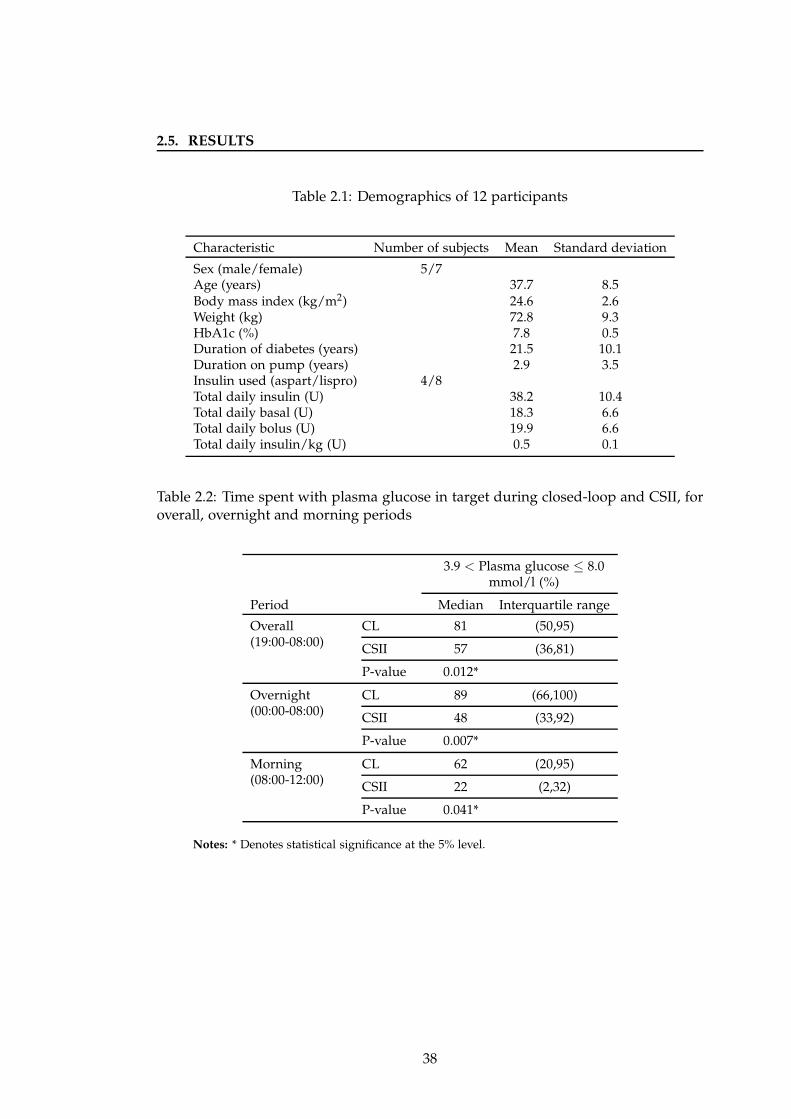
2.5. RESULTS
Table 2.1: Demographics of 12 participants
Characteristic Number of subjects Mean Standard deviation
Sex (male/female) 5/7Age (years) 37.7 8.5Body mass index (kg/m2) 24.6 2.6Weight (kg) 72.8 9.3HbA1c (%) 7.8 0.5Duration of diabetes (years) 21.5 10.1Duration on pump (years) 2.9 3.5Insulin used (aspart/lispro) 4/8Total daily insulin (U) 38.2 10.4Total daily basal (U) 18.3 6.6Total daily bolus (U) 19.9 6.6Total daily insulin/kg (U) 0.5 0.1
Table 2.2: Time spent with plasma glucose in target during closed-loop and CSII, foroverall, overnight and morning periods
3.9 < Plasma glucose ≤ 8.0mmol/l (%)
Period Median Interquartile range
Overall(19:00-08:00)
CL 81 (50,95)
CSII 57 (36,81)
P-value 0.012*
Overnight(00:00-08:00)
CL 89 (66,100)
CSII 48 (33,92)
P-value 0.007*
Morning(08:00-12:00)
CL 62 (20,95)
CSII 22 (2,32)
P-value 0.041*
Notes: * Denotes statistical significance at the 5% level.
38
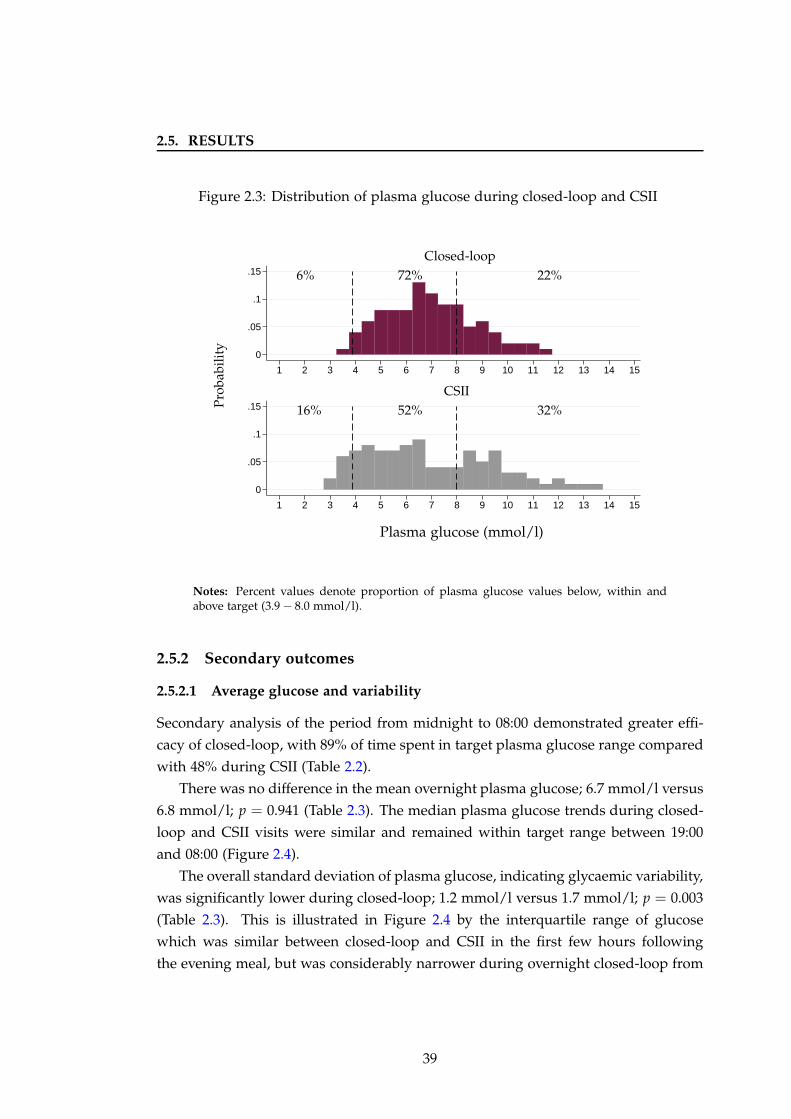
2.5. RESULTS
Figure 2.3: Distribution of plasma glucose during closed-loop and CSII
0
.05
.1
.15
0
.05
.1
.15
1 2 3 4 5 6 7 8 9 10 11 12 13 14 15
1 2 3 4 5 6 7 8 9 10 11 12 13 14 15
Plasma glucose (mmol/l)
CSII
Closed-loop
16% 52% 32%
6% 72% 22%
Pro
babi
lity
Notes: Percent values denote proportion of plasma glucose values below, within andabove target (3.9 − 8.0 mmol/l).
2.5.2 Secondary outcomes
2.5.2.1 Average glucose and variability
Secondary analysis of the period from midnight to 08:00 demonstrated greater effi-
cacy of closed-loop, with 89% of time spent in target plasma glucose range compared
with 48% during CSII (Table 2.2).
There was no difference in the mean overnight plasma glucose; 6.7 mmol/l versus
6.8 mmol/l; p = 0.941 (Table 2.3). The median plasma glucose trends during closed-
loop and CSII visits were similar and remained within target range between 19:00
and 08:00 (Figure 2.4).
The overall standard deviation of plasma glucose, indicating glycaemic variability,
was significantly lower during closed-loop; 1.2 mmol/l versus 1.7 mmol/l; p = 0.003
(Table 2.3). This is illustrated in Figure 2.4 by the interquartile range of glucose
which was similar between closed-loop and CSII in the first few hours following
the evening meal, but was considerably narrower during overnight closed-loop from
39
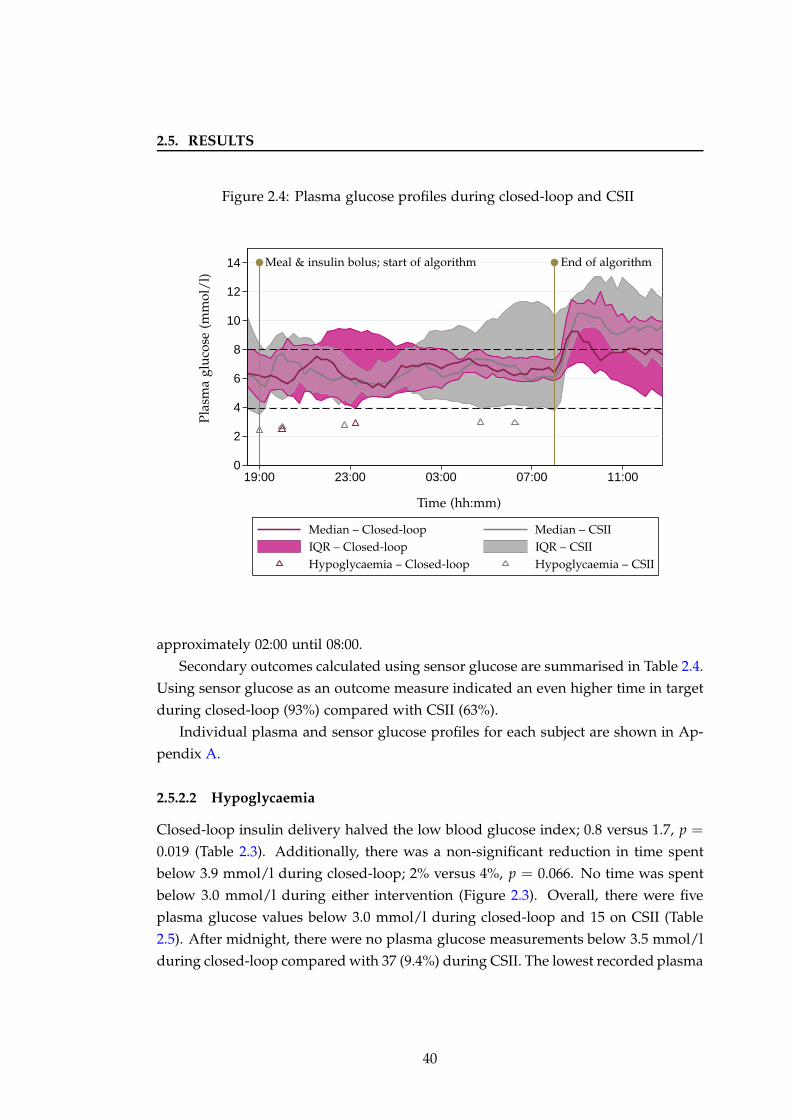
2.5. RESULTS
Figure 2.4: Plasma glucose profiles during closed-loop and CSII
0
2
4
6
8
10
12
14
19:00 23:00 03:00 07:00 11:00
Pla
sma
glu
cose
(mm
ol/
l)
Time (hh:mm)
Meal & insulin bolus; start of algorithm End of algorithm
Median – Closed-loop Median – CSII
IQR – Closed-loop IQR – CSII
Hypoglycaemia – CSIIHypoglycaemia – Closed-loop
approximately 02:00 until 08:00.
Secondary outcomes calculated using sensor glucose are summarised in Table 2.4.
Using sensor glucose as an outcome measure indicated an even higher time in target
during closed-loop (93%) compared with CSII (63%).
Individual plasma and sensor glucose profiles for each subject are shown in Ap-
pendix A.
2.5.2.2 Hypoglycaemia
Closed-loop insulin delivery halved the low blood glucose index; 0.8 versus 1.7, p =
0.019 (Table 2.3). Additionally, there was a non-significant reduction in time spent
below 3.9 mmol/l during closed-loop; 2% versus 4%, p = 0.066. No time was spent
below 3.0 mmol/l during either intervention (Figure 2.3). Overall, there were five
plasma glucose values below 3.0 mmol/l during closed-loop and 15 on CSII (Table
2.5). After midnight, there were no plasma glucose measurements below 3.5 mmol/l
during closed-loop compared with 37 (9.4%) during CSII. The lowest recorded plasma
40

2.5
.R
ES
UL
TS
Table 2.3: Plasma glucose outcomes during closed-loop and CSII, for overall, overnight and morning periods
Overall (19:00-08:00) Overnight (00:00-08:00) Morning (08:00-12:00)
CL CSII P-value CL CSII P-value CL CSII P-value
Plasma glucose at 6.6 ± 1.9 6.9 ± 3.4 0.776 — — — — — —start of CL (mmol/l)
Mean plasma 6.7 ± 1.4 6.6 ± 1.3 0.889 6.7 ± 1.3 6.8 ± 2.2 0.941 8.2 ± 2.2 9.3 ± 2.0 0.244glucose (mmol/l)
Standard deviation of 1.2 1.7 0.003* 0.9 1.0 0.480 1.3 1.5 0.050*plasma glucose (mmol/l) (1.0,1.4) (1.4,2.5) (0.6,1.2) (0.5,1.9) (0.6,2.1) (1.1,2.3)
3.9 < Plasma glucose ≤ 8.0 81 57 0.012* 89 48 0.007* 62 22 0.041*mmol/l (%) (50,95) (36,81) (66,100) (33,92) (20,95) (1.7,32)
Plasma glucose 0 0 0.225 0 0 0.285 0 0 0.317< 3.0 mmol/l (%) (0,0) (0,7) (0,0) (0,0) (0,0) (0,0)
Plasma glucose 2 4 0.066 0 0 0.225 0 0 0.600≤ 3.9 mmol/l (%) (0,8) (0,27) (0,2) (0,25) (0,0) (0,12)
Plasma glucose 10 24 0.117 2 22 0.018* 34 75 0.110> 8.0 mmol/l (%) (1,48) (14,46) (0,30) (0,67) (0,80) (53,98)
Low blood 0.8 1.7 0.019* 0.1 0.5 0.092 0.0 0.0 0.674glucose index (0.0,1.9) (0.4,4.9) (0.0,1.2) (0.1,5.4) (0.0,0.5) (0.0,1.6)
High blood 1.0 1.4 0.306 0.8 1.1 0.091 1.6 7.4 0.050*glucose index (0.3,3.0) (0.9,4.4) (0.2,1.9) (0,5.1) (0.5,7.7) (3.4,12.0)
Notes: Data are mean ± standard deviation or median (interquartile range). * Denotes statistical significance at the 5% level.
41
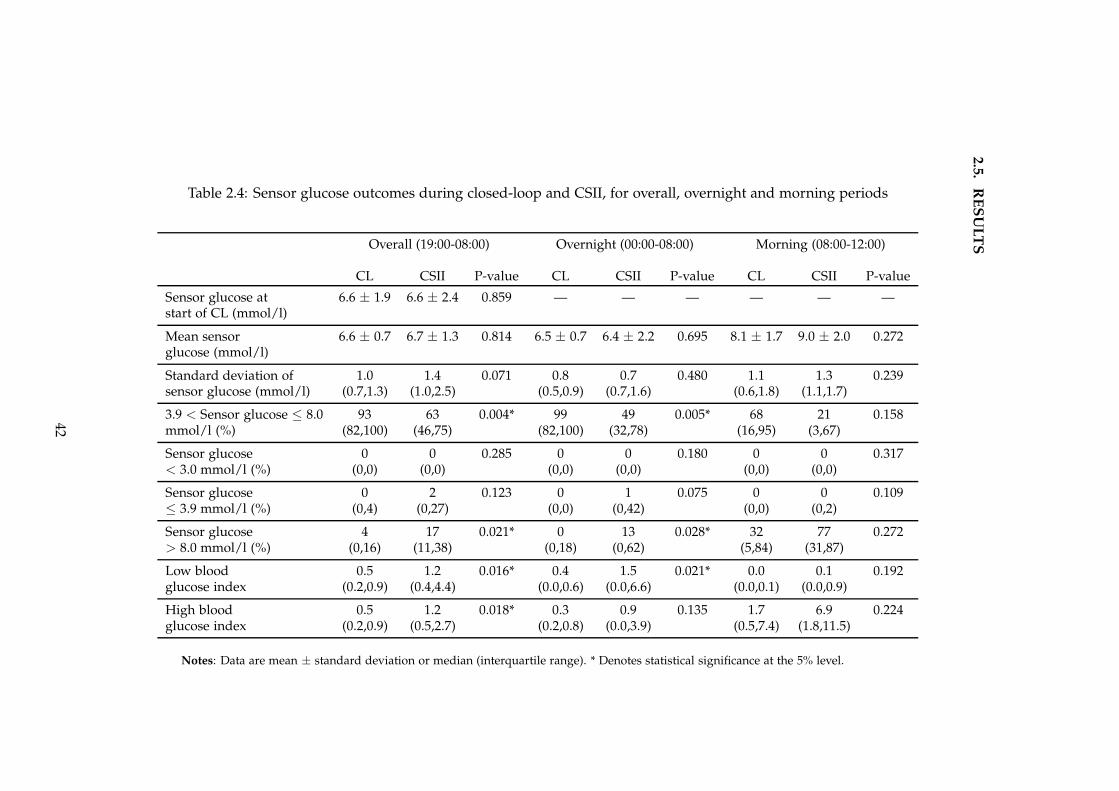
2.5
.R
ES
UL
TS
Table 2.4: Sensor glucose outcomes during closed-loop and CSII, for overall, overnight and morning periods
Overall (19:00-08:00) Overnight (00:00-08:00) Morning (08:00-12:00)
CL CSII P-value CL CSII P-value CL CSII P-value
Sensor glucose at 6.6 ± 1.9 6.6 ± 2.4 0.859 — — — — — —start of CL (mmol/l)
Mean sensor 6.6 ± 0.7 6.7 ± 1.3 0.814 6.5 ± 0.7 6.4 ± 2.2 0.695 8.1 ± 1.7 9.0 ± 2.0 0.272glucose (mmol/l)
Standard deviation of 1.0 1.4 0.071 0.8 0.7 0.480 1.1 1.3 0.239sensor glucose (mmol/l) (0.7,1.3) (1.0,2.5) (0.5,0.9) (0.7,1.6) (0.6,1.8) (1.1,1.7)
3.9 < Sensor glucose ≤ 8.0 93 63 0.004* 99 49 0.005* 68 21 0.158mmol/l (%) (82,100) (46,75) (82,100) (32,78) (16,95) (3,67)
Sensor glucose 0 0 0.285 0 0 0.180 0 0 0.317< 3.0 mmol/l (%) (0,0) (0,0) (0,0) (0,0) (0,0) (0,0)
Sensor glucose 0 2 0.123 0 1 0.075 0 0 0.109≤ 3.9 mmol/l (%) (0,4) (0,27) (0,0) (0,42) (0,0) (0,2)
Sensor glucose 4 17 0.021* 0 13 0.028* 32 77 0.272> 8.0 mmol/l (%) (0,16) (11,38) (0,18) (0,62) (5,84) (31,87)
Low blood 0.5 1.2 0.016* 0.4 1.5 0.021* 0.0 0.1 0.192glucose index (0.2,0.9) (0.4,4.4) (0.0,0.6) (0.0,6.6) (0.0,0.1) (0.0,0.9)
High blood 0.5 1.2 0.018* 0.3 0.9 0.135 1.7 6.9 0.224glucose index (0.2,0.9) (0.5,2.7) (0.2,0.8) (0.0,3.9) (0.5,7.4) (1.8,11.5)
Notes: Data are mean ± standard deviation or median (interquartile range). * Denotes statistical significance at the 5% level.
42
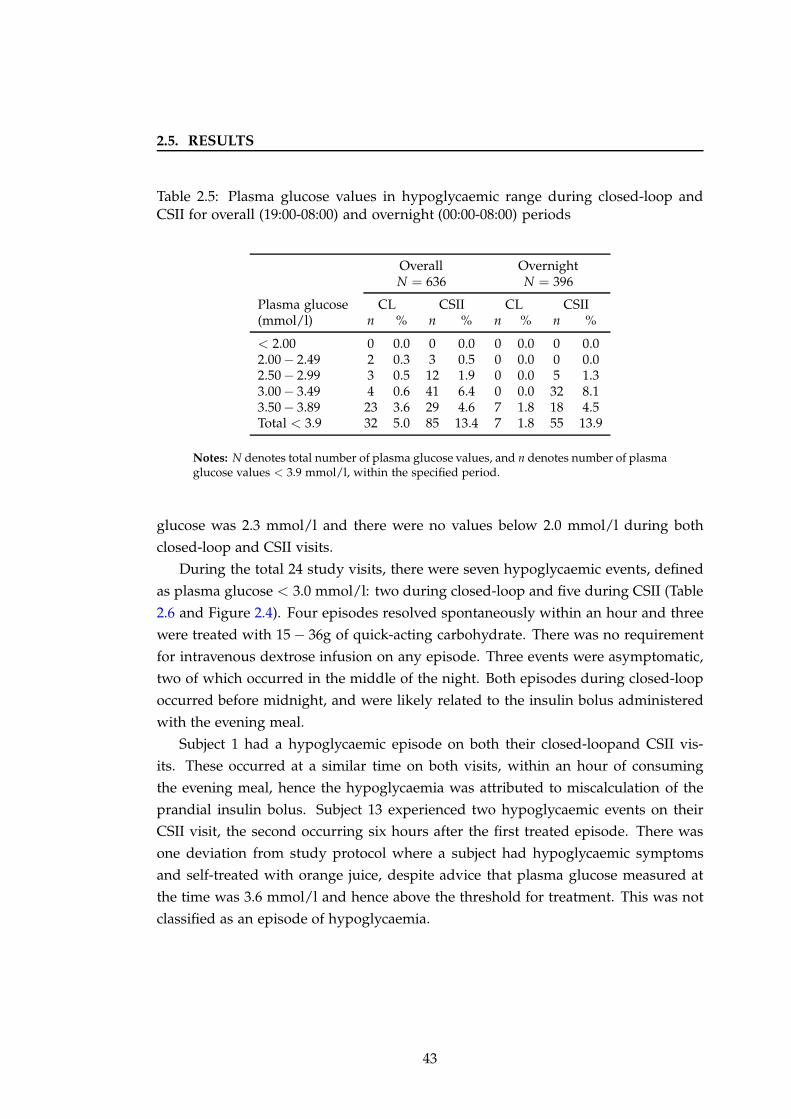
2.5. RESULTS
Table 2.5: Plasma glucose values in hypoglycaemic range during closed-loop andCSII for overall (19:00-08:00) and overnight (00:00-08:00) periods
Overall OvernightN = 636 N = 396
Plasma glucose CL CSII CL CSII(mmol/l) n % n % n % n %
< 2.00 0 0.0 0 0.0 0 0.0 0 0.02.00− 2.49 2 0.3 3 0.5 0 0.0 0 0.02.50− 2.99 3 0.5 12 1.9 0 0.0 5 1.33.00− 3.49 4 0.6 41 6.4 0 0.0 32 8.13.50− 3.89 23 3.6 29 4.6 7 1.8 18 4.5Total < 3.9 32 5.0 85 13.4 7 1.8 55 13.9
Notes: N denotes total number of plasma glucose values, and n denotes number of plasmaglucose values < 3.9 mmol/l, within the specified period.
glucose was 2.3 mmol/l and there were no values below 2.0 mmol/l during both
closed-loop and CSII visits.
During the total 24 study visits, there were seven hypoglycaemic events, defined
as plasma glucose < 3.0 mmol/l: two during closed-loop and five during CSII (Table
2.6 and Figure 2.4). Four episodes resolved spontaneously within an hour and three
were treated with 15 − 36g of quick-acting carbohydrate. There was no requirement
for intravenous dextrose infusion on any episode. Three events were asymptomatic,
two of which occurred in the middle of the night. Both episodes during closed-loop
occurred before midnight, and were likely related to the insulin bolus administered
with the evening meal.
Subject 1 had a hypoglycaemic episode on both their closed-loopand CSII vis-
its. These occurred at a similar time on both visits, within an hour of consuming
the evening meal, hence the hypoglycaemia was attributed to miscalculation of the
prandial insulin bolus. Subject 13 experienced two hypoglycaemic events on their
CSII visit, the second occurring six hours after the first treated episode. There was
one deviation from study protocol where a subject had hypoglycaemic symptoms
and self-treated with orange juice, despite advice that plasma glucose measured at
the time was 3.6 mmol/l and hence above the threshold for treatment. This was not
classified as an episode of hypoglycaemia.
43
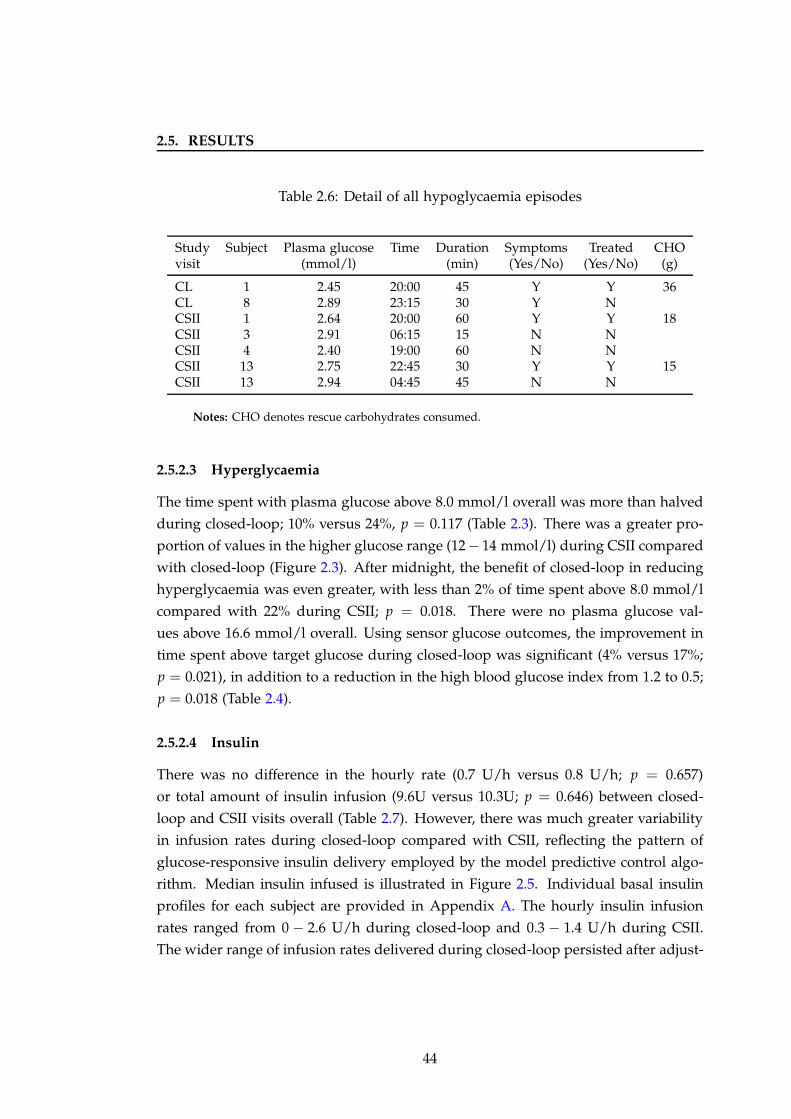
2.5. RESULTS
Table 2.6: Detail of all hypoglycaemia episodes
Study Subject Plasma glucose Time Duration Symptoms Treated CHOvisit (mmol/l) (min) (Yes/No) (Yes/No) (g)
CL 1 2.45 20:00 45 Y Y 36CL 8 2.89 23:15 30 Y NCSII 1 2.64 20:00 60 Y Y 18CSII 3 2.91 06:15 15 N NCSII 4 2.40 19:00 60 N NCSII 13 2.75 22:45 30 Y Y 15CSII 13 2.94 04:45 45 N N
Notes: CHO denotes rescue carbohydrates consumed.
2.5.2.3 Hyperglycaemia
The time spent with plasma glucose above 8.0 mmol/l overall was more than halved
during closed-loop; 10% versus 24%, p = 0.117 (Table 2.3). There was a greater pro-
portion of values in the higher glucose range (12− 14 mmol/l) during CSII compared
with closed-loop (Figure 2.3). After midnight, the benefit of closed-loop in reducing
hyperglycaemia was even greater, with less than 2% of time spent above 8.0 mmol/l
compared with 22% during CSII; p = 0.018. There were no plasma glucose val-
ues above 16.6 mmol/l overall. Using sensor glucose outcomes, the improvement in
time spent above target glucose during closed-loop was significant (4% versus 17%;
p = 0.021), in addition to a reduction in the high blood glucose index from 1.2 to 0.5;
p = 0.018 (Table 2.4).
2.5.2.4 Insulin
There was no difference in the hourly rate (0.7 U/h versus 0.8 U/h; p = 0.657)
or total amount of insulin infusion (9.6U versus 10.3U; p = 0.646) between closed-
loop and CSII visits overall (Table 2.7). However, there was much greater variability
in infusion rates during closed-loop compared with CSII, reflecting the pattern of
glucose-responsive insulin delivery employed by the model predictive control algo-
rithm. Median insulin infused is illustrated in Figure 2.5. Individual basal insulin
profiles for each subject are provided in Appendix A. The hourly insulin infusion
rates ranged from 0 − 2.6 U/h during closed-loop and 0.3 − 1.4 U/h during CSII.
The wider range of infusion rates delivered during closed-loop persisted after adjust-
44
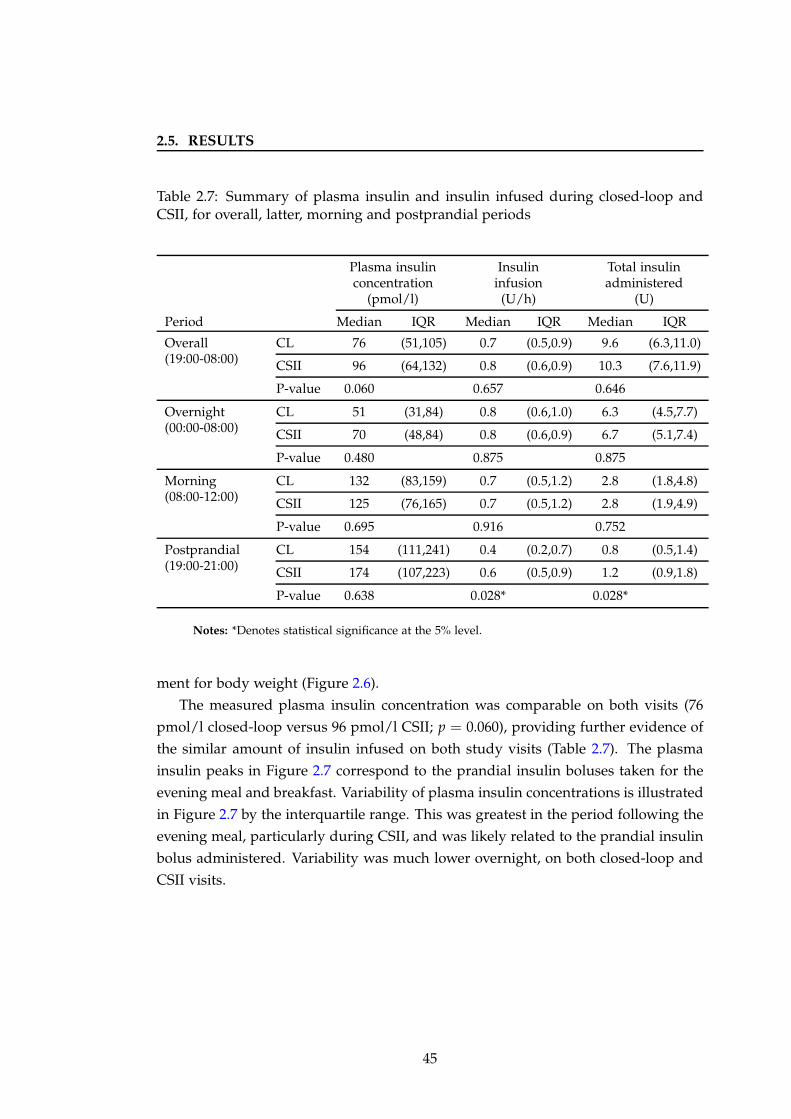
2.5. RESULTS
Table 2.7: Summary of plasma insulin and insulin infused during closed-loop andCSII, for overall, latter, morning and postprandial periods
Plasma insulin Insulin Total insulinconcentration infusion administered
(pmol/l) (U/h) (U)
Period Median IQR Median IQR Median IQR
Overall(19:00-08:00)
CL 76 (51,105) 0.7 (0.5,0.9) 9.6 (6.3,11.0)
CSII 96 (64,132) 0.8 (0.6,0.9) 10.3 (7.6,11.9)
P-value 0.060 0.657 0.646
Overnight(00:00-08:00)
CL 51 (31,84) 0.8 (0.6,1.0) 6.3 (4.5,7.7)
CSII 70 (48,84) 0.8 (0.6,0.9) 6.7 (5.1,7.4)
P-value 0.480 0.875 0.875
Morning(08:00-12:00)
CL 132 (83,159) 0.7 (0.5,1.2) 2.8 (1.8,4.8)
CSII 125 (76,165) 0.7 (0.5,1.2) 2.8 (1.9,4.9)
P-value 0.695 0.916 0.752
Postprandial(19:00-21:00)
CL 154 (111,241) 0.4 (0.2,0.7) 0.8 (0.5,1.4)
CSII 174 (107,223) 0.6 (0.5,0.9) 1.2 (0.9,1.8)
P-value 0.638 0.028* 0.028*
Notes: *Denotes statistical significance at the 5% level.
ment for body weight (Figure 2.6).
The measured plasma insulin concentration was comparable on both visits (76
pmol/l closed-loop versus 96 pmol/l CSII; p = 0.060), providing further evidence of
the similar amount of insulin infused on both study visits (Table 2.7). The plasma
insulin peaks in Figure 2.7 correspond to the prandial insulin boluses taken for the
evening meal and breakfast. Variability of plasma insulin concentrations is illustrated
in Figure 2.7 by the interquartile range. This was greatest in the period following the
evening meal, particularly during CSII, and was likely related to the prandial insulin
bolus administered. Variability was much lower overnight, on both closed-loop and
CSII visits.
45
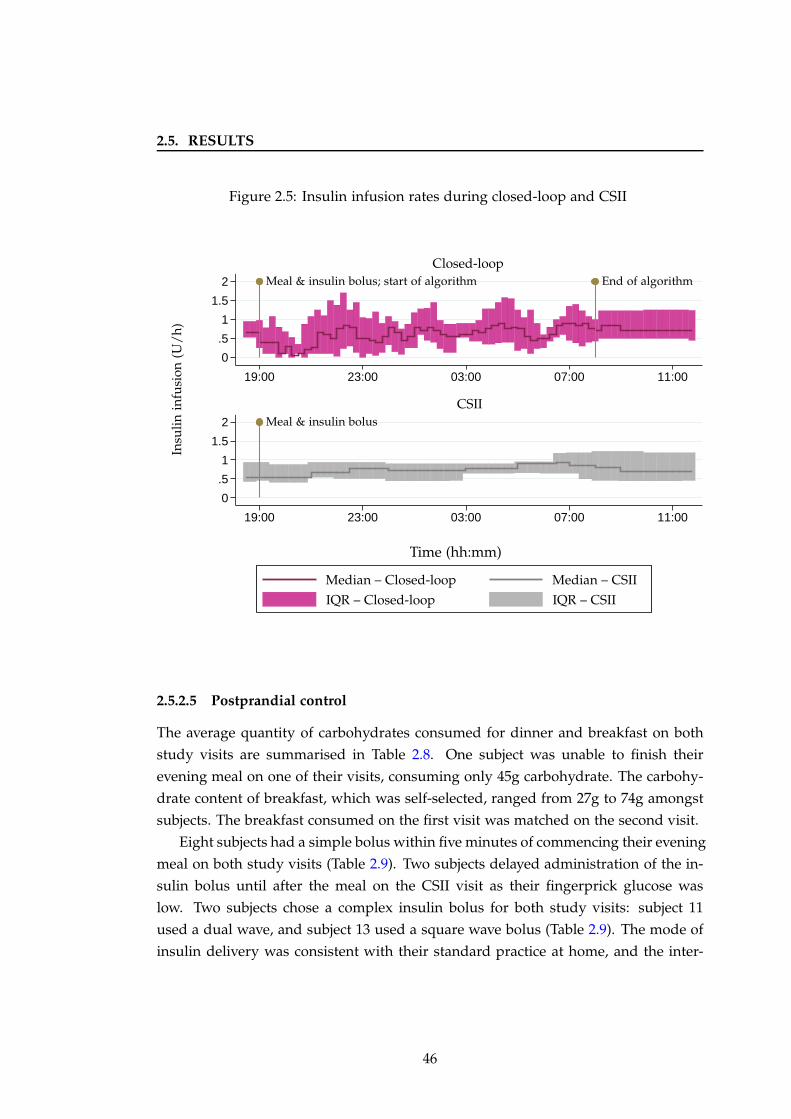
2.5. RESULTS
Figure 2.5: Insulin infusion rates during closed-loop and CSII
0
.5
1
1.5
2
0
.5
1
1.5
2
19:00 23:00 03:00 07:00 11:00
19:00 23:00 03:00 07:00 11:00
CSII
Closed-loop
Insu
lin
infu
sion
(U/
h)
Time (hh:mm)
Meal & insulin bolus; start of algorithm
Meal & insulin bolus
End of algorithm
Median – Closed-loop Median – CSII
IQR – Closed-loop IQR – CSII
2.5.2.5 Postprandial control
The average quantity of carbohydrates consumed for dinner and breakfast on both
study visits are summarised in Table 2.8. One subject was unable to finish their
evening meal on one of their visits, consuming only 45g carbohydrate. The carbohy-
drate content of breakfast, which was self-selected, ranged from 27g to 74g amongst
subjects. The breakfast consumed on the first visit was matched on the second visit.
Eight subjects had a simple bolus within five minutes of commencing their evening
meal on both study visits (Table 2.9). Two subjects delayed administration of the in-
sulin bolus until after the meal on the CSII visit as their fingerprick glucose was
low. Two subjects chose a complex insulin bolus for both study visits: subject 11
used a dual wave, and subject 13 used a square wave bolus (Table 2.9). The mode of
insulin delivery was consistent with their standard practice at home, and the inter-
46
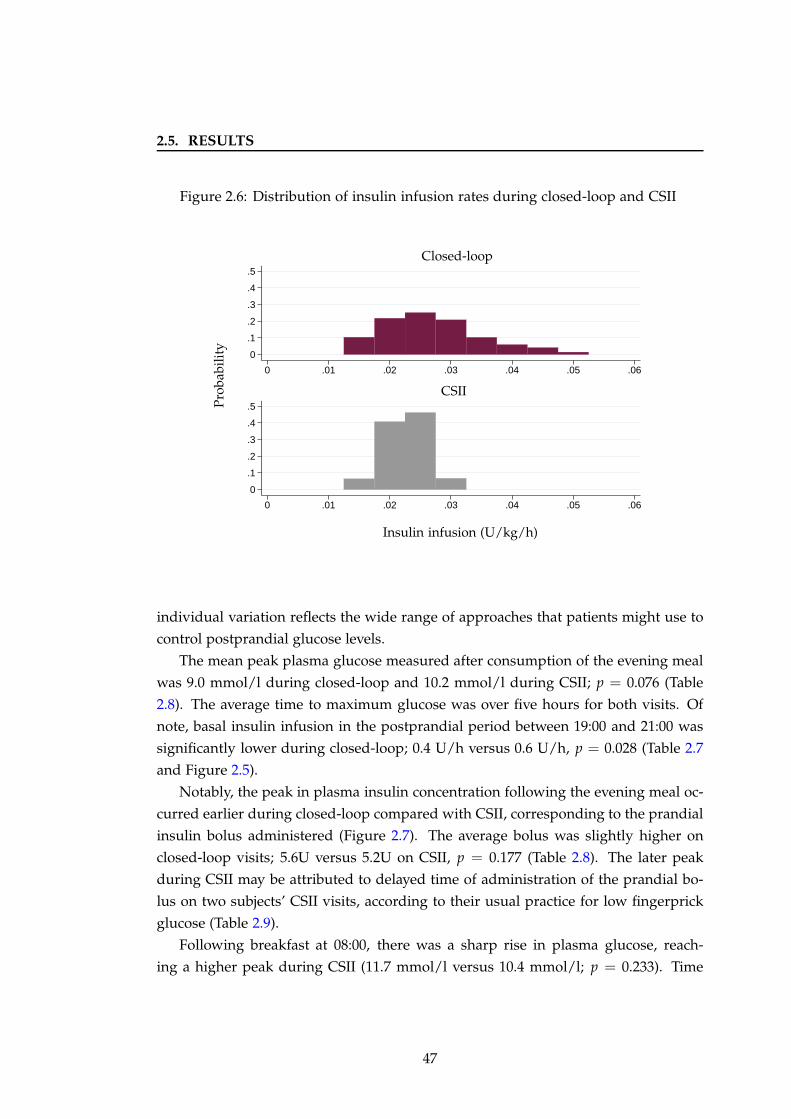
2.5. RESULTS
Figure 2.6: Distribution of insulin infusion rates during closed-loop and CSII
0
.1
.2
.3
.4
.5
0
.1
.2
.3
.4
.5
0 .01 .02 .03 .04 .05 .06
0 .01 .02 .03 .04 .05 .06
CSII
Closed-loop
Pro
babi
lity
Insulin infusion (U/kg/h)
individual variation reflects the wide range of approaches that patients might use to
control postprandial glucose levels.
The mean peak plasma glucose measured after consumption of the evening meal
was 9.0 mmol/l during closed-loop and 10.2 mmol/l during CSII; p = 0.076 (Table
2.8). The average time to maximum glucose was over five hours for both visits. Of
note, basal insulin infusion in the postprandial period between 19:00 and 21:00 was
significantly lower during closed-loop; 0.4 U/h versus 0.6 U/h, p = 0.028 (Table 2.7
and Figure 2.5).
Notably, the peak in plasma insulin concentration following the evening meal oc-
curred earlier during closed-loop compared with CSII, corresponding to the prandial
insulin bolus administered (Figure 2.7). The average bolus was slightly higher on
closed-loop visits; 5.6U versus 5.2U on CSII, p = 0.177 (Table 2.8). The later peak
during CSII may be attributed to delayed time of administration of the prandial bo-
lus on two subjects’ CSII visits, according to their usual practice for low fingerprick
glucose (Table 2.9).
Following breakfast at 08:00, there was a sharp rise in plasma glucose, reach-
ing a higher peak during CSII (11.7 mmol/l versus 10.4 mmol/l; p = 0.233). Time
47
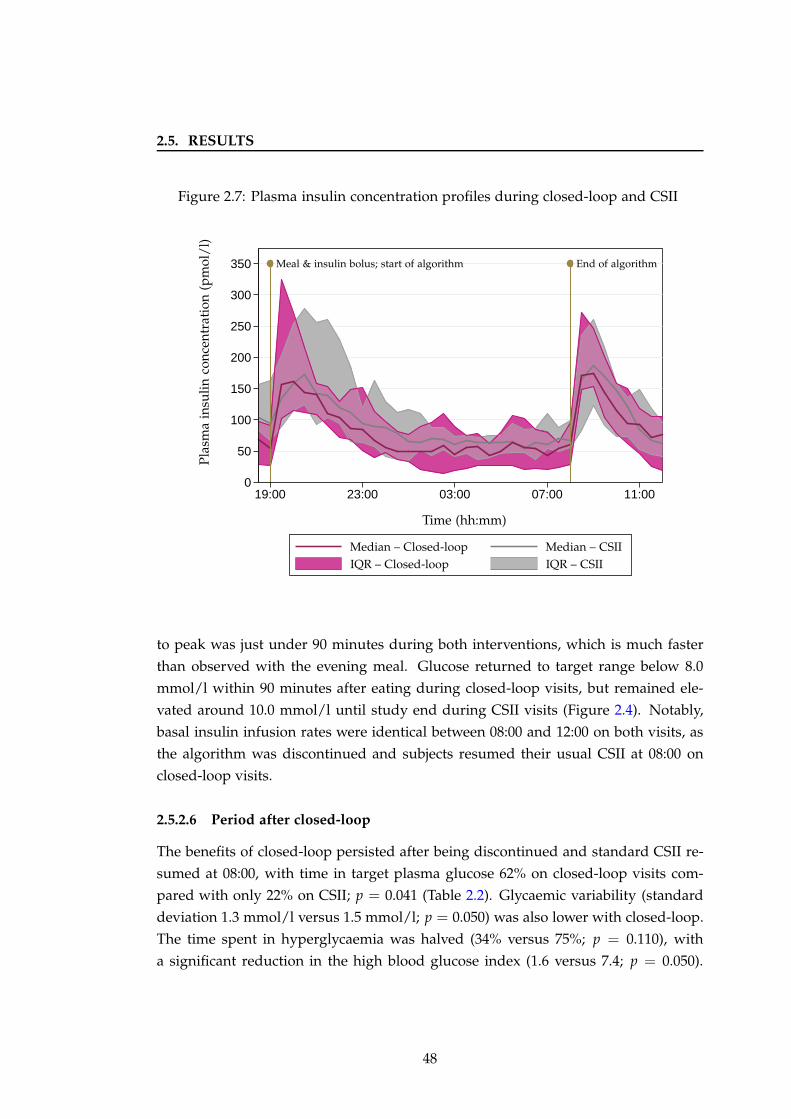
2.5. RESULTS
Figure 2.7: Plasma insulin concentration profiles during closed-loop and CSII
0
50
100
150
200
250
300
350
19:00 23:00 03:00 07:00 11:00
Pla
sma
insu
lin
con
cen
trat
ion
(pm
ol/
l)
Time (hh:mm)
Meal & insulin bolus; start of algorithm End of algorithm
Median – Closed-loop Median – CSII
IQR – Closed-loop IQR – CSII
to peak was just under 90 minutes during both interventions, which is much faster
than observed with the evening meal. Glucose returned to target range below 8.0
mmol/l within 90 minutes after eating during closed-loop visits, but remained ele-
vated around 10.0 mmol/l until study end during CSII visits (Figure 2.4). Notably,
basal insulin infusion rates were identical between 08:00 and 12:00 on both visits, as
the algorithm was discontinued and subjects resumed their usual CSII at 08:00 on
closed-loop visits.
2.5.2.6 Period after closed-loop
The benefits of closed-loop persisted after being discontinued and standard CSII re-
sumed at 08:00, with time in target plasma glucose 62% on closed-loop visits com-
pared with only 22% on CSII; p = 0.041 (Table 2.2). Glycaemic variability (standard
deviation 1.3 mmol/l versus 1.5 mmol/l; p = 0.050) was also lower with closed-loop.
The time spent in hyperglycaemia was halved (34% versus 75%; p = 0.110), with
a significant reduction in the high blood glucose index (1.6 versus 7.4; p = 0.050).
48
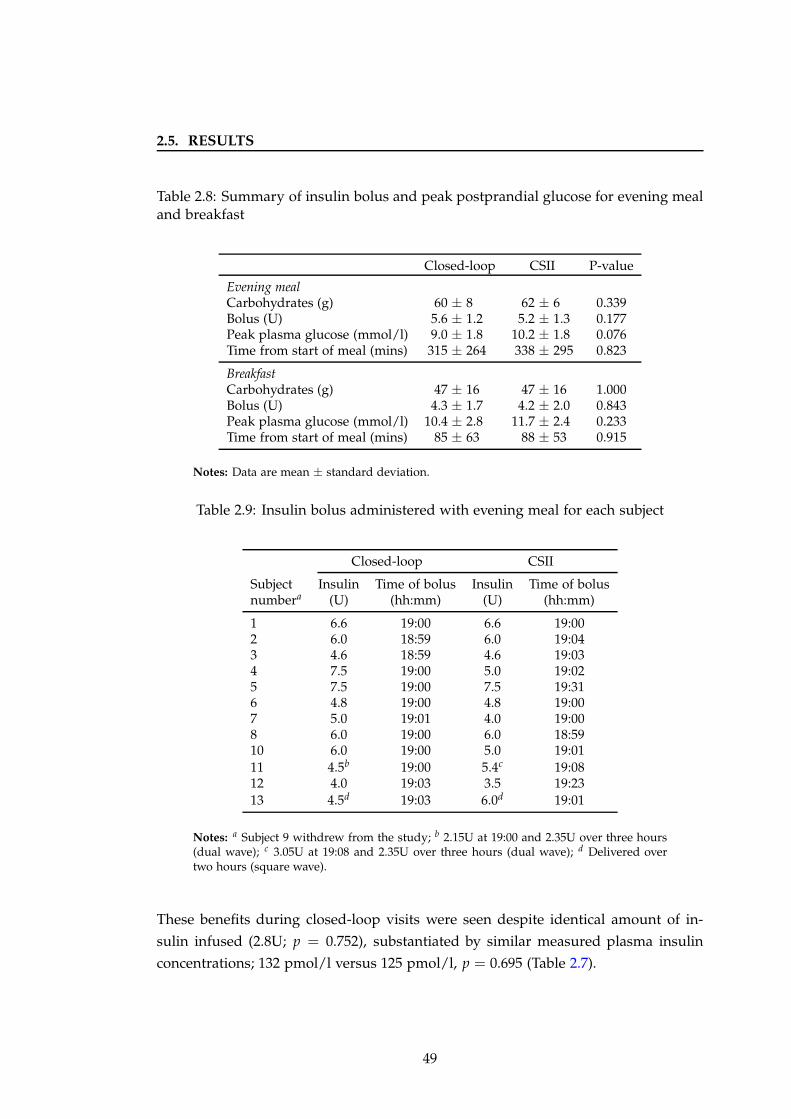
2.5. RESULTS
Table 2.8: Summary of insulin bolus and peak postprandial glucose for evening mealand breakfast
Closed-loop CSII P-value
Evening mealCarbohydrates (g) 60 ± 8 62 ± 6 0.339Bolus (U) 5.6 ± 1.2 5.2 ± 1.3 0.177Peak plasma glucose (mmol/l) 9.0 ± 1.8 10.2 ± 1.8 0.076Time from start of meal (mins) 315 ± 264 338 ± 295 0.823
BreakfastCarbohydrates (g) 47 ± 16 47 ± 16 1.000Bolus (U) 4.3 ± 1.7 4.2 ± 2.0 0.843Peak plasma glucose (mmol/l) 10.4 ± 2.8 11.7 ± 2.4 0.233Time from start of meal (mins) 85 ± 63 88 ± 53 0.915
Notes: Data are mean ± standard deviation.
Table 2.9: Insulin bolus administered with evening meal for each subject
Closed-loop CSII
Subject Insulin Time of bolus Insulin Time of bolusnumbera (U) (hh:mm) (U) (hh:mm)
1 6.6 19:00 6.6 19:002 6.0 18:59 6.0 19:043 4.6 18:59 4.6 19:034 7.5 19:00 5.0 19:025 7.5 19:00 7.5 19:316 4.8 19:00 4.8 19:007 5.0 19:01 4.0 19:008 6.0 19:00 6.0 18:5910 6.0 19:00 5.0 19:0111 4.5b 19:00 5.4c 19:0812 4.0 19:03 3.5 19:2313 4.5d 19:03 6.0d 19:01
Notes: a Subject 9 withdrew from the study; b 2.15U at 19:00 and 2.35U over three hours(dual wave); c 3.05U at 19:08 and 2.35U over three hours (dual wave); d Delivered overtwo hours (square wave).
These benefits during closed-loop visits were seen despite identical amount of in-
sulin infused (2.8U; p = 0.752), substantiated by similar measured plasma insulin
concentrations; 132 pmol/l versus 125 pmol/l, p = 0.695 (Table 2.7).
49
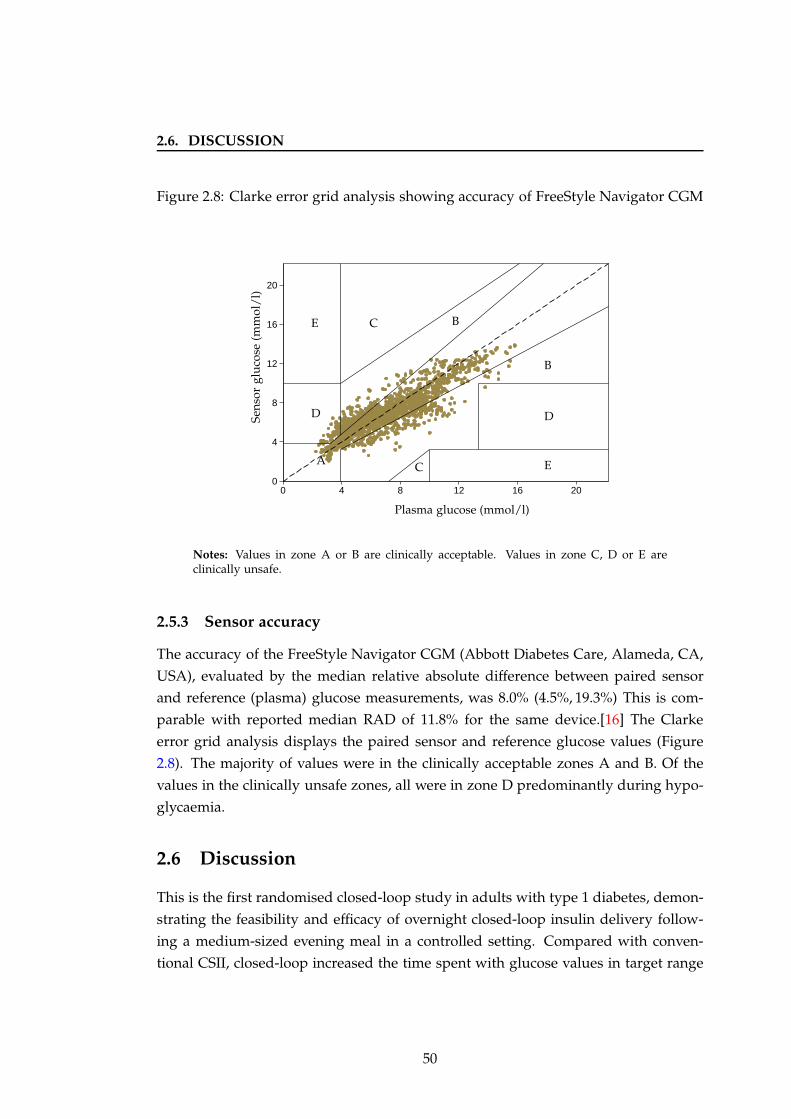
2.6. DISCUSSION
Figure 2.8: Clarke error grid analysis showing accuracy of FreeStyle Navigator CGM
0
4
8
12
16
20
0 4 8 12 16 20
Sens
orgl
uco
se(m
mol
/l)
Plasma glucose (mmol/l)
A
B
B
C
C
DD
E
E
Notes: Values in zone A or B are clinically acceptable. Values in zone C, D or E areclinically unsafe.
2.5.3 Sensor accuracy
The accuracy of the FreeStyle Navigator CGM (Abbott Diabetes Care, Alameda, CA,
USA), evaluated by the median relative absolute difference between paired sensor
and reference (plasma) glucose measurements, was 8.0% (4.5%, 19.3%) This is com-
parable with reported median RAD of 11.8% for the same device.[16] The Clarke
error grid analysis displays the paired sensor and reference glucose values (Figure
2.8). The majority of values were in the clinically acceptable zones A and B. Of the
values in the clinically unsafe zones, all were in zone D predominantly during hypo-
glycaemia.
2.6 Discussion
This is the first randomised closed-loop study in adults with type 1 diabetes, demon-
strating the feasibility and efficacy of overnight closed-loop insulin delivery follow-
ing a medium-sized evening meal in a controlled setting. Compared with conven-
tional CSII, closed-loop increased the time spent with glucose values in target range
50
2.6. DISCUSSION
(3.9 − 8.0 mmol/l) by 24%. Glucose variability, which is associated with an increased
risk of complications of diabetes was also reduced.[48]
This study confirmed the safety of overnight closed-loop as indicated by the re-
duced low blood glucose index and a trend towards lesser time spent below 3.9
mmol/l. There were two episodes of hypoglycaemia during closed-loop, compared
with five during CSII. Both occurred before midnight and were likely related to the
prandial insulin bolus administered with the evening meal. There were no plasma
glucose values below 3.5 mmol/l after midnight during closed-loop. One of the fea-
tures of the model predictive control algorithm used is its ability to suspend insulin
delivery when sensor glucose levels are below 4.4 mmol/l or rapidly declining. As
fear of hypoglycaemia is reported as the major barrier to achieving optimal glycaemic
control, and the incidence of severe hypoglycaemia is higher during the overnight
period,[119] these results suggest a benefit of closed-loop in lowering the risk of oth-
erwise unrecognised and potentially severe nocturnal hypoglycaemia.
After midnight, the improvements in glucose control during closed-loop were
even greater, when time in target glucose increased by 41% and time spent above
8.0 mmol/l decreased by 20%. The model predictive control algorithm is an adaptive
system whereby current glucose measurements are used to update model parameters
such as insulin sensitivity, based on previous insulin infusion rates and carbohydrate
intake, resulting in real-time optimisation.[81] As a result, the effectiveness of closed-
loop increases with longer duration of use. Optimal glucose control prior to midnight
was influenced by the rise in glucose following the evening meal in addition to the
prandial insulin bolus administered which was calculated manually.
Significantly, the benefits of closed-loop persisted even after it was discontinued
at 08:00. This is similar to the time that patients using overnight closed-loop in the
home setting may disconnect from closed-loop on waking, and switch to ‘open loop’
CSII during the daytime. Between 08:00 and 12:00, time in target glucose during
closed-loop visits increased from 22% to 62%, and the time spent in hyperglycaemia
was halved. Remarkably, these improvements were seen even with identical insulin
infused (subjects’ usual CSII regimen) on both visits, and administration of an insulin
bolus calculated using subjects’ usual bolus calculators for breakfast at 08:00.
Use of closed-loop insulin delivery overnight is a likely intermediate step, prior
to fully closed-loop glucose control over 24 hours. Therefore it is encouraging that
the improvements overnight were sustained after discontinuation, especially as main-
taining glycaemic control during the morning period can be challenging with over
50% of patients with type 1 diabetes experiencing higher glucose levels.[142] In my
51
2.6. DISCUSSION
study, during conventional CSII visits subjects spent 75% of time in hyperglycaemia
after breakfast. This is known as the dawn phenomenon, and may be associated with
growth hormone-induced impairment in insulin sensitivity in liver and muscle.
During CSII visits, only 57% of time overnight was spent in normoglycaemia. In
other words, nearly half the time was spent outside target glucose range, predomi-
nantly in hyperglycaemia. This is an important observation as hyperglycaemia is as-
sociated with increased risk of diabetes-related morbidity.[49] Although median time
spent below 3.9 mmol/l was only 4%, there were five episodes of hypoglycaemia,
in other words almost one episode every two nights. Notably, subjects did not un-
dertake any exercise following the evening meal and were in fact more sedentary in
the clinical research facility compared with being at home. One subject experienced
two hypoglycaemic events on their CSII visit, one episode occurred whilst awake in
the late evening and the second six hours later whilst asleep. Prior hypoglycaemia
is known to potentiate the risk of subsequent episodes.[130] No symptoms of hypo-
glycaemia were experienced for three of the events, two of which occurred overnight
at 04:45 and 06:15. This suggests that the incidence of nocturnal hypoglycaemia may
be even higher than that reported by patients at home. These observations indicate
that even with use of optimised insulin pump regimens in highly motivated patients,
current conventional therapies are unable to achieve ideal glycaemic targets.
Importantly, the improvements in overnight glycaemic control with closed-loop
were achieved without any requirement for additional insulin infusion. Distinct from
conventional CSII, the variable insulin infusion characteristic of closed-loop suggests
that the pattern and timing rather than total amount of insulin may be more relevant
to optimising insulin delivery (Figure 2.5).
One example of the glucose-responsive insulin delivery characteristic of closed-
loop systems was during the postprandial period. Following the evening meal, a
lower rate of insulin was infused during closed-loop in order to minimise the risk
of delayed postprandial hypoglycaemia associated with miscalculation of prandial
insulin or administration of multiple correction boluses resulting in insulin stacking.
Even with less basal insulin infused and similar prandial insulin boluses adminis-
tered, closed-loop achieved a lower peak postprandial plasma glucose (9.0 mmol/l
versus 10.2 mmol/l).
Interestingly, the average time to achieve peak glucose following the evening meal
was over five hours, in contrast to less than 90 minutes for breakfast. This indicates
the wide variation in absorption of ingested carbohydrate between the two meals,
which may be related to the size and macronutrient composition. These results may
52
2.6. DISCUSSION
be useful to clinicians and patients when determining the amount and type of in-
sulin bolus (e.g. simple versus complex) to be administered for meals. Additionally,
this information may be valuable in the development of closed-loop algorithms for
postprandial glycaemic control.
One of the major strengths of this study was the crossover design where closed-
loop insulin delivery was compared with subjects’ usual CSII, thus eliminating inter-
individual variability in factors such as insulin sensitivity. The randomised order of
visits minimised confounding due to adjustment in insulin regimens between visits.
Notably, closed-loop insulin delivery was evaluated against maximally optimised
CSII which is the best possible insulin replacement currently available to patients
with type 1 diabetes.
Importantly, the algorithm used sensor glucose, rather than plasma glucose, to
generate the advice on insulin infusion rates, and the algorithm advice was always
followed. The study was carried out using commercially available insulin pumps and
glucose sensors. A single study pump was used to ensure comparability of insulin
delivery between visits. Rapid acting insulin analogue aspart was used in all subjects
to enable comparison of plasma insulin measurements. A single sensor was used
calibrated according to manufacturers’ instructions with no additional calibrations,
which is representative of real life. Sensor accuracy measured by the relative differ-
ence between paired sensor and reference glucose values was 8.0%, indicating much
better performance than previously reported.[16]
Although designed as a pilot feasibility study, the small numbers in addition to
the cohort of subjects studied limit applicability of the results to all subjects with type
1 diabetes. Another limitation was the lack of automation of the closed-loop system,
and hence the risk of operator error in entering CGM values and changing the insulin
pump infusion rates manually every 15 minutes.
Consumption of matched meals on both visits with no snacks or caloric drinks
in between the evening meal and breakfast enabled direct comparison of glucose
control. However, this may not be representative of a typical evening at home for
all patients. Other scenarios such as consuming a bedtime snack will likely have a
different effect on glucose excursions. The CSII visit may not have been a true rep-
resentation of glycaemic control in the home setting, even though subjects continued
their usual insulin regimen, as confounding factors including snacks and low inten-
sity physical activity such as housework are likely to have had an effect on glycaemic
control. Subjects were blinded to CGM during CSII visits and were hence unable
to make any changes based on CGM. This is important as the majority of patients
53
2.7. CONCLUSION
currently rely on routine fingerprick glucose testing to manage their diabetes.
2.7 Conclusion
This pilot study confirmed the feasibility of overnight closed-loop insulin delivery
in adults with type 1 diabetes, demonstrating superior glycaemic control, compared
with conventional insulin pump therapy. Specifically, time in target glucose (3.9 − 8.0
mmol/l) and glycaemic variability were improved with a trend towards reduction in
hypoglycaemia. Notably, these benefits were achieved without any additional insulin,
and were sustained after discontinuation of closed-loop on waking in the morning.
54
Chapter 3
Closed-loop insulin delivery after
evening meal and alcohol
3.1 Background
In health, postprandial glycaemic excursions are influenced by the pattern of in-
sulin secretion and its ability to stimulate glucose uptake and suppress endoge-
nous glucose production. In type 1 diabetes, relative insulin deficiency and a
lack of meal-induced suppression of glucagon secretion contribute to postprandial
hyperglycaemia.[143] The magnitude of glucose excursions following carbohydrate
consumption is dependent on various factors including meal size and composition,
as well as timing and amount of insulin administered. The resulting hyperglycae-
mia and accompanying glycaemic variability is associated with an increased risk of
diabetes-related complications.[48; 144]
The American Diabetes Association recommends a target postprandial glucose
below 10.0 mmol/l.[95] Accurate estimation of carbohydrates to be ingested is a cru-
cial component of diabetes management. Various structured education programmes
are available to patients with diabetes, one of which is ‘Dose Adjustment For Normal
Eating’ which has been linked with improved glycaemic control.[145]
Quality, in addition to quantity of carbohydrates consumed, also has an impact
on postprandial glycaemic excursions. Glycaemic index, which expresses the blood
glucose response after eating a standard amount of food relative to the response after
consuming the same amount of carbohydrate as glucose, has been shown to be a
stronger predictor of postprandial glucose and insulin responses compared with car-
bohydrate quantity alone.[146] Consumption of a low glycaemic index meal may be
55
3.1. BACKGROUND
associated with lower glucose levels.[147] A meta-analysis of 14 randomised studies
found a small but significant improvement in HbA1c (0.43%) for diets with a lower
glycaemic index.[148]
Prandial insulin boluses may be estimated using a pump bolus wizard or similar
calculator, which is individualised with patients’ insulin sensitivity and insulin to
carbohydrate ratios, and requires entry of results of fingerprick glucose testing and
grams of carbohydrate to be consumed. Manual calculation using individualised
insulin to carbohydrate ratios may be more difficult and time consuming. For some
patients, the complexity of such tasks may lead to incorrect calculation or empirical
estimation, which can result in mismatch between carbohydrates and insulin and
subsequent increased risk of hyper- or hypoglycaemia. Delivery of the insulin bolus
itself may be overlooked: a study in Swedish adolescents found that over a third
had missed more than 15% of boluses, which was correlated with worse glycaemic
control.[149]
One of the major limitations of subcutaneous insulin delivery is the delay in time
to peak blood glucose lowering effect which may be 90 − 120 minutes with the cur-
rently available rapid acting insulin analogues.[93] These delays result in slower glu-
cose disposal with subsequent postprandial hyperglycaemia. This may prompt inad-
vertent administration of correction boluses and insulin stacking, thus increasing the
risk of delayed hypoglycaemia. Optimising timing of insulin bolus delivery may im-
prove postprandial control. Administration of rapid acting insulin as a simple bolus
15 to 20 minutes prior to eating has been shown to result in lower peak glucose and
greater time in target during conventional pump therapy, compared with delivery at
the beginning or after a meal.[150; 151] There are several novel approaches under de-
velopment targeting improved insulin pharmacokinetics, ranging from modifications
in insulin formulations to enhancement of the mode of delivery. These have been
reviewed in Section 1.4.3.
Alcohol plays a significant role in many social situations. Moderate alcohol con-
sumption in healthy individuals has been shown to be associated with lower post-
prandial glucose levels, improved insulin sensitivity and a 30% lower incidence of
type 2 diabetes.[152; 153] In patients with type 1 diabetes, alcohol in moderation
has been shown to have a beneficial effect on microvascular complications, includ-
ing neuropathy and retinopathy.[154] However, it is also associated with a signifi-
cantly higher risk of delayed or reactive hypoglycaemia.[155] The main mechanism
is inhibition of hepatic glucose production, which usually accounts for a significant
proportion of basal glucose production during hypoglycaemia in type 1 diabetes.
56
3.1. BACKGROUND
Alcohol is metabolised in the liver by oxidation to acetaldehyde and acetate. This
process is dependent on the cofactor nicotinamide adenine dinucleotide, excess con-
sumption of which results in lower levels available for gluconeogenesis. Another
reason for hypoglycaemia may be administration of correction doses of insulin to
counter the initial rise in glucose levels that occurs when drinking alcohol. An im-
mediate and prolonged hypoglycaemic effect of alcohol was observed using CGM
following the ingestion of vodka or placebo in 16 adults with type 1 diabetes during
free-living.[156]
Alcohol can result in impairment of the counter-regulatory response to hypogly-
caemia. Clamp studies performed during hypoglycaemia with concurrent alcohol
consumption in 17 subjects with type 1 diabetes demonstrated an attenuated re-
sponse to growth hormone with no differences in glucagon, adrenaline and cortisol
levels.[157] The release of growth hormone in the counter-regulatory response to hy-
poglycaemia is especially important for patients with type 1 diabetes, as the response
to adrenaline is attenuated and glucagon secretion is absent. An inpatient study in six
young men with type 1 diabetes demonstrated lower fasting and postprandial glu-
cose levels with increased symptomatic hypoglycaemia the morning after an evening
of drinking alcohol.[158] Overnight secretion of growth hormone was also reduced.
In addition to the direct effects on glycaemic control, alcohol can impair judge-
ment which may result in lower self-management of diabetes, such as failing to detect
and treat a hypoglycaemic episode. Furthermore, hypoglycaemic symptoms may be
misinterpreted by others as alcohol intoxication. Alcohol consumption may exagger-
ate the cognitive impairment that occurs with more severe hypoglycaemia. This was
demonstrated during clamp studies in 17 subjects with type 1 diabetes, where con-
sumption of vodka resulted in impaired reaction times and cognitive performance
independent of glucose concentration.[159] Induction of hypoglycaemia in combina-
tion with alcohol led to further deterioration in all aspects of cognitive testing. Slower
reaction times, blunted hand tremor and increased sweating were demonstrated in a
study in healthy subjects and patients with type 1 diabetes, during hypoglycaemia
following moderate alcohol consumption.[160] Notably, only two out of the 15 par-
ticipants were aware of being hypoglycaemic after drinking alcohol compared with
11 after consuming the placebo drink.
There is high inter-individual variability in ethanol pharmacokinetics, influenced
by factors such as age, gender and ethnicity. In addition, intra-individual differences,
including consumption of food and variation in gastrointestinal function, specifically
gastric emptying, intestinal transit time, portal blood flow and hepatic first pass ex-
57
3.2. RATIONALE
traction have variable effects on the metabolic response to alcohol.[161] A study of
ethanol ingestion before or after an evening meal in healthy young males demon-
strated higher intra- and inter-subject variability in the fed state.[162] Other factors
include the strength, type and quantity of ethanol, and length of time spent drinking.
The influence of these multiple factors makes it challenging for people with type 1
diabetes to maintain normal glycaemic levels when drinking alcohol. Consumption
of alcohol without food can result in more severe hypoglycaemia due to alcohol-
induced suppression of gluconeogenesis, which is the main source of glucose in the
fasting state, in addition to depleted liver glycogen stores.[155]
Guidelines for alcohol consumption in patients with diabetes are similar to those
of the general population: the American Diabetes Association recommends a daily
maximum of one drink for women and two for men, while Diabetes UK advises a
daily limit of two units for women and three units for men. There is minimal evi-
dence regarding optimal insulin regimens when drinking alcohol. As such, patients
make adjustments based on personal experience and anecdotal evidence. A survey
of college students with type 1 diabetes found that the majority made no changes to
their diabetes regimen of students when drinking alcohol.[163]
3.2 Rationale
Conventional insulin pump therapy relies on pre-programmed basal infusion rates
and complex calculations for prandial insulin boluses, based on results of fingerprick
glucose testing and estimation of quantity of carbohydrate to be consumed. Incorrect
estimation, such as of foods not normally consumed, may lead to mismatch between
insulin and carbohydrates resulting in fluctuating glucose levels. Additionally, bolus
calculations are not able to take into account concurrent influences such as drinking
alcohol or physical activity which are associated with an increased risk of hypogly-
caemia. A closed-loop system linking continuous glucose monitoring with insulin
delivery using a model predictive control algorithm may provide safer glucose con-
trol following such situations. An algorithm incorporating meal announcement may
help overcome the delays associated with absorption of subcutaneously delivered
insulin and appearance of meal-related glucose in the bloodstream.
The feasibility study described in Chapter 2 confirmed the safety and efficacy of
overnight closed-loop insulin delivery overnight following a medium-sized evening
meal similar to that consumed at home. Several other common scenarios faced by
patients with type 1 diabetes in daily life may provide a greater challenge to gly-
58
3.3. AIM
caemic control. These include eating a larger meal at a restaurant which may result
in postprandial hyperglycaemia, and drinking alcohol which is associated with a risk
of delayed hypoglycaemia.
3.3 Aim
The aim of this study was to evaluate the efficacy and safety of overnight closed-loop
insulin delivery, in particular the frequency of nocturnal or early morning hypogly-
caemia, following an evening of drinking alcohol accompanying a large meal, com-
pared with conventional insulin pump therapy (CSII), in adults with type 1 diabetes
in a controlled setting.
3.4 Methods
3.4.1 Participants
Twelve new participants, different from those enrolled in the feasibility study, were
recruited from the adult diabetes outpatient clinic at Addenbrooke’s Hospital, Cam-
bridge, UK. Inclusion and exclusion criteria were the same as those applied in the
feasibility study. Additional exclusion criteria included current pregnancy or breast-
feeding, poorly controlled diabetes defined by an HbA1c ≥ 10%, total daily insulin
dose ≥ 1.4 U/kg, and intolerance or inability to consume the necessary quantity
of alcohol as per the study design. The study protocol was approved by the Cam-
bridgeshire Research Ethics Committee, and carried out in accordance with the Dec-
laration of Helsinki. Written informed consent was obtained from each participant.
3.4.2 Study design
The study had a randomised crossover design similar to that of the feasibility study
described in Section 2.4.2. The timeline of procedures is shown in Figure 3.1. There
was no period of optimisation of insulin therapy prior to study commencement. Sub-
jects attended for a closed-loop visit, which involved inputs of glucose concentration
and insulin infusion rates into a computer programme and a manual pump setting
following advice of the algorithm output, and a control (usual CSII) visit. A glucose
sensor (blinded mode) was inserted one to two days prior to each study visit, and
subjects were asked to arrive at the clinical research facility at 18:30. Blood sampling
59
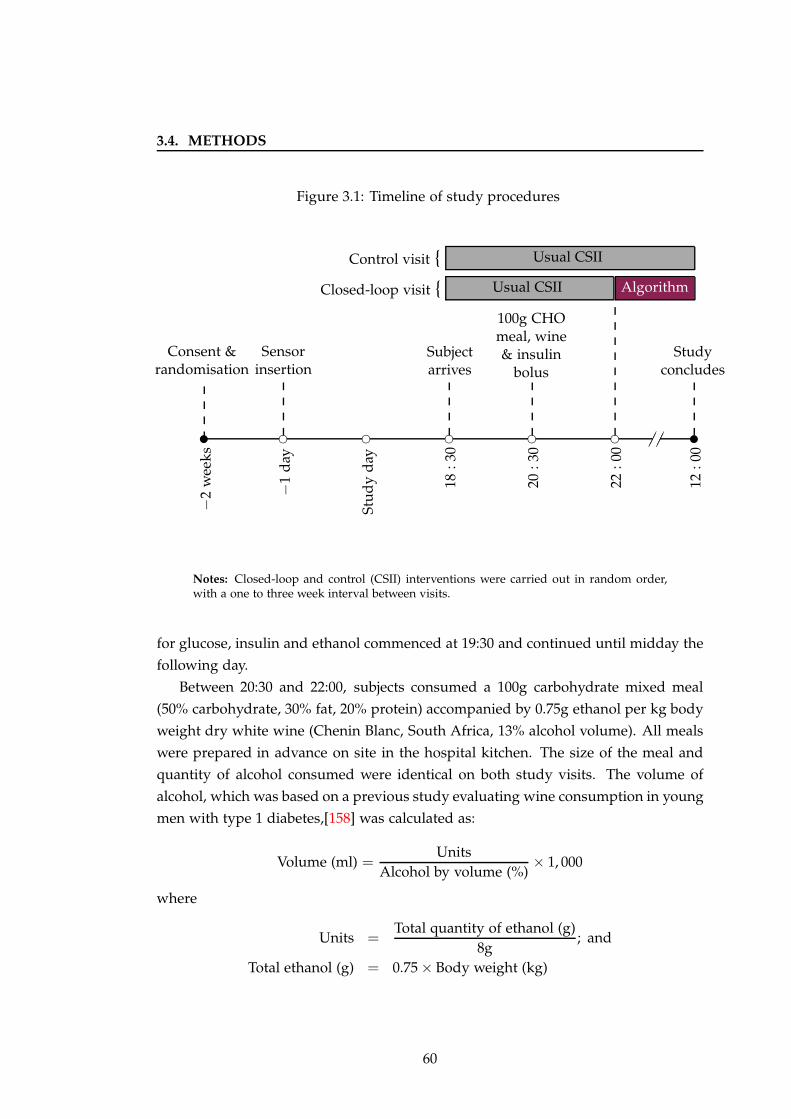
3.4. METHODS
Figure 3.1: Timeline of study procedures−
2w
eeks
✉ ❡
−1
day
❡
Stu
dy
day
❡
18:3
0❡
20:3
0
❡
22:0
0 ✁✁✁✁✉
12:0
0
Consent &randomisation
Sensorinsertion
Subjectarrives
100g CHOmeal, wine& insulin
bolusStudy
concludes
Usual CSII
Usual CSII
AlgorithmClosed-loop visit {
Control visit {
Notes: Closed-loop and control (CSII) interventions were carried out in random order,with a one to three week interval between visits.
for glucose, insulin and ethanol commenced at 19:30 and continued until midday the
following day.
Between 20:30 and 22:00, subjects consumed a 100g carbohydrate mixed meal
(50% carbohydrate, 30% fat, 20% protein) accompanied by 0.75g ethanol per kg body
weight dry white wine (Chenin Blanc, South Africa, 13% alcohol volume). All meals
were prepared in advance on site in the hospital kitchen. The size of the meal and
quantity of alcohol consumed were identical on both study visits. The volume of
alcohol, which was based on a previous study evaluating wine consumption in young
men with type 1 diabetes,[158] was calculated as:
Volume (ml) =Units
Alcohol by volume (%)× 1, 000
where
Units =Total quantity of ethanol (g)
8g; and
Total ethanol (g) = 0.75 × Body weight (kg)
60
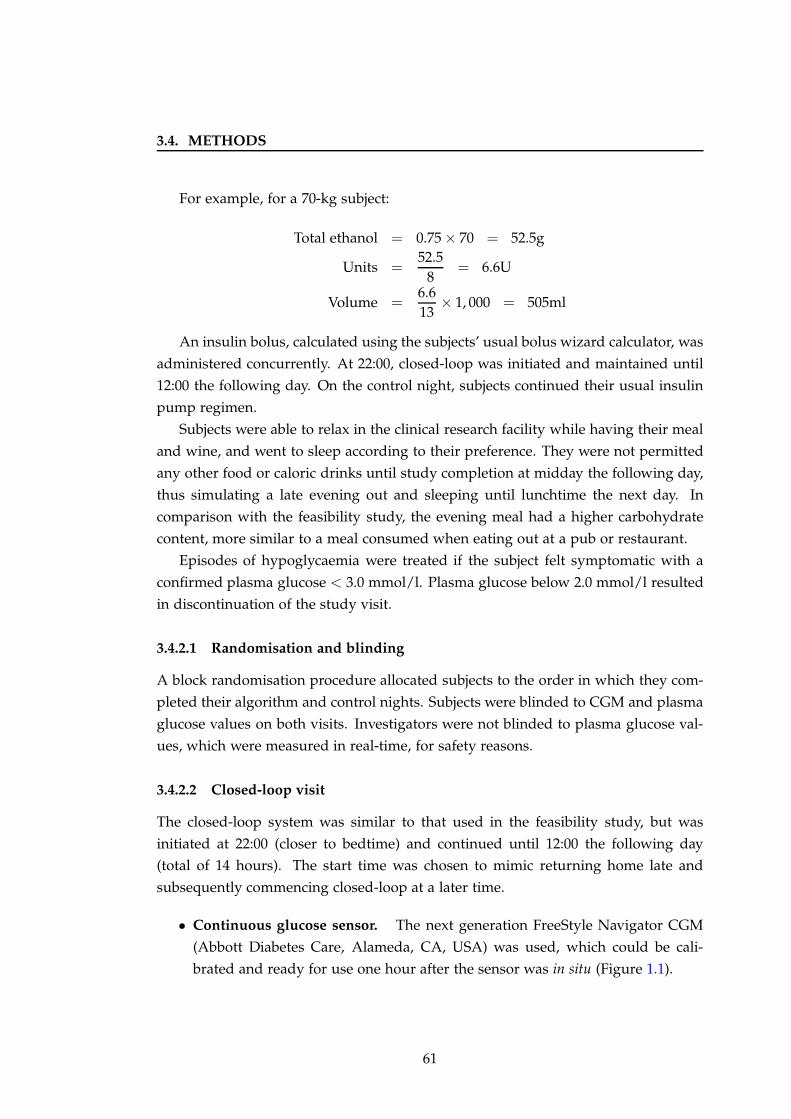
3.4. METHODS
For example, for a 70-kg subject:
Total ethanol = 0.75 × 70 = 52.5g
Units =52.5
8= 6.6U
Volume =6.613
× 1, 000 = 505ml
An insulin bolus, calculated using the subjects’ usual bolus wizard calculator, was
administered concurrently. At 22:00, closed-loop was initiated and maintained until
12:00 the following day. On the control night, subjects continued their usual insulin
pump regimen.
Subjects were able to relax in the clinical research facility while having their meal
and wine, and went to sleep according to their preference. They were not permitted
any other food or caloric drinks until study completion at midday the following day,
thus simulating a late evening out and sleeping until lunchtime the next day. In
comparison with the feasibility study, the evening meal had a higher carbohydrate
content, more similar to a meal consumed when eating out at a pub or restaurant.
Episodes of hypoglycaemia were treated if the subject felt symptomatic with a
confirmed plasma glucose < 3.0 mmol/l. Plasma glucose below 2.0 mmol/l resulted
in discontinuation of the study visit.
3.4.2.1 Randomisation and blinding
A block randomisation procedure allocated subjects to the order in which they com-
pleted their algorithm and control nights. Subjects were blinded to CGM and plasma
glucose values on both visits. Investigators were not blinded to plasma glucose val-
ues, which were measured in real-time, for safety reasons.
3.4.2.2 Closed-loop visit
The closed-loop system was similar to that used in the feasibility study, but was
initiated at 22:00 (closer to bedtime) and continued until 12:00 the following day
(total of 14 hours). The start time was chosen to mimic returning home late and
subsequently commencing closed-loop at a later time.
• Continuous glucose sensor. The next generation FreeStyle Navigator CGM
(Abbott Diabetes Care, Alameda, CA, USA) was used, which could be cali-
brated and ready for use one hour after the sensor was in situ (Figure 1.1).
61
3.4. METHODS
• Model Predictive Control (MPC) algorithm. Versions 0.02.14.0 to 0.02.18.0 of
the MPC algorithm designed at the University of Cambridge were used.
• Study pump. The Deltec Cozmo (Smiths Medical, St Paul, MN, USA) pump
was used on all study visits, and connected to an established infusion site. The
rapid acting insulin analogue aspart (Novo Nordisk, Bagsvaerd, Denmark) was
used for all study visits.
3.4.2.3 CSII visit
On CSII visits, subjects continued their usual insulin pump regimen. This included
setting temporary basal rates and/or reducing the insulin bolus taken for the evening
meal as per their usual practice when drinking alcohol.
3.4.3 Measurements
All samples of whole blood were immediately centrifuged and separated. Plasma
glucose was measured in real-time on a YSI 2300 STAT Plus analyser (YSI Ltd, Fleet,
UK). Plasma samples of insulin were stored at −80 ◦C and ethanol on dry ice, for
later analysis. Plasma insulin was measured using an immunochemiluminometric
assay (Invitron Ltd, Monmouth, UK). Plasma ethanol was determined using the ethyl
alcohol method (Dade Behring Inc, Atterbury, Milton Keynes, UK). At a mean of 6.6
mmol/l, the intra-assay and inter-assay coefficient of variation were 2.4% and 5.7%,
respectively.
3.4.4 Statistical analysis
3.4.4.1 Power calculation
Similar to the ‘Feasibility’ study described in Chapter 2, the power calculation was
based on the results of evaluation of closed-loop in children,[104] as the results from
the first study in adults were not available at the time of designing this study.
3.4.4.2 Efficacy endpoints
The primary outcome measure was proportion of time spent with plasma glucose
in target range (3.9 − 8.0 mmol/l) between 22:00 and 12:00. The secondary outcome
measures were identical to those measured in the feasiblity study. In addition, peak
plasma ethanol concentration and area under the ethanol concentration curve (AUC)
62
3.4. METHODS
were calculated to verify similar metabolism of the alcohol consumed on closed-loop
and CSII visits. Secondary outcomes were calculated using plasma and sensor (CGM)
glucose, for the following time periods:
• Overall period (22:00-12:00). On closed-loop visits, the ‘overall period’ was
defined as the interval from commencement of the algorithm at 22:00 until dis-
continuation at 12:00 the following day. On CSII visits, this was defined as the
corresponding time period when subjects continued their usual CSII regimen.
• Overnight period (00:00-08:00). On closed-loop visits, the ‘overnight period’
was defined from midnight to 08:00. On CSII visits, this was the corresponding
period in time when subjects continued their usual CSII regimen. This period
was chosen as it enabled evaluation of glycaemic control at night time specifi-
cally.
• Latter period (03:00-12:00). On closed-loop visits, the ‘latter period’ was defined
as the period five hours after commencement of the algorithm until discontin-
uation at 12:00. This period was chosen as it enabled comparison with the
corresponding period in the feasibility study five hours after the algorithm was
started at 19:00. On CSII visits, this was the corresponding period in time when
subjects continued their usual CSII regimen.
• Morning period (08:00-12:00) On closed-loop visits the ‘morning period’ was
defined from 08:00 until end of study at 12:00. On CSII visits, this was the
corresponding period in time when subjects continued their usual CSII regimen.
This period enabled evaluation of morning glycaemic control, specifically risk
of delayed hypoglycaemia.
Statistical analyses were carried out as described in Section 2.4.4, using SPSS,
Version 15 (SPSS Inc, Chicago, IL, USA).
The AUC of plasma ethanol was determined by calculating the sum of the average
plasma ethanol concentrations at each time period (i.e. average plasma ethanol ×
time). The intra-individual variability in peak plasma ethanol and AUC ethanol were
analysed by calculating the coefficient of variation of the difference between first
and second study visits. The inter-individual coefficient of variation of peak plasma
ethanol and AUC ethanol was determined from the mean and standard deviation of
all study visits. Coefficient of variation, defined as the standard deviation expressed
as a percentage of the mean, measures the dispersion of data around the mean.
63
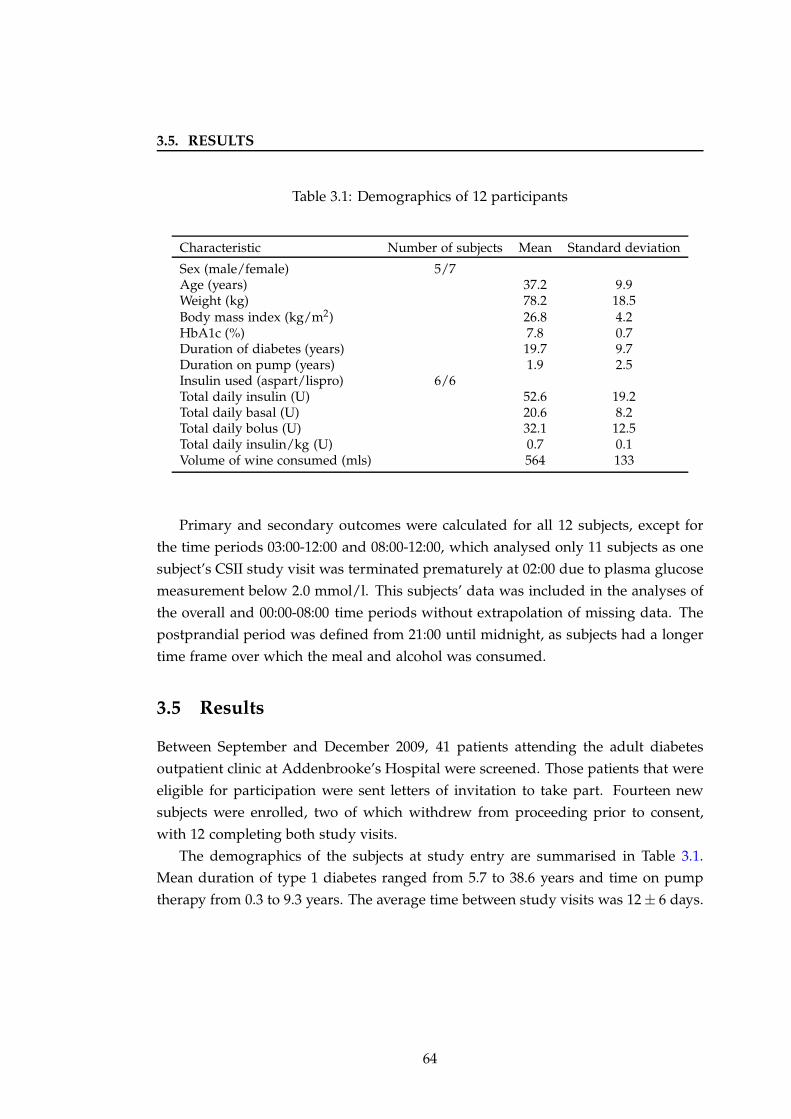
3.5. RESULTS
Table 3.1: Demographics of 12 participants
Characteristic Number of subjects Mean Standard deviation
Sex (male/female) 5/7Age (years) 37.2 9.9Weight (kg) 78.2 18.5Body mass index (kg/m2) 26.8 4.2HbA1c (%) 7.8 0.7Duration of diabetes (years) 19.7 9.7Duration on pump (years) 1.9 2.5Insulin used (aspart/lispro) 6/6Total daily insulin (U) 52.6 19.2Total daily basal (U) 20.6 8.2Total daily bolus (U) 32.1 12.5Total daily insulin/kg (U) 0.7 0.1Volume of wine consumed (mls) 564 133
Primary and secondary outcomes were calculated for all 12 subjects, except for
the time periods 03:00-12:00 and 08:00-12:00, which analysed only 11 subjects as one
subject’s CSII study visit was terminated prematurely at 02:00 due to plasma glucose
measurement below 2.0 mmol/l. This subjects’ data was included in the analyses of
the overall and 00:00-08:00 time periods without extrapolation of missing data. The
postprandial period was defined from 21:00 until midnight, as subjects had a longer
time frame over which the meal and alcohol was consumed.
3.5 Results
Between September and December 2009, 41 patients attending the adult diabetes
outpatient clinic at Addenbrooke’s Hospital were screened. Those patients that were
eligible for participation were sent letters of invitation to take part. Fourteen new
subjects were enrolled, two of which withdrew from proceeding prior to consent,
with 12 completing both study visits.
The demographics of the subjects at study entry are summarised in Table 3.1.
Mean duration of type 1 diabetes ranged from 5.7 to 38.6 years and time on pump
therapy from 0.3 to 9.3 years. The average time between study visits was 12 ± 6 days.
64
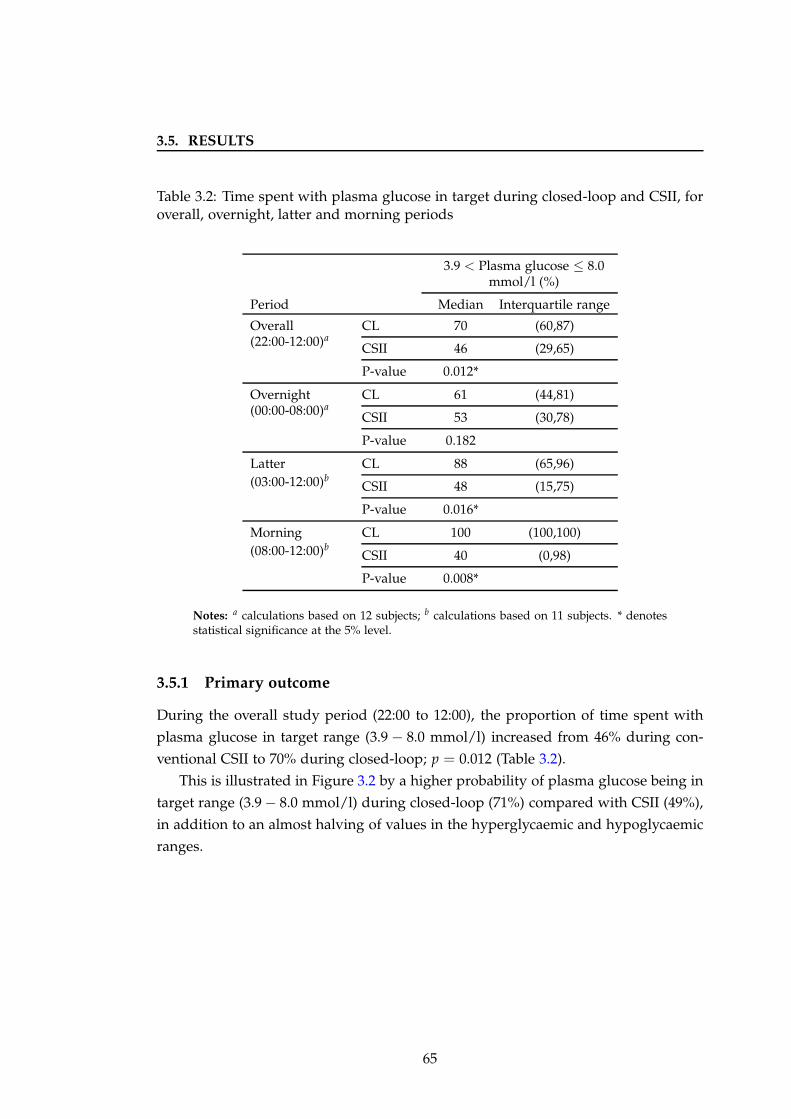
3.5. RESULTS
Table 3.2: Time spent with plasma glucose in target during closed-loop and CSII, foroverall, overnight, latter and morning periods
3.9 < Plasma glucose ≤ 8.0mmol/l (%)
Period Median Interquartile range
Overall(22:00-12:00)a
CL 70 (60,87)
CSII 46 (29,65)
P-value 0.012*
Overnight(00:00-08:00)a
CL 61 (44,81)
CSII 53 (30,78)
P-value 0.182
Latter(03:00-12:00)b
CL 88 (65,96)
CSII 48 (15,75)
P-value 0.016*
Morning(08:00-12:00)b
CL 100 (100,100)
CSII 40 (0,98)
P-value 0.008*
Notes: a calculations based on 12 subjects; b calculations based on 11 subjects. * denotesstatistical significance at the 5% level.
3.5.1 Primary outcome
During the overall study period (22:00 to 12:00), the proportion of time spent with
plasma glucose in target range (3.9 − 8.0 mmol/l) increased from 46% during con-
ventional CSII to 70% during closed-loop; p = 0.012 (Table 3.2).
This is illustrated in Figure 3.2 by a higher probability of plasma glucose being in
target range (3.9 − 8.0 mmol/l) during closed-loop (71%) compared with CSII (49%),
in addition to an almost halving of values in the hyperglycaemic and hypoglycaemic
ranges.
65
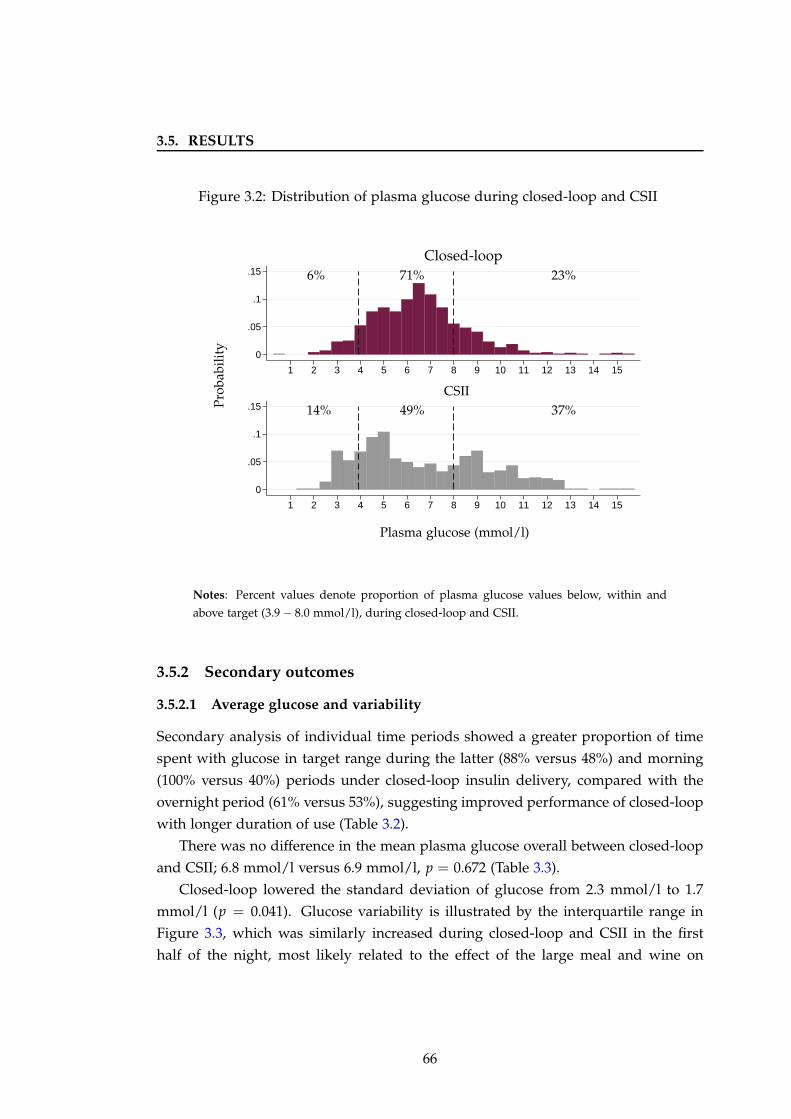
3.5. RESULTS
Figure 3.2: Distribution of plasma glucose during closed-loop and CSII
0
.05
.1
.15
0
.05
.1
.15
1 2 3 4 5 6 7 8 9 10 11 12 13 14 15
1 2 3 4 5 6 7 8 9 10 11 12 13 14 15
Plasma glucose (mmol/l)
CSII
Closed-loop6% 71% 23%
14% 49% 37%Pro
babi
lity
Notes: Percent values denote proportion of plasma glucose values below, within and
above target (3.9 − 8.0 mmol/l), during closed-loop and CSII.
3.5.2 Secondary outcomes
3.5.2.1 Average glucose and variability
Secondary analysis of individual time periods showed a greater proportion of time
spent with glucose in target range during the latter (88% versus 48%) and morning
(100% versus 40%) periods under closed-loop insulin delivery, compared with the
overnight period (61% versus 53%), suggesting improved performance of closed-loop
with longer duration of use (Table 3.2).
There was no difference in the mean plasma glucose overall between closed-loop
and CSII; 6.8 mmol/l versus 6.9 mmol/l, p = 0.672 (Table 3.3).
Closed-loop lowered the standard deviation of glucose from 2.3 mmol/l to 1.7
mmol/l (p = 0.041). Glucose variability is illustrated by the interquartile range in
Figure 3.3, which was similarly increased during closed-loop and CSII in the first
half of the night, most likely related to the effect of the large meal and wine on
66
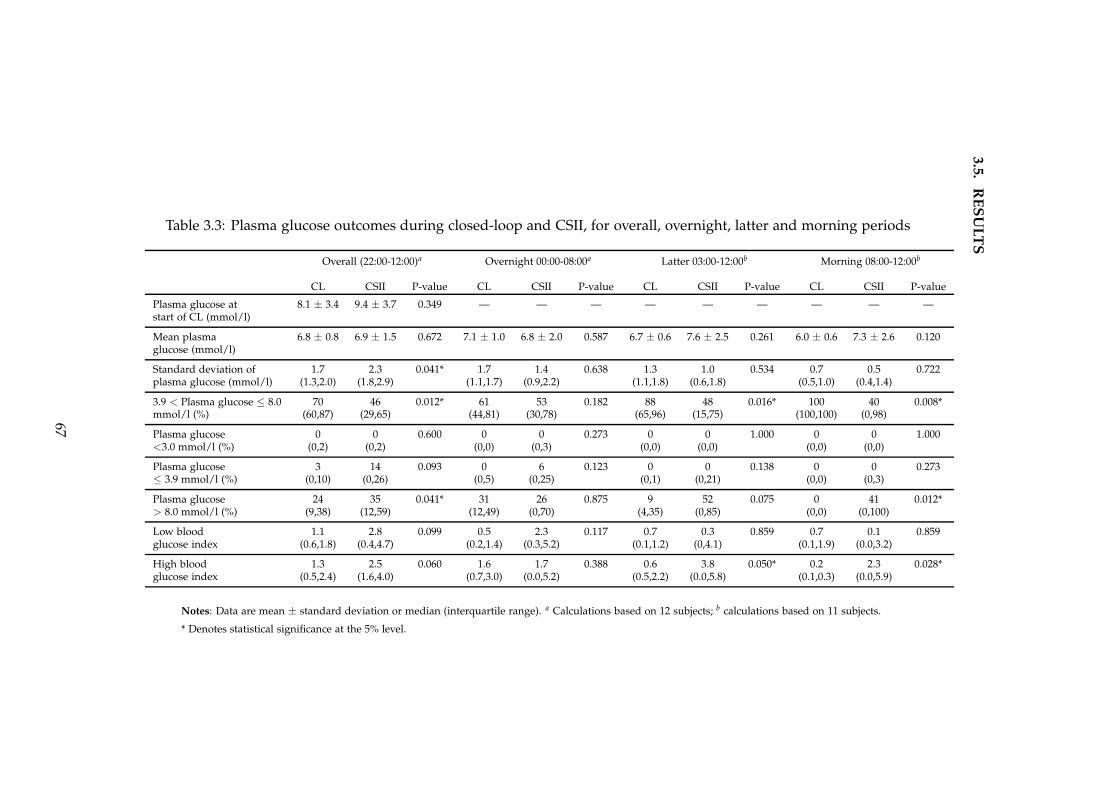
3.5
.R
ES
UL
TS
Table 3.3: Plasma glucose outcomes during closed-loop and CSII, for overall, overnight, latter and morning periods
Overall (22:00-12:00)a Overnight 00:00-08:00a Latter 03:00-12:00b Morning 08:00-12:00b
CL CSII P-value CL CSII P-value CL CSII P-value CL CSII P-value
Plasma glucose at 8.1 ± 3.4 9.4 ± 3.7 0.349 — — — — — — — — —start of CL (mmol/l)
Mean plasma 6.8 ± 0.8 6.9 ± 1.5 0.672 7.1 ± 1.0 6.8 ± 2.0 0.587 6.7 ± 0.6 7.6 ± 2.5 0.261 6.0 ± 0.6 7.3 ± 2.6 0.120glucose (mmol/l)
Standard deviation of 1.7 2.3 0.041* 1.7 1.4 0.638 1.3 1.0 0.534 0.7 0.5 0.722plasma glucose (mmol/l) (1.3,2.0) (1.8,2.9) (1.1,1.7) (0.9,2.2) (1.1,1.8) (0.6,1.8) (0.5,1.0) (0.4,1.4)
3.9 < Plasma glucose ≤ 8.0 70 46 0.012* 61 53 0.182 88 48 0.016* 100 40 0.008*mmol/l (%) (60,87) (29,65) (44,81) (30,78) (65,96) (15,75) (100,100) (0,98)
Plasma glucose 0 0 0.600 0 0 0.273 0 0 1.000 0 0 1.000<3.0 mmol/l (%) (0,2) (0,2) (0,0) (0,3) (0,0) (0,0) (0,0) (0,0)
Plasma glucose 3 14 0.093 0 6 0.123 0 0 0.138 0 0 0.273≤ 3.9 mmol/l (%) (0,10) (0,26) (0,5) (0,25) (0,1) (0,21) (0,0) (0,3)
Plasma glucose 24 35 0.041* 31 26 0.875 9 52 0.075 0 41 0.012*> 8.0 mmol/l (%) (9,38) (12,59) (12,49) (0,70) (4,35) (0,85) (0,0) (0,100)
Low blood 1.1 2.8 0.099 0.5 2.3 0.117 0.7 0.3 0.859 0.7 0.1 0.859glucose index (0.6,1.8) (0.4,4.7) (0.2,1.4) (0.3,5.2) (0.1,1.2) (0,4.1) (0.1,1.9) (0.0,3.2)
High blood 1.3 2.5 0.060 1.6 1.7 0.388 0.6 3.8 0.050* 0.2 2.3 0.028*glucose index (0.5,2.4) (1.6,4.0) (0.7,3.0) (0.0,5.2) (0.5,2.2) (0.0,5.8) (0.1,0.3) (0.0,5.9)
Notes: Data are mean ± standard deviation or median (interquartile range). a Calculations based on 12 subjects; b calculations based on 11 subjects.
* Denotes statistical significance at the 5% level.
67
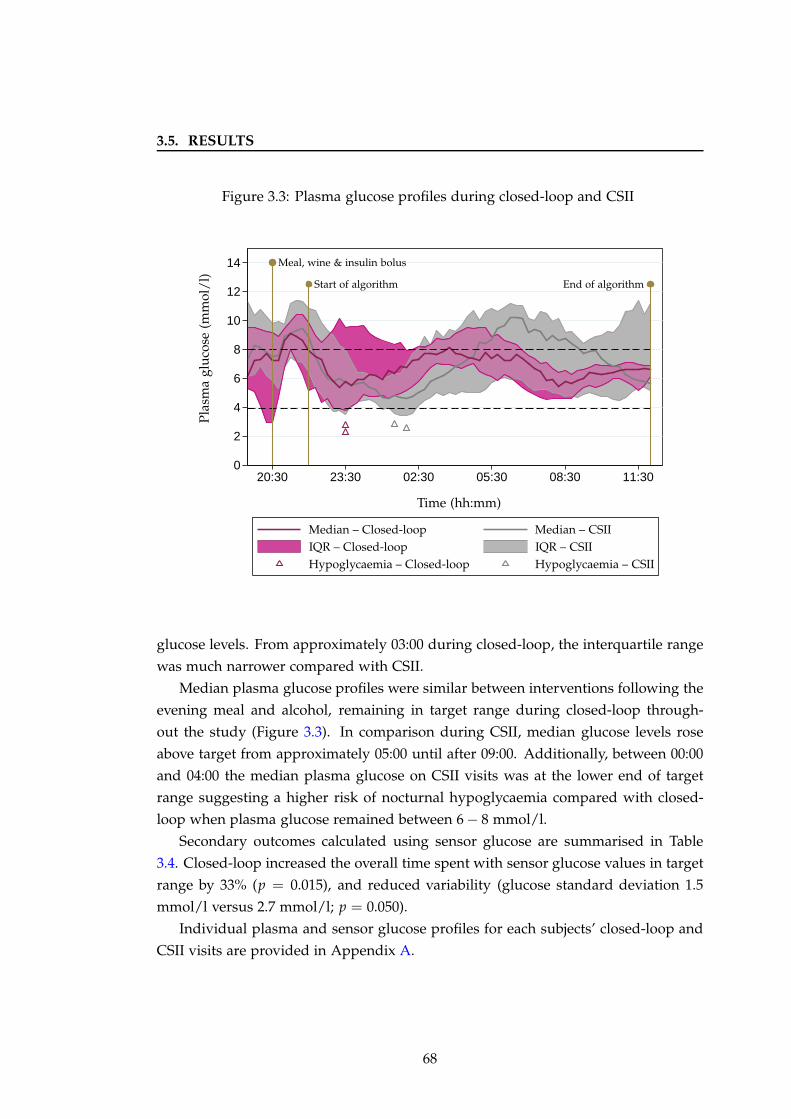
3.5. RESULTS
Figure 3.3: Plasma glucose profiles during closed-loop and CSII
0
2
4
6
8
10
12
14
20:30 23:30 02:30 05:30 08:30 11:30
Pla
sma
glu
cose
(mm
ol/
l)
Time (hh:mm)
Meal, wine & insulin bolus
Start of algorithm End of algorithm
Median – Closed-loop Median – CSII
IQR – Closed-loop IQR – CSII
Hypoglycaemia – CSIIHypoglycaemia – Closed-loop
glucose levels. From approximately 03:00 during closed-loop, the interquartile range
was much narrower compared with CSII.
Median plasma glucose profiles were similar between interventions following the
evening meal and alcohol, remaining in target range during closed-loop through-
out the study (Figure 3.3). In comparison during CSII, median glucose levels rose
above target from approximately 05:00 until after 09:00. Additionally, between 00:00
and 04:00 the median plasma glucose on CSII visits was at the lower end of target
range suggesting a higher risk of nocturnal hypoglycaemia compared with closed-
loop when plasma glucose remained between 6 − 8 mmol/l.
Secondary outcomes calculated using sensor glucose are summarised in Table
3.4. Closed-loop increased the overall time spent with sensor glucose values in target
range by 33% (p = 0.015), and reduced variability (glucose standard deviation 1.5
mmol/l versus 2.7 mmol/l; p = 0.050).
Individual plasma and sensor glucose profiles for each subjects’ closed-loop and
CSII visits are provided in Appendix A.
68
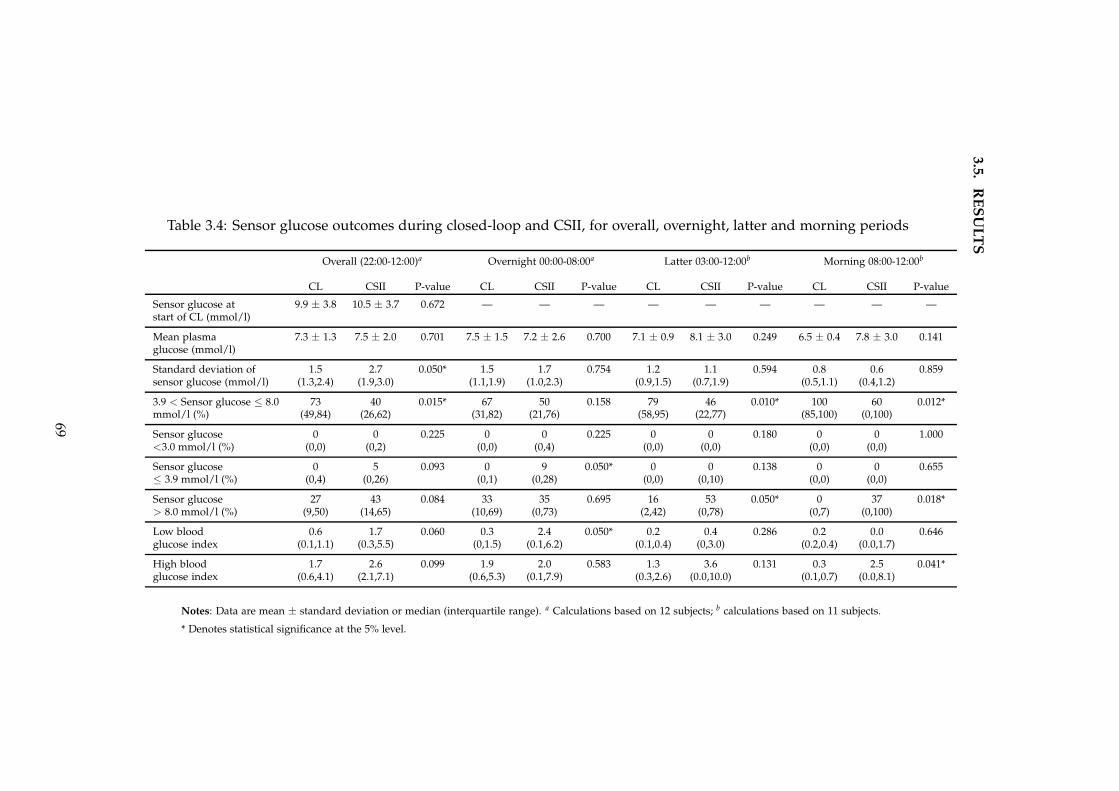
3.5
.R
ES
UL
TS
Table 3.4: Sensor glucose outcomes during closed-loop and CSII, for overall, overnight, latter and morning periods
Overall (22:00-12:00)a Overnight 00:00-08:00a Latter 03:00-12:00b Morning 08:00-12:00b
CL CSII P-value CL CSII P-value CL CSII P-value CL CSII P-value
Sensor glucose at 9.9 ± 3.8 10.5 ± 3.7 0.672 — — — — — — — — —start of CL (mmol/l)
Mean plasma 7.3 ± 1.3 7.5 ± 2.0 0.701 7.5 ± 1.5 7.2 ± 2.6 0.700 7.1 ± 0.9 8.1 ± 3.0 0.249 6.5 ± 0.4 7.8 ± 3.0 0.141glucose (mmol/l)
Standard deviation of 1.5 2.7 0.050* 1.5 1.7 0.754 1.2 1.1 0.594 0.8 0.6 0.859sensor glucose (mmol/l) (1.3,2.4) (1.9,3.0) (1.1,1.9) (1.0,2.3) (0.9,1.5) (0.7,1.9) (0.5,1.1) (0.4,1.2)
3.9 < Sensor glucose ≤ 8.0 73 40 0.015* 67 50 0.158 79 46 0.010* 100 60 0.012*mmol/l (%) (49,84) (26,62) (31,82) (21,76) (58,95) (22,77) (85,100) (0,100)
Sensor glucose 0 0 0.225 0 0 0.225 0 0 0.180 0 0 1.000<3.0 mmol/l (%) (0,0) (0,2) (0,0) (0,4) (0,0) (0,0) (0,0) (0,0)
Sensor glucose 0 5 0.093 0 9 0.050* 0 0 0.138 0 0 0.655≤ 3.9 mmol/l (%) (0,4) (0,26) (0,1) (0,28) (0,0) (0,10) (0,0) (0,0)
Sensor glucose 27 43 0.084 33 35 0.695 16 53 0.050* 0 37 0.018*> 8.0 mmol/l (%) (9,50) (14,65) (10,69) (0,73) (2,42) (0,78) (0,7) (0,100)
Low blood 0.6 1.7 0.060 0.3 2.4 0.050* 0.2 0.4 0.286 0.2 0.0 0.646glucose index (0.1,1.1) (0.3,5.5) (0,1.5) (0.1,6.2) (0.1,0.4) (0,3.0) (0.2,0.4) (0.0,1.7)
High blood 1.7 2.6 0.099 1.9 2.0 0.583 1.3 3.6 0.131 0.3 2.5 0.041*glucose index (0.6,4.1) (2.1,7.1) (0.6,5.3) (0.1,7.9) (0.3,2.6) (0.0,10.0) (0.1,0.7) (0.0,8.1)
Notes: Data are mean ± standard deviation or median (interquartile range). a Calculations based on 12 subjects; b calculations based on 11 subjects.
* Denotes statistical significance at the 5% level.
69
3.5. RESULTS
3.5.2.2 Hypoglycaemia
The proportion of time spent in hypoglycaemia (< 3.9 mmol) was 3% during closed-
loop compared with 14% during CSII although this difference was not significant;
p = 0.093 (Table 3.3). Using sensor glucose outcomes (Table 3.4), closed-loop reduced
the time spent in hypoglycaemia after midnight from 9% to 0% (p = 0.050) and the
low blood glucose index from 2.4 to 0.3 (p = 0.050). The frequency of hypoglycaemia
on both closed-loop and CSII visits was low overall, with only seven plasma glucose
measurements below 3.0 mmol/l during closed-loop and 11 on CSII (Table 3.5). After
midnight, there were two plasma glucose values below 3.0 mmol/l on closed-loop
and seven on CSII.
There were four hypoglycaemic events overall, defined as plasma glucose < 3.0
mmol/l: two during closed-loop and two during CSII visits (Table 3.6). There was
no requirement for intravenous dextrose on any episode. The events during closed-
loop occurred within three hours of consumption of the meal and wine and were
likely related to the prandial bolus administered. They were both associated with
symptoms and resolved with 15g of quick-acting carbohydrate as Lucozade Energy
drink (GlaxoSmithKline, UK) or orange juice. The hypoglycaemic episodes on CSII
visits occurred after midnight and were both asymptomatic. One of these resulted
in early termination of the subject’s study visit at 02:00, as per study protocol, as
plasma glucose nadir was < 2.0 mmol/l. This subject had a large bolus of 24U
for the evening meal which may have contributed to the hypoglycaemia. Of note,
the bolus was calculated using their usual bolus wizard and was identical to that
administered for the evening meal on the closed-loop visit.
3.5.2.3 Hyperglycaemia
Closed-loop lowered the overall time spent with plasma glucose above 8.0 mmol/l
from 35% to 24%; p = 0.041 (Table 3.3). After 08:00, there were no plasma glu-
cose measurements above 8.0 mmol/l during closed-loop. There was a significant
reduction in the high blood glucose index, measuring duration and extent of hyper-
glycaemia, during closed-loop from 03:00. A similar improvement in hyperglycaemia
during closed-loop was seen using sensor glucose outcomes, with significant reduc-
tion after 03:00 from 53% to 16%; p = 0.050 (Table 3.4).
70
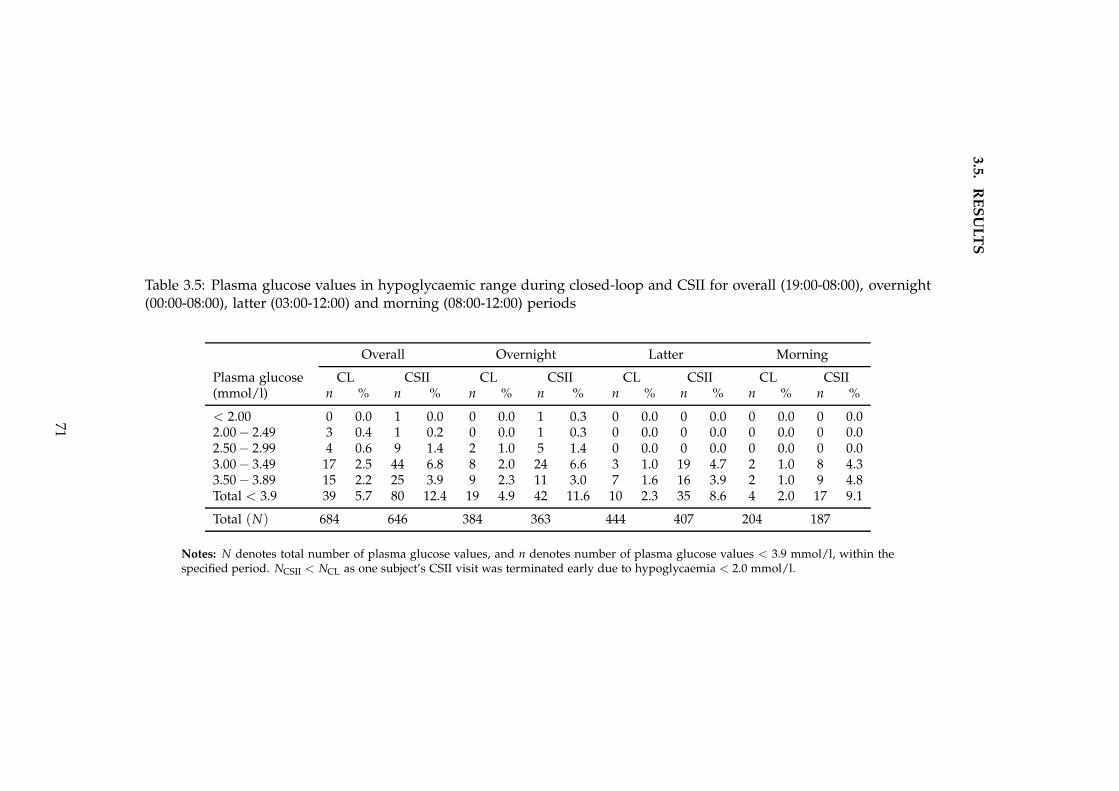
3.5
.R
ES
UL
TS
Table 3.5: Plasma glucose values in hypoglycaemic range during closed-loop and CSII for overall (19:00-08:00), overnight(00:00-08:00), latter (03:00-12:00) and morning (08:00-12:00) periods
Overall Overnight Latter Morning
Plasma glucose CL CSII CL CSII CL CSII CL CSII(mmol/l) n % n % n % n % n % n % n % n %
< 2.00 0 0.0 1 0.0 0 0.0 1 0.3 0 0.0 0 0.0 0 0.0 0 0.02.00 − 2.49 3 0.4 1 0.2 0 0.0 1 0.3 0 0.0 0 0.0 0 0.0 0 0.02.50 − 2.99 4 0.6 9 1.4 2 1.0 5 1.4 0 0.0 0 0.0 0 0.0 0 0.03.00 − 3.49 17 2.5 44 6.8 8 2.0 24 6.6 3 1.0 19 4.7 2 1.0 8 4.33.50 − 3.89 15 2.2 25 3.9 9 2.3 11 3.0 7 1.6 16 3.9 2 1.0 9 4.8Total < 3.9 39 5.7 80 12.4 19 4.9 42 11.6 10 2.3 35 8.6 4 2.0 17 9.1
Total (N) 684 646 384 363 444 407 204 187
Notes: N denotes total number of plasma glucose values, and n denotes number of plasma glucose values < 3.9 mmol/l, within thespecified period. NCSII < NCL as one subject’s CSII visit was terminated early due to hypoglycaemia < 2.0 mmol/l.
71
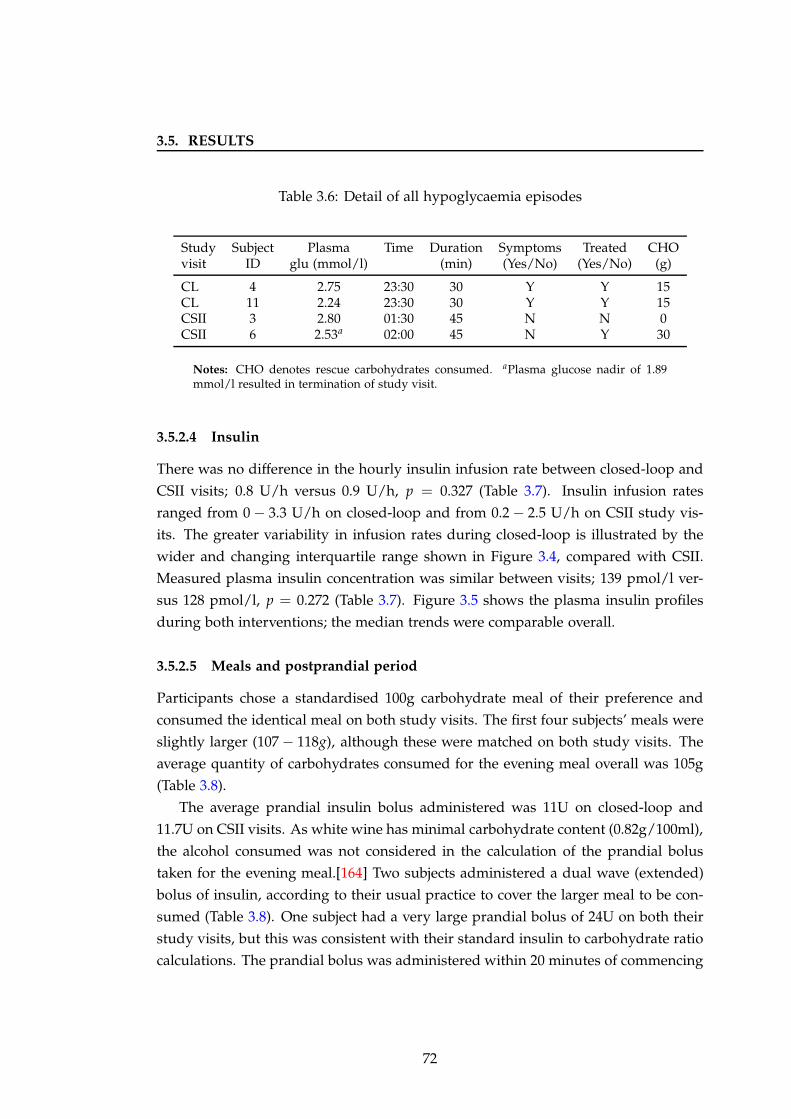
3.5. RESULTS
Table 3.6: Detail of all hypoglycaemia episodes
Study Subject Plasma Time Duration Symptoms Treated CHOvisit ID glu (mmol/l) (min) (Yes/No) (Yes/No) (g)
CL 4 2.75 23:30 30 Y Y 15CL 11 2.24 23:30 30 Y Y 15CSII 3 2.80 01:30 45 N N 0CSII 6 2.53a 02:00 45 N Y 30
Notes: CHO denotes rescue carbohydrates consumed. aPlasma glucose nadir of 1.89mmol/l resulted in termination of study visit.
3.5.2.4 Insulin
There was no difference in the hourly insulin infusion rate between closed-loop and
CSII visits; 0.8 U/h versus 0.9 U/h, p = 0.327 (Table 3.7). Insulin infusion rates
ranged from 0 − 3.3 U/h on closed-loop and from 0.2 − 2.5 U/h on CSII study vis-
its. The greater variability in infusion rates during closed-loop is illustrated by the
wider and changing interquartile range shown in Figure 3.4, compared with CSII.
Measured plasma insulin concentration was similar between visits; 139 pmol/l ver-
sus 128 pmol/l, p = 0.272 (Table 3.7). Figure 3.5 shows the plasma insulin profiles
during both interventions; the median trends were comparable overall.
3.5.2.5 Meals and postprandial period
Participants chose a standardised 100g carbohydrate meal of their preference and
consumed the identical meal on both study visits. The first four subjects’ meals were
slightly larger (107 − 118g), although these were matched on both study visits. The
average quantity of carbohydrates consumed for the evening meal overall was 105g
(Table 3.8).
The average prandial insulin bolus administered was 11U on closed-loop and
11.7U on CSII visits. As white wine has minimal carbohydrate content (0.82g/100ml),
the alcohol consumed was not considered in the calculation of the prandial bolus
taken for the evening meal.[164] Two subjects administered a dual wave (extended)
bolus of insulin, according to their usual practice to cover the larger meal to be con-
sumed (Table 3.8). One subject had a very large prandial bolus of 24U on both their
study visits, but this was consistent with their standard insulin to carbohydrate ratio
calculations. The prandial bolus was administered within 20 minutes of commencing
72
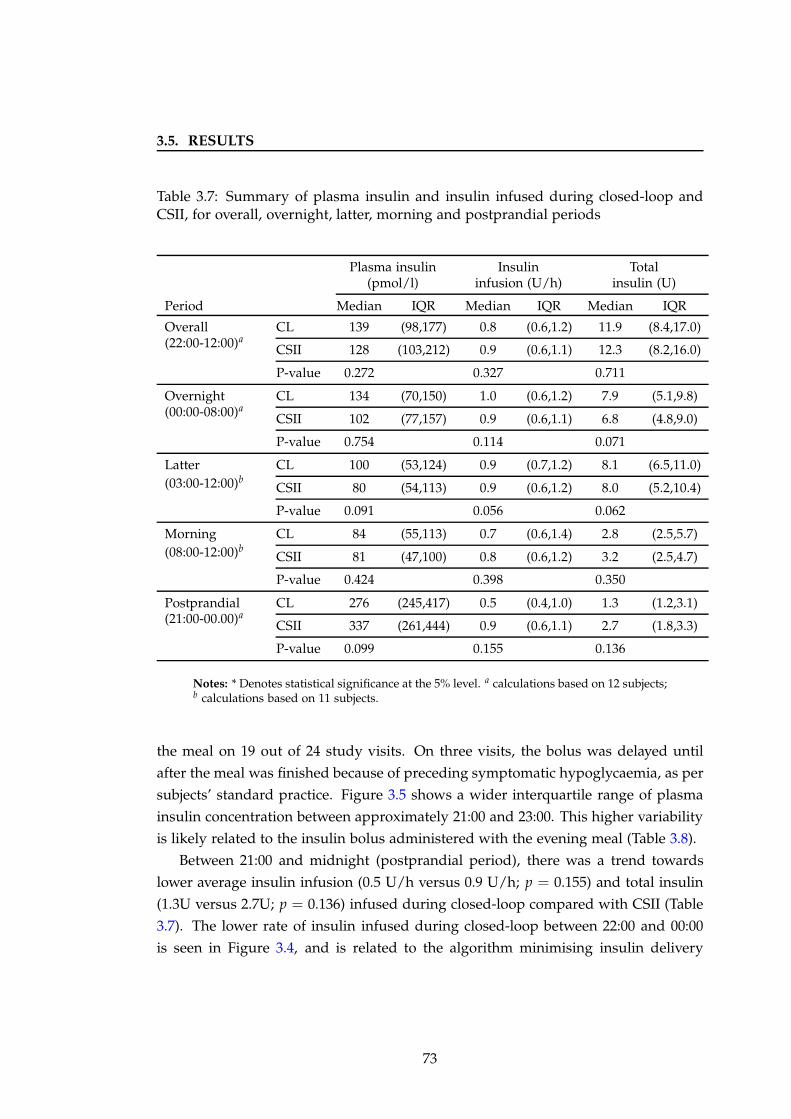
3.5. RESULTS
Table 3.7: Summary of plasma insulin and insulin infused during closed-loop andCSII, for overall, overnight, latter, morning and postprandial periods
Plasma insulin Insulin Total(pmol/l) infusion (U/h) insulin (U)
Period Median IQR Median IQR Median IQR
Overall(22:00-12:00)a
CL 139 (98,177) 0.8 (0.6,1.2) 11.9 (8.4,17.0)
CSII 128 (103,212) 0.9 (0.6,1.1) 12.3 (8.2,16.0)
P-value 0.272 0.327 0.711
Overnight(00:00-08:00)a
CL 134 (70,150) 1.0 (0.6,1.2) 7.9 (5.1,9.8)
CSII 102 (77,157) 0.9 (0.6,1.1) 6.8 (4.8,9.0)
P-value 0.754 0.114 0.071
Latter(03:00-12:00)b
CL 100 (53,124) 0.9 (0.7,1.2) 8.1 (6.5,11.0)
CSII 80 (54,113) 0.9 (0.6,1.2) 8.0 (5.2,10.4)
P-value 0.091 0.056 0.062
Morning(08:00-12:00)b
CL 84 (55,113) 0.7 (0.6,1.4) 2.8 (2.5,5.7)
CSII 81 (47,100) 0.8 (0.6,1.2) 3.2 (2.5,4.7)
P-value 0.424 0.398 0.350
Postprandial(21:00-00.00)a
CL 276 (245,417) 0.5 (0.4,1.0) 1.3 (1.2,3.1)
CSII 337 (261,444) 0.9 (0.6,1.1) 2.7 (1.8,3.3)
P-value 0.099 0.155 0.136
Notes: * Denotes statistical significance at the 5% level. a calculations based on 12 subjects;b calculations based on 11 subjects.
the meal on 19 out of 24 study visits. On three visits, the bolus was delayed until
after the meal was finished because of preceding symptomatic hypoglycaemia, as per
subjects’ standard practice. Figure 3.5 shows a wider interquartile range of plasma
insulin concentration between approximately 21:00 and 23:00. This higher variability
is likely related to the insulin bolus administered with the evening meal (Table 3.8).
Between 21:00 and midnight (postprandial period), there was a trend towards
lower average insulin infusion (0.5 U/h versus 0.9 U/h; p = 0.155) and total insulin
(1.3U versus 2.7U; p = 0.136) infused during closed-loop compared with CSII (Table
3.7). The lower rate of insulin infused during closed-loop between 22:00 and 00:00
is seen in Figure 3.4, and is related to the algorithm minimising insulin delivery
73
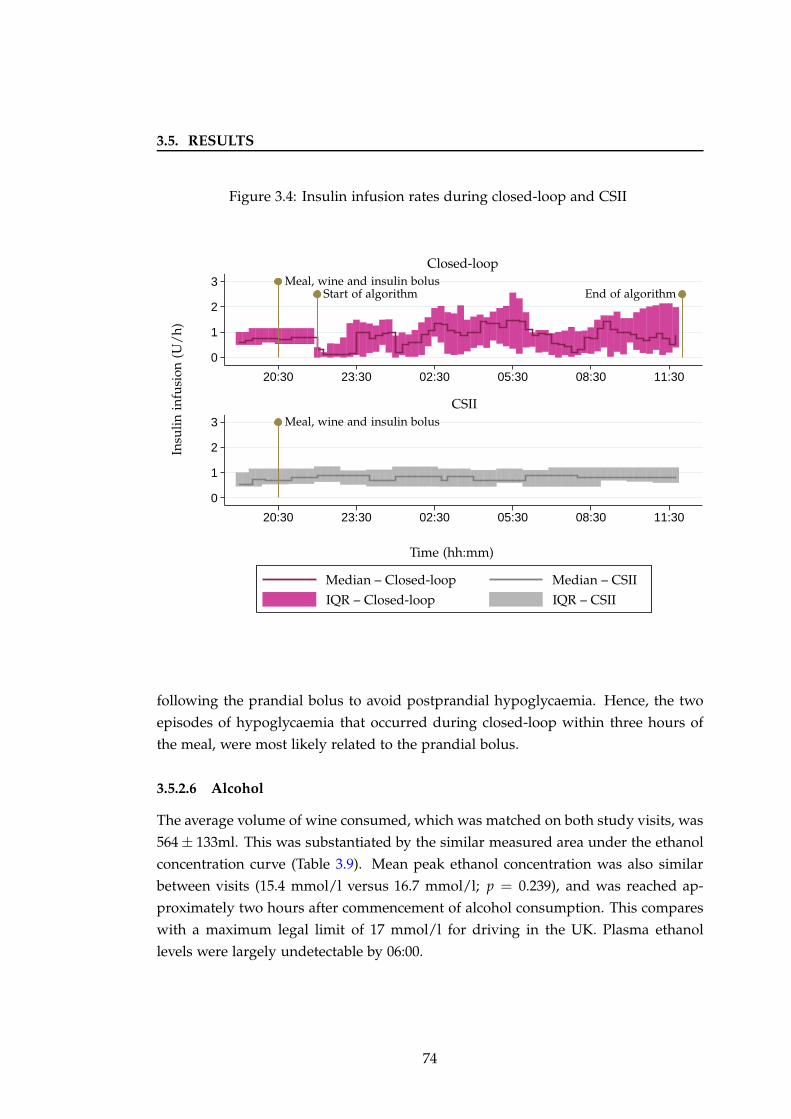
3.5. RESULTS
Figure 3.4: Insulin infusion rates during closed-loop and CSII
0
1
2
3
0
1
2
3
20:30 23:30 02:30 05:30 08:30 11:30
20:30 23:30 02:30 05:30 08:30 11:30
CSII
Closed-loop
Insu
lin
infu
sion
(U/
h)
Time (hh:mm)
Meal, wine and insulin bolus
Meal, wine and insulin bolusStart of algorithm End of algorithm
Median – Closed-loop Median – CSII
IQR – Closed-loop IQR – CSII
following the prandial bolus to avoid postprandial hypoglycaemia. Hence, the two
episodes of hypoglycaemia that occurred during closed-loop within three hours of
the meal, were most likely related to the prandial bolus.
3.5.2.6 Alcohol
The average volume of wine consumed, which was matched on both study visits, was
564 ± 133ml. This was substantiated by the similar measured area under the ethanol
concentration curve (Table 3.9). Mean peak ethanol concentration was also similar
between visits (15.4 mmol/l versus 16.7 mmol/l; p = 0.239), and was reached ap-
proximately two hours after commencement of alcohol consumption. This compares
with a maximum legal limit of 17 mmol/l for driving in the UK. Plasma ethanol
levels were largely undetectable by 06:00.
74
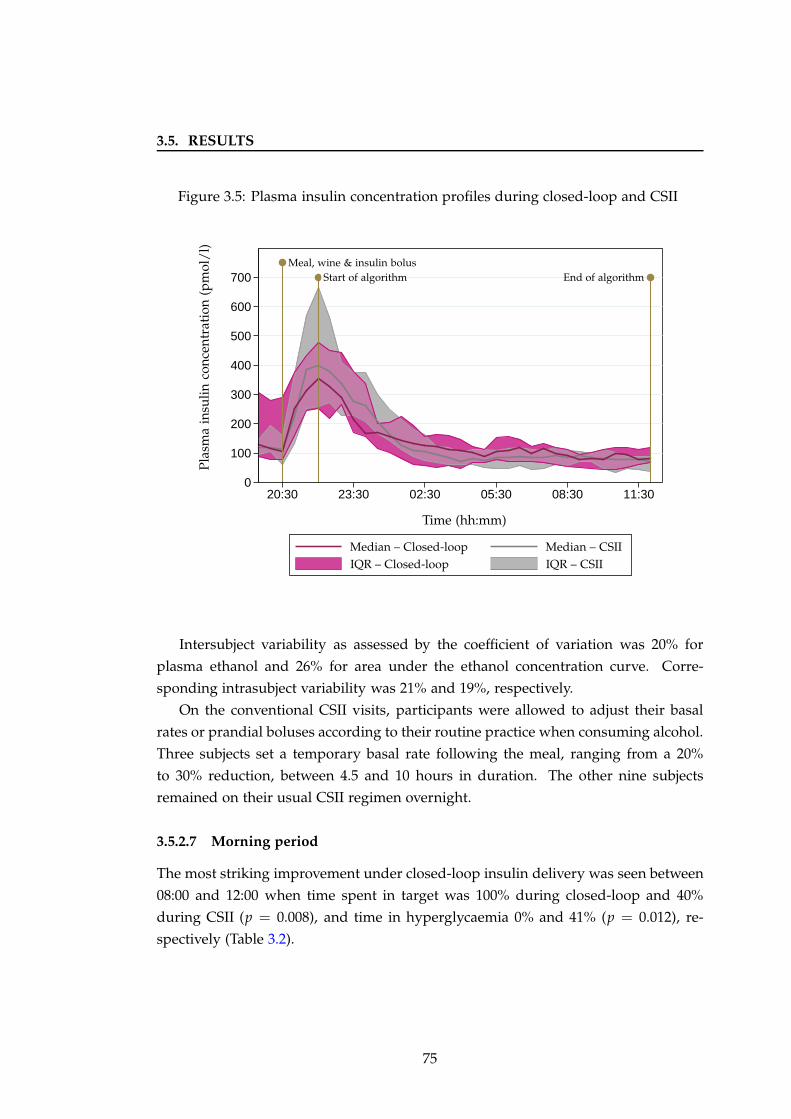
3.5. RESULTS
Figure 3.5: Plasma insulin concentration profiles during closed-loop and CSII
0
100
200
300
400
500
600
700
20:30 23:30 02:30 05:30 08:30 11:30
Pla
sma
insu
lin
con
cen
trat
ion
(pm
ol/
l)
Time (hh:mm)
Meal, wine & insulin bolusStart of algorithm End of algorithm
Median – Closed-loop Median – CSII
IQR – Closed-loop IQR – CSII
Intersubject variability as assessed by the coefficient of variation was 20% for
plasma ethanol and 26% for area under the ethanol concentration curve. Corre-
sponding intrasubject variability was 21% and 19%, respectively.
On the conventional CSII visits, participants were allowed to adjust their basal
rates or prandial boluses according to their routine practice when consuming alcohol.
Three subjects set a temporary basal rate following the meal, ranging from a 20%
to 30% reduction, between 4.5 and 10 hours in duration. The other nine subjects
remained on their usual CSII regimen overnight.
3.5.2.7 Morning period
The most striking improvement under closed-loop insulin delivery was seen between
08:00 and 12:00 when time spent in target was 100% during closed-loop and 40%
during CSII (p = 0.008), and time in hyperglycaemia 0% and 41% (p = 0.012), re-
spectively (Table 3.2).
75
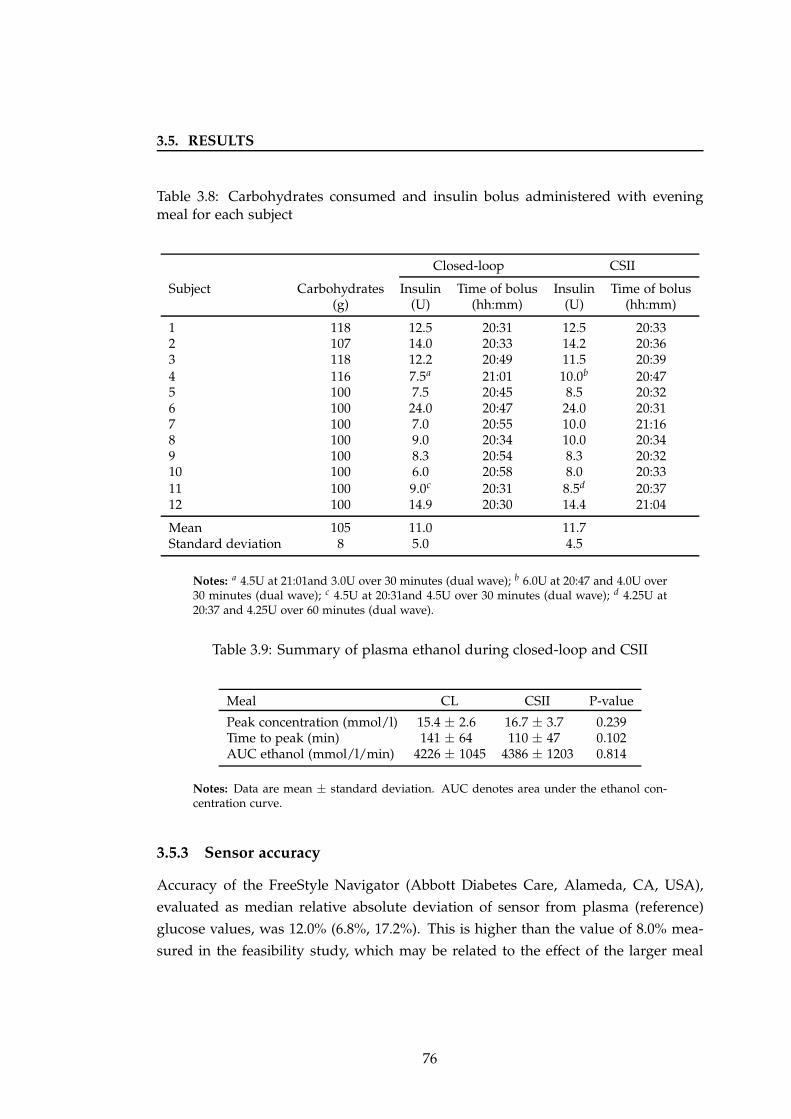
3.5. RESULTS
Table 3.8: Carbohydrates consumed and insulin bolus administered with eveningmeal for each subject
Closed-loop CSII
Subject Carbohydrates Insulin Time of bolus Insulin Time of bolus(g) (U) (hh:mm) (U) (hh:mm)
1 118 12.5 20:31 12.5 20:332 107 14.0 20:33 14.2 20:363 118 12.2 20:49 11.5 20:394 116 7.5a 21:01 10.0b 20:475 100 7.5 20:45 8.5 20:326 100 24.0 20:47 24.0 20:317 100 7.0 20:55 10.0 21:168 100 9.0 20:34 10.0 20:349 100 8.3 20:54 8.3 20:3210 100 6.0 20:58 8.0 20:3311 100 9.0c 20:31 8.5d 20:3712 100 14.9 20:30 14.4 21:04
Mean 105 11.0 11.7Standard deviation 8 5.0 4.5
Notes: a 4.5U at 21:01and 3.0U over 30 minutes (dual wave); b 6.0U at 20:47 and 4.0U over30 minutes (dual wave); c 4.5U at 20:31and 4.5U over 30 minutes (dual wave); d 4.25U at20:37 and 4.25U over 60 minutes (dual wave).
Table 3.9: Summary of plasma ethanol during closed-loop and CSII
Meal CL CSII P-value
Peak concentration (mmol/l) 15.4 ± 2.6 16.7 ± 3.7 0.239Time to peak (min) 141 ± 64 110 ± 47 0.102AUC ethanol (mmol/l/min) 4226 ± 1045 4386 ± 1203 0.814
Notes: Data are mean ± standard deviation. AUC denotes area under the ethanol con-centration curve.
3.5.3 Sensor accuracy
Accuracy of the FreeStyle Navigator (Abbott Diabetes Care, Alameda, CA, USA),
evaluated as median relative absolute deviation of sensor from plasma (reference)
glucose values, was 12.0% (6.8%, 17.2%). This is higher than the value of 8.0% mea-
sured in the feasibility study, which may be related to the effect of the larger meal
76
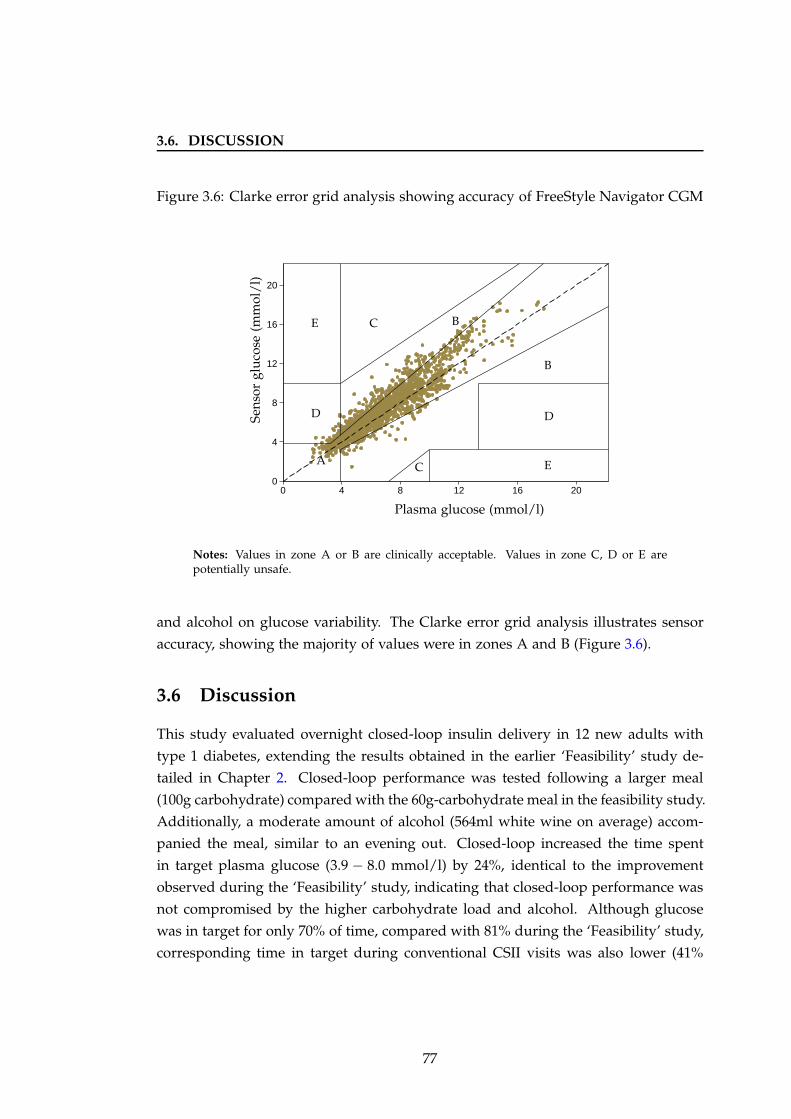
3.6. DISCUSSION
Figure 3.6: Clarke error grid analysis showing accuracy of FreeStyle Navigator CGM
0
4
8
12
16
20
0 4 8 12 16 20
Sen
sor
glu
cose
(mm
ol/
l)
Plasma glucose (mmol/l)
A
B
B
C
C
DD
E
E
Notes: Values in zone A or B are clinically acceptable. Values in zone C, D or E arepotentially unsafe.
and alcohol on glucose variability. The Clarke error grid analysis illustrates sensor
accuracy, showing the majority of values were in zones A and B (Figure 3.6).
3.6 Discussion
This study evaluated overnight closed-loop insulin delivery in 12 new adults with
type 1 diabetes, extending the results obtained in the earlier ‘Feasibility’ study de-
tailed in Chapter 2. Closed-loop performance was tested following a larger meal
(100g carbohydrate) compared with the 60g-carbohydrate meal in the feasibility study.
Additionally, a moderate amount of alcohol (564ml white wine on average) accom-
panied the meal, similar to an evening out. Closed-loop increased the time spent
in target plasma glucose (3.9 − 8.0 mmol/l) by 24%, identical to the improvement
observed during the ‘Feasibility’ study, indicating that closed-loop performance was
not compromised by the higher carbohydrate load and alcohol. Although glucose
was in target for only 70% of time, compared with 81% during the ‘Feasibility’ study,
corresponding time in target during conventional CSII visits was also lower (41%
77
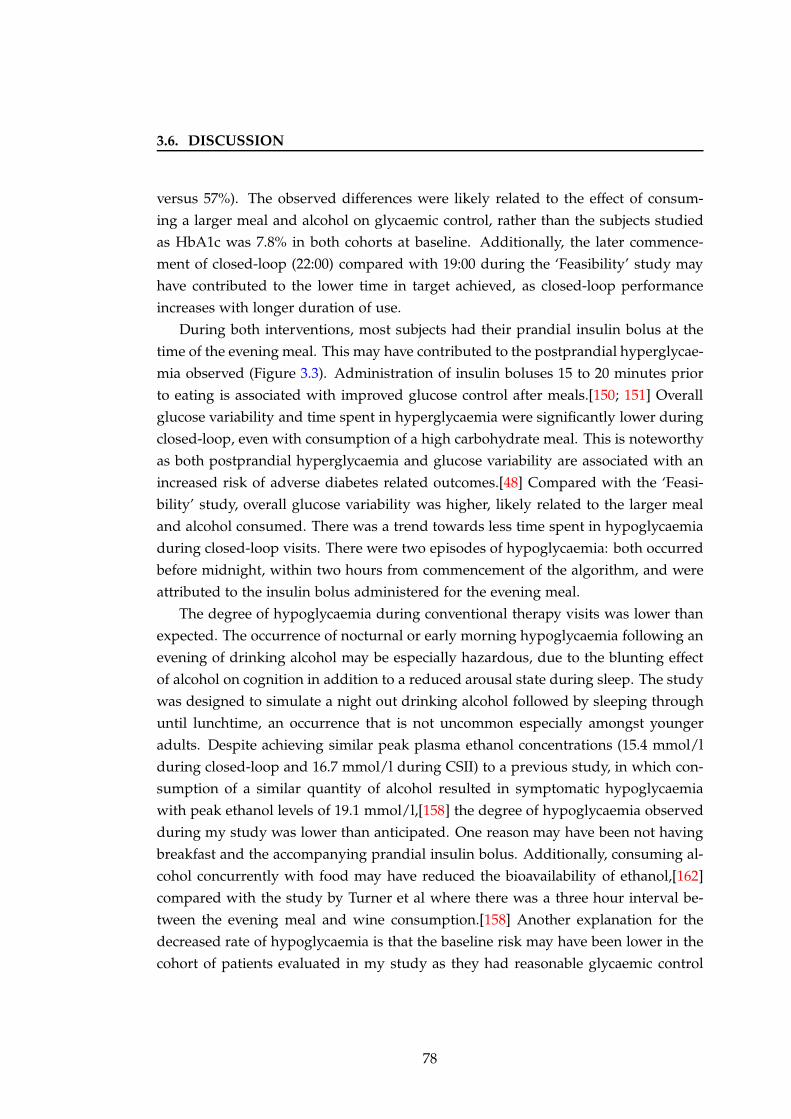
3.6. DISCUSSION
versus 57%). The observed differences were likely related to the effect of consum-
ing a larger meal and alcohol on glycaemic control, rather than the subjects studied
as HbA1c was 7.8% in both cohorts at baseline. Additionally, the later commence-
ment of closed-loop (22:00) compared with 19:00 during the ‘Feasibility’ study may
have contributed to the lower time in target achieved, as closed-loop performance
increases with longer duration of use.
During both interventions, most subjects had their prandial insulin bolus at the
time of the evening meal. This may have contributed to the postprandial hyperglycae-
mia observed (Figure 3.3). Administration of insulin boluses 15 to 20 minutes prior
to eating is associated with improved glucose control after meals.[150; 151] Overall
glucose variability and time spent in hyperglycaemia were significantly lower during
closed-loop, even with consumption of a high carbohydrate meal. This is noteworthy
as both postprandial hyperglycaemia and glucose variability are associated with an
increased risk of adverse diabetes related outcomes.[48] Compared with the ‘Feasi-
bility’ study, overall glucose variability was higher, likely related to the larger meal
and alcohol consumed. There was a trend towards less time spent in hypoglycaemia
during closed-loop visits. There were two episodes of hypoglycaemia: both occurred
before midnight, within two hours from commencement of the algorithm, and were
attributed to the insulin bolus administered for the evening meal.
The degree of hypoglycaemia during conventional therapy visits was lower than
expected. The occurrence of nocturnal or early morning hypoglycaemia following an
evening of drinking alcohol may be especially hazardous, due to the blunting effect
of alcohol on cognition in addition to a reduced arousal state during sleep. The study
was designed to simulate a night out drinking alcohol followed by sleeping through
until lunchtime, an occurrence that is not uncommon especially amongst younger
adults. Despite achieving similar peak plasma ethanol concentrations (15.4 mmol/l
during closed-loop and 16.7 mmol/l during CSII) to a previous study, in which con-
sumption of a similar quantity of alcohol resulted in symptomatic hypoglycaemia
with peak ethanol levels of 19.1 mmol/l,[158] the degree of hypoglycaemia observed
during my study was lower than anticipated. One reason may have been not having
breakfast and the accompanying prandial insulin bolus. Additionally, consuming al-
cohol concurrently with food may have reduced the bioavailability of ethanol,[162]
compared with the study by Turner et al where there was a three hour interval be-
tween the evening meal and wine consumption.[158] Another explanation for the
decreased rate of hypoglycaemia is that the baseline risk may have been lower in the
cohort of patients evaluated in my study as they had reasonable glycaemic control
78
3.6. DISCUSSION
prior to study entry.
Inter- and intra-subject variability in plasma ethanol concentration as measured
by the coefficient of variation was 20% and 21%, respectively. Respective values for
ethanol AUC were 26% and 19%. These values are lower than previously reported
in healthy young males, where inter- and intra-individual coefficient of variation for
plasma ethanol were 34% and 38% respectively, with values of 44% and 35% for
ethanol AUC.[162] The aetiology of the lower variability measured in my study is
uncertain, as the study was not designed to evaluate such effects of ethanol inges-
tion. Possible contributing factors include age, quantity and strength of the alcohol
consumed, and concurrent ingestion of food.[161] It is also possible that co-existing
diabetes has an influence on ethanol metabolism, although this has not been previ-
ously investigated.
Continuation of closed-loop insulin delivery during the morning from 08:00 until
midday resulted in an even greater benefit on glycaemic control with 100% of time
spent in target glucose, compared with only 40% during conventional therapy. As
drinking alcohol in the evening is associated with an increased risk of delayed hy-
poglycaemia, the results of my study demonstrate the potential for closed-loop to
minimise hypoglycaemia whilst still achieving target glycaemic levels.
During closed-loop visits there were no plasma glucose measurements above 8.0
mmol/l after 08:00. Although breakfast with subsequent postprandial rise in glu-
cose levels was omitted, on CSII visits over 40% of time was spent hyperglycaemic
during the morning. As no prandial insulin bolus was delivered in the morning,
the hyperglycaemia is likely attributed to inadequate amount of basal infusion. In-
sulin requirements are generally higher in the morning, associated with the dawn
phenomenon.[142] Interestingly, three participants chose to set a 20 − 30% reduction
in their usual CSII rates for up to ten hours following consumption of the wine as per
their usual practice. My study suggests that such reduction may not be necessary,
and in fact may contribute to elevated glucose levels the following morning. How-
ever, the effect of alcohol on glycaemic control is multifactorial, hence the results of
this study cannot be applied to all patients with type 1 diabetes and to all situations
involving alcohol consumption.
One of the major strengths of this study was evaluating a common scenario which
can be challenging for people with type 1 diabetes, in particular the increased risk of
delayed hypoglycaemia after drinking alcohol. The size and timing of the meal and
wine were chosen to replicate real life as closely as possible. This enabled in-clinic
evaluation of closed-loop following a common situation prior to outpatient testing.
79
3.7. CONCLUSION
This study provided an insight into self-management routines in insulin therapy
in a small cohort of patients with type 1 diabetes. During conventional CSII visits
subjects were advised to make adjustments to their insulin regimen as they would
usually do at home when drinking alcohol. Only three subjects adjusted their usual
insulin regimen for alcohol. The majority reported that they would normally con-
sume a snack before bedtime to prevent late hypoglycaemia, which they found to
be less complicated than adjusting basal rates or prandial insulin boluses. Subjects
administered insulin for the evening meal according to their standard practice, with
only two choosing an extended bolus despite the larger meal consumed.
The reasonably well-controlled cohort of subjects studied may have limited eval-
uation of the true hypoglycaemic effect of alcohol in patients with type 1 diabetes.
The response to alcohol consumption seen in the cohort of patients studied may not
be comparable to the effect of drinking in all people with type 1 diabetes. Similarly,
consumption of other types of alcohol such as beer or not eating whilst drinking are
likely to have a different effect on glucose levels.
3.7 Conclusion
This is the second randomised overnight closed-loop study in adults with type 1
diabetes, extending the results of the ‘Feasibility’ study. Closed-loop performance
was not compromised by consuming a large carbohydrate meal and drinking alco-
hol. Compared with conventional insulin pump therapy, closed-loop increased time
spent with plasma glucose in target range, lowered time spent in hyperglycaemia and
reduced glucose variability. Closed-loop insulin delivery was safe, with no episodes
of hypoglycaemia after midnight.
80
Chapter 4
Daytime closed-loop insulin
delivery during pregnancy
4.1 Background
4.1.1 Physiology of pregnancy
Pregnancy is regarded as a diabetogenic state with increasing insulin resistance
as gestation progresses, attributed to increased production of insulin antagonising
hormones including cortisol, progesterone, oestrogen, prolactin and leptin. In re-
sponse to increasing foetal demands, gluconeogenesis also increases with advancing
pregnancy.[165]
4.1.2 Glycaemic control and obstetric outcomes
Less than a third of women with diabetes receive adequate preconception care.[166]
A population study from the Netherlands reported a significantly lower risk of con-
genital anomalies in planned (4%) versus unplanned (12%) pregnancies.[167] A UK
cohort study of 290 women with type 1 diabetes found a strong association between
prepregnancy care and improved early glycaemic control, with resulting lower foetal
malformation and premature delivery rates.[168]
Suboptimal glycaemic control in diabetic pregnancy is linked with significantly
increased rates of adverse obstetric and neonatal outcomes.[167; 169; 170] As the
transfer of nutrients across the placenta is concentration dependent, maternal hy-
perglycaemia will have a direct effect on the foetus.[171] In addition, as free insulin
cannot cross the placenta, metabolism of maternal nutrients is dependent on foetal
81
4.1. BACKGROUND
insulin secretion. Episodic rises in maternal glucose levels, during the second and
third trimesters, may stimulate foetal hyperinsulinism which promotes development
of macrosomic or large for gestational age infants.[172; 173] Macrosomia is com-
mon, occurring in approximately 50% of women with diabetes, and is associated
with delivery-related complications as well as an increased risk of insulin resistance,
obesity and diabetes in offspring later in life.[174]
The largest reported population-based study, carried out in Sweden, showed con-
siderably higher rates of preeclampsia (odds ratio 4.5), preterm delivery (odds ratio
4.9), stillbirth (odds ratio 3.34), perinatal mortality (odds ratio 3.3), major congenital
malformations (odds ratio 2.5) and macrosomia (odds ratio 11.5) in women with type
1 diabetes compared with healthy controls.[169] The 2006 Confidential Enquiry into
Maternal and Child Health in the UK reported a four times greater risk of perinatal
mortality and two times greater risk of congenital malformations in pregnant women
with type 1 or 2 diabetes compared with healthy controls.[170]
During the DCCT trial, there were 270 pregnancies in 180 women.[175] Mean
HbA1c was 7.4% in the intensive group and 8.1% in the conventional therapy group
at conception, but similar during gestation (HbA1c 6.6%). Of the 86 women in the
conventional group, there was no difference in adverse outcomes between those who
switched to intensive therapy before versus after conception. There were nine (4.7%)
congenital malformations overall: eight occurred in women originally in the conven-
tional group, three of which were considered unrelated to diabetes.
4.1.3 Hypoglycaemia
Pregnancy is associated with an increased risk of hypoglycaemia, particularly in early
gestation when the risk of severe hypoglycaemia is increased three to five fold com-
pared with prepregnancy rates.[176] One third of women with no prior history of
severe hypoglycaemia may experience an episode during pregnancy. Intensification
of insulin therapy to minimise hyperglycaemia is commonly implicated.[177] How-
ever, post hoc analysis of the DCCT suggested that intensive insulin therapy was
not associated with hypoglycaemia during pregnancy.[175] During early pregnancy,
contributing factors include a reduction in hypoglycaemia awareness, pregnancy in-
duced nausea and vomiting, and a relatively lower insulin requirement.[176] An ob-
servational study in Denmark found a severe hypoglycaemia rate of 5.3, 2.4 and 0.5
events per patient years in trimesters 1, 2 and 3, respectively, with 45% of women
experiencing at least one event during pregnancy.[177] Both severe hypoglycaemia
82
4.1. BACKGROUND
pre-conception and reduced hypoglycaemia awareness were independent predictors
of severe hypoglycaemic events. Other risk factors include longer duration of dia-
betes and tight glycaemic control (HbA1c < 6.5%).[176; 177]
Recurrent hypoglycaemia and diabetes progression result in impaired glucose
counter-regulation and the associated phenomenon of hypoglycaemia unawareness,
both of which may be exacerbated during pregnancy. Clamp studies in women with
type 1 diabetes during pregnancy demonstrated significantly diminished epinephrine
and growth hormone responses to hypoglycaemia, compared with the non-pregnant
state. In healthy controls, the normal glucagon response to hypoglycaemia was di-
minished during pregnancy.[178]
Severe hypoglycaemia is the leading cause of maternal death in type 1 diabetes.
A case review from Finland reported five deaths amongst 972 pregnant women with
type 1 diabetes (0.5%), two of which were attributed to hypoglycaemia.[179] A cohort
study of 323 pregnant women with type 1 diabetes from the Netherlands reported
two deaths (0.6%), one of which was due to severe hypoglycaemia.[167] These figures
represent a 60-fold increased mortality rate in women with type 1 diabetes compared
with the normal population.
The effect of maternal hypoglycaemia on offspring is less well understood. A
teratogenic effect of even brief periods of hypoglycaemia resulting in developmen-
tal anomalies and growth retardation has been seen in animal studies.[180; 181]
Such outcomes have not been observed in humans, although no studies have specifi-
cally evaluated the vulnerable period of embryogenesis in early gestation, when the
embryo is wholly dependent on maternal glycolysis.[182] As transplacental glucose
transport is dependent on the maternal-foetal concentration gradient, a reduction in
maternal glucose levels may compromise foetal nutrition, resulting in an increased
risk of intrauterine growth restriction. Small for gestational age infants have been
observed to have higher rates of adverse neonatal outcomes.[183] Neonatal, but not
maternal, hypoglycaemia has been shown to be associated with neurological deficits
in the long term.[184]
4.1.4 Challenges to daytime glycaemic control
Aiming for near-normoglycaemia, including minimising fluctuations in glucose lev-
els, is imperative to achieving favourable obstetric outcomes. During the daytime,
glucose control may be influenced by meals (as detailed in Chapter 3) and physical
activity.
83
4.1. BACKGROUND
4.1.4.1 Glycaemic effects of exercise
Physical activity, in contrast to the effect of a meal or insulin bolus, has longer last-
ing and more dynamic consequences on glucose-insulin regulation in type 1 dia-
betes. The magnitude of effect depends on multiple factors including insulin ther-
apy, prior carbohydrate consumption, exercise duration and intensity, cardiovascular
fitness and pre-exercise glucose levels. The major factors influencing glucose up-
take into muscle during exercise include insulin-independent translocation of glu-
cose transporter proteins (primarily glucose transporter 4) from an intracellular store
to the plasma membrane, blood glucose concentration, capillary blood flow, and glu-
cose phosphorylation. In comparison with the sedentary state, where glucose trans-
port is the major rate-limiting step, phosphorylation has a greater influence during
exercise.[185]
In healthy individuals, exercise stimulates suppression of insulin secretion with
resulting increased hepatic glucose production, lipolysis and reduced peripheral glu-
cose uptake. In type 1 diabetes, elevated therapeutic insulin levels inhibit hepatic
glucose production which is required to meet the glucose demand by exercising mus-
cles, leading to an increased risk of hypoglycaemia. Activation of counter-regulatory
hormones, which normally contribute to restoration of glucose levels and triggering
of neuroglycopaenic symptoms during exercise, are reduced or absent.[186] The be-
havioural response is hence compromised with resulting failure to recognise symp-
toms and initiate rescue carbohydrate treatment. The beneficial effect of exercise
itself on peripheral insulin sensitivity also contributes to hypoglycaemia. The risk of
hypoglycaemia is even greater during pregnancy due to increased energy demands
placed by the foetus as well as the tighter glycaemic targets necessitated to avoid
hyperglycaemia-related adverse obstetric outcomes.
4.1.4.2 Exercise intensity
Low to moderate intensity exercise is associated with a greater risk of
hypoglycaemia.[187] More intense activity induces a rise in catecholamines, cortisol
and growth hormone, resulting in hyperglycaemia.[188] During recovery in healthy
individuals, catecholamine levels decrease and insulin secretion is increased, result-
ing in normalisation of glucose. In type 1 diabetes, the absence of a rise in endoge-
nous insulin secretion during recovery results in prolonged hyperglycaemia. The
hyperinsulinaemia may be mimicked with administration of a correction bolus,[189]
but a subsequent snack may be required to prevent later hypoglycaemia. Intermittent
84
4.1. BACKGROUND
high intensity exercise, compared with moderate intensity exercise alone, is associ-
ated with a lower rate of hypoglycaemia.[190] Inclusion of a ten second sprint has
been shown to limit the risk of post-exercise hypoglycaemia.[191]
4.1.4.3 Exercise timing
The scheduling of exercise in relation to timing of meals, insulin and other activity
has a significant influence on glycaemic outcomes. The risk of hypoglycaemia is
lower when exercise is carried out several hours after a meal, known as the post-
absorptive state.[192] Exercising prior to administration of insulin for breakfast may
provide added protection as circulating insulin levels are low, and liver and muscle
glycogen stores are replete. Compared with afternoon exercise, pre-breakfast exercise
in six subjects with type 1 diabetes was associated with higher glucose and cortisol
levels with a subsequent lower risk of hypoglycaemia.[193]
The glucose-lowering effects of exercise may persist for several hours, associated
with increased tissue insulin sensitivity and physiological repletion of depleted mus-
cle glycogen stores. Late afternoon exercise is associated with an increased risk
of nocturnal hypoglycaemia, as indicated by a biphasic increase in glucose utilisa-
tion at the end of exercise and again 7 − 11 hours later in adolescents with type
1 diabetes.[194] Late afternoon exercise in 50 youth with type 1 diabetes resulted in
lower mean overnight glucose of 7.3 mmol/l versus 8.6 mmol/l when no exercise was
performed.[195] Pre-exercise and pre-bedtime snack glucose levels were the strongest
predictors of hypoglycaemia risk.
4.1.4.4 Preceding exercise or hypoglycaemia
Repeated episodes of hypoglycaemia result in progressive blunting of the counter-
regulatory response causing a vicious cycle of recurrent hypoglycaemia, termed hy-
poglycaemia associated autonomic failure.[186] Glucagon, epinephrine and cortisol
responses were markedly reduced during exercise the day after two episodes of hy-
poglycaemia in 16 adults with type 1 diabetes.[196] A three-fold increased glucose
infusion rate was required to maintain euglycaemia. Post hoc analysis of the DCCT
cohort found that unusual physical activity was more frequent on days when severe
hypoglycaemia occurred although this association was not significant.[119] Prior ex-
ercise has also been shown to reduce the counter-regulatory response to subsequent
exercise with ensuing increased risk of hypoglycaemia.[197]
85
4.1. BACKGROUND
4.1.4.5 Managing glucose levels during exercise
Conventional strategies to avoid hypoglycaemia include adjusting insulin doses and/or
consuming additional carbohydrates before and after exercise. One recommendation
is consuming 15g carbohydrate prior and every 30− 60 minutes during exercise, with
larger quantities for more intense activity.[192] Excess carbohydrate supplementation
may lead to hyperglycaemia. Consumption of low glycaemic index compared with
high glycaemic index foods may provide more stable glucose levels.[198]
Reduction in insulin taken for meals, proportionate to exercise intensity and du-
ration, may lower the risk of hypoglycaemia.[199] Temporary suspension of basal
insulin pump therapy for exercise has been shown to reduce hypoglycaemia in chil-
dren with type 1 diabetes.[200; 201] The main risk is hyperglycaemia and ketoaci-
dosis, which may be further exacerbated by the metabolic changes associated with
exercise.[202] Reduction in pre-exercise prandial insulin of up to 75% did not result in
increased ketone body formation.[203] Discontinuation of CSII for three hours during
exercise resulted in an elevated but safe level of ketone body formation, compared
with no exercise.[204]
Insulin absorption from subcutaneous tissue may be increased during exercise.
Postulated mechanisms include increased local blood flow and/or mobilisation from
the subcutaneous depot due to a pumping effect of contracting muscles. Evidence
from studies conducted almost 30 years ago, demonstrated increased insulin concen-
trations with injection of insulin into exercising limbs.[205; 206] However, the older
insulin formulations and measurement methods employed in these studies limit ap-
plicability in current practice. There is minimal evidence regarding absorption of
insulin from CSII catheter site during exercise. Plasma insulin levels were observed
to increase at the end of 20 minutes of running on a treadmill, with a decrease to
baseline within 10 minutes in 12 CSII-treated adults.[207]
4.1.5 Glucose monitoring
Frequent monitoring of glucose is essential to maintaining tight glycaemic control
during pregnancy. HbA1c is usually measured at booking, 16 − 20 weeks and 28
weeks gestation. UK National Institute for Health and Clinical Excellence guidelines
recommend a preconception HbA1c as close to 6.1% as can be safely achieved with-
out increasing the risk of hypoglycaemia.[94] The DCCT showed a dose-dependent
relationship between HbA1c and adverse outcomes.[175] In another study, congen-
ital malformation and perinatal mortality rates were increased four and seven-fold,
86
4.2. RATIONALE
respectively, at HbA1c levels above 10.4%.[208] However, interpretation of HbA1c
is limited during pregnancy due to the dynamic changes that occur to red blood
cells, including increased cell turnover and erythropoietin levels, and the effects of
haemodilution with increasing gestation.[209] The 2005 Confidential Enquiry into
Maternal and Child Health report noted that 25% of women whose offspring had an
anomaly had achieved an HbA1c below 7% by 13 weeks gestation, suggesting that
‘near optimal’ glycaemic control at the end of the first trimester is already too late for
prevention of congenital anomalies.[210]
The emergence of CGM over the last decade has revolutionised the monitoring
of diabetes. Its use in pregnancy is especially valuable in detecting the dynamic glu-
cose excursions not apparent with conventional fingerprick glucose tests or HbA1c
monitoring.
4.1.6 Treatment
Insulin needs in diabetic pregnancy vary considerably, associated with increasing in-
sulin resistance as gestation progresses. In a study of 65 women with well controlled
type 1 diabetes, insulin doses ranged from 0.6 − 1.1 U/kg/day with a peak in week
nine, nadir in week 16, and greater peak in week 37.[211] The majority of women are
treated by multiple daily injection therapy. Insulin pumps or CSII may provide more
flexibility during pregnancy, when changing eating patterns, morning sickness, re-
duced exercise capacity and a growing foetus may variably affect glucose levels.[212]
Currently, CSII is only recommended for women inadequately controlled on multi-
ple daily injections or with severe hypoglycaemia. Both a meta-analysis [213] and
a Cochrane review [214] from 2007 found no difference in pregnancy outcomes and
glycaemic control between CSII and multiple daily injection therapy. The majority
of studies were observational with small numbers and evaluated the older soluble
insulins.
4.2 Rationale
Despite the recent availability of continuous glucose monitoring and ongoing refine-
ment of insulin replacement regimens, many women still fail to meet glucose targets
during pregnancy.[215] Optimal treatment of diabetes during pregnancy necessitates
avoidance of both hyperglycaemia and hypoglycaemia whilst maintaining glucose
levels within a narrow range. As a result of the changing insulin requirements during
87
4.3. AIM
pregnancy, frequent antenatal review and fine tuning of insulin regimens is essential
in order to optimise glucose control. This requires considerable allocation of time
and health care resources as well as patient motivation and co-operation.
A closed-loop system, which employs a computerised control algorithm to link
insulin delivery with CGM in real-time, may provide improved glycaemic control. A
feasibility study carried out in ten pregnant women with type 1 diabetes confirmed
safety of closed-loop insulin delivery with no hypoglycaemia events overnight.[108]
Postprandial control was more challenging, with 28 − 44% of time spent hypergly-
caemic after breakfast. Daytime glucose control requires consideration of carbohy-
drates consumed and physical activity performed. The feasibility study in pregnancy
was carried out during sedentary conditions, and hence did not include typical ‘real
life’ activities such as housework or exercise. Before proceeding to studies in the
home setting, it is essential to evaluate the closed-loop system during normal day-
time activities.
4.3 Aim
To evaluate the efficacy of closed-loop insulin delivery to maintain glucose levels
within target range (3.5 − 7.8 mmol/l), compared with conventional insulin pump
therapy, during normal daily activities in pregnant women with type 1 diabetes.
4.4 Methods
4.4.1 Participants
Between April 2010 and April 2011, 12 women with type 1 diabetes were recruited
from antenatal diabetes outpatient clinics at Addenbrooke’s Hospital, Cambridge,
and King’s Hospital, London. Inclusion criteria were age 16 to 44 years, type 1 dia-
betes (World Health Organisation criteria [2]) for at least 12 months, current insulin
pump therapy, and a viable singleton pregnancy confirmed by ultrasound. Subjects
were excluded if they had non-type 1 diabetes, any major conditions or concurrent
medications likely to interfere with interpretation of the study results, any clinically
significant diabetes-related complications or severe hypoglycaemia, poorly controlled
diabetes (HbA1c ≥ 10%), significant obesity (BMI > 35 kg/m2), insulin resistance
defined by total daily dose ≥ 1.5 U/kg at booking, or had conceived via in vitro
fertilisation or assisted reproductive techniques.
88
4.4. METHODS
4.4.2 Study design
The study had an open randomised crossover design. The protocol was approved by
the Cambridge Research Ethics Committee, and carried out in accordance with the
Declaration of Helsinki. Once written informed consent was obtained, participants
were randomised to attend the Wellcome Trust clinical research facility, Cambridge
for two 24-hour visits (closed-loop and control), one to six weeks apart. The study
protocol, which was matched on both visits, was designed to mimic a typical day at
home or work (Figure 4.1).
A continuous glucose sensor was inserted at least 24 hours prior to study vis-
its. Women were given basic training and instructions on insertion, calibrations and
alarms. On arrival for the study visit at midday, an intravenous cannula was in-
serted for blood sampling of glucose and insulin. Following a standardised light
lunch, a lightweight (10g) combined heart rate and accelerometer device (Actiheart,
Cam Ntech Ltd, Papworth, UK) was attached (Figure 4.2). The Actiheart was indi-
vidually calibrated at each study visit with a ramped step test which involved eight
minutes of stepping at progressively increasing frequency followed by two minutes
of recovery.[216]
The subject’s insulin pump was disconnected and the study pump (Animas 2020
Johnson & Johnson, New Jersey, USA), delivering rapid acting insulin analogue as-
part (Novo Nordisk, Bagsvaerd, Denmark), connected to the established subcuta-
neous insulin infusion site. On the closed-loop visit, insulin was delivered based on
the advice of a model predictive control algorithm tested in the previous feasibility
study in pregnancy,[108] from 14:00 until 12:30 the next day. The closed-loop system
was used in the manual mode. Versions 0.03.03 to 0.03.11 of the algorithm, which
is described in detail in Section 2.4.2, were used in the study. During closed-loop,
meals, moderate intensity exercise and hypoglycaemia requiring treatment with res-
cue carbohydrates were announced to the algorithm. Snacks were not announced
unless an accompanying insulin bolus was administered.
On the control visit, subjects continued their usual insulin pump regimen via the
study pump. Women did not have access to CGM and any adjustments, such as
setting a temporary basal rate for exercise or reducing the pre-exercise meal insulin
bolus, were made using fingerprick glucose measurements.
The study visit concluded at 12:30, with subjects consuming a lunch meal of their
choice prior to discharge home.
89
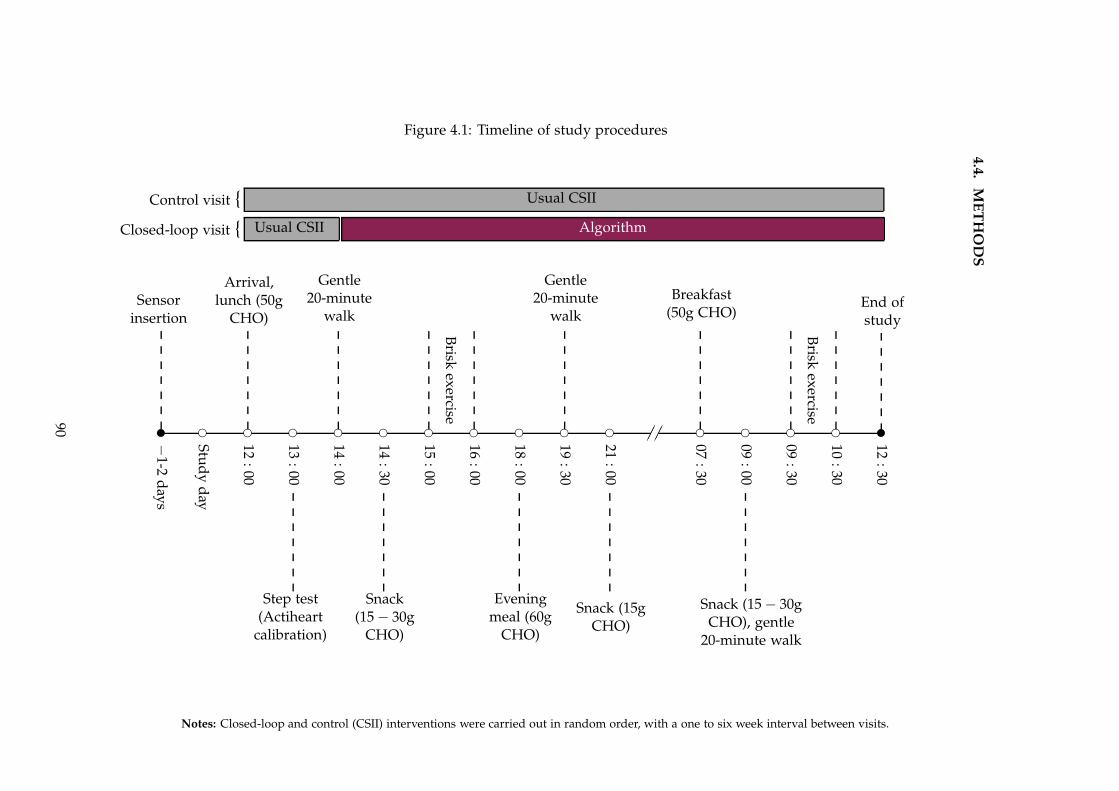
4.4
.M
ET
HO
DS
Figure 4.1: Timeline of study procedures
✉
−1-2
days
Sensorinsertion
❡
Stud
yd
ay
❡
12:00
Arrival,lunch (50g
CHO)
❡
13:00
Step test(Actiheart
calibration)
❡
14:00
Gentle20-minute
walk
❡
14:30
Snack(15 − 30g
CHO)
❡
15:00
Brisk
exercise
❡
16:00
❡
18:00
Eveningmeal (60g
CHO)
❡
19:30
Gentle20-minute
walk
❡
21:00
Snack (15gCHO)
✁✁✁✁❡
07:30
Breakfast(50g CHO)
❡
09:00
Snack (15 − 30gCHO), gentle
20-minute walk
❡
09:30
Brisk
exercise
❡
10:30
✉
12:30
End ofstudy
Usual CSII
Usual CSII Algorithm
Control visit {
Closed-loop visit {
Notes: Closed-loop and control (CSII) interventions were carried out in random order, with a one to six week interval between visits.
90
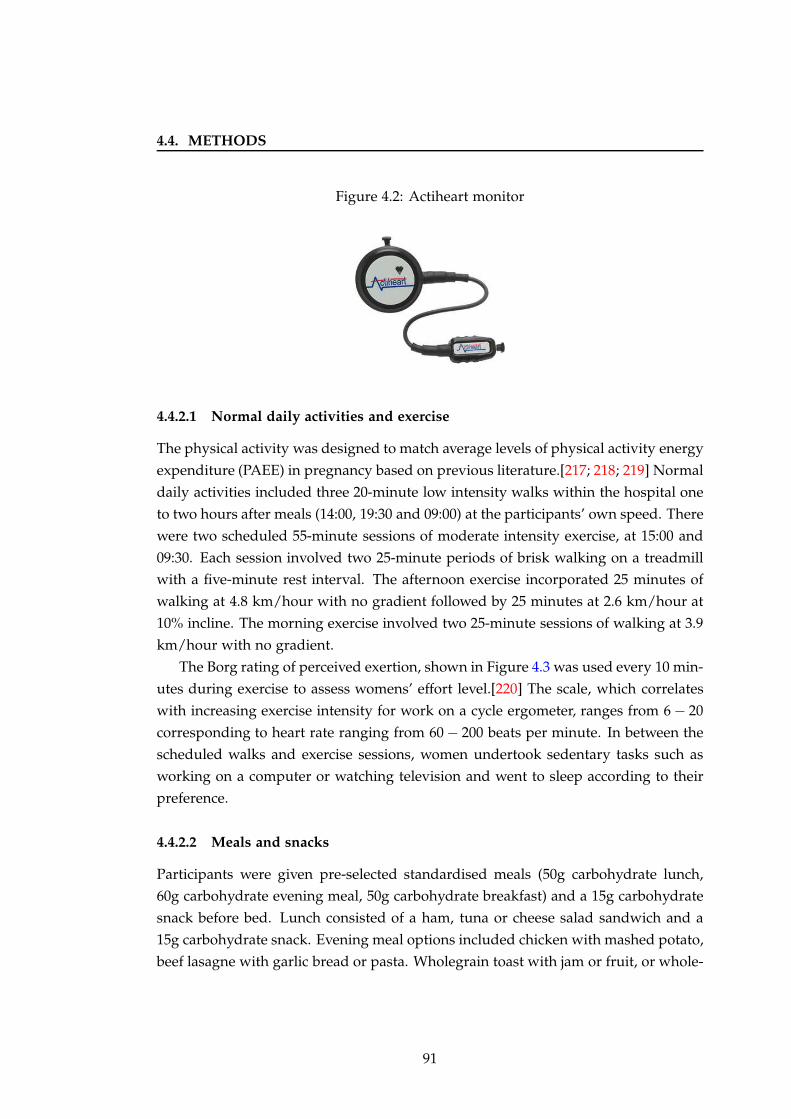
4.4. METHODS
Figure 4.2: Actiheart monitor
4.4.2.1 Normal daily activities and exercise
The physical activity was designed to match average levels of physical activity energy
expenditure (PAEE) in pregnancy based on previous literature.[217; 218; 219] Normal
daily activities included three 20-minute low intensity walks within the hospital one
to two hours after meals (14:00, 19:30 and 09:00) at the participants’ own speed. There
were two scheduled 55-minute sessions of moderate intensity exercise, at 15:00 and
09:30. Each session involved two 25-minute periods of brisk walking on a treadmill
with a five-minute rest interval. The afternoon exercise incorporated 25 minutes of
walking at 4.8 km/hour with no gradient followed by 25 minutes at 2.6 km/hour at
10% incline. The morning exercise involved two 25-minute sessions of walking at 3.9
km/hour with no gradient.
The Borg rating of perceived exertion, shown in Figure 4.3 was used every 10 min-
utes during exercise to assess womens’ effort level.[220] The scale, which correlates
with increasing exercise intensity for work on a cycle ergometer, ranges from 6 − 20
corresponding to heart rate ranging from 60 − 200 beats per minute. In between the
scheduled walks and exercise sessions, women undertook sedentary tasks such as
working on a computer or watching television and went to sleep according to their
preference.
4.4.2.2 Meals and snacks
Participants were given pre-selected standardised meals (50g carbohydrate lunch,
60g carbohydrate evening meal, 50g carbohydrate breakfast) and a 15g carbohydrate
snack before bed. Lunch consisted of a ham, tuna or cheese salad sandwich and a
15g carbohydrate snack. Evening meal options included chicken with mashed potato,
beef lasagne with garlic bread or pasta. Wholegrain toast with jam or fruit, or whole-
91
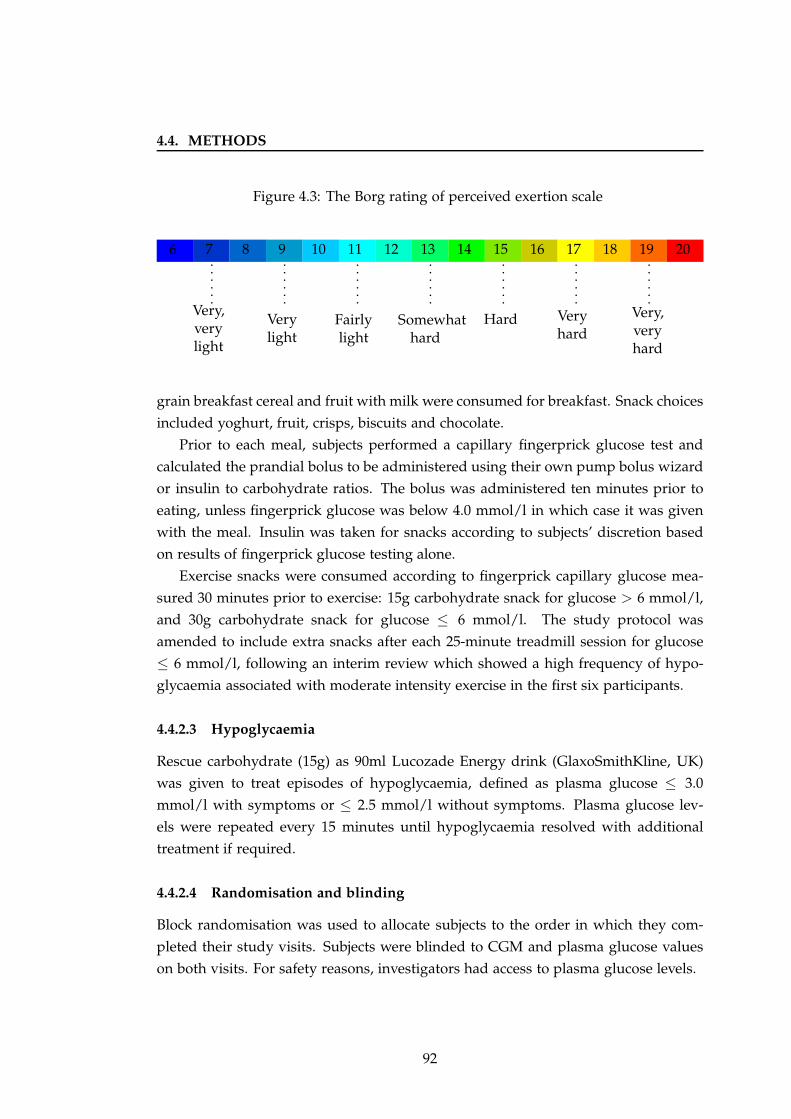
4.4. METHODS
Figure 4.3: The Borg rating of perceived exertion scale
6 7
Very,verylight
8 9
Verylight
10 11
Fairlylight
12 13
Somewhathard
14 15
Hard
16 17
Veryhard
18 19
Very,veryhard
20
grain breakfast cereal and fruit with milk were consumed for breakfast. Snack choices
included yoghurt, fruit, crisps, biscuits and chocolate.
Prior to each meal, subjects performed a capillary fingerprick glucose test and
calculated the prandial bolus to be administered using their own pump bolus wizard
or insulin to carbohydrate ratios. The bolus was administered ten minutes prior to
eating, unless fingerprick glucose was below 4.0 mmol/l in which case it was given
with the meal. Insulin was taken for snacks according to subjects’ discretion based
on results of fingerprick glucose testing alone.
Exercise snacks were consumed according to fingerprick capillary glucose mea-
sured 30 minutes prior to exercise: 15g carbohydrate snack for glucose > 6 mmol/l,
and 30g carbohydrate snack for glucose ≤ 6 mmol/l. The study protocol was
amended to include extra snacks after each 25-minute treadmill session for glucose
≤ 6 mmol/l, following an interim review which showed a high frequency of hypo-
glycaemia associated with moderate intensity exercise in the first six participants.
4.4.2.3 Hypoglycaemia
Rescue carbohydrate (15g) as 90ml Lucozade Energy drink (GlaxoSmithKline, UK)
was given to treat episodes of hypoglycaemia, defined as plasma glucose ≤ 3.0
mmol/l with symptoms or ≤ 2.5 mmol/l without symptoms. Plasma glucose lev-
els were repeated every 15 minutes until hypoglycaemia resolved with additional
treatment if required.
4.4.2.4 Randomisation and blinding
Block randomisation was used to allocate subjects to the order in which they com-
pleted their study visits. Subjects were blinded to CGM and plasma glucose values
on both visits. For safety reasons, investigators had access to plasma glucose levels.
92
4.4. METHODS
4.4.3 Measurements
4.4.3.1 Plasma glucose and insulin
Blood sampling for glucose and insulin was carried out at 15 and 30 minute intervals
from 14:00 until study end at 12:30 the following day. Whole blood samples were
immediately centrifuged, and plasma aliquoted into separate tubes. Plasma glucose
was measured in real-time on a YSI 2300 STAT Plus analyser (YSI, Fleet, UK). Plasma
insulin was stored frozen, for later analysis by immunochemiluminometric assay (In-
vitron Ltd, Monmouth, UK).
4.4.3.2 Continuous glucose monitor
The FreeStyle Navigator CGM (Abbott Diabetes Care, Alameda, CA, USA) with a
one hour run-in calibration period was used (Figure 1.1).
4.4.3.3 Physical activity energy expenditure (PAEE)
PAEE was measured using the Actiheart (Cam Ntech Ltd, Papworth, UK) device
consisting of two electrodes connected by a short lead which attach to the chest
surface via two electrocardiogram pads (Figure 4.2). It has been validated outside of
pregnancy, with reported intra-device coefficient of variation of 0.5% and 0.03% and
inter-device coefficient of variation of 5.7% and 0.03%, for movement and heart rate
respectively.[221] The device was set to record at 30-second epochs.
4.4.4 Statistical analysis
For this exploratory safety study, the sample size was pragmatic based on a previous
feasibility study of closed-loop in pregnant women with type 1 diabetes.[108]
The primary outcome was time spent with plasma glucose in the target range
(3.5 − 7.8 mmol/l), based on National Institute for Health and Clinical Excellence
guidelines for pregnancy,[94] from 14:00 on day one to 12:30 on day two.
Pre-defined secondary outcomes were time spent above (> 7.8 mmol/l and >
10.0 mmol/l) and below (≤ 3.5 mmol/l and ≤ 2.8 mmol/l) target, mean glucose
concentration, standard deviation of glucose, the low blood glucose index, mean
insulin infusion rate and plasma insulin concentration. Secondary outcomes were
calculated for both plasma and sensor glucose, for the following time periods:
93
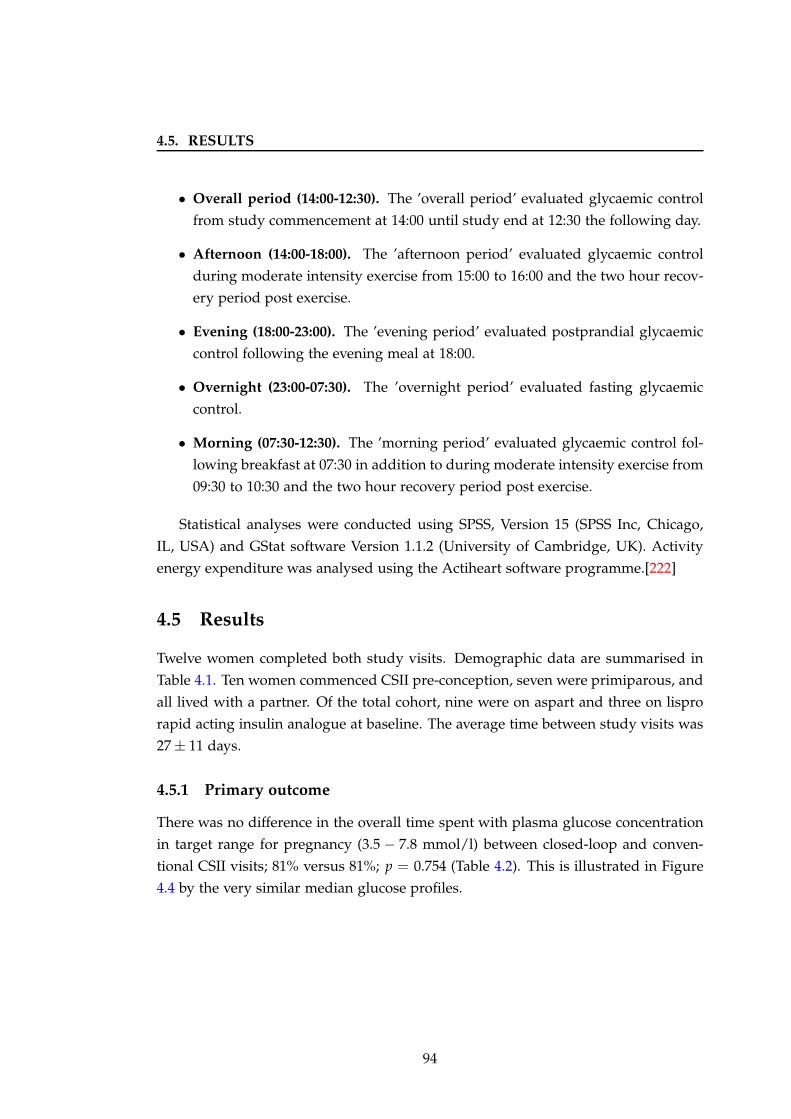
4.5. RESULTS
• Overall period (14:00-12:30). The ’overall period’ evaluated glycaemic control
from study commencement at 14:00 until study end at 12:30 the following day.
• Afternoon (14:00-18:00). The ’afternoon period’ evaluated glycaemic control
during moderate intensity exercise from 15:00 to 16:00 and the two hour recov-
ery period post exercise.
• Evening (18:00-23:00). The ’evening period’ evaluated postprandial glycaemic
control following the evening meal at 18:00.
• Overnight (23:00-07:30). The ’overnight period’ evaluated fasting glycaemic
control.
• Morning (07:30-12:30). The ’morning period’ evaluated glycaemic control fol-
lowing breakfast at 07:30 in addition to during moderate intensity exercise from
09:30 to 10:30 and the two hour recovery period post exercise.
Statistical analyses were conducted using SPSS, Version 15 (SPSS Inc, Chicago,
IL, USA) and GStat software Version 1.1.2 (University of Cambridge, UK). Activity
energy expenditure was analysed using the Actiheart software programme.[222]
4.5 Results
Twelve women completed both study visits. Demographic data are summarised in
Table 4.1. Ten women commenced CSII pre-conception, seven were primiparous, and
all lived with a partner. Of the total cohort, nine were on aspart and three on lispro
rapid acting insulin analogue at baseline. The average time between study visits was
27 ± 11 days.
4.5.1 Primary outcome
There was no difference in the overall time spent with plasma glucose concentration
in target range for pregnancy (3.5 − 7.8 mmol/l) between closed-loop and conven-
tional CSII visits; 81% versus 81%; p = 0.754 (Table 4.2). This is illustrated in Figure
4.4 by the very similar median glucose profiles.
94
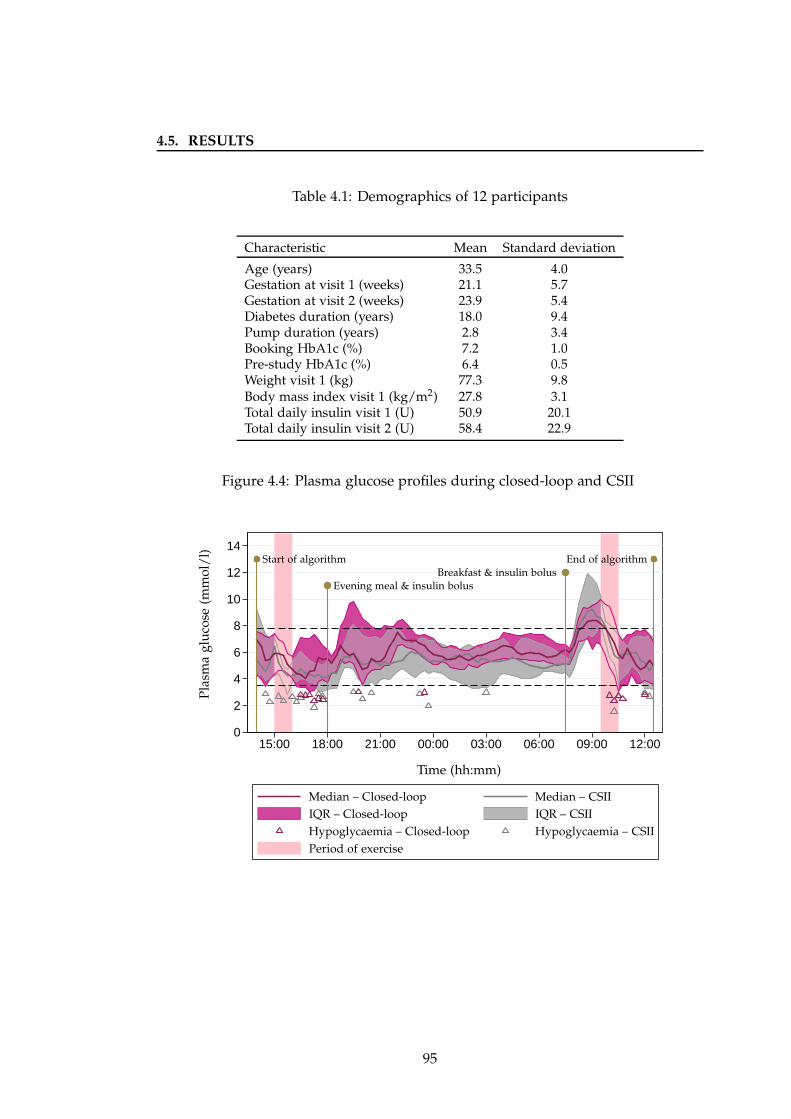
4.5. RESULTS
Table 4.1: Demographics of 12 participants
Characteristic Mean Standard deviation
Age (years) 33.5 4.0Gestation at visit 1 (weeks) 21.1 5.7Gestation at visit 2 (weeks) 23.9 5.4Diabetes duration (years) 18.0 9.4Pump duration (years) 2.8 3.4Booking HbA1c (%) 7.2 1.0Pre-study HbA1c (%) 6.4 0.5Weight visit 1 (kg) 77.3 9.8Body mass index visit 1 (kg/m2) 27.8 3.1Total daily insulin visit 1 (U) 50.9 20.1Total daily insulin visit 2 (U) 58.4 22.9
Figure 4.4: Plasma glucose profiles during closed-loop and CSII
0
2
4
6
8
10
12
14
15:00 18:00 21:00 00:00 03:00 06:00 09:00 12:00
Pla
sma
glu
cose
(mm
ol/
l)
Time (hh:mm)
Evening meal & insulin bolusBreakfast & insulin bolus
Start of algorithm End of algorithm
Median – Closed-loop Median – CSII
IQR – Closed-loop IQR – CSII
Hypoglycaemia – CSIIHypoglycaemia – Closed-loop
Period of exercise
95
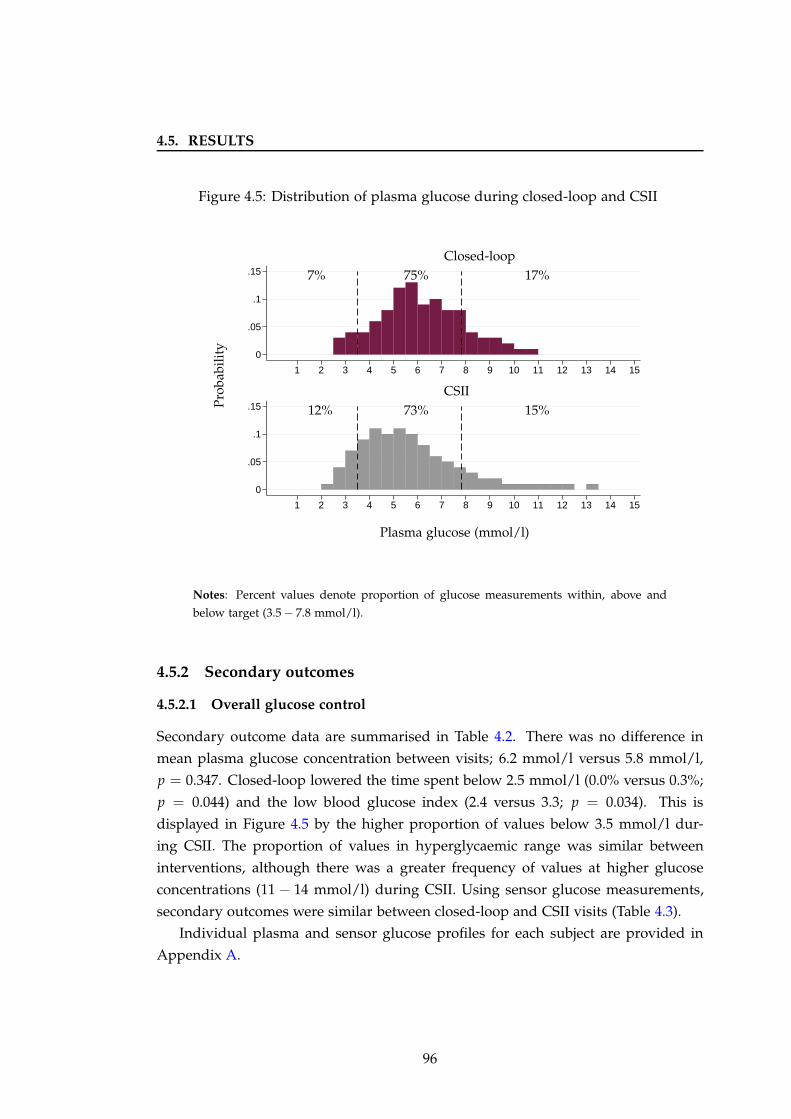
4.5. RESULTS
Figure 4.5: Distribution of plasma glucose during closed-loop and CSII
0
.05
.1
.15
0
.05
.1
.15
1 2 3 4 5 6 7 8 9 10 11 12 13 14 15
1 2 3 4 5 6 7 8 9 10 11 12 13 14 15
Plasma glucose (mmol/l)
CSII
Closed-loop
7% 75% 17%
12% 73% 15%Pro
babi
lity
Notes: Percent values denote proportion of glucose measurements within, above and
below target (3.5 − 7.8 mmol/l).
4.5.2 Secondary outcomes
4.5.2.1 Overall glucose control
Secondary outcome data are summarised in Table 4.2. There was no difference in
mean plasma glucose concentration between visits; 6.2 mmol/l versus 5.8 mmol/l,
p = 0.347. Closed-loop lowered the time spent below 2.5 mmol/l (0.0% versus 0.3%;
p = 0.044) and the low blood glucose index (2.4 versus 3.3; p = 0.034). This is
displayed in Figure 4.5 by the higher proportion of values below 3.5 mmol/l dur-
ing CSII. The proportion of values in hyperglycaemic range was similar between
interventions, although there was a greater frequency of values at higher glucose
concentrations (11 − 14 mmol/l) during CSII. Using sensor glucose measurements,
secondary outcomes were similar between closed-loop and CSII visits (Table 4.3).
Individual plasma and sensor glucose profiles for each subject are provided in
Appendix A.
96
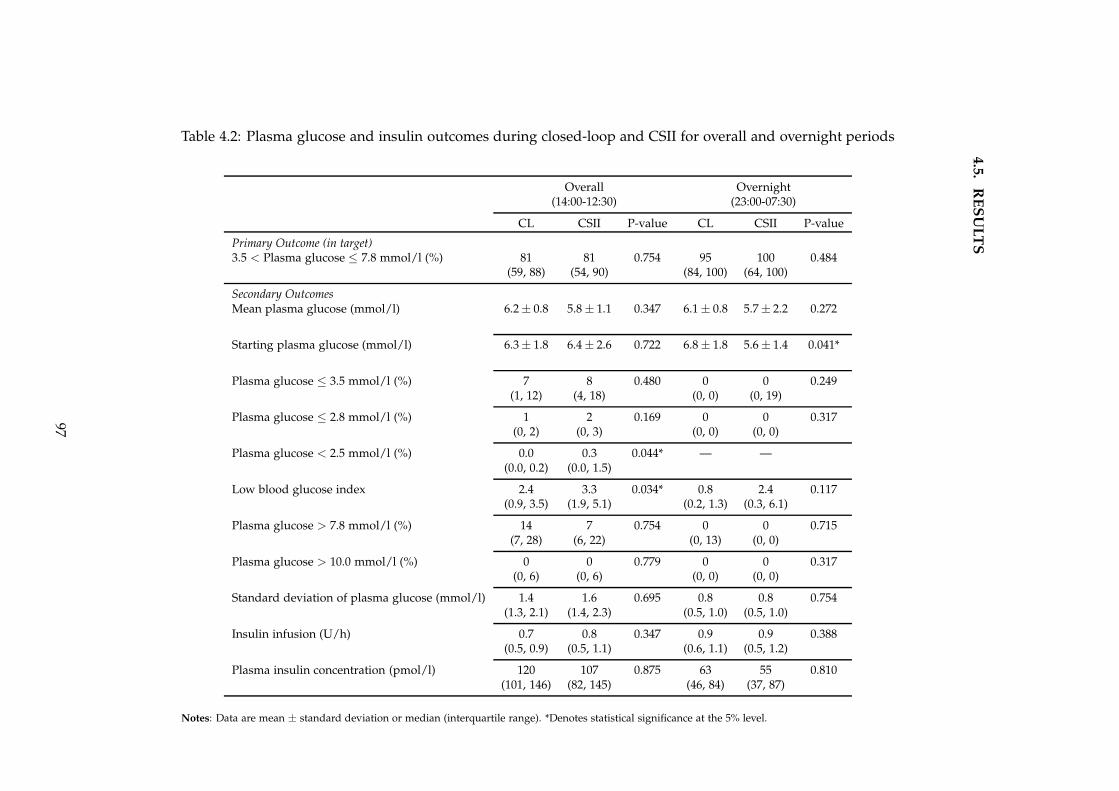
4.5
.R
ES
UL
TS
Table 4.2: Plasma glucose and insulin outcomes during closed-loop and CSII for overall and overnight periods
Overall Overnight(14:00-12:30) (23:00-07:30)
CL CSII P-value CL CSII P-value
Primary Outcome (in target)3.5 < Plasma glucose ≤ 7.8 mmol/l (%) 81 81 0.754 95 100 0.484
(59, 88) (54, 90) (84, 100) (64, 100)
Secondary OutcomesMean plasma glucose (mmol/l) 6.2 ± 0.8 5.8 ± 1.1 0.347 6.1 ± 0.8 5.7 ± 2.2 0.272
Starting plasma glucose (mmol/l) 6.3 ± 1.8 6.4 ± 2.6 0.722 6.8 ± 1.8 5.6 ± 1.4 0.041*
Plasma glucose ≤ 3.5 mmol/l (%) 7 8 0.480 0 0 0.249(1, 12) (4, 18) (0, 0) (0, 19)
Plasma glucose ≤ 2.8 mmol/l (%) 1 2 0.169 0 0 0.317(0, 2) (0, 3) (0, 0) (0, 0)
Plasma glucose < 2.5 mmol/l (%) 0.0 0.3 0.044* — —(0.0, 0.2) (0.0, 1.5)
Low blood glucose index 2.4 3.3 0.034* 0.8 2.4 0.117(0.9, 3.5) (1.9, 5.1) (0.2, 1.3) (0.3, 6.1)
Plasma glucose > 7.8 mmol/l (%) 14 7 0.754 0 0 0.715(7, 28) (6, 22) (0, 13) (0, 0)
Plasma glucose > 10.0 mmol/l (%) 0 0 0.779 0 0 0.317(0, 6) (0, 6) (0, 0) (0, 0)
Standard deviation of plasma glucose (mmol/l) 1.4 1.6 0.695 0.8 0.8 0.754(1.3, 2.1) (1.4, 2.3) (0.5, 1.0) (0.5, 1.0)
Insulin infusion (U/h) 0.7 0.8 0.347 0.9 0.9 0.388(0.5, 0.9) (0.5, 1.1) (0.6, 1.1) (0.5, 1.2)
Plasma insulin concentration (pmol/l) 120 107 0.875 63 55 0.810(101, 146) (82, 145) (46, 84) (37, 87)
Notes: Data are mean ± standard deviation or median (interquartile range). *Denotes statistical significance at the 5% level.
97
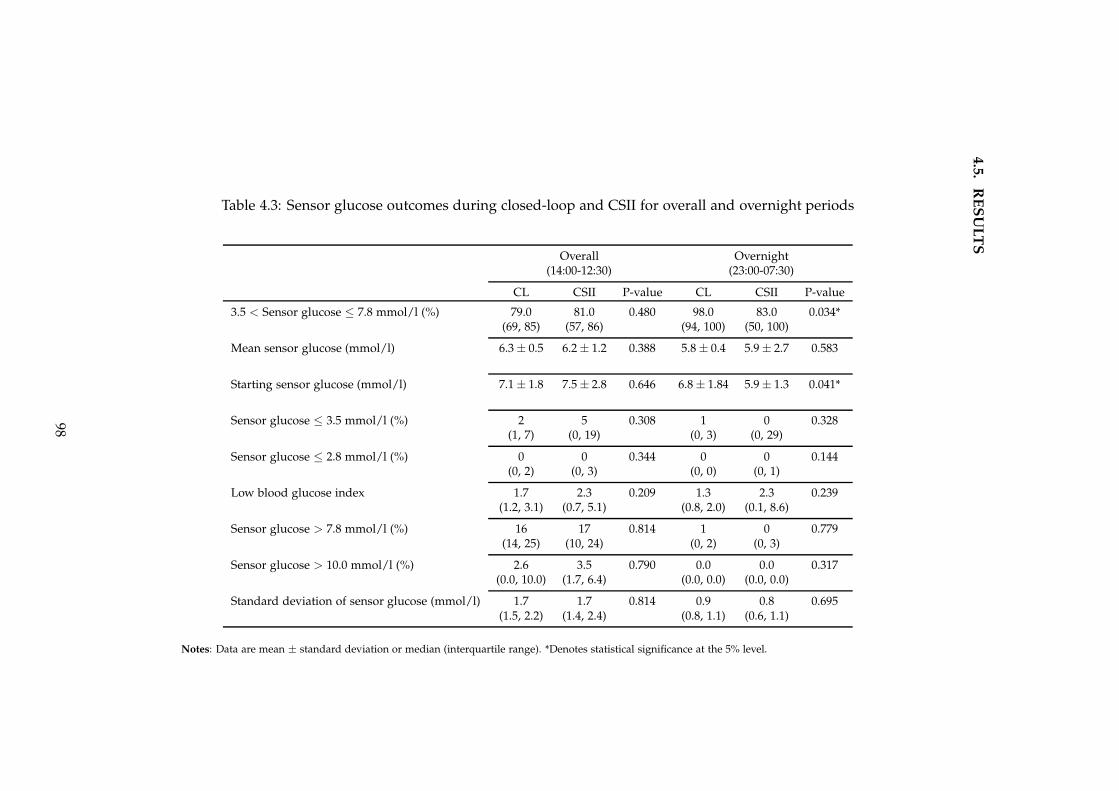
4.5
.R
ES
UL
TS
Table 4.3: Sensor glucose outcomes during closed-loop and CSII for overall and overnight periods
Overall Overnight(14:00-12:30) (23:00-07:30)
CL CSII P-value CL CSII P-value
3.5 < Sensor glucose ≤ 7.8 mmol/l (%) 79.0 81.0 0.480 98.0 83.0 0.034*(69, 85) (57, 86) (94, 100) (50, 100)
Mean sensor glucose (mmol/l) 6.3 ± 0.5 6.2 ± 1.2 0.388 5.8 ± 0.4 5.9 ± 2.7 0.583
Starting sensor glucose (mmol/l) 7.1 ± 1.8 7.5 ± 2.8 0.646 6.8 ± 1.84 5.9 ± 1.3 0.041*
Sensor glucose ≤ 3.5 mmol/l (%) 2 5 0.308 1 0 0.328(1, 7) (0, 19) (0, 3) (0, 29)
Sensor glucose ≤ 2.8 mmol/l (%) 0 0 0.344 0 0 0.144(0, 2) (0, 3) (0, 0) (0, 1)
Low blood glucose index 1.7 2.3 0.209 1.3 2.3 0.239(1.2, 3.1) (0.7, 5.1) (0.8, 2.0) (0.1, 8.6)
Sensor glucose > 7.8 mmol/l (%) 16 17 0.814 1 0 0.779(14, 25) (10, 24) (0, 2) (0, 3)
Sensor glucose > 10.0 mmol/l (%) 2.6 3.5 0.790 0.0 0.0 0.317(0.0, 10.0) (1.7, 6.4) (0.0, 0.0) (0.0, 0.0)
Standard deviation of sensor glucose (mmol/l) 1.7 1.7 0.814 0.9 0.8 0.695(1.5, 2.2) (1.4, 2.4) (0.8, 1.1) (0.6, 1.1)
Notes: Data are mean ± standard deviation or median (interquartile range). *Denotes statistical significance at the 5% level.
98
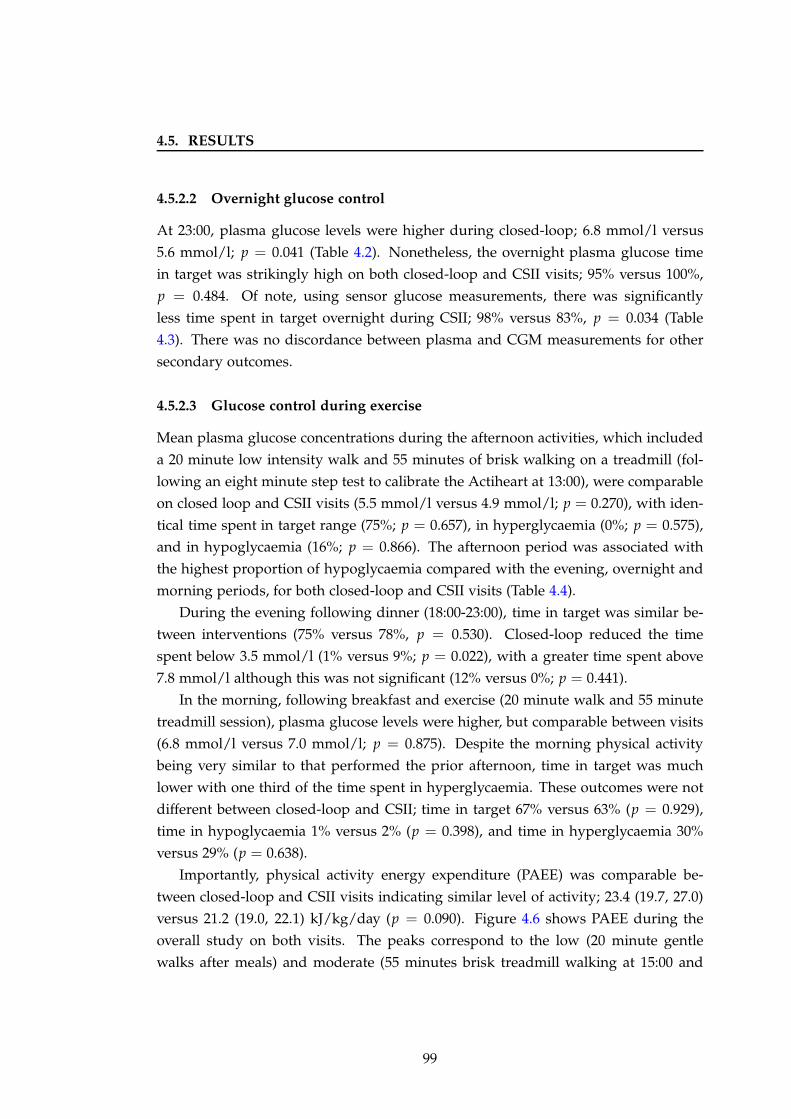
4.5. RESULTS
4.5.2.2 Overnight glucose control
At 23:00, plasma glucose levels were higher during closed-loop; 6.8 mmol/l versus
5.6 mmol/l; p = 0.041 (Table 4.2). Nonetheless, the overnight plasma glucose time
in target was strikingly high on both closed-loop and CSII visits; 95% versus 100%,
p = 0.484. Of note, using sensor glucose measurements, there was significantly
less time spent in target overnight during CSII; 98% versus 83%, p = 0.034 (Table
4.3). There was no discordance between plasma and CGM measurements for other
secondary outcomes.
4.5.2.3 Glucose control during exercise
Mean plasma glucose concentrations during the afternoon activities, which included
a 20 minute low intensity walk and 55 minutes of brisk walking on a treadmill (fol-
lowing an eight minute step test to calibrate the Actiheart at 13:00), were comparable
on closed loop and CSII visits (5.5 mmol/l versus 4.9 mmol/l; p = 0.270), with iden-
tical time spent in target range (75%; p = 0.657), in hyperglycaemia (0%; p = 0.575),
and in hypoglycaemia (16%; p = 0.866). The afternoon period was associated with
the highest proportion of hypoglycaemia compared with the evening, overnight and
morning periods, for both closed-loop and CSII visits (Table 4.4).
During the evening following dinner (18:00-23:00), time in target was similar be-
tween interventions (75% versus 78%, p = 0.530). Closed-loop reduced the time
spent below 3.5 mmol/l (1% versus 9%; p = 0.022), with a greater time spent above
7.8 mmol/l although this was not significant (12% versus 0%; p = 0.441).
In the morning, following breakfast and exercise (20 minute walk and 55 minute
treadmill session), plasma glucose levels were higher, but comparable between visits
(6.8 mmol/l versus 7.0 mmol/l; p = 0.875). Despite the morning physical activity
being very similar to that performed the prior afternoon, time in target was much
lower with one third of the time spent in hyperglycaemia. These outcomes were not
different between closed-loop and CSII; time in target 67% versus 63% (p = 0.929),
time in hypoglycaemia 1% versus 2% (p = 0.398), and time in hyperglycaemia 30%
versus 29% (p = 0.638).
Importantly, physical activity energy expenditure (PAEE) was comparable be-
tween closed-loop and CSII visits indicating similar level of activity; 23.4 (19.7, 27.0)
versus 21.2 (19.0, 22.1) kJ/kg/day (p = 0.090). Figure 4.6 shows PAEE during the
overall study on both visits. The peaks correspond to the low (20 minute gentle
walks after meals) and moderate (55 minutes brisk treadmill walking at 15:00 and
99
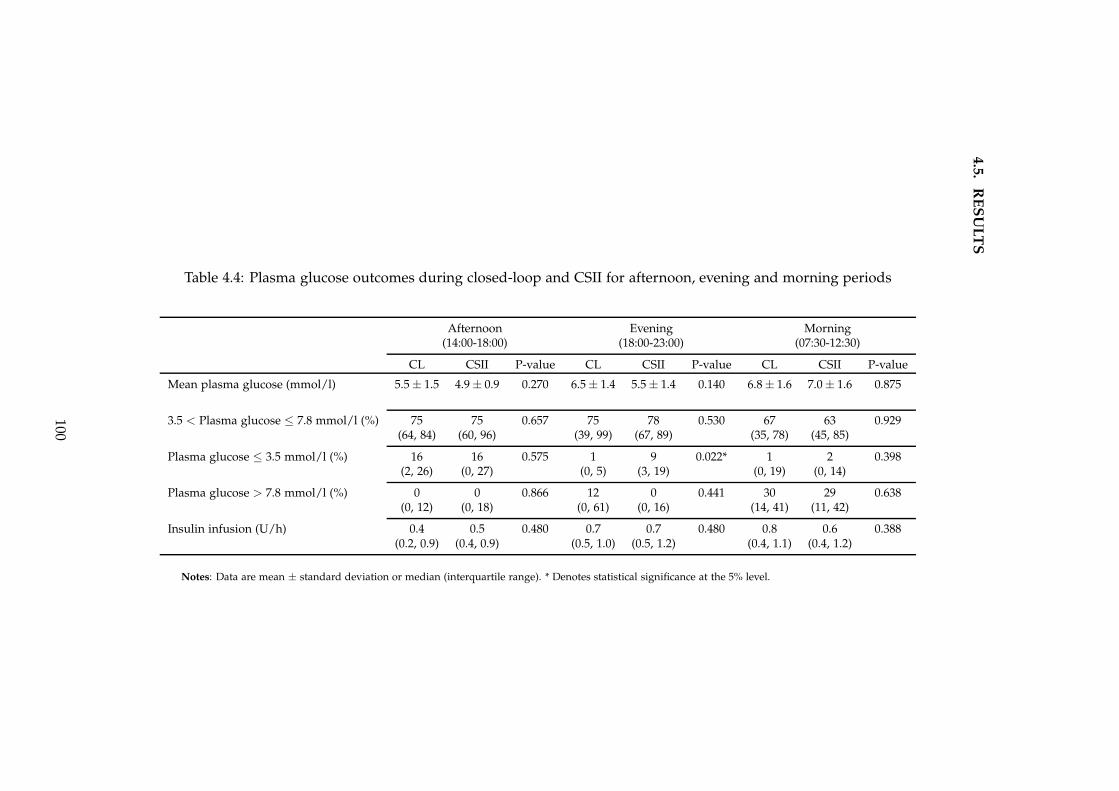
4.5
.R
ES
UL
TS
Table 4.4: Plasma glucose outcomes during closed-loop and CSII for afternoon, evening and morning periods
Afternoon Evening Morning(14:00-18:00) (18:00-23:00) (07:30-12:30)
CL CSII P-value CL CSII P-value CL CSII P-value
Mean plasma glucose (mmol/l) 5.5 ± 1.5 4.9 ± 0.9 0.270 6.5 ± 1.4 5.5 ± 1.4 0.140 6.8 ± 1.6 7.0 ± 1.6 0.875
3.5 < Plasma glucose ≤ 7.8 mmol/l (%) 75 75 0.657 75 78 0.530 67 63 0.929(64, 84) (60, 96) (39, 99) (67, 89) (35, 78) (45, 85)
Plasma glucose ≤ 3.5 mmol/l (%) 16 16 0.575 1 9 0.022* 1 2 0.398(2, 26) (0, 27) (0, 5) (3, 19) (0, 19) (0, 14)
Plasma glucose > 7.8 mmol/l (%) 0 0 0.866 12 0 0.441 30 29 0.638(0, 12) (0, 18) (0, 61) (0, 16) (14, 41) (11, 42)
Insulin infusion (U/h) 0.4 0.5 0.480 0.7 0.7 0.480 0.8 0.6 0.388(0.2, 0.9) (0.4, 0.9) (0.5, 1.0) (0.5, 1.2) (0.4, 1.1) (0.4, 1.2)
Notes: Data are mean ± standard deviation or median (interquartile range). * Denotes statistical significance at the 5% level.
100
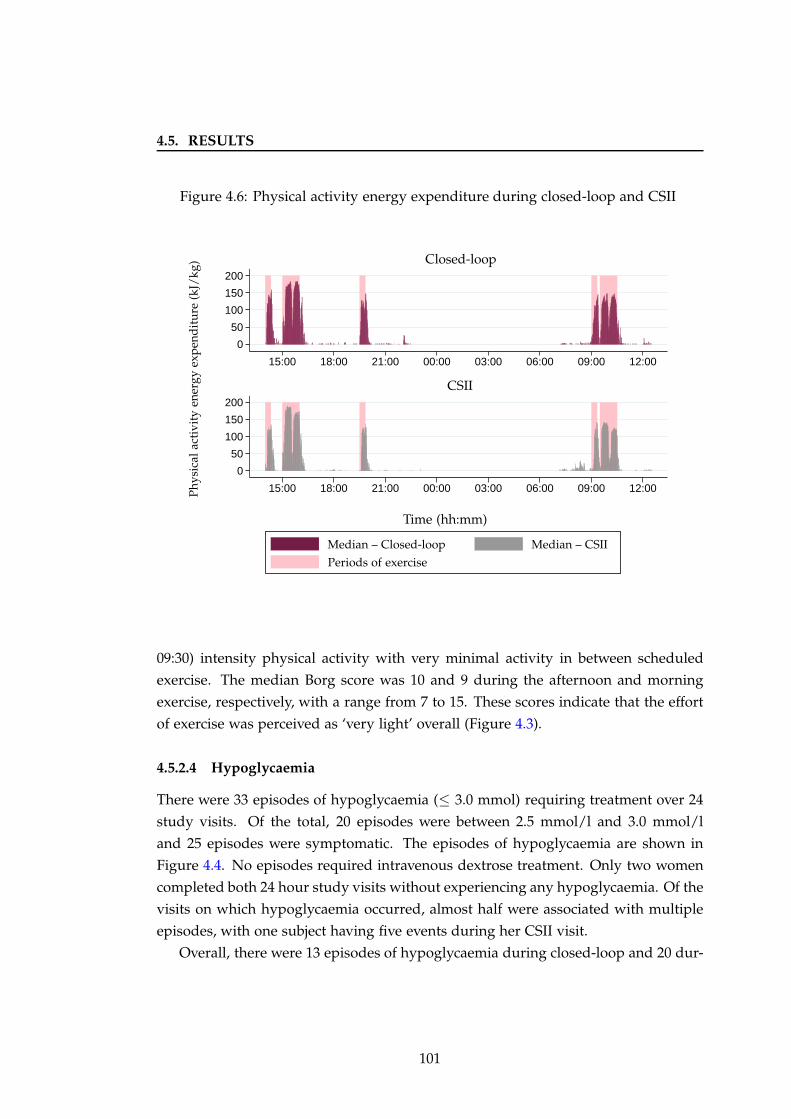
4.5. RESULTS
Figure 4.6: Physical activity energy expenditure during closed-loop and CSII
0
50
100
150
200
0
50
100
150
200
15:00 18:00 21:00 00:00 03:00 06:00 09:00 12:00
15:00 18:00 21:00 00:00 03:00 06:00 09:00 12:00
CSII
Closed-loop
Time (hh:mm)
Phy
sica
lac
tivi
tyen
ergy
exp
end
itu
re(k
J/kg
)
Median – Closed-loop Median – CSII
Periods of exercise
09:30) intensity physical activity with very minimal activity in between scheduled
exercise. The median Borg score was 10 and 9 during the afternoon and morning
exercise, respectively, with a range from 7 to 15. These scores indicate that the effort
of exercise was perceived as ‘very light’ overall (Figure 4.3).
4.5.2.4 Hypoglycaemia
There were 33 episodes of hypoglycaemia (≤ 3.0 mmol) requiring treatment over 24
study visits. Of the total, 20 episodes were between 2.5 mmol/l and 3.0 mmol/l
and 25 episodes were symptomatic. The episodes of hypoglycaemia are shown in
Figure 4.4. No episodes required intravenous dextrose treatment. Only two women
completed both 24 hour study visits without experiencing any hypoglycaemia. Of the
visits on which hypoglycaemia occurred, almost half were associated with multiple
episodes, with one subject having five events during her CSII visit.
Overall, there were 13 episodes of hypoglycaemia during closed-loop and 20 dur-
101
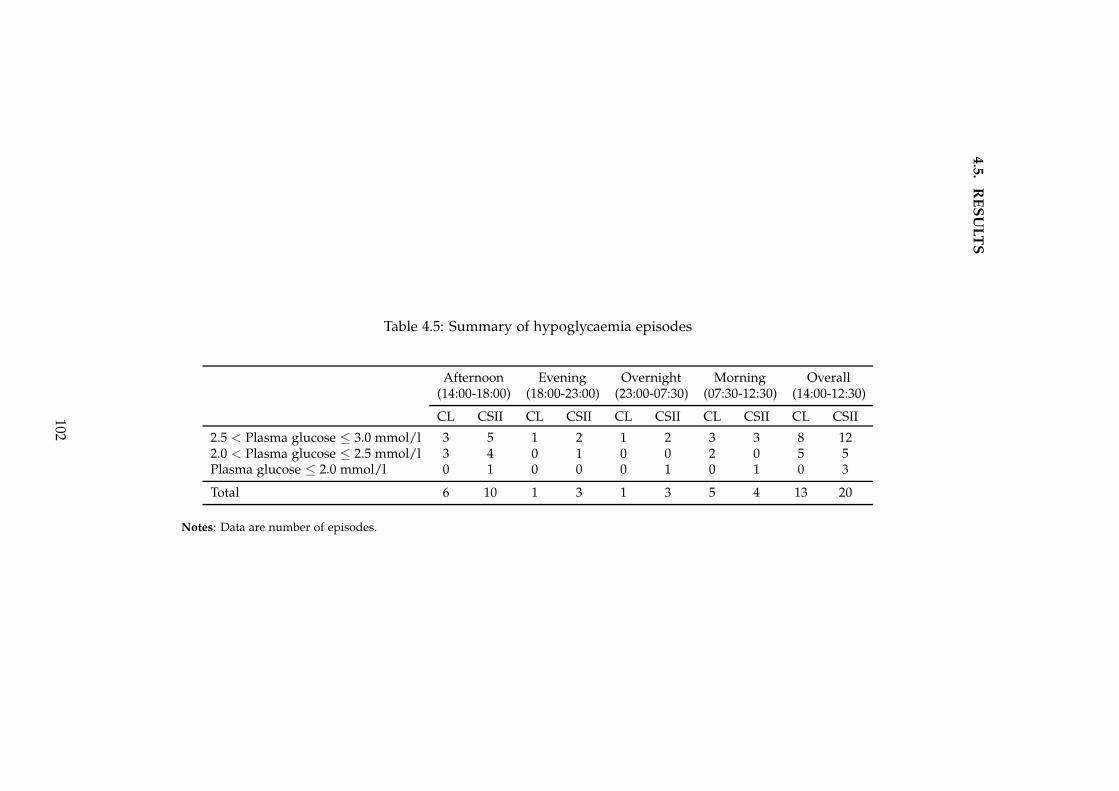
4.5
.R
ES
UL
TS
Table 4.5: Summary of hypoglycaemia episodes
Afternoon Evening Overnight Morning Overall(14:00-18:00) (18:00-23:00) (23:00-07:30) (07:30-12:30) (14:00-12:30)
CL CSII CL CSII CL CSII CL CSII CL CSII
2.5 < Plasma glucose ≤ 3.0 mmol/l 3 5 1 2 1 2 3 3 8 122.0 < Plasma glucose ≤ 2.5 mmol/l 3 4 0 1 0 0 2 0 5 5Plasma glucose ≤ 2.0 mmol/l 0 1 0 0 0 1 0 1 0 3
Total 6 10 1 3 1 3 5 4 13 20
Notes: Data are number of episodes.
102
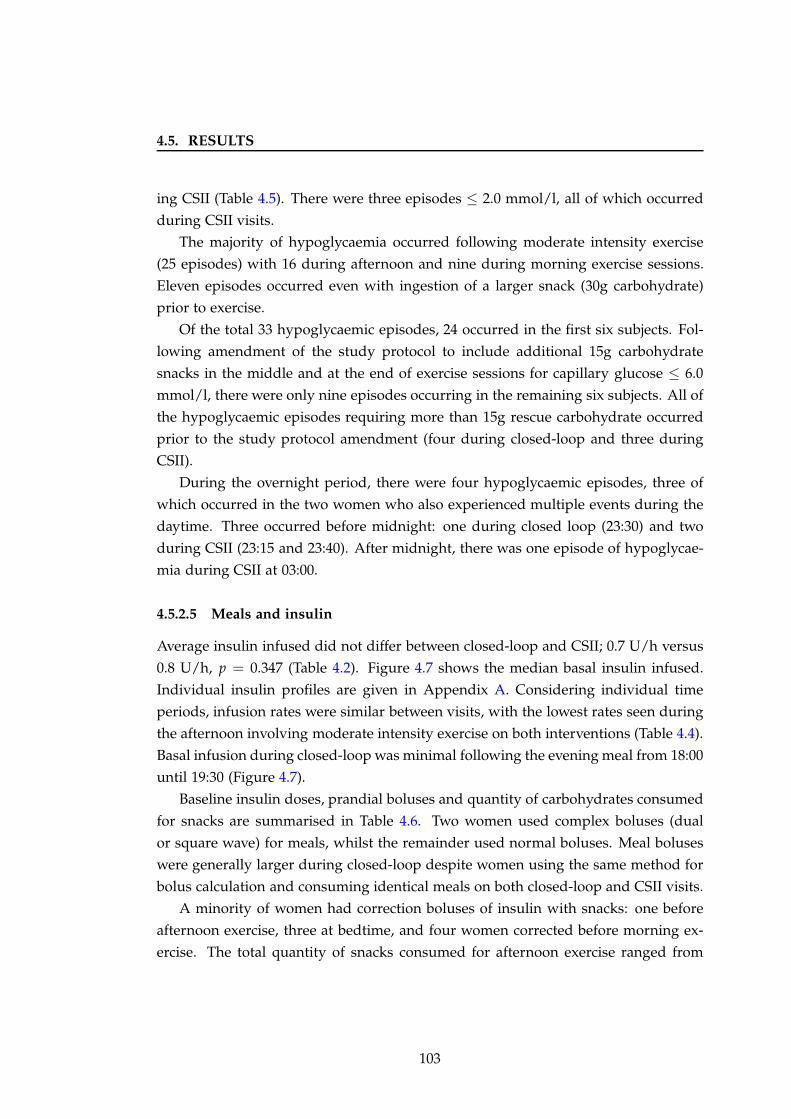
4.5. RESULTS
ing CSII (Table 4.5). There were three episodes ≤ 2.0 mmol/l, all of which occurred
during CSII visits.
The majority of hypoglycaemia occurred following moderate intensity exercise
(25 episodes) with 16 during afternoon and nine during morning exercise sessions.
Eleven episodes occurred even with ingestion of a larger snack (30g carbohydrate)
prior to exercise.
Of the total 33 hypoglycaemic episodes, 24 occurred in the first six subjects. Fol-
lowing amendment of the study protocol to include additional 15g carbohydrate
snacks in the middle and at the end of exercise sessions for capillary glucose ≤ 6.0
mmol/l, there were only nine episodes occurring in the remaining six subjects. All of
the hypoglycaemic episodes requiring more than 15g rescue carbohydrate occurred
prior to the study protocol amendment (four during closed-loop and three during
CSII).
During the overnight period, there were four hypoglycaemic episodes, three of
which occurred in the two women who also experienced multiple events during the
daytime. Three occurred before midnight: one during closed loop (23:30) and two
during CSII (23:15 and 23:40). After midnight, there was one episode of hypoglycae-
mia during CSII at 03:00.
4.5.2.5 Meals and insulin
Average insulin infused did not differ between closed-loop and CSII; 0.7 U/h versus
0.8 U/h, p = 0.347 (Table 4.2). Figure 4.7 shows the median basal insulin infused.
Individual insulin profiles are given in Appendix A. Considering individual time
periods, infusion rates were similar between visits, with the lowest rates seen during
the afternoon involving moderate intensity exercise on both interventions (Table 4.4).
Basal infusion during closed-loop was minimal following the evening meal from 18:00
until 19:30 (Figure 4.7).
Baseline insulin doses, prandial boluses and quantity of carbohydrates consumed
for snacks are summarised in Table 4.6. Two women used complex boluses (dual
or square wave) for meals, whilst the remainder used normal boluses. Meal boluses
were generally larger during closed-loop despite women using the same method for
bolus calculation and consuming identical meals on both closed-loop and CSII visits.
A minority of women had correction boluses of insulin with snacks: one before
afternoon exercise, three at bedtime, and four women corrected before morning ex-
ercise. The total quantity of snacks consumed for afternoon exercise ranged from
103
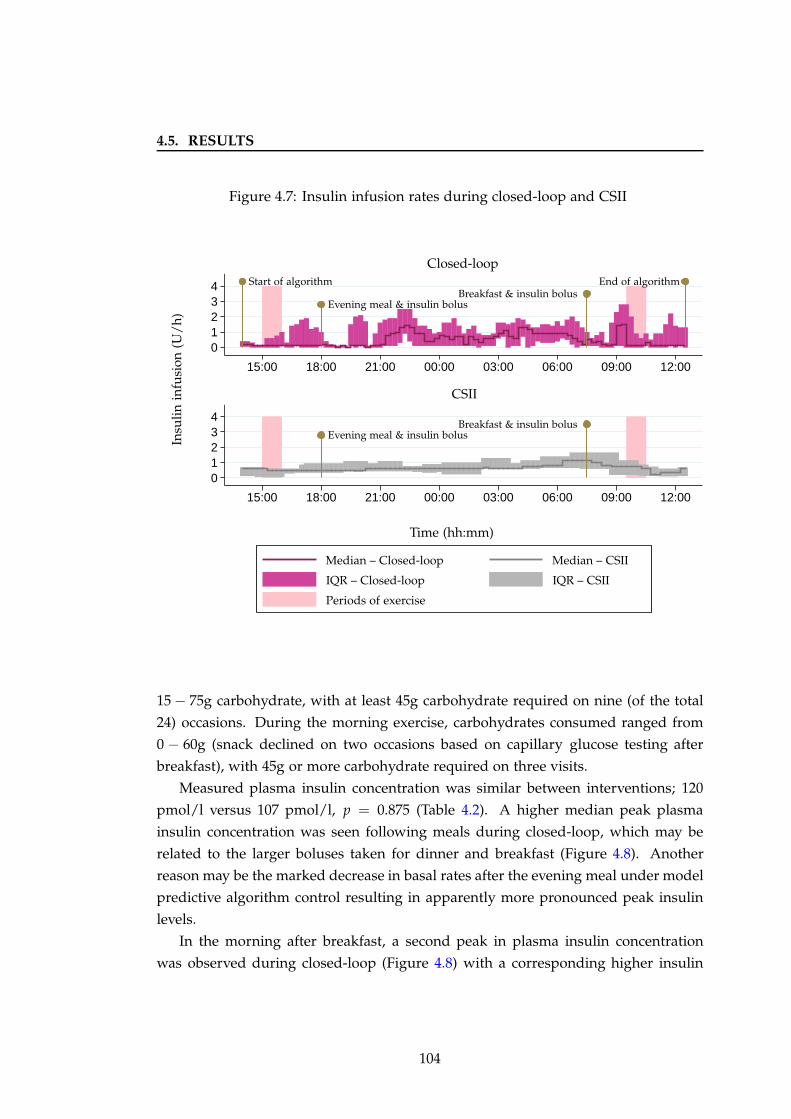
4.5. RESULTS
Figure 4.7: Insulin infusion rates during closed-loop and CSII
01234
01234
15:00 18:00 21:00 00:00 03:00 06:00 09:00 12:00
15:00 18:00 21:00 00:00 03:00 06:00 09:00 12:00
CSII
Closed-loop
Insu
lin
infu
sion
(U/
h)
Time (hh:mm)
Evening meal & insulin bolus
Evening meal & insulin bolus
Breakfast & insulin bolus
Breakfast & insulin bolusStart of algorithm End of algorithm
Median – Closed-loop Median – CSII
IQR – Closed-loop IQR – CSII
Periods of exercise
15 − 75g carbohydrate, with at least 45g carbohydrate required on nine (of the total
24) occasions. During the morning exercise, carbohydrates consumed ranged from
0 − 60g (snack declined on two occasions based on capillary glucose testing after
breakfast), with 45g or more carbohydrate required on three visits.
Measured plasma insulin concentration was similar between interventions; 120
pmol/l versus 107 pmol/l, p = 0.875 (Table 4.2). A higher median peak plasma
insulin concentration was seen following meals during closed-loop, which may be
related to the larger boluses taken for dinner and breakfast (Figure 4.8). Another
reason may be the marked decrease in basal rates after the evening meal under model
predictive algorithm control resulting in apparently more pronounced peak insulin
levels.
In the morning after breakfast, a second peak in plasma insulin concentration
was observed during closed-loop (Figure 4.8) with a corresponding higher insulin
104
4.5. RESULTS
Table 4.6: Summary of insulin amounts and carbohydrates consumed
Closed-loop CSII
Median IQR Median IQR
Pre-studyTotal daily insulin (U) 53.2 (35.4, 73.4) 54.1 (33.7, 70.9)Total daily bolus (U) 31.2 (24.0, 39.6) 24.9 (23.1, 49.3)Total daily basal (U) 20.1 (15.6, 29.8) 17.8 (13.8, 20.3)Total daily insulin/kg (U) 0.7 (0.5, 0.9) 0.7 (0.5, 0.9)
During studyLunch carbohydrate (g)a 50 50Lunch bolus (U) 7.2 (5.0, 10.8) 6.5 (4.9, 10.0)Afternoon snack carbohydrate (g)b 30 (30, 58) 32 (16, 60)Afternoon snack bolus (U) 0.0 (0.0, 0.0) 0.0 (0.0, 0.0)Dinner carbohydrate (g)a 60 60Dinner bolus (U) 8.6 (5.6, 11.5) 7.1 (4.7, 11.1)Bedtime snack carbohydrate (g)b 15 15Bedtime snack bolus (U) 0.0 (0.0, 0.4) 0.0 (0.0, 1.1)Breakfast carbohydrate (g)a 50 50Breakfast bolus (U) 8.0 (5.7, 10.6) 6.3 (3.8, 8.9)Morning snack carbohydrate (g)b 15 (15, 18) 15 (15, 30)Morning snack bolus (U) 0.0 (0.0, 0.0) 0.5 (0.0, 2.1)
Notes: a Size of meal identical across subjects, on closed-loop and CSII visits; b size of
snack varied according to capillary glucose readings prior to, and during, exercise.
delivery (Figure 4.7), most likely due to rising glucose following the pre-exercise
snack. Importantly, this increased insulin delivery was not associated with a greater
risk of hypoglycaemia post exercise (Table 4.5). Additionally, no correction boluses
were required on closed-loop compared with 0.5U on CSII (Table 4.6).
4.5.3 Sensor accuracy
The median relative absolute difference between the FreeStyle Navigator (Abbott Di-
abetes Care, Alameda, CA, USA) sensor and reference plasma glucose measurements
was 13.3%. This is higher than previously reported in a closed-loop study in pregnant
women with type 1 diabetes carried out under sedentary conditions (11.4%),[108] and
is most likely related to daytime glucose fluxes with meals and physical activity. The
Clarke error grid analysis in Figure 4.9 illustrates the relationship between sensor
and reference glucose values, showing the majority of values in zones A and B, with
105
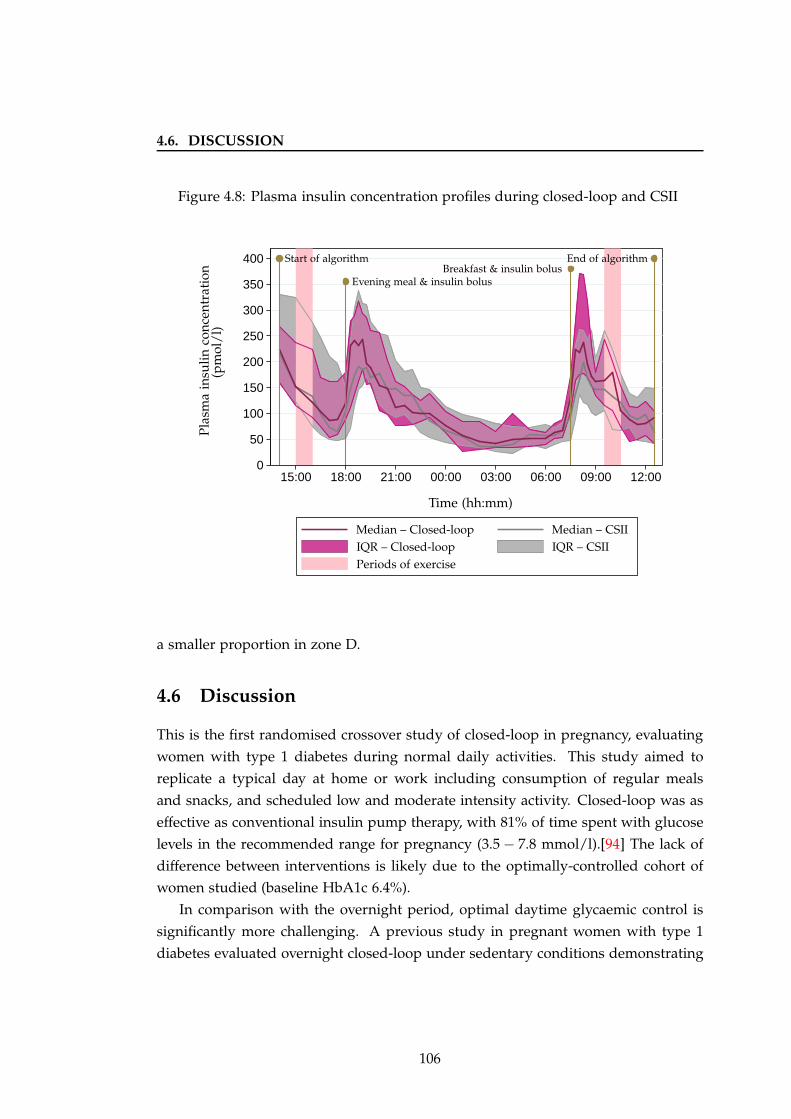
4.6. DISCUSSION
Figure 4.8: Plasma insulin concentration profiles during closed-loop and CSII
0
50
100
150
200
250
300
350
400
15:00 18:00 21:00 00:00 03:00 06:00 09:00 12:00
Pla
sma
insu
lin
con
cen
trat
ion
(pm
ol/
l)
Time (hh:mm)
Evening meal & insulin bolusBreakfast & insulin bolus
Start of algorithm End of algorithm
Median – Closed-loop Median – CSII
IQR – Closed-loop IQR – CSII
Periods of exercise
a smaller proportion in zone D.
4.6 Discussion
This is the first randomised crossover study of closed-loop in pregnancy, evaluating
women with type 1 diabetes during normal daily activities. This study aimed to
replicate a typical day at home or work including consumption of regular meals
and snacks, and scheduled low and moderate intensity activity. Closed-loop was as
effective as conventional insulin pump therapy, with 81% of time spent with glucose
levels in the recommended range for pregnancy (3.5 − 7.8 mmol/l).[94] The lack of
difference between interventions is likely due to the optimally-controlled cohort of
women studied (baseline HbA1c 6.4%).
In comparison with the overnight period, optimal daytime glycaemic control is
significantly more challenging. A previous study in pregnant women with type 1
diabetes evaluated overnight closed-loop under sedentary conditions demonstrating
106
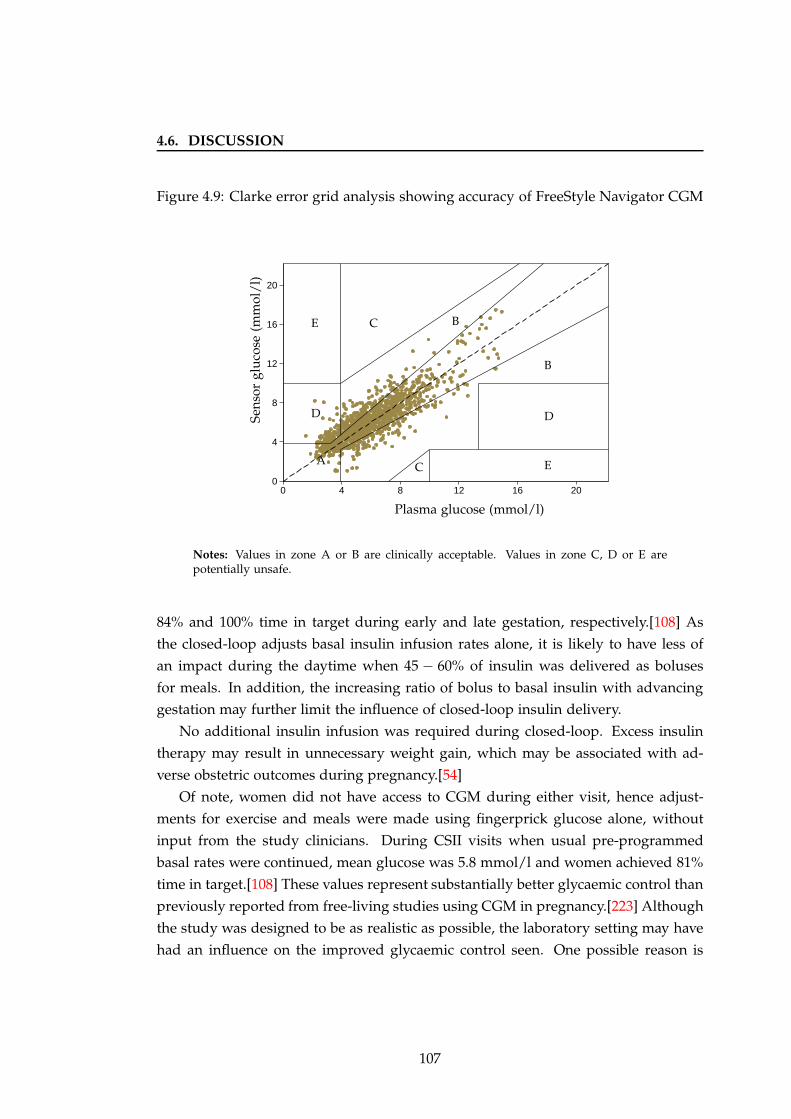
4.6. DISCUSSION
Figure 4.9: Clarke error grid analysis showing accuracy of FreeStyle Navigator CGM
0
4
8
12
16
20
0 4 8 12 16 20
Sen
sor
glu
cose
(mm
ol/
l)
Plasma glucose (mmol/l)
A
B
B
C
C
DD
E
E
Notes: Values in zone A or B are clinically acceptable. Values in zone C, D or E arepotentially unsafe.
84% and 100% time in target during early and late gestation, respectively.[108] As
the closed-loop adjusts basal insulin infusion rates alone, it is likely to have less of
an impact during the daytime when 45 − 60% of insulin was delivered as boluses
for meals. In addition, the increasing ratio of bolus to basal insulin with advancing
gestation may further limit the influence of closed-loop insulin delivery.
No additional insulin infusion was required during closed-loop. Excess insulin
therapy may result in unnecessary weight gain, which may be associated with ad-
verse obstetric outcomes during pregnancy.[54]
Of note, women did not have access to CGM during either visit, hence adjust-
ments for exercise and meals were made using fingerprick glucose alone, without
input from the study clinicians. During CSII visits when usual pre-programmed
basal rates were continued, mean glucose was 5.8 mmol/l and women achieved 81%
time in target.[108] These values represent substantially better glycaemic control than
previously reported from free-living studies using CGM in pregnancy.[223] Although
the study was designed to be as realistic as possible, the laboratory setting may have
had an influence on the improved glycaemic control seen. One possible reason is
107
4.6. DISCUSSION
that women were motivated and had more time to engage in their diabetes care,
in contrast to the home situation where work and family commitments may take
precedence. Nonetheless, glycaemic targets were achieved with existing strategies in-
cluding carbohydrate counting, fingerprick glucose testing and conventional insulin
pump therapy.
4.6.1 Postprandial periods
Postprandial hyperglycaemia was observed during both closed-loop and CSII visits,
particularly following breakfast when approximately 30% of time was spent above
target (> 7.8 mmol/l). Similar elevated glucose levels (28 − 44% above target) follow-
ing a 60g-carbohydrate breakfast were seen in a previous feasibility study of closed-
loop in pregnancy.[108] Use of stable isotope tracers demonstrated time to appear-
ance of half the glucose from the sugar-rich breakfast of 58 minutes, compared with
109 minutes for the starch-rich evening meal in addition to a second peak two to four
hours later.[224] These results indicate faster absorption of sugar-rich meals, which
may explain the steep rise in glucose levels after breakfast during my study.
The quantity and type of meals provided may have differed from womens’ usual
diet. In gestational diabetes, reduction in total daily carbohydrate intake in addition
to preferential consumption of low glycaemic index carbohydrates may improve gly-
caemic control.[144] In my study, all meals complied with American College of Ob-
stetricians and Gynaecologists guidelines comprising 40 − 50% carbohydrates, 20%
protein and 20 − 30% fat, although the glycaemic index of carbohydrates consumed
was not considered.[225]
Prandial insulin doses were calculated using womens’ usual bolus wizard calcu-
lators during both interventions. Inaccurate estimation of the meal bolus, for exam-
ple due to incorrect pre-programmed insulin to carbohydrate ratios, may have con-
tributed to the rise in glucose levels following meals. Another reason may be a delay
in insulin absorption, over and above that seen outside of pregnancy, which may be
related to increasing insulin resistance with advancing gestation. Time to peak insulin
concentration following meals was 49 minutes during early and 71 minutes during
late gestation in a study of women with type 1 diabetes.[224] These results suggest
that administration of insulin at least 15 − 30 minutes before meals may be required
to overcome the delays in insulin absorption during pregnancy. In my study, insulin
boluses were administered 10 minutes prior to meals, unless fingerprick glucose was
below 4.0 mmol/l. Importantly, these strategies to improve daytime glycaemic con-
108
4.6. DISCUSSION
trol can be implemented using conventional insulin therapy. A closed-loop system
with meal announcement, as employed in this study, may overcome the discrepancy
between rapid appearance of meal-derived glucose in the bloodstream and delayed
absorption of subcutaneously delivered insulin.
4.6.2 Exercise
Compared with conventional CSII, closed-loop reduced the frequency of hypogly-
caemic episodes (13 versus 20) and the low blood glucose index. Several factors may
influence glycaemic control with exercise. The majority of hypoglycaemia episodes
were associated with moderate intensity exercise despite anticipatory 15g carbohy-
drate snacks, or 30g for fingerprick glucose below 6.0 mmol/l. This is similar to
the American Diabetes Association recommendation of additional carbohydrates for
glucose less than 5.6 mmol/l prior to physical activity.[226] Exercise was delayed if
capillary glucose was below 4.0 mmol/l, comparable to the American Diabetes As-
sociation guideline of 4.4 mmol/l. The inclusion of additional 15 − 30g carbohydrate
snacks during and at the end of exercise reduced the occurrence of hypoglycaemia.
The composition of the snacks consumed (high versus low glycaemic index) are likely
to have had a variable effect on glucose control, although this was not specifically
evaluated.
During CSII visits, women set temporary basal rates for exercise according to
their usual practice, using capillary blood glucose levels alone. During closed-loop
visits, information on exercise timing and duration was announced to the algorithm
one hour prior to exercising. Although the model predictive control algorithm used
is updated continuously in real-time, rapid changes in glucose levels during exercise
may lead to delays in glucose sensing in interstitial fluid and subsequent delays in
appropriate adjustment of insulin infusion rates. Compared with CSII visits, closed-
loop basal insulin delivery was minimal during and following both exercise sessions,
suggesting the prandial insulin dose had a greater effect (Figure 4.7). Although the
majority of women reduced their prandial insulin bolus prior to exercise, this was
estimated using their usual bolus calculators, and hence may not have been enough
to prevent a decline in glucose levels. A study in non-pregnant adults with type 1
diabetes evaluated the effect of exercise performed 90 minutes after administration
of an insulin bolus for a 48g carbohydrate breakfast, similar in design to the morn-
ing exercise in my study.[227] Both a 50% reduction in pre-meal insulin and pump
suspension during exercise were required to prevent hypoglycaemia.
109
4.6. DISCUSSION
The physical activity performed in my study was of low to moderate intensity,
which is associated with a greater risk of hypoglycaemia.[187] This may be one reason
for the hypoglycaemia observed. Additionally, the scheduling of exercise within two
to three hours of the antecedent mealtime insulin bolus is likely to have had an
effect on the observed glycaemic responses. As the duration of action of rapid acting
insulin is up to four hours, the prandial insulin bolus was likely to have had an effect
on glycaemic control at the time of exercising.
The frequency of hypoglycaemic episodes was much higher for afternoon com-
pared with morning exercise (16 versus 9 episodes). This may have been due to
greater energy expended in the afternoon prior to the treadmill exercise including an
eight minute step test to calibrate the Actiheart and effort expended in arriving to the
study visits (e.g. walking from the car park and carrying an overnight bag). A pre-
vious study showed a higher risk of hypoglycaemia when exercise was undertaken
in the afternoon compared with the morning.[228] The occurrence of hypoglycaemia
in the afternoon on closed-loop visits may be related to inadequate time for the al-
gorithm to establish optimal glycaemic control, as it was commenced only one hour
prior to exercise. Previous studies in children using the same algorithm demonstrated
improving performance of closed-loop with longer duration of use.[104]
Late afternoon exercise may be associated with an increased risk of nocturnal
hypoglycaemia.[194; 195] In my study, glucose levels were in target range for 95 −
100% of the overnight period, with 0% time in hypoglycaemia during both interven-
tions. There were no episodes of hypoglycaemia during closed-loop after midnight.
Following the evening meal, closed-loop provided safer glucose control with signif-
icantly less time spent in hypoglycaemia. Additionally, the higher plasma glucose
at bedtime (23:00) during closed-loop (6.8 mmol/l versus 5.6 mmol/l during CSII)
may be a safer glucose concentration to minimise risk of hypoglycaemia overnight.
Blood glucose < 6 mmol/l was the strongest predictor of nocturnal hypoglycaemia
in a study in women with type 1 diabetes during early pregnancy.[229]
Both prior exercise and hypoglycaemia may impair the counter-regulatory re-
sponse to subsequent exercise with ensuing increased risk of hypoglycaemia.[196;
197] Except for two episodes (occurring in the same subject), all of the episodes of
morning hypoglycaemia occurred in women who had experienced hypoglycaemia
the day prior. Similarly, any hypoglycaemia prior to arrival for study visits may have
increased the risk of later episodes during the study period.
110
4.7. CONCLUSION
4.6.3 Strengths and limitations
The study was designed to approximate a real-life setting with normal daily activities
including exercise, meals and snacks. This was in preparation for testing the closed-
loop system in the home environment where patients are faced by such challenges
on a daily basis. The exercise performed was achieved without any discomfort, with
the perceived level of exertion reported as light or very light. Importantly, the 24-
hour study period enabled evaluation of the effect of exercise on glucose levels over
a longer duration, including overnight. Activities were matched on both visits to
enable direct comparison of glucose control between interventions, and an objective
measure of physical activity energy expenditure was used.
Women were able to select from at least four choices for meals and eight choices
of snacks, thus simulating the range of foods that might be consumed at home, in
addition to evaluating the ability of the control algorithm to cope with foods of vary-
ing macronutrient content. One limitation of standardising the meals was that the
women were required to eat the specified amount, regardless of whether that was
consistent with their usual practice. This may have contributed to the higher glucose
levels seen following breakfast, as a large proportion of the women reported that
they often consume fewer carbohydrates for breakfast at home. The glycaemic index
of the snacks consumed for exercise, which is likely to have a differential effect on
glucose levels, was not ascertained.
Despite trying to mimic normal daily activities as closely as possible, large parts of
the study visits were spent reclining in bed which is not representative of outpatient
life, and highlights one of the limitations of clinic-based research.
All of the women studied had very well controlled diabetes at baseline, which
is likely to have an effect on the degree of hypoglycaemia and hyperglycaemia ob-
served. This may have been because women who are more motivated and engaged
in the management of their diabetes are more likely to volunteer to take part in re-
search. Evaluation of women with suboptimal glycaemic control is warranted, as this
cohort is likely to derive a benefit from closed-loop insulin delivery.
4.7 Conclusion
In conclusion, in this cohort of well controlled women with type 1 diabetes during
pregnancy, closed-loop insulin delivery was as effective as conventional pump ther-
apy during a typical day including meals, snacks and physical activity. Moderate
111
4.7. CONCLUSION
intensity exercise was undertaken on consecutive days without any discomfort. Hy-
poglycaemia was common following exercise sessions during both interventions, but
closed-loop prevented nocturnal episodes. The effectiveness of closed-loop may be
lower in the daytime when a relatively higher proportion of total daily insulin is
attributed to boluses. This effect may be even more pronounced during pregnancy,
due to the increasing ratio of bolus to basal insulin with advancing gestation. Even
with conventional insulin pump therapy guided by fingerprick glucose tests alone,
women achieved 80% overall and 100% overnight time in target glucose, suggesting
those who are motivated can achieve optimal glycaemic control with the currently
available strategies.
112
Chapter 5
Energy expenditure and glucose
control in pregnancy
5.1 Background
5.1.1 Exercise in type 1 diabetes
5.1.1.1 Benefits
Regular physical activity in healthy individuals is associated with several physio-
logical gains, including improved cardiovascular fitness, body composition, blood
pressure and lipid profiles.[230] In addition, exercise has been shown to increase
insulin sensitivity and lower the incidence of new diabetes.[231]
In a cohort study of 500 people with type 1 diabetes, there was a significant
inverse relationship between activity levels and occurrence of diabetes-related com-
plications as well as mortality risk at seven years follow up.[232] Although the cardio-
vascular benefits of exercise in type 1 diabetes are well known, there is less evidence
of an improvement in glycaemic control. Reduced insulin requirements and/or the
increased caloric intake required to prevent exercise-induced hypoglycaemia are pos-
sible explanations for a masking of improvement in glucose control.
5.1.1.2 Targets
Despite awareness of the positive effects of exercise, activity levels amongst patients
with type 1 diabetes remain low, largely due to the challenges in maintaining normal
glucose levels and avoiding hypoglycaemia.[233] This risk is even greater during
113
5.1. BACKGROUND
pregnancy due to increased energy demands placed by the foetus as well as the
tighter glycaemic targets necessitated to avoid hyperglycaemia-related adverse foetal
and obstetric outcomes.[176]
For healthy adults, the American College of Sports Medicine recommends a min-
imum of 30 minutes of moderate intensity exercise such as brisk walking five days
a week, in addition to 20 minutes of vigorous aerobic activity such as jogging three
days a week, and resistance training and neuromotor exercises at least two days a
week.[230] The American Diabetes Association position statement declares that ‘all
levels of physical activity, including leisure, recreational and competitive sports, can
be performed by people with type 1 diabetes who do not have complications and
are in good blood glucose control’.[226] The American College of Obstetricians and
Gynaecologists published guidelines for exercise in pregnancy in 2002, recommend-
ing at least 30 minutes of exercise on most days of the week in otherwise healthy
pregnant women. In those with type 1 diabetes, prior medical evaluation is indicated
only for those with poor control.[234]
5.1.1.3 Relationship with glucose control
With the wider availability of CGM and accelerometry, increasing efforts are being
made to understand the relationship between physical activity and glycaemic control.
A significant correlation (0.58 − 0.99) was seen in six (of a total 16) children with type
1 diabetes, monitored with a physical activity sensor (Diatrace) and CGM for up to
three days.[235] Evaluation in 11 adults with type 1 diabetes during 30 minutes of
exercise failed to demonstrate a correlation between declining plasma glucose levels
and increasing heart rate and accelerometry counts.[236]
5.1.1.4 Measuring physical activity
There is a lack of data on physical activity energy expenditure (PAEE) during preg-
nancy. A major limitation of studies evaluating exercise is the reliance on subjective
self-reporting methods, which are confounded by misreporting and a tendency to
overestimate energy expenditure.[237] The International Physical Activity Question-
naire under-predicted less intense and over-predicted more intense activity in a study
in healthy women during pregnancy, compared with more objective methods.[238]
The gold standard for measuring energy expenditure under free-living conditions
is the doubly-labelled water technique.[239] This method is however expensive and
time consuming and does not provide information on the frequency and intensity of
114
5.1. BACKGROUND
physical activity, which may be better assessed by pedometers (less sensitive during
upper body exercise) or accelerometry.
Accelerometers are portable motion sensors which have been validated against
the doubly-labelled water method in non-pregnant populations.[240] A wrist-worn
tri-axial accelerometer failed to provide a reliable measurement of PAEE in pregnancy
when compared with non-pregnant women.[241] Accelerometry alone may underes-
timate PAEE due to its limited ability to detect lower levels of physical activity as
occurs in late gestation.[237; 242] Heart rate is directly related to oxygen consump-
tion, but on its own may not be an accurate measure of PAEE during low intensity
activity when changes in heart rate are less pronounced, and may be confounded
by factors which increase resting heart rate such as stress and pregnancy itself. Use
of combined heart rate and accelerometry monitoring may provide a better estima-
tion of PAEE.[243] One such device is the Actiheart (Cam Ntech Ltd, Papworth, UK)
which has been employed in two studies in pregnancy to date.[244; 245]
5.1.2 Exercise in pregnancy
During pregnancy, additional benefits of exercise include limitation of excess mater-
nal weight gain, fewer delivery-related complications, as well as an improved foetal
stress response and reduced fat mass.[246] Regular moderate to high intensity cycle
training in healthy pregnant women attenuated the rise in insulin resistance nor-
mally seen with increasing gestation.[247] The benefits of exercise on weight, fat
mass and cardiovascular profiles have been shown to be maintained several years
after pregnancy.[248]
Although the beneficial effects of exercise are widely accepted, the majority of
studies evaluating the effect of physical activity in diabetic pregnancy have been
carried out in women with or at risk of gestational diabetes mellitus, demonstrating
improved insulin sensitivity and better glycaemic control.[249; 250]
There is no objective data on physical activity in pregnant women with type 1
diabetes. Only one study, carried out over 25 years ago, evaluated the effect of a
postprandial walking programme in this patient group, showing an improved lipid
profile with no difference in glycaemic control.[251]
Physical activity levels are lower in pregnancy and decline with advancing gesta-
tion, compensating for the increased energy cost of exercise.[217] Total energy expen-
diture, which is a composite measure of basal metabolic rate (60− 75%), diet-induced
thermogenesis (10%) and activity energy expenditure (25 − 30%), is increased. This
115
5.1. BACKGROUND
is due to a 20% higher basal metabolic rate in pregnancy, attributed to accelerated fat
and protein synthesis, increased tissue mass and increased overall metabolic load, all
of which increase with advancing gestation.[219]
Longitudinal assessment of physical activity using accelerometry and self-report
questionnaires in overweight pregnant women in England found that over 60% ach-
ieved the minimum recommended 30 minutes of moderate intensity activity daily,
which was maintained throughout gestation.[252] Another UK study evaluating 64
normal weight women using a multi-axial accelerometer demonstrated a progressive
decline in physical activity levels with advancing gestation.[242] The accelerometer
used was less accurate at detecting the low levels of activity more common in late
pregnancy, and compliance with wear also declined over time.
A study using a multi-axial accelerometer, doubly labelled water and indirect
calorimetry in pregnant women in Sweden showed that 63 minutes per day (4%) was
spent in moderate activity.[253] Compared with non-pregnant women, 92 more min-
utes was spent on sedentary activity with 94 minutes less on standing and walking,
in addition to choosing a slower pace. In another Swedish study, physical activity
patterns were evaluated in healthy and overweight women using a combined heart
rate and movement sensor, doubly-labelled water and indirect calorimetry.[245] Com-
pared with controls, pregnant women spent 13% more time sedentary and 71% less
time in moderate-vigorous intensity activity. Despite 44% lower total activity levels,
pregnant women achieved a similar exercise-related improvement in insulin sensi-
tivity. Accelerometry and indirect calorimetry assessment of energy expenditure in
27 healthy Swiss women showed a 20% higher resting metabolic rate, accounting
for the increase in total energy expenditure during late pregnancy compared with
postpartum.[244] PAEE, adjusted for body weight, was lower during pregnancy with
more time spent in less intense activities.
5.1.3 Glucose control in pregnancy
5.1.3.1 Targets
Recommended glycaemic targets for pregnant women with diabetes are fasting glu-
cose between 3.5− 5.9 mmol/l and one hour-postprandial level below 7.8 mmol/l.[94]
Continuous glucose monitoring (CGM) profiles recorded in 57 healthy women dur-
ing pregnancy demonstrated mean fasting glucose of 4.2 mmol/l and postprandial
peak glucose of 6.1 mmol/l.[254] These glucose profiles are significantly lower than
the levels currently recommended for women with diabetes, suggesting that tighter
116
5.1. BACKGROUND
glycaemic targets levels may be required to reduce the risk of adverse maternal and
foetal outcomes.[255] In a study of 12 CSII-treated pregnancies, despite maintain-
ing strict glycaemic targets with mean Hba1c 6.5%, 5.9% and 5.8% in trimesters 1, 2
and 3 respectively, mean birth weight was still increased with large for gestational
age infants in 35%.[256] It is suggested that a mean glucose of 5.3 mmol/l or lower
throughout the second and third trimesters may be required to achieve normal foetal
growth.[257]
5.1.3.2 Evidence from CGM
The emergence of CGM over the last decade has revolutionised the monitoring of
diabetes. Its use in pregnancy may be especially valuable in detecting the dynamic
glucose excursions that occur with the physiological changes of advancing gestation.
Evidence of CGM use in pregnancy is increasing. The high day to day glucose vari-
ability was shown in a study of pregnant women with type 1 diabetes using CGM for
two days.[258] Another study observed a mean time spent in hyperglycaemia (> 7.8
mmol/l) of 192 minutes/day, not detected by SMBG.[259] Nocturnal hypoglycaemic
events (< 2.8 mmol/l) occurred in 26 of the 34 women (76%), one-third of whom did
not experience any symptoms. Assessment of glycaemic control using retrospective
CGM worn in each trimester showed that women with type 1 diabetes spent only 43%
of the day in euglycaemic range (3.9− 7.8 mmol/l) in the first trimester during which
critical foetal development occurs, improving to only 56% by the third trimester.[223]
Almost 33% time was spent hyperglycaemic, while time spent in hypoglycaemia was
14% overall and 16% overnight.
A randomised trial of intermittent retrospective CGM use (worn for up to seven
days, at four to six week intervals) in 71 women with pregestational diabetes pro-
vided evidence of a benefit of CGM on clinical outcomes.[215] Compared with stan-
dard antenatal care, CGM resulted in an improvement in HbA1c in late gestation
from 6.4% to 5.8%, lower mean birth weight and reduced risk of macrosomia. A
recent study in 25 women evaluating continuous (daily) versus intermittent (14 days
per month) real-time CGM from three months pre-conception until delivery, found
no difference in maternal and foetal outcomes with both groups demonstrating sim-
ilar decline in HbA1c from first to third trimester.[260]
117
5.2. RATIONALE
5.2 Rationale
The relationship between physical activity and glucose levels is multifactorial, further
complicated by the unique physiology of pregnancy. There is no objective evidence
on physical activity patterns or energy expenditure in pregnant women with type 1
diabetes. Several previous studies have evaluated glycaemic control using CGM in
mixed groups of women, including those with type 1 and 2 diabetes and on both
MDI and CSII. None have used CGM in a cohort of women exclusively on CSII. Fur-
thermore, none have studied the effects of controlled diet and exercise on glucose
levels. Detailed evaluation of PAEE and glycaemic control may contribute to the de-
velopment of evidence based guidelines for optimising diabetes management during
pregnancy.
5.3 Aim
The aim of this study was to objectively investigate physical activity energy expendi-
ture and glucose control as measured by continuous glucose monitoring, in pregnant
women with type 1 diabetes during free-living and structured diet and exercise con-
ditions.
5.4 Methods
5.4.1 Study design
As part of the study evaluating closed-loop insulin delivery in pregnancy described
in Chapter 4, activity patterns and glucose levels in ten women with type 1 diabetes
were investigated, under free-living and controlled study conditions.
5.4.1.1 Controlled diet and exercise conditions
Women attended a clinical research facility from midday until 12:30 the following
day. Activities of varying intensity, measured in metabolic equivalents (METs), were
planned over the 24-hour study period, based on reference values.[261] The study
protocol included scheduled low (three 20-minute self-paced walks after meals) and
moderate (two 55-minute sessions of brisk treadmill walking, each with a 5 minute
rest interval) intensity exercise. The Borg rating of perceived exertion was used to
assess effort level during exercise (Figure 4.3).[220] In between scheduled exercise,
118
5.4. METHODS
women undertook sedentary tasks such as working on a computer, watching televi-
sion or reading.
Participants were given standardised 50 − 60g carbohydrate meals and a 15g car-
bohydrate snack before bed. All meals were accompanied by an insulin bolus, cal-
culated using the pump bolus wizard or insulin to carbohydrate ratios. Additional
snacks were consumed according to capillary glucose measured prior to, during and
after treadmill exercise. Women continued their standard insulin pump regimen,
and were able to set temporary basal rates and/or reduce pre-exercise meal insulin
boluses.
A FreeStyle Navigator CGM (Abbott Diabetes Care, Alameda, CA, USA) was in-
serted one to two days prior to the study visit. Women did not have access to CGM
readings, and any adjustments to insulin doses were made using capillary glucose
measurements. A non-invasive combined heart rate and accelerometer device (Ac-
tiheart, Cam Ntech Ltd, Papworth, UK) was individually calibrated for each subject
and attached on arrival (Figure 4.2).[216]
5.4.1.2 Free-living conditions
On completion of the controlled study, women were asked to continue wearing both
the CGM and acclerometer at home in order to obtain free-living data. Basic training
and written instructions on device calibration and interpretation of real-time CGM
data (available to women at home) was provided. The Actiheart could be worn con-
tinuously throughout out the day and overnight, including whilst bathing. Women
were provided with extra electrocardiogram pads to be replaced if the existing ones
came loose from the skin due to moisture. During the recording period, women were
asked to consume meals and carry out physical activity according to their usual daily
routine (ad libitum). To reduce any persisting effect of the controlled study condi-
tions, the first 24 hours of PAEE was not considered for analysis. At the end of the
free-living recording period, women returned the Actiheart and CGM devices, which
were downloaded retrospectively.
5.4.2 Measurements
5.4.2.1 Demographic and anthropometric information
Demographic data was collected at the baseline screening visit. Weight was measured
to the nearest 0.1kg using calibrated electronic scales (Kern & Sohn GmbH, Germany)
119
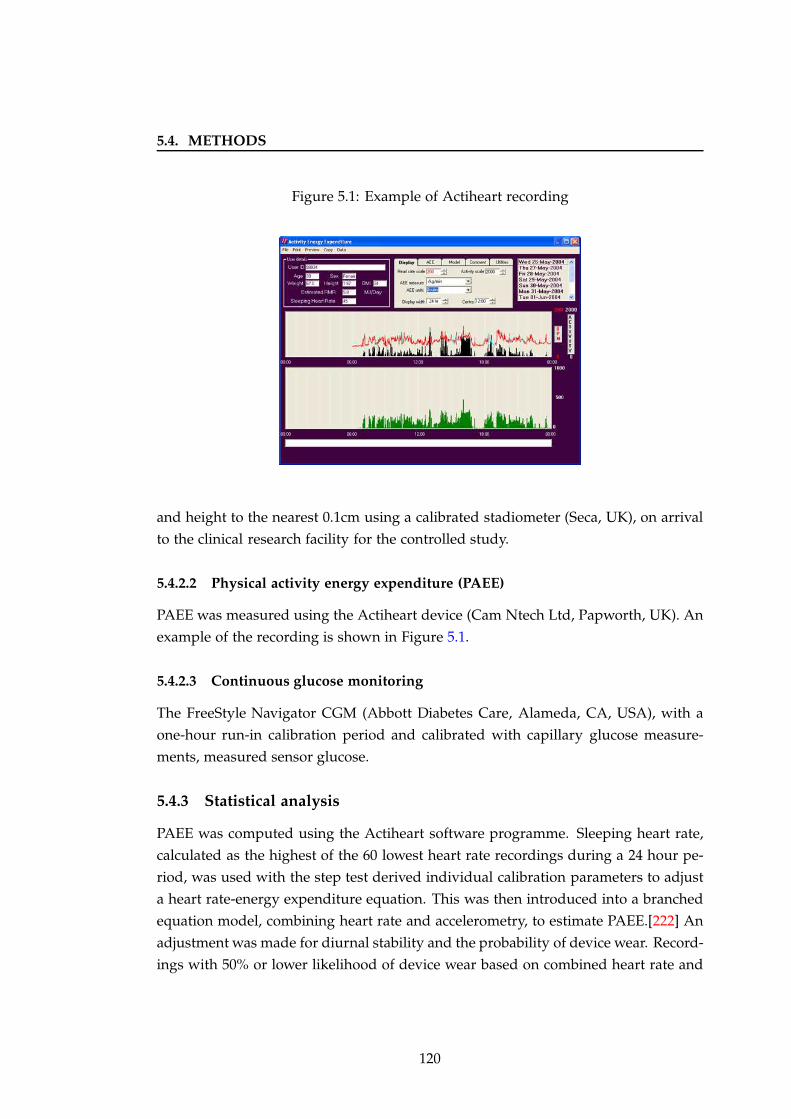
5.4. METHODS
Figure 5.1: Example of Actiheart recording
and height to the nearest 0.1cm using a calibrated stadiometer (Seca, UK), on arrival
to the clinical research facility for the controlled study.
5.4.2.2 Physical activity energy expenditure (PAEE)
PAEE was measured using the Actiheart device (Cam Ntech Ltd, Papworth, UK). An
example of the recording is shown in Figure 5.1.
5.4.2.3 Continuous glucose monitoring
The FreeStyle Navigator CGM (Abbott Diabetes Care, Alameda, CA, USA), with a
one-hour run-in calibration period and calibrated with capillary glucose measure-
ments, measured sensor glucose.
5.4.3 Statistical analysis
PAEE was computed using the Actiheart software programme. Sleeping heart rate,
calculated as the highest of the 60 lowest heart rate recordings during a 24 hour pe-
riod, was used with the step test derived individual calibration parameters to adjust
a heart rate-energy expenditure equation. This was then introduced into a branched
equation model, combining heart rate and accelerometry, to estimate PAEE.[222] An
adjustment was made for diurnal stability and the probability of device wear. Record-
ings with 50% or lower likelihood of device wear based on combined heart rate and
120
5.5. RESULTS
accelerometry, were excluded.
Proportion of time spent in various activities was described as metabolic equiv-
alents, a concept which expresses the energy cost of physical activity as a multiple
of basal metabolic rate where one MET (kcal/kg/hr) equates to resting oxygen con-
sumption, conventionally set at 3.5 ml O2/kg of body weight/min based on an av-
erage 70-kg male. Metabolic equivalents can be used as an index of the intensity of
physical activity, which was categorised as sedentary (≤ 1 MET), light (1 − 3 METs),
or moderate to vigorous (> 3 METs).[261]
Glycaemic outcomes were calculated using sensor glucose for overall (14:00-12:00)
and overnight (23:00-07:30) periods. These included time spent within, above and be-
low target glucose defined as 3.5− 7.8 mmol/l, based on National Institute for Health
and Clinical Excellence guidelines for pregnancy.[94] Mean glucose, standard devia-
tion of glucose and the low blood glucose index were also calculated.[97] Episodes of
hypoglycaemia were quantified during the controlled study.
Values are given as median (interquartile range) or mean ± standard deviation.
Significant differences (p ≤ 0.05) were identified using non-parametric t-tests for
paired data. Analyses were conducted using SPSS Version 15 (SPSS Inc, Chicago, IL,
USA).
5.5 Results
5.5.1 Demographic data
Ten women of the original cohort which took part in the closed-loop study completed
the free-living phase of the study. The baseline characteristics of these women are
summarised in Table 5.1.
5.5.2 Activity patterns and energy expenditure
A 22-hour consecutive period of PAEE recordings during free-living at home, matched
in time to the controlled study visit (14:00-12:00), was evaluated. Median PAEE dur-
ing free-living was 15.9 kJ/kg/day with the wide interquartile range (10.8, 22.9) indi-
cating a greater variability in intensity of physical activity at home (Table 5.2). Most
of the day was spent sedentary (54%) or in light activity such as standing (43%), with
only 2% spent in moderate intensity activity.
During controlled study conditions including structured exercise, PAEE was 21.2
(18.2, 22.4) kJ/kg/day, with 62% of time spent sedentary, 30% in light activity and 8%
121
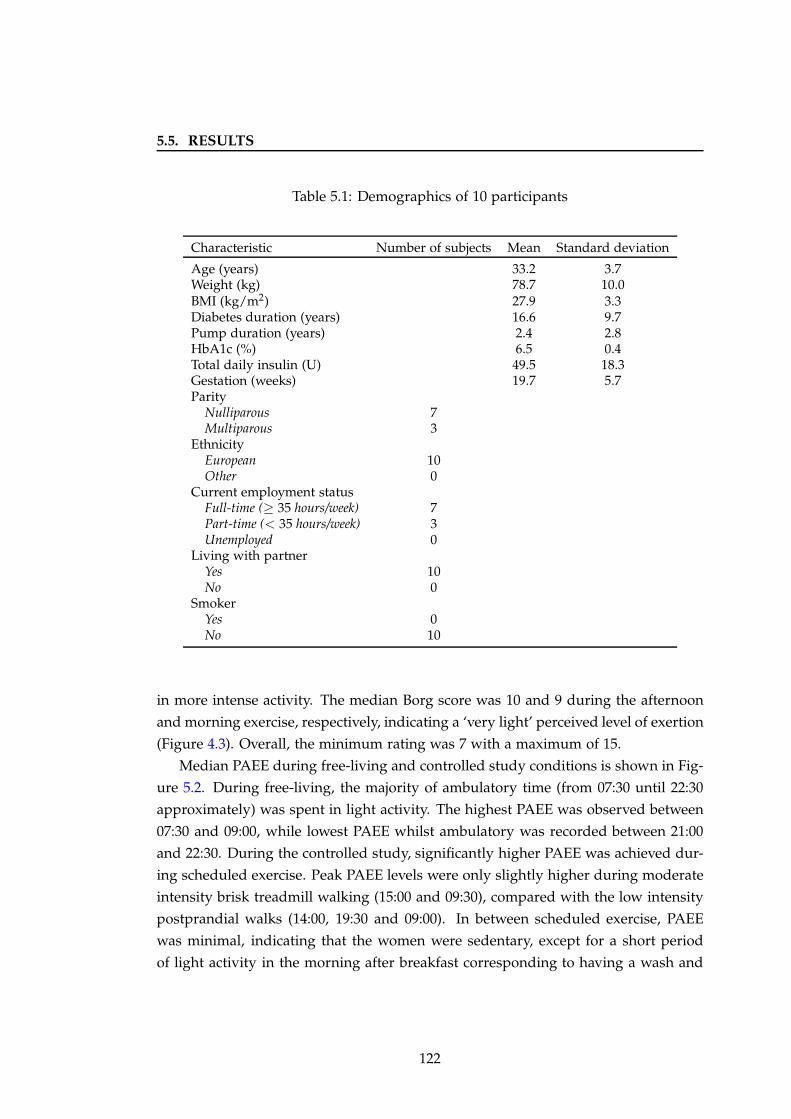
5.5. RESULTS
Table 5.1: Demographics of 10 participants
Characteristic Number of subjects Mean Standard deviation
Age (years) 33.2 3.7Weight (kg) 78.7 10.0BMI (kg/m2) 27.9 3.3Diabetes duration (years) 16.6 9.7Pump duration (years) 2.4 2.8HbA1c (%) 6.5 0.4Total daily insulin (U) 49.5 18.3Gestation (weeks) 19.7 5.7Parity
Nulliparous 7Multiparous 3
EthnicityEuropean 10Other 0
Current employment statusFull-time (≥ 35 hours/week) 7Part-time (< 35 hours/week) 3Unemployed 0
Living with partnerYes 10No 0
SmokerYes 0No 10
in more intense activity. The median Borg score was 10 and 9 during the afternoon
and morning exercise, respectively, indicating a ‘very light’ perceived level of exertion
(Figure 4.3). Overall, the minimum rating was 7 with a maximum of 15.
Median PAEE during free-living and controlled study conditions is shown in Fig-
ure 5.2. During free-living, the majority of ambulatory time (from 07:30 until 22:30
approximately) was spent in light activity. The highest PAEE was observed between
07:30 and 09:00, while lowest PAEE whilst ambulatory was recorded between 21:00
and 22:30. During the controlled study, significantly higher PAEE was achieved dur-
ing scheduled exercise. Peak PAEE levels were only slightly higher during moderate
intensity brisk treadmill walking (15:00 and 09:30), compared with the low intensity
postprandial walks (14:00, 19:30 and 09:00). In between scheduled exercise, PAEE
was minimal, indicating that the women were sedentary, except for a short period
of light activity in the morning after breakfast corresponding to having a wash and
122
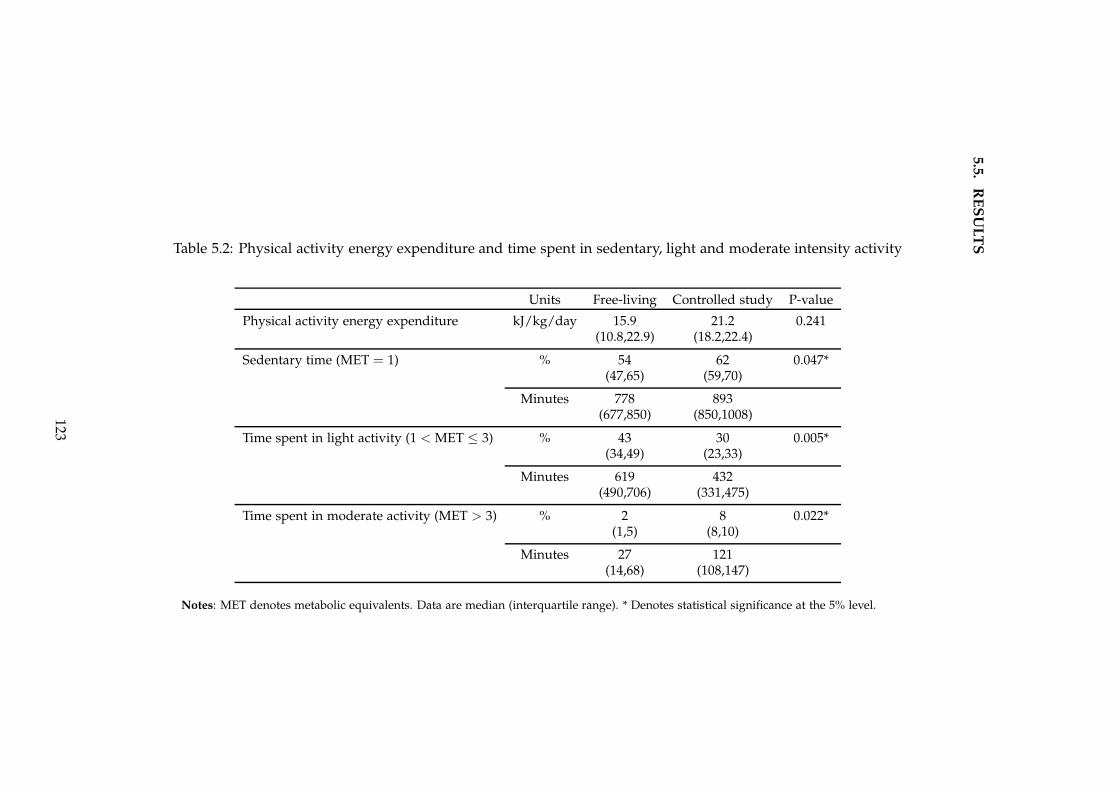
5.5
.R
ES
UL
TSTable 5.2: Physical activity energy expenditure and time spent in sedentary, light and moderate intensity activity
Units Free-living Controlled study P-value
Physical activity energy expenditure kJ/kg/day 15.9 21.2 0.241(10.8,22.9) (18.2,22.4)
Sedentary time (MET = 1) % 54 62 0.047*(47,65) (59,70)
Minutes 778 893(677,850) (850,1008)
Time spent in light activity (1 < MET ≤ 3) % 43 30 0.005*(34,49) (23,33)
Minutes 619 432(490,706) (331,475)
Time spent in moderate activity (MET > 3) % 2 8 0.022*(1,5) (8,10)
Minutes 27 121(14,68) (108,147)
Notes: MET denotes metabolic equivalents. Data are median (interquartile range). * Denotes statistical significance at the 5% level.
123
5.5. RESULTS
getting ready.
5.5.3 Glycaemic control
5.5.3.1 Day and night
Overall mean sensor glucose was much higher during free-living compared with the
controlled study (7.7 mmol/l versus 6.0 mmol/l; p = 0.028), with a trend towards
increased proportion of time spent in hyperglycaemia (28% versus 17%; p = 0.059).
The outcomes are summarised in Table 5.3.
The median glucose profile shown in Figure 5.3 was generally higher during free-
living, with glucose levels remaining above target range between 20:00 and 23:00. The
interquartile range, illustrating glycaemic variability, was also much wider during
free-living. This disparity was particularly evident in the evening from 19:00, which
is generally the period following consumption of the evening meal. Additionally,
women were least active during this time at home, compared with the controlled
study where women undertook a 20-minute walk after their evening meal (Figure
5.2).
During the controlled study, glucose levels remained within target range for most
of the day, except after breakfast when there was a steep rise in glucose levels. In
comparison, during free-living, hyperglycaemia after breakfast was less marked and
similar to that observed after the evening meal.
5.5.3.2 Overnight
Overnight mean sensor glucose was 7.5 mmol/l during free-living compared with
5.2 mmol/l during the controlled study; p = 0.047 (Table 5.3). Women also had
a significantly higher mean glucose at the start of the overnight period (23:00); 9.6
mmol/l versus 5.9 mmol/l, p = 0.013.
During the controlled diet and exercise study, zero time was spent in hypergly-
caemia overnight compared with 19% at home (p = 0.028). The standard deviation
of glucose, representing glucose variability, was almost halved; 0.7 mmol/l versus
1.3 mmol/l, p = 0.022. This is illustrated in Figure 5.3 by the narrower interquartile
range overnight during the controlled study.
124
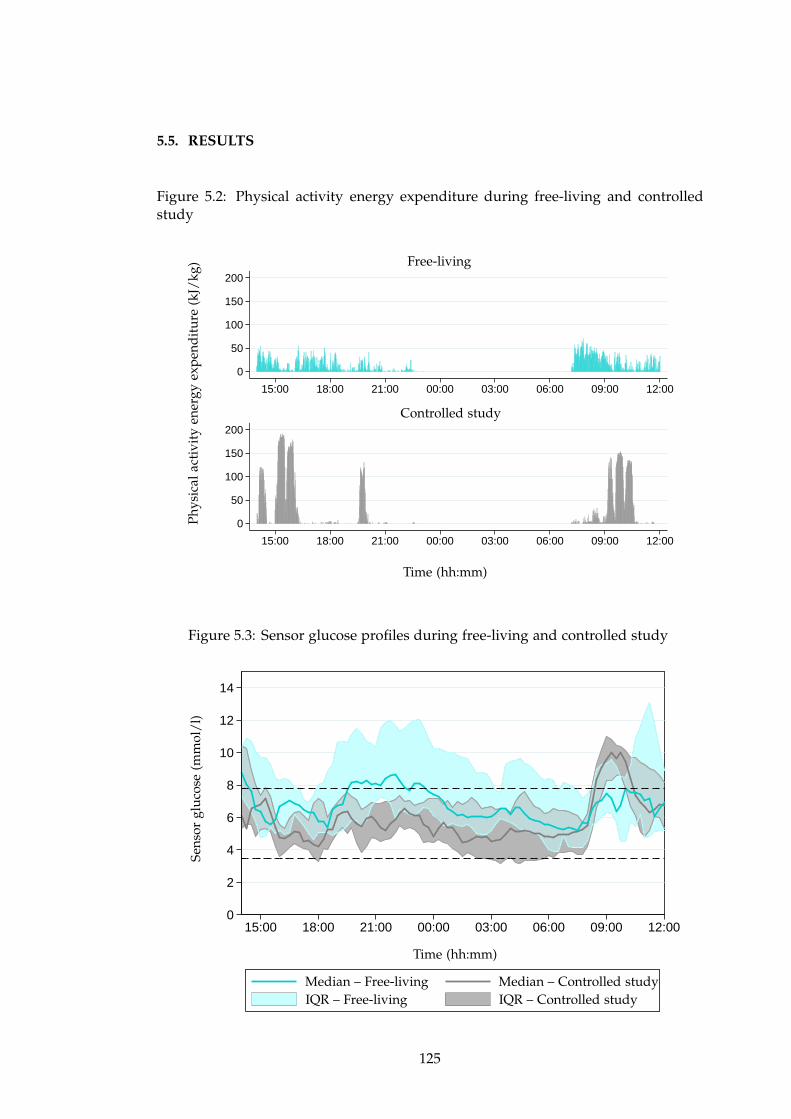
5.5. RESULTS
Figure 5.2: Physical activity energy expenditure during free-living and controlledstudy
0
50
100
150
200
0
50
100
150
200
15:00 18:00 21:00 00:00 03:00 06:00 09:00 12:00
15:00 18:00 21:00 00:00 03:00 06:00 09:00 12:00
Controlled study
Free-living
Time (hh:mm)
Ph
ysic
alac
tivi
tyen
ergy
exp
end
itu
re(k
J/kg
)
Figure 5.3: Sensor glucose profiles during free-living and controlled study
0
2
4
6
8
10
12
14
15:00 18:00 21:00 00:00 03:00 06:00 09:00 12:00
Sen
sor
glu
cose
(mm
ol/
l)
Time (hh:mm)
Median – Free-living Median – Controlled studyIQR – Free-living IQR – Controlled study
125
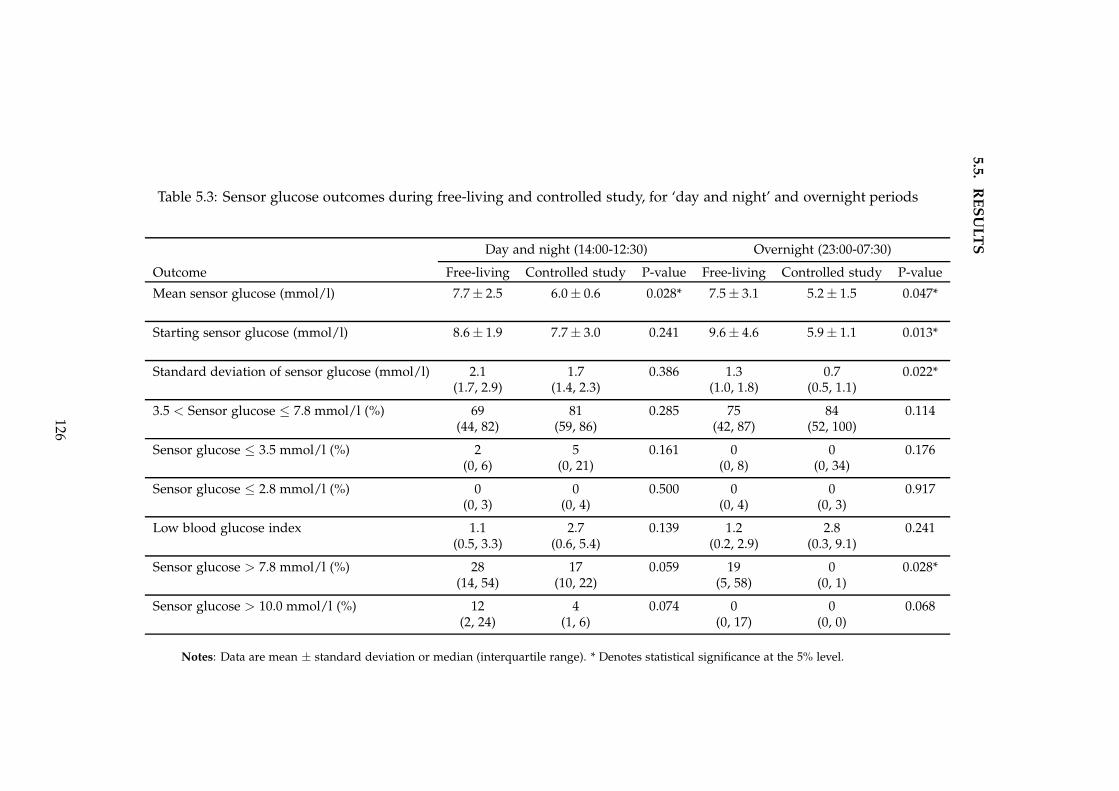
5.5
.R
ES
UL
TS
Table 5.3: Sensor glucose outcomes during free-living and controlled study, for ‘day and night’ and overnight periods
Day and night (14:00-12:30) Overnight (23:00-07:30)
Outcome Free-living Controlled study P-value Free-living Controlled study P-value
Mean sensor glucose (mmol/l) 7.7 ± 2.5 6.0 ± 0.6 0.028* 7.5 ± 3.1 5.2 ± 1.5 0.047*
Starting sensor glucose (mmol/l) 8.6 ± 1.9 7.7 ± 3.0 0.241 9.6 ± 4.6 5.9 ± 1.1 0.013*
Standard deviation of sensor glucose (mmol/l) 2.1 1.7 0.386 1.3 0.7 0.022*(1.7, 2.9) (1.4, 2.3) (1.0, 1.8) (0.5, 1.1)
3.5 < Sensor glucose ≤ 7.8 mmol/l (%) 69 81 0.285 75 84 0.114(44, 82) (59, 86) (42, 87) (52, 100)
Sensor glucose ≤ 3.5 mmol/l (%) 2 5 0.161 0 0 0.176(0, 6) (0, 21) (0, 8) (0, 34)
Sensor glucose ≤ 2.8 mmol/l (%) 0 0 0.500 0 0 0.917(0, 3) (0, 4) (0, 4) (0, 3)
Low blood glucose index 1.1 2.7 0.139 1.2 2.8 0.241(0.5, 3.3) (0.6, 5.4) (0.2, 2.9) (0.3, 9.1)
Sensor glucose > 7.8 mmol/l (%) 28 17 0.059 19 0 0.028*(14, 54) (10, 22) (5, 58) (0, 1)
Sensor glucose > 10.0 mmol/l (%) 12 4 0.074 0 0 0.068(2, 24) (1, 6) (0, 17) (0, 0)
Notes: Data are mean ± standard deviation or median (interquartile range). * Denotes statistical significance at the 5% level.
126
5.6. DISCUSSION
5.5.3.3 Hypoglycaemia
Time spent in hypoglycaemia overall was greater during the controlled study, al-
though not significant (5% versus 2%; p = 0.161). There were 17 episodes of hypogly-
caemia (1.7 episodes per subject) requiring treatment with 15g rescue carbohydrate.
Eleven (65%) episodes occurred during or within two hours of the exercise sessions
on the treadmill despite setting of temporary basal infusion rates (70% of women)
and consumption of supplementary snacks for exercise according to capillary glu-
cose testing (total amount consumed ranged from 15g to 75g carbohydrate). There
was one episode after midnight. Episodes of hypoglycaemia during free-living were
not recorded.
5.6 Discussion
This is the first study to objectively measure amount and intensity of physical activ-
ity energy expenditure in pregnant women with type 1 diabetes. Most of the women
studied were in their second trimester of pregnancy. Seven were nulliparous and
hence likely to have very different activity patterns from those women with children.
The majority of time was spent sedentary (lying down or sitting) or in light inten-
sity activity (e.g. standing, slow walking).[261] Interestingly, the highest PAEE was
recorded between 07:30 and 09:00 (Figure 5.2), when women tend to be engaged in
domestic tasks such as getting ready, preparing meals for the family and travelling
to school or work, suggesting that such habitual light activity accounts for a not in-
significant proportion of daily energy expenditure. The lowest PAEE during waking
hours was measured from 20:00 to 23:00.
Less than 2% of time (27 minutes) was spent in moderate intensity activity, which
is just below the American College of Obstetricians and Gynaecologists recommen-
dation of 30 minutes per day. A study in non-diabetic overweight women in Eng-
land showed, of the total 742 minutes ambulatory, 585 minutes was spent sedentary,
122 minutes in light activity and 33 minutes in moderate to vigorous activity.[252]
Other studies in healthy pregnancy reported times of 57 minutes (Switzerland) and
63 minutes (Sweden) spent at moderate or vigorous intensity.[244; 253] These and
other studies assessed energy expenditure in healthy or overweight pregnant women
[242; 245; 262], but there is no such data in pregnant women with diabetes.
Although there have been several studies using CGM to assess glycaemic control
during pregnancy associated with type 1 and 2 diabetes [215; 223; 258; 259], this
127
5.6. DISCUSSION
is the first evaluation of a cohort of women exclusively on insulin pump therapy
and the first to consider the influence of physical activity. Average glucose was 7.7
mmol/l during free-living, which is above National Institute for Health and Clinical
Excellence recommended targets during pregnancy.[94] This level is even higher than
a previously observed second trimester glucose of 7.1 mmol/l in a mixed cohort of
women with MDI and CSII-treated type 1 and 2 diabetes.[223]
Women spent almost one-third of time hyperglycaemic, similar to that reported
earlier,[223] despite almost achieving the recommended 30 minutes of moderate ac-
tivity daily. This suggests that current exercise guidelines may not be sufficient to
achieve glucose targets in pregnancy. Of note, this cohort of women were all op-
timised on CSII with well controlled diabetes (HbA1c 6.4%) on entering the study.
Moreover, they had access to real-time CGM in addition to conventional fingerprick
glucose monitoring at home to make adjustments to their insulin regimen and diet.
This suggests that the availability of technology is not the sole determinant of im-
proved glycaemic control. This may have been because women were not wearing
the device specifically to optimise glucose control and/or because of the challenges
in matching insulin to glucose levels in real life. Another reason may have been
inexperience in using a new device.
During the 24-hour period including a controlled diet and structured exercise,
glucose levels were significantly improved. These benefits were even more strik-
ing during the overnight period, with zero time spent in both hypoglycaemia and
hyperglycaemia. Glycaemic variability was also reduced, which is clinically signif-
icant as fluctuating glucose levels are correlated with an increased risk of severe
hypoglycaemia.[177]
Women attained a higher total PAEE with a greater proportion of time spent in
moderate intensity activity (121 minutes), during the controlled study. This was ach-
ieved without any discomfort, as indicated by the Borg rating of perceived exertion
during exercise. Nonetheless, exercise did result in 11 episodes of symptomatic hy-
poglycaemia within two hours of treadmill sessions. These events occurred despite
setting of temporary basal rate reductions and consumption of supplemental carbo-
hydrates prior to and during exercise. There was only one episode after midnight,
occurring in a subject who had already experienced four episodes of hypoglycae-
mia following moderate intensity exercise the afternoon and evening prior. Notably,
mean sensor glucose was 5.2 mmol/l at 23:00 during the controlled study. Blood
glucose levels below 6 mmol/l at bedtime have been shown to be associated with an
increased risk of nocturnal hypoglycaemia in pregnancy.[229]
128
5.6. DISCUSSION
The treadmill exercise sessions were of moderate intensity, which is associated
with a higher risk of decline in glucose levels.[187] Continuous or intermittent higher
intensity exercise is less likely to result in hypoglycaemia, although this type of ex-
ercise may not be practical in pregnancy.[190] Only one other study to date has
evaluated the effect of exercise in pregnant women with type 1 diabetes, showing
improved lipid profiles but no benefit on glucose control of a postprandial walking
programme.[251]
The controlled diet consisted of nutritionally balanced (40 − 50% carbohydrate,
20 − 30% fat, 20% protein), 50 − 60g carbohydrate meals and supplementary snacks
for exercise. A study in overweight women with gestational diabetes found that one-
hour postprandial capillary glucose was < 7.8 mmol/l when meals with 45 − 55%
carbohydrate content were consumed, compared with glucose < 6.7 mmol/l follow-
ing lower carbohydrate (33 − 45%) meals.[263] In comparison, in my study mean
glucose was 6.0 mmol/l during controlled conditions suggesting that glucose targets
may be attainable with a moderate dietary intake, without the need for excessive
carbohydrate restriction. Although women did not have access to CGM readings, it
is likely that they were more engaged in their diabetes and also had more time to
fine tune their insulin boluses and basal rates during the 24-hour stay in the clinical
research facility.
Compared with free-living, glucose levels were higher after breakfast in the morn-
ing under controlled diet and exercise conditions. This period of the day is often the
most challenging for women during pregnancy. One possible reason is that women
were given a higher carbohydrate breakfast compared to that which may be nor-
mally consumed at home. Additionally, during free-living this period was associated
with higher activity levels corresponding to when women are actively engaged in
household tasks and getting ready for work, in contrast to the controlled study when
women were inevitably sedentary in between scheduled walks and exercise.
Light intensity activity alone has been shown to have a positive effect on gly-
caemic control. An Australian study in overweight men and women at risk of dia-
betes found a significant association between light intensity physical activity and two
hour (post oral glucose tolerance test) plasma glucose, with no such association for
moderate or vigorous activity.[264] In my study, reasonable levels of PAEE were ach-
ieved during the low intensity walks after meals (Figure 5.2), suggesting even gentle
walking may have a benefit on glucose levels.
One of the major strengths of this study was the use of an objective method
of quantifying PAEE, compared with subjective measures which may be biased and
129
5.6. DISCUSSION
prone to overestimation of activity levels.[237] Various methods, including self-report
questionnaires, pedometers, heart rate monitors and accelerometers, have been em-
ployed in studies evaluating activity levels.[237; 238] The device used in this study
was a combined heart rate and movement sensor, which provides a more accurate
estimate of PAEE compared with heart rate or accelerometry alone.[221] The device
was individually calibrated on each study visit, which reduced the inter-individual
variation in measurement. This is particularly relevant in pregnancy due to the phys-
iological effects on heart rate with advancing gestation. Importantly, compliance with
wear was 100%, thus improving the reliability of the results. However, the validity of
using accelerometry to measure PAEE in pregnancy is undetermined, as it has only
been validated in non-pregnant populations. In addition, accelerometers are less sen-
sitive to detecting the lower intensity activity levels common in pregnancy [242]. The
Actiheart device has been used in two recent studies in healthy pregnant women in
Sweden and Switzerland.[244; 245]
The free-living observations in this study provide reference data which may be
clinically useful. Elevated glucose levels in the evening before going to bed corre-
sponded to the least active period of the day, whilst glucose levels remained in target
in the morning when women were most active. These results suggest a benefit of
physical activity on glycaemic control, and may help in the development of recom-
mendations on timing and intensity of physical activity during diabetic pregnancy.
Limitations of my study include the small number of subjects studied, and the
evaluation of a single day which may not be representative of usual glycaemic con-
trol. All of the women were of Caucasian ethnicity, in full or part-time employment,
and living with a partner. These demographic characteristics may influence activity
levels and degree of self-efficacy in diabetes management, and hence limit general-
isability of the results to all women with type 1 diabetes during pregnancy. Fitness
levels of the participants may have also had an influence on glycaemic responses ob-
served during exercise. Women who volunteer to take part in research are generally
more motivated and engaged in their diabetes care, which may also include a higher
likelihood of undertaking regular exercise. In addition, the active monitoring of glu-
cose and activity levels during the free-living period of the study may have motivated
women to exercise more and be more vigilant in managing their diabetes.
The controlled study was not designed specifically to evaluate the effect of ex-
ercise on glycaemic control. Hence, it was not possible to differentiate between the
influence of diet, insulin and physical activity on glucose levels. Similarly, during
free-living women consumed meals and snacks ad libitum and a diet record was not
130
5.7. CONCLUSIONS
obtained.
5.7 Conclusions
This study describes the first objective data on activity patterns and energy expen-
diture in combination with glucose levels in pregnant women with type 1 diabetes
during free-living. Despite having well-controlled diabetes treated by insulin pump
therapy and almost achieving the daily exercise goals for pregnancy, glucose levels
were above recommended targets, with almost a third of the day spent hypergly-
caemic. As a much higher proportion of time was spent sedentary or in light activity,
guidelines incorporating daily targets for light intensity exercise may be more appro-
priate and achievable in the setting of pregnancy.
This data may serve as a reference for clinicians when titrating daytime basal
insulin regimens to optimise glycaemic control whilst minimising the risk of hypo-
glycaemia during pregnancy. In addition, this information may be used to aid in
the refinement and tailoring of algorithms used to drive insulin delivery in a future
artificial pancreas system.
A programme of structured low and moderate intensity exercise with a controlled
diet resulted in improved glucose levels. Exercise may be crucial to achieving near-
normal glucose control, but even in a controlled setting hypoglycaemia could not be
prevented.
131
Chapter 6
Sensor accuracy during exercise in
pregnancy
6.1 Background
6.1.1 Utility of CGM in exercise
Exercise in type 1 diabetes is associated with a significantly increased risk of
hypoglycaemia.[187] Despite awareness of the benefits of exercise, the fear of hypo-
glycaemia often results in over-compensatory behaviours such as excess carbohydrate
consumption or avoidance of exercise, which are associated with worse metabolic
control.[126] Guidelines for type 1 diabetes recommend checking capillary glucose
at least twice before and every 30 minutes during exercise as well on recovery.[226]
This regimen can be difficult to adhere to, particularly if activity must be interrupted
to carry out fingerprick testing. In addition, the information obtained is limited to
isolated glucose measurements. A survey of endurance athletes with type 1 diabetes
found that although the majority monitored glucose levels before and after exercise,
only 50% reported checking during exercise.[265]
The emergence of CGM over the last decade has provided both patients and clin-
icians with a much more detailed picture of glycaemic control.[9] This is especially
useful during physical activity where CGM may serve as a tool to recognise impend-
ing hypoglycaemia or hyperglycaemia, thus enabling appropriate modifications in
therapy. Additionally, CGM may play an important role in detecting delayed, in-
cluding nocturnal, hypoglycaemia that may otherwise go unnoticed when exercise is
performed later in the day.[194]
132
6.1. BACKGROUND
CGM may increase self efficacy during sport by providing glucose readings in
real-time without the need to discontinue exercise, and empower patients to make
more informed decisions regarding insulin and carbohydrates prior to and during
physical activity. Real-time CGM in patients with type 2 diabetes has been shown
to have a positive effect on modification of dietary and exercise habits, evidenced by
improvement in body mass index and HbA1c levels.[266]
CGM may be favoured over fingerprick testing for certain activities, such as dur-
ing sporting competitions when such checks are not practical. The utility and accu-
racy of CGMS Gold (Medtronic, Northridge, CA, USA) in detecting hypoglycaemia
during scuba diving, when symptoms of hypoglycaemia may not be easily recog-
nised, has been demonstrated.[267]
6.1.2 CGM performance during exercise
Optimal performance of currently available CGM devices is limited by calibration
errors and a physiological time lag of glucose transport between blood and intersti-
tial fluid compartments, as well as a device-dependent delay associated with sensor
signal processing and filtering out measurement noise. Accuracy, as measured by
the median relative absolute difference (RAD) between paired sensor and reference
glucose values, ranges from 11% to 14% under resting conditions.[17; 21] Perfor-
mance may be lower at the extremes of the glucose range or when levels are changing
rapidly, both situations of which are commonly associated with exercise.
There are a limited number of studies to date evaluating CGM during physical
activity. Accuracy of the Guardian REAL-Time CGM (Medtronic, Northridge, CA,
USA) was lower during moderate intensity exercise, with mean RAD ranging from
22 − 28% and consistent sensor under-reading during hyperglycaemia.[207; 268] The
previous generation CGMS Gold (Medtronic, Northridge, CA, USA) was evaluated
in 58 adolescents during three separate sports camps, showing a mean RAD of 23%
overall, with 43% in the hypoglycaemic (< 3.9 mmol/l) and 18% in the hypergly-
caemic range (> 10 mmol/l).[269] Evaluation of the FreeStyle Navigator CGM (Ab-
bott Diabetes Care, Alameda, CA, USA) in 30 children with type 1 diabetes demon-
strated a median RAD of 17% during 60 minutes of treadmill exercise improving to
11% with incorporation of a 10-minute sensor lag, compared with a median RAD of
12% over the 24-hour study period.[270]
Current CGM devices employ a glucose oxidase-based sensor which is sensitive
to changes in pH. Theoretically, a fall in pH during intense anaerobic exercise due
133
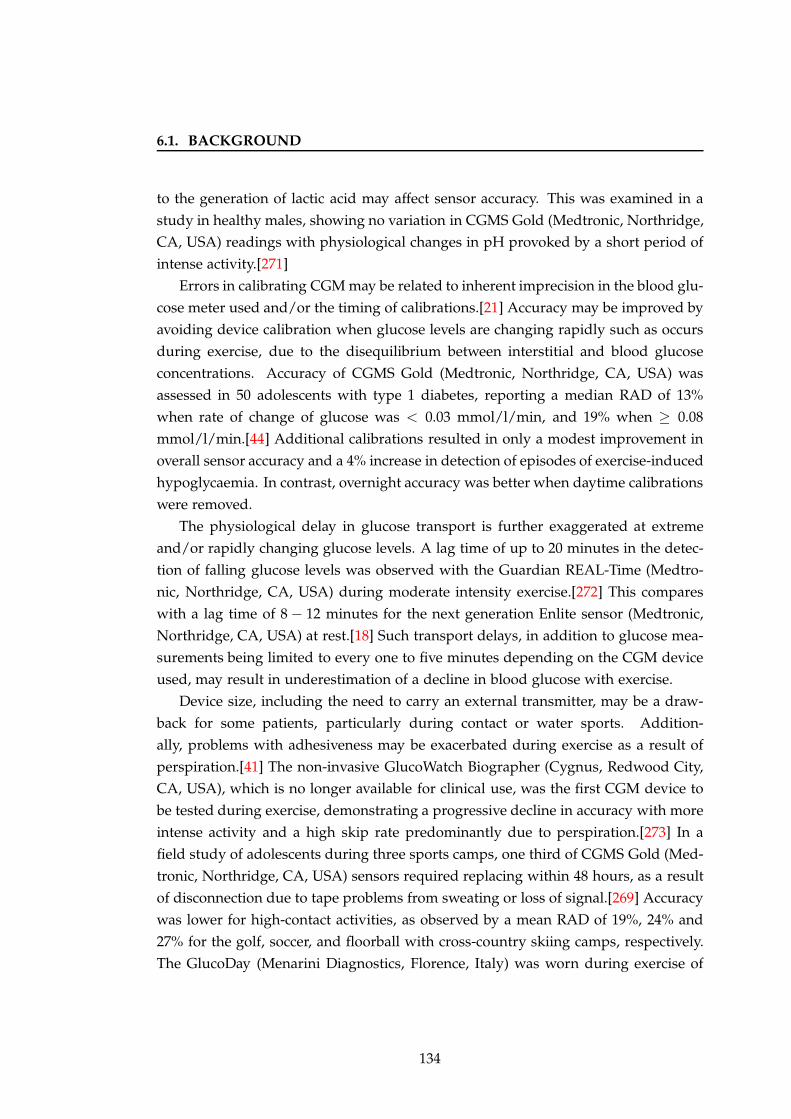
6.1. BACKGROUND
to the generation of lactic acid may affect sensor accuracy. This was examined in a
study in healthy males, showing no variation in CGMS Gold (Medtronic, Northridge,
CA, USA) readings with physiological changes in pH provoked by a short period of
intense activity.[271]
Errors in calibrating CGM may be related to inherent imprecision in the blood glu-
cose meter used and/or the timing of calibrations.[21] Accuracy may be improved by
avoiding device calibration when glucose levels are changing rapidly such as occurs
during exercise, due to the disequilibrium between interstitial and blood glucose
concentrations. Accuracy of CGMS Gold (Medtronic, Northridge, CA, USA) was
assessed in 50 adolescents with type 1 diabetes, reporting a median RAD of 13%
when rate of change of glucose was < 0.03 mmol/l/min, and 19% when ≥ 0.08
mmol/l/min.[44] Additional calibrations resulted in only a modest improvement in
overall sensor accuracy and a 4% increase in detection of episodes of exercise-induced
hypoglycaemia. In contrast, overnight accuracy was better when daytime calibrations
were removed.
The physiological delay in glucose transport is further exaggerated at extreme
and/or rapidly changing glucose levels. A lag time of up to 20 minutes in the detec-
tion of falling glucose levels was observed with the Guardian REAL-Time (Medtro-
nic, Northridge, CA, USA) during moderate intensity exercise.[272] This compares
with a lag time of 8 − 12 minutes for the next generation Enlite sensor (Medtronic,
Northridge, CA, USA) at rest.[18] Such transport delays, in addition to glucose mea-
surements being limited to every one to five minutes depending on the CGM device
used, may result in underestimation of a decline in blood glucose with exercise.
Device size, including the need to carry an external transmitter, may be a draw-
back for some patients, particularly during contact or water sports. Addition-
ally, problems with adhesiveness may be exacerbated during exercise as a result of
perspiration.[41] The non-invasive GlucoWatch Biographer (Cygnus, Redwood City,
CA, USA), which is no longer available for clinical use, was the first CGM device to
be tested during exercise, demonstrating a progressive decline in accuracy with more
intense activity and a high skip rate predominantly due to perspiration.[273] In a
field study of adolescents during three sports camps, one third of CGMS Gold (Med-
tronic, Northridge, CA, USA) sensors required replacing within 48 hours, as a result
of disconnection due to tape problems from sweating or loss of signal.[269] Accuracy
was lower for high-contact activities, as observed by a mean RAD of 19%, 24% and
27% for the golf, soccer, and floorball with cross-country skiing camps, respectively.
The GlucoDay (Menarini Diagnostics, Florence, Italy) was worn during exercise of
134
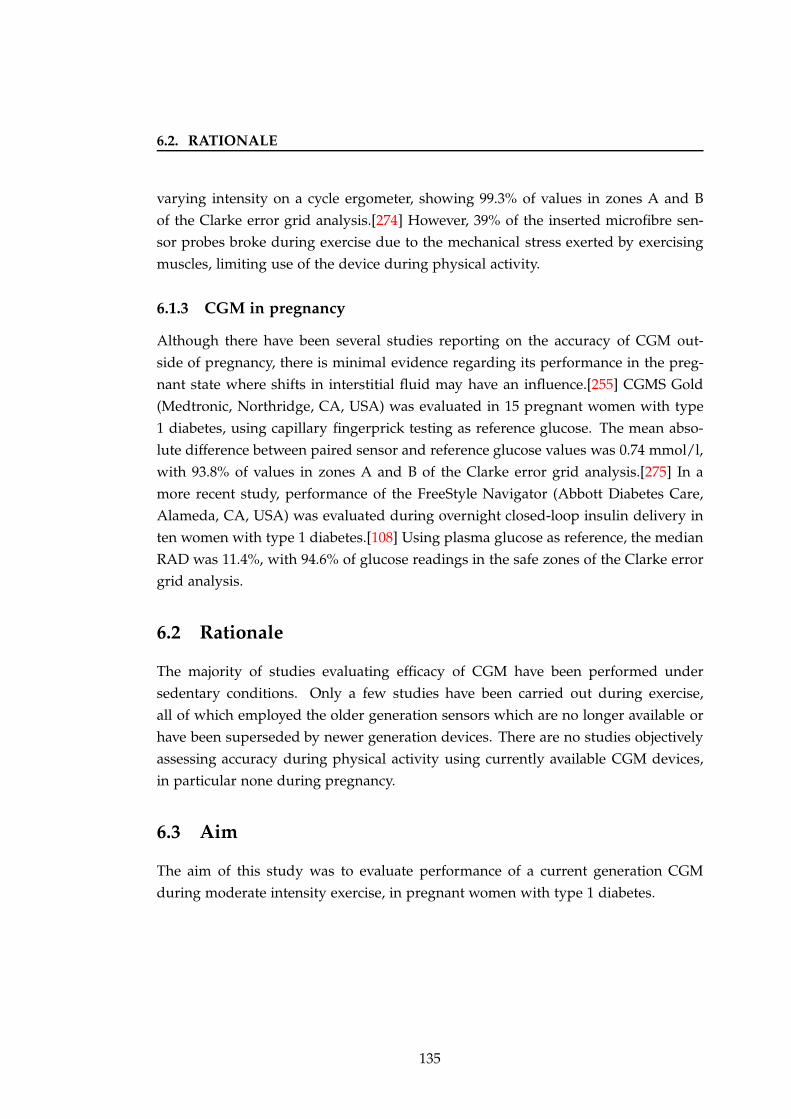
6.2. RATIONALE
varying intensity on a cycle ergometer, showing 99.3% of values in zones A and B
of the Clarke error grid analysis.[274] However, 39% of the inserted microfibre sen-
sor probes broke during exercise due to the mechanical stress exerted by exercising
muscles, limiting use of the device during physical activity.
6.1.3 CGM in pregnancy
Although there have been several studies reporting on the accuracy of CGM out-
side of pregnancy, there is minimal evidence regarding its performance in the preg-
nant state where shifts in interstitial fluid may have an influence.[255] CGMS Gold
(Medtronic, Northridge, CA, USA) was evaluated in 15 pregnant women with type
1 diabetes, using capillary fingerprick testing as reference glucose. The mean abso-
lute difference between paired sensor and reference glucose values was 0.74 mmol/l,
with 93.8% of values in zones A and B of the Clarke error grid analysis.[275] In a
more recent study, performance of the FreeStyle Navigator (Abbott Diabetes Care,
Alameda, CA, USA) was evaluated during overnight closed-loop insulin delivery in
ten women with type 1 diabetes.[108] Using plasma glucose as reference, the median
RAD was 11.4%, with 94.6% of glucose readings in the safe zones of the Clarke error
grid analysis.
6.2 Rationale
The majority of studies evaluating efficacy of CGM have been performed under
sedentary conditions. Only a few studies have been carried out during exercise,
all of which employed the older generation sensors which are no longer available or
have been superseded by newer generation devices. There are no studies objectively
assessing accuracy during physical activity using currently available CGM devices,
in particular none during pregnancy.
6.3 Aim
The aim of this study was to evaluate performance of a current generation CGM
during moderate intensity exercise, in pregnant women with type 1 diabetes.
135
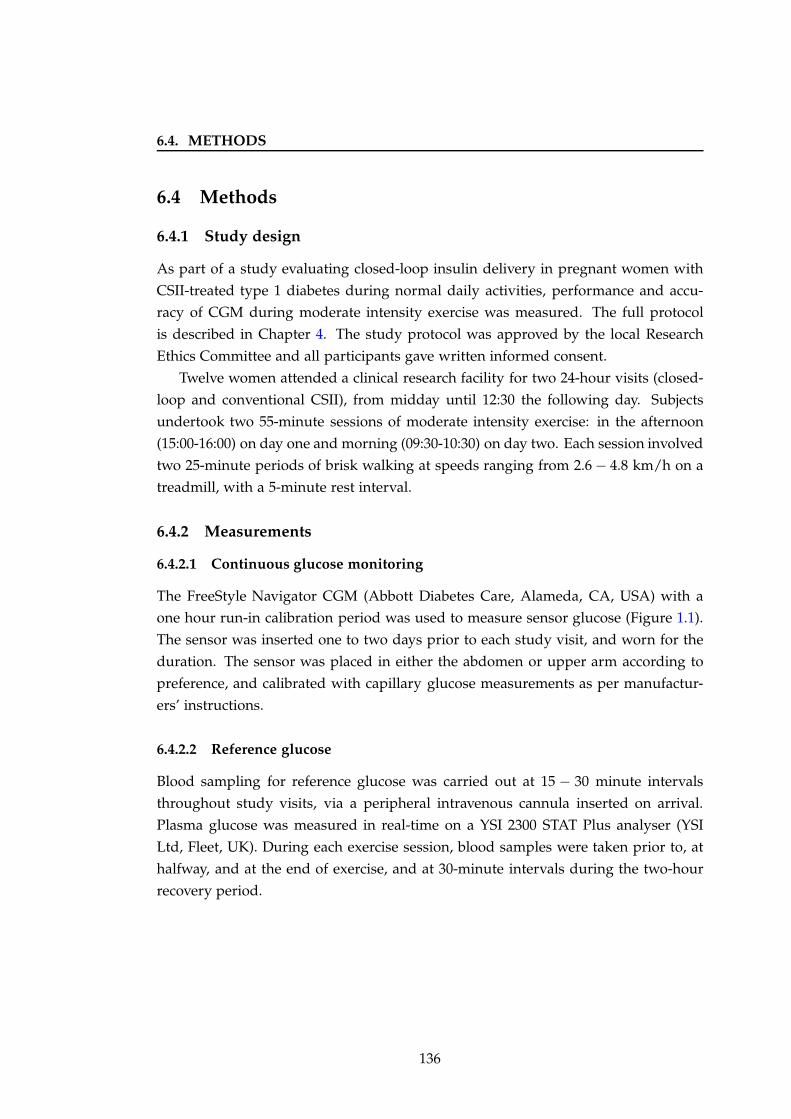
6.4. METHODS
6.4 Methods
6.4.1 Study design
As part of a study evaluating closed-loop insulin delivery in pregnant women with
CSII-treated type 1 diabetes during normal daily activities, performance and accu-
racy of CGM during moderate intensity exercise was measured. The full protocol
is described in Chapter 4. The study protocol was approved by the local Research
Ethics Committee and all participants gave written informed consent.
Twelve women attended a clinical research facility for two 24-hour visits (closed-
loop and conventional CSII), from midday until 12:30 the following day. Subjects
undertook two 55-minute sessions of moderate intensity exercise: in the afternoon
(15:00-16:00) on day one and morning (09:30-10:30) on day two. Each session involved
two 25-minute periods of brisk walking at speeds ranging from 2.6 − 4.8 km/h on a
treadmill, with a 5-minute rest interval.
6.4.2 Measurements
6.4.2.1 Continuous glucose monitoring
The FreeStyle Navigator CGM (Abbott Diabetes Care, Alameda, CA, USA) with a
one hour run-in calibration period was used to measure sensor glucose (Figure 1.1).
The sensor was inserted one to two days prior to each study visit, and worn for the
duration. The sensor was placed in either the abdomen or upper arm according to
preference, and calibrated with capillary glucose measurements as per manufactur-
ers’ instructions.
6.4.2.2 Reference glucose
Blood sampling for reference glucose was carried out at 15 − 30 minute intervals
throughout study visits, via a peripheral intravenous cannula inserted on arrival.
Plasma glucose was measured in real-time on a YSI 2300 STAT Plus analyser (YSI
Ltd, Fleet, UK). During each exercise session, blood samples were taken prior to, at
halfway, and at the end of exercise, and at 30-minute intervals during the two-hour
recovery period.
136
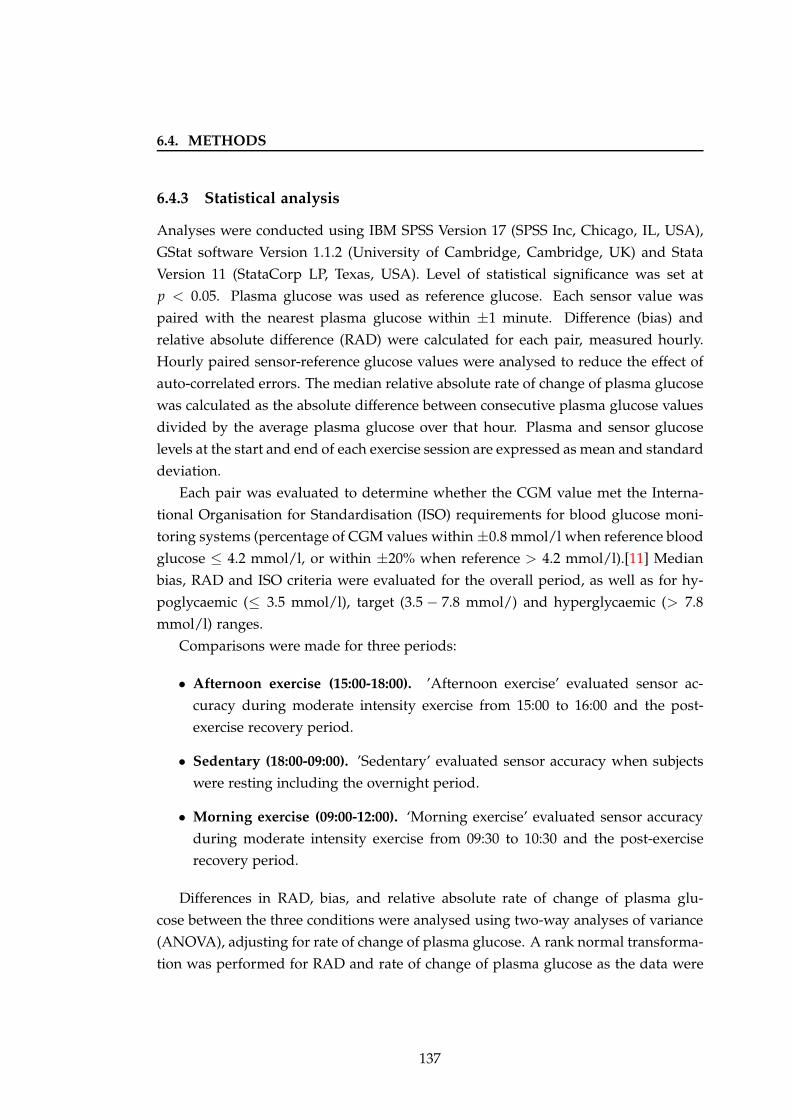
6.4. METHODS
6.4.3 Statistical analysis
Analyses were conducted using IBM SPSS Version 17 (SPSS Inc, Chicago, IL, USA),
GStat software Version 1.1.2 (University of Cambridge, Cambridge, UK) and Stata
Version 11 (StataCorp LP, Texas, USA). Level of statistical significance was set at
p < 0.05. Plasma glucose was used as reference glucose. Each sensor value was
paired with the nearest plasma glucose within ±1 minute. Difference (bias) and
relative absolute difference (RAD) were calculated for each pair, measured hourly.
Hourly paired sensor-reference glucose values were analysed to reduce the effect of
auto-correlated errors. The median relative absolute rate of change of plasma glucose
was calculated as the absolute difference between consecutive plasma glucose values
divided by the average plasma glucose over that hour. Plasma and sensor glucose
levels at the start and end of each exercise session are expressed as mean and standard
deviation.
Each pair was evaluated to determine whether the CGM value met the Interna-
tional Organisation for Standardisation (ISO) requirements for blood glucose moni-
toring systems (percentage of CGM values within ±0.8 mmol/l when reference blood
glucose ≤ 4.2 mmol/l, or within ±20% when reference > 4.2 mmol/l).[11] Median
bias, RAD and ISO criteria were evaluated for the overall period, as well as for hy-
poglycaemic (≤ 3.5 mmol/l), target (3.5 − 7.8 mmol/) and hyperglycaemic (> 7.8
mmol/l) ranges.
Comparisons were made for three periods:
• Afternoon exercise (15:00-18:00). ’Afternoon exercise’ evaluated sensor ac-
curacy during moderate intensity exercise from 15:00 to 16:00 and the post-
exercise recovery period.
• Sedentary (18:00-09:00). ’Sedentary’ evaluated sensor accuracy when subjects
were resting including the overnight period.
• Morning exercise (09:00-12:00). ‘Morning exercise’ evaluated sensor accuracy
during moderate intensity exercise from 09:30 to 10:30 and the post-exercise
recovery period.
Differences in RAD, bias, and relative absolute rate of change of plasma glu-
cose between the three conditions were analysed using two-way analyses of variance
(ANOVA), adjusting for rate of change of plasma glucose. A rank normal transforma-
tion was performed for RAD and rate of change of plasma glucose as the data were
137
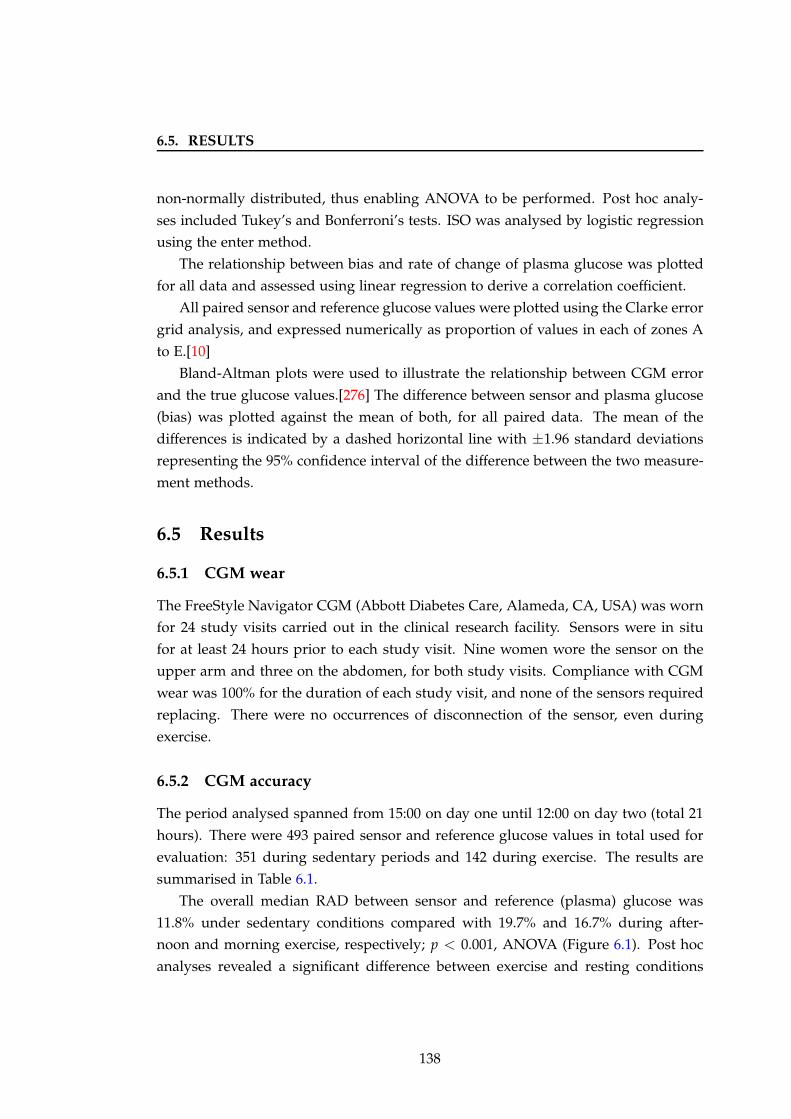
6.5. RESULTS
non-normally distributed, thus enabling ANOVA to be performed. Post hoc analy-
ses included Tukey’s and Bonferroni’s tests. ISO was analysed by logistic regression
using the enter method.
The relationship between bias and rate of change of plasma glucose was plotted
for all data and assessed using linear regression to derive a correlation coefficient.
All paired sensor and reference glucose values were plotted using the Clarke error
grid analysis, and expressed numerically as proportion of values in each of zones A
to E.[10]
Bland-Altman plots were used to illustrate the relationship between CGM error
and the true glucose values.[276] The difference between sensor and plasma glucose
(bias) was plotted against the mean of both, for all paired data. The mean of the
differences is indicated by a dashed horizontal line with ±1.96 standard deviations
representing the 95% confidence interval of the difference between the two measure-
ment methods.
6.5 Results
6.5.1 CGM wear
The FreeStyle Navigator CGM (Abbott Diabetes Care, Alameda, CA, USA) was worn
for 24 study visits carried out in the clinical research facility. Sensors were in situ
for at least 24 hours prior to each study visit. Nine women wore the sensor on the
upper arm and three on the abdomen, for both study visits. Compliance with CGM
wear was 100% for the duration of each study visit, and none of the sensors required
replacing. There were no occurrences of disconnection of the sensor, even during
exercise.
6.5.2 CGM accuracy
The period analysed spanned from 15:00 on day one until 12:00 on day two (total 21
hours). There were 493 paired sensor and reference glucose values in total used for
evaluation: 351 during sedentary periods and 142 during exercise. The results are
summarised in Table 6.1.
The overall median RAD between sensor and reference (plasma) glucose was
11.8% under sedentary conditions compared with 19.7% and 16.7% during after-
noon and morning exercise, respectively; p < 0.001, ANOVA (Figure 6.1). Post hoc
analyses revealed a significant difference between exercise and resting conditions
138
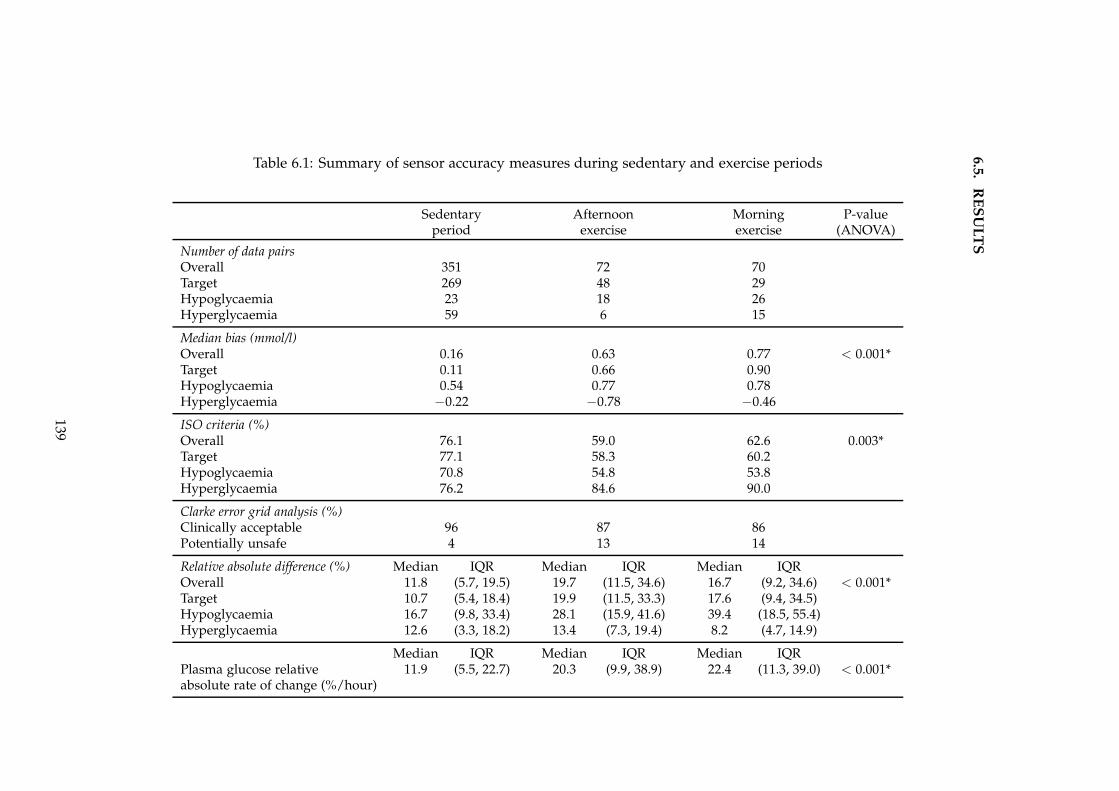
6.5
.R
ES
UL
TS
Table 6.1: Summary of sensor accuracy measures during sedentary and exercise periods
Sedentary Afternoon Morning P-valueperiod exercise exercise (ANOVA)
Number of data pairsOverall 351 72 70Target 269 48 29Hypoglycaemia 23 18 26Hyperglycaemia 59 6 15
Median bias (mmol/l)Overall 0.16 0.63 0.77 < 0.001*Target 0.11 0.66 0.90Hypoglycaemia 0.54 0.77 0.78Hyperglycaemia −0.22 −0.78 −0.46
ISO criteria (%)Overall 76.1 59.0 62.6 0.003*Target 77.1 58.3 60.2Hypoglycaemia 70.8 54.8 53.8Hyperglycaemia 76.2 84.6 90.0
Clarke error grid analysis (%)Clinically acceptable 96 87 86Potentially unsafe 4 13 14
Relative absolute difference (%) Median IQR Median IQR Median IQROverall 11.8 (5.7, 19.5) 19.7 (11.5, 34.6) 16.7 (9.2, 34.6) < 0.001*Target 10.7 (5.4, 18.4) 19.9 (11.5, 33.3) 17.6 (9.4, 34.5)Hypoglycaemia 16.7 (9.8, 33.4) 28.1 (15.9, 41.6) 39.4 (18.5, 55.4)Hyperglycaemia 12.6 (3.3, 18.2) 13.4 (7.3, 19.4) 8.2 (4.7, 14.9)
Median IQR Median IQR Median IQRPlasma glucose relative 11.9 (5.5, 22.7) 20.3 (9.9, 38.9) 22.4 (11.3, 39.0) < 0.001*absolute rate of change (%/hour)
139
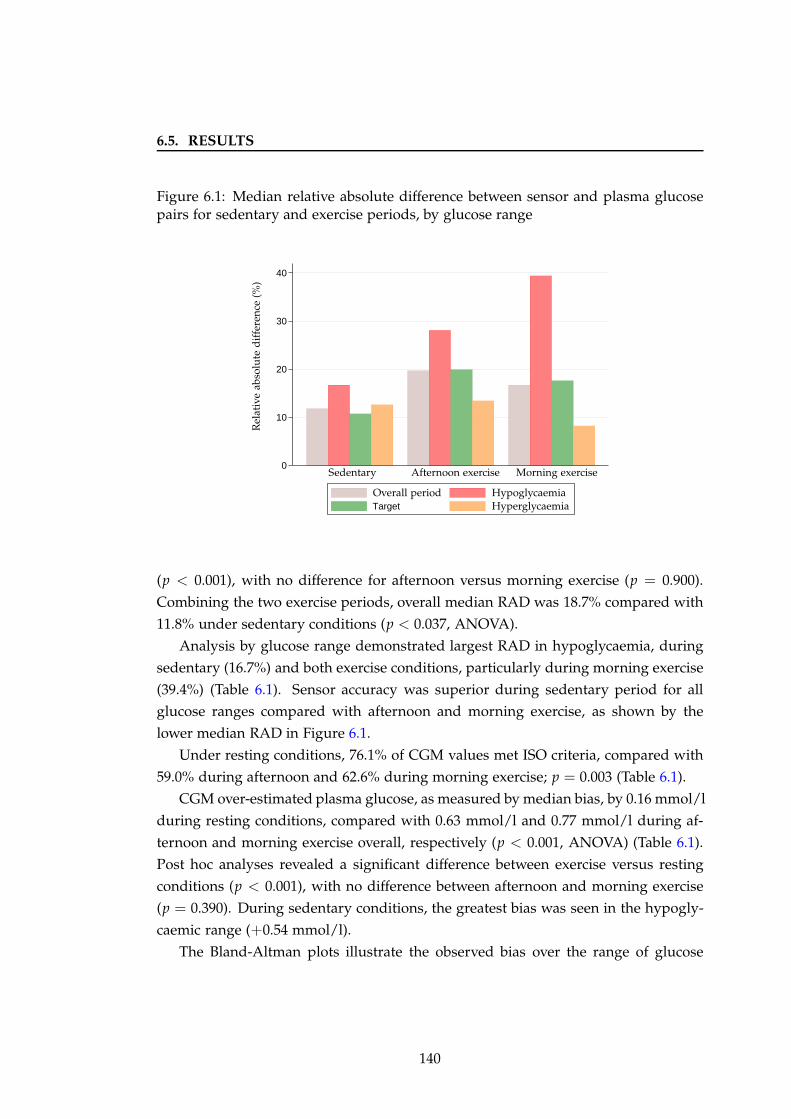
6.5. RESULTS
Figure 6.1: Median relative absolute difference between sensor and plasma glucosepairs for sedentary and exercise periods, by glucose range
0
10
20
30
40
Target
Rel
ativ
eab
solu
ted
iffe
ren
ce(%
)
Sedentary Afternoon exercise Morning exercise
HypoglycaemiaHyperglycaemia
Overall period
(p < 0.001), with no difference for afternoon versus morning exercise (p = 0.900).
Combining the two exercise periods, overall median RAD was 18.7% compared with
11.8% under sedentary conditions (p < 0.037, ANOVA).
Analysis by glucose range demonstrated largest RAD in hypoglycaemia, during
sedentary (16.7%) and both exercise conditions, particularly during morning exercise
(39.4%) (Table 6.1). Sensor accuracy was superior during sedentary period for all
glucose ranges compared with afternoon and morning exercise, as shown by the
lower median RAD in Figure 6.1.
Under resting conditions, 76.1% of CGM values met ISO criteria, compared with
59.0% during afternoon and 62.6% during morning exercise; p = 0.003 (Table 6.1).
CGM over-estimated plasma glucose, as measured by median bias, by 0.16 mmol/l
during resting conditions, compared with 0.63 mmol/l and 0.77 mmol/l during af-
ternoon and morning exercise overall, respectively (p < 0.001, ANOVA) (Table 6.1).
Post hoc analyses revealed a significant difference between exercise versus resting
conditions (p < 0.001), with no difference between afternoon and morning exercise
(p = 0.390). During sedentary conditions, the greatest bias was seen in the hypogly-
caemic range (+0.54 mmol/l).
The Bland-Altman plots illustrate the observed bias over the range of glucose
140
6.5. RESULTS
concentrations (Figure 6.2). Under sedentary conditions, the majority of values were
within the 95% confidence interval. Values outside these limits were evenly dis-
tributed across the range of glucose concentrations, with a tendency for CGM overes-
timation during hyperglycaemia and underestimation during hypoglycaemia (panel
6.2a).
During afternoon exercise there was a greater proportion of outlying values in the
negative bias range, indicating sensor underestimation (panel 6.2b). During morning
exercise there was similar over- and under-reading by the sensor across the glucose
range with only a few values outside the 95% confidence interval (panel 6.2c).
Using the Clarke error grid analysis, 96% of values were in the clinically accept-
able zones A + B during resting conditions, compared with 87% during afternoon
exercise and 86% during morning exercise (Table 6.1). Figure 6.3 displays the plotted
paired sensor and plasma glucose measurements. Zone D contained 4% of points
during rest and 13 − 14% during exercise. There were no values in zones C or E.
6.5.3 Rate of change of glucose
The relative absolute rate of change of plasma glucose was significantly lower during
sedentary (11.9%) conditions compared with afternoon (20.3%) and morning exercise
(22.4%); p < 0.001, ANOVA. Even after adjusting for the relative absolute rate of
plasma glucose change, the differences in median RAD between resting and the two
exercise periods remained significant (p < 0.001). When the sedentary period was
excluded from the analysis, there was no difference between the two exercise periods
after adjusting for the relative absolute rate of plasma glucose change (p = 0.568).
The plasma and sensor glucose profiles during afternoon and morning exercise
sessions are shown in Figure 6.4. Plasma glucose declined by 1.2 ± 1.8 mmol/l, com-
pared with 0.9 ± 1.6 mmol/l for sensor glucose (p = 0.255), from start to end of
afternoon exercise. There was a significant difference between mean plasma and
CGM glucose at the end of afternoon exercise (4.8 ± 1.6 mmol/l versus 5.5 ± 1.7
mmol/l; p = 0.036). Similarly, at the end of morning exercise, plasma glucose was
5.9 ± 3.1 mmol/l and CGM was 7.3 ± 2.5 mmol/l (p < 0.001), with a more rapid
decline in plasma glucose (2.9 ± 2.6 versus 2.1 ± 2.5; p = 0.003). Of note, exercise
was commenced at higher plasma glucose in the morning (8.8 ± 2.6 mmol/l) com-
pared with 6.0± 1.8 mmol/l prior to afternoon exercise. These results indicate sensor
over-reading as plasma glucose levels were falling with exercise. Mean fingerprick
capillary glucose readings performed before, during and after exercise were gener-
141
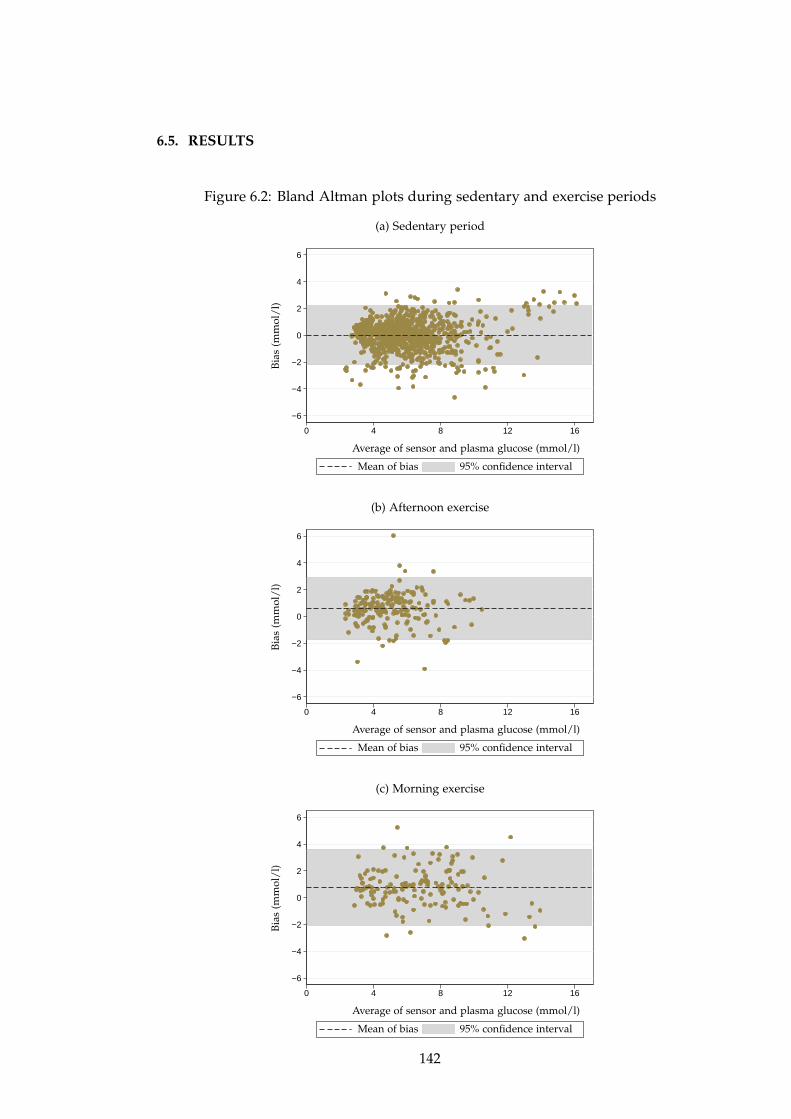
6.5. RESULTS
Figure 6.2: Bland Altman plots during sedentary and exercise periods
(a) Sedentary period
−6
−4
−2
0
2
4
6
0 4 8 12 16
Bia
s(m
mol
/l)
Average of sensor and plasma glucose (mmol/l)
Mean of bias 95% confidence interval
(b) Afternoon exercise
−6
−4
−2
0
2
4
6
0 4 8 12 16
Bia
s(m
mol
/l)
Average of sensor and plasma glucose (mmol/l)
Mean of bias 95% confidence interval
(c) Morning exercise
−6
−4
−2
0
2
4
6
0 4 8 12 16
Bia
s(m
mol
/l)
Average of sensor and plasma glucose (mmol/l)
Mean of bias 95% confidence interval
142
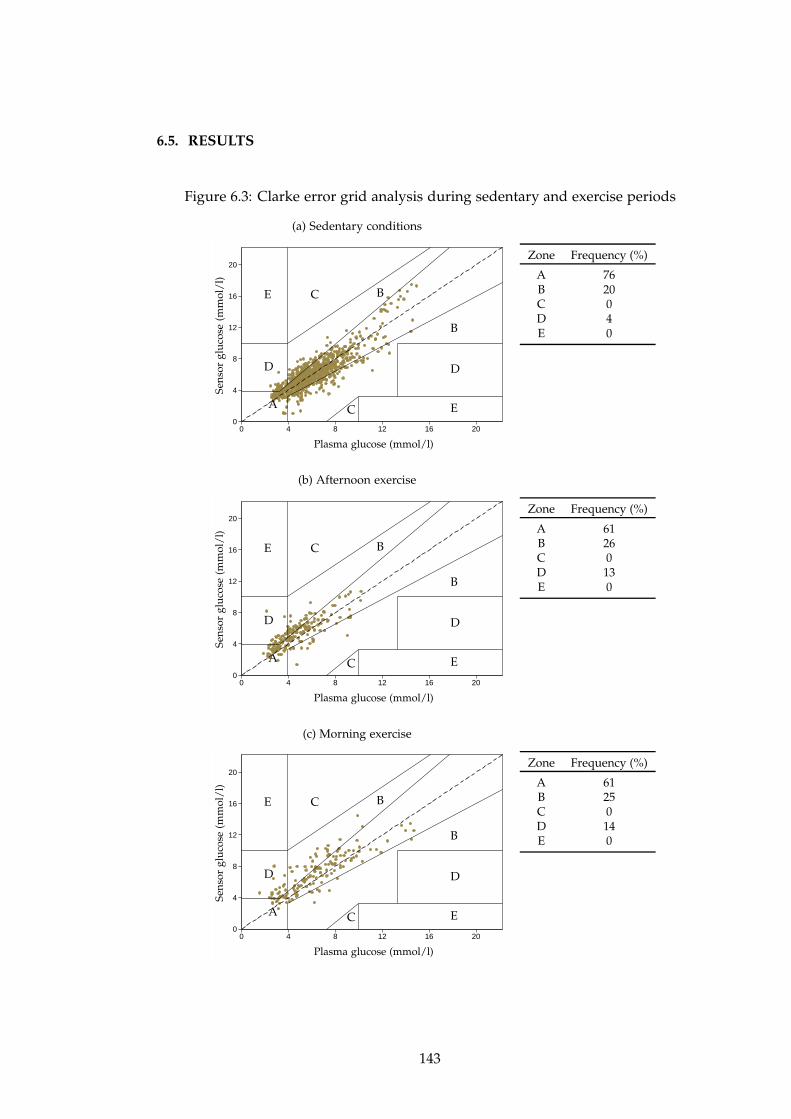
6.5. RESULTS
Figure 6.3: Clarke error grid analysis during sedentary and exercise periods
(a) Sedentary conditions
0
4
8
12
16
20
0 4 8 12 16 20
Sen
sor
glu
cose
(mm
ol/
l)
Plasma glucose (mmol/l)
A
B
B
C
C
DD
E
E
Zone Frequency (%)
A 76B 20C 0D 4E 0
(b) Afternoon exercise
0
4
8
12
16
20
0 4 8 12 16 20
Sen
sor
glu
cose
(mm
ol/
l)
Plasma glucose (mmol/l)
A
B
B
C
C
DD
E
E
Zone Frequency (%)
A 61B 26C 0D 13E 0
(c) Morning exercise
0
4
8
12
16
20
0 4 8 12 16 20
Sen
sor
glu
cose
(mm
ol/
l)
Plasma glucose (mmol/l)
A
B
B
C
C
DD
E
E
Zone Frequency (%)
A 61B 25C 0D 14E 0
143
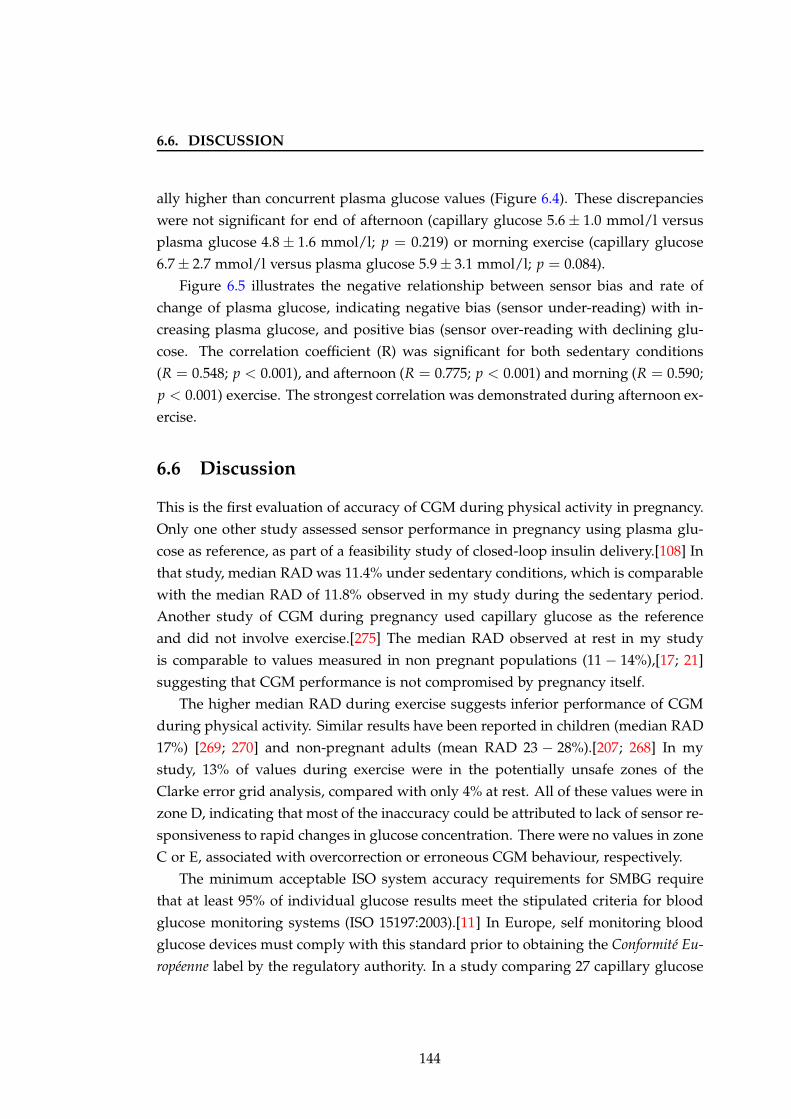
6.6. DISCUSSION
ally higher than concurrent plasma glucose values (Figure 6.4). These discrepancies
were not significant for end of afternoon (capillary glucose 5.6 ± 1.0 mmol/l versus
plasma glucose 4.8 ± 1.6 mmol/l; p = 0.219) or morning exercise (capillary glucose
6.7 ± 2.7 mmol/l versus plasma glucose 5.9 ± 3.1 mmol/l; p = 0.084).
Figure 6.5 illustrates the negative relationship between sensor bias and rate of
change of plasma glucose, indicating negative bias (sensor under-reading) with in-
creasing plasma glucose, and positive bias (sensor over-reading with declining glu-
cose. The correlation coefficient (R) was significant for both sedentary conditions
(R = 0.548; p < 0.001), and afternoon (R = 0.775; p < 0.001) and morning (R = 0.590;
p < 0.001) exercise. The strongest correlation was demonstrated during afternoon ex-
ercise.
6.6 Discussion
This is the first evaluation of accuracy of CGM during physical activity in pregnancy.
Only one other study assessed sensor performance in pregnancy using plasma glu-
cose as reference, as part of a feasibility study of closed-loop insulin delivery.[108] In
that study, median RAD was 11.4% under sedentary conditions, which is comparable
with the median RAD of 11.8% observed in my study during the sedentary period.
Another study of CGM during pregnancy used capillary glucose as the reference
and did not involve exercise.[275] The median RAD observed at rest in my study
is comparable to values measured in non pregnant populations (11 − 14%),[17; 21]
suggesting that CGM performance is not compromised by pregnancy itself.
The higher median RAD during exercise suggests inferior performance of CGM
during physical activity. Similar results have been reported in children (median RAD
17%) [269; 270] and non-pregnant adults (mean RAD 23 − 28%).[207; 268] In my
study, 13% of values during exercise were in the potentially unsafe zones of the
Clarke error grid analysis, compared with only 4% at rest. All of these values were in
zone D, indicating that most of the inaccuracy could be attributed to lack of sensor re-
sponsiveness to rapid changes in glucose concentration. There were no values in zone
C or E, associated with overcorrection or erroneous CGM behaviour, respectively.
The minimum acceptable ISO system accuracy requirements for SMBG require
that at least 95% of individual glucose results meet the stipulated criteria for blood
glucose monitoring systems (ISO 15197:2003).[11] In Europe, self monitoring blood
glucose devices must comply with this standard prior to obtaining the Conformité Eu-
ropéenne label by the regulatory authority. In a study comparing 27 capillary glucose
144
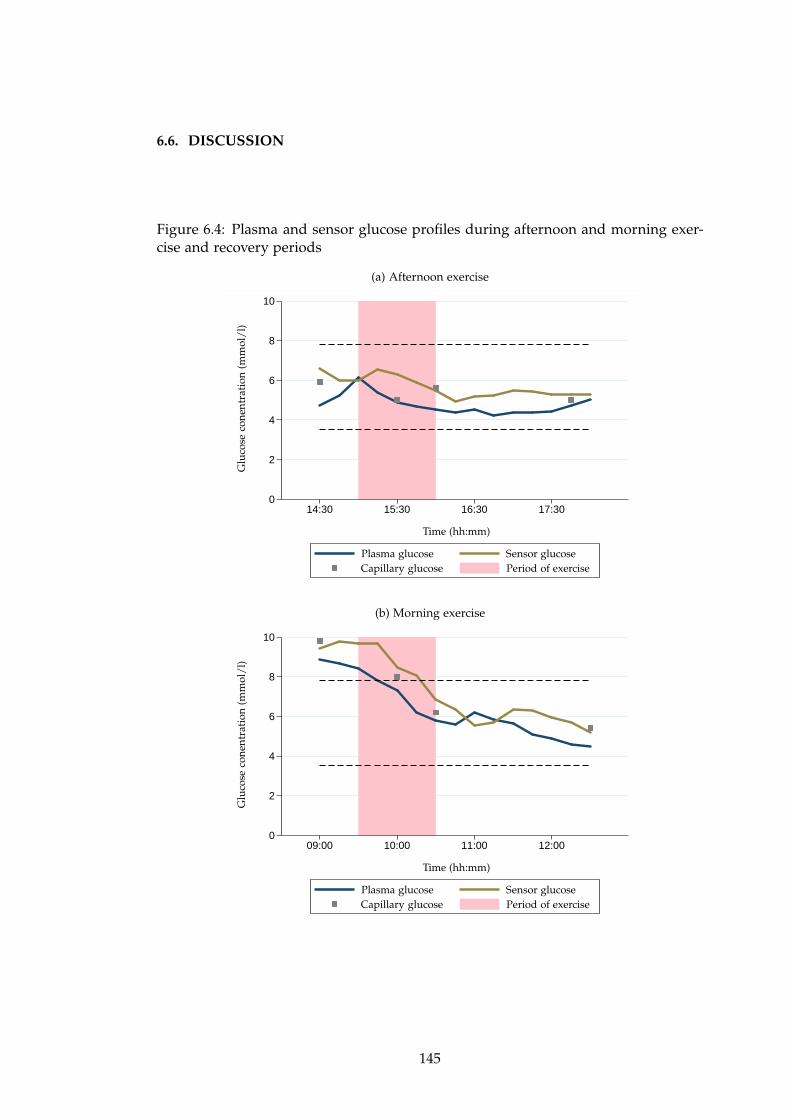
6.6. DISCUSSION
Figure 6.4: Plasma and sensor glucose profiles during afternoon and morning exer-cise and recovery periods
(a) Afternoon exercise
0
2
4
6
8
10
14:30 15:30 16:30 17:30
Glu
cose
con
entr
atio
n(m
mol
/l)
Time (hh:mm)
Plasma glucose Sensor glucoseCapillary glucose Period of exercise
(b) Morning exercise
0
2
4
6
8
10
09:00 10:00 11:00 12:00
Glu
cose
con
entr
atio
n(m
mol
/l)
Time (hh:mm)
Plasma glucose Sensor glucoseCapillary glucose Period of exercise
145
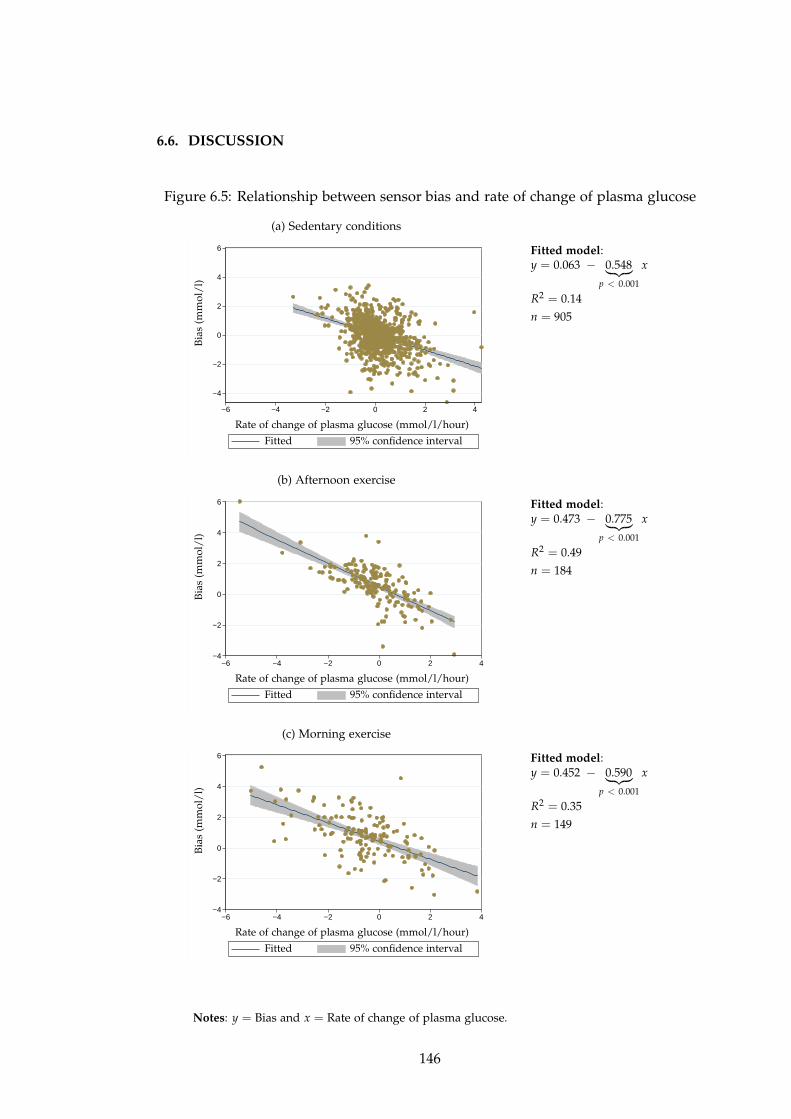
6.6. DISCUSSION
Figure 6.5: Relationship between sensor bias and rate of change of plasma glucose
(a) Sedentary conditions
−4
−2
0
2
4
6
−6 −4 −2 0 2 4
Bia
s(m
mol
/l)
Rate of change of plasma glucose (mmol/l/hour)
Fitted 95% confidence interval
Fitted model:y = 0.063 − 0.548
︸ ︷︷ ︸
p < 0.001
x
R2 = 0.14
n = 905
(b) Afternoon exercise
−4
−2
0
2
4
6
−6 −4 −2 0 2 4
Bia
s(m
mol
/l)
Rate of change of plasma glucose (mmol/l/hour)
Fitted 95% confidence interval
Fitted model:y = 0.473 − 0.775
︸ ︷︷ ︸
p < 0.001
x
R2 = 0.49
n = 184
(c) Morning exercise
−4
−2
0
2
4
6
−6 −4 −2 0 2 4
Bia
s(m
mol
/l)
Rate of change of plasma glucose (mmol/l/hour)
Fitted 95% confidence interval
Fitted model:y = 0.452 − 0.590
︸ ︷︷ ︸
p < 0.001
x
R2 = 0.35
n = 149
Notes: y = Bias and x = Rate of change of plasma glucose.
146
6.6. DISCUSSION
monitoring devices, 95% of glucose values for each device met the ISO standard.[8]
Similarly, between 90% and 99% of values of five commercially used home blood
glucose monitoring devices were within acceptable range.[277] The ISO criteria may
also by applied to CGM devices. In my study, only 76% of FreeStyle Navigator CGM
values met the ISO standard during sedentary conditions, with an even lower pro-
portion under exercise conditions.
At the end of the exercise sessions, plasma glucose levels were lower than CGM
(4.8 mmol/l versus 5.5 mmol/l for afternoon, and 5.9 mmol/l versus 7.3 mmol/l for
morning exercise), suggesting a delay in the response of CGM to declining glucose
levels, most likely due to the delay in transport of glucose from blood to the intersti-
tial compartment. This observation is clinically significant as inaccurate estimation
of glucose control based on CGM values whilst exercising may lead to failure to
recognise and treat true hypoglycaemia. CGM under-reading in the hyperglycaemic
range has been observed previously.[207] Incorporation of a lag time between inter-
stitial and plasma glucose, which may be increased during exercise, may improve
accuracy.[270]
Fingerprick glucose readings taken during exercise tended to be higher than cor-
responding plasma glucose (Figure 6.4). This is another important clinical obser-
vation as the majority of patients currently rely on conventional capillary glucose
monitoring during exercise.
Inferior performance of CGM during physical activity may be correlated with the
rapid fluxes in glucose levels associated with exercise. In my study, however, sensor
accuracy appeared to be higher in the morning (RAD 16.7%) when plasma glucose
was changing more rapidly (22.4% rate of change), compared with afternoon exercise
(RAD 19.7%) when rate of change of glucose was 20.3%.
There was a significant negative correlation between bias and rate of change of
plasma glucose during both sedentary and exercise conditions, with the greatest cor-
relation during afternoon exercise. When rate of change of plasma glucose was in-
cluded as a covariate in the ANOVA model, there was still a significant difference
in accuracy as measured by median RAD between resting and exercise periods, sug-
gesting that rate of change alone does not account for the observed differences in
accuracy.
The majority of studies evaluating accuracy of CGM have been carried out un-
der sedentary conditions, hence there is a lack of data on the influence of factors
related to exercise such as changes in subcutaneous tissue circulation and increased
temperature. Rapid shifts in ambient temperature have been shown to result in at
147
6.6. DISCUSSION
least 5% over or underestimation of glucose results by conventional self-monitoring
blood glucose devices.[278] When moving between environments differing in ambi-
ent temperature, it is suggested that patients wait at least 15 minutes before testing
to allow for temperature equilibration of both the meter and glucose strips. Per-
formance of microdialysis-based CGM devices is influenced by temperature with a
4% variation in current signal observed for each change in degree centigrade.[279]
This is thought to be associated with the catalytic activity of glucose oxidase, per-
meability of the microdialysis probe to glucose and water solubility of oxygen. Ap-
plication of a temperature-compensating algorithm resulted in improved accuracy of
the next generation microdialysis-based sensor, GlucoMenDay (Menarini, Florence,
Italy).[15] Changes in temperature may also hinder the performance of newer non-
invasive continuous glucose sensors such as those employing infrared or impedance
spectroscopy.[22] However, there is no data suggesting an effect of temperature on
the more commonly used needle-based CGM devices, as employed in my study.
Decline in pH, as occurs with the development of lactic acidosis during more
intense exercise, has not been shown to affect sensor performance.[271] Errors due to
variations in oxygen concentration of blood are less likely in the current generation
glucose oxidase-based CGM devices. Calibration of the device also has an important
effect on accuracy, which may be improved by avoiding calibration at times of rapidly
changing glucose or glucose extremes.[21]
Another potential source of inaccuracy is sensor dislodgement due to sweating,
or direct mechanical forces on sensors sited in exercising limbs.[269; 273; 274] In my
study there were no problems with loss of signal or missed readings during exercise.
Sensors remained intact for the duration of the study visit in all participants, although
the intensity of exercise performed may not have been high enough to precipitate
displacement.
The major strength of this analysis was the use of plasma glucose as reference,
allowing objective evaluation of sensor glucose performance. Reference plasma glu-
cose was measured using a YSI 2300 STAT Plus analyser, which is regarded as a gold
standard for analysing blood glucose. The CGM was calibrated with capillary glu-
cose according to manufacturers’ instructions, which provides a better representation
of performance of CGM in the real life setting, unlike previous studies where blood
glucose measurements were used to calibrate the CGM device.[269]
Another important strength was the evaluation of a current generation CGM de-
vice commercially available in Europe, which enables direct applicability of the re-
sults in clinical practice. However, as physical activity has a complex and variable
148
6.7. CONCLUSION
effect on glucose control, these observations of CGM performance may not be ap-
plicable to other intensities, timing or duration of physical activity. Studies evaluat-
ing currently available CGM devices under various exercise conditions and in larger
numbers of subjects are required.
6.7 Conclusion
This is the first objective evaluation of CGM in pregnant women with type 1 diabetes
during normal daily activities, demonstrating feasibility of CGM during moderate
intensity exercise whilst maintaining reasonable performance. Sensor accuracy was
lower when glucose levels were in the hypoglycaemic range during both sedentary
and exercise conditions. Although accuracy was reduced during exercise, this dif-
ference was only partly explained by the higher rate of change of glucose associated
with physical activity. Over 13% of sensor glucose measurements during exercise
were considered clinically unsafe. There was a tendency for CGM to lag behind
and hence overestimate plasma glucose as levels declined with exercise. These ob-
servations can be directly applied to CGM use in clinical practice, and additionally
will need to be considered in the future development of closed-loop insulin delivery
systems for use during normal daily activities including exercise.
149
Chapter 7
Conclusions
7.1 Summary of results
Closed-loop insulin delivery was evaluated in three randomised crossover studies in
24 adults and 12 pregnant women with type 1 diabetes, in a controlled setting. The
results are summarised in Figure 7.1.
Feasibility of overnight closed-loop insulin delivery
The feasibility study confirmed the safety and efficacy of overnight closed-loop in-
sulin delivery in adults with type 1 diabetes, following a standard evening meal.
Compared with conventional insulin pump therapy (CSII), closed-loop increased the
time spent in target glucose (3.9 − 8.0 mmol/l) by 24% and reduced glycaemic vari-
ability. Importantly, there was a halving of the low blood glucose index measuring
duration and extent of hypoglycaemia, and a trend towards less time spent below
3.9 mmol/l during closed-loop. The benefits were proportional to time spent using
closed-loop, as indicated by a greater time in target after midnight. The favourable
effect on glucose control persisted during the morning even after closed-loop was
discontinued and usual CSII was resumed at 08:00, with increased time in target and
reduced time in hyperglycaemia.
Closed-loop insulin delivery after evening meal and alcohol
Twelve further adults with type 1 diabetes were evaluated during overnight closed-
loop insulin delivery following a larger evening meal and moderate amount of al-
cohol, associated with postprandial hyperglycaemia and delayed hypoglycaemia, re-
150
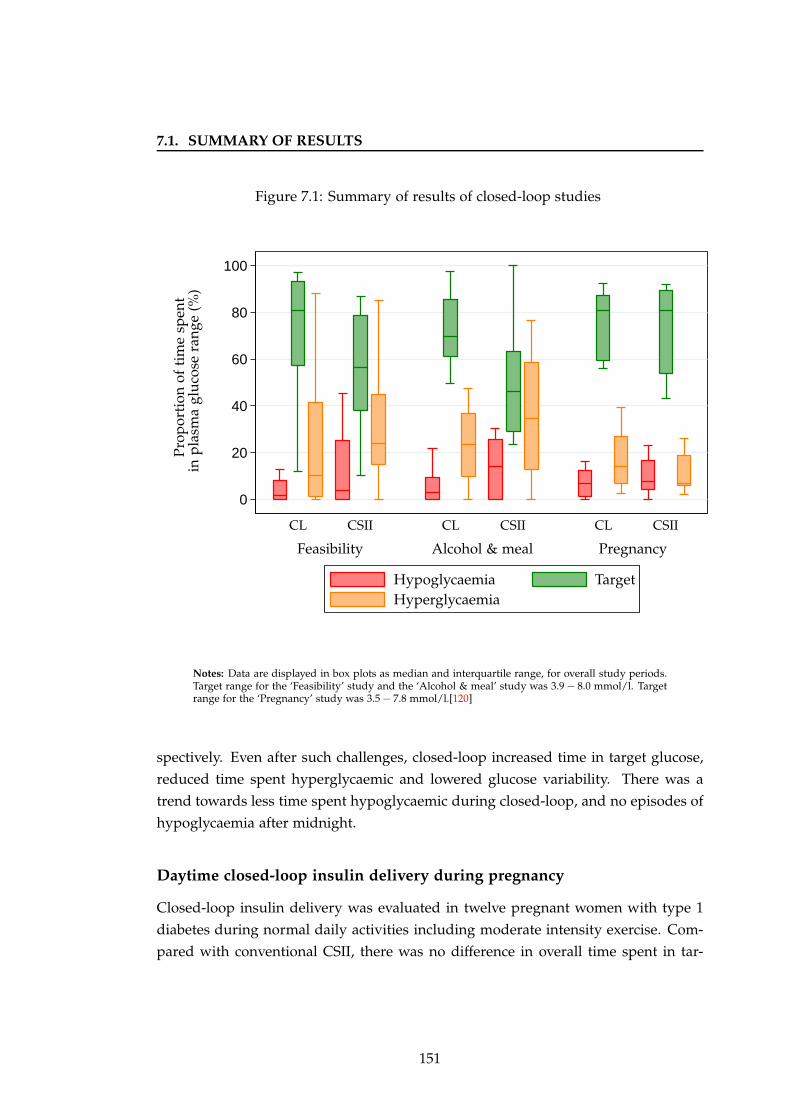
7.1. SUMMARY OF RESULTS
Figure 7.1: Summary of results of closed-loop studies
0
20
40
60
80
100
CSIICSIICSII CLCLCL
Feasibility Alcohol & meal Pregnancy
HypoglycaemiaHyperglycaemia
Target
Pro
por
tion
ofti
me
spen
tin
pla
sma
glu
cose
ran
ge(%
)
Notes: Data are displayed in box plots as median and interquartile range, for overall study periods.Target range for the ‘Feasibility’ study and the ‘Alcohol & meal’ study was 3.9 − 8.0 mmol/l. Targetrange for the ‘Pregnancy’ study was 3.5 − 7.8 mmol/l.[120]
spectively. Even after such challenges, closed-loop increased time in target glucose,
reduced time spent hyperglycaemic and lowered glucose variability. There was a
trend towards less time spent hypoglycaemic during closed-loop, and no episodes of
hypoglycaemia after midnight.
Daytime closed-loop insulin delivery during pregnancy
Closed-loop insulin delivery was evaluated in twelve pregnant women with type 1
diabetes during normal daily activities including moderate intensity exercise. Com-
pared with conventional CSII, there was no difference in overall time spent in tar-
151
7.2. STRENGTHS
get range for pregnancy between 3.5 and 7.8 mmol/l, with even tighter control ac-
chieved overnight. The favourable glucose results achieved during CSII visits may
be attributed to the well-controlled cohort of women studied (baseline HbA1c 6.4%).
Closed-loop lowered the time spent below 2.5 mmol/l and the low blood glucose
index. Hypoglycaemia occurred during both closed-loop and CSII visits, predomi-
nantly following moderate intensity exercise, although closed-loop prevented noctur-
nal episodes.
Energy expenditure and glucose control in pregnancy
This evaluation provided the first objective evidence on activity patterns and energy
expenditure in combination with sensor glucose in ten pregnant (mean gestation 19
weeks) women with type 1 diabetes during free-living. Glucose levels were above
recommended targets for pregnancy with almost a third of the day spent hypergly-
caemic. In comparison, during the 24 hour study in hospital, involving a controlled
diet and structured low and moderate intensity exercise, glucose control was signifi-
cantly improved. Moderate intensity exercise was achieved without any discomfort,
but did result in hypoglycaemia despite efforts to reduce basal insulin infusion and
consume additional carbohydrates.
Sensor accuracy during exercise in pregnancy
The performance of a current generation CGM was objectively assessed, using plasma
glucose as reference, in 12 pregnant women with type 1 diabetes during normal daily
activities. Accuracy, measured by the median relative absolute difference between
paired sensor and plasma glucose values, was lower during moderate intensity exer-
cise (brisk treadmill walking) in the afternoon (20%) and morning (17%) compared
with sedentary conditions (12%). Using Clarke error grid analysis, 14% of sensor
glucose measurements during exercise were considered clinically unsafe, compared
with 4% at rest. The reduced accuracy was only partly explained by the higher rate
of change of glucose associated with physical activity.
7.2 Strengths
A major strength of my studies was the robust methodology. This included a crossover
repeated measures design whereby each participant completed both a closed-loop
152
7.2. STRENGTHS
and a control visit under identical conditions, allowing for objective assessment of
closed-loop without confounders such as inter-individual variability in insulin sen-
sitivity. In addition, the randomised order of visits minimised any potential influ-
ence due to adjustment in insulin regimens between visits, as a result of information
gained from the first study visit. There is only one other overnight closed-loop study
published to date, carried out in 20 adults with type 1 diabetes using a model predic-
tive control algorithm developed in silico.[105] This study was non-randomised as the
open loop visit always took place first in order to provide the algorithm with meal
information prior to closed-loop execution, hence there was a potential for human
(subject and staff) learning.
Another strength is the direct applicability of the results to clinical practice, as the
closed-loop was used under conditions as close to real life as possible. Commercially
available glucose sensors and insulin pumps, delivering a routinely used rapid acting
insulin analogue, were used for all studies. Subjects wore a single sensor during all
study visits, which is likely to increase user acceptability and is more representative
of real life. Previously reported closed-loop studies used at least two sensors, switch-
ing to a better performing sensor if accuracy became suboptimal.[83; 85; 101; 105; 111]
Use of multiple sensors was evaluated by Castle et al, demonstrating reduction in
very large sensor errors and improved accuracy (mean relative absolute difference
11.6% versus 14.8%) with using four sensors simultaneously compared with a single
sensor.[280] Redundancy was not affected by sensor placement within 7mm of each
other. However, these findings have limited applicability in the outpatient setting
where patients are unlikely to be willing to wear more than one CGM device. In
my studies, the sensor was calibrated using fingerprick capillary glucose as patients
would normally do at home, rather than venous glucose as used in other closed-loop
studies.[84; 112] Calibration was performed at times specified by the manufacturer
with no additional calibrations if suboptimal accuracy was detected.
Importantly, the model predictive control algorithm used in my studies con-
sidered only real-time sensor glucose measurements to generate the advice on in-
sulin infusion rates, rather than venous glucose as employed in previous closed-loop
studies.[112] Although more accurate than interstitial glucose, venous glucose sam-
pling is more invasive with a risk of infection and bleeding, and is not practical
for outpatient use of closed-loop. Subcutaneous CGM is a more feasible method of
measuring glucose as part of a closed-loop system in the home setting.
The advice of the model predictive control algorithm was always adhered to dur-
ing studies, suggesting that the system may be reliably used in the home setting
153
7.2. STRENGTHS
without any need to override the algorithm. In a recent multicentre closed-loop
study the algorithm advice was not followed on four occasions due to concern of
near-hypoglycaemia.[105]
Initiation of the algorithm is straightforward for the user, requiring entry of three
parameters: weight, total daily insulin dose, and basal infusion rates. A high degree
of inter- and intra-individual variability in insulin requirements often limits the opti-
mal tailoring of conventional insulin regimens in patients with diabetes. The adaptive
nature of the model predictive control algorithm enabled the closed-loop system to
cope with these variations effectively by initialising insulin sensitivity (based on to-
tal daily insulin dose and usual basal requirements) and adapting this estimate in
real-time on the basis of sensor glucose measurements, resulting in safe and effective
insulin dosing.
The effect of different start times of closed-loop insulin delivery on overnight
glycaemic control was observed in the ‘Feasibility’ and ‘Alcohol and meal’ adult
studies. Glucose levels from midnight appeared to be better controlled when closed-
loop was commenced at 19:00 compared with a later start at 22:00. This was most
likely associated with the increasing efficacy of closed-loop with longer duration of
use. No difference in early (18:00) versus later (21:00) start of automated closed-loop
was observed in a recent randomised study in eight young children.[106]
A major advantage of the model predictive control algorithm used is the reduc-
tion in hypoglycaemia, by suspending insulin delivery when sensor glucose is low
or declining rapidly. The overall improvement in hypoglycaemia during closed-loop
visits is significant as one of the greatest concerns for patients and their families is
the fear of going low, especially overnight whilst asleep and in patients with reduced
hypoglycaemia awareness or those living alone. This risk may be amplified further
following situations such as drinking alcohol. In addition, treatment of hypogly-
caemia may result in rebound hyperglycaemia, and repeated episodes may lead to
avoidance behaviours such as under-insulinising or excessive snacking which could
adversely affect glycaemic control.
The threshold chosen for treatment of hypoglycaemia was 3.0 mmol/l, which is
lower than the glucose level normally used to define hypoglycaemia in clinical prac-
tice (4.0 mmol/l). This threshold was chosen to test the ability of closed-loop to pre-
vent impending hypoglycaemia, in a controlled inpatient setting. The treatment was
oral carbohydrate, consistent with management of hypoglycaemia in the outpatient
setting. Intravenous dextrose was only indicated if subjects failed to recover from
an episode after oral therapy, unlike in a previous closed-loop study where dextrose
154
7.2. STRENGTHS
was given if glucose was below 3.3 mmol/l.[83] In my studies, none of the episodes
of hypoglycaemia required treatment with intravenous dextrose, in both adults and
pregnant women.
Importantly, the improvements in glycaemic control during closed-loop were ach-
ieved with no difference in the average amount of insulin infused on closed-loop and
CSII visits, further substantiated by similar measured plasma insulin concentrations.
This is a clinically significant outcome as excess exogenous insulin therapy may be as-
sociated with weight gain, and further emphasises the benefit of glucose-responsive
insulin delivery.
A single insulin pump was used for all study visits. Minor differences between
commercially available pumps, including precision of basal infusion rates and fre-
quency of bolus pulses which may affect insulin delivery, have been reported. Aspart
insulin was used for all visits, to ensure comparability of results of plasma insulin
concentration as the assay varies for different types of insulin. On arrival for each
visit, the participant’s usual pump was replaced with the study pump using the same
infusion site. An established subcutaneous insulin infusion site was ideally used on
all study visits, thus minimising the possibility of variable delivery of insulin associ-
ated with recent set change. Insertion of a catheter into subcutaneous tissue results
in an inflammatory reaction affecting local blood flow, which in turn may affect ab-
sorption of insulin.
Another strong point of my studies was the standardisation of meals and snacks
consumed. All meals were prepared on site in the hospital kitchen, and matched in
carbohydrate and macronutrient content during closed-loop and CSII interventions.
Subjects chose from a variety of meals, which were carefully selected to represent
what might normally be consumed at home. Other closed-loop studies used liquid
meal replacements such as Ensure Plus in place of normal meals.[105]
Plasma glucose was measured using the gold standard YSI 2300 STAT Plus anal-
yser (YSI Ltd, Fleet, UK). Whole blood was centrifuged immediately after sampling.
Plasma was separated from whole blood, and either frozen for retrospective analy-
sis of glucose (’Feasibility’ study) or measured in real-time (‘Alcohol and meal’ and
pregnancy studies). A delay in separation of plasma from whole blood may result in
deterioration of glucose concentrations.[281]
155
7.3. LIMITATIONS
7.3 Limitations
One of the limitations of my studies was the lack of automation of the closed-loop
system, which required entry of CGM readings into the computer and subsequent
manual alteration of pump settings every 15 minutes by the research nurse or clini-
cian. The possibility of operator error in carrying out this repetitive process cannot
be excluded, as well as the likelihood of delays in manually changing the pump.
This approach is not feasible in clinical practice, and requires development of an au-
tomated closed-loop system with wireless transmission of data. Such a system has
been evaluated in eight children overnight in an inpatient setting, demonstrating safe
and efficacious control of automated closed-loop insulin delivery.[106]
All of the studies had a ‘control’ visit where subjects remained on their usual
CSII regimen. Although this visit replicated the home setting most closely, subjects
anecdotally reported better/worse glycaemic control at home despite maintaining an
identical CSII regimen. The reasons for this are likely to be multi-factorial including
day to day variability in insulin sensitivity, differences in meals consumed which are
less regulated at home, and variable activity levels. One of the main limitations of
carrying out clinic-based studies is that subjects tend to be more sedentary, which is
likely to have an influence on daytime glucose control, although in a similar manner
on both closed-loop and CSII visits. This effect was observed in the 24-hour study
in pregnant women with type 1 diabetes, where a greater time was spent sedentary
compared with during free-living. Interestingly, in the feasibility study in adults,
there were seven episodes of hypoglycaemia despite subjects being less active.
Another potential limitation of the closed-loop system employed in my studies
is the requirement for manual calculation of prandial insulin boluses, which may be
viewed as extra effort for some patients who envisage using a closed-loop system
with minimal user inputs, and additionally depends on the accuracy of the method
used (bolus wizard calculator or carbohydrate to insulin ratios). Although inaccurate
estimation of mealtime insulin boluses may have affected postprandial glycaemic
control, a similar method of calculation was used on both study visits, hence ensuring
comparability between closed-loop and conventional CSII.
Because of the nature of the medical devices used, the interventions were known
to both participants and investigators. Subjects were blinded to CGM and plasma
glucose taken during the study. Investigators were blinded to plasma glucose values
in the ‘Feasibility’ study, but not in the other two studies for safety reasons.
As the order of study visits was revealed to each subject on attending for their
156
7.4. FUTURE STUDIES
first night, any self-adjustment of insulin regimens between visits may potentially
have affected glycaemic control on the second night. However, this bias was largely
overcome by randomly allocating participants to their order of completion of study
visits. It is impossible to exclude an effect of intra-individual variability in insulin
sensitivity associated with multiple factors such as physical activity, concurrent ill-
ness, and menstrual cycle in females between visits.
The subjects enrolled to the studies were all educated insulin pump users of white
ethnicity, hence were not representative of all adults with type 1 diabetes. Addition-
ally, more motivated patients tend to volunteer for research trials. Although only
small numbers were studied, these trials were designed to evaluate the feasibility of
closed-loop insulin delivery. This should be taken into account when considering
the results of multiple secondary analyses performed. Additionally, the observations
obtained may limit applicability to all patients with type 1 diabetes.
7.4 Future studies
The immediate benefits of short-term (up to 48 hours) application of closed-loop on
glycaemic control have been demonstrated in several studies carried out in a con-
trolled environment. Although the clinical research facility is the safest setting for
evaluating feasibility and performance of closed-loop, limitations exist which may
only be overcome by moving to outpatient testing over a longer period. This necessi-
tates an automated closed-loop system with wireless data transmission.
A multicentre randomised controlled study evaluating overnight closed-loop in-
sulin delivery in 24 adults with type 1 diabetes in the home setting is planned.
Patients already established on CSII and willing to use CGM and closed-loop will
complete four weeks of CGM alone whilst maintaining their usual CSII regimen
and four weeks of closed-loop insulin delivery overnight with ‘open-loop’ CSII and
CGM during the daytime, in random order. The acceptability of closed-loop will
be assessed with interviews and validated questionnaires measuring satisfaction and
user-friendliness of the devices. Subjects will also complete a survey evaluating fears
related to hypoglycaemia. This qualitative information will be invaluable in under-
standing the psychosocial aspects of using closed-loop and hence assist in developing
better device training and support systems, as well as providing criteria to facilitate
selection of those patients that are most likely to benefit from using the system.
Following on from this study, a larger study over a longer period, enabling assess-
157
7.4. FUTURE STUDIES
ment of a sustained benefit of closed-loop insulin delivery on glycaemic control as
measured by HbA1c and reduction in diabetes-related complications, is warranted.
This will also be important for women with type 1 diabetes during pregnancy, as
maintenance of glucose control throughout gestation would be expected to be asso-
ciated with improved pregnancy outcomes.
Extending outpatient evaluation of overnight closed-loop insulin delivery to the
daytime is justified. The study in pregnancy demonstrated the challenges in man-
aging glucose levels following meals and physical activity, in a controlled setting.
Testing in the home setting, where routines are much less structured, will provide
important information on feasibility of using closed-loop in clinical practice. Results
gained from physiological studies in progress, using stable isotope tracers to evaluate
glucose fluxes following meals of varying sizes or nutrient composition, will aid in
refining closed-loop algorithms.[282] Further clinical and simulation studies evaluat-
ing different intensities of exercise are required, to assist in our understanding of the
variable glycaemic responses seen.
All the studies evaluating closed-loop insulin delivery thus far have been carried
out in people with type 1 diabetes. Closed-loop is likely to have a similar beneficial
effect in patients with type 2 diabetes. One indication in this patient cohort may be
insulin therapy in hospital, where closed-loop insulin delivery is likely to provide
safer glycaemic control. Currently, variable insulin replacement schedules including
use of sliding scales in addition to infrequent blood glucose monitoring often result
in suboptimal diabetes management in hospital. This can result in worse metabolic
control, associated with poorer health outcomes and longer hospital stay.[283] A pilot
feasibility study of closed-loop insulin delivery in patients with type 2 diabetes is un-
derway. Twelve subjects, treated by oral glucose-lowering medications alone, are be-
ing studied on two separate 24-hour visits on the clinical research facility, comparing
closed-loop glucose control with usual diabetes therapy. Subjects remain sedentary
and consume regular meals and snacks, thus mimicking an inpatient stay. Following
on from this, a larger study is planned in hospitalised patients with type 2 diabetes.
Another area of research is evaluating which patients are most likely to benefit
from closed-loop glycaemic control. For safety reasons, my studies excluded patients
with hypoglycaemia unawareness or history of severe hypoglycaemia. Evaluation
of this group is warranted as the effect of closed-loop in reducing hypoglycaemia,
as demonstrated in my studies in adults, is likely to have a significant impact on
quality of life. Although closed-loop insulin delivery only had a limited impact in the
cohort of pregnant women studied, women with suboptimal glucose control during
158
7.5. CLOSED-LOOP INSULIN DELIVERY IN CLINICAL PRACTICE
pregnancy are likely to realise a benefit.
7.5 Closed-loop insulin delivery in clinical practice
7.5.1 Challenges to implementation
7.5.1.1 Glucose sensors
The development of closed-loop systems has progressed rapidly over the last decade,
but has faced several hurdles, the major one being development of more accurate
and reliable glucose sensors. Most of the commercially-available CGM devices still
require confirmatory capillary glucose measurement prior to any action taken based
on sensor values. Both delays in glucose sensing between interstitial and plasma
compartments and errors in calibration contribute to inaccurate sensor readings and
associated false alarms. Factory-based calibrations of future generation devices may
limit the risk of human or meter error. Setting realistic expectations of the limita-
tions of CGM will be vital to increasing patient satisfaction and reducing the risk of
premature discontinuation.
7.5.1.2 Insulin delivery
The subcutaneous-subcutaneous route is minimally invasive and hence has the most
potential for closed-loop application in the outpatient setting. It is the approach em-
ployed in the majority of closed-loop systems currently under development, however
is also associated with delays related to both glucose sensing and insulin kinetics.[93]
One of the major limitations of subcutaneous insulin delivery is the delay in time to
peak blood glucose lowering effect which may be 90− 120 minutes with the currently
available rapid acting insulin analogues. In addition, the high degree of inter- and
intra-individual variability in insulin absorption must also be considered.[67] Opti-
mising the timing and mode of bolus delivery, together with ongoing development of
faster more stable insulins that mimic more closely the actions of endogenous insulin
may help overcome some of these hurdles. Alternative routes of insulin delivery,
such as the intraperitoneal and transdermal routes, may provide another solution.
159
7.5. CLOSED-LOOP INSULIN DELIVERY IN CLINICAL PRACTICE
7.5.1.3 Control algorithm
Ongoing efforts are required in refining control algorithms to be able to integrate
the delays associated with glucose sensing and insulin delivery, particularly in the
postprandial period. In addition, both inter- and intra-subject variability in glucose
responses to factors such as meals, illness, stress, travel and physical activity will
need to be incorporated into metabolic models in order to accurately predict glucose
excursions.
Use of closed-loop during the day will require the ability to cope with such chal-
lenges as activities of daily living, meals and exercise, which result in transient de-
rangements in glucose-insulin metabolism. Hyperglycaemia following carbohydrate
ingestion is a major challenge to closed-loop. Delays in glucose sensing and subcuta-
neous insulin delivery limit the ability of closed-loop to slow the rapid rise in glucose
postprandially. Moreover, a delay in insulin action as glucose levels are declining may
result in late hypoglycaemia.
Exercise has longer lasting and more dynamic effects on glucose-insulin dynam-
ics. The magnitude of effect depends on several factors, including duration and
intensity of activity. Even low intensity daily tasks such as housework and shopping
may lower glucose levels. Adjustment in insulin delivery according to exercise of dif-
ferent intensities will be required. Replicating the physiological hyperinsulinaemia
following intense exercise will be a challenge for closed-loop control due to the risk
of iatrogenic hypoglycaemia. Announcement of exercise is likely to be an essential
component to enable timely decrease in insulin delivery. Inclusion of glucagon in a
closed-loop system may limit exercise-related hypoglycaemia.
7.5.1.4 Device-patient interface
Currently, insulin delivery and continuous glucose sensing are contained in separate
devices and require two separate insertions. Approaches to combine insulin delivery
and continuous glucose sensing into a single device are being developed.[284] The
feasibility of administering insulin and measuring glucose at the same adipose tissue
site was evaluated in healthy subjects, demonstrating stability of glucose levels at the
site of insulin administration.[285] Such ‘single-port’ systems will halve the number
of skin perforations required as well as the number of devices that need to be carried,
which is likely to increase device acceptability and hence compliance with wear.[42]
This is significant as compliance is associated with greater efficacy of CGM. A recent
meta-analysis demonstrated a 0.15% reduction in HbA1c for each extra day of sensor
160
7.5. CLOSED-LOOP INSULIN DELIVERY IN CLINICAL PRACTICE
wear.[286]
Development of an integrated user friendly system employing wireless data trans-
mission will be important for outpatient use of closed-loop. Daytime application in
particular will require the devices to be portable and discreet. Safety and efficacy of
a prototype fully-automated closed-loop system using wireless transmission of data
has been demonstrated overnight in eight young children in an inpatient setting.[106]
7.5.2 Patient selection
Appropriate patient selection for use of closed-loop will be essential. This may be
guided by known predictors of success with currently used devices. Higher HbA1c,
younger age and shorter diabetes duration were associated with greater benefit on
CSII.[55] The UK National Institute for Health and Clinical Excellence judge CSII
to be cost-effective in patients with persistently elevated HbA1c levels of 8.5% or
higher. A meta-analysis of CGM showed the greatest benefit was seen in patients with
higher HbA1c; 0.9% reduction when baseline HbA1c was 10%.[286] High frequency
of SMBG testing and older age have also been linked with success on CGM.[25]
Closed-loop is likely to be most beneficial in patients who struggle to achieve
glucose targets, and/or where further intensification of insulin regimens is limited
by recurrent episodes of hypoglycaemia. Closed-loop may be a safer option for cer-
tain vulnerable patient groups including those with hypoglycaemia unawareness and
those living alone. It is also likely to be indicated for patients who are less able to
self-manage their diabetes, such as young children or those with learning disabilities,
and where compliance is a barrier such as during adolescence.
Closed-loop may be indicated in women with type 1 diabetes during pregnancy
where hypoglycaemia often limits safe achievement of tight glycaemic control. Selec-
tion of women most likely to benefit could be based on presence of known risk fac-
tors, including history of severe hypoglycaemia, hypoglycaemia unawareness, longer
diabetes duration and lower HbA1c in early pregnancy.[176]
Future use of a closed-loop system will depend on patients’ willingness to learn
and their ability to use the technology. Patient acceptance is likely to be high, based
on qualitative assessments carried out in adult patients [287] and caregivers of chil-
dren with type 1 diabetes.[288] However, for some patients the benefits will be out-
weighed by the burdens and complexities of learning to use a new technology. Sim-
ilar to the concerns expressed by patients on CGM, these may include dealing with
alarms, body image issues related to permanently wearing a device, and pain with
161
7.5. CLOSED-LOOP INSULIN DELIVERY IN CLINICAL PRACTICE
insertion, which may limit acceptability of using closed-loop.[42]
7.5.3 Stepwise introduction
The future deployment of closed loop systems is likely to be a staged process, with
the aims of improving glycaemic control and reducing hypoglycaemia whilst en-
suring preservation of safety at each stage. This is most likely to commence with
a closed-loop system that shuts off at low glucose levels. This feature is already
available in the Paradigm Veo (Medtronic, Northridge, CA, USA), approved for com-
mercial use in Europe since 2009 but awaiting authorisation in the USA. The pump
can be linked with a glucose sensor, suspending insulin delivery for up to two hours
during hypoglycaemia, but still demands manual calculation and entry of basal rates
and boluses. In 2010, JDRF announced a partnership with Animas Corporation to de-
velop a partially automated ‘hypoglycaemia-hyperglycaemia minimiser’ closed-loop
system within the next four years, which will slow or stop insulin delivery when
sensor glucose levels are declining and similarly increase insulin when rising until
glucose returns to acceptable range.
The next feasible step may be using the closed-loop system overnight when meals
and exercise do not confound glycaemic control, with the added significant benefit
of preventing nocturnal hypoglycaemia. Daytime closed-loop glucose control will be
more challenging. A hybrid or semi-closed loop system with meal announcement
may be the most feasible approach, until delays in glucose sensing and subcutaneous
insulin delivery can be overcome.
Closed-loop insulin delivery during exercise is potentially a safer and more flex-
ible treatment option enabling patients to exercise with more confidence, however
refinements and further testing, including simulation studies, will be required prior
to safe application. Incorporation of motion sensors and heart rate monitoring into
closed-loop systems is being considered.[236] The latter will require differentiation
between transient (e.g. stress-induced), and substantial increases in heart rate. The
Cellnovo (London, UK) insulin patch pump, due to be launched in Europe in late
2012, has an in-built accelerometer. Future systems may incorporate glucagon and/or
other hormones.
The ultimate goal is an integrated system facilitating fully automated closed-loop
control over 24 hours. These technological advances are important but should not
delay gradual introduction of closed-loop into clinical practice.
162
7.6. CONTRIBUTION TO KNOWLEDGE AND CONCLUDING REMARKS
7.5.4 Practical issues
Prior to employment of closed-loop systems in clinical practice, strict safety checks
by regulatory bodies are essential, as technical faults or failure can lead to serious
complications including severe hypoglycaemia due to excess insulin. Ongoing safety
monitoring to manage technical issues will be necessary. Ensuring security and in-
tegrity of such technology-dependent systems will also be critical to guaranteeing
safe use of closed-loop.
Telemedicine will increasingly play an integral role in closed-loop systems, al-
lowing logging of data and enabling retrospective analysis and fine tuning of the
system.[289] Distant monitoring of blood glucose will provide an added safety layer,
above that embedded into the control algorithm. Global positioning system tech-
nology may be incorporated in a portable closed-loop system, enabling monitoring
from any location. Such an application, termed E911, has been proposed as a tool
for tracking and alerting medical personnel to impending hypoglycaemic events in
patients at higher risk such as those with hypoglycaemia unawareness.[290]
In order to ensure the availability of closed-loop in clinical practice, both the
initial expenses and the cost of ongoing consumables and maintenance must be taken
into consideration. Closed-loop should ideally be available to all eligible patients
regardless of economic circumstances and geographic location. More realistically, in
many countries it is likely that product use will ultimately rely upon national health
care policies based on cost-benefit analyses, and reimbursement schemes by health
insurance companies.
Success of the artificial pancreas will also depend on the establishment of appro-
priate infrastructures that will sustain the ongoing deployment of the system. These
include training courses for healthcare professionals and patients, a support network
to manage the technological aspects, and collaboration with the industries producing
the device and regulatory authorities to ensure availability and affordability.
7.6 Contribution to knowledge and concluding remarks
Diabetes is a condition where the body’s innate ability to regulate blood glucose fails,
instead relying on the individual’s conscious efforts to maintain glycaemic control.
Day-to-day variability in insulin requirements, which may be influenced by multiple
factors, make such ‘open-loop’ control challenging. Even with the sophisticated in-
sulin pumps and continuous glucose monitoring devices available currently, the ma-
163
7.6. CONTRIBUTION TO KNOWLEDGE AND CONCLUDING REMARKS
jority of patients struggle to achieve optimal glycaemic control. Extensive efforts by
clinicians and patients are still required. The ‘closed-loop’ or artificial pancreas sys-
tem offers a more convenient and effective mode of insulin delivery, thus minimising
the need for constant monitoring and adjustment. This may have a significant impact
on patients’ perceptions of their diabetes, including a reduced burden of self-care and
increased self-confidence in achieving glucose targets without fear of hypoglycaemia.
These are the first randomised controlled studies evaluating closed-loop insulin
delivery in adults and pregnant women with type 1 diabetes, using commercially
available devices and a model predictive control algorithm. The results are sum-
marised in Figure 7.1. In adults, overnight closed-loop resulted in safe and effective
glycaemic control. These results were sustained even with evening consumption of
a large meal and alcohol. In a cohort of well-controlled women during pregnancy,
closed-loop insulin delivery during normal daily activities was as effective as conven-
tional pump therapy. Safety of glucose control during closed-loop was maintained
even after exercise of moderate intensity, with fewer episodes of hypoglycaemia over-
all and prevention of nocturnal episodes. The analysis of activity patterns and gly-
caemic control during free-living contributes to the understanding of the relationship
between diet, exercise and glucose levels, which may be useful in future closed-loop
systems incorporating accelerometry. This information may also be helpful to clini-
cians in optimising conventional treatment regimens, including formulation of exer-
cise guidelines. The observations of lower accuracy of CGM during exercise will be
important for patients to consider when exercising, and additionally in the develop-
ment of closed-loop systems for daytime use.
In conclusion, my studies provide evidence of the safety and efficacy of closed-
loop insulin delivery in adults with type 1 diabetes, including women during preg-
nancy, in a controlled setting. These results facilitate the transition to outpatient
studies to assess performance over consecutive nights under real life conditions. Fur-
ther system refinements will be necessary prior to optimal daytime application of
closed-loop. As the hurdles and practicalities are gradually overcome, the ultimate
goal of introduction of closed-loop in clinical practice will be realised.
164
Appendix A
Individual glucose & insulin
profiles
This Appendix presents sensor glucose, plasma glucose and basal insulin profiles for
all subjects on both their closed-loop and CSII study visits. Profiles for the ‘Feasibil-
ity’ study presented in Chapter 2 are shown in A.1. In relation to that study, subject 9
withdrew participation after their first visit and was replaced by subject 13. Profiles
for the ‘Alcohol and meal’ study presented in Chapter 3 are shown in A.2, and for the
‘Pregnancy’ study presented in Chapter 4 in A.3. Each figure displays the CSII visit
(left panel) and the closed-loop visit (right panel) for each subject. Meals and snacks
consumed during the study with concurrent prandial insulin boluses administered
are detailed in the table below each figure.
165
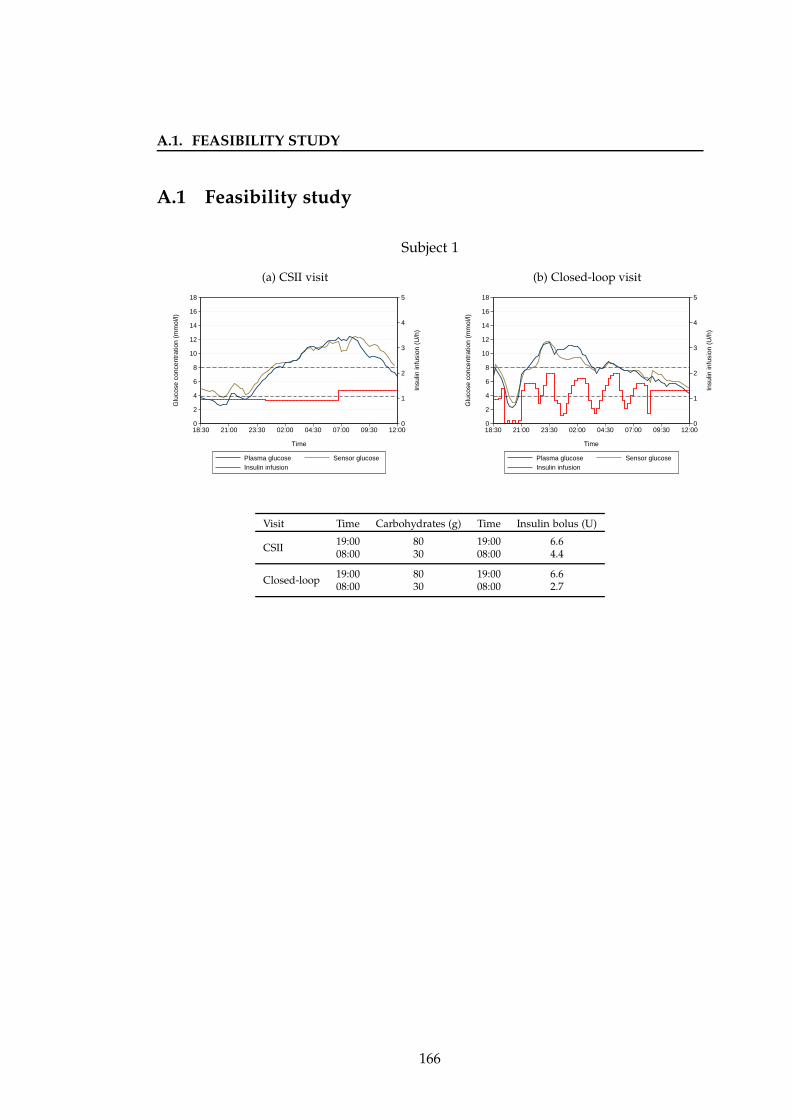
A.1. FEASIBILITY STUDY
A.1 Feasibility study
Subject 1
(a) CSII visit
0
1
2
3
4
5
In
sulin
infu
sion
(U
/h)
0
2
4
6
8
10
12
14
16
18
Glu
cose
con
cent
ratio
n (m
mol
/l)
18:30 21:00 23:30 02:00 04:30 07:00 09:30 12:00
Time
Plasma glucose Sensor glucose Insulin infusion
(b) Closed-loop visit
0
1
2
3
4
5
In
sulin
infu
sion
(U
/h)
0
2
4
6
8
10
12
14
16
18
Glu
cose
con
cent
ratio
n (m
mol
/l)
18:30 21:00 23:30 02:00 04:30 07:00 09:30 12:00
Time
Plasma glucose Sensor glucose Insulin infusion
Visit Time Carbohydrates (g) Time Insulin bolus (U)
CSII19:00 80 19:00 6.608:00 30 08:00 4.4
Closed-loop19:00 80 19:00 6.608:00 30 08:00 2.7
166
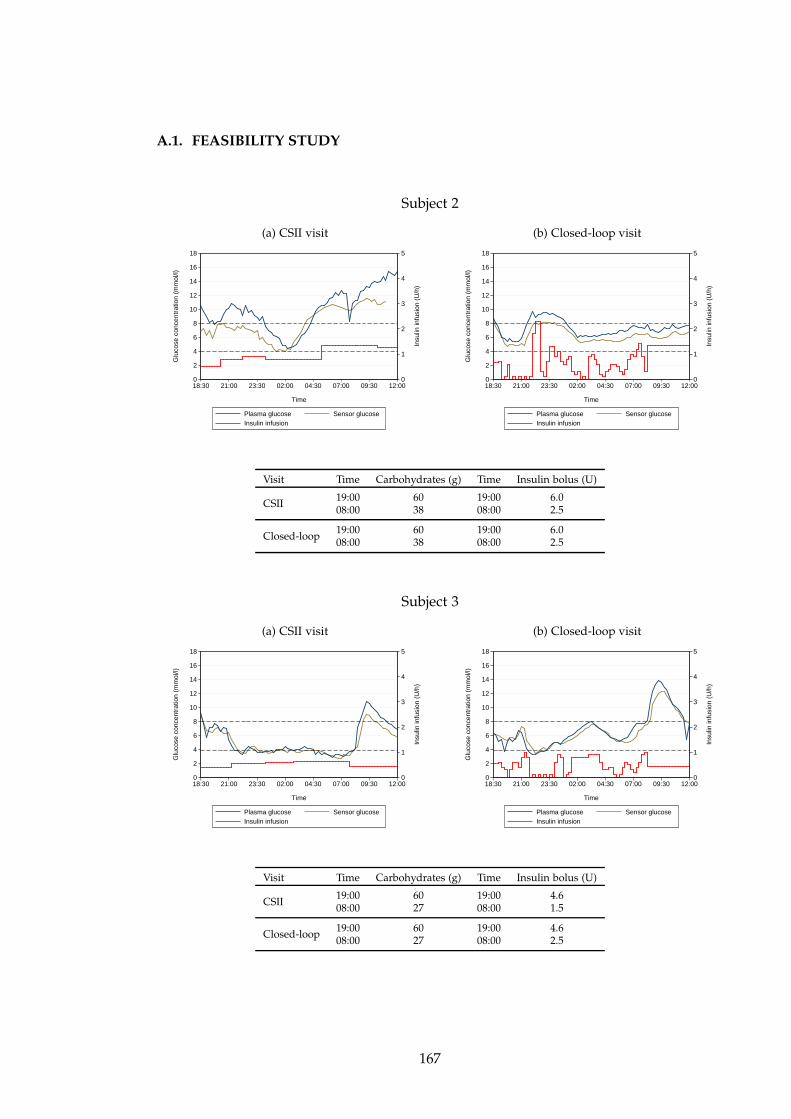
A.1. FEASIBILITY STUDY
Subject 2
(a) CSII visit
0
1
2
3
4
5
In
sulin
infu
sion
(U
/h)
0
2
4
6
8
10
12
14
16
18
Glu
cose
con
cent
ratio
n (m
mol
/l)
18:30 21:00 23:30 02:00 04:30 07:00 09:30 12:00
Time
Plasma glucose Sensor glucose Insulin infusion
(b) Closed-loop visit
0
1
2
3
4
5
In
sulin
infu
sion
(U
/h)
0
2
4
6
8
10
12
14
16
18
Glu
cose
con
cent
ratio
n (m
mol
/l)
18:30 21:00 23:30 02:00 04:30 07:00 09:30 12:00
Time
Plasma glucose Sensor glucose Insulin infusion
Visit Time Carbohydrates (g) Time Insulin bolus (U)
CSII19:00 60 19:00 6.008:00 38 08:00 2.5
Closed-loop19:00 60 19:00 6.008:00 38 08:00 2.5
Subject 3
(a) CSII visit
0
1
2
3
4
5
In
sulin
infu
sion
(U
/h)
0
2
4
6
8
10
12
14
16
18
Glu
cose
con
cent
ratio
n (m
mol
/l)
18:30 21:00 23:30 02:00 04:30 07:00 09:30 12:00
Time
Plasma glucose Sensor glucose Insulin infusion
(b) Closed-loop visit
0
1
2
3
4
5
In
sulin
infu
sion
(U
/h)
0
2
4
6
8
10
12
14
16
18
Glu
cose
con
cent
ratio
n (m
mol
/l)
18:30 21:00 23:30 02:00 04:30 07:00 09:30 12:00
Time
Plasma glucose Sensor glucose Insulin infusion
Visit Time Carbohydrates (g) Time Insulin bolus (U)
CSII19:00 60 19:00 4.608:00 27 08:00 1.5
Closed-loop19:00 60 19:00 4.608:00 27 08:00 2.5
167
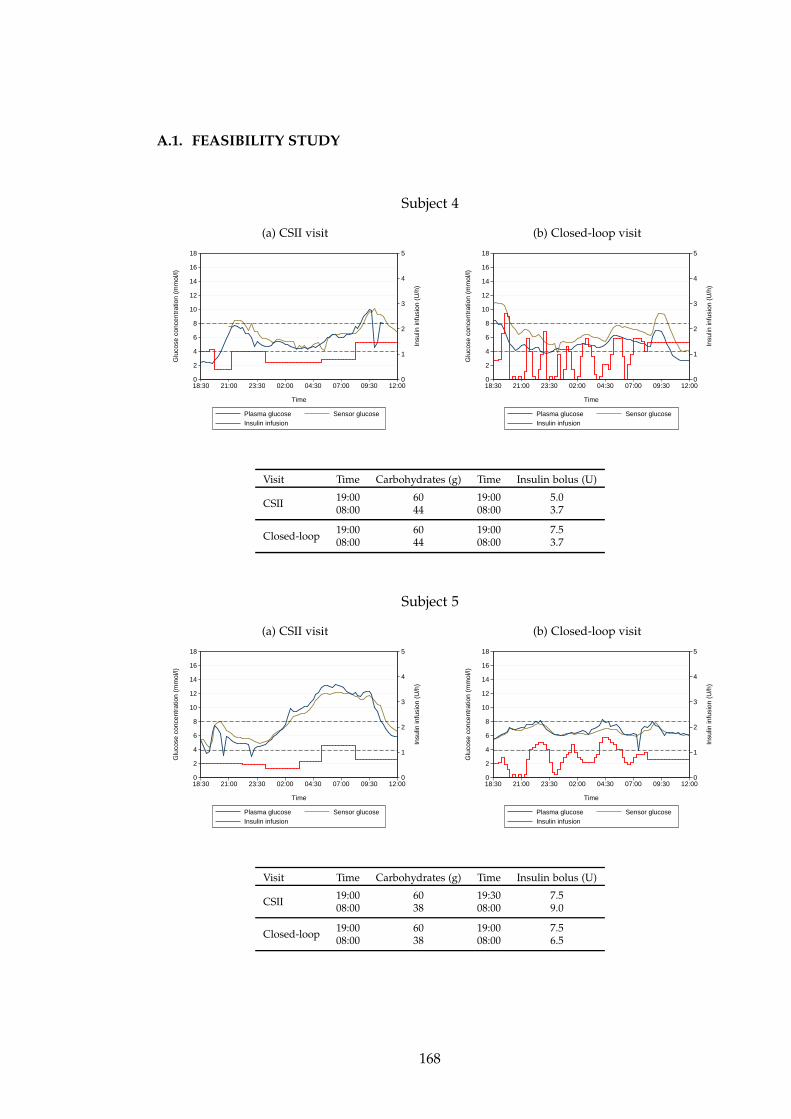
A.1. FEASIBILITY STUDY
Subject 4
(a) CSII visit
0
1
2
3
4
5
In
sulin
infu
sion
(U
/h)
0
2
4
6
8
10
12
14
16
18
Glu
cose
con
cent
ratio
n (m
mol
/l)
18:30 21:00 23:30 02:00 04:30 07:00 09:30 12:00
Time
Plasma glucose Sensor glucose Insulin infusion
(b) Closed-loop visit
0
1
2
3
4
5
In
sulin
infu
sion
(U
/h)
0
2
4
6
8
10
12
14
16
18
Glu
cose
con
cent
ratio
n (m
mol
/l)
18:30 21:00 23:30 02:00 04:30 07:00 09:30 12:00
Time
Plasma glucose Sensor glucose Insulin infusion
Visit Time Carbohydrates (g) Time Insulin bolus (U)
CSII19:00 60 19:00 5.008:00 44 08:00 3.7
Closed-loop19:00 60 19:00 7.508:00 44 08:00 3.7
Subject 5
(a) CSII visit
0
1
2
3
4
5
In
sulin
infu
sion
(U
/h)
0
2
4
6
8
10
12
14
16
18
Glu
cose
con
cent
ratio
n (m
mol
/l)
18:30 21:00 23:30 02:00 04:30 07:00 09:30 12:00
Time
Plasma glucose Sensor glucose Insulin infusion
(b) Closed-loop visit
0
1
2
3
4
5
In
sulin
infu
sion
(U
/h)
0
2
4
6
8
10
12
14
16
18
Glu
cose
con
cent
ratio
n (m
mol
/l)
18:30 21:00 23:30 02:00 04:30 07:00 09:30 12:00
Time
Plasma glucose Sensor glucose Insulin infusion
Visit Time Carbohydrates (g) Time Insulin bolus (U)
CSII19:00 60 19:30 7.508:00 38 08:00 9.0
Closed-loop19:00 60 19:00 7.508:00 38 08:00 6.5
168
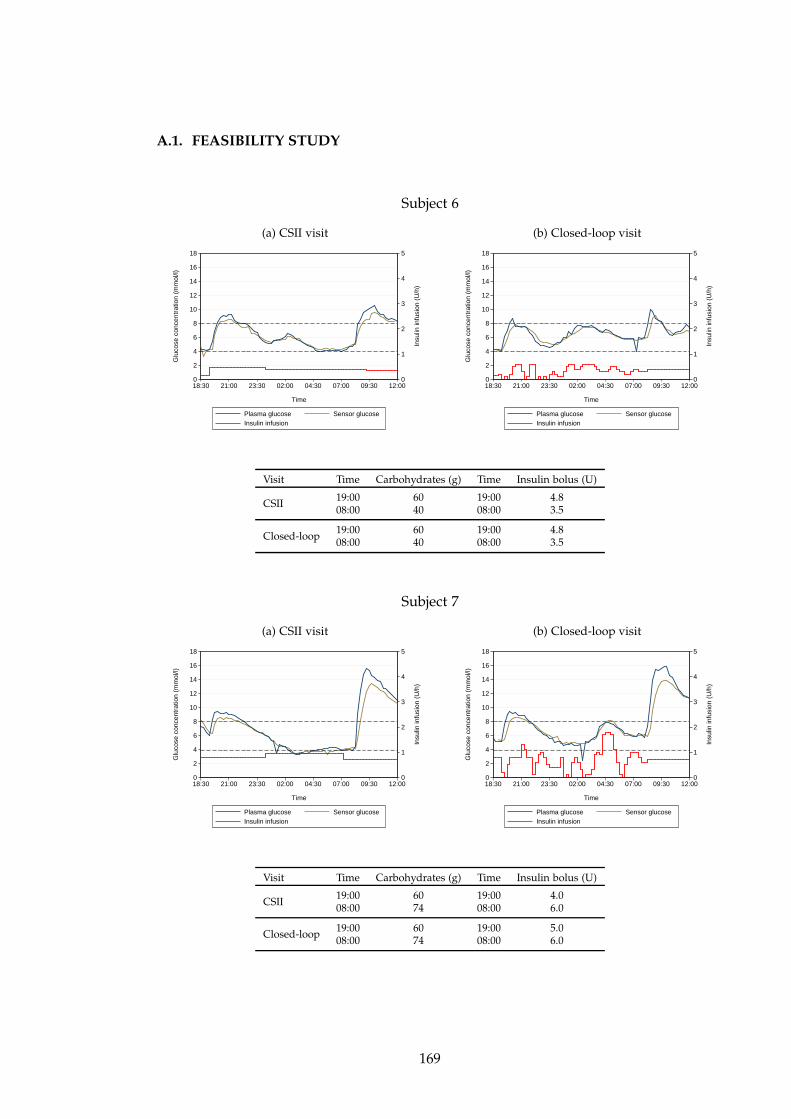
A.1. FEASIBILITY STUDY
Subject 6
(a) CSII visit
0
1
2
3
4
5
In
sulin
infu
sion
(U
/h)
0
2
4
6
8
10
12
14
16
18
Glu
cose
con
cent
ratio
n (m
mol
/l)
18:30 21:00 23:30 02:00 04:30 07:00 09:30 12:00
Time
Plasma glucose Sensor glucose Insulin infusion
(b) Closed-loop visit
0
1
2
3
4
5
In
sulin
infu
sion
(U
/h)
0
2
4
6
8
10
12
14
16
18
Glu
cose
con
cent
ratio
n (m
mol
/l)
18:30 21:00 23:30 02:00 04:30 07:00 09:30 12:00
Time
Plasma glucose Sensor glucose Insulin infusion
Visit Time Carbohydrates (g) Time Insulin bolus (U)
CSII19:00 60 19:00 4.808:00 40 08:00 3.5
Closed-loop19:00 60 19:00 4.808:00 40 08:00 3.5
Subject 7
(a) CSII visit
0
1
2
3
4
5
In
sulin
infu
sion
(U
/h)
0
2
4
6
8
10
12
14
16
18
Glu
cose
con
cent
ratio
n (m
mol
/l)
18:30 21:00 23:30 02:00 04:30 07:00 09:30 12:00
Time
Plasma glucose Sensor glucose Insulin infusion
(b) Closed-loop visit
0
1
2
3
4
5
In
sulin
infu
sion
(U
/h)
0
2
4
6
8
10
12
14
16
18
Glu
cose
con
cent
ratio
n (m
mol
/l)
18:30 21:00 23:30 02:00 04:30 07:00 09:30 12:00
Time
Plasma glucose Sensor glucose Insulin infusion
Visit Time Carbohydrates (g) Time Insulin bolus (U)
CSII19:00 60 19:00 4.008:00 74 08:00 6.0
Closed-loop19:00 60 19:00 5.008:00 74 08:00 6.0
169
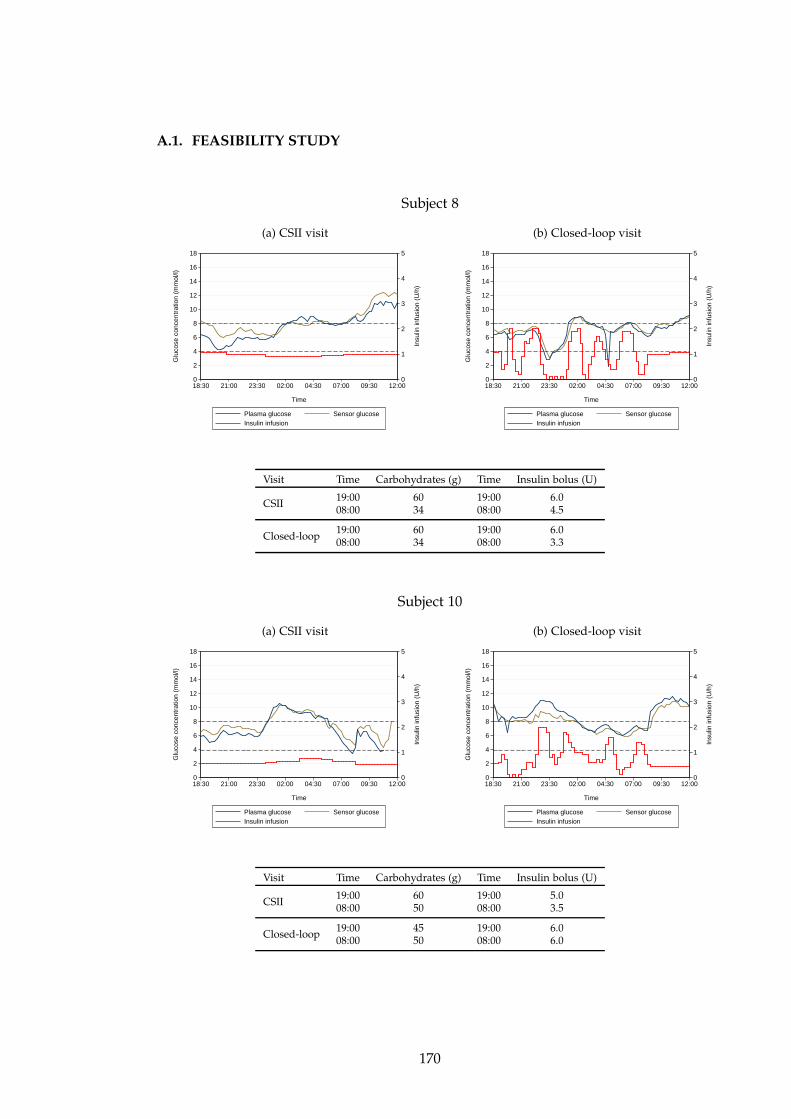
A.1. FEASIBILITY STUDY
Subject 8
(a) CSII visit
0
1
2
3
4
5
In
sulin
infu
sion
(U
/h)
0
2
4
6
8
10
12
14
16
18
Glu
cose
con
cent
ratio
n (m
mol
/l)
18:30 21:00 23:30 02:00 04:30 07:00 09:30 12:00
Time
Plasma glucose Sensor glucose Insulin infusion
(b) Closed-loop visit
0
1
2
3
4
5
In
sulin
infu
sion
(U
/h)
0
2
4
6
8
10
12
14
16
18
Glu
cose
con
cent
ratio
n (m
mol
/l)
18:30 21:00 23:30 02:00 04:30 07:00 09:30 12:00
Time
Plasma glucose Sensor glucose Insulin infusion
Visit Time Carbohydrates (g) Time Insulin bolus (U)
CSII19:00 60 19:00 6.008:00 34 08:00 4.5
Closed-loop19:00 60 19:00 6.008:00 34 08:00 3.3
Subject 10
(a) CSII visit
0
1
2
3
4
5
In
sulin
infu
sion
(U
/h)
0
2
4
6
8
10
12
14
16
18
Glu
cose
con
cent
ratio
n (m
mol
/l)
18:30 21:00 23:30 02:00 04:30 07:00 09:30 12:00
Time
Plasma glucose Sensor glucose Insulin infusion
(b) Closed-loop visit
0
1
2
3
4
5
In
sulin
infu
sion
(U
/h)
0
2
4
6
8
10
12
14
16
18
Glu
cose
con
cent
ratio
n (m
mol
/l)
18:30 21:00 23:30 02:00 04:30 07:00 09:30 12:00
Time
Plasma glucose Sensor glucose Insulin infusion
Visit Time Carbohydrates (g) Time Insulin bolus (U)
CSII19:00 60 19:00 5.008:00 50 08:00 3.5
Closed-loop19:00 45 19:00 6.008:00 50 08:00 6.0
170
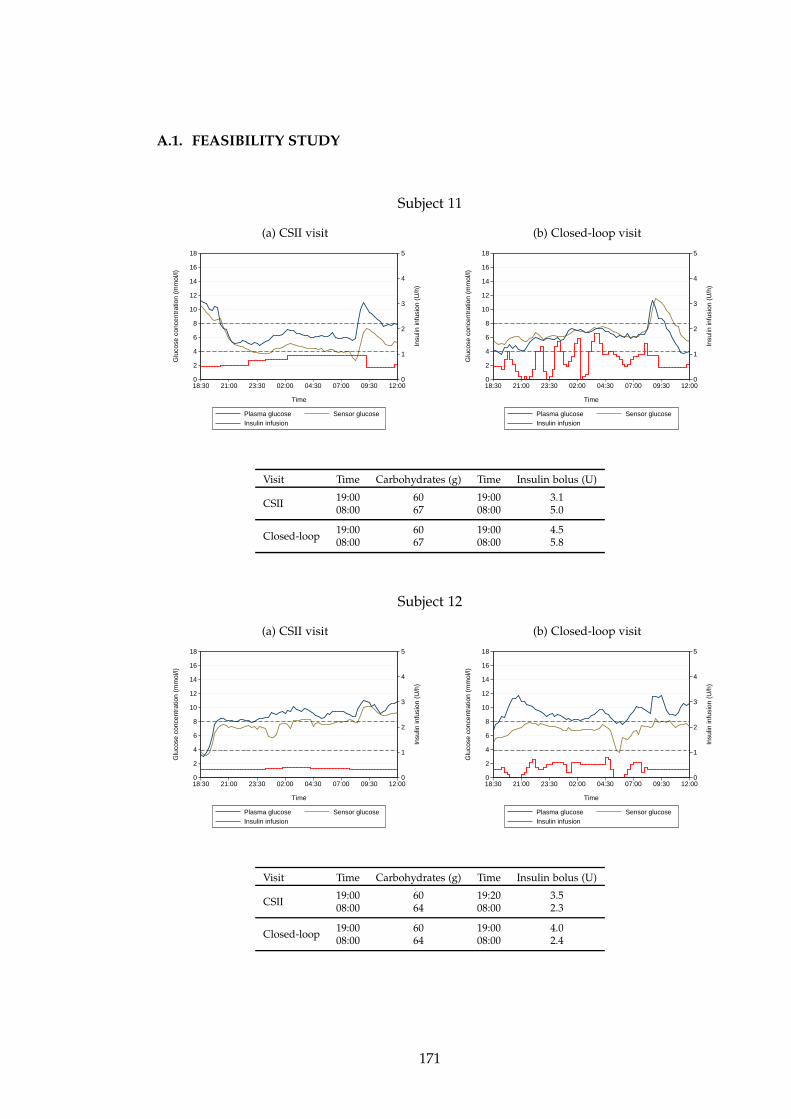
A.1. FEASIBILITY STUDY
Subject 11
(a) CSII visit
0
1
2
3
4
5
In
sulin
infu
sion
(U
/h)
0
2
4
6
8
10
12
14
16
18
Glu
cose
con
cent
ratio
n (m
mol
/l)
18:30 21:00 23:30 02:00 04:30 07:00 09:30 12:00
Time
Plasma glucose Sensor glucose Insulin infusion
(b) Closed-loop visit
0
1
2
3
4
5
In
sulin
infu
sion
(U
/h)
0
2
4
6
8
10
12
14
16
18
Glu
cose
con
cent
ratio
n (m
mol
/l)
18:30 21:00 23:30 02:00 04:30 07:00 09:30 12:00
Time
Plasma glucose Sensor glucose Insulin infusion
Visit Time Carbohydrates (g) Time Insulin bolus (U)
CSII19:00 60 19:00 3.108:00 67 08:00 5.0
Closed-loop19:00 60 19:00 4.508:00 67 08:00 5.8
Subject 12
(a) CSII visit
0
1
2
3
4
5
In
sulin
infu
sion
(U
/h)
0
2
4
6
8
10
12
14
16
18
Glu
cose
con
cent
ratio
n (m
mol
/l)
18:30 21:00 23:30 02:00 04:30 07:00 09:30 12:00
Time
Plasma glucose Sensor glucose Insulin infusion
(b) Closed-loop visit
0
1
2
3
4
5
In
sulin
infu
sion
(U
/h)
0
2
4
6
8
10
12
14
16
18
Glu
cose
con
cent
ratio
n (m
mol
/l)
18:30 21:00 23:30 02:00 04:30 07:00 09:30 12:00
Time
Plasma glucose Sensor glucose Insulin infusion
Visit Time Carbohydrates (g) Time Insulin bolus (U)
CSII19:00 60 19:20 3.508:00 64 08:00 2.3
Closed-loop19:00 60 19:00 4.008:00 64 08:00 2.4
171
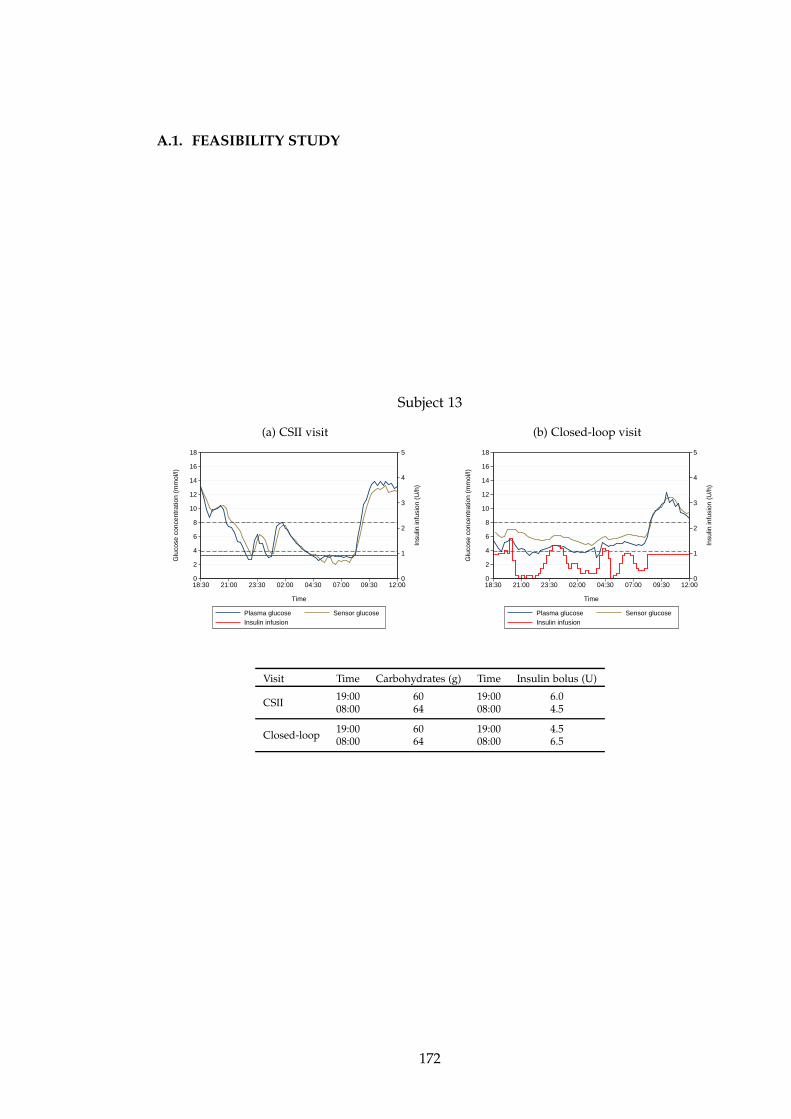
A.1. FEASIBILITY STUDY
Subject 13
(a) CSII visit
0
1
2
3
4
5
In
sulin
infu
sion
(U
/h)
0
2
4
6
8
10
12
14
16
18
Glu
cose
con
cent
ratio
n (m
mol
/l)
18:30 21:00 23:30 02:00 04:30 07:00 09:30 12:00
Time
Plasma glucose Sensor glucose Insulin infusion
(b) Closed-loop visit
0
1
2
3
4
5
In
sulin
infu
sion
(U
/h)
0
2
4
6
8
10
12
14
16
18
Glu
cose
con
cent
ratio
n (m
mol
/l)
18:30 21:00 23:30 02:00 04:30 07:00 09:30 12:00
Time
Plasma glucose Sensor glucose Insulin infusion
Visit Time Carbohydrates (g) Time Insulin bolus (U)
CSII19:00 60 19:00 6.008:00 64 08:00 4.5
Closed-loop19:00 60 19:00 4.508:00 64 08:00 6.5
172
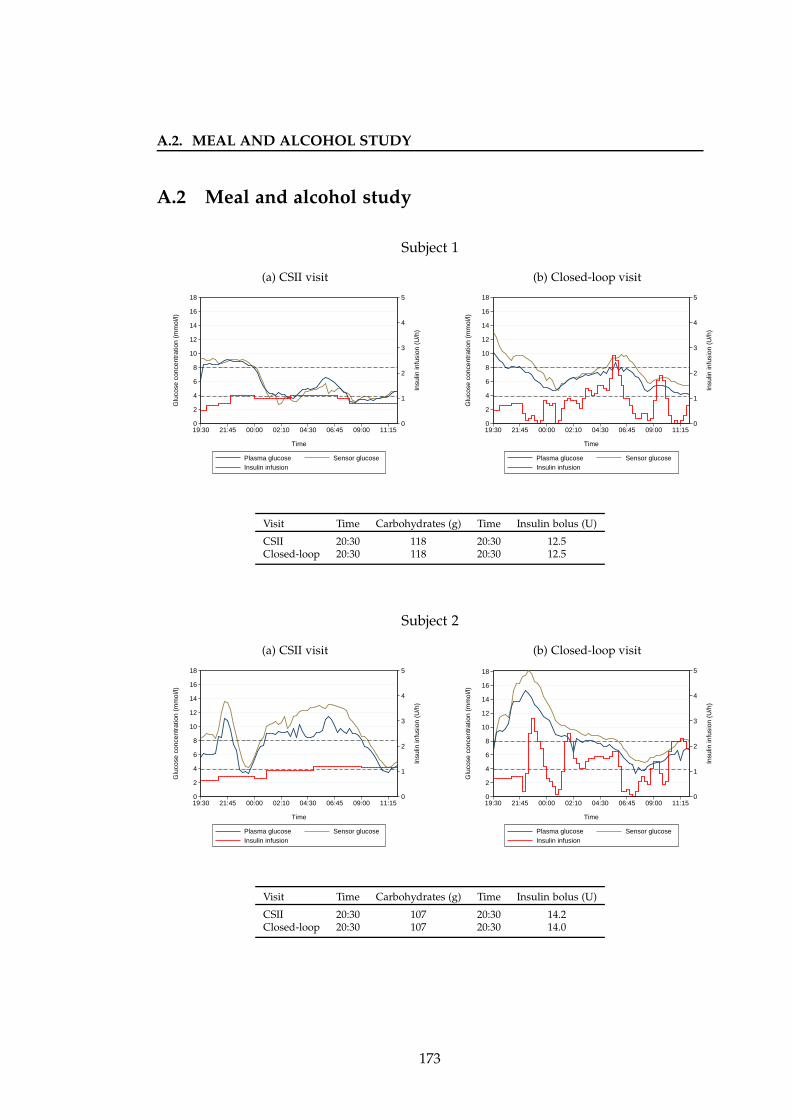
A.2. MEAL AND ALCOHOL STUDY
A.2 Meal and alcohol study
Subject 1
(a) CSII visit
0
1
2
3
4
5
In
sulin
infu
sion
(U
/h)
0
2
4
6
8
10
12
14
16
18
Glu
cose
con
cent
ratio
n (m
mol
/l)
19:30 21:45 00:00 02:10 04:30 06:45 09:00 11:15
Time
Plasma glucose Sensor glucose Insulin infusion
(b) Closed-loop visit
0
1
2
3
4
5
In
sulin
infu
sion
(U
/h)
0
2
4
6
8
10
12
14
16
18
Glu
cose
con
cent
ratio
n (m
mol
/l)
19:30 21:45 00:00 02:10 04:30 06:45 09:00 11:15
Time
Plasma glucose Sensor glucose Insulin infusion
Visit Time Carbohydrates (g) Time Insulin bolus (U)
CSII 20:30 118 20:30 12.5Closed-loop 20:30 118 20:30 12.5
Subject 2
(a) CSII visit
0
1
2
3
4
5
In
sulin
infu
sion
(U
/h)
0
2
4
6
8
10
12
14
16
18
Glu
cose
con
cent
ratio
n (m
mol
/l)
19:30 21:45 00:00 02:10 04:30 06:45 09:00 11:15
Time
Plasma glucose Sensor glucose Insulin infusion
(b) Closed-loop visit
0
1
2
3
4
5
In
sulin
infu
sion
(U
/h)
0
2
4
6
8
10
12
14
16
18
Glu
cose
con
cent
ratio
n (m
mol
/l)
19:30 21:45 00:00 02:10 04:30 06:45 09:00 11:15
Time
Plasma glucose Sensor glucose Insulin infusion
Visit Time Carbohydrates (g) Time Insulin bolus (U)
CSII 20:30 107 20:30 14.2Closed-loop 20:30 107 20:30 14.0
173
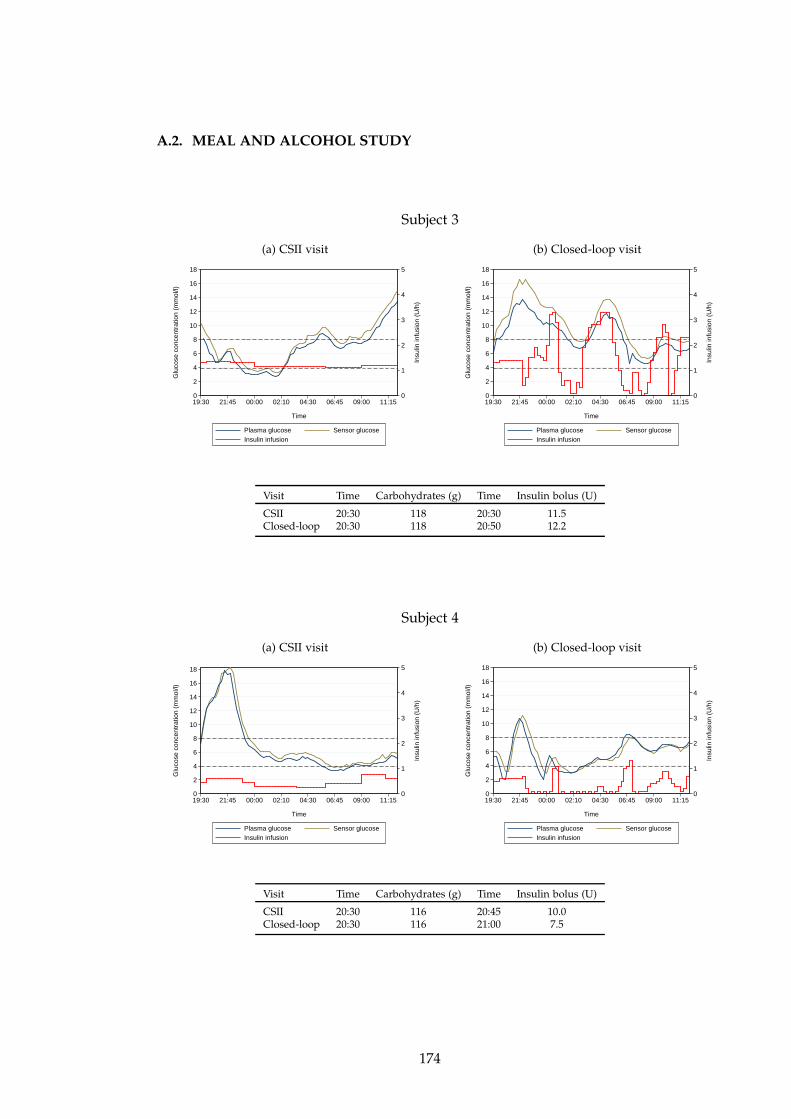
A.2. MEAL AND ALCOHOL STUDY
Subject 3
(a) CSII visit
0
1
2
3
4
5
In
sulin
infu
sion
(U
/h)
0
2
4
6
8
10
12
14
16
18
Glu
cose
con
cent
ratio
n (m
mol
/l)
19:30 21:45 00:00 02:10 04:30 06:45 09:00 11:15
Time
Plasma glucose Sensor glucose Insulin infusion
(b) Closed-loop visit
0
1
2
3
4
5
In
sulin
infu
sion
(U
/h)
0
2
4
6
8
10
12
14
16
18
Glu
cose
con
cent
ratio
n (m
mol
/l)
19:30 21:45 00:00 02:10 04:30 06:45 09:00 11:15
Time
Plasma glucose Sensor glucose Insulin infusion
Visit Time Carbohydrates (g) Time Insulin bolus (U)
CSII 20:30 118 20:30 11.5Closed-loop 20:30 118 20:50 12.2
Subject 4
(a) CSII visit
0
1
2
3
4
5
In
sulin
infu
sion
(U
/h)
0
2
4
6
8
10
12
14
16
18
Glu
cose
con
cent
ratio
n (m
mol
/l)
19:30 21:45 00:00 02:10 04:30 06:45 09:00 11:15
Time
Plasma glucose Sensor glucose Insulin infusion
(b) Closed-loop visit
0
1
2
3
4
5
In
sulin
infu
sion
(U
/h)
0
2
4
6
8
10
12
14
16
18
Glu
cose
con
cent
ratio
n (m
mol
/l)
19:30 21:45 00:00 02:10 04:30 06:45 09:00 11:15
Time
Plasma glucose Sensor glucose Insulin infusion
Visit Time Carbohydrates (g) Time Insulin bolus (U)
CSII 20:30 116 20:45 10.0Closed-loop 20:30 116 21:00 7.5
174
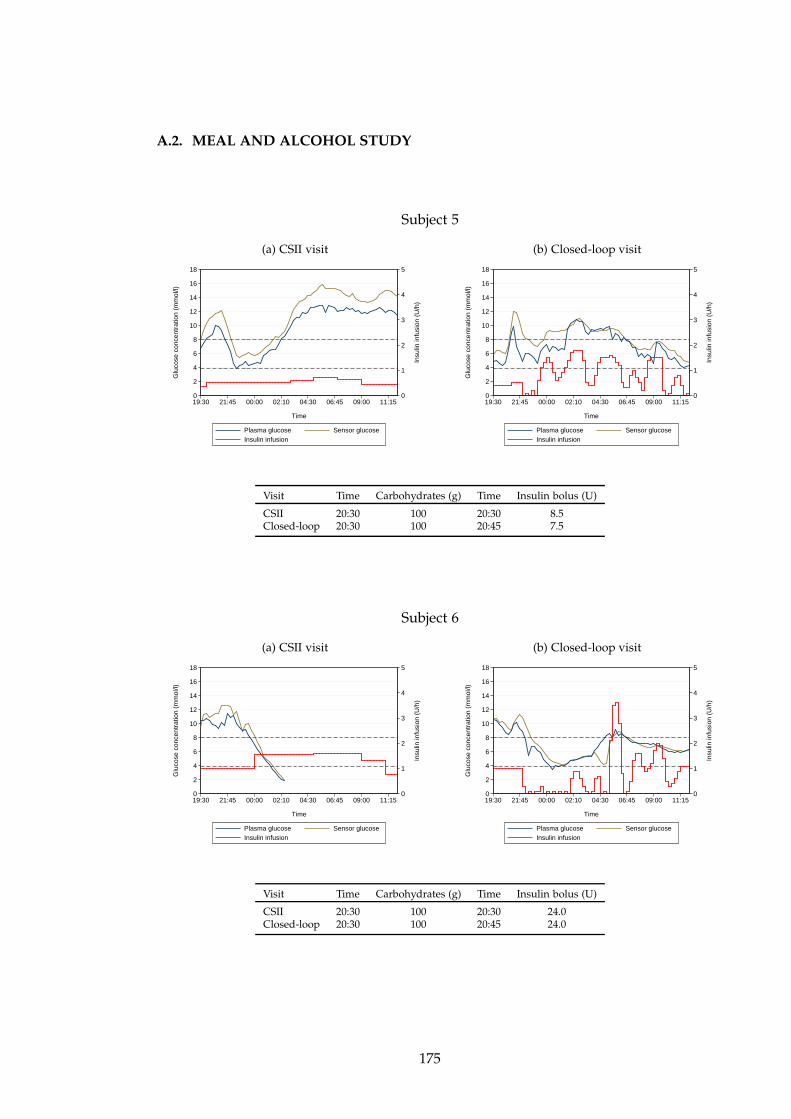
A.2. MEAL AND ALCOHOL STUDY
Subject 5
(a) CSII visit
0
1
2
3
4
5
In
sulin
infu
sion
(U
/h)
0
2
4
6
8
10
12
14
16
18
Glu
cose
con
cent
ratio
n (m
mol
/l)
19:30 21:45 00:00 02:10 04:30 06:45 09:00 11:15
Time
Plasma glucose Sensor glucose Insulin infusion
(b) Closed-loop visit
0
1
2
3
4
5
In
sulin
infu
sion
(U
/h)
0
2
4
6
8
10
12
14
16
18
Glu
cose
con
cent
ratio
n (m
mol
/l)
19:30 21:45 00:00 02:10 04:30 06:45 09:00 11:15
Time
Plasma glucose Sensor glucose Insulin infusion
Visit Time Carbohydrates (g) Time Insulin bolus (U)
CSII 20:30 100 20:30 8.5Closed-loop 20:30 100 20:45 7.5
Subject 6
(a) CSII visit
0
1
2
3
4
5
In
sulin
infu
sion
(U
/h)
0
2
4
6
8
10
12
14
16
18
Glu
cose
con
cent
ratio
n (m
mol
/l)
19:30 21:45 00:00 02:10 04:30 06:45 09:00 11:15
Time
Plasma glucose Sensor glucose Insulin infusion
(b) Closed-loop visit
0
1
2
3
4
5
In
sulin
infu
sion
(U
/h)
0
2
4
6
8
10
12
14
16
18
Glu
cose
con
cent
ratio
n (m
mol
/l)
19:30 21:45 00:00 02:10 04:30 06:45 09:00 11:15
Time
Plasma glucose Sensor glucose Insulin infusion
Visit Time Carbohydrates (g) Time Insulin bolus (U)
CSII 20:30 100 20:30 24.0Closed-loop 20:30 100 20:45 24.0
175
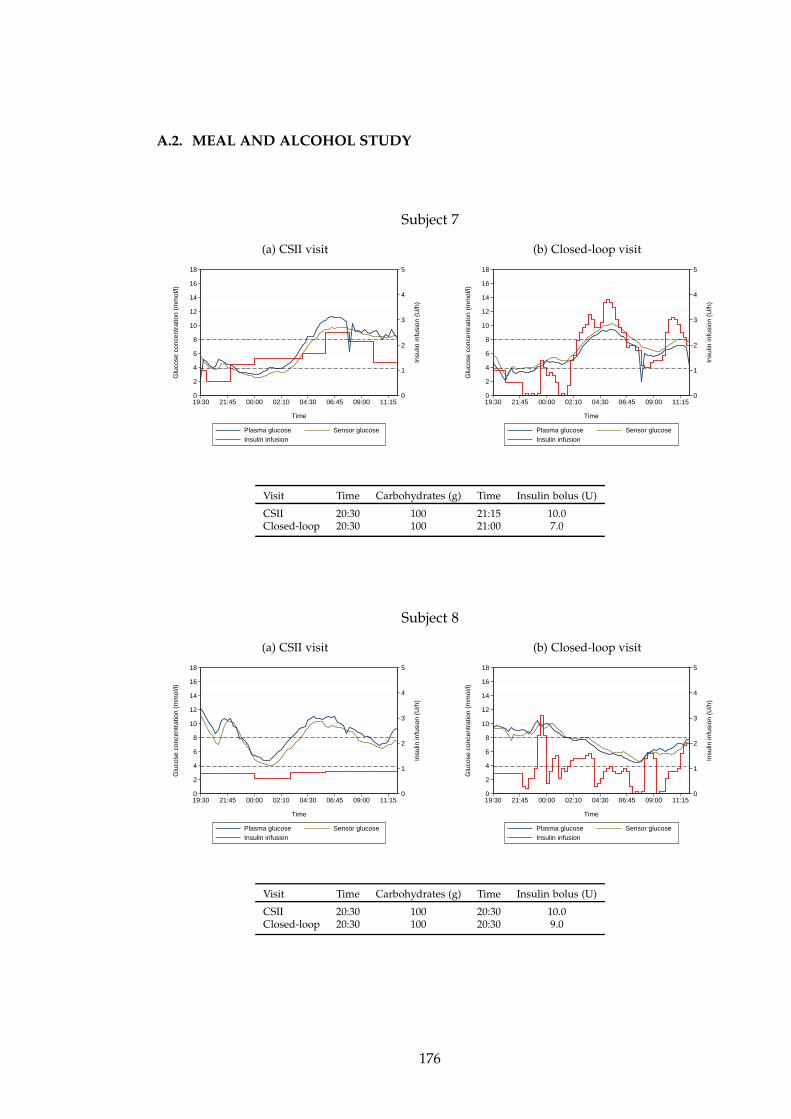
A.2. MEAL AND ALCOHOL STUDY
Subject 7
(a) CSII visit
0
1
2
3
4
5
In
sulin
infu
sion
(U
/h)
0
2
4
6
8
10
12
14
16
18
Glu
cose
con
cent
ratio
n (m
mol
/l)
19:30 21:45 00:00 02:10 04:30 06:45 09:00 11:15
Time
Plasma glucose Sensor glucose Insulin infusion
(b) Closed-loop visit
0
1
2
3
4
5
In
sulin
infu
sion
(U
/h)
0
2
4
6
8
10
12
14
16
18
Glu
cose
con
cent
ratio
n (m
mol
/l)
19:30 21:45 00:00 02:10 04:30 06:45 09:00 11:15
Time
Plasma glucose Sensor glucose Insulin infusion
Visit Time Carbohydrates (g) Time Insulin bolus (U)
CSII 20:30 100 21:15 10.0Closed-loop 20:30 100 21:00 7.0
Subject 8
(a) CSII visit
0
1
2
3
4
5
In
sulin
infu
sion
(U
/h)
0
2
4
6
8
10
12
14
16
18
Glu
cose
con
cent
ratio
n (m
mol
/l)
19:30 21:45 00:00 02:10 04:30 06:45 09:00 11:15
Time
Plasma glucose Sensor glucose Insulin infusion
(b) Closed-loop visit
0
1
2
3
4
5
In
sulin
infu
sion
(U
/h)
0
2
4
6
8
10
12
14
16
18
Glu
cose
con
cent
ratio
n (m
mol
/l)
19:30 21:45 00:00 02:10 04:30 06:45 09:00 11:15
Time
Plasma glucose Sensor glucose Insulin infusion
Visit Time Carbohydrates (g) Time Insulin bolus (U)
CSII 20:30 100 20:30 10.0Closed-loop 20:30 100 20:30 9.0
176
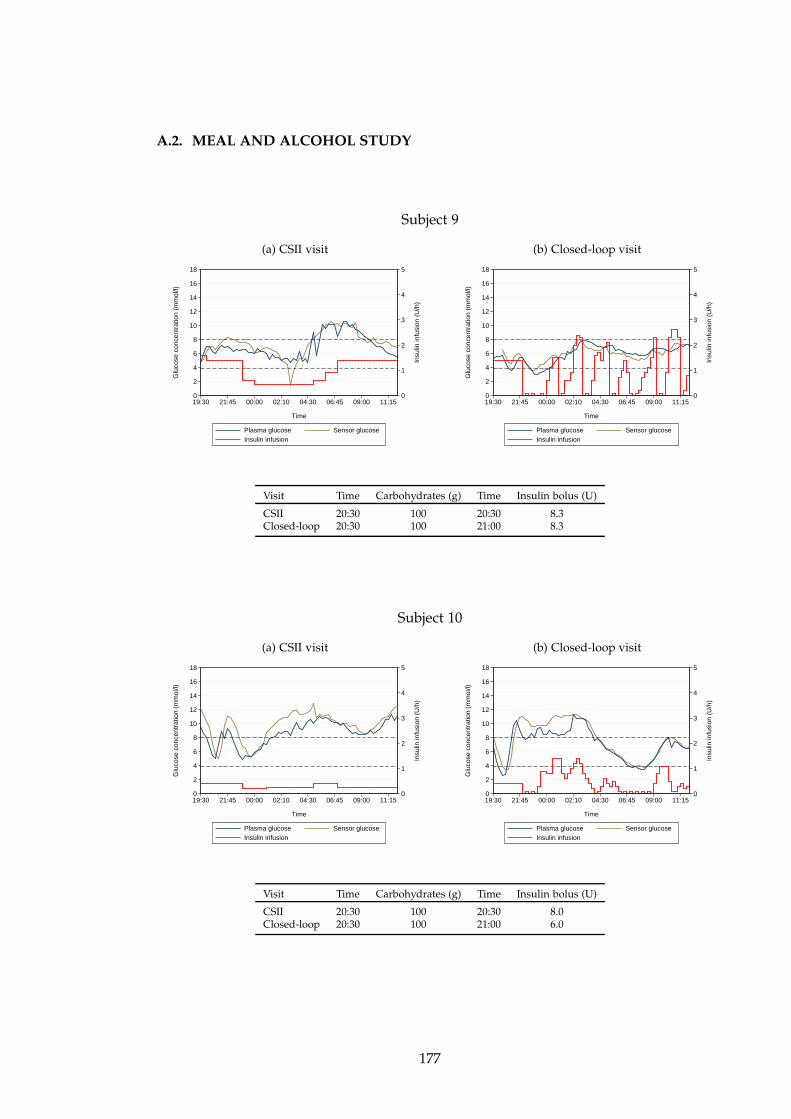
A.2. MEAL AND ALCOHOL STUDY
Subject 9
(a) CSII visit
0
1
2
3
4
5
In
sulin
infu
sion
(U
/h)
0
2
4
6
8
10
12
14
16
18
Glu
cose
con
cent
ratio
n (m
mol
/l)
19:30 21:45 00:00 02:10 04:30 06:45 09:00 11:15
Time
Plasma glucose Sensor glucose Insulin infusion
(b) Closed-loop visit
0
1
2
3
4
5
In
sulin
infu
sion
(U
/h)
0
2
4
6
8
10
12
14
16
18
Glu
cose
con
cent
ratio
n (m
mol
/l)
19:30 21:45 00:00 02:10 04:30 06:45 09:00 11:15
Time
Plasma glucose Sensor glucose Insulin infusion
Visit Time Carbohydrates (g) Time Insulin bolus (U)
CSII 20:30 100 20:30 8.3Closed-loop 20:30 100 21:00 8.3
Subject 10
(a) CSII visit
0
1
2
3
4
5
In
sulin
infu
sion
(U
/h)
0
2
4
6
8
10
12
14
16
18
Glu
cose
con
cent
ratio
n (m
mol
/l)
19:30 21:45 00:00 02:10 04:30 06:45 09:00 11:15
Time
Plasma glucose Sensor glucose Insulin infusion
(b) Closed-loop visit
0
1
2
3
4
5
In
sulin
infu
sion
(U
/h)
0
2
4
6
8
10
12
14
16
18
Glu
cose
con
cent
ratio
n (m
mol
/l)
19:30 21:45 00:00 02:10 04:30 06:45 09:00 11:15
Time
Plasma glucose Sensor glucose Insulin infusion
Visit Time Carbohydrates (g) Time Insulin bolus (U)
CSII 20:30 100 20:30 8.0Closed-loop 20:30 100 21:00 6.0
177
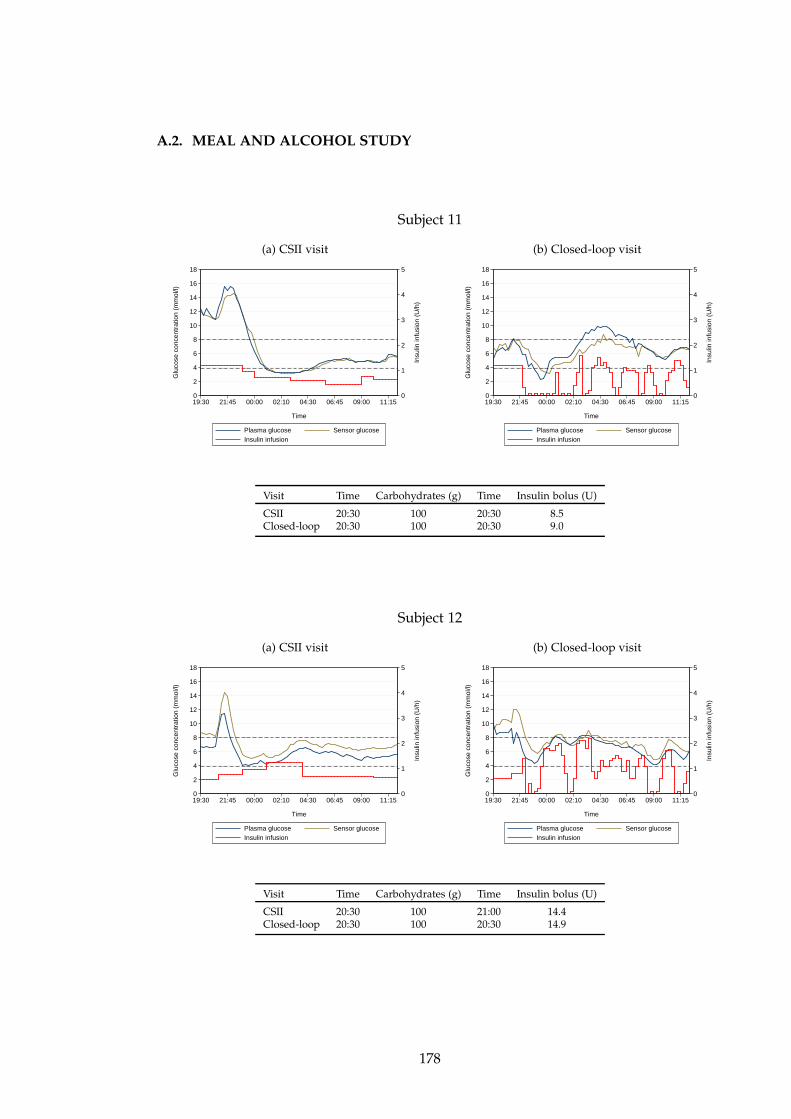
A.2. MEAL AND ALCOHOL STUDY
Subject 11
(a) CSII visit
0
1
2
3
4
5
In
sulin
infu
sion
(U
/h)
0
2
4
6
8
10
12
14
16
18
Glu
cose
con
cent
ratio
n (m
mol
/l)
19:30 21:45 00:00 02:10 04:30 06:45 09:00 11:15
Time
Plasma glucose Sensor glucose Insulin infusion
(b) Closed-loop visit
0
1
2
3
4
5
In
sulin
infu
sion
(U
/h)
0
2
4
6
8
10
12
14
16
18
Glu
cose
con
cent
ratio
n (m
mol
/l)
19:30 21:45 00:00 02:10 04:30 06:45 09:00 11:15
Time
Plasma glucose Sensor glucose Insulin infusion
Visit Time Carbohydrates (g) Time Insulin bolus (U)
CSII 20:30 100 20:30 8.5Closed-loop 20:30 100 20:30 9.0
Subject 12
(a) CSII visit
0
1
2
3
4
5
In
sulin
infu
sion
(U
/h)
0
2
4
6
8
10
12
14
16
18
Glu
cose
con
cent
ratio
n (m
mol
/l)
19:30 21:45 00:00 02:10 04:30 06:45 09:00 11:15
Time
Plasma glucose Sensor glucose Insulin infusion
(b) Closed-loop visit
0
1
2
3
4
5
In
sulin
infu
sion
(U
/h)
0
2
4
6
8
10
12
14
16
18
Glu
cose
con
cent
ratio
n (m
mol
/l)
19:30 21:45 00:00 02:10 04:30 06:45 09:00 11:15
Time
Plasma glucose Sensor glucose Insulin infusion
Visit Time Carbohydrates (g) Time Insulin bolus (U)
CSII 20:30 100 21:00 14.4Closed-loop 20:30 100 20:30 14.9
178
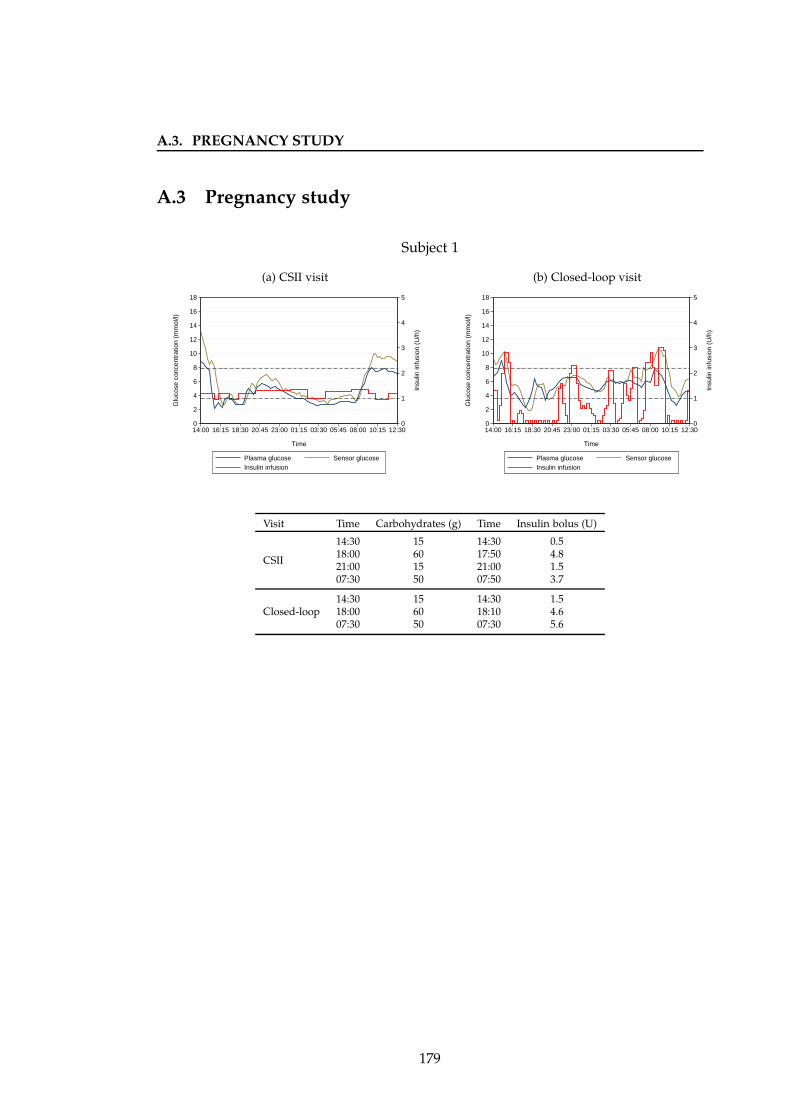
A.3. PREGNANCY STUDY
A.3 Pregnancy study
Subject 1
(a) CSII visit
0
1
2
3
4
5
In
sulin
infu
sion
(U
/h)
0
2
4
6
8
10
12
14
16
18
Glu
cose
con
cent
ratio
n (m
mol
/l)
14:00 16:15 18:30 20:45 23:00 01:15 03:30 05:45 08:00 10:15 12:30
Time
Plasma glucose Sensor glucose Insulin infusion
(b) Closed-loop visit
0
1
2
3
4
5
In
sulin
infu
sion
(U
/h)
0
2
4
6
8
10
12
14
16
18
Glu
cose
con
cent
ratio
n (m
mol
/l)
14:00 16:15 18:30 20:45 23:00 01:15 03:30 05:45 08:00 10:15 12:30
Time
Plasma glucose Sensor glucose Insulin infusion
Visit Time Carbohydrates (g) Time Insulin bolus (U)
CSII
14:30 15 14:30 0.518:00 60 17:50 4.821:00 15 21:00 1.507:30 50 07:50 3.7
Closed-loop14:30 15 14:30 1.518:00 60 18:10 4.607:30 50 07:30 5.6
179
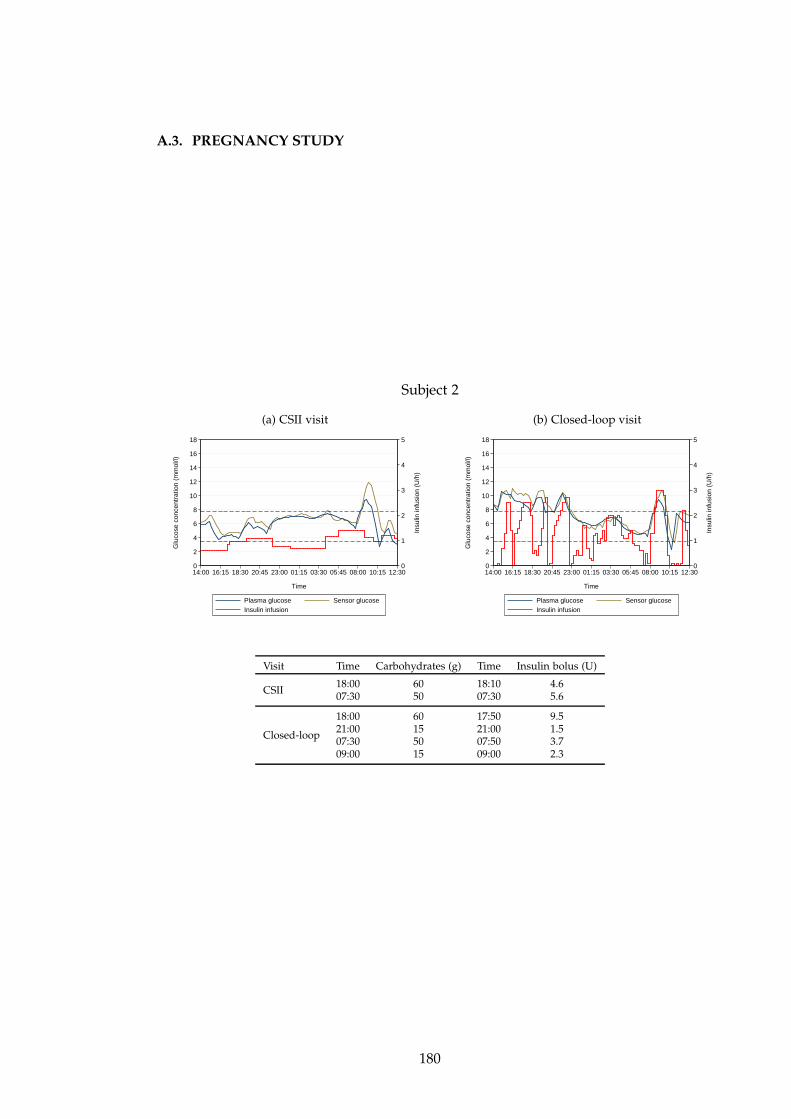
A.3. PREGNANCY STUDY
Subject 2
(a) CSII visit
0
1
2
3
4
5
In
sulin
infu
sion
(U
/h)
0
2
4
6
8
10
12
14
16
18
Glu
cose
con
cent
ratio
n (m
mol
/l)
14:00 16:15 18:30 20:45 23:00 01:15 03:30 05:45 08:00 10:15 12:30
Time
Plasma glucose Sensor glucose Insulin infusion
(b) Closed-loop visit
0
1
2
3
4
5
In
sulin
infu
sion
(U
/h)
0
2
4
6
8
10
12
14
16
18
Glu
cose
con
cent
ratio
n (m
mol
/l)
14:00 16:15 18:30 20:45 23:00 01:15 03:30 05:45 08:00 10:15 12:30
Time
Plasma glucose Sensor glucose Insulin infusion
Visit Time Carbohydrates (g) Time Insulin bolus (U)
CSII18:00 60 18:10 4.607:30 50 07:30 5.6
Closed-loop
18:00 60 17:50 9.521:00 15 21:00 1.507:30 50 07:50 3.709:00 15 09:00 2.3
180
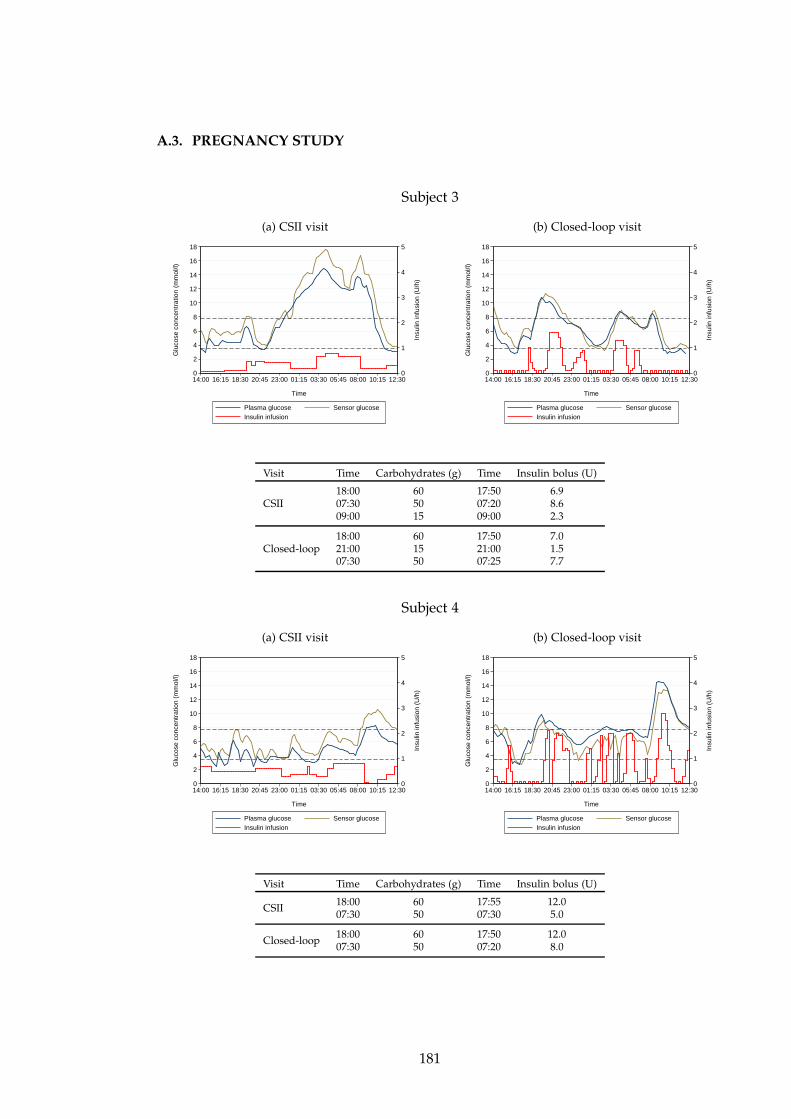
A.3. PREGNANCY STUDY
Subject 3
(a) CSII visit
0
1
2
3
4
5
In
sulin
infu
sion
(U
/h)
0
2
4
6
8
10
12
14
16
18
Glu
cose
con
cent
ratio
n (m
mol
/l)
14:00 16:15 18:30 20:45 23:00 01:15 03:30 05:45 08:00 10:15 12:30
Time
Plasma glucose Sensor glucose Insulin infusion
(b) Closed-loop visit
0
1
2
3
4
5
In
sulin
infu
sion
(U
/h)
0
2
4
6
8
10
12
14
16
18
Glu
cose
con
cent
ratio
n (m
mol
/l)
14:00 16:15 18:30 20:45 23:00 01:15 03:30 05:45 08:00 10:15 12:30
Time
Plasma glucose Sensor glucose Insulin infusion
Visit Time Carbohydrates (g) Time Insulin bolus (U)
CSII18:00 60 17:50 6.907:30 50 07:20 8.609:00 15 09:00 2.3
Closed-loop18:00 60 17:50 7.021:00 15 21:00 1.507:30 50 07:25 7.7
Subject 4
(a) CSII visit
0
1
2
3
4
5
In
sulin
infu
sion
(U
/h)
0
2
4
6
8
10
12
14
16
18
Glu
cose
con
cent
ratio
n (m
mol
/l)
14:00 16:15 18:30 20:45 23:00 01:15 03:30 05:45 08:00 10:15 12:30
Time
Plasma glucose Sensor glucose Insulin infusion
(b) Closed-loop visit
0
1
2
3
4
5
In
sulin
infu
sion
(U
/h)
0
2
4
6
8
10
12
14
16
18
Glu
cose
con
cent
ratio
n (m
mol
/l)
14:00 16:15 18:30 20:45 23:00 01:15 03:30 05:45 08:00 10:15 12:30
Time
Plasma glucose Sensor glucose Insulin infusion
Visit Time Carbohydrates (g) Time Insulin bolus (U)
CSII18:00 60 17:55 12.007:30 50 07:30 5.0
Closed-loop18:00 60 17:50 12.007:30 50 07:20 8.0
181

A.3. PREGNANCY STUDY
Subject 5
(a) CSII visit
0
1
2
3
4
5
In
sulin
infu
sion
(U
/h)
0
2
4
6
8
10
12
14
16
18
Glu
cose
con
cent
ratio
n (m
mol
/l)
14:00 16:15 18:30 20:45 23:00 01:15 03:30 05:45 08:00 10:15 12:30
Time
Plasma glucose Sensor glucose Insulin infusion
(b) Closed-loop visit
0
1
2
3
4
5
In
sulin
infu
sion
(U
/h)
0
2
4
6
8
10
12
14
16
18
Glu
cose
con
cent
ratio
n (m
mol
/l)
14:00 16:15 18:30 20:45 23:00 01:15 03:30 05:45 08:00 10:15 12:30
Time
Plasma glucose Sensor glucose Insulin infusion
Visit Time Carbohydrates (g) Time Insulin bolus (U)
CSII18:00 60 18:15 4.007:30 50 07:35 6.109:00 15 09:00 1.0
Closed-loop18:00 60 17:55 10.007:30 50 07:25 11.009:00 15 09:00 2.0
182
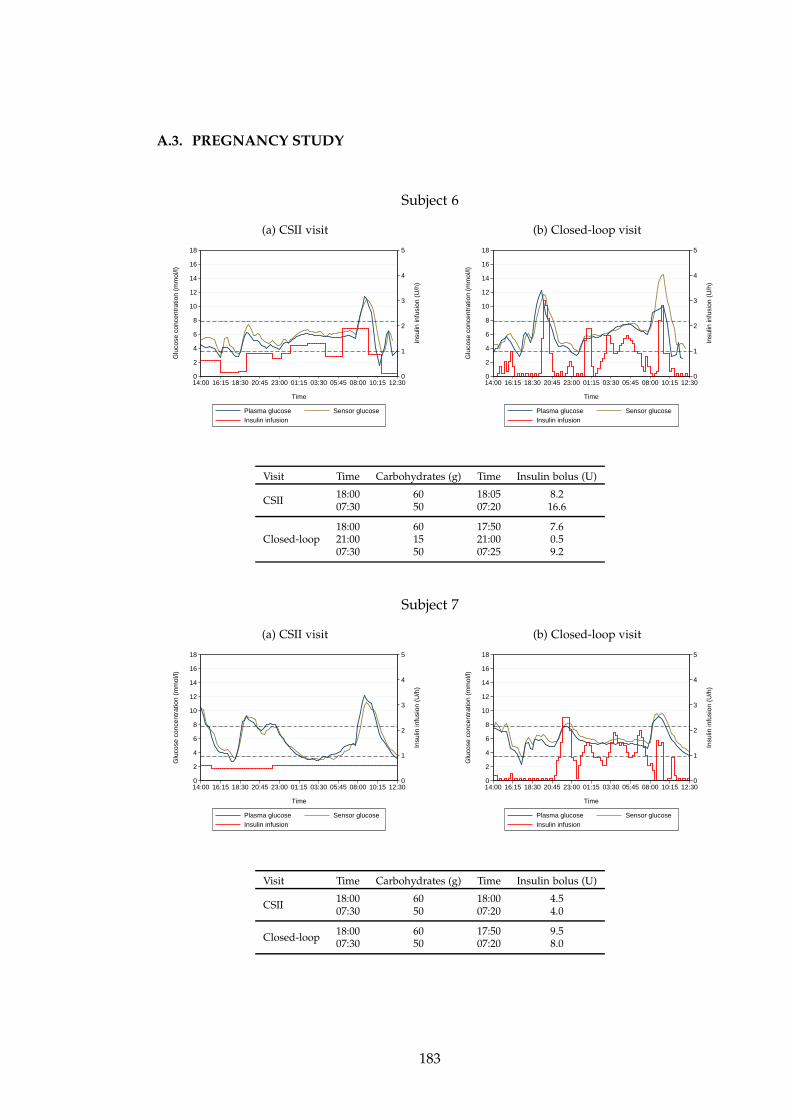
A.3. PREGNANCY STUDY
Subject 6
(a) CSII visit
0
1
2
3
4
5
In
sulin
infu
sion
(U
/h)
0
2
4
6
8
10
12
14
16
18
Glu
cose
con
cent
ratio
n (m
mol
/l)
14:00 16:15 18:30 20:45 23:00 01:15 03:30 05:45 08:00 10:15 12:30
Time
Plasma glucose Sensor glucose Insulin infusion
(b) Closed-loop visit
0
1
2
3
4
5
In
sulin
infu
sion
(U
/h)
0
2
4
6
8
10
12
14
16
18
Glu
cose
con
cent
ratio
n (m
mol
/l)
14:00 16:15 18:30 20:45 23:00 01:15 03:30 05:45 08:00 10:15 12:30
Time
Plasma glucose Sensor glucose Insulin infusion
Visit Time Carbohydrates (g) Time Insulin bolus (U)
CSII18:00 60 18:05 8.207:30 50 07:20 16.6
Closed-loop18:00 60 17:50 7.621:00 15 21:00 0.507:30 50 07:25 9.2
Subject 7
(a) CSII visit
0
1
2
3
4
5
In
sulin
infu
sion
(U
/h)
0
2
4
6
8
10
12
14
16
18
Glu
cose
con
cent
ratio
n (m
mol
/l)
14:00 16:15 18:30 20:45 23:00 01:15 03:30 05:45 08:00 10:15 12:30
Time
Plasma glucose Sensor glucose Insulin infusion
(b) Closed-loop visit
0
1
2
3
4
5
In
sulin
infu
sion
(U
/h)
0
2
4
6
8
10
12
14
16
18
Glu
cose
con
cent
ratio
n (m
mol
/l)
14:00 16:15 18:30 20:45 23:00 01:15 03:30 05:45 08:00 10:15 12:30
Time
Plasma glucose Sensor glucose Insulin infusion
Visit Time Carbohydrates (g) Time Insulin bolus (U)
CSII18:00 60 18:00 4.507:30 50 07:20 4.0
Closed-loop18:00 60 17:50 9.507:30 50 07:20 8.0
183
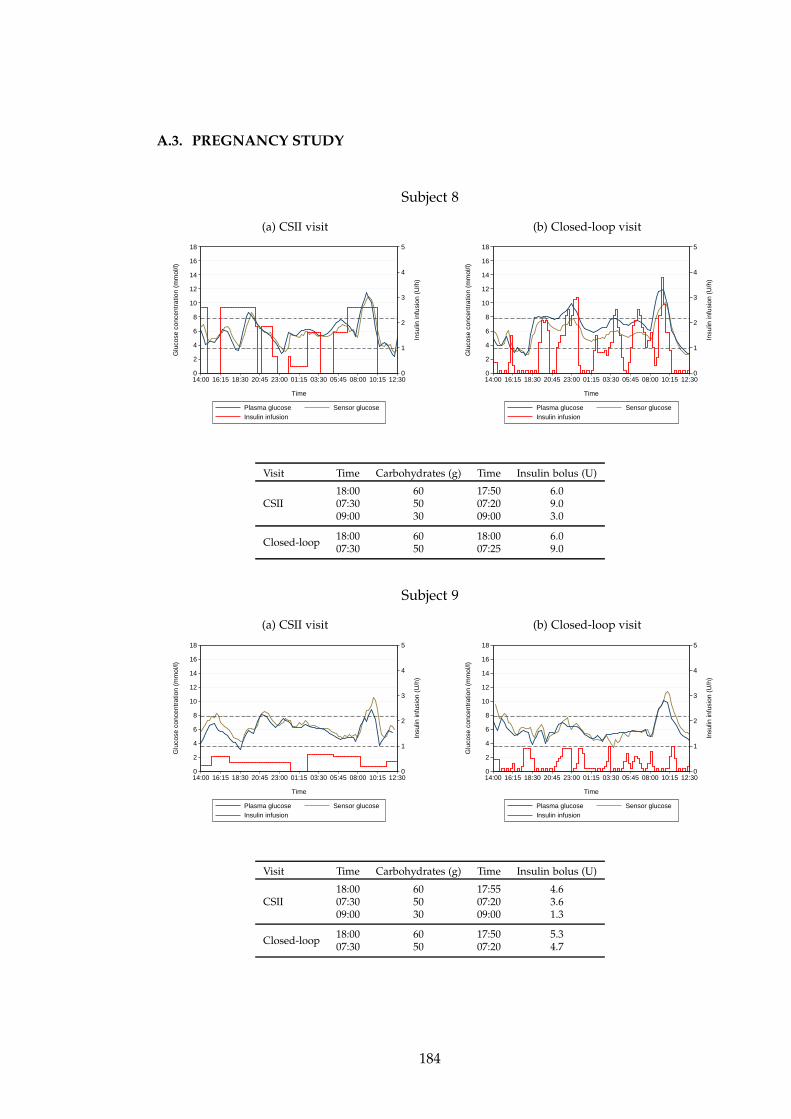
A.3. PREGNANCY STUDY
Subject 8
(a) CSII visit
0
1
2
3
4
5
In
sulin
infu
sion
(U
/h)
0
2
4
6
8
10
12
14
16
18
Glu
cose
con
cent
ratio
n (m
mol
/l)
14:00 16:15 18:30 20:45 23:00 01:15 03:30 05:45 08:00 10:15 12:30
Time
Plasma glucose Sensor glucose Insulin infusion
(b) Closed-loop visit
0
1
2
3
4
5
In
sulin
infu
sion
(U
/h)
0
2
4
6
8
10
12
14
16
18
Glu
cose
con
cent
ratio
n (m
mol
/l)
14:00 16:15 18:30 20:45 23:00 01:15 03:30 05:45 08:00 10:15 12:30
Time
Plasma glucose Sensor glucose Insulin infusion
Visit Time Carbohydrates (g) Time Insulin bolus (U)
CSII18:00 60 17:50 6.007:30 50 07:20 9.009:00 30 09:00 3.0
Closed-loop18:00 60 18:00 6.007:30 50 07:25 9.0
Subject 9
(a) CSII visit
0
1
2
3
4
5
In
sulin
infu
sion
(U
/h)
0
2
4
6
8
10
12
14
16
18
Glu
cose
con
cent
ratio
n (m
mol
/l)
14:00 16:15 18:30 20:45 23:00 01:15 03:30 05:45 08:00 10:15 12:30
Time
Plasma glucose Sensor glucose Insulin infusion
(b) Closed-loop visit
0
1
2
3
4
5
In
sulin
infu
sion
(U
/h)
0
2
4
6
8
10
12
14
16
18
Glu
cose
con
cent
ratio
n (m
mol
/l)
14:00 16:15 18:30 20:45 23:00 01:15 03:30 05:45 08:00 10:15 12:30
Time
Plasma glucose Sensor glucose Insulin infusion
Visit Time Carbohydrates (g) Time Insulin bolus (U)
CSII18:00 60 17:55 4.607:30 50 07:20 3.609:00 30 09:00 1.3
Closed-loop18:00 60 17:50 5.307:30 50 07:20 4.7
184
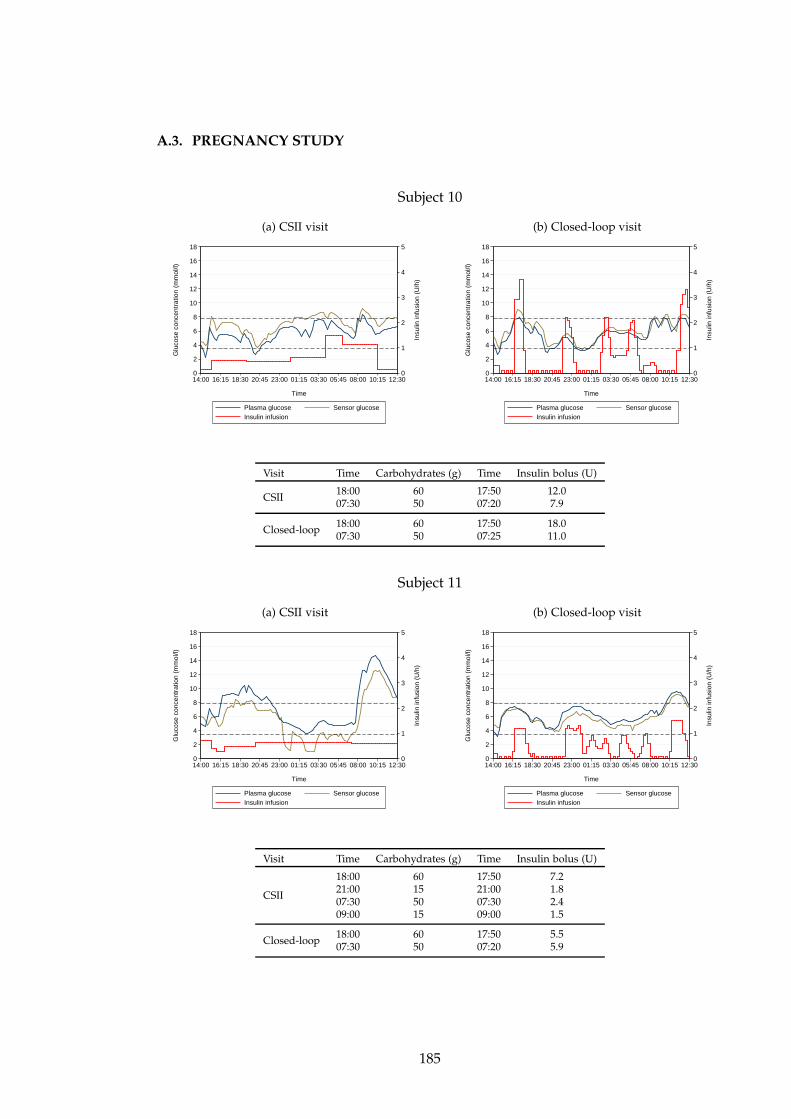
A.3. PREGNANCY STUDY
Subject 10
(a) CSII visit
0
1
2
3
4
5
In
sulin
infu
sion
(U
/h)
0
2
4
6
8
10
12
14
16
18
Glu
cose
con
cent
ratio
n (m
mol
/l)
14:00 16:15 18:30 20:45 23:00 01:15 03:30 05:45 08:00 10:15 12:30
Time
Plasma glucose Sensor glucose Insulin infusion
(b) Closed-loop visit
0
1
2
3
4
5
In
sulin
infu
sion
(U
/h)
0
2
4
6
8
10
12
14
16
18
Glu
cose
con
cent
ratio
n (m
mol
/l)
14:00 16:15 18:30 20:45 23:00 01:15 03:30 05:45 08:00 10:15 12:30
Time
Plasma glucose Sensor glucose Insulin infusion
Visit Time Carbohydrates (g) Time Insulin bolus (U)
CSII18:00 60 17:50 12.007:30 50 07:20 7.9
Closed-loop18:00 60 17:50 18.007:30 50 07:25 11.0
Subject 11
(a) CSII visit
0
1
2
3
4
5
In
sulin
infu
sion
(U
/h)
0
2
4
6
8
10
12
14
16
18
Glu
cose
con
cent
ratio
n (m
mol
/l)
14:00 16:15 18:30 20:45 23:00 01:15 03:30 05:45 08:00 10:15 12:30
Time
Plasma glucose Sensor glucose Insulin infusion
(b) Closed-loop visit
0
1
2
3
4
5
In
sulin
infu
sion
(U
/h)
0
2
4
6
8
10
12
14
16
18
Glu
cose
con
cent
ratio
n (m
mol
/l)
14:00 16:15 18:30 20:45 23:00 01:15 03:30 05:45 08:00 10:15 12:30
Time
Plasma glucose Sensor glucose Insulin infusion
Visit Time Carbohydrates (g) Time Insulin bolus (U)
CSII
18:00 60 17:50 7.221:00 15 21:00 1.807:30 50 07:30 2.409:00 15 09:00 1.5
Closed-loop18:00 60 17:50 5.507:30 50 07:20 5.9
185
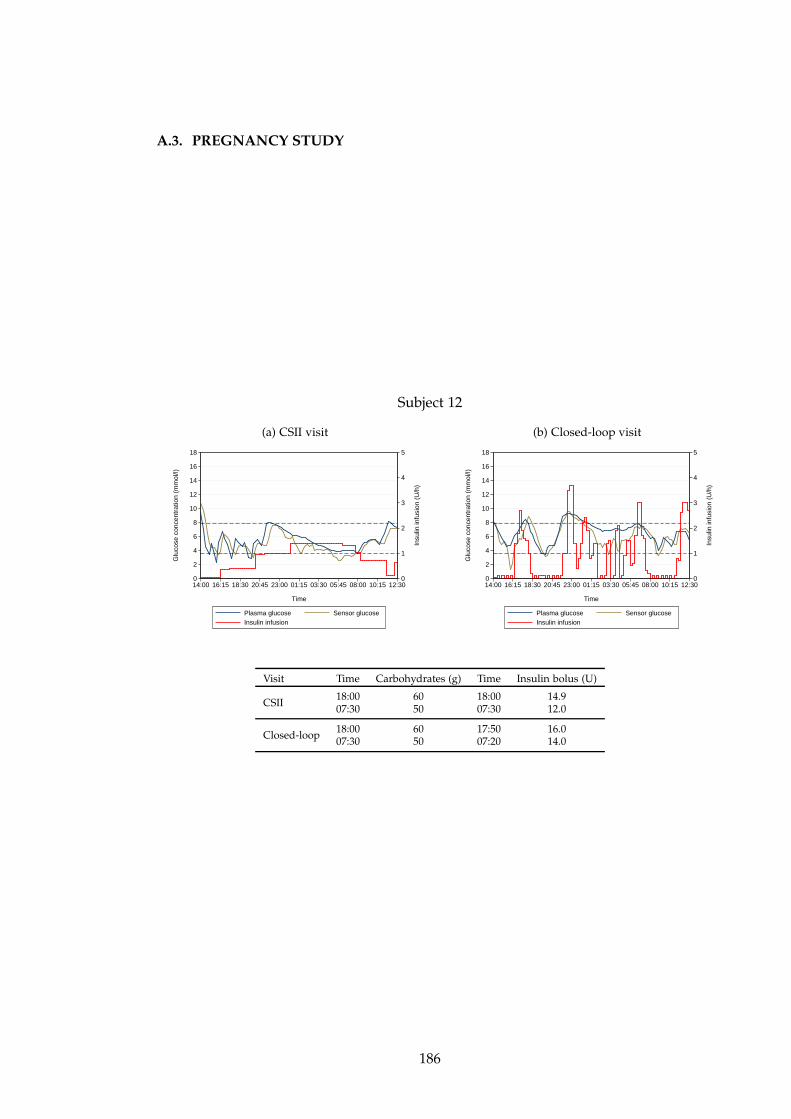
A.3. PREGNANCY STUDY
Subject 12
(a) CSII visit
0
1
2
3
4
5
In
sulin
infu
sion
(U
/h)
0
2
4
6
8
10
12
14
16
18
Glu
cose
con
cent
ratio
n (m
mol
/l)
14:00 16:15 18:30 20:45 23:00 01:15 03:30 05:45 08:00 10:15 12:30
Time
Plasma glucose Sensor glucose Insulin infusion
(b) Closed-loop visit
0
1
2
3
4
5
In
sulin
infu
sion
(U
/h)
0
2
4
6
8
10
12
14
16
18
Glu
cose
con
cent
ratio
n (m
mol
/l)
14:00 16:15 18:30 20:45 23:00 01:15 03:30 05:45 08:00 10:15 12:30
Time
Plasma glucose Sensor glucose Insulin infusion
Visit Time Carbohydrates (g) Time Insulin bolus (U)
CSII18:00 60 18:00 14.907:30 50 07:30 12.0
Closed-loop18:00 60 17:50 16.007:30 50 07:20 14.0
186
Appendix B
Achievements
Publications
• Haidar A, Elleri D, Allen J, Harris J, Kumareswaran K, Nodale M, Acerini C,
Wilinska M, Jackson N, Umpleby M, Evans M, Dunger D, Hovorka R. “Validity
of Triple and Dual-Tracer Techniques to Estimate Glucose Appearance" Ameri-
can Journal of Physiology Endocrinology & Metabolism 2012 Mar 27
• Kumareswaran K, Evans M, Hovorka R. “Closed-loop insulin delivery: towards
improved diabetes care” Discovery Medicine 2012 Feb, 13(69):159-70
• Kumareswaran K, Elleri D, Allen J, Harris J, Xing D, Kollman C, Nodale M,
Murphy H, Amiel S, Heller S, Wilinska M, Acerini C, Evans M, Dunger D,
Hovorka R. “Meta-analysis of overnight closed-loop randomised studies in chil-
dren and adults with type 1 diabetes: the Cambridge cohort” Journal of Diabetes
Science and Technology 2011 Nov, 5(6):1352-62
• Murphy H, Kumareswaran K, Elleri D, Allen J, Caldwell K, Biagioni M, Sim-
mons D, Dunger D, Nodale M, Wilinska M, Amiel S, Hovorka R. “Safety and
efficacy of 24-hour closed-loop insulin delivery in well controlled pregnant
women with type 1 diabetes: a randomised crossover case series” Diabetes Care
2011 Dec, 34(12):2527-9
• Hovorka R, Kumareswaran K, Harris J, Allen J, Elleri D, Xing D, Kollman C,
Nodale M, Murphy H, Dunger D, Amiel A, Heller S, Wilinska M, Evans M.
187
“Overnight closed-loop insulin delivery (artificial pancreas) in adults with type
1 diabetes: crossover randomised controlled studies” British Medical Journal 2011
Apr, 342:d1855
• Kumareswaran K, Evans M, Hovorka R. “Artificial Pancreas: an emerging
approach to treat type 1 diabetes” Expert Review of Medical Devices 2009 July,
6(4):401-410
Awards & prizes
• John Stowers Research Award (best conference poster), EASD Diabetic Preg-
nancy Study Group meeting 2011
• MRL Student Symposium poster prize, University of Cambridge Metabolic Re-
search Laboratories 2011
• Class of 2011 Endocrine Trainee Travel Award, ENDO Boston 2011
• Juvenile Diabetes Research Foundation Student Research Gold Award (best con-
ference poster), Diabetes Technology Meeting 2010
• Travel Award, European Association for the Study of Diabetes meeting 2010
• Eli Lilly Award (best clinical science poster), Diabetes UK Annual Professional
Conference 2010
• Travel Award, Diabetes UK Annual Professional Conference 2010
Formal presentations
• “Physical activity energy expenditure and glucose levels in pregnant women
with type 1 diabetes during free-living and controlled conditions" (poster) Amer-
ican Diabetes Association, Philadelphia USA, 2012
• “Continuous glucose monitoring performance during exercise in pregnant women
with type 1 diabetes" (poster) American Diabetes Association, Philadelphia
USA, 2012
188
• “Closed-loop insulin delivery during normal daily activities in pregnant women
with type 1 diabetes" (oral) Advanced Technologies and Treatments for Dia-
betes, Barcelona Spain, 2012
• “Closed-loop insulin delivery during normal daily activities in pregnant women
with type 1 diabetes" (poster) Medical Research Society Clinician Scientists in
Training Meeting, London UK, 2012
• “Closed-loop insulin delivery protects against nocturnal hypoglycaemia after
moderate physical activity in pregnant women with type 1 diabetes" (poster)
EASD Diabetic Pregnancy Study Group meeting, Cambridge UK, 2011
• “The diverse spectrum of non-islet cell tumour-induced hypoglycaemia – 3 case
reports” (poster) ENDO Annual Meeting, Boston USA, 2011
• “Overnight closed-loop insulin delivery in adults with type 1 diabetes” (poster)
Parliamentary and Scientific Committee SET for BRITAIN Competition, House
of Commons London UK, 2011
• “Closing the loop overnight in adults with type 1 diabetes following standard
meal and large meal with alcohol” (oral) Advanced Technologies and Treat-
ments for Diabetes, London UK, 2011
• “Overnight closed-loop insulin delivery in adults with type 1 diabetes” (poster)
Medical Research Society Clinician Scientists in Training Meeting, London UK,
2011
• “A rare cause of hypoglycaemia” (oral) Addenbrooke’s Hospital Grand Round,
Cambridge UK, 2010
• “Overnight closed-loop insulin delivery in adults with type 1 diabetes” (poster)
Diabetes Technology Meeting, Bethesda USA, 2010
• “Overnight closed-loop glucose control following consumption of alcohol in
adults with type 1 diabetes” (oral) European Association for the Study of Dia-
betes, Stockholm Sweden, 2010
• “Non-islet cell tumour-induced hypoglycaemia – what is the optimal treatment?
2 case reports” (poster) UK Ireland Neuroendocrine Tumour Society Meeting,
Belfast Ireland, 2010
189
• “Overnight closed loop glucose control following consumption of alcohol in
adults with type 1 diabetes” (oral) American Diabetes Association, Orlando
USA, 2010
• “Closing the loop in adults with type 1 diabetes” (oral) Diabetes UK Annual
Professional Conference, Liverpool UK, 2010
• “Closing the loop in adults with type 1 diabetes” (oral) Anglo Danish Dutch
Diabetes Group Meeting, Avegoor Netherlands, 2009
190
References
[1] A Guyton and J Hall. Textbook of Medical Physiology. Elsevier Saunders, Philadel-
phia, 11 edition, 2006. 1
[2] World Health Organization: Definition and diagnosis of diabetes mellitus and
intermediate hyperglycemia: Report of a WHO/IDF consultation. Technical
report, World Health Org, Geneva, 2006. 2, 88
[3] J. A. Todd. Etiology of type 1 diabetes. Immunity, 32(4):457–67, 2010. 2
[4] J. E. Shaw, R. A. Sicree, and P. Z. Zimmet. Global estimates of the prevalence
of diabetes for 2010 and 2030. Diabetes Research and Clinical Practice, 87(1):4–14,
2010. 2
[5] The NHS Information Centre. National diabetes audit executive summary
2009-2010. Key findings about the quality of care for people with diabetes in
England and Wales. Technical report, 2011. 2, 12
[6] P. Zhang, X. Z. Zhang, J. Brown, D. Vistisen, R. Sicree, J. Shaw, and G. Nichols.
Global healthcare expenditure on diabetes for 2010 and 2030. Diabetes Research
and Clinical Practice, 87(3):293–301, 2010. 2
[7] American Diabetes Association. Executive summary: standards of medical care
in diabetes – 2012. Diabetes Care, 35 Suppl 1:S4–10, 2012. 3, 12
[8] G. Freckmann, A. Baumstark, N. Jendrike, E. Zschornack, S. Kocher, J. Tshi-
ananga, F. Heister, and C. Haug. System accuracy evaluation of 27 blood glu-
cose monitoring systems according to DIN EN ISO 15197. Diabetes Technol Ther,
12(3):221–31, 2010. 3, 147
[9] D. C. Klonoff. Continuous glucose monitoring: roadmap for 21st century dia-
betes therapy. Diabetes Care, 28(5):1231–9, 2005. 3, 132
191
REFERENCES
[10] W. L. Clarke, D. Cox, L. A. Gonderfrederick, W. Carter, and S. L. Pohl. Evaluat-
ing clinical accuracy of systems for self-monitoring of blood-glucose. Diabetes
Care, 10(5):622–8, 1987. 3, 4, 37, 138
[11] ISO 15197:2003. In vitro diagnostic test systems: requirements for blood-
glucose monitoring systems for self-testing in managing diabetes mellitus.
Technical report, 2003. 4, 137, 144
[12] K. Rebrin, G. M. Steil, W. P. Van Antwerp, and J. J. Mastrototaro. Subcutaneous
glucose predicts plasma glucose independent of insulin: implications for con-
tinuous monitoring. Am J Physiol Endocrinol Metab, 277:E561–E571, 1999. 5
[13] N. Sachedina and J. C. Pickup. Performance assessment of the Medtronic-
MiniMed Continuous Glucose Monitoring System and its use for measurement
of glycaemic control in type 1 diabetic subjects. Diabet Med, 20(12):1012–5, 2003.
5
[14] M. Schoemaker, E. Andreis, J. Roper, R. Kotulla, V. Lodwig, K. Obermaier,
P. Stephan, W. Reuschling, M. Rutschmann, R. Schwaninger, U. Wittmann,
H. Rinne, H. Kontschieder, and W. Strohmeier. The SCGM1 System: sub-
cutaneous continuous glucose monitoring based on microdialysis technique.
Diabetes Technol Ther, 5(4):599–608, 2003. 5
[15] F. Valgimigli, F. Lucarelli, C. Scuffi, S. Morandi, and I. Sposato. Evaluating the
clinical accuracy of GlucoMen(R)Day: a novel microdialysis-based continuous
glucose monitor. J Diabetes Sci Technol, 4(5):1182–92, 2010. 5, 6, 11, 148
[16] B. Kovatchev, S. Anderson, L. Heinemann, and W. Clarke. Comparison of the
numerical and clinical accuracy of four continuous glucose monitors. Diabetes
Care, 31(6):1160–1164, 2008. 6, 7, 50, 53
[17] S. K. Garg, J. Smith, C. Beatson, B. Lopez-Baca, M. Voelmle, and P. A. Gottlieb.
Comparison of accuracy and safety of the SEVEN and the Navigator continu-
ous glucose monitoring systems. Diabetes Technol Ther, 11(2):65–72, 2009. 6, 133,
144
[18] D. B. Keenan, J. J. Mastrototaro, H. Zisser, K. A. Cooper, G. Raghavendhar, S. W.
Lee, J. Yusi, T. Bailey, R. L. Brazg, and R. V. Shah. Accuracy of the Enlite 6-day
glucose sensor with Guardian and Veo calibration algorithms. Diabetes Technol
Ther, 14(3):225–31, Mar 2011. 6, 7, 10, 134
192
REFERENCES
[19] R. O. Potts, J. A. Tamada, and M. J. Tierney. Glucose monitoring by reverse
iontophoresis. Diabetes Metab Res Rev, 18 Suppl 1:S49–53, 2002. 5
[20] S. P. Newman, D. Cooke, A. Casbard, S. Walker, S. Meredith, A. Nunn, L. Steed,
A. Manca, M. Sculpher, M. Barnard, D. Kerr, J. Weaver, J. Ahlquist, and S. J.
Hurel. A randomised controlled trial to compare minimally invasive glu-
cose monitoring devices with conventional monitoring in the management of
insulin-treated diabetes mellitus (MITRE). Health Technol Assess, 13(28):1–194,
2009. 5
[21] A. Kamath, A. Mahalingam, and J. Brauker. Analysis of time lags and other
sources of error of the DexCom SEVEN continuous glucose monitor. Diabetes
Technol Ther, 11(11):689–95, 2009. 7, 10, 133, 134, 144, 148
[22] S. Vaddiraju, D. J. Burgess, I. Tomazos, F. C. Jain, and F. Papadimitrakopoulos.
Technologies for continuous glucose monitoring: current problems and future
promises. J Diabetes Sci Technol, 4(6):1540–62, 2010. 7, 148
[23] D. Deis, J. Bolinder, J. P. Riveline, T. Battelino, E. Bosi, N. Tubiana-Rufi, D. Kerr,
and M. Phillip. Improved glycemic control in poorly controlled patients with
type 1 diabetes using real-time continuous glucose monitoring. Diabetes Care,
29(12):2730–2, 2006. 7
[24] W. V. Tamborlane, R. W. Beck, B. W. Bode, B. Buckingham, H. P. Chase,
R. Clemons, R. Fiallo-Scharer, L. A. Fox, L. K. Gilliam, I. B. Hirsch, E. S.
Huang, C. Kollman, A. J. Kowalski, L. Laffel, J. M. Lawrence, J. Lee, N. Mauras,
M. O’Grady, K. J. Ruedy, M. Tansey, E. Tsalikian, S. Weinzimer, D. M. Wilson,
H. Wolpert, T. Wysocki, D. Y. Xing, and Continuous Juvenile Diabet Res Fdn.
Continuous glucose monitoring and intensive treatment of type 1 diabetes. New
Engl J Med, 359(14):1464–U65, 2008. 7
[25] R. W. Beck, B. Buckingham, K. Miller, H. Wolpert, D. Xing, J. M. Block, H. P.
Chase, I. Hirsch, C. Kollman, L. Laffel, J. M. Lawrence, K. Milaszewski, K. J.
Ruedy, and W. V. Tamborlane. Factors predictive of use and of benefit from
continuous glucose monitoring in type 1 diabetes. Diabetes Care, 32(11):1947–
53, 2009. 7, 161
[26] G. Y. Gandhi, M. Kovalaske, Y. Kudva, K. Walsh, M. B. Elamin, M. Beers,
C. Coyle, M. Goalen, M. S. Murad, P. J. Erwin, J. Corpus, V. M. Montori, and
193
REFERENCES
M. H. Murad. Efficacy of continuous glucose monitoring in improving glycemic
control and reducing hypoglycemia: a systematic review and meta-analysis of
randomized trials. J Diabetes Sci Technol, 5(4):952–65, 2011. 7
[27] B. Bode, R. W. Beck, D. Xing, L. Gilliam, I. Hirsch, C. Kollman, L. Laffel, K. J.
Ruedy, W. V. Tamborlane, S. Weinzimer, and H. Wolpert. Sustained benefit of
continuous glucose monitoring on A1c, glucose profiles, and hypoglycemia in
adults with type 1 diabetes. Diabetes Care, 32(11):2047–9, 2009. 8
[28] T. Battelino, M. Phillip, N. Bratina, R. Nimri, P. Oskarsson, and J. Bolinder.
Effect of continuous glucose monitoring on hypoglycemia in type 1 diabetes.
Diabetes Care, 34(4):795–800, 2011. 8
[29] E. A. Ryan and J. Germsheid. Use of continuous glucose monitoring system
in the management of severe hypoglycemia. Diabetes Technol Ther, 11(10):635–9,
2009. 8
[30] T. T. Ly, J. Hewitt, R. J. Davey, E. M. Lim, E. A. Davis, and T. W. Jones. Im-
proving epinephrine responses in hypoglycemia unawareness with real-time
continuous glucose monitoring in adolescents with type 1 diabetes. Diabetes
Care, 34(1):50–2, 2011. 8
[31] M. W. Langendam, Y. M. Luijf, L. Hooft, J. H. Devries, A. H. Mudde, and R. J.
Scholten. Continuous glucose monitoring systems for type 1 diabetes mellitus.
Cochrane Database Syst Rev, 1:CD008101, 2012. 8
[32] I. B. Hirsch, J. Abelseth, B. W. Bode, J. S. Fischer, F. R. Kaufman, J. Mastrototaro,
C. G. Parkin, H. A. Wolpert, and B. A. Buckingham. Sensor-augmented insulin
pump therapy: Results of the first randomized treat-to-target study. Diabetes
Technol Ther, 10(5):377–83, 2008. 8
[33] R. M. Bergenstal, W. V. Tamborlane, A. Ahmann, J. B. Buse, G. Dailey, S. N.
Davis, C. Joyce, T. Peoples, B. A. Perkins, J. B. Welsh, S. M. Willi, M. A. Wood,
and STAR Study Grp. Effectiveness of sensor-augmented insulin-pump therapy
in type 1 diabetes. New Engl J Med, 363(4):311–320, 2010. 8, 30
[34] J. B. Buse, G. Dailey, A. A. Ahmann, R. M. Bergenstal, J. B. Green, T. Peoples,
R. J. Tanenberg, and Q. Yang. Baseline predictors of A1c reduction in adults
using sensor-augmented pump therapy or multiple daily injection therapy: The
STAR 3 experience. Diabetes Technol Ther, 13(6):601–6, 2011. 8
194
REFERENCES
[35] I. Conget, T. Battelino, M. Gimenez, H. Gough, J. Castaneda, and J. Bolinder.
The SWITCH study (sensing with insulin pump therapy to control HbA1c):
design and methods of a randomized controlled crossover trial on sensor-
augmented insulin pump efficacy in type 1 diabetes suboptimally controlled
with pump therapy. Diabetes Technol Ther, 13(1):49–54, 2011. 8
[36] I Conget, T Battelino, B Olsen, I Schütz-Fuhrmann, E Hommel, R Hoogma,
U Schierloh, N Sulli, and J Bolinder. Efficacy of continuous glucose monitoring
in type 1 diabetes sub-optimally controlled with insulin pump therapy. the
SWITCH study. In Advanced Technologies & Treatments for Diabetes, Barcelona
Spain, 2012. 9
[37] I. B. Hirsch, D. Armstrong, R. M. Bergenstal, B. Buckingham, B. P. Childs, W. L.
Clarke, A. Peters, and H. Wolpert. Clinical application of emerging sensor tech-
nologies in diabetes management: consensus guidelines for continuous glucose
monitoring (CGM). Diabetes Technol Ther, 10(4):232–44; quiz 245–6, 2008. 9, 30
[38] D. C. Klonoff, B. Buckingham, J. S. Christiansen, V. M. Montori, W. V. Tambor-
lane, R. A. Vigersky, and H. Wolpert. Continuous glucose monitoring: an En-
docrine Society clinical practice guideline. J Clin Endocrinol Metab, 96(10):2968–
79, 2011. 9
[39] J. H. DeVries. Continuous glucose monitoring - coming of age. Eur J Endocrinol,
166(1):1–4, 2012. 9
[40] E. S. Huang, M. O’Grady, A. Basu, A. Winn, P. John, J. Lee, D. Meltzer, C. Koll-
man, L. Laffel, W. Tamborlane, S. Weinzimer, T. Wysocki, and Continuous Ju-
venile Diabet Res Fdn. The cost-effectiveness of continuous glucose monitoring
in type 1 diabetes. Diabetes Care, 33(6):1269–74, 2010. 9
[41] J. Halford and C. Harris. Determining clinical and psychological benefits and
barriers with continuous glucose monitoring therapy. Diabetes Technol Ther,
12(3):201–5, 2010. 9, 10, 134
[42] M. Tansey, L. Laffel, J. Cheng, R. Beck, J. Coffey, E. Huang, C. Kollman,
J. Lawrence, J. Lee, K. Ruedy, W. Tamborlane, T. Wysocki, and D. Xing. Satis-
faction with continuous glucose monitoring in adults and youths with type 1
diabetes. Diabet Med, 28(9):1118–22, 2011. 10, 160, 162
195
REFERENCES
[43] B. P. Kovatchev, D. Shields, and M. Breton. Graphical and numerical evaluation
of continuous glucose sensing time lag. Diabetes Technol Ther, 11(3):139–43, 2009.
10
[44] B. A. Buckingham, C. Kollman, R. Beck, A. Kalajian, R. Fiallo-Scharer, M. J.
Tansey, L. A. Fox, D. M. Wilson, S. A. Weinzimer, K. J. Ruedy, and W. V. Tam-
borlane. Evaluation of factors affecting CGMS calibration. Diabetes Technol Ther,
8(3):318–25, 2006. 10, 134
[45] Burdick J Kalajian A Kollman C Choy M Wilson DM Chase P; Diabetes Re-
search in Children Network. Buckingham B, Block J. Response to nocturnal
alarms using a real-time glucose sensor. Diabetes Technol Ther, 7(3):440–7, 2005.
11, 30
[46] B. Buckingham, D. M. Wilson, T. Lecher, R. Hanas, K. Kaiserman, and
F. Cameron. Duration of nocturnal hypoglycemia before seizures. Diabetes
Care, 31(11):2110–2, 2008. 11, 30
[47] A. Ceriello, M. A. Ihnat, and J. E. Thorpe. The "metabolic memory": Is more
than just tight glucose control necessary to prevent diabetic complications? J
Clin Endocrinol Metab, 94(2):410–5, 2009. 11
[48] C. Weber and O. Schnell. The assessment of glycemic variability and its im-
pact on diabetes-related complications: an overview. Diabetes Technol Ther,
11(10):623–33, 2009. 11, 51, 55, 78
[49] M. J. Sheetz and G. L. King. Molecular understanding of hyperglycemia’s ad-
verse effects for diabetic complications. JAMA, 288(20):2579–88, 2002. 11, 52
[50] D Nathan, S Genuth, J Lachin, P Cleary, O Crofford, M Davis, L Rand, and
C Siebert. The effect of intensive treatment of diabetes on the development and
progression of long-term complications in insulin-dependent diabetes mellitus.
the Diabetes Control and Complications Trial Research Group. N Engl J Med,
329(14):977–86, 1993. 12, 28
[51] I. H. de Boer, W. Sun, P. A. Cleary, J. M. Lachin, M. E. Molitch, M. W. Steffes,
and B. Zinman. Intensive diabetes therapy and glomerular filtration rate in
type 1 diabetes. N Engl J Med, 365(25):2366–76, 2011. 12
196
REFERENCES
[52] N. H. White, W. Sun, P. A. Cleary, R. P. Danis, M. D. Davis, D. P. Hainsworth,
L. D. Hubbard, J. M. Lachin, and D. M. Nathan. Prolonged effect of inten-
sive therapy on the risk of retinopathy complications in patients with type 1
diabetes mellitus: 10 years after the Diabetes Control and Complications Trial.
Arch Ophthalmol, 126(12):1707–15, 2008. 12
[53] D. M. Nathan, P. A. Cleary, J. Y. Backlund, S. M. Genuth, J. M. Lachin, T. J.
Orchard, P. Raskin, and B. Zinman. Intensive diabetes treatment and cardio-
vascular disease in patients with type 1 diabetes. N Engl J Med, 353(25):2643–53,
2005. 12
[54] J. Q. Purnell, J. E. Hokanson, S. M. Marcovina, M. W. Steffes, P. A. Cleary, and
J. D. Brunzell. Effect of excessive weight gain with intensive therapy of type
1 diabetes on lipid levels and blood pressure: results from the DCCT. JAMA,
280(2):140–6, 1998. 12, 107
[55] J. C. Pickup. Insulin-pump therapy for type 1 diabetes mellitus. N Engl J Med,
366(17):1616–24, Apr 2012. 12, 30, 161
[56] H. Anhalt and N. J. V. Bohannon. Insulin patch pumps: Their development
and future in closed-loop systems. Diabetes Technol Ther, 12:S51–S58, 2010. 13
[57] E. Cummins, P. Royle, A. Snaith, A. Greene, L. Robertson, L. McIntyre, and
N. Waugh. Clinical effectiveness and cost-effectiveness of continuous subcuta-
neous insulin infusion for diabetes: systematic review and economic evalua-
tion. Health Technol Assess, 14(11):iii–iv, xi–xvi, 1–181, 2010. 13
[58] J. C. Pickup and A. J. Sutton. Severe hypoglycaemia and glycaemic control in
type 1 diabetes: meta-analysis of multiple daily insulin injections compared
with continuous subcutaneous insulin infusion. Diabet Med, 25(7):765–74, 2008.
13
[59] M. Gimenez, M. Lara, and I. Conget. Sustained efficacy of continuous subcuta-
neous insulin infusion in type 1 diabetes subjects with recurrent non-severe and
severe hypoglycemia and hypoglycemia unawareness: A pilot study. Diabetes
Technol Ther, 12(7):517–21, 2010. 13
[60] J. C. Pickup. Are insulin pumps underutilized in type 1 diabetes? yes. Diabetes
Care, 29(6):1449–52, 2006. 13
197
REFERENCES
[61] E. Renard. Insulin pump use in Europe. Diabetes Technol Ther, 12:S29–S32, 2010.
13
[62] J. C. Pickup and P. Hammond. NICE guidance on continuous subcutaneous
insulin infusion 2008: review of the technology appraisal guidance. Diabet
Med, 26(1):1–4, 2009. 13
[63] S. A. White, J. A. Shaw, and D. E. Sutherland. Pancreas transplantation. Lancet,
373(9677):1808–17, 2009. 13
[64] A. M. J. Shapiro, C. Ricordi, B. J. Hering, H. Auchincloss, R. Lindblad, P. Robert-
son, A. Secchi, M. D. Brendel, T. Berney, D. C. Brennan, E. Cagliero, R. Alejan-
dro, E. A. Ryan, B. DiMercurio, P. Morel, K. S. Polonsky, J. A. Reems, R. G.
Bretzel, F. Bertuzzi, T. Froud, R. Kandaswamy, D. E. R. Sutherland, G. Eisen-
barth, M. Segal, J. Preiksaitis, G. S. Korbutt, F. B. Barton, L. Viviano, V. Seyfert-
Margolis, J. Bluestone, and J. R. T. Lakey. International trial of the Edmonton
protocol for islet transplantation. New Engl J Med, 355(13):1318–30, 2006. 14
[65] E. A. Ryan, B. W. Paty, P. A. Senior, D. Bigam, E. Alfadhli, N. M. Kneteman,
J. R. T. Lakey, and A. M. J. Shapir. Five-year follow-up after clinical islet trans-
plantation. Diabetes, 54(7):2060–9, 2005. 14
[66] J. E. Tooley, F. Waldron-Lynch, and K. C. Herold. New and future immunomod-
ulatory therapy in type 1 diabetes. Trends Mol Med, 2012. 14
[67] L. Heinemann. Variability of insulin absorption and insulin action. Diabetes
Technol Ther, 4(5):673–82, 2002. 14, 159
[68] G. Sindelka, L. Heinemann, M. Berger, W. Frenck, and E. Chantelau. Effect
of insulin concentration, subcutaneous fat thickness and skin temperature on
subcutaneous insulin absoprtion in healthy subjects. Diabetologia, 37(4):377–80,
1994. 14, 15
[69] Kaastrup P Stallknecht B. Clausen, TS. Effect of insulin catheter wear-time
on subcutaneous adipose tissue blood flow and insulin absorption in humans.
Diabetes Technol Ther, 11(9):575–80, 2009. 14
[70] K. L. Swan, J. D. Dziura, G. M. Steil, G. R. Voskanyan, K. A. Sikes, A. T. Steffen,
M. L. Martin, W. V. Tamborlane, and S. A. Weinzimer. Effect of age of infu-
sion site and type of rapid-acting analog on pharmacodynamic parameters of
198
REFERENCES
insulin boluses in youth with type 1 diabetes receiving insulin pump therapy.
Diabetes Care, 32(2):240–4, 2009. 14
[71] S. Steiner, M. Hompesch, R. Pohl, P. Simms, F. Flacke, T. Mohr, A. Pfutzner, and
L. Heinemann. A novel insulin formulation with a more rapid onset of action.
Diabetologia, 51(9):1602–6, 2008. 15
[72] M. Hompesch, D. B. Muchmore, L. Morrow, and D. E. Vaughn. Accelerated
insulin pharmacokinetics and improved postprandial glycemic control in pa-
tients with type 1 diabetes after coadministration of prandial insulins with
hyaluronidase. Diabetes Care, 34(3):666–8, 2011. 15
[73] I. Raz, R. Weiss, Y. Yegorchikov, G. Bitton, R. Nagar, and B. Pesach. Effect of
a local heating device on insulin and glucose pharmacokinetic profiles in an
open-label, randomized, two-period, one-way crossover study in patients with
type 1 diabetes using continuous subcutaneous insulin infusion. Clin Ther,
31(5):980–7, 2009. 15
[74] C. Weyer, A. Gottlieb, D. D. Kim, K. Lutz, S. Schwartz, M. Gutierrez, Y. Wang,
J. A. Ruggles, O. G. Kolterman, and D. G. Maggs. Pramlintide reduces post-
prandial glucose excursions when added to regular insulin or insulin lispro in
subjects with type 1 diabetes: a dose-timing study. Diabetes Care, 26(11):3074–9,
2003. 15
[75] A. Liebl, R. Hoogma, E. Renard, P. H. Geelhoed-Duijvestijn, E. Klein, J. Diglas,
L. Kessler, V. Melki, P. Diem, J. M. Brun, P. Schaepelynck-Belicar, and T. Frei. A
reduction in severe hypoglycaemia in type 1 diabetes in a randomized crossover
study of continuous intraperitoneal compared with subcutaneous insulin infu-
sion. Diabetes Obes Metab, 11(11):1001–8, 2009. 16
[76] H. Gin, E. Renard, V. Melki, S. Boivin, P. Schaepelynck-Belicar, B. Guerci, J. L.
Selam, J. M. Brun, J. P. Riveline, B. Estour, B. Catargi, and Evadiac Study Grp.
Combined improvements in implantable pump technology and insulin stability
allow safe and effective long term intraperitoneal insulin delivery in type 1
diabetic patients: the EVADIAC experience. Diabetes Metab, 29(6):602–7, 2003.
16
[77] K. Rave, E. Potocka, L. Heinemann, T. Heise, A. H. Boss, M. Marino, D. Costello,
and R. Chen. Pharmacokinetics and linear exposure of AFRESA compared
199
REFERENCES
with the subcutaneous injection of regular human insulin. Diabetes Obes Metab,
11(7):715–20, 2009. 16
[78] J. Rosenstock, R. Bergenstal, R. A. DeFronzo, I. B. Hirsch, D. Klonoff, A. H. Boss,
D. Kramer, R. Petrucci, W. Yu, B. Levy, and Grp Study. Efficacy and safety of
Technosphere inhaled insulin compared with Technosphere powder placebo in
insulin-naive type 2 diabetes suboptimally controlled with oral agents. Diabetes
Care, 31(11):2177–82, 2008. 16
[79] R. J. Pettis, L. Hirsch, C. Kapitza, L. Nosek, U. Hovelmann, H. J. Kurth, D. E.
Sutter, N. G. Harvey, and L. Heinemann. Microneedle-based intradermal ver-
sus subcutaneous administration of regular human insulin or insulin lispro:
pharmacokinetics and postprandial glycemic excursions in patients with type
1 diabetes. Diabetes Technol Ther, 13(4):443–50, 2011. 16
[80] K. Kumareswaran, M. L. Evans, and R. Hovorka. Closed-loop insulin delivery:
towards improved diabetes care. Discov Med, 13(69):159–70, 2012. 17, 21
[81] R. Hovorka, V. Canonico, L. J. Chassin, U. Haueter, M. Massi-Benedetti,
M. Orsini Federici, T. R. Pieber, H. C. Schaller, L. Schaupp, T. Vering, and
M. E. Wilinska. Nonlinear model predictive control of glucose concentration in
subjects with type 1 diabetes. Physiol Meas, 25(4):905–20, 2004. 18, 34, 51
[82] G. M. Steil, A. E. Panteleon, and K. Rebrin. Closed-loop insulin delivery-the
path to physiological glucose control. Adv Drug Deliv Rev, 56(2):125–44, 2004.
18
[83] J. R. Castle, J. M. Engle, J. E. L. Youssef, R. G. Massoud, K. C. J. Yuen, R. Kagan,
and W. K. Ward. Novel use of glucagon in a closed-loop system for prevention
of hypoglycemia in type 1 diabetes. Diabetes Care, 33(6):1282–7, 2010. 18, 22, 25,
153, 155
[84] J. El Youssef, J. R. Castle, D. L. Branigan, R. G. Massoud, M. E. Breen, P. G.
Jacobs, B. W. Bequette, and W. K. Ward. A controlled study of the effectiveness
of an adaptive closed-loop algorithm to minimize corticosteroid-induced stress
hyperglycemia in type 1 diabetes. J Diabetes Sci Technol, 5(6):1312–26, 2011. 18,
22, 153
[85] G. M. Steil, C. C. Palerm, N. Kurtz, G. Voskanyan, A. Roy, S. Paz, and F. R.
200
REFERENCES
Kandeel. The effect of insulin feedback on closed loop glucose control. J Clin
Endocrinol Metab, 96(5):1402–8, 2011. 18, 22, 24, 153
[86] AH Kadish. Automation control of blood sugar.I. Servomechanism for glucose
monitoring and control. Am J Med Electron, 3(2):82–6, 1964. 19
[87] A. M. Albisser, B. S. Leibel, T. G. Ewart, Davidova.Z, C. K. Botz, and W. Zingg.
Artificial endocrine pancreas. Diabetes, 23(5):389–96, 1974. 19
[88] E. F. Pfeiffer, C. Thum, and A. H. Clemens. Artificial beta cell - continuous
control of blood-sugar by external regulation of insulin infusion. Horm Metab
Res, 6(5):339–42, 1974. 19
[89] A. H. Clemens, P. H. Chang, and R. W. Myers. The development of Biostator,
a glucose controlled insulin infusion system (GCIIS). Horm Metab Res, Suppl
7:23–33, 1977. 19
[90] R. Hovorka, L. J. Chassin, M. E. Wilinska, V. Canonico, J. A. Akwi, M. O. Fed-
erici, M. Massi-Benedetti, I. Hutzli, C. Zaugg, H. Kaufmann, M. Both, T. Vering,
H. C. Schaller, L. Schaupp, M. Bodenlenz, and T. R. Pieber. Closing the loop:
the ADICOL experience. Diabetes Technol Ther, 6(3):307–18, 2004. 19
[91] G. M. Steil, K. Rebrin, C. Darwin, F. Hariri, and M. F. Saad. Feasibility of
automating insulin delivery for the treatment of type 1 diabetes. Diabetes,
55(12):3344–50, 2006. 19, 22, 24
[92] P Galley, R Wagner, H Buck, S Weinert, S Bousamra, J Long, A Thukral,
D Kenyon, G Freckmann, N Jendrike, C Haug, and A Abicht. Use of subcuta-
neous continuous glucose measurements to drive real-time algorithm-directed
insulin infusion recommendations. Diabetes Technol Ther, 6:245–6, 2004. 19
[93] R. Hovorka. Closed-loop insulin delivery: from bench to clinical practice. Nat
Rev Endocrinol, 7(7):385–95, 2011. 20, 56, 159
[94] NICE. Management of diabetes from preconception to the postnatal period:
summary of NICE guidance. BMJ, 336(7646):714–7, 2008. 20, 86, 93, 106, 116,
121, 128
[95] American Diabetes Association. Postprandial blood glucose. Diabetes Care,
24(4):775–8, 2001. 20, 55
201
REFERENCES
[96] D. Rodbard. Interpretation of continuous glucose monitoring data: glycemic
variability and quality of glycemic control. Diabetes Technol Ther, 11 Suppl
1:S55–67, 2009. 20
[97] BP Kovatchev, DJ Cox, LA Gonder-Frederick, D Young-Hyman, D Schlundt,
and W Clarke. Assessment of risk for severe hypoglycemia among adults with
IDDM: validation of the low blood glucose index. Diabetes Care, 21(11):1870–5,
1998. 20, 36, 121
[98] D. B. Keenan, B. Grosman, H. W. Clark, A. Roy, S. A. Weinzimer, R. V. Shah,
and J. J. Mastrototaro. Continuous glucose monitoring considerations for the
development of a closed-loop artificial pancreas system. J Diabetes Sci Technol,
5(6):1327–36, 2011. 20
[99] P. Choudhary, J. Shin, Y. Wang, M. L. Evans, P. J. Hammond, D. Kerr, J. A. Shaw,
J. C. Pickup, and S. A. Amiel. Insulin pump therapy with automated insulin
suspension in response to hypoglycemia: Reduction in nocturnal hypoglycemia
in those at greatest risk. Diabetes Care, 34(9):2023–5, 2011. 21, 22
[100] T. Danne, O. Kordonouri, M. Holder, H. Haberland, S. Golembowski, K. Re-
mus, S. Blasig, T. Wadien, S. Zierow, R. Hartmann, and A. Thomas. Prevention
of hypoglycemia by using low glucose suspend function in sensor-augmented
pump therapy. Diabetes Technol Ther, 13(11):1129–34, 2011. 21, 22
[101] B. Buckingham, H. P. Chase, E. Dassau, E. Cobry, P. Clinton, V. Gage,
K. Caswell, J. Wilkinson, F. Cameron, H. Lee, B. W. Bequette, and F. J. Doyle.
Prevention of nocturnal hypoglycemia using predictive alarm algorithms and
insulin pump suspension. Diabetes Care, 33(5):1013–7, 2010. 21, 22, 23, 153
[102] B. Buckingham, E. Cobry, P. Clinton, V. Gage, K. Caswell, E. Kunselman,
F. Cameron, and H. P. Chase. Preventing hypoglycemia using predictive alarm
algorithms and insulin pump suspension. Diabetes Technol Ther, 11(2):93–7,
2009. 21, 22, 23
[103] R. Hovorka, K. Kumareswaran, J. Harris, J. M. Allen, D. Elleri, D. Xing, C. Koll-
man, M. Nodale, H. R. Murphy, D. B. Dunger, S. A. Amiel, S. R. Heller, M. E.
Wilinska, and M. L. Evans. Overnight closed loop insulin delivery (artificial
pancreas) in adults with type 1 diabetes: crossover randomised controlled stud-
ies. BMJ, 342:d1855, 2011. 22
202
REFERENCES
[104] R. Hovorka, J. M. Allen, D. Elleri, L. J. Chassin, J. Harris, D. Y. Xing, C. Kollman,
T. Hovorka, A. M. F. Larsen, M. Nodale, A. De Palma, M. E. Wilinska, C. L.
Acerini, and D. B. Dunger. Manual closed-loop insulin delivery in children
and adolescents with type 1 diabetes: a phase 2 randomised crossover trial.
Lancet, 375(9716):743–51, 2010. 22, 23, 30, 36, 62, 110
[105] B. Kovatchev, C. Cobelli, E. Renard, S. Anderson, M. Breton, S. Patek, W. Clarke,
D. Bruttomesso, A. Maran, S. Costa, A. Avogaro, C. Dalla Man, A. Facchinetti,
L. Magni, G. De Nicolao, J. Place, and A. Farret. Multinational study of subcu-
taneous model-predictive closed-loop control in type 1 diabetes mellitus: sum-
mary of the results. J Diabetes Sci Technol, 4(6):1374–81, 2010. 22, 23, 153, 154,
155
[106] D. Elleri, J. M. Allen, M. Nodale, M. E. Wilinska, J. S. Mangat, A. M. Larsen,
C. L. Acerini, D. B. Dunger, and R. Hovorka. Automated overnight closed-loop
glucose control in young children with type 1 diabetes. Diabetes Technol Ther,
13(4):419–24, 2011. 22, 23, 154, 156, 161
[107] D Elleri, JM Allen, K Kumareswaran, L Leelarathna, M Nodale, K Caldwell,
H Murphy, ME Wilinska, CL Acerini, DB Dunger, and R Hovorka. Day-and-
night closed-loop glucose control in adolescents with type 1 diabetes. Diabetes,
60(Suppl 1):A41–A41, 2011. 22, 24
[108] H. R. Murphy, D. Elleri, J. M. Allen, J. Harris, D. Simmons, G. Rayman, R. Tem-
ple, D. B. Dunger, A. Haidar, M. Nodale, M. E. Wilinska, and R. Hovorka.
Closed-loop insulin delivery during pregnancy complicated by type 1 diabetes.
Diabetes Care, 34(2):406–11, 2011. 22, 24, 88, 89, 93, 105, 107, 108, 135, 144
[109] H. R. Murphy, K. Kumareswaran, D. Elleri, J. M. Allen, K. Caldwell, M. Bia-
gioni, D. Simmons, D. B. Dunger, M. Nodale, M. E. Wilinska, S. A. Amiel, and
R. Hovorka. Safety and efficacy of 24-h closed-loop insulin delivery in well-
controlled pregnant women with type 1 diabetes: a randomized crossover case
series. Diabetes Care, 34(12):2527–9, 2011. 22
[110] E. Atlas, R. Nimri, S. Miller, E. A. Grunberg, and M. Phillip. MD-logic artificial
pancreas system: a pilot study in adults with type 1 diabetes. Diabetes Care,
33(5):1072–6, 2010. 22, 25
[111] S. A. Weinzimer, G. M. Steil, K. L. Swan, J. Dziura, N. Kurtz, and W. V. Tam-
borlane. Fully automated closed-loop insulin delivery versus semiautomated
203
REFERENCES
hybrid control in pediatric patients with type 1 diabetes using an artificial pan-
creas. Diabetes Care, 31(5):934–9, 2008. 22, 24, 153
[112] F. H. El-Khatib, S. J. Russell, D. M. Nathan, R. G. Sutherlin, and E. R. Damiano.
A bihormonal closed-loop artificial pancreas for type 1 diabetes. Sci Transl Med,
2(27):27ra27, 2010. 22, 25, 153
[113] E. Renard, J. Place, M. Cantwell, H. Chevassus, and C. C. Palerm. Closed-
loop insulin delivery using a subcutaneous glucose sensor and intraperitoneal
insulin delivery feasibility study testing a new model for the artificial pancreas.
Diabetes Care, 33(1):121–7, 2010. 22, 26
[114] P. Agrawal, J. B. Welsh, B. Kannard, S. Askari, Q. Yang, and F. R. Kaufman.
Usage and effectiveness of the low glucose suspend feature of the Medtronic
Paradigm Veo insulin pump. J Diabetes Sci Technol, 5(5):1137–41, 2011. 21
[115] S. Garg, R. L. Brazg, T. S. Bailey, B. A. Buckingham, R. H. Slover, D. C. Klonoff,
J. Shin, J. B. Welsh, and F. R. Kaufman. Reduction in duration of hypoglycemia
by automatic suspension of insulin delivery: The in-clinic ASPIRE study. Dia-
betes Technol Ther, 14(3):205–9, 2012. 21
[116] R. P. Radermecker and A. J. Scheen. Continuous subcutaneous insulin infusion
with short-acting insulin analogues or human regular insulin: efficacy, safety,
quality of life, and cost-effectiveness. Diabetes Metab Res Rev, 20(3):178–88, 2004.
23
[117] D. Elleri, J. M. Allen, M. Nodale, M. E. Wilinska, C. L. Acerini, D. B. Dunger,
and R. Hovorka. Suspended insulin infusion during overnight closed-loop glu-
cose control in children and adolescents with type 1 diabetes. Diabet Med,
27(4):480–4, 2010. 23
[118] E. Cengiz, K. L. Swan, W. V. Tamborlane, G. M. Steil, A. T. Steffen, and S. A.
Weinzimer. Is an automatic pump suspension feature safe for children with
type 1 diabetes? An exploratory analysis with a closed-loop system. Diabetes
Technol Ther, 11(4):207–10, 2009. 23
[119] D. M. Nathan and others. The DCCT Research Group. Epidemiology of severe
hypoglycemia in the Diabetes Control and Complications Trial. Am J Med,
90(4):450–9, 1991. 23, 28, 29, 30, 51, 85
204
REFERENCES
[120] K. Kumareswaran, D. Elleri, J. M. Allen, J. Harris, D. Xing, C. Kollman,
M. Nodale, H. R. Murphy, S. A. Amiel, S. R. Heller, M. E. Wilinska, C. L. Ac-
erini, M. L. Evans, D. B. Dunger, and R. Hovorka. Meta-analysis of overnight
closed-loop randomized studies in children and adults with type 1 diabetes:
the Cambridge cohort. J Diabetes Sci Technol, 5(6):1352–62, 2011. 23, 151
[121] SA Weinzimer, JL Sherr, E Cengiz, G Kim, L Carria, and W Tamborlane. Effect
of adjuvant injected pramlintide on closed-loop automated insulin delivery.
Diabetes, 60(Suppl 1):A253–A253, 2011. 24
[122] W. K. Ward, J. R. Castle, and J. El Youssef. Safe glycemic management during
closed-loop treatment of type 1 diabetes: the role of glucagon, use of multi-
ple sensors, and compensation for stress hyperglycemia. J Diabetes Sci Technol,
5(6):1373–80, 2011. 25
[123] E. Renard, G. Costalat, H. Chevassus, and J. Bringer. Closed loop insulin de-
livery using implanted insulin pumps and sensors in type 1 diabetic patients.
Diabetes Res Clin Pract, 74:S173–7, 2006. 26
[124] M. E. Wilinska, L. J. Chassin, C. L. Acerini, J. M. Allen, D. B. Dunger, and
R. Hovorka. Simulation environment to evaluate closed-loop insulin delivery
systems in type 1 diabetes. J Diabetes Sci Technol, 4(1):132–44, 2010. 26
[125] Man CD Cobelli C. Kovatchev BP, Breton M. In silico preclinical trials: a proof
of concept in closed-loop control of type 1 diabetes. J Diabetes Sci Technol,
3(1):43–55, 2009. 26
[126] D. Wild, R. von Maltzahn, E. Brohan, T. Christensen, P. Clauson, and L. Gonder-
Frederick. A critical review of the literature on fear of hypoglycemia in di-
abetes: Implications for diabetes management and patient education. Patient
Educ Couns, 68(1):10–5, 2007. 28, 132
[127] R. Nixon and J. C. Pickup. Fear of hypoglycemia in type 1 diabetes managed by
continuous subcutaneous insulin infusion: is it associated with poor glycemic
control? Diabetes Technol Ther, 13(2):93–8, 2011. 28
[128] Defining and reporting hypoglycemia in diabetes: a report from the American
Diabetes Association workgroup on hypoglycemia. Diabetes Care, 28(5):1245–9,
2005. 28
205
REFERENCES
[129] K. M. MacLeod, D. A. Hepburn, and B. M. Frier. Frequency and morbid-
ity of severe hypoglycaemia in insulin-treated diabetic patients. Diabet Med,
10(3):238–45, 1993. 28, 29
[130] P. E. Cryer, S. N. Davis, and H. Shamoon. Hypoglycemia in diabetes. Diabetes
Care, 26(6):1902–12, 2003. 29, 52
[131] P. E. Cryer. Current concepts: Diverse causes of hypoglycemia-associated auto-
nomic failure in diabetes. New Engl J Med, 350(22):2272–9, 2004. 29
[132] T. W. Jones, P. Porter, R. S. Sherwin, E. A. Davis, P. O’Leary, F. Frazer, G. Byrne,
S. Stick, and W. V. Tamborlane. Decreased epinephrine responses to hypo-
glycemia during sleep. N Engl J Med, 338(23):1657–62, 1998. 29
[133] S. Banarer and P. E. Cryer. Sleep-related hypoglycemia-associated autonomic
failure in type 1 diabetes: reduced awakening from sleep during hypoglycemia.
Diabetes, 52(5):1195–203, 2003. 29
[134] T. T. Ly, T. W. Jones, A. Griffiths, J. Dart, E. A. Davis, S. Stick, and A. Wil-
son. Hypoglycemia does not change the threshold for arousal from sleep in
adolescents with type 1 diabetes. Diabetes Technol Ther, 14(2):101–4, 2012. 29
[135] Juvenile Diabetes Research Foundation CGM Study Group. Prolonged noctur-
nal hypoglycemia is common during 12 months of continuous glucose moni-
toring in children and adults with type 1 diabetes. Diabetes Care, 33(5):1004–8,
2010. 29
[136] G. Gill, A. Woodward, I. Casson, and P. Weston. Cardiac arrhythmia and noc-
turnal hypoglycaemia in type 1 diabetes-the ’dead in bed’ syndrome revisited.
Diabetologia, 52(1):42–45, 2009. 29
[137] I. Campbell. Dead in bed syndrome: a new manifestation of nocturnal hypo-
glycaemia? Diabet Med, 8(1):3–4, 1991. 29
[138] A. M. Secrest, D. J. Becker, S. F. Kelsey, R. E. Laporte, and T. J. Orchard. Charac-
terizing sudden death and dead-in-bed syndrome in type 1 diabetes: analysis
from two childhood-onset type 1 diabetes registries. Diabet Med, 28(3):293–300,
2011. 29
[139] P. King, M. F. Kong, H. Parkin, I. A. Macdonald, and R. B. Tattersall. Well-
being, cerebral function, and physical fatigue after nocturnal hypoglycemia in
IDDM. Diabetes Care, 21(3):341–5, 1998. 30
206
REFERENCES
[140] B. O. Asvold, T. Sand, K. Hestad, and M. R. Bjorgaas. Cognitive function in
type 1 diabetic adults with early exposure to severe hypoglycemia: a 16-year
follow-up study. Diabetes Care, 33(9):1945–7, 2010. 30
[141] S Genuth and DCCT Research Group. Long-term effect of diabetes and its
treatment on cognitive function. New Engl J Med, 356(18):1842–52, 2007. 30
[142] M. F. Carroll and D. S. Schade. The dawn phenomenon revisited: implications
for diabetes therapy. Endocr Pract, 11(1):55–64, 2005. 51, 79
[143] A. Vella, P. Shah, A. Basu, and R. A. Rizza. Prandial insulin and the systemic
appearance of meal-derived glucose in people with type 1 diabetes. Diabetes
Care, 31(11):2230–1, 2008. 55
[144] M. S. Rendell and L. Jovanovic. Targeting postprandial hyperglycemia.
Metabolism, 55(9):1263–81, 2006. 55, 108
[145] Training in flexible, intensive insulin management to enable dietary freedom
in people with type 1 diabetes: dose adjustment for normal eating (DAFNE)
randomised controlled trial. BMJ, 325(7367):746, 2002. 55
[146] D. J. Jenkins, T. M. Wolever, R. H. Taylor, H. Barker, H. Fielden, J. M. Baldwin,
A. C. Bowling, H. C. Newman, A. L. Jenkins, and D. V. Goff. Glycemic index
of foods: a physiological basis for carbohydrate exchange. Am J Clin Nutr,
34(3):362–6, 1981. 55
[147] M. Parillo, G. Annuzzi, A. A. Rivellese, L. Bozzetto, R. Alessandrini, G. Ric-
cardi, and B. Capaldo. Effects of meals with different glycaemic index on post-
prandial blood glucose response in patients with type 1 diabetes treated with
continuous subcutaneous insulin infusion. Diabet Med, 28(2):227–9, 2011. 56
[148] J. Brand-Miller, S. Hayne, P. Petocz, and S. Colagiuri. Low-glycemic index diets
in the management of diabetes: a meta-analysis of randomized controlled trials.
Diabetes Care, 26(8):2261–7, 2003. 56
[149] A. L. Olinder, A. Kernell, and B. Smide. Missed bolus doses: devastating for
metabolic control in CSII-treated adolescents with type 1 diabetes. Pediatr Dia-
betes, 10(2):142–8, 2009. 56
[150] Y. M. Luijf, A. C. van Bon, J. B. Hoekstra, and J. H. Devries. Premeal injec-
tion of rapid-acting insulin reduces postprandial glycemic excursions in type 1
diabetes. Diabetes Care, 33(10):2152–5, 2010. 56, 78
207
REFERENCES
[151] E. Cobry, K. McFann, L. Messer, V. Gage, B. VanderWel, L. Horton, and H. P.
Chase. Timing of meal insulin boluses to achieve optimal postprandial glycemic
control in patients with type 1 diabetes. Diabetes Technol Ther, 12(3):173–7, 2010.
56, 78
[152] J. C. Brand-Miller, K. Fatema, C. Middlemiss, M. Bare, V. Liu, F. Atkinson, and
P. Petocz. Effect of alcoholic beverages on postprandial glycemia and insuline-
mia in lean, young, healthy adults. Am J Clin Nutr, 85(6):1545–51, 2007. 56
[153] L. L. Koppes, J. M. Dekker, H. F. Hendriks, L. M. Bouter, and R. J. Heine. Mod-
erate alcohol consumption lowers the risk of type 2 diabetes: a meta-analysis
of prospective observational studies. Diabetes Care, 28(3):719–25, 2005. 56
[154] J. W. Beulens, J. S. Kruidhof, D. E. Grobbee, N. Chaturvedi, J. H. Fuller, and S. S.
Soedamah-Muthu. Alcohol consumption and risk of microvascular complica-
tions in type 1 diabetes patients: the EURODIAB Prospective Complications
Study. Diabetologia, 51(9):1631–8, 2008. 56
[155] D. R. Meeking and D. A. Cavan. Alcohol ingestion and glycaemic control in
patients with insulin-dependent diabetes mellitus. Diabet Med, 14(4):279–83,
1997. 56, 58
[156] T. Richardson, M. Weiss, P. Thomas, and D. Kerr. Day after the night before:
influence of evening alcohol on risk of hypoglycemia in patients with type 1
diabetes. Diabetes Care, 28(7):1801–2, 2005. 57
[157] D. Kerr, E. Cheyne, P. Thomas, and R. Sherwin. Influence of acute alcohol
ingestion on the hormonal responses to modest hypoglycaemia in patients with
type 1 diabetes. Diabet Med, 24(3):312–6, 2007. 57
[158] B. C. Turner, E. Jenkins, D. Kerr, R. S. Sherwin, and D. A. Cavan. The effect
of evening alcohol consumption on next-morning glucose control in type 1
diabetes. Diabetes Care, 24(11):1888–93, 2001. 57, 60, 78
[159] E. H. Cheyne, R. S. Sherwin, M. J. Lunt, D. A. Cavan, P. W. Thomas, and D. Kerr.
Influence of alcohol on cognitive performance during mild hypoglycaemia; im-
plications for type 1 diabetes. Diabet Med, 21(3):230–7, 2004. 57
[160] D. Kerr, I. A. Macdonald, S. R. Heller, and R. B. Tattersall. Alcohol causes hypo-
glycemic unawareness in healthy volunteers and patients with type 1 (insulin-
dependent) diabetes. Diabetologia, 33(4):216–221, 1990. 57
208
REFERENCES
[161] G. T. Passananti, C. A. Wolff, and E. S. Vesell. Reproducibility of individual
rates of ethanol metabolism in fasting subjects. Clin Pharmacol Ther, 47(3):389–
96, 1990. 58, 79
[162] A. G. Fraser, S. B. Rosalki, G. D. Gamble, and R. E. Pounder. Inter-individual
and intra-individual variability of ethanol concentration-time profiles: compar-
sion of ethanol ingestion before or after an evening meal. Br J Clin Pharmacol,
40(4):387–92, 1995. 58, 78, 79
[163] N. Ramchandani, J. M. Cantey-Kiser, C. A. Alter, S. J. Brink, S. D. Yeager, W. V.
Tamborlane, and S. R. Chipkin. Self-reported factors that affect glycemic control
in college students with type 1 diabetes. Diabetes Educ, 26(4):656–66, 2000. 58
[164] USDA. USDA National Nutrient Database for Standard Reference. Technical
Report 7 Dec, 2011. 72
[165] S. Kalhan, K. Rossi, L. Gruca, E. Burkett, and A. O’Brien. Glucose turnover and
gluconeogenesis in human pregnancy. J Clin Invest, 100(7):1775–81, 1997. 81
[166] H. R. Murphy, J. M. Roland, T. C. Skinner, D. Simmons, E. Gurnell, N. J. Mor-
rish, S. C. Soo, S. Kelly, B. Lim, J. Randall, S. Thompsett, and R. C. Temple. Ef-
fectiveness of a regional prepregnancy care program in women with type 1 and
type 2 diabetes: benefits beyond glycemic control. Diabetes Care, 33(12):2514–20,
2010. 81
[167] I.M. Evers, H.W. De Valk, and G.H.A. Visser. Risk of complications of preg-
nancy in women with type 1 diabetes: nationwide prospective study in the
Netherlands. BMJ, 328(7445):915, 2004. 81, 83
[168] R. C. Temple, V. J. Aldridge, and H. R. Murphy. Prepregnancy care and preg-
nancy outcomes in women with type 1 diabetes. Diabetes Care, 29(8):1744–9,
2006. 81
[169] M. Persson, M. Norman, and U. Hanson. Obstetric and perinatal outcomes in
type 1 diabetic pregnancies: A large, population-based study. Diabetes Care,
32(11):2005–9, 2009. 81, 82
[170] M. C. Macintosh, K. M. Fleming, J. A. Bailey, P. Doyle, J. Modder, D. Acolet,
S. Golightly, and A. Miller. Perinatal mortality and congenital anomalies in ba-
bies of women with type 1 or type 2 diabetes in England, Wales, and Northern
Ireland: population based study. BMJ, 333(7560):177, 2006. 81, 82
209
REFERENCES
[171] M. U. Baumann, S. Deborde, and N. P. Illsley. Placental glucose transfer and
fetal growth. Endocrine, 19(1):13–22, 2002. 81
[172] A. Kerssen, H. W. de Valk, and G. H. Visser. Increased second trimester mater-
nal glucose levels are related to extremely large-for-gestational-age infants in
women with type 1 diabetes. Diabetes Care, 30(5):1069–74, 2007. 82
[173] L. Herranz, L. F. Pallardo, N. Hillman, P. Martin-Vaquero, A. Villarroel, and
A. Fernandez. Maternal third trimester hyperglycaemic excursions predict
large-for-gestational-age infants in type 1 diabetic pregnancy. Diabetes Res Clin
Pract, 75(1):42–6, 2007. 82
[174] M. C. Jolly, N. J. Sebire, J. P. Harris, L. Regan, and S. Robinson. Risk factors for
macrosomia and its clinical consequences: a study of 350,311 pregnancies. Eur
J Obstet Gynecol Reprod Biol, 111(1):9–14, 2003. 82
[175] Pregnancy outcomes in the Diabetes Control and Complications Trial. Am J
Obstet Gynecol, 174(4):1343–53, 1996. 82, 86
[176] L. Ringholm, U. Pedersen-Bjergaard, B. Thorsteinsson, P. Damm, and E. R.
Mathiesen. Hypoglycaemia during pregnancy in women with type 1 diabetes.
Diabet Med, 29(5):558–66, 2012. 82, 83, 114, 161
[177] L. R. Nielsen, U. Pedersen-Bjergaard, B. Thorsteinsson, M. Johansen, P. Damm,
and E. R. Mathiesen. Hypoglycemia in pregnant women with type 1 diabetes:
predictors and role of metabolic control. Diabetes Care, 31(1):9–14, 2008. 82, 83,
128
[178] B. M. Rosenn, M. Miodovnik, J. C. Khoury, and T. A. Siddiqi. Counterregula-
tory hormonal responses to hypoglycemia during pregnancy. Obstet Gynecol,
87(4):568–74, 1996. 83
[179] P. J. Leinonen, V. K. Hiilesmaa, R. J. Kaaja, and K. A. Teramo. Maternal mortal-
ity in type 1 diabetes. Diabetes Care, 24(8):1501–2, 2001. 83
[180] I. W. Smoak and T. W. Sadler. Embryopathic effects of short-term exposure to
hypoglycemia in mouse embryos in vitro. Am J Obstet Gynecol, 163(2):619–24,
1990. 83
[181] T. A. Buchanan, J. K. Schemmer, and N. Freinkel. Embryotoxic effects of brief
maternal insulin-hypoglycemia during organogenesis in the rat. J Clin Invest,
78(3):643–9, 1986. 83
210
REFERENCES
[182] E. W. ter Braak, I. M. Evers, D. Willem Erkelens, and G. H. Visser. Maternal
hypoglycemia during pregnancy in type 1 diabetes: maternal and fetal conse-
quences. Diabetes Metab Res Rev, 18(2):96–105, 2002. 83
[183] A. Garcia-Patterson, R. Corcoy, M. Balsells, O. Altirriba, J. M. Adelantado,
L. Cabero, and A. de Leiva. In pregnancies with gestational diabetes mellitus
and intensive therapy, perinatal outcome is worse in small-for-gestational-age
newborns. Am J Obstet Gynecol, 179(2):481–5, 1998. 83
[184] E. Stenninger, R. Flink, B. Eriksson, and C. Sahlen. Long-term neurological
dysfunction and neonatal hypoglycaemia after diabetic pregnancy. Arch Dis
Child Fetal Neonatal Ed, 79(3):F174–9, 1998. 83
[185] A. Thorell, M. F. Hirshman, J. Nygren, L. Jorfeldt, J. F. Wojtaszewski, S. D.
Dufresne, E. S. Horton, O. Ljungqvist, and L. J. Goodyear. Exercise and insulin
cause GLUT-4 translocation in human skeletal muscle. Am J Physiol, 277(4 Pt
1):E733–41, 1999. 84
[186] P. E. Cryer. Exercise-related hypoglycemia-associated autonomic failure in dia-
betes. Diabetes, 58(9):1951–2, 2009. 84, 85
[187] A. C. Ertl and S. N. Davis. Evidence for a vicious cycle of exercise and hypo-
glycemia in type 1 diabetes mellitus. Diabetes Metab Res Rev, 20(2):124–30, 2004.
84, 110, 129, 132
[188] E. B. Marliss and M. Vranic. Intense exercise has unique effects on both insulin
release and its roles in glucoregulation: implications for diabetes. Diabetes, 51
Suppl 1:S271–83, 2002. 84
[189] R. J. Sigal, C. Purdon, S. J. Fisher, J. B. Halter, M. Vranic, and E. B. Marliss.
Hyperinsulinemia prevents prolonged hyperglycemia after intense exercise in
insulin-dependent diabetic subjects. J Clin Endocrinol Metab, 79(4):1049–57, 1994.
84
[190] K. J. Guelfi, T. W. Jones, and P. A. Fournier. The decline in blood glucose
levels is less with intermittent high-intensity compared with moderate exercise
in individuals with type 1 diabetes. Diabetes Care, 28(6):1289–94, 2005. 85, 129
[191] V. A. Bussau, L. D. Ferreira, T. W. Jones, and P. A. Fournier. The 10-s maximal
sprint: a novel approach to counter an exercise-mediated fall in glycemia in
individuals with type 1 diabetes. Diabetes Care, 29(3):601–6, 2006. 85
211
REFERENCES
[192] I. W. Gallen, C. Hume, and A. Lumb. Fuelling the athlete with type 1 diabetes.
Diabetes Obes Metab, 13(2):130–6, 2011. 85, 86
[193] J. J. Ruegemer, R. W. Squires, H. M. Marsh, M. W. Haymond, P. E. Cryer, R. A.
Rizza, and J. M. Miles. Differences between prebreakfast and late afternoon
glycemic responses to exercise in IDDM patients. Diabetes Care, 13(2):104–10,
1990. 85
[194] S. K. McMahon, L. D. Ferreira, N. Ratnam, R. J. Davey, L. M. Youngs, E. A.
Davis, P. A. Fournier, and T. W. Jones. Glucose requirements to maintain eug-
lycemia after moderate-intensity afternoon exercise in adolescents with type 1
diabetes are increased in a biphasic manner. J Clin Endocrinol Metab, 92(3):963–8,
2007. 85, 110, 132
[195] M. J. Tansey, E. Tsalikian, R. W. Beck, N. Mauras, B. A. Buckingham, S. A.
Weinzimer, K. F. Janz, C. Kollman, D. Xing, K. J. Ruedy, M. W. Steffes, T. M.
Borland, R. J. Singh, and W. V. Tamborlane. The effects of aerobic exercise on
glucose and counterregulatory hormone concentrations in children with type 1
diabetes. Diabetes Care, 29(1):20–5, 2006. 85, 110
[196] P. Galassetti, D. Tate, R. A. Neill, S. Morrey, D. H. Wasserman, and S. N. Davis.
Effect of antecedent hypoglycemia on counterregulatory responses to subse-
quent euglycemic exercise in type 1 diabetes. Diabetes, 52(7):1761–9, 2003. 85,
110
[197] D. A. Sandoval, D. L. Guy, M. A. Richardson, A. C. Ertl, and S. N. Davis. Effects
of low and moderate antecedent exercise on counterregulatory responses to
subsequent hypoglycemia in type 1 diabetes. Diabetes, 53(7):1798–806, 2004. 85,
110
[198] E. J. Stevenson, C. Williams, L. E. Mash, B. Phillips, and M. L. Nute. Influence
of high-carbohydrate mixed meals with different glycemic indexes on substrate
utilization during subsequent exercise in women. Am J Clin Nutr, 84(2):354–60,
2006. 86
[199] R. Rabasa-Lhoret, J. Bourque, F. Ducros, and J. L. Chiasson. Guidelines for
premeal insulin dose reduction for postprandial exercise of different intensities
and durations in type 1 diabetic subjects treated intensively with a basal-bolus
insulin regimen (ultralente-lispro). Diabetes Care, 24(4):625–30, 2001. 86
212
REFERENCES
[200] E. Tsalikian, C. Kollman, W. B. Tamborlane, R. W. Beck, R. Fiallo-Scharer, L. Fox,
K. F. Janz, K. J. Ruedy, D. Wilson, D. Xing, and S. A. Weinzimer. Prevention of
hypoglycemia during exercise in children with type 1 diabetes by suspending
basal insulin. Diabetes Care, 29(10):2200–4, 2006. 86
[201] C. E. Taplin, E. Cobry, L. Messer, K. McFann, H. P. Chase, and R. Fiallo-Scharer.
Preventing post-exercise nocturnal hypoglycemia in children with type 1 dia-
betes. J Pediatr, 157(5):784–8 e1, 2010. 86
[202] J. H. Koeslag. Post-exercise ketosis and the hormone response to exercise: a
review. Med Sci Sports Exerc, 14(5):327–34, 1982. 86
[203] R. M. Bracken, D. J. West, J. W. Stephens, L. P. Kilduff, S. Luzio, and S. C. Bain.
Impact of pre-exercise rapid-acting insulin reductions on ketogenesis following
running in type 1 diabetes. Diabet Med, 28(2):218–22, 2011. 86
[204] Z. Jankovec, M. Krcma, J. Gruberova, J. Komorousova, J. Tomesova, M. Zourek,
and Z. Rusavy. Influence of physical activity on metabolic state within a 3-h
interruption of continuous subcutaneous insulin infusion in patients with type
1 diabetes. Diabetes Technol Ther, 13(12):1234–9, 2011. 86
[205] J. C. Thow, A. B. Johnson, M. Antsiferov, and P. D. Home. Exercise augments
the absorption of isophane (NPH) insulin. Diabet Med, 6(4):342–5, 1989. 86
[206] E. Ferrannini, B. Linde, and O. Faber. Effect of bicycle exercise on insulin
absorption and subcutaneous blood flow in the normal subject. Clin Physiol,
2(1):59–70, 1982. 86
[207] S. Schmidt, D. A. Finan, A. K. Duun-Henriksen, J. B. Jorgensen, H. Madsen,
H. Bengtsson, J. J. Holst, S. Madsbad, and K. Norgaard. Effects of everyday life
events on glucose, insulin, and glucagon dynamics in continuous subcutaneous
insulin infusion-treated type 1 diabetes: Collection of clinical data for glucose
modeling. Diabetes Technol Ther, 14(3):210–7, Mar 2011. 86, 133, 144, 147
[208] D. M. Jensen, L. Korsholm, P. Ovesen, H. Beck-Nielsen, L. Moelsted-Pedersen,
J. G. Westergaard, M. Moeller, and P. Damm. Peri-conceptional A1c and risk
of serious adverse pregnancy outcome in 933 women with type 1 diabetes.
Diabetes Care, 32(6):1046–8, 2009. 87
[209] S. Lurie and Y. Mamet. Red blood cell survival and kinetics during pregnancy.
Eur J Obstet Gynecol Reprod Biol, 93(2):185–92, 2000. 87
213
REFERENCES
[210] I. F. Casson. Pregnancy in women with diabetes–after the CEMACH report,
what now? Diabet Med, 23(5):481–4, 2006. 87
[211] A. Garcia-Patterson, I. Gich, S. B. Amini, P. M. Catalano, A. de Leiva, and
R. Corcoy. Insulin requirements throughout pregnancy in women with type 1
diabetes mellitus: three changes of direction. Diabetologia, 53(3):446–51, 2010.
87
[212] A. D. Wollitzer, H. Zisser, and L. Jovanovic. Insulin pumps and their use in
pregnancy. Diabetes Technol Ther, 12 Suppl 1:S33–6, 2010. 87
[213] A. Mukhopadhyay, T. Farrell, R. B. Fraser, and B. Ola. Continuous subcuta-
neous insulin infusion vs intensive conventional insulin therapy in pregnant
diabetic women: a systematic review and metaanalysis of randomized, con-
trolled trials. Am J Obstet Gynecol, 197(5):447–56, 2007. 87
[214] D. Farrar, D. J. Tuffnell, and J. West. Continuous subcutaneous insulin infusion
versus multiple daily injections of insulin for pregnant women with diabetes.
Cochrane Database Syst Rev, (3):CD005542, 2007. 87
[215] H. R. Murphy, G. Rayman, K. Lewis, S. Kelly, B. Johal, K. Duffield, D. Fowler,
P. J. Campbell, and R. C. Temple. Effectiveness of continuous glucose mon-
itoring in pregnant women with diabetes: randomised clinical trial. BMJ,
337:a1680, 2008. 87, 117, 127
[216] S. Brage, U. Ekelund, N. Brage, M. A. Hennings, K. Froberg, P. W. Franks, and
N. J. Wareham. Hierarchy of individual calibration levels for heart rate and
accelerometry to measure physical activity. J Appl Physiol, 103(2):682–92, 2007.
89, 119
[217] G. R. Goldberg, A. M. Prentice, W. A. Coward, H. L. Davies, P. R. Murgatroyd,
C. Wensing, A. E. Black, M. Harding, and M. Sawyer. Longitudinal assessment
of energy expenditure in pregnancy by the doubly labeled water method. Am
J Clin Nutr, 57(4):494–505, 1993. 91, 115
[218] J. M. van Raaij, C. M. Schonk, S. H. Vermaat-Miedema, M. E. Peek, and J. G.
Hautvast. Energy cost of walking at a fixed pace and self-paced before, during,
and after pregnancy. Am J Clin Nutr, 51(2):158–61, 1990. 91
[219] A. M. Prentice, C. J. Spaaij, G. R. Goldberg, S. D. Poppitt, J. M. van Raaij,
M. Totton, D. Swann, and A. E. Black. Energy requirements of pregnant and
214
REFERENCES
lactating women. Eur J Clin Nutr, 50 Suppl 1:S82–110; discussion S10–1, 1996.
91, 116
[220] G. A. Borg. Psychophysical bases of perceived exertion. Med Sci Sports Exerc,
14(5):377–81, 1982. 91, 118
[221] S. Brage, N. Brage, P. W. Franks, U. Ekelund, and N. J. Wareham. Reliability
and validity of the combined heart rate and movement sensor Actiheart. Eur J
Clin Nutr, 59(4):561–70, 2005. 93, 130
[222] S. Brage, N. Brage, P. W. Franks, U. Ekelund, M. Y. Wong, L. B. Andersen,
K. Froberg, and N. J. Wareham. Branched equation modeling of simultaneous
accelerometry and heart rate monitoring improves estimate of directly mea-
sured physical activity energy expenditure. J Appl Physiol, 96(1):343–51, 2004.
94, 120
[223] H. R. Murphy, G. Rayman, K. Duffield, K. S. Lewis, S. Kelly, B. Johal, D. Fowler,
and R. C. Temple. Changes in the glycemic profiles of women with type 1 and
type 2 diabetes during pregnancy. Diabetes Care, 30(11):2785–91, 2007. 107, 117,
127, 128
[224] H. R. Murphy, D. Elleri, J. M. Allen, J. Harris, D. Simmons, G. Rayman, R. C.
Temple, A. M. Umpleby, D. B. Dunger, A. Haidar, M. Nodale, M. E. Wilinska,
and R. Hovorka. Pathophysiology of postprandial hyperglycaemia in women
with type 1 diabetes during pregnancy. Diabetologia, 55(2):282–93, 2012. 108
[225] ACOG Practice Bulletin. Clinical management guidelines for obstetrician-
gynecologists. Pregestational diabetes mellitus. Obstet Gynecol, 105(3):675–85,
2005. 108
[226] B. Zinman, N. Ruderman, B. N. Campaigne, J. T. Devlin, and S. H. Schneider.
Physical activity/exercise and diabetes mellitus. Diabetes Care, 26 Suppl 1:S73–
7, 2003. 109, 114, 132
[227] G. E. Sonnenberg, F. W. Kemmer, and M. Berger. Exercise in type 1 (insulin-
dependent) diabetic patients treated with continuous subcutaneous insulin in-
fusion. Prevention of exercise induced hypoglycaemia. Diabetologia, 33(11):696–
703, 1990. 109
215
REFERENCES
[228] A. M. Gomez, C. M. Gomez, A. Veloza, O. Munoz, and C. P. Rubio. Impact of
exercise on continuously-monitored glucose levels in type 1 diabetes patients
>14 years of age on insulin pump therapy. Diabetologia, 53, 2010. 110
[229] E. Hellmuth, P. Damm, L. Molsted-Pedersen, and I. Bendtson. Prevalence of
nocturnal hypoglycemia in first trimester of pregnancy in patients with insulin
treated diabetes mellitus. Acta Obstet Gynecol Scand, 79(11):958–62, 2000. 110,
128
[230] C. E. Garber, B. Blissmer, M. R. Deschenes, B. A. Franklin, M. J. Lamonte, I. M.
Lee, D. C. Nieman, and D. P. Swain. American College of Sports Medicine posi-
tion stand. Quantity and quality of exercise for developing and maintaining car-
diorespiratory, musculoskeletal, and neuromotor fitness in apparently healthy
adults: guidance for prescribing exercise. Med Sci Sports Exerc, 43(7):1334–59,
2011. 113, 114
[231] R. E. Ratner. An update on the Diabetes Prevention Program. Endocr Pract, 12
Suppl 1:20–4, 2006. 113
[232] C. S. Moy, T. J. Songer, R. E. LaPorte, J. S. Dorman, A. M. Kriska, T. J. Orchard,
D. J. Becker, and A. L. Drash. Insulin-dependent diabetes mellitus, physical
activity, and death. Am J Epidemiol, 137(1):74–81, 1993. 113
[233] AS Brazeau, R Rabasa-Lhoret, I Strychar, and H Mircescu. Barriers to physical
activity among patients with type 1 diabetes. Diabetes care, 31(11):2108, 2008.
113
[234] ACOG committee opinion. Exercise during pregnancy and the postpartum pe-
riod. American College of Obstetricians and Gynecologists. Int J Gynaecol Ob-
stet, 77(1):79–81, 2002. 114
[235] R. Schiel, A. Thomas, A. Kaps, and G. Bieber. An innovative telemedical sup-
port system to measure physical activity in children and adolescents with type
1 diabetes mellitus. Exp Clin Endocrinol Diabetes, 119(9):565–8, 2011. 114
[236] A. C. van Bon, E. Verbitskiy, G. von Basum, J. B. Hoekstra, and J. H. Devries.
Exercise in closed-loop control: a major hurdle. J Diabetes Sci Technol, 5(6):1337–
41, 2011. 114, 162
216
REFERENCES
[237] A. D. Stein, J. M. Rivera, and J. M. Pivarnik. Measuring energy expenditure
in habitually active and sedentary pregnant women. Med Sci Sports Exerc,
35(8):1441–6, 2003. 114, 115, 130
[238] C. L. Harrison, R. G. Thompson, H. J. Teede, and C. B. Lombard. Measuring
physical activity during pregnancy. Int J Behav Nutr Phys Act, 8:19, 2011. 114,
130
[239] A. M. Prentice. Stable isotopic methods for measuring energy expenditure. Ap-
plications of the doubly-labelled-water (2H2(18)O) method in free-living adults.
Proc Nutr Soc, 47(3):259–68, 1988. 114
[240] G. Plasqui and K. R. Westerterp. Physical activity assessment with accelerom-
eters: an evaluation against doubly labeled water. Obesity (Silver Spring),
15(10):2371–9, 2007. 115
[241] V. T. van Hees, F. Renstrom, A. Wright, A. Gradmark, M. Catt, K. Y. Chen,
M. Lof, L. Bluck, J. Pomeroy, N. J. Wareham, U. Ekelund, S. Brage, and P. W.
Franks. Estimation of daily energy expenditure in pregnant and non-pregnant
women using a wrist-worn tri-axial accelerometer. PLoS One, 6(7):e22922, 2011.
115
[242] E. K. Rousham, P. E. Clarke, and H. Gross. Significant changes in physical
activity among pregnant women in the UK as assessed by accelerometry and
self-reported activity. Eur J Clin Nutr, 60(3):393–400, 2006. 115, 116, 127, 130
[243] S. E. Crouter, J. R. Churilla, and Jr. Bassett, D. R. Accuracy of the Actiheart for
the assessment of energy expenditure in adults. Eur J Clin Nutr, 62(6):704–11,
2008. 115
[244] K. Melzer, Y. Schutz, M. Boulvain, and B. Kayser. Pregnancy-related changes
in activity energy expenditure and resting metabolic rate in Switzerland. Eur J
Clin Nutr, 63(10):1185–91, 2009. 115, 116, 127, 130
[245] A. Gradmark, J. Pomeroy, F. Renstrom, S. Steiginga, M. Persson, A. Wright,
L. Bluck, M. Domellof, S. E. Kahn, I. Mogren, and P. W. Franks. Physical
activity, sedentary behaviors, and estimated insulin sensitivity and secretion
in pregnant and non-pregnant women. BMC Pregnancy Childbirth, 11:44, 2011.
115, 116, 127, 130
217
REFERENCES
[246] K. Melzer, Y. Schutz, M. Boulvain, and B. Kayser. Physical activity and
pregnancy: cardiovascular adaptations, recommendations and pregnancy out-
comes. Sports Med, 40(6):493–507, 2010. 115
[247] L. A. Wolfe, A. P. Heenan, and A. Bonen. Aerobic conditioning effects on sub-
strate responses during graded cycling in pregnancy. Can J Physiol Pharmacol,
81(7):696–703, 2003. 115
[248] J. F. Clapp. Long-term outcome after exercising throughout pregnancy: fitness
and cardiovascular risk. Am J Obstet Gynecol, 199(5):489 e1–6, 2008. 115
[249] M. C. de Barros, M. A. Lopes, R. P. Francisco, A. D. Sapienza, and M. Zugaib.
Resistance exercise and glycemic control in women with gestational diabetes
mellitus. Am J Obstet Gynecol, 203(6):556 e1–6, 2010. 115
[250] M. J. Ong, K. J. Guelfi, T. Hunter, K. E. Wallman, P. A. Fournier, and J. P. Newn-
ham. Supervised home-based exercise may attenuate the decline of glucose
tolerance in obese pregnant women. Diabetes Metab, 35(5):418–21, 2009. 115
[251] D. R. Hollingsworth and T. R. Moore. Postprandial walking exercise in preg-
nant insulin-dependent (type I) diabetic women: reduction of plasma lipid lev-
els but absence of a significant effect on glycemic control. Am J Obstet Gynecol,
157(6):1359–63, 1987. 115, 129
[252] C. McParlin, S. C. Robson, P. W. Tennant, H. Besson, J. Rankin, A. J. Adamson,
M. S. Pearce, and R. Bell. Objectively measured physical activity during preg-
nancy: a study in obese and overweight women. BMC Pregnancy Childbirth,
10:76, 2010. 116, 127
[253] M. Lof. Physical activity pattern and activity energy expenditure in healthy
pregnant and non-pregnant Swedish women. Eur J Clin Nutr, 65(12):1295–301,
2011. 116, 127
[254] Y. Yogev, A. Ben-Haroush, R. Chen, B. Rosenn, M. Hod, and O. Langer. Diurnal
glycemic profile in obese and normal weight nondiabetic pregnant women. Am
J Obstet Gynecol, 191(3):949–53, 2004. 116
[255] L. Chitayat, H. Zisser, and L. Jovanovic. Continuous glucose monitoring during
pregnancy. Diabetes Technol Ther, 11 Suppl 1:S105–11, 2009. 117, 135
218
REFERENCES
[256] O. Cohen, N. Keidar, M. Simchen, B. Weisz, M. Dolitsky, and E. Sivan. Macro-
somia in well controlled CSII treated type I diabetic pregnancy. Gynecol En-
docrinol, 24(11):611–3, 2008. 117
[257] G. Mello, E. Parretti, F. Mecacci, P. La Torre, R. Cioni, D. Cianciulli, and
G. Scarselli. What degree of maternal metabolic control in women with type
1 diabetes is associated with normal body size and proportions in full-term
infants? Diabetes Care, 23(10):1494–8, 2000. 117
[258] A. Kerssen, H. W. de Valk, and G. H. Visser. Day-to-day glucose variability
during pregnancy in women with type 1 diabetes mellitus: glucose profiles
measured with the continuous glucose monitoring system. BJOG, 111(9):919–
24, 2004. 117, 127
[259] Y. Yogev, R. Chen, A. Ben-Haroush, M. Phillip, L. Jovanovic, and M. Hod.
Continuous glucose monitoring for the evaluation of gravid women with type
1 diabetes mellitus. Obstet Gynecol, 101(4):633–8, 2003. 117, 127
[260] G. Petrovski, C. Dimitrovski, M. Bogoev, T. Milenkovic, I. Ahmeti, and
I. Bitovska. Is there a difference in pregnancy and glycemic outcome in pa-
tients with type 1 diabetes on insulin pump with constant or intermittent glu-
cose monitoring? A pilot study. Diabetes Technol Ther, 13(11):1109–13, 2011.
117
[261] B. E. Ainsworth, W. L. Haskell, A. S. Leon, Jr. Jacobs, D. R., H. J. Montoye,
J. F. Sallis, and Jr. Paffenbarger, R. S. Compendium of physical activities: clas-
sification of energy costs of human physical activities. Med Sci Sports Exerc,
25(1):71–80, 1993. 118, 121, 127
[262] M. Lof and E. Forsum. Activity pattern and energy expenditure due to physical
activity before and during pregnancy in healthy Swedish women. Br J Nutr,
95(2):296–302, 2006. L. 127
[263] C. M. Peterson and L. Jovanovic-Peterson. Percentage of carbohydrate and
glycemic response to breakfast, lunch, and dinner in women with gestational
diabetes. Diabetes, 40 Suppl 2:172–4, 1991. 129
[264] G. N. Healy, D. W. Dunstan, J. Salmon, E. Cerin, J. E. Shaw, P. Z. Zimmet, and
N. Owen. Objectively measured light-intensity physical activity is indepen-
219
REFERENCES
dently associated with 2-h plasma glucose. Diabetes Care, 30(6):1384–9, 2007.
129
[265] M. Devadoss, L. Kennedy, and N. Herbold. Endurance athletes and type 1
diabetes. Diabetes Educ, 37(2):193–207, 2011. 132
[266] H. J. Yoo, H. G. An, S. Y. Park, O. H. Ryu, H. Y. Kim, J. A. Seo, E. G. Hong, D. H.
Shin, Y. H. Kim, S. G. Kim, K. M. Choi, I. B. Park, J. M. Yu, and S. H. Baik. Use
of a real time continuous glucose monitoring system as a motivational device
for poorly controlled type 2 diabetes. Diabetes Res Clin Pract, 82(1):73–9, 2008.
133
[267] P Adolfsson, H Örnhagen, and J Jendle. The benefits of continuous glucose
monitoring and a glucose monitoring schedule in individuals with type 1 dia-
betes during recreational diving. J Diabetes Sci Technol, 2(5):778–84, 2008. 133
[268] J Broz, M Brabec, and J Polak. The accuracy of real-time CGM sensor in patients
with type 1 diabetes during a physical activity. In Advanced Technologies &
Treatments of Diabetes London UK, 2011. 133, 144
[269] P. Adolfsson, S. Nilsson, and B. Lindblad. Continuous glucose monitoring sys-
tem during physical exercise in adolescents with type 1 diabetes. Acta Paediatr,
100(12):1603–9, 2011. 133, 134, 144, 148
[270] D. M. Wilson, R. W. Beck, W. V. Tamborlane, M. J. Dontchev, C. Kollman,
P. Chase, L. A. Fox, K. J. Ruedy, E. Tsalikian, S. A. Weinzimer, and Grp Di-
recNet Study. The accuracy of the FreeStyle Navigator continuous glucose
monitoring system in children with type 1 diabetes. Diabetes Care, 30(1):59–64,
2007. 133, 144, 147
[271] RJ Davey, LD Ferreira, TW Jones, and PA Fournier. Effect of exercise-mediated
acidosis on determination of glycemia using CGMS. Diabetes Technol Ther,
8(4):516–8, 2006. 134, 148
[272] K. E. Iscoe, J. E. Campbell, V. Jamnik, B. A. Perkins, and M. C. Riddell. Efficacy
of continuous real-time blood glucose monitoring during and after prolonged
high-intensity cycling exercise: spinning with a continuous glucose monitoring
system. Diabetes Technol Ther, 8(6):627–35, 2006. 134
220
REFERENCES
[273] T. Nunnold, S. R. Colberg, M. T. Herriott, and C. T. Somma. Use of the non-
invasive GlucoWatch Biographer during exercise of varying intensity. Diabetes
Technol Ther, 6(4):454–62, 2004. 134, 148
[274] C. Fayolle, J. F. Brun, J. Bringer, J. Mercier, and E. Renard. Accuracy of contin-
uous subcutaneous glucose monitoring with the GlucoDay in type 1 diabetic
patients treated by subcutaneous insulin infusion during exercise of low versus
high intensity. Diabetes Metab, 32(4):313–20, 2006. 135, 148
[275] A. Kerssen, H. W. de Valk, and G. H. Visser. The continuous glucose monitoring
system during pregnancy of women with type 1 diabetes mellitus: accuracy
assessment. Diabetes Technol Ther, 6(5):645–51, 2004. 135, 144
[276] J. M. Bland and D. G. Altman. Statistical methods for assessing agreement
between two methods of clinical measurement. Lancet, 1(8476):307–10, 1986.
138
[277] C. Tack, H. Pohlmeier, T. Behnke, V. Schmid, M. Grenningloh, T. Forst, and
A. Pfutzner. Accuracy evaluation of five blood glucose monitoring systems
obtained from the pharmacy: A European multicenter study with 453 subjects.
Diabetes Technol Ther, 14(4):330–7, 2011. 147
[278] K. Nerhus, P. Rustad, and S. Sandberg. Effect of ambient temperature on ana-
lytical performance of self-monitoring blood glucose systems. Diabetes Technol
Ther, 13(9):883–92, 2011. 148
[279] F. Ricci, F. Caprio, A. Poscia, F. Valgimigli, D. Messeri, E. Lepori, G. Dall’Oglio,
G. Palleschi, and D. Moscone. Toward continuous glucose monitoring with
planar modified biosensors and microdialysis. Study of temperature, oxygen
dependence and in vivo experiment. Biosens Bioelectron, 22(9-10):2032–9, 2007.
148
[280] J. R. Castle, A. Pitts, K. Hanavan, R. Muhly, J. El Youssef, C. Hughes-Karvetski,
B. Kovatchev, and W. K. Ward. The accuracy benefit of multiple amperometric
glucose sensors in people with type 1 diabetes. Diabetes Care, 35(4):706–10, 2012.
153
[281] D. Elleri, C. L. Acerini, J. M. Allen, A. M. Larsen, M. E. Wilinska, D. B. Dunger,
and R. Hovorka. Effect of delay on measurement of blood glucose levels in
221
REFERENCES
young subjects with type 1 diabetes. Diabetes Res Clin Pract, 86(2):e31–3, 2009.
155
[282] Allen J Harris J Kumareswaran K Nodale M Acerini C Wilinska M Jackson N
Umpleby M Evans ML Dunger D Hovorka R Haidar A, Elleri D. Validity of
triple and dual-tracer techniques to estimate glucose appearance. Am J Physiol
Endocrinol Metab., Mar 27 2012. 158
[283] G. E. Umpierrez, S. D. Isaacs, N. Bazargan, X. D. You, L. M. Thaler, and A. E.
Kitabchi. Hyperglycemia: An independent marker of in-hospital mortality in
patients with undiagnosed diabetes. J Clin Endocrinol Metab, 87(3):978–82, 2002.
158
[284] L. Heinemann, C. Benesch, and J. H. DeVries. APhome: a novel European
approach to bring the artificial pancreas home. J Diabetes Sci Technol, 5(6):1363–
72, 2011. 160
[285] S. Lindpointner, S. Korsatko, G. Kohler, H. Kohler, R. Schaller, L. Schaupp,
M. Ellmerer, T. R. Pieber, and W. Regittnig. Glucose levels at the site of subcu-
taneous insulin administration and their relationship to plasma levels. Diabetes
Care, 33(4):833–8, 2010. 160
[286] J. C. Pickup, S. C. Freeman, and A. J. Sutton. Glycaemic control in type 1
diabetes during real time continuous glucose monitoring compared with self
monitoring of blood glucose: meta-analysis of randomised controlled trials
using individual patient data. BMJ, 343:d3805, 2011. 161
[287] A. C. van Bon, M. J. Kohinor, J. B. Hoekstra, G. von Basum, and J. H. deVries.
Patients’ perception and future acceptance of an artificial pancreas. J Diabetes
Sci Technol, 4(3):596–602, 2010. 161
[288] D. Elleri, C. L. Acerini, J. M. Allen, J. Hayes, C. Pesterfield, M. E. Wilinska,
D. B. Dunger, and R. Hovorka. Parental attitudes towards overnight closed-
loop glucose control in children with type 1 diabetes. Diabetes Technol Ther,
12(1):35–9, 2010. 161
[289] G. Lanzola, D. Capozzi, N. Serina, L. Magni, and R. Bellazzi. Bringing the
artificial pancreas home: telemedicine aspects. J Diabetes Sci Technol, 5(6):1381–
6, 2011. 163
222
REFERENCES
[290] E. Dassau, L. Jovanovic, 3rd Doyle, F. J., and H. C. Zisser. Enhanced 911/global
position system wizard: a telemedicine application for the prevention of severe
hypoglycemia – monitor, alert, and locate. J Diabetes Sci Technol, 3(6):1501–6,
2009. 163
223