Embed Size (px)
Citation preview
International Journal of Hybrid Information Technology
Vol.7, No.5 (2014), pp.23-32
http://dx.doi.org/10.14257/ijhit.2014.7.5.03
ISSN: 1738-9968 IJHIT
Copyright ⓒ 2014 SERSC
Investigation on Closed-loop Fiber Optic Gyroscope Structure
and Operation
Rohollah Mazrae Khoshki1 and Prof. Submarian Ganesan2
1,2Oakland University, Electrical and Computer Engineering Dep.
[email protected], [email protected]
Abstract
In this paper, I reviewed comprehensively the structure and operation of closed-loop
IFOGs, Feedback Erbium-doped fiber amplifier (EFDA) FOGs, called FE-FOG. The
procedure of finding the Sagnac shift for closed-loop IFOG has been studied. The signal
processing in the closed-loop IFOG was simulated using PSCAD software. In the
closed-loop IFOG, the phase shift was derived through frequent use of Sagnac loop. The
output signal is injected in the input again as feedback. The shift phase between
clockwise and counterclockwise waves in each complete route, including primary and
feedback route, is identified as Sagnac shift phase. According to Sagnac shift phase we
could determine angular rotation rate.
Keywords: Interferometric Fiber Optic Gyroscope (IFOG), Feedback Erbium-doped
fiber amplifier FOG (FE-FOG), Erbium-doped fiber amplifier (EFDA), PSCAD, Sagnac
shift
1. Introduction
Gyroscope is a sensor which determines the rotation rate and direction. Inertial
guidance and navigation systems are known to be very useful for aircrafts, land vehicles
and robots for many years, in past they make use of mechanical gyroscope but todays
FOG (Fiber Optic Gyroscope) is used for measurement of the rotation based on Sagnact
Effect [1]. Two types of FOG are used: first the interferometric FOG (I-FOG) in which a
low coherence light source is used and second the resonance FOG (R-FOG). In the R-
FOG the differences of resonance frequency caused by sagnact effect is utilized for
measuring the rotation. Therefore even a short length of optical fiber is sufficient for the
measurement. R-FOG needs a coherent light source for which such effects like Kerr
effect and reflective optic phenomenon must be considered. The FOG converts the
Sagnact phase shift into a beam frequency between the clockwise and counterclockwise
of laser modes. As an example requirement of the precision of rotation measurement for
spacecraft navigation lies between hr/01.00 to hr/001.0
0 .
The principle of operation of a typical fiber gyro is based on a phase modulation in
both directions of an optical fiber loop, as if it acts as a delay line. The modulation
frequency,2
1
Pf
, matches the half period of the transit time . Such a modulation
scheme provides a sinusoidal response with a stable bias. However this response is
nonlinear and the rotation rate proportional to the returning power is not perfectly stable.
Ring laser gyroscope (RLG) consists of a ring laser having two counter-propagating
modes over the same path in order to detect rotation. It works based on Sagnac shift
effect and requires high vacuum and precision mirror technology, which makes this
technique very expensive [2]. The physical principal of RLG operation is analogous to
the Doppler Effect, but it involves determination of the phase shift between two counter-
propagating light beams in an evacuated mirrored cavity [3]. To address this drawback,
interferometric fiber optic gyro (IFOG) is employed whose function resembles RLG,
International Journal of Hybrid Information Technology
Vol.7, No.5 (2014)
24 Copyright ⓒ 2014 SERSC
notwithstanding the fact that, in IFOG, the same effect is obtained in a fiber coil with the
elimination of the high voltage and high vacuum, which results in a low-cost inertial
rotation sensor [2 and 3]. In addition, IFOGs are abstracted in miniature devices; all-
solid state with a limited number of components, therefore lower cost.
In terms of light source, RLG requires an external narrow band gas laser with its
active gain medium which is an integral part of the sensing cavity, whereas IFOG works
with an external broadband light source [4]. Path length measurement in RLG is
performed by measuring the difference of resonant frequencies between two cavities.
Despite, IFOG rotation rate sensing is achieved through a direct measurement (open loop)
or nulling (close loop) of the optical phase difference due to the rotation-induced Sagnac
phase shift [5].
According to the fact that high precision gyro is not always required, e.g. in land
automotive vehicle an IFOG with the accuracy between 10 to 200deg/hr is sufficient [6],
and also regarding to the least requirements with the most flexibility in the design of
IFOG, the improvement of this sensor becomes more sensible. Therefore in this paper I
used EF-IFOG that will be explained in detail in next section.
2. Principle of EF-IFOG Operation
EF-FOG work by frequent utilize of sagnact loop, in this manner output signal
re-inputted as feedback. It performs like R-FOG but without high length coherence
light source and never use the resonance effect. FE-FOG in comparison with Open-
loop I-FOG has high sensibility and wide dynamic range [7].
A light source with a coherence length much shorter than the coil length allows
only the wave pairs that have circulated the same number of times in the loop to
interfere with each other and to produce an output related to the rotation-induced
nonreciprocal phase shift. The resultant optical response is essentially the sum of
all the optical responses of a series of conventional Sagnac Interferometric fiber -
optic gyroscopes with their effective loop length in mul tiples of a single coil’s
length. The multiple-trip interference and the associated intensity summation
produces a response resembling a resonance phenomenon, with the strength and
sharpness of the resonance increasing with the number of interfering light waves.
The proposed gyro has different from a resonant fiber-optic gyro (R-FOG) because
it uses a low coherent light source. The low coherent source minimizes not only
errors from Rayleigh back scattering, but also bias errors caused by the optical
Kerr effect. This could not possibly be done in an R-FOG because of high coherent
light source.
If the modulation frequency of phase modulator in sagnact loop consists of
whole loop time delay, the output signal in IFOG will be in pulse shape; therefore,
when rotation occurs in the system, the location of output peak pulse shifts by
sagnact effect. Precision of measurement depends on sharpness of the output
pulses. Sharpness of output pulse is determined by the phase modulation depth and
EFDA gain [8].
Miniature fiber optic gyros have also been manufactured with all solid-state
optical devices for precise measurements of mechanical rotation based on the
sagnac principle.
Open-loop IFOG is a simple configuration of the IFOG. Closed-loop IFOG
performs similar to the resonance FOG (R-FOG), both based on Sagnac effect,
although used for different tasks.
International Journal of Hybrid Information Technology
Vol.7, No.5 (2014)
Copyright ⓒ 2014 SERSC 25
3. Rotation Equation
When the optical ring is rotated with a tangential velocity , the beam rotating with
the ring will have an optical path longer than the counter-rotating beam by a distance L
given by:
c
RL
4
(1)
Where, R is the ring radius and c is the speed of light in the vacuum. For a
monochromatic light of wavelength , this change in optical path length results in the
Sagnac phase difference, which is given by Equation (2).
c
RL
282
(2)
The phase difference between two beams, after passing the ring with the area A and
rotating with an angular velocity , generates a phase difference which is given by:
c
A
8
(3)
It is important to note that, the resultant phase shift is independent of the medium and
of the exact shape of the loop. This compliant property of the IFOG is an advantage
when it is required to design it to fit the volume constrains in the specific applications.
However, the resultant phase shift can be increased by additional loops (turns of fiber)
i.e. if it is wound N turns of the fiber coil. The resultant phase shift becomes [9]:
c
NA
8
(4)
Alternatively, we can express the resultant phase shift in terms of coil diameter and
fiber length by noting that:
4
2D
A
(5)
And,
DNL
(6)
So, the Sagnac phase shift can be rewritten as:
c
LD
2
(7)
As one example in a typical IFOG (200m coil length, 10cm-diameter coil) for
measurement of the earth angular rotation ( =15°/h=0.73 µr/s), the sensor detects a
phase difference of =36 µr, corresponding to an optical path difference of the order
of 10-12 m [9].
4. Closed-loop EF-FOG Configuration and Operation
In this structure the weak feedback signal is amplified by the Er-Doped Fiber
Amplifier (EDFA) to prevent the laser scattering. Fiber amplifier is assumed to be linear,
which means there are no gain effects. The output signal is the sum of interferometric
CW and CCW beams in the total route. The modulator is located in sagnac loop. If the
International Journal of Hybrid Information Technology
Vol.7, No.5 (2014)
26 Copyright ⓒ 2014 SERSC
phase modulator frequency is selected properly, the output signal will be a series of short
pulses [8]. Hence modulation frequency of phase modulator and route delay must be
approved by the equation:
nm
2
(8)
Wherem
is angular frequency of the phase modulation, and is the time delay in
whole round trip loop consisting of Sagnac loop and amplified fiber optic loop. If the
sharpness of output pulses could not be adjusted by phase modulation, by changing
EFDA gain it can be compensated. If this equation0
2 nm
is not realized, for
example due to detuning, there will be a phase shift 0
that can be demodulated as an
error signal for phase modulated (PM) technology. The operation of the FE-FOG is
sensitive to the EDFA gain [10]. In theory the first interferometric output signal without
feedback is equal to ordinary IFOG as:
)cos(cos11
)(1
tmes
vKtP
(9)
Where v is the interferometric coefficient and 1
K is a parameter that expresses the
loss resulting from the Sagnac loop and the couplers of the Sagnac interferometer,m
is
the modulation frequency,e
is the effective phase-modulation depth, which is expressed
as
)sin(2smme
f
(10)
s is the wave-propagation time through the Sagnac loop (please note the difference
with the total time round-trip delay ) and is expressed as cnLs
/ (where L is the
length of Sagnac loop), and m
is the phase-modulation depth. s
is the Sagnac phase
shift induced by rotational movement, which is expressed as Equation (7) in the previous
section.
By considering the effect of optical feedback, the second-time interference signal
experienced after the feedback has been derived is
)cos(cos1)cos(cos1)(2
2
12ttvKAKtP
mesmmes
(11)
And the third-time interference signal that occurs after feedback has been twice
derived is
)2cos(cos1)()(22
2
3
1
2
3
mmestvKKAtP
)cos(cos1 mmes
tv
)cos(cos1 tvmes
(12)
Where A is the gain of the fiber amplifier and 2
K is a parameter that depends on the
coupling ratio of the feedback couplers and the transmission loss in the feedback loop.
For simplicity, we assume that21
'.KKK . The total output at the photodetector is the
summation of the number of above-mentioned interferences and is expressed as
International Journal of Hybrid Information Technology
Vol.7, No.5 (2014)
Copyright ⓒ 2014 SERSC 27
...,)()()()(321
tPtPtPtPtotal
(13)
If nm
2 , the total photodetector output can be realized by proper adjustment of
the modulation frequency to match the round-trip time, and we can have:
)cos(1'1
)cos(cos1)(
tAK
tvKtP
mes
mes
total
(14)
Where K is the photodetector coefficient, because the total output is a series of short
pulses, we can determine the peak value through the following equation:
0)(' tPtotal
0)cos(sin tKvmes
,2)cos( ntmes
n=0,1,2,3, …
(15)
Above Equation is a condition required to find the peak position of the output pulse
that is valid for both cases of rotation and nonrotation, please note that only those
equations of even π correspond to the peak position. From this equation and condition
we can see that the output pulse shifts if rotation occurs.
For Closed-Loop FE-FOG In Eq.(10) if e
is selected to be between 20 e
and
0s
there is no rotation, Eq.(10) is satisfied only when n=0. In this case, the peak
positions of the output pulse are determined through the following equation:
,2
12
0
it
m
i=0,1,2, …
(16)
Here 0
t represents the peak positions corresponding to the nonrotation case and i
denotes the peak number of the output pulse in the time axis. We see that the peak
positions are not affected by the phase-modulation depth e
when there is no rotation
On the other hand, when rotation occurs ( 0≠s
) the peak positions are affected by the
Sagnac phase shift and can be determined by:
,2arccos
it
e
s
rm
i=0,1,2, …
(17)
Wherer
t denotes the peak positions when rotation occurs and i has the same meaning
as in Eq. 16 Comparing Eqs. 16 and 17, we see that the peak positions shift if rotation
occurs, and the shift of the peaks is just equal to0
tttr . Therefore, the peak
positions are in fenced by only the Sagnac phase shift if rotation occurs and if we fix the
phase-modulation depthe
. We can thus determine the rotation rate by the detection of
the peak shift t of the output pulse.
In this paper the wave-length of optical source is m 5.10 , the modulation
frequency of the phase modulator, MHzfm
209790.0 (mm
f.2 ), and the radius of
the Sagnac loop is R =0.05m. The round-trip length is 500 m, which is selected to match

International Journal of Hybrid Information Technology
Vol.7, No.5 (2014)
28 Copyright ⓒ 2014 SERSC
the modulation frequency for the pulse output, of which the Sagnac-loop length is 460 m
and the length of the EDFA (including the pigtail of couplers) is 40 m. The
interferometric coefficient is v=0.96, the photodetection coefficient is K=0.2, the
parameter 06.0'K , the effective phase-modulation depth is rad
e6.0 , and the
Sagnac phase shift is 0s
for the nonrotation case.
Figure 1. Rotation Measurement for Closed-loop EF-IFOG 11
1070741.3
t
Figure 1 demonstrates the principle of the rotation measurement for the Closed-loop
EF-IFOG method when the output pulse is shifted by rotation. The plots are normalized
and rade
18.0 . We see that the peak position shifts if rotation occurs, phase shift
h/0
and h/6.3
. Further calculations show that the shift is increased as the rotation
rate increases. The very sharp peak of the output pulse can result in a high-resolution
rotation measurement. From Eqs. 7 and 15–17 (in Eq. 16, i=0,2,4), we can derive the
rotation rate as:
ttRL
c
mme
0
0cos
4
tRL
c
me
sin
4
0
(18)
Where t is the time shift of the output peak as a result of the rotation, In Closed-
Loop Method for the FE-FOG, we selected e
with a condition of 42 e
. In
such a case the output pulse is shifted by only the rotation. In this section, we hope to
show that the output pulse is affected by both rotation and phase modulation, so that we
can use the phase modulation to compensate the Sagnac phase shift. Such a technical
idea is consistent with the closed-loop method.
In Eq. (15), if we assume that 0s
(nonrotation) and we select 42 e
, e.g.,
2.2e
, then Eq. (15), can be satisfied by n=1, n=0, and n =-1, which means that the
output pulse has three kinds of peaks. The peaks corresponding to n=0 have the same
properties as do those of the open-loop method and will not be affected by the phase
modulation; however, the peaks corresponding to n=1or n=-1 will be in fenced by both

International Journal of Hybrid Information Technology
Vol.7, No.5 (2014)
Copyright ⓒ 2014 SERSC 29
the Sagnac phase shift and the phase-modulation depth. This performance can be used
for the rotation measurement.
Figure 2 shows comparison of output pulses for different phase modulation.
Figure 2. The Comparison of the Output Pulses for Different Phase
Modulations when One Value of e
, 20
e and 42
e . The Plots are Normalized
Figure 2 shows that the output pulses related to 2.0e
is simple, but, the output
pulses related to 2.2e
are complicated and consist of three kinds of peaks
designated A, B, and C. (Note: if we select e
to be greater than 4 , even more output
peaks will appear, because in Eq. (15) n also includes integers over. This case can also
be analyzed similarly). The peak positions for A, B, and C are determined by n = 1, 0, -
1, respectively, in Eq. (15). In this paper, we look at the peak positions corresponding to
peaks A (peaks C also have similar properties). In one time period, peaks A also consist
of two additional peaks, marked with circles and squares, whose positions are
determined by:
nteAm
2)/2arccos(
nteAm
2)/2arccos(2 , n=0,1,2, …
(19)
n=0,1,2, ... respectively. If the Sagnac phase shift induced by rotation is canceled by
the phase modulation of the phase modulator, the peak positions corresponding to peaks
A will not shift in spite of rotation’s occurring. To realize this phase compensation we
can feed back an electrical signal at the phase modulator. The rotation rate can thus be
evaluated through the value of the phase modulation. Further calculations also show that,
although in the closed-loop case (when both rotation and feedback control of e
occur)
peaks B and C are shifted, they cannot cross with peaks A. This is because, for in any
case, the peak positions of peaks A, B, and C are determined from Eq. (15) with n = 1, 0,

International Journal of Hybrid Information Technology
Vol.7, No.5 (2014)
30 Copyright ⓒ 2014 SERSC
-1, respectively, and they always have different values. The above result tells us that in
the closed-loop case the dynamic range is large.
A more detailed mathematical description is presented in the following paragraphs.
We first consider the case of nonrotation (0
s
, for which the peak positions
corresponding to peaks A can be determined by
2)cos(0
Ame
t
(20)
Where 0e
is the phase-modulation depth corresponding to the nonrotation case, on the
other hand, when rotation occurs and if the electrical-feedback signal is placed on the
phase modulator, the peak positions corresponding to peaks A will not change, and then
we have:
),cos()(20 Amees
t
(21)
From Eqs. (20) and (21) we can further derive
,2)cos(
0e
e
Amest
(22)
We can evaluate the rotation rate by detectinge
.
Figure 3a. Output Pulse when the Rotation doesn't Exist 0 and
2.20
ee
International Journal of Hybrid Information Technology
Vol.7, No.5 (2014)
Copyright ⓒ 2014 SERSC 31
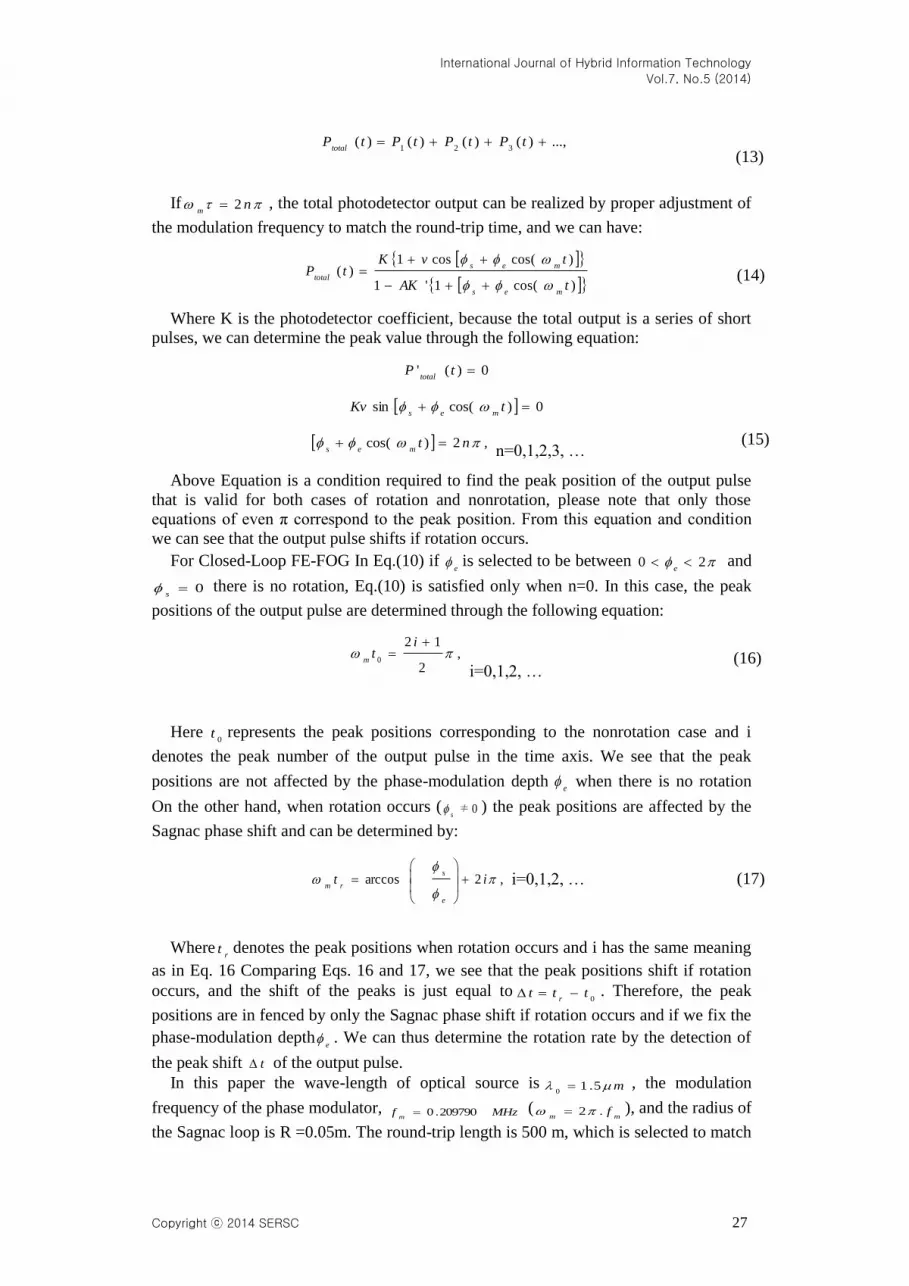
Figure 3b. Output Pulse when Rotate without Electric Feedback Signal in
Phase Modulator h/65.30
and 2.20
ee
Figure 3 shows the variation of the phase-modulation depth e
as a function of the
rotation rate for the closed loop. Figure 5a shows the output pulse when the rotation
doesn't exist 0 and 2.20
eeand Figure 5b shows the output pulse when
rotate without electric feedback signal in phase modulator h/65.30
and
2.20
ee therefore when rotation occur output pulses shifted. We can see the
peak that shifted by rotation could back to the first position that e
shows the variation
of phase modulation induced by electric feedback, that means the rotation rate of
h/65.30
needs the phase compensation 5-092E1.63508262e
.
5. Conclusion
In this paper, a comprehensive formulation of Closed-loop interferometric fiber
optic gyroscope, so called EF-FOG was studied. The functionality of the closed-
loop fiber-optic gyroscope EF-FOG, based on multiple utilizations of the Sagnac
loop and amplified optical feedback, has been proposed and theoretically
investigated. The new gyroscope is termed as feedback Er-doped fiber-optic
amplifier (FEDFA). A low-coherence light source is used in this FOG [11].
Amplification of a weak feedback gyroscope signal is performed by the
incorporated EDFA. The final gyroscope output is pulsed if the modulation
frequency of the phase modulator matches the round-trip time [12]. Sagnac phase
shift can induce a shift of the output pulse, which is used for the rotation
measurement.
References
[1] M. Merlo, N. Orgia and S. Donati, "Fiber Gyroscope Principles", Handbook of Fibre Optic Sensing
Technology, John Wiley & Sons, Ltd. Chapter 16, (2000), pp. 1-23.
[2] H. C. Lefevre , "Fundamentals of the Interferometric Fiber-Optic gyroscope", Optical review, vol.4, no.
1a, (1997) , pp. 20-27.
[3] S. Oho, H. Kajioka, and T. Sasayama, "Optical Fiber Gyroscope for Automotive Navigation", IEEE
transactions on vehicular technology, vol. 44. no. 3, (1995), pp. 698-705.
International Journal of Hybrid Information Technology
Vol.7, No.5 (2014)
32 Copyright ⓒ 2014 SERSC
[4] K. Shaikh, R. Shariff, F. Nagi, H. Jamaluddin, and S. Mansor, "Inertial Navigation Sensors; Data
Processing and Integration With GPS For Mobile Mapping", (2005).
[5] M. R. Nasiri-Avanaki, V. Soleimani and R. Mazrae Khoshki “Comparative Assessment on the
performance of Open-loop and Closed-loop IFOGs”, Optics and Photonics Journal, vol.2 no.1, (2012),
pp. 17-29.
[6] S. M. Bennett, S. Emge and R. B. Dyott, "Fiber Optic Gyroscopes for Vehicle Use", Intelligent
Transportation System, ITSC, IEEE Conference, (1998), pp. 1053-1057.
[7] R. M. Khoshki, "Analysis of Closed-Loop Interferometric Fiber Optic Gyroscope (EF-FOG) and
implementation", M.Sc. Thesis, Razi University, (2009).
[8] C. X. Shi, T. Yuhara, H. Iizuka, and H. Kajioka, “New interferometric fiber-optic gyroscope with
amplified optical feedback”, Applied Optics, vol.35, no.3, (1996).
[9] R. Y. Liu and G. W. Adams, "Interferometric Fiber Optic Gyroscope: A Summary of Progress", IEEE
conference Las Vegas, USA (1990), pp. 31-35.
[10] C.-Y. Liaw, Y. Zhou, Y.-L. Lam, member IEEE Characterization of an Open-Loop Interferometric
Fiber-Optic Gyroscope with the Sagnac Coil Closed by an Erbium-Doped Fiber Amplifier. Lightwave
Technology, Journal, vol. 16, no. 12 , (1998).
[11] A. Noureldin, M. Mintchev, D. Irvine-Halliday and H. Tabler, “Computer Modelling of
Microelectronic Closed Loop Fiber Optic Gyroscope,” IEEE Canadian Conference on Electrical and
Computer Engineering, Edmonton, 9-12, (1999), pp. 633-638.
[12] B. Se?men, “Simulation on Interferometric Fiber Optic Gyroscope with Amplified Optical Feedback,”
Middle East Technical University (METU), (2003).
Authors
Rohollah Mazrae Khoshki, PhD student in Oakland University,
Rochester, MI, USA, in Embedded System Electrical Eng., He is
working as a teaching assistant for the electrical and computer
engineering department at Oakland University. He investigated and
designed of Interferometric Fiber Optic Gyroscope (IFOG) as his
Master Thesis, designed and implemented of Heater Health
Monitoring (HHM) project for Nexthermal Company. He is
interested in Embedded Systems, FPGAs and Microcontrollers,
Robotics and control, Image processing and Optoelectronic in
research and practical applications.
Dr. Subramaniam Ganesan, Professor of Electrical and
Computer Engineering, Oakland University, Rochester, MI, 48309,
USA. He has over 25 years of teaching and research experience in
Digital systems. He served as the chair of the CSE department from
1991 to 98. He is with Electrical and Computer Engineering
Department since 2008. He received his masters and Ph.D. from
Indian Institute of Science (IISc) Bangalore, India. He worked at
National Aeronautical Laboratory (NAL) India, Ruhr University,
Germany, Concordia University Canada, and Western Michigan
University before joining Oakland University in 1986.


