Embed Size (px)
Citation preview

An Overview of Capital Structure
of Engineering Industry of
Bangladesh

Project Report
On
An Overview of Capital Structure of Engineering Industry of Bangladesh
Prepared For:
Dr. Tanbir Ahmed Chowdhury
Professor
Business Administration Department
East West University
Prepared By:
Salman Shahraiar
2008- l-10-076
Business Administration Department
East West University
Submission Date: 18th December, 2011
!l~ EAST \VEST U\ I\'ERSITY
1

LETTER OF TRANSMITTAL
181h December, 2011
Dr. Tanbtr Ahmed ChowdhuryProfessorDepartment of University
Subject: Letter regarding submission of project work on .' An Engineering Industry of Bangladesh".
DearSir,lt's a great pleasure for me to have the opportunity to
Overview of Capital Structure of Engineering Industry of for me to work in such an important area. I utmost to
one. Any shortcomings are expected to have a kind view
Thank you for your sincere & honest try to let me make
our
capital structure as well as its paper a successful one.
to measure
can serve for meant
Salman Shahriar2008-1-1 0-076Business Administration
I
Structure of
on
a
terms to

East West University
Executive Summary
Analysis of capital structure gives an overall scenario of the company's strength and capacity to
acquire capital for running as well as growing its business. Equity and Debt are two chief
financing sources of a company. Equity can be in the form of common stock and preferred stock;
and debt, primarily in the form of bonds and notes and then it can be in the form of loans and
advances from financial institutions. As both these two genres have unique sets of risk and
return, choice of the financing source is always a critical parameter for the financial managers of
any company. This report particularly focuses on the capital structure preferences of the
companies in the engineering industry of Bangladesh and also to test the influence of various
independent factors in the capital structure and the conformity of these factors with the
predictions drawn by capital structure theories. With this objective, the cost of debt and equity of
the selected companies have been analyzed, various leverages as well as ratios were calculated
and finally, the influence of different influencing independent factors on capital structure has
been tested.
'fhe analyses and calculations of this report entirely depend on secondary data collected from the
annual reports of the selected companies and Dhaka Stock Exchange (DSE). The capital
structures were determined by calculating the debt and equity portions of total value of the firm
and then the costs of these two financing sources were computed separately the summation of
which resulted in the total costs of capital. The use of Degree of Operating Leverage (DOL),
Degree of Financial Leverage (DFL) and Degree of Total Leverage (DTL) resulted in the
calculation of the riskiness and also in the profit potential of the entire firm. Finally, the
influence of the independent factors like operating leverage, growth rate, tangibility, debt service
capacity on capital structure was tested and a conclusion drawn on the influence of the factors
and checked those with the popular theories.

Acknowledgement
First of all I acknowledge my gratitude to the Almighty Allah.
My deepest gratitude to my project supervisorDr. Tanbir Ahmed Chowdhury,
Professor, Faculty of Department of Business Administration, East West University for
giving me this type of project and helping to complete the report. T do believe this study
have enriched my knowledge and will be very much helpful for my near future.

Table of Content
Topic Page Numbe
1
1
1.2 Objective of the Study 2
1.3 Scope of the Report 2
2
1 3
4
Theore1ical and Literature Review 4
I
4
4
2.1 Introduction
2.2 Theories, Approaches and Principles of Capital Structure
+-~
2.3 Literature Review I 11
16
16
of the Engineering Company Enlisted in DhakaStock 17
Thai Aluminium

Methodology of the Study 22
4.1 Data Requirement 22 ~-,
4.2 Data Sources 22
4.3 Data Type 23
4.4 Statement of Hypotheses 23 -" ..... _._ ... ........... ---,~
4.5 Position of Ca pital Structure 23 C---"'"
5 25 r
Analysis ami Results 25
5.1 Analysis of Capital Structures of Engineering Industry 25 ,', ...............................• -,-
5,2 Relationship between the Asset Growth Rate and Debt Ratio 29
5.3 tionship between the Operating Leverage and Debt Ratio 37
5,4 Relationship between the Financial Leverage and Debt Ratio 45
Relationship between the Tangibility Ratio and Debt Ratio 53
5.6 Relationship between the Debt Ratio and Cost of Capital 61
5.7 Relationship between the Debt Ratio and Market Price of 68
Share
Chapter - 6 75 - -
Findings and Conclusion 75
ibli >h 80

Chapter -1
Introduction
Bangladesh is a developing country with potential for rapid economic development
Like all other developing nations it has an ample scope for industrial development,
which would eventually bring about positive outcome for the country's economy,
Towards ensuring a healthy growth the country needs development of adequate
inirastructure facilities and development of inirastructural facilities is not possible
without development of industTies,
Analyzing the capital structure of an engineering company of Bangladesh will give the
overall situation of the sector. A company's proportion of long-term debt and equity is
considered when analyzing capital structure "Alhen people refer to capital structure
they are most likely referring to a firm's debt-to-equity ratio, which provides insight
into how risky a company is, Usually a company is more heavily financed by debt
poses gyeater risk, as this firm is relatively highly levered, The capital structure is how a
firm finances overall operations and growth by using different sources of funds,
Debt comes in the form of bond issues or long-term notes payable, while equity is
\.."'''~'m:u as common stock, preferred stock or retained earnings,
1.1 Origin of the Report
This reL'ort has
for completion
University,
plIep'He:LI to make a study on " An overview of Capital Structure of
Bangladesh." as a part of the fulfillment of the Project required
Bachelor of Business Administration program of East West
The report WaS prepared under the supervision of Dr, Tanbir Ahmed Chowdhury
Professor, West University,
I am very much thankful to him fOf assigning me such types of project work
1 I ;
1 of the Study
traded
objective of this report is to analyze the capital structure of five publicly
neering industries of Bangladesh. The specific objectives of the study are
listed below:
• understand the concept of capital structure.
• To analyze the prevailing capital structure in the engineering industry
Bangladesh.
• To test the influence of different influencing independent like opercltin
leverage, financial leverage, asset growth rate and tangibility ratio.
e To test the effect of change in capital structure of cost capital and market
of share.
1.3 Scope of the Report
In Bangladesh, presently there are 25 engineering companies enlisted with Dhaka Stock
Exchange. This report considers last 5(five) years financial statements of 6 (six) selected
engineering companies to analyze and evaluate the capital structure of engineering
industry.
1.4 Methodology
There are Twenty five (25) engineering company enlisted with Dhaka Stock EXChange. I
randomly choose %th or 25% or six (6) companies from all engineering companies to
conduct the study. To identify the capital structure of specified companies, this report
required information auditors' report from different annual reports, yearend stock
price. Latest five year's information was
companies. Selected companies are:
for randomly chosen six (6)
21

.:. Singer Bangladesh Limited
.:. Aftab Automobile Limited
.:. Atlas Bangladesh Limited
.:. Bangladesh Thai Aluminium Limited
.:. Monno Jute Stafllers Limited
.:. Eastern Cables Limited
For execution of the report J used MS office and MS Excel software and SPSS. Topic of
the report did not permit me to input data from primary sources. As the report must be
factual, the data source of this report is basically secondary sources. I gathered relevant
data from the different periodicals pu blished by the sector. I also collected relevant
information from different books as well. r collected some data from the internet to
broaden scope of analysis. All information used in this study was from secondary data
sources. So, no primary dCltCl is inel uded in this report.
1.5 Limitation
• Size of the companies in engll1eenng industries is different. As a result, they
were not completely comparable.
• Theories of books were for efficient market. These theories were not completely
applicable for an inefficient market like Bangladesh.
• All data are secondary data.

Chapter 2
Theoretical and Literature Review
2.1 Introduction
Capital structure refers to the way a corporation finances its assets through some
combination of equity, debt, or hybrid securities. The history of modern theory of
capital structure started with the path-breaking paper of Modigliani and Miller
published in 1958. In this paper, they used some restrictive set of assumptions and
contended in their first proposition that the impact of financing on the value of the firm
is irrelevant. The Miller and Modigliani (M&M) propositions assert that there would be
arbitrage opportunities in the perfect capital market if the value of the firm depends on
its capital structure. They also argue that if investors and finns can borrow at the same
rate, investors can neutralize any capital structure decisions the firm's management
may take. Though their proposition theoretically sounds good but it is only valid under
perfect market conditions (no tax is one of them) which were not actually possible in
real world. After that a lot of study was carried out to explain different issues related to
capital structure. Some of the popular theories are discussed in the following section.
2.2 Theories, Approaches and Principles of Capital Structure
The Modigliani-Miller (M&M) Theory
The Modigiiani-Miller theory, (also known as The Total-Value Principle) proposed by
Franco Modigliani and Merton Miller, forms the basis for modern thinking on ca pital
structure, though it is generally viewed as a purely theoretical result since it assumes
away many important factors in the capital structure decision. The theory states that, in
a perfect market, how a firm is financed is irrelevant to its value. This result provides
the base with which to examine real world reasons why capital structure is relevant,
41

that is, a company's value is affected by the capital structure it employs. These other
reasons include bankruptcy costs, agency costs, taxes, information asymmetry, to name
some. This analysis can then be extended to look at whether there is in fact an optimal
capital structure: the one which maximizes the value of the firm (Baker & Wurgler,
2002)
In their original position, Modigliani-Miller theory advocates that the relationship
between financial leverage and the cost of capital is explained by Net Operating Income
approach They make a formidable attack on the traditional position by offering
behavioral justification for having the overall capitalization rate, k" remain constant
throughout the entire range of financial leverage probabilities. This is because the total
investment value of a corporation depends on its underlying profitability and risk, firm
value unchanging with aspect of changes in the firm's capital structure. Thus, in the
absence of taxes and market imperfections, the value of the firm's total value does not
change no matter how the capital structure is divided into debt, equity and other
securities. The support for this position rests on the idea that the investors are able to
substitute personal for corporate financial leverage. Thus, investors have the capacity to
replicate any capital structure, through personal-borrowing, the firm might undertake
(Horne & Wachowicz, 2005).
Trade-off theory allows the bankruptcy cost to exist. It states that there is an advantage
to financing with debt (namely, the tax benefit of debts) and that there is a cost of
financing with debt (the bankruptcy costs of debt). The marginal benefit of further
increases in debt declines as debt increases, while the marginal cost increases, so that a
firm that is optimizing its overall value will focus on this trade-off when choosing how
much debt and equity to use for financing. Empirically, this theory may explain
differences in DIE ratios between industries, but it doesn't explain differences within
the same industry (Lyandres, 2010).
Now, if capital structure is irrelevant in a perfect market, then imperfections which exist
in the real world must be the cause of its relevance. The theories below try to address
some of these imperfections, by relaxing assumptions made in the M&M model.
51
Net Operating Income (NO I) Approach
Net Operating Income (NOl) approach to capital structure is a theory of in which the
weighted average cost of capital (W ACq and the total value of the firm remain
constant as the financial leverage is changed With this approach, net operating income
is capitalized (discounted) at the firm's overall capitalization rate to obtain the total
market value of the firm. The market value of the debt is then deducted from the total
market value to obtain the market value of the common stock. The critical assumption
with this approach is that the overall capitalization rate, ko, as well as the cost of debt
funds, ki, stays the same regardless of the financial leverage employed. As a firm
increases its use of financial leverage, it becomes increasingly riskier. Besides as long as
ki remains constant, ke, the required rate of return on equity, is a constant linear
function of the debt-to-equity ratio (measured in market value terms). Because the cost
of capital of the firm, ko, cannot be altered through financial leverage, the Net
Operating Income (NOI) approach implies that there is no one optimal capital structure
(Horne & Wachowicz, 2(05).
Traditional Approach
Traditional Approach to capital structure assumes that there exists an optimal capital
structure and where management can increase the total value of the firm through the
judiciOUS use of financial leverage. This approach suggests that the firm can initially
lower its cost of capital and raise its total value through increasing leverage. Although
investors raise the required rate of return on equity, the increase in ke does not entirely
offset the benefit of using "cheaper" debt funds and as a result the weighted average
cost of capital, ko, declines with moderate use of financial leverage. After a point, the
increase in k, more than offsets the use of cheaper debt funds in the capital structure
and /(0 begins to rise. The rise in /(0 is supported further as k, begins to rise. And the
optimal capital structure is the point at which ko bottoms out (Horne & Wachowicz,
20(5).
61

Order Theory
theory to the costs of asymmetric information. It states
companies prioritize their sources of to equity)
according to the law of least effort, or of resistance, preferring to raise equity as a
means /J last debt is is
depleted, then debt is issued; and when it is no longer sensible to issue any more debt,
equity is This theory that businesses to a hierarchy
financing sources and prefer internal financing is preferred
over equity if external financing is required (equity would mean issuing which
meant external ownership' company). the form debt a firm
chooses can act as a signal of its need for external finance. The pecking order theory is
popularized by Myers (1984) when that equity is a less means to
raise capital because (who are assumed to know about true
condition of firm than investors) issue new equity, investors believe that
IS are of over-
valuation. As a result, investors will place a lower value to the new equity
Myers, 2010).
Summing up the Theories
M'odigliani Miller's provocative irrelevance has 1n consider a ble
amount of work on the theory of structure. (1984) proposed the
Trade Theory" of structure. a
ratio is viewed as determined by a trade off the costs and benefits of borrowing, holding
assets and plans constant. costs
literature are bankruptcy costs (e.g. Scott, agency costs (Jensen and Meckling,
1977) of non-debt tax shield (De Angelo and Masulis, 1980). These costs
become especially relevant
subsumed under "Cost of financial d
IS tax shjeld of
implications developed out the
71

are having larger proportion of tangible assets and more growth opportumtles are
likely to hove more debt-ratio. The costs of distress are likely to be higher for firms
whose value depends on grow opportunities and intangible assets. Sometimes firms are
likely to forego investment opportunity due to financial distress. Moreover, if a default
occurs, the loss due to liquidation value of their assets is likely to be more. ii)
Companies like pharmaceutical and information technology have high business risk
issue and less debt. Because, they would be less certain of generating enough income to
utilise their debt tax shields. One important empirical observation inconsistent with the
Static Trade Off Theory is that most profitable firms tend to borrow the least. Myers
(1984) explains the negative relationship between profitability and the debt equity ratio
using what he calls the 'Pecking Order Theory/. ThIS is based on the assumption that
the firms have a preference for internal finance. If internal finance is not sufficient, then
they first issue debt, followed by hybrid securities such as Partly Convertible Bonds,
Fully Convertible Bond and Equity as a last resort. Managers may prefer internal
financing because it relieves them from the disciplining effects of the Security Market.
Moreover, as shown by Myers and Majluf (1984) an issue of equity also requires
Managers to deal with a possible conflict of interest - between existing and new
shareholders. Finally if one accepts the pecking order theory then more profitable firms
would end up with lower debt ratios, because they would be able to finance their
investments through the preferred internal sources and do not have to resort to debt
financing. The pecking order theory also implies that companies with high rates should
have a higher debt ratio since the need for external funds would be higher (G., 2008)
Gorden (1962) found that as gearing increased with size, return on investment was
negatively related to debt ratio. He also confirmed the negative association between
operating risk and debt ratio.
Baxter (1967) reported that leverage would depend on the variance of net operating
earnings. Since business with relatively stable income streams are less subject to the
possibility of ruin l they may find it desirable to rely relatively heavily on debt financing.
On the other handl firms with risky income streams are less able to assume fixed charge
sources of finance. Hence he concluded negative association betvveen variance of net
operating earnings and leverage.

Gupta (1969) conducted a study on the financial structure of American Manufacturing
Enterprises. The focus of the study was analyzing the industry effect and the growth
effect on the financial structural relationship of American Manufacturing Enterprises. It
was a cross sectional study for the year 1961-62. The study confirmed that total debt
ratios were positively related to growth and negatively related to size. He also found
significant industry effect on debt ratio. He further observed that n family pattern of
ownership" is an important determinant of leverage in the paper and allied product
industry.
Toy et al (1974) reported that higher the operating risk companies showed, higher is the
debt ratio. They found that debt ratios were positively related to growth typically
measured as sales growth and return on investment was negatively related to debt
ratio. They also concluded that the corporation size and the industry class do not
appear to be determinants of debt ratio.
Carelton and Siberman (1997) concluded that higher the variability in rate of return on
invested capital, lower will be the degree of financial leverage adopted. Hence it is the
variance, not the rate of return that is the ultimate determinant of leverage They also
found return on investment to be negatively related to debt ratio.
Ferri and Jones (1979) examined the determinants of financial structure. The objective of
their study was to investigate the relationship between a firm's financial structure and
its industrial class, size, variability of income and operating leverage. They found that
the industry class was linked to the firm's leverage, but not in a direct manner as was
suggested in other researches. Secondly, a firm's use of debt is related to its size, but the
income could not be shown to be associated with the firm's leverage. Finally, operating
leverage does influence the percentage of debt in a firm's financial structure and the
relationship between these ru,·o types of leverage is similar to the negative linear form
which financial theory suggests
Bhat (1980) studied the impact of size, growth, business risk, dividend policy,
profitability, debt service capacity and the degree of operating leverages on the leverage
ratio of the firm. He used multiple regression models to find out the contribution of
each characteristic. Business risk (defined as earning instability), profitability, dividend
91

payout and debt service capacity were found to be significant determinants of the
leverage ratio. He used a sample of 63 companies from engineering industry.
Venkatesan (1983) investigated the determinants of financial leverage by analyzing the
relationship between seven different variables and the financial structure of the firms.
The variables included industry categorization, size, operating leverage, debt coverage,
cash flow coverage, business risk, and growth ratio. Industry influence has been
examined on the grouping of firms in various leverages classes and he found a
statistical relationship between industry class and leverage, but the relationship could
not be significant and conclusive. The impact of the remaining independent variables
on the dependent variable was examined in two sample classifications, viz. lntra
industry and Inter-industry through multiple regression analysis. In summation, only
debt coverage ratio was found to be the important variable significantly affecting the
financial structure of the firm.
Mathew (1997) has made an attempt to analyze the relationship between ownership
structure and financial structure with a view to know whether the former has any
impact on the latter. The analysis was based on three hypothetical relationships that
exist between ownership structures on one hand and unsystematic risk, non
manufacturing expenses and profit appropriation policies on the other hand. He
concluded that wherever the management stake is high, leverage will be low and vice
versa and there exists a significant relationship between ownership structure and
financial structure of firms.
Ram Kumar Kakani (1999) in his paper entitled "Determinants of Capital Structure"
attempted to find out the determinants of the capital structure and its maturity in India
and he has analyzed measure of short-term and long-term debt rather than an
aggregate measure of total debt. And he also analyzed the empirical implications of
liberalizations of the Indian Economy' on the determinants of capital structure of the
firms'.
Kotrappa (2000) slacked that the success of a corporation greatly depends upon sound
financing. When the original financing has been sound, a co-operation has less fear for
the future, provided it is given by a competent management. In this write-up, he

attempts to sketch the factories responsible for reduced proportion of debt capital in the
total capital employed. However, the choice between debt and equity sources of capital
for a corporate borrower is greatly influenced by these factors.1) Taxes on Corporate
Incomes 2) Inflation 3) Controlling Interest 4) Capital Market Reforms.
Bradley, Janoll and Kim (2002) found that debt to asset ratio is negatively related to
both the volatility of annual operating earnings and advertising and Research and
Development expenses.
Mohanty (2003) found that leverage is negatively related with profitability and value of
the firm both within an industry as well as within the Indian Economy. It has been
found that companies that spend a large sum of money on advertisement and Research
and Development expenditure arC the least levered.
2.3 L iteratllre ReDieu'
The history of modern theory of capital structure started with the path-breaking paper
of Modigliani and Miller published in 1958. In this paper, they used some restrictive set
of assumptions and contended in their first proposition that the impact of financing on
the value of the firm is irrelevant. The Miller and Modigliani (M&M) propositions assert
that there would be arbitrage opportunities in the perfect capital market if the value of
the firm depends on its capital structure. They also argue that if investors and firms can
borrow at the same rate, investors can neutralize any capital structure decisions the
firm's management may take (home-made leverage). Though their proposition
theoretically sounds good but it is only valid under perfect market conditions (no tax is
one of them) which were not actually possible in real world. They corrected this
proposition in 1963 incorporating the effect of tax on va]ue and cost of the capital of the
firm (Modigliani and Miller'] 963). Their new proposition contends that, in the world of
corporate tax, the value of the firm depends on the variation of the debt level and tax
shield benefit on interest payments. In 1976, Miller brought forward the next version of
111

irrelevance theory of structure. He ca pital structure decisions of
firms with both corporate and personal taxes circumstances are irrelevant (Miller 1977).
develops model. According to this modet optima]
structure does exist. A firm sets its target level moves towards
This theory asserts that a optimal debt-equity ratio is achieved at the
when the marginal present value the tax on is equal to the increase in
value of financial distress costs. Under this theory, a firm's target IS
driven three (i) (ii) costs of distress
and (iii) agency costs. Both tax-based and agency-cost-based models belong to
the as by (1973),
Meckling (1976), Miller (1977), Kim (1978), Bradley, Grossman and Hart (1982), Jarrel
and (1984), Jensen (1986), and Raviv (1990), Stulz (1990) and Chang (1999).
Agency theory developed Jensen and Meckling 1976 also suggest for an optimal
level capital structure by minimizing agency costs arising from the divergent
interest managers with shareholders Meckling (1976)
that either ownership of the managers in the firm should be In
to align the of with that of the owners or use of
motivated to control managers' tendency for excessive perk Jensen
(1986) agency problem associated with free-cash flow.
cash flow problem can be somehow controlled increasing the
or by capital structure, thereby reducing
In
amount
of 1/ free" cash available to managers.
There are several capital structure theories like signaling theory pecking
apply notion of asymmetric information with an attempt to explain the
role asymmetric plays the structure. Ross
12

(1977) laid down the foundations of signaling theory and its various extensionsc He
assumes that managers being the insiders have a better knowledge about the true
distribution of future returns of the firm whereas investors do not
According to 1\055, investors interpret larger levels of leverage as a signal of the firm's
current stable income, high future cash flows and managers' confidence about the
performance of their own firm. Accordingly, Ross (1977) concludes that investors take
larger levels of debt as a signal of higher quality and that profitability (as a proxy of
quality performance) and leverage are thus positively relatedc
On the other hand, pecking order theory, suggested by Myers and Majluf in 1984, who
captured the effect of asymmetric information upon the mispricing of new securities,
says that there is no well defined target debt ratio. They say that investors generally
p<2rceive that managers are better informed of the price sensitive information of the
firms. Investors' perception is such that managers issue risky securities when they are
overpricedc This perception of investors leads to the under pricing of new equity issuec
Sometimes this under pricing becomes so severe that it causes substantial loss to the
existing shareholders. To avoid the problem arising from information asymmetry firms
fuUill their financing needs by preferring retained earnings as their main source of
financing, then debt and finally external equity financing as a last resort Capital
structure is thus arranged by a hierarchy of preferences for the issuance of new capital.
This has been termed as "Pecking Order Theory"c While studying determinants of
capital structure in the context of Bangladesh I have come across the most initial studies
examined in the international level. In a cross sectional analysis Rajan and Zingales
(1995) find that" the determinants of capital structure that have been reported for the
US (size, growth, profitability, and tangible assets) are important in other countries as
well". The analysis by Booth et al (2001) suggests that the developing countries face
more or less same factors in determining capital structure. Recent work by Kremp et at
(1999),

De Miguel and Pindado (2001), and Ozkan (2001) also focuse on the issue of capital
structure decisions, offering better insight on the determinants explaining the target
debt-to-equity ratio. A very recent study by Drobetz and Fix (2003) tested leverage
predictions of the o'ade-off and pecking order models using Swiss data. Confirming the
pecking order model but contradicting the trade-off model, they say that "more
profitable firms use less leverage. Firms with more investment opportunities apply less
leverage, which supports both the trade off model and a complex version of the pecking
order model. Leverage is also closely related to tangibility of assets and the volatility of
a firm's earnings" Recent study carried out by Gaud, Jani, Hoesli, Andre and Bender
(2003) on Swiss companies uses growth opportunity, size, profitability, tangibility,
operating risk as determinants of capital structure. Size, tangibility and risk variables
have a positive impact on leverage whereas growth opportunity and profitability shows
a negative relation. Baral (2004) uses growth rate, size, business risk, dividend payout
ratio, operating leverage, profitability and debt service capacity in his study on listed
companies of Nepal. The first five variables show a positive relation with leverage
whereas the last two proves to have negative relation. Huang and Song (2002) in their
analysis on Chinese company, includes growth rate, size, profitability, tangibility, non
debt tax shield, tax, ownership structure, volatility as determinants of capital structure.
Their study shows that profitability and non-debt tax shield is strongly negatively
related with leverage Volatility, size and ownership of institutes are positively related
whereas tax and management shareholding, as per their expectation, have no
Significant effect on leverage. A very recent study by Shah and Khan in 2007 includes
growth opportunity, size, and profitability, tangibility, earning volatility and non-debt
tax shield as important determinants of capital structure. Their study reveals that
tangibility and size are positively related, where profitability and growth opportunity
are negatively related. Non-debt tax shield and earning volatility appear to have no
significant impact on leverage.
14 I '

At national level, Haque (1989) empirically tested the Bangladeshi firms and finds that
ca structure do significantly vary among industries and it has no
on firm's profitability, dividend and market Chowdhury (2004), based on
Bangladeshi and Japanese panel data, did another study on capital structure
with finds growth
rate, profitability and operating leverage to significantly aifect capital structure choice.
15 I

Chapter 3
An Overview
3.1 Industry
The major markets for engineering are mostly domestic and sector
most to use local partners!
rather than partners from other developing countries. It also noted that
the booming market in Bangladesh, IS a
for pipes cables and steels, a number of new cables and pipes plants have been built and
lTIOre are cable and steel plant development is a
usually specialized contractors. It should also be noted that
of developmen t of road and transport system, there is a for
is an appliances.
Currently! the main trade flows in the engineering sector are mostly one with
. Most inflows are
in the form of su pplier' s credits debt financing as the international oil companies
make capital production, while energy
develop
The engineering industry covers a broad range sub-sectors! with potential
prospects
number of the
that have
with the leather
found
if are
prospects for engrneenng industry have been found in a
authorized by the Bangladesh Government in order to upgrade the
. Owing to pollution Ll..;;>.;:'VLU ....
metal working industries, a of BMRE projects
financial assistance being made available through national banks
16 I

and the Asian Development Bank under the BMRE scheme of the government. The
to a of pu bEc sector
manufacturing industries, which
modernized or
attract foreign investment and allow them to be
no European company contacted appeared to
interested in any public sector any industry since all
of public sector sums of money to the public sector banks,
which would have to were found in the
working business, where the Pran Group of companies were found to have
to the to million to
Rangpur Foundry Limited to produce tube wells, rice mill spares, pumps and
imported equipment, from India. same
company had originally been set up 1989 to wells, plastic
and engine Also in the building materials sector, there appeared to be
some interest European su ppliers to to
Bangladesh to set up the manufacturing of hollow concrete blocks, roof tiles and floor
tiles.
3.2 N arne of the Engineering
III
III
III
III
III
III
III
II
Aftab Automobiles
Anwar Galvanizing Limited
Atlas Bangladesh Limited
Bangladesh Autocars Limited
Bangladesh Lamps
Bangladesh Thaj Aluminium Limited
BSRM Steels Limited
Stock
17 I

"
•
..
II
"
II
II
..
"
"
..
"
.II
•
•
1.
Deshbandhu Polymer
Eastern Cables
Golden Son
Monno Jutex Limited
Monno Jute Stafflers Limited
Navana CNG Limited
National Polymer Limited
National Tubes Limited
Olympic Industries Limited
Quasem Drycells Limited
Rangpur Foundry Limited
Renwick Jajneswar & Company Limited
Alam Cold Rolled Steels Limited
Bangladesh Limited
companies I have selected 25 % companies
are:
Bangladesh Limited
Automobiles Limited
Bangladesh Limited
Limited
Monno Jute Stafflers Lim.ited
industry.
18 I
6.
3.3 Bangladesh Limited
motor cycles, and domestic and electric povver ca bles
and Dlarketing color television,
Bangladesh. The company also
Involves DVD players, home systems, kitchen
computers, motorcycle, sewing power supply, refrigerators, freezers,
fan, microwave oven, electric oven, vvashing machine, and
seWIng as as consumer electronics household appliances. It
111arkets products under various brands, incl uding Singer, SalTISung, WhirlpooL Haier,
es,Moulinex, Sebec, Tefat through the d channeL as wen as
through its own retail chain shops under the name SINGER PLUS. The company vvas
in 1979 and is based Dhaka, Bangladesh. Bangladesb IS a
subsidiar:y of The Singer Bhold B. V.
Aftab Automobiles \tvas In 1967 as a 'Private
Limited Company. In 1981 the Company registered itself as a Public Limited Company
which is one of the au assembling plants in the private sector.
Registered Office of the Company is located at 1251 A, Motijheel Commercial Areal
Dhaka-1000. The Company was with Dhaka Stock
Chittagong Stock Exchange Limited In 1996 respectively. The
activities of the throughout the period were assembling of Toyota
Land Cruiser soft topl Pick-up, Prado, Hino Hino Mini I Truck
with a production Capacity of 2400 units of in 3 shifts in
Unit. But since inception,
demand. The Company has
IS shift
four units namely Body Building Unit Paint Unit
19 I

Battery Unit & Furniture Unit and the commercial production of which started w.e.f.
May 5, 1997, November 01, 1999, January 03,2002 and May 01, 2002 respectivel y.
3.5 Atlas Bangladesh Limited
Atlas Bangladesh Ltd. imports and distributes motorcycles and parts The company was
tounded in 1966 and is based in Cazipur, Bangladesh. Atlas Bangladesh Ltd. is a
subsidiary of S'mgladesh Steel & Engineering Corporation.
3.6 Eastern Cables Limited
Eastern Cables, Ltd. manufactures cables and conductors in Bangladesh. Its products
include PVC insulakd and PVC shea ted single cort' and multicore low tension domestic
cable; and controL flexible, and power cables with copper conductor. The company also
produces armored and screened cables. In addition, it manufactures bare and insulated
all aluminium conductor and aluminium conductor steel reinforced. Eastern Cables
Ltd. with its office and factory at Patenga, Chittagong was established in 1967 and
started its commercial production on 1st March 1971 for manufachning of cables and
conductors. Eastern Cables Limited, a subsidiary Company of Bangladesh Steel &
Engineering Corporation (BSEC) is the biggest cables and conductor manufacturer in
Bangladesh. The range of its products not only includes PVC insulated and PVC
sheated single core and multi core low tension domestic cable but also control, flexible
and power cables with copper conductor having continuous permissible voltage grade
up to 12 KV. It also enjoys the honor of being the pioneer in this country in the
production of armored and screened cables. The different sizes of bare and insulated All
Aluminium Conductor (AAC) and Aluminium Conductor Steel Reinforced (ACSR) are
also being manufactured here.
20 I

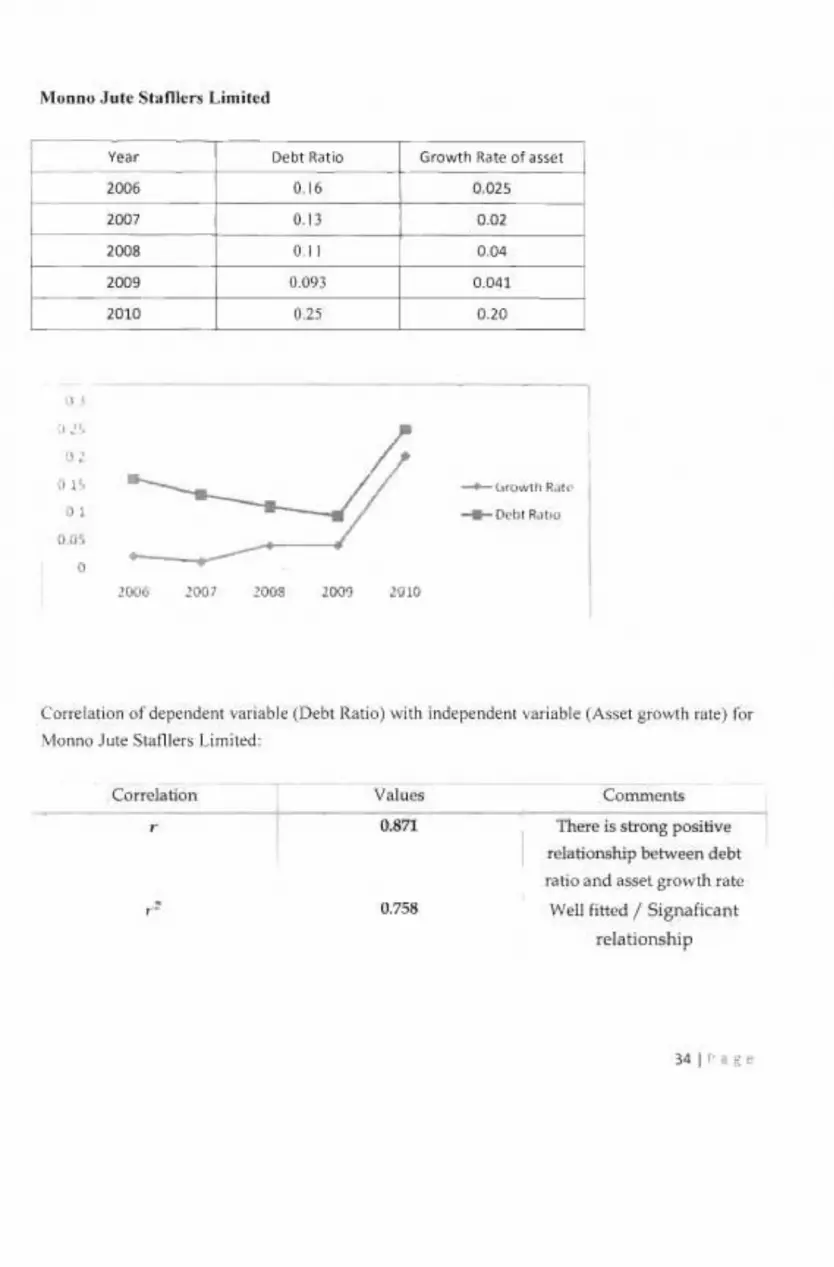
3.7 Monno Jute Stafllers Limited
Monno Jute Stafllers Limited enlisted with Dhaka Stock Exchange in 1982. Authorized
capital of Monno Jute Stafllers Limited is takal0 million.
3.8 Bangladesh Thai Aluminium
Bangladesh Thai Aluminium Limited (BT A) designs and manufactures anodized and
powder coated aluminum products. It offers aluminum doors, windows, curtain walls,
railway coach windows, ladders, bolts, and accessories. The company provides
aluminum fabrication, extrusion, coating, and wrapping services. BTA was founded in
1979 and is based in Dhaka, Bangladesh.
21 (

Chapter - 4
Methodology of the Study
'I'he methodology provides an understanding of how the study was conducted and
organized in order to obtain, analyze and present the information, This study follows
uncomplicated procedures which are discussed below:
4.1 Data Requirement
To identify the capital structure of specified companies, this report required information
auditors' report from different annual reports, yearend stock price, Latest five year's
information was collected for 6 selected companies, Selected companies are:
.:. Singer Bangladesh Limited
.:. Aftab Automobile Limited
.:. Atlas Bangladesh Limited
.:. Bangladesh Thai Aluminium Limited
.:. Monno Jute Stat1lers Limited
.:. Eastern Cables Limited
4.2 Data Sources
• Annual Reports of the companies: Earnings before interest and taxes, EPS,
Interest, Total asset, Total long term debt, Total equity and Fixed cost
• www.bdstockprice.com: Year-end stock price
• www.dsebd.org
• Dhaka Stock Exchange (Other Data)
Most of the annual reports were collected from Dhaka stock exchange library, Some
recent annual reports were collected from specific company websites, Stock price data
for different companies are depends on their face value,

4.3 Data Type All information used in this study was from secondary data sources. So, no primary
data is included in this report.
4.4 Statement of Hypotheses This study has tested the fonowing null hypotheses on relation between the
independent variables and capital structure of the selected companies:
H 01 : There is no significant relationship between the asset growth rate and debt ratio.
N v'O : There is no significant relationship between the operating leverage and debt ratio.
d <13 : There is no significant relationship between the financial leverage and debt ratio.
H 04: There is no significant relationship between the tangibility asset ratio and debt
ratio.
The study has also tested the following hypotheses:
!-i 05 : There is no significant relationship between the debt ratio and cost of capital
H 00: There is no significant relationship between the debt ratio and market price of
share
4.5 Position of Capital Structure The analysis of capital structure has been made by using following ratios:
i) Debt Equity Ratio
This ratio is calculated as:
ii) Debt to Total Asset Ratio
This ratio is calculated as:
Toral Debt tal Asset
23 I ;'~

ii) Long-term Debt Ratio
Long Te-rm Debe This ratio is calculated as: Toral Asset
The capital structure of each company has been determined using the above ratios. The
parameters of the above six companies have been used to determine the industry
average. The capital structures of the companies are then compared with the industry
average.
24 I

-5
of Capital
In the fonowing table shows the overall position of assets and capital structure I Debt-Equity
Ratio, Debt to Total Assetj and Long-Term Debt Ratio of the selected engineering industries as
at the end the 2006 the selected six compan..ies, which
is used analyzing the position of individual
Table 5-1: Overall Capital Structure engineering 2006 [Figu in million Taka]
Singer Aftab Atlas Bangladesh Monno Eastern Industry Automobile Thai Jute Cables Average
Limited Limited Limited Aluminium lers Limited Limited
Debt- 0.21 0.17 6.48 0.33 0.42 1.76 Asset Ratio
Debt- 0.]97 0.08 0.10 0.80 0.16 0.24 Equity Ratio
0.12 0.01 0.01 0.083 0.04l 0.094 0.06 term Debt Ratio
Structures of Engineering
In the following table shows the overall position of assets and capital structure, Debt-Equity
Ratio j Debt to Tota! Asset, and Long-Term Debt Ratio of the selected engineering industries as
at the end of the year 2007 which
is used for analyzing the position
25 e

Table 5-2: OveraU Capital Structure of Selected engineering Companies of 2007
[Figure In milhon Taka]
Limited
Limited
Ratio
3 0.10 0.28 0.32
Ratio
0.009
Debt Ratio
5.1.3 Analysis of CapitaJ Structures of Engineering Industry of 2008
In the foUowing table shows the overall position of assets and capital structure, Debt-Equity
Ratio, Debt to Total Asset, and Long-Term Debt Ratio of the selected engineering industries as
at the end of the year 2008 and also the average of all these of the selected six companies, which
is used for analyzing the position of individual companies:
26 I

T.able 5-3: Overall
DebtEquity Ratio
DebtAsset Ratio
0.00764
5,1.4 Analysis of
Ratio, Debt to
at the
is used analyzing the posi non of
Table 5-4: Overall Capital Structure
Debt-Asset Ratio
Debt-Equity Ratio
Long-term Debt Ratio
Singer Bangladesh
Limited
0.29
0,1437
0.0366
Aftab Atlas Automobile Bangladesh
Limited Limited
0,94 O.
0.35 0.229
0.007 0.0055
engineering Companies of 2008
0,16
0.045 0,028
[Figure in million Taka]
0,0392
Industry of 2009
industries as
of 2009
[Figure in million Taka)
Industry Average
0.48
0,088 0.035

I
5.1.5 Analysis of Capital Structures of Engineering Industry of 2010
In the following table shows the overall position of assets and capital structure. Debt-Equity
Ratio, Debt to Total Asset, and Long-Term Debt Ratio of the selected engineering industries as
at the end of the year 2010 and also the average of all these of the selected six companies, which
is used for analyzing the position of individual companies:
Table 5-5: Overall Capital Structure of Selected engineering Companies of 2010
[Figure in million TakaJ
Singer Aftab Atlas Bangladesh Monno Eastern Industry Bangladesh Automobile Bangladesh Thai Jute Cables Average
Limited Limited Limited Aluminium StaflIers Limited Limited
Debt- 0.12 0.11 030 0,39 0.49 0.43 0.24 Asset Ratio
Debt- 0.0007 0.12 0.15 027 0.25 0.23 0.13 Equity Ratio
Long- O 0.0054 0.0033 0.037 0.024 0.083 0.019 terrn Debt Ratio

the
experiences controversy. According to agency cost theory, agency cost is likely to
wider choice of future investment.
grovvth rate is negatively related with long-term level (Jensen and Meckling 1976).
IS empirical done by Kim and (1986),
Titman Wessels (1988), et (1995) (1995)
rejected this relation (1986). According to trade-off theory, companies with high
growth use debt In case of bankruptcy, the
high growth to zero, (Myers, 1984; Williamson, 1988 and Harris
and Raviv/ 1990). Firms with growth prospects should use debt because it a
role (Jensen/ Stulz, 1990). Pecking theory, contrary to
cost theory, shows positive relation between leverage of growing
This is because a higher growth rate implies a higher demand for funds,
and/ ceteris a greater on preferred
source of debt (Sinha 1992)/ (Myers 1984). Thus, the pecking order theory suggests a
of in capital structure of the growing companies than that of
stagnant no-growth companies. However, Chaplinsky and Niehaus (1990),
(1993)/ got the contrary to the pecking order theory. Chowdhury (2004)
growth opportunities and but found a
negative relationship between the two. A common proxy for growth opportunities is
compounded growth in assets last
We will HOl l'f r::': ~ 050 , .
have to find the relationship between Asset Growth Rate and Debt Ratio of
selected engineering
29 I ;
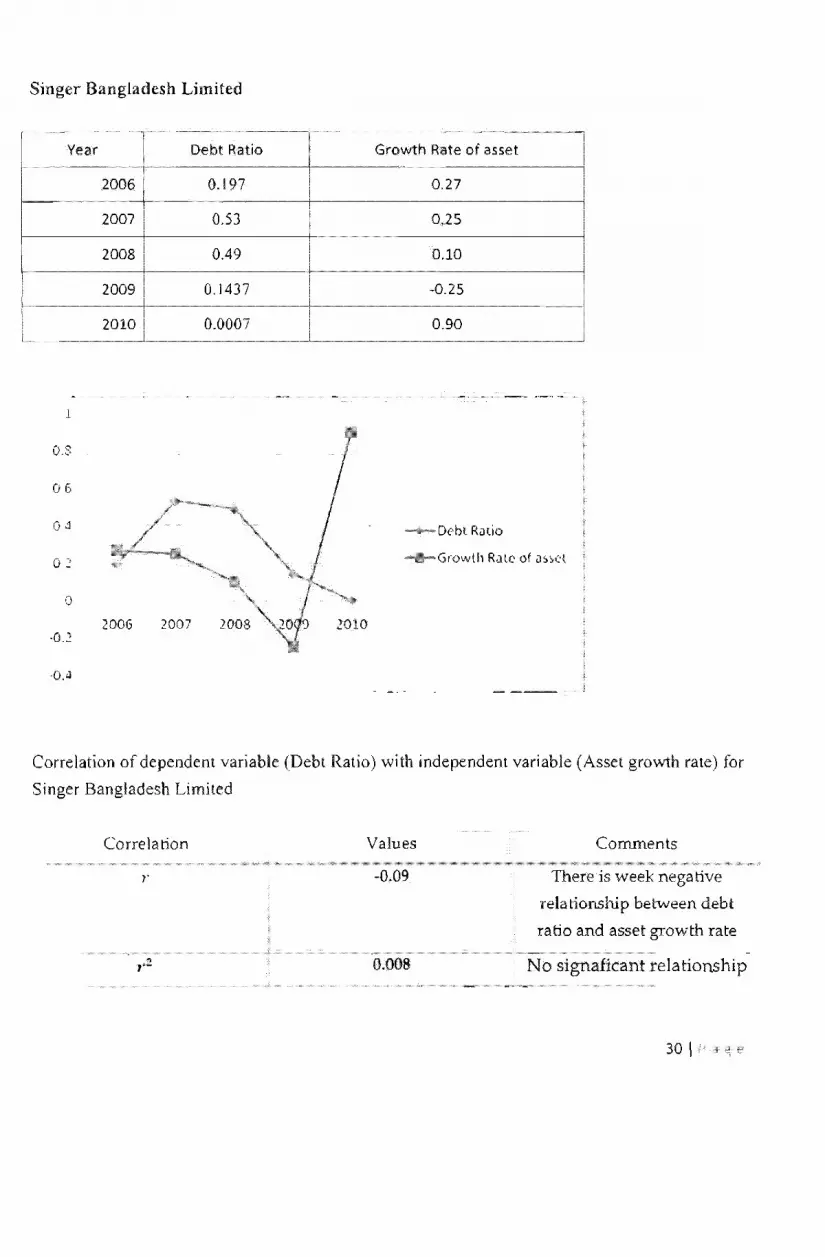
Singer Bangladesh Limited
T··········-~·······
Year Debt Ratio Growth Rate of asset
2006 0.197 0.27
2007 0.53 0.25
2008 0.49 0.10
2009 0.1437 -0.25 -
2010 0.0007 0.90 L .......
1
0.8
06
D('bt R,Jlio
0::
o
·0.2
o.~
Correlation of dependent variable (Debt Ratio) with independent variable (Asset growth rate) for
Singer Bangladesh Limited
Correlation Values
-0.09
., ,-- 0.008
Comments
There is week nega tive
relationship between debt
ratio and asset growth rate . -
No signaficant relationship
30 \

Aftab Automobile Limited
Year Debt Ratio Growth Rate of asset
2006 0.08 0.01
2007 0.09 ~0.01
2008 0.4 2.20
0.35 0.10 0.12 0.70
25
2
0,5
o 2006 1007 2008 2009 2010
-05
Correlation of dependent variable (Debt Ratio) with independent variable (Asset growth rate) for
Aftab Automobile Limited:
Correlation Values
r ..0.621
0.385
Comments
There is week negative
relationship between debt
ratio and asset growth rate
No signaficant relationship
31 I p

Atlas Banglades h Limited
0' OJ, OJ
o J5 OJ
02:, 0.1
o 1 S
01 005
o
Year
2006
2007
2008
2009
2010
2006 2007
Debt Ratio Growth Rate of asset
0.10 0.05 0.10 0.07 0.15 0.14
0.229 0.44 0.15
0.02
-.-Growth R.ll l'
2008 2001) 2010
Correlati on of dependent variable (Debt Ratio) with independent variable (Asset growth rate) for
Atlas Bangladesh Limited :
Correlation Values
-0.879
0.772
Comments
There is strong positive
relationship between debt
ratio and asset growth ra te
Well fi tted / Signaficant
rela tionship
321 Pdge

Bangladesh Thai Aluminium Limited
Year Debt Rat io Growth Rate of asset
2006 0.80 -0.05
2007 0.79 0.05
2008 0.35 1.55
2009 0.34 0.90
2010 0.27 0.30
1 8
1.6
" 1.2
1
OS -+-Grow\h Rate
0 6 ___ Debt R;J \lo
OJ
0' 0
-o.} 2006 1007 ~OOg 100'j 1010
Correlation of dependent variable (Debt Ratio) w ith independent variab le (Asset growth rate ) for
Bangladesh Thai Aluminiu m Limited:
Correlation Values
-0.676
, .2 0.457 1
Comments
There is week negative
relationship between debt
ratio and asset growth rate
Not well fitted / No
signaficant relationship
33 I i' fl f. P
'-,--M' -
r--~ ""
, ." . . J! '
" '" o
-
.
"""
Do<Ot ft,, <> Gro"'t~ ~ . .. of " • ., - ~
0" om,
'" OW
," 0 .•
0.(1'1) 0."'1
'" 0 _10
",0
(", .. I. "on of de.,.oo. .. ,,;,,,.b l, (D<bt Ita,ic) with ioo.p<oo.n, ,", i"l>I. (A"" IVO'''" ""j for
\ t"""" J "'" sum..,., l "",,<>.1
V.I ....
0.=
~" ~ is strong pooiliv.
...... HonaNp I>etwffn deb<
raM.tId ....... gto,,-th ,.'"
W~ll f;"'-'<.I/ Signalica nt
relatlOnshlp

Eastern Cables Limited
-~
Year Debt Ratio Growth Rate of asset
2006 0.02
2007 0.15
0.01 -
2009 13 -0.07 :-
2010 0.03
03
o
2007
0.1
Correlation of dependent variable (Debt Ratio) with independent rale) for
Cables LImited:
Correlation
is strongpositive
relationship between debt
ratio and asset growth rate
Well fitted / Signaficant
rela tionshi p
35 I

Correlation of dependent variable (Debt Ratio) wilh independent variable (Asset growth rate) for
engineering industry of Bangladesh
Here. /" -
reI a tionship.
Values
" 0.05
0.002
Comments
There is week positive
relationship between debt
ratio and asset growth rate
Not fitted I No
signaficant relationship
0.05 which means Debt Ratio and Market Price of Share have week positive
~ , H And r-:::: 0.002 which is less than 0.5 (r- < 0.002). We can not reject C1. SO There is no
signaficant relationship between Debt Ratio and Market Price of Share.
From the above it can be concluded that the relationship between debt ratio and asset
growth rate is weekly positive but the relationship is not significant in case of engineering
industries of Bangladesh.
36 I "

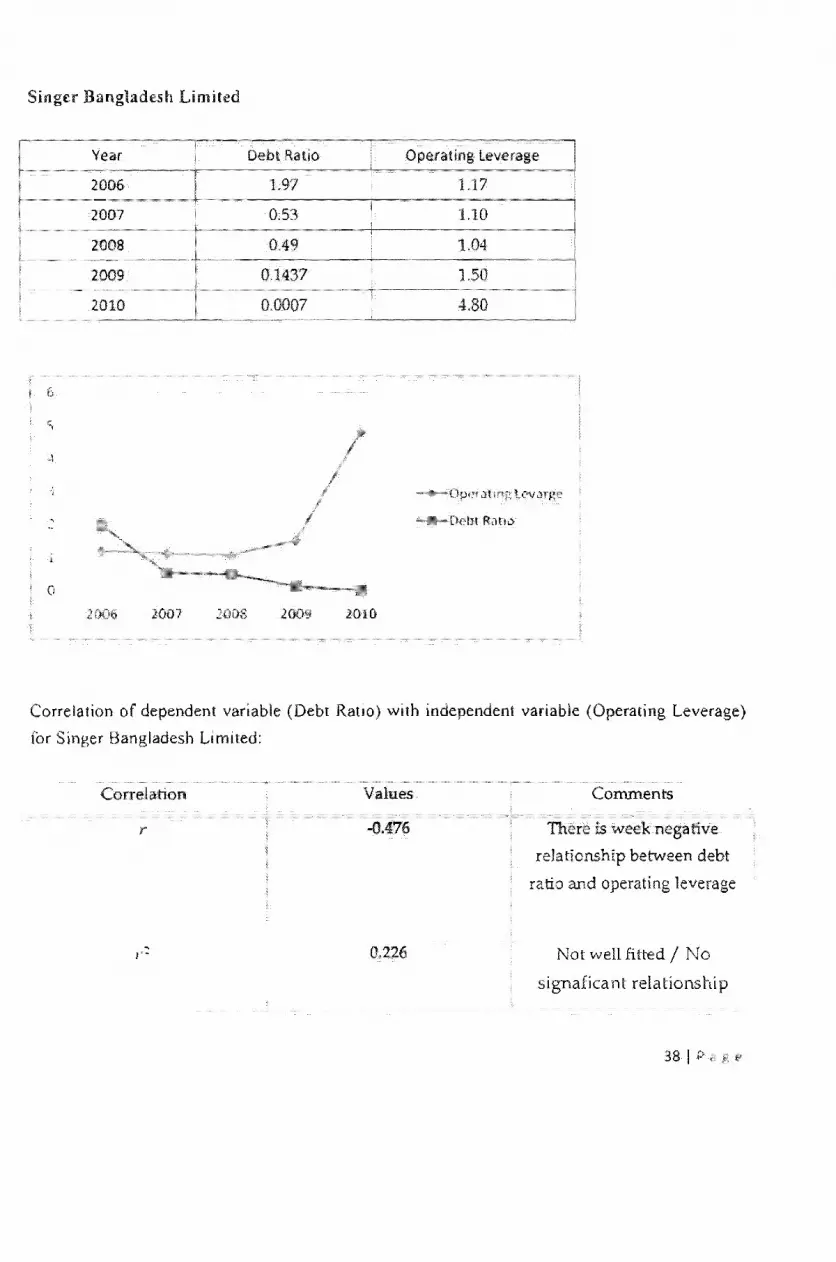
5.3 Relationship between the Operating Leverage and Debt Ratio
Operating leverage is defined as the use of fixed costs in the operation of a firm. A firm
has a high degree of operating leverage if it employs a greater amount of fixed costs and
a small amount of variable costs and vice versa. Operating leverage affects the capital
structure. The high degree of operating leverage i.e. use of higher proportion of fixed
cost in the total costs over a period of time can intensify the variability in future
earnings. Both the bankruptcy cost theory and agency cost theory predict the negative
relation between operating leverage and debt level. As per bankruptcy cost theory,
higher operating leverage enhances the chance of business failure and the greater
amount of bankruptcy costs to be incurred. From this point of view, trade-off theory
says that high degree of operating leverage raises the marginal costs of debt and lowers
the level of debt as welL Considering the high chances of bankruptcy costs to be
incurred, pecking order theory also suggests that a firm should use contractually
obliged debt less and rely more on retained earnings. Thus, all these theories suggest
that as operating leverage increases, the debt level in capital structure of the enterprises
should decrease. Chowdhury (2004), in his study carried on both Japan and
Bangladeshi firms, also found a result consistent with the prediction drawn by above
mentioned theories. The proxy for the variable is the ratio of the percentage change in
EBIT to the percentage change in sales,
We will reject H 02 ,if r; :> 050
We have tried to find the relationship between Operating Leverage and Debt Ratio of
selected engineering industry:
2007
200B
2009
h mired
Dt:ln RatIo
2007 2010
Correlation of Ratio) with independent variable (Operating Leverage)
for S Li
r
Comments
is week negative
reJationship between debt
ratio and operating leverage
Not well fitted / No
signaficant relationship
38 I v

,
i
Aftab Automobile Limited
4
l, 'j
3
2 S
.2
1 S
u
Year
2006
2008
2009
2010
200G
Debt Ratio
0.08
0.09
0.40
_c ...........
2007 1003 2000
Operating Leverage
3.45
3.70
3.61 -
2.10
2.047 . ............
D",!)t R.)lIO
2010
Correlation of dependent variable (Debt Ratio) with independent variable (Operating Leverage)
for Aftab Automobile Limited:
Correlation Values
-0.29
0.084
Comments
There is week negative
relationship between debt
ratio and operating leverage
Not well fitted / 'Jo
signaficant relationship
39 I

Atlas Bangladesh
2008
2010
1
(\
Correlation
for Atlas
2DOi
0.10
0.10
0.15
0.229
0.15
2008 2000
variable (Debt
Limited:
1.75
1.55
2.30
4.60
3.20
2010
There is strong
relationship between
ratio and operating
Well fitted /
relationship
40 I

Bangladesh Thai Aluminium
4.')
4
1 ')
1
0.5
o
Year
2006
2007
2008
2009
2010
2006
Correlation of
2007
for Bangladesh Thai
r
2008
nlUm
Ratio Operating Leverage
0.2
0.78
2.8
4.1
Debt Rallo
2009 2010
Ratio) with independent variable (Operating
Well /
relationship
41 I r

Monno Jute Stafllers Limited
r--
} C J,J
],
.1
o
Year
2006
2007
2008
2009
2010
2006
Debt Ratio
0.16
0.13
0.11
0.093
0.25
2007 .wos 2009
Operating leverage
1.9
0.2
2.2
0.3
3.011
2010
Correlation of dependent variable (Debt Ratio) with independent variable (Operating Leverage)
for Monno Jute Stafllers Limited:
Correlation Values
" 0.727
0.529
Comments
There is strong positive
relationship between debt
ratio and operating leverage
Well fitted / Signaficant
relationshi p
42 I

I
Eastern Cables Limited
Year Debt Ratio Operating Leverage I
2006 0.24 1.98
• 2007 0.28 2.001
2008 0,26 2.008 I
2009 3 12.1
Debt Rdllo
Correlation of dependent variable (Debt Ratio) with independent variable (Operating Leverage)
for Eastern Cables Limiled:
Correlahon Values
r ..0.724
Comments
There is negative
relationship between debt
ratio and operating leverage
Well fitted / Signaficant
relationship
43 \
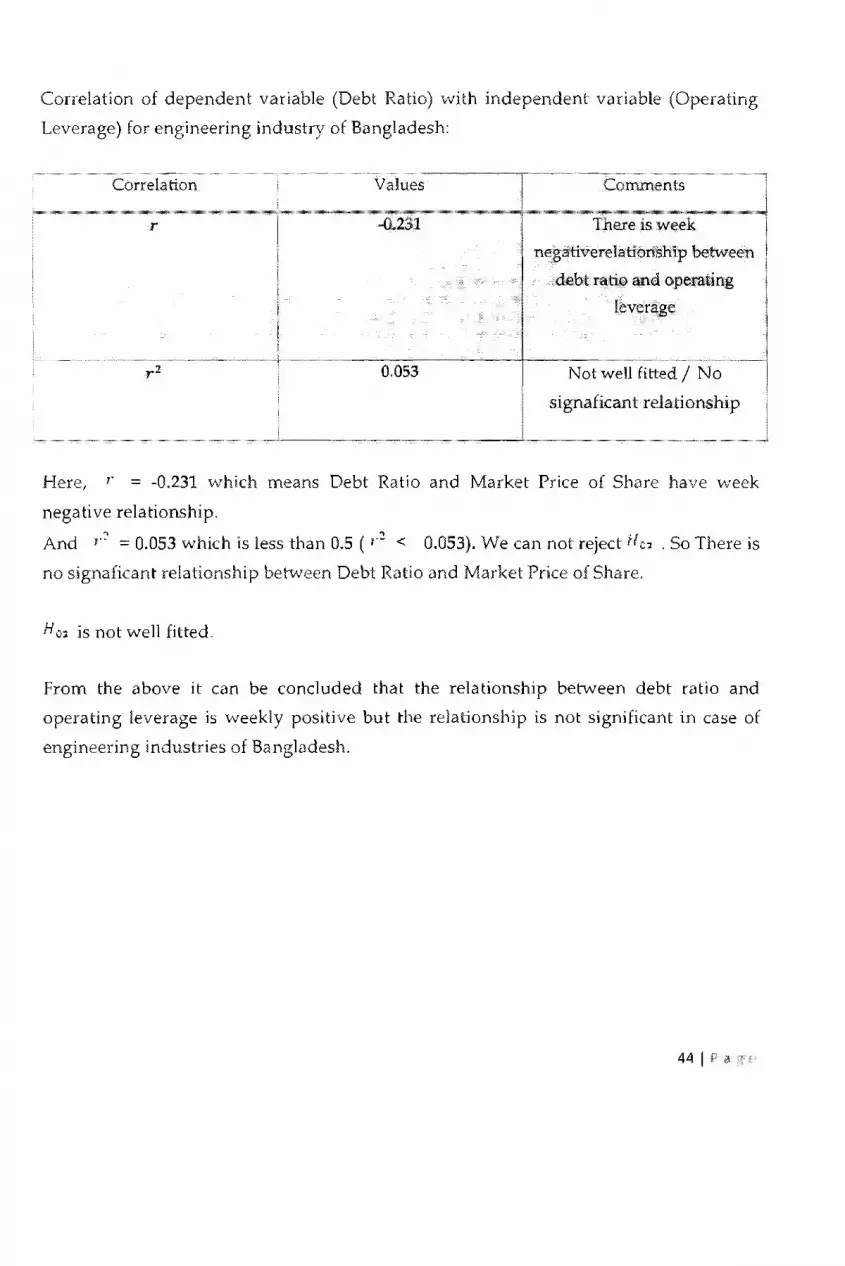
Correlation of dependent variable (Debt Ratio) with independent variable (Operating
Leverage) for engineering industry of Bangladesh:
Correlation Values
r
0.053 ., r-
Comments
is week
negativerelationship behveen
debt and operating
leverage
Not well fitted / No
signaficant relationship
Here, r ::: -0.231 which means Debt Ratio and Market Price of Share have week
negative relationship.
And /.::'::: 0.053 which is less than 0.5 (,.:! < 0.053). We can not reject ffcJ . So There is
no signaficant relationship betvveen Debt Ratio and Market Price of Share.
H O~ is not wen fitted.
From the above it can be conduded that the relationship betvveen debt ratio and
operating leverage is weekly positive but the relationship is not significant in case of
engineering industries of Bangladesh.
44 I
5.4 Relationship between the Financial Leverage and Debt Ratio:
The degree to which an investor or business is utilizing Borrowed money. Companies
that are highly leveraged may be at risk of bankruptcy if they are unable to
make payments on their debt; they may also be unable to find new lenders in
the future. Financial leverage is not always bad, however; it can increase the
shareholders' return on investment and often there are tax advantages associated with
borrowing.
A financial leverage is a use of borrowed money to achieve more efficient capital
structure. A borrowed capital is cheaper than equity capital most of the times. So usage
of borrowed money makes weighted average capital cost (WACC) lower if done
properly.
[n corporate finance financial leverage is used for development of an activity or
acquisitions. Most big companies are using borrowed money to grow larger. The bigger
share of borrowed capital, the higher financial leverage and risk is. Usually such ratios
are used to measure company's indebtedness level.
Tn investment financial leverage mostly is used by hedge funds, also by some private
investors. Repo contracts or margin trading are main instruments to use financial
leverage in an investment portfolio. Financial leverage in investment may help to
achieve faster results when market is growing, but it extremely risky in volatile
markets.
We will reject ''-/0' • if r 1 ? 0.50
We have tried to find the relationship between Financial Leverage and Debt Ratio of
selected engineering industry:
45 I ;'
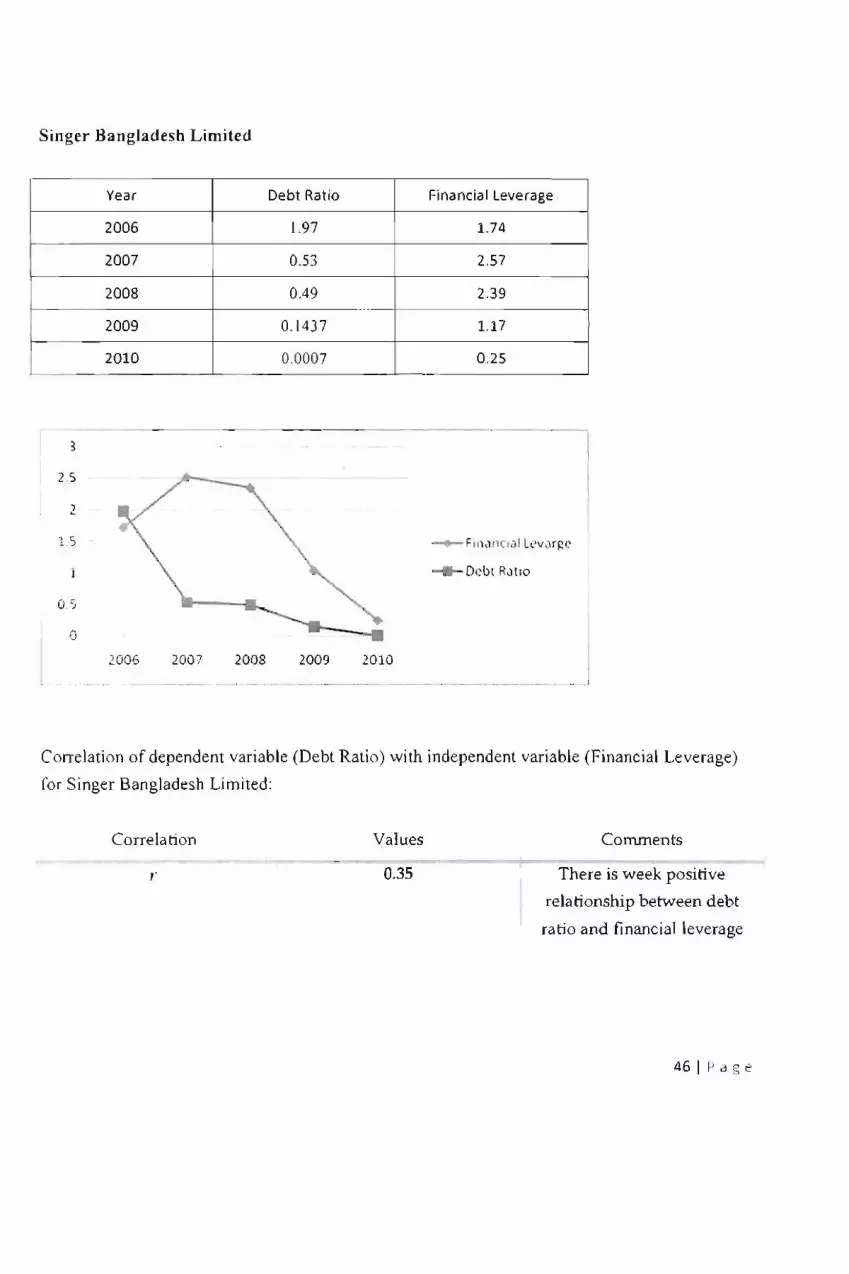
Singer Bangladesh Limited
2.5
2
U' c. )
Q
Year
2006
2007
2008
2009
2010
2006 2007 2008
Debt Ratio Financial Leverage
1.97 1.74
0.53 2.57
0.49 2.39 -.-
0,1437 1.17
0.0007 0 .25
200') 2010
Correlation of dependent variable (Debt Ratio) with independent variable (Financial Leverage)
Cor Singer Bangladesh Limited:
Correlation Values
,. 0.35
Comments
There is week positive
relationship between debt
ratio and financial leverage
46 I I'd t'

r
Aftab Automobile Limited
1.6
14
12
0.8
D .• !
(J
Year
2006
2007
2008
2009
2010
200G ~003
Debt Ratio
0.08 1.28
0.09
0.40
2009 2010
Correlation of dependent variable (Debl Ratio) with independent
for Aftab Automobile Limited:
Correlation
r
/
471

., ,--
Atlas Bangladesh Limited
2006
2007
J C .. ,
2
1.')
1
0.5
2006 2007
0.019
Debt Ratio
0.10
0.10
0.15
0.229
0.15
1009 .lOW
Not wen fitted / No
signaficant relationship
ncial Leverage
2.73
2.78
1.50
0.80
Correlation of dependent variable (Debt Ratio) wi th independent variable (Financial Leverage)
for Atlas Bangladesh Limited:
Correlation Values
'" -0.868
Comments
There is strong negative
relationship between debt
ratio and financial leverage
48 I P

Bangladesh Thai Aluminium Limited
Year Debt Ratio
2006
2007
2008
2009
2010
o 2008 200')
0.753
2010
0.82
0.57
0.54
0.31
0.29
Well fitted / Signaficant
relationship
Correlation of dependent variable (Debt Ratio) with independent variable (Financial Leverage)
of Bangladesh Thai Aluminium Limited:
Correlation
r 0.833
Comments
There is strong positive
relationship between debt
ratio and asset growth rate
49 II

Monno Jute StaflJers Limited
Year Debt
7
6
S
'-1
3
2
1
o
2006
2007
2008
2009
2010
2006 2007
-0.16
0.13 ""
0.11
2008 2009
Correlation of dependent variable
for Monno Jute Statl Limited:
Correlation
2010
Well fi tted /
relationshi p
Financial Leverage
5.92
5.98
0.01
0.03
2.21 •
Ratio
with independent variable (Financial Leverage)
Values Comments
so I

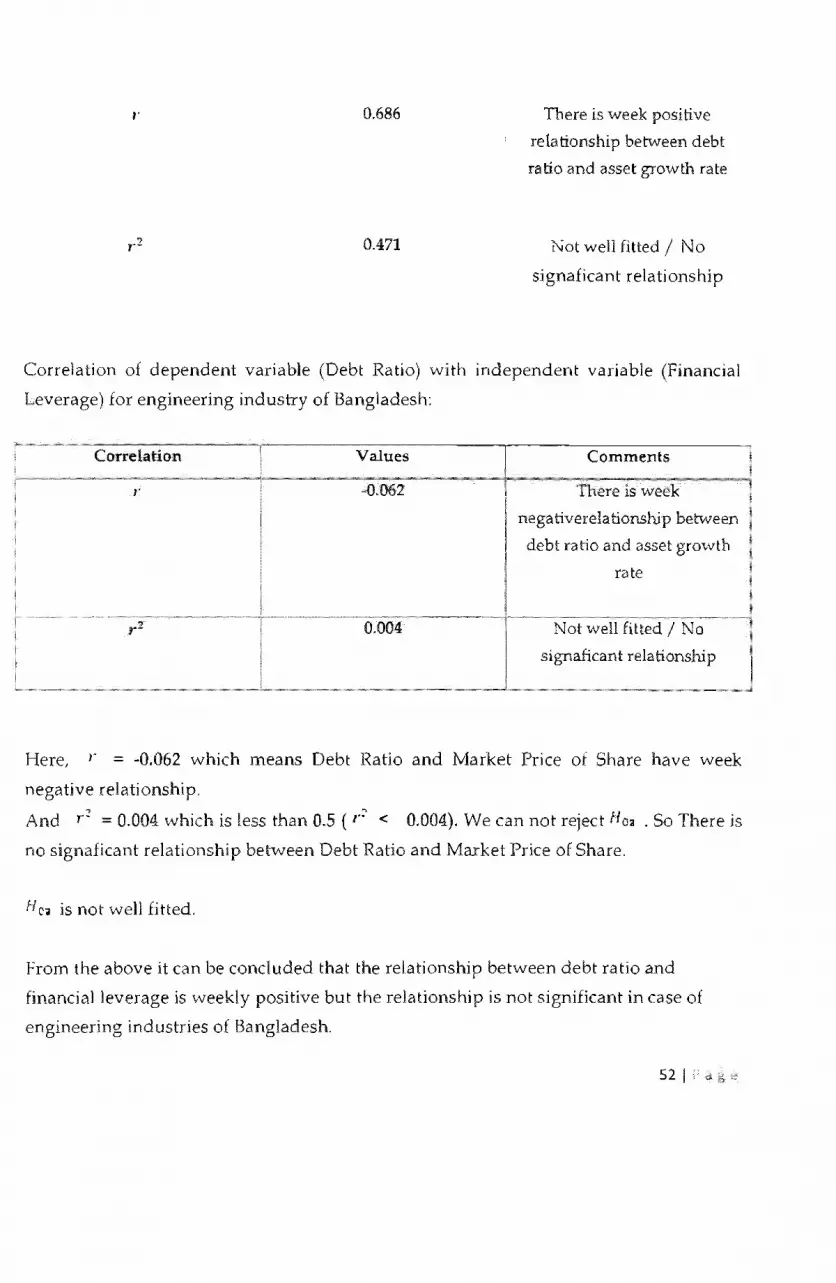
Eastern Cables Limited
-l
"
o.s o
2006
2007
2008
2009
2010
2007 20QS
0.26
0.213
0.23
2000
0.241
0.058
~OlO
2.23
1.51
There is week positive
relationship between debt
ratio and asset growth rate
Not well fitted / No
signaficant relationship
Correlarion of dependent variable (Deb[ Ratio) with independent variable (Financial Leverage)
for Eastern Cables Limited:
Correlation Values Comments
511
;
" 0.686
0.471
There is week positive
relationship between debt
ratio and asset growth rate
!\lot well fitted / No
signaficant relationship
Correlation of dependent variable (Debt Ratio) with independent variable (Financial
Leverage) for engineering industry of Bangladesh:
Correlation Values Comments
r -0.062 There is week
negativerelationship between
debt ratio and asset growth
rate
,.2 0.004 Not well fitted / No
signaficant relationship
Here, r = -0.062 which means Debt Ratio and Market Price of Share have week
negative relationship.
And r~ = 0.004 which is less than 0.5 (r': < 0.004). We can not reject H03 . So There is
no signaficant relationship between Debt Ratio and Market Price of Share.
He. is not well fitted,
hom the above it can be concluded that the relationship between debt ratio and
financial leverage is weekly positive but the relationship is not significant in case of
engineering industries of Bangladesh.
52 I

Relationship between the
Capital structure theories generally
Jensen and
and capital
to riskier investment after
to shareholders to exploit to the option nature
assets are high, then these assets can be as collateral,
of suffering such agency costs of debt". a
to give rise to high leverage ratio. The trade-off
Moreover, liquidation value of tangible assets
assets in the event of bankruptcy. Williamson (1988)
suggest leverage should increase with liquidation value
leverage is positively correlated with tangibility.
well-known empirical studies like Marsh {1982},
Lang (1988), Rajan and Zingales (1995), Wald (1999).
a firm with more tangible assets has
says that less information asymmetry
and lower dependence on debt thus
information
assets and leverage (Harris and Raviv, 1991).
selected as a proxy for tangibility of assets.
ted to
as the
wealth from
tangible
risk
assets is expected
assets to
prediction.
intangible
Ra v iv (1990)
that
by several
and
theorYI
theory
ty
assets is
53 I

vVe will reject H o. I if r· ~
We have tried to
Debt Ratio
Singer Bangladesh
Year
2006
;W08
2009
2010
2,5
1.S
05
between Tangible Asset to Total Asset
industry:
Ratio Tangibility Ratio
1.97 0.54
0.18
0,49 0.21
0.1437 0.22
0.0007 0,16
RallO
Debl Ratio
~006 2007 2008 200~ 2010
and
S4
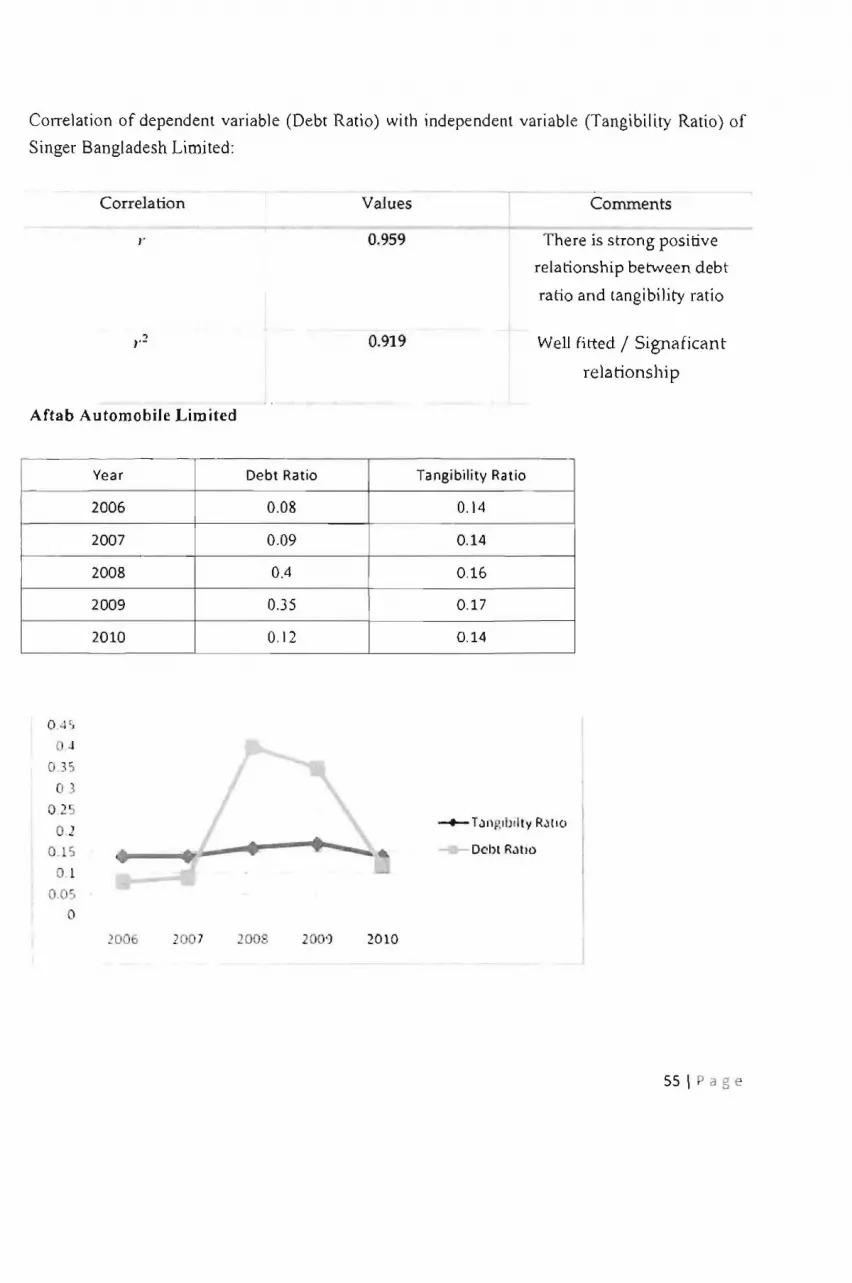
Correlation of dependent variable (Debt Ratio) with independent variable (Tangibility Ratio) of
Singer Bangladesh Limited:
Correlation
Aftab Automobile Limited
J
0.35 . 3
02
0 1 O. S
o 1
0.05 o
Year
2006
2007
2008
2009
2010
2006 2007
Debt Ratio
0.08
0 .09
0.4
0.35
0.12
200v 200')
Values
0.959
0.919
2010
Tangibility Ratio
0.14
0.14
0.16
0.17
0.14
Comments
There is strong positive
relationship betvvreen debt
ratio and tangibility ratio
Well fitted / Signaficant
relationship
Debl R.)(IO
55 \ a g e

Correlation of dependent variable (Debt Ratio) with independent variable (Tangibility Ratio) of
Af1ab Automobile Limited:
Correlation
r
Atlas Bangladesh Limited
0.1
0.15
2009 0,229
2010 0.15
O. is
0.1
0,05
o ~007
Values
-0.339
0.115
~OO9 1010
0.02
0.02
0.01
0,01
Comments
is negative
relationship between debt
ratio and tangibility ratio
Not well fitted / No
signaficant relationship
Debt R.:lliO
S6 I

of variable (Debt Ralio) with independent
Bangladesh Limited:
Correlation
0.571
Aluminium Limited
C"""
Year Debt Ratio Tangibility Ratio
2006 0.8 0.14
2007 0.13
2008 5 0,55
2009 0,51 '""" "
2010 0.48 '"""""""
J
o 2008 2009 2010
(Tangibility Ratio) of
relationship between debt
ratio and tangibil
Well fitted I rela
I~JIIO
57 I

Correlation of dependent variable (Debt Ratio) with independent variable (Tangibility Ratio) of
Bangladesh Thai Aluminium Limited:
Correlation
Manno Jute Stafllers Limited
Year Debt Ratio
2006 0.16
2007 0.13
2008 0.11
2009 0.093
2010 0.25
---- _ •· .... ···~A A_ ~. - .. ._- 0"
0.35
03
O.2'i
0.2
0.1 c;
O,l
o OS
° 2006 2007 2008 2009
Values
-0.973
0.947
. __ . -
"-..... ..
201.0
Tangibility Ratio
0.31
0.27
0.23
0.2
0.14
Comments
There is strong negative
relationship between debt
ratio and tangibility ratio
Well fitted / Signaficant
relationship
...... ,-_._--
---+- T il1):s1 b'llly RJ llO
Dl'bt Ratio
58 I P a
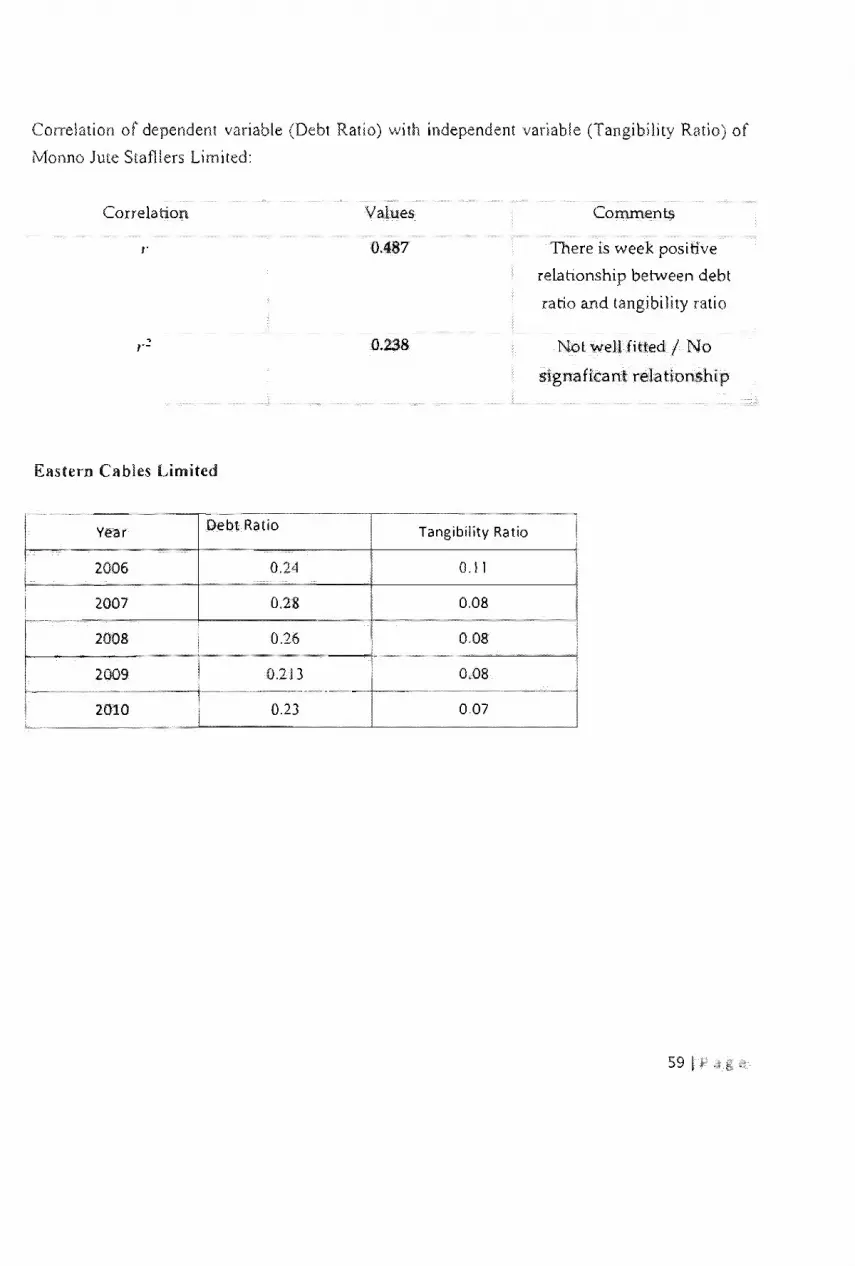
Correlation of dependent variable (Debt Ratio) with independent variable (Tangibility Ratio) of
Monno Jute Stafllers Limited:
Correlation
, r-
Eastern Cables Limited
mmmm"
Year Debt Ratio
2006 0.24
2007 0.28
1008 0.26
2009 0.213
2010 0.23
0.487
Tangibility Ratio
0.11
0.08
0.08
0.08
007
Comments
There is week positive
relationship between debt
ratio and tangibility ratio
Not well fitted / No
signaficant relationship
59 I

o :s
02 S
0.2
015 Ratio
01
005
o 2007 2008 2009 2010
Correlation of dependent variable (Debt Ratio) with independent variable (Tangibility Ratio) of
Eastern Cables Limited:
Correlation Values
0.019
0.0001
There is week positive
relationship between debt
ratio and tangibility ratio
Not well fitted / No
signaficant relationship
Correlation of dependent variable (Debt Ratio) with independent variable (Tangibility
Ratio) of engineering industry of Bangladesh:
Correlation Values
r
between debt
ratio and asset rate
0.019 Not well fitted I No
relationship
60 I

Here, ,. ::::: 0.436 which means Debt Ratio and Market Price of Share have week positive
relationship.
And r::' = 0.019 which is less than O.S (r2 < 0.019). We can not reject N c, •. So There is
no signaficant relationship between Debt Ratio and Market Price of Share.
H c ... is not well fitted.
From the above it can be concluded that the relationship between debt ratio and
tangible asset to total asset ratio is weekly positive but the relationship is not significant
in case of engineering industries of Bangladesh.
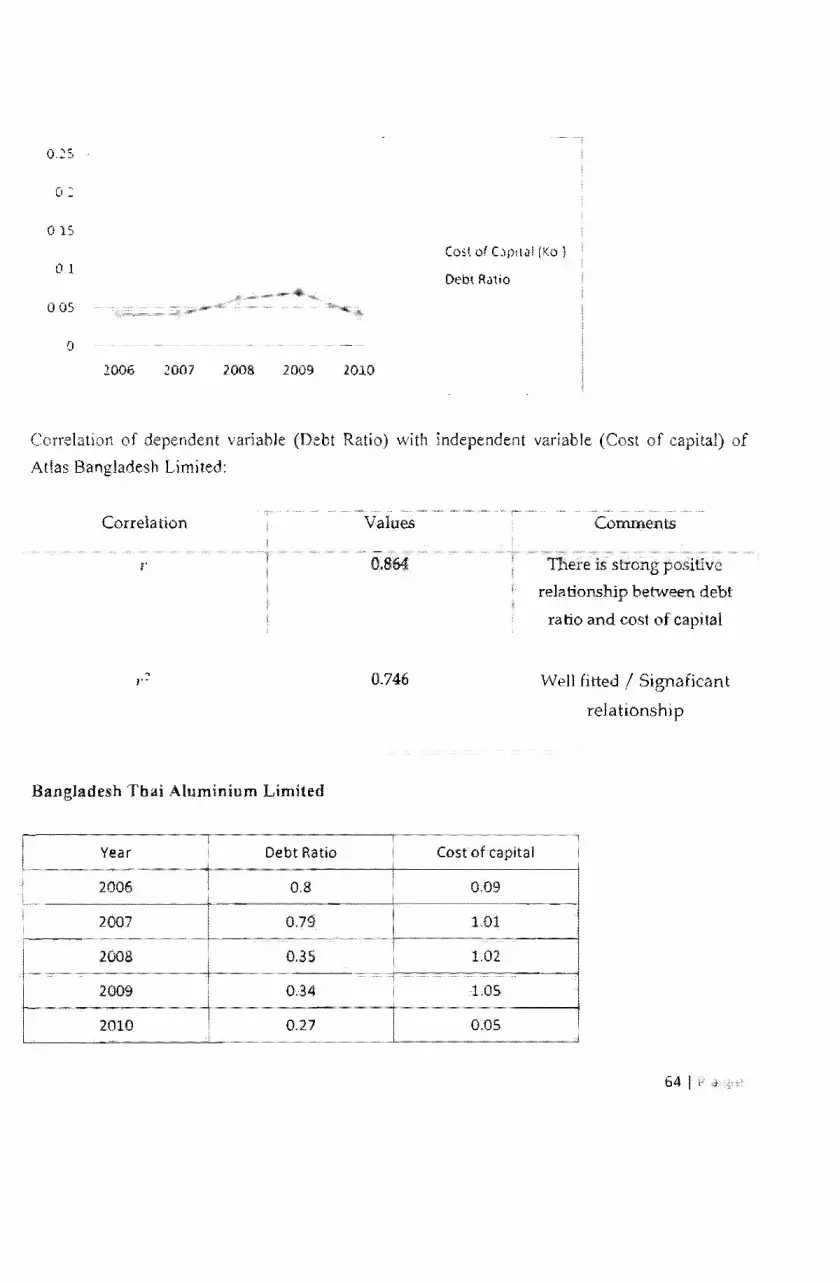
5.6 Relationship between the Debt Ratio and Cost of Capital
We will reject H 05 I if Y' ?! 0.50
We have tried to find the relationship between Cost of Capital (Ko) and Debt Ratio of selected
engineering ind us try:
Singer Bangladesh Limited
61 I P

2007 0.53 0.11
2008 0.49 0 .13
2009 0 .1 437 0 .19
2010 0,0007 0.05
1.5 (05! 0 1 Ca p i t al (Ko )
Debt R.)tlo 0 .:,
o 2006 2.007 2003 100') 2010
Correlation of dependent variable (Debl Ralio) with independent variable (Cost of capital) of
Singer Bangladesh Limited:
Correlation
r
Aftab Automobile Limited
Year Debt Ratio
2006 0,08
2007 0.09
2008 0.40
2009 0.35
2010 0.12
Values
0.952
-0.906
Cost of capital
0.04
0.04
0.07
0,06
0,05
Comments
There is strong positive
relationship between debt
ratio and cost of capital
Well fitted / Signaficant
relationship
62 I a ge

Ool
o 3S
03
0.2S
0.2
0.15
0.1
200S
·Cost of Capital (Ko )
Debt R<llIO
Correlation of dependenl variable (Debt Ratio) with independent variable (Cost of capital) of
Aftab Automobile Limited:
Correlation
r
., ,.-
Atlas Bangladesh Limited
Year Debt Ratio
2006 0.10
2007 0.10
2008 0.15
2009 0.229
2010 0.15
Values
-0.338
0.115
Cost of capital
0.04
0.04
0.06
0.07
0.04
Comments
There is week negative
relationship betvveen debt
ratio and cost of capital
Not wen fitted / No
signaficant relationship
63 I !"
0.':5
0:
015
01
0.05
o 1006 2007 1008 2009 2010
Cost of C'Otl,)l (Ko )
Debt Rdtio
Correlation of
Atlas Bangladesh
(Debt Ratio) with independent variable
Values
r 0.864
relationship
ratio
0.746 Well /
Cost of
0.09
1.02
1.05
0.05
of
64 I

0.0
03
0.2
0.1
o 200G 2007
CuSt of C .)!JllJII Ko \
2008 2009 2010
Correlation of dependent variable (Debt Ratio) with independent variable (Cost of capital) of
Bangladesh Thai Aluminium Limited:
Correlation
Monno ,jute Stamers Limited
Year Debt Ratio
2006 0.16
2007 0.13
2008 0.11
2009 0.093
2010 0.25
Values
-0.083
0.007
Cost of capital
0.07
0.07
0.04
0.04
0.04
Comments
There is week negative
relationship between debt
ratio and cost of capital
Not well fitted / No
signaficant relationship
65 I f'

0.3
025
0.15
01
0.05
o 2006 2007 2008 200') :2:010
dependent variable (Debt Ratio) with
Manno Jute Stafllers Limited:
Correlation
Eastern Cables Limited
Vear Ratio
2006 0.24
2007 0.28
2010
(OS\ 01
0.041
IKo)
variable (Cost of capital) of
Comments
There I~ week negative
relationship between
ratio and cost of capital
l\.ot well fitted / No
signaficant relationship
66 I

0.3
0 .2:'
0.2
0 .1 S CO~1 of CJpllal /Ko )
o 1
os
o 200r, 2007 2008 2009 2010
Correlation of dependent variable (Debt Ratio) with independent variable (Cost of capital) of
Eastern Cables Limited:
Correlation
'"
~ ,..
Values
0.40
0.16
Comments
There is week positive
relationship between debt
ratio and Cost of capital
Not well fitt d / No
signaficant relationshi p
Correlation of dependent variable (Debt Ratio) with independent variable (Cost of
capital) of engineering industry of Bangladesh:
Correla tion Values Comments
,. 0.487 There is week positive
relationship between debt
ratio and Cost of capital
~ 0.238 Not well fitted / No r-
signaficant relationship
---
67 I P ,1 ,!"

Here, r = 0.487 which means Debt Ratio and Market Price of Share have week positive
rela tionshi p.
And /,:2 = 0.238 which is less than 0.5 (r2 < 0.238). We can not reject H C5 . So There is
no signaficant relationship between Debt Ratio and Market Price of Share.
H 05 is not well fitted.
from the above it can be concluded that the relationship between debt ratio and cost of
capital is weekly positive but the relationship is not significant in case of engineering
industries of Bangladesh.
5.7 Relationship between the Debt Ratio and Market Price of Share
We will reject H 06 ,if r 1 ~ 0.50
We have tried to find the relationship between Market Price Share and Debt Ratio of selected
engineering industry:
Singer Bangladesh Limited
Year Debt Ratio
2006 1.97 7
2007 0.53 18.9
2008 0.49 19.23
68 I

10
o 2008
R')lIo
2010
Correlation of dependent variable (Debt Ratio) with independent variable (Market Price of
Share) of Singer Bangladesh Limited:
Correlation Values
-0.67
0.449
Aftab Automobile Limited
2010 0.12
Comments
There is negative
between debt ratio and market price
of share
Not well fitted / No signaficant
relationshi p
2115
69 I

o 2007
Correlation of
Share) of Aftab Automobile
Correlation
2009
2010
RJtlo
2009 2010
Ratio) with independent variable
Values
-0.128
0.016
0.10
0.15
Comments
There is week negative
between debt ratio and
of share
Not well fitted /
relationship
212
361
298
397
70 I
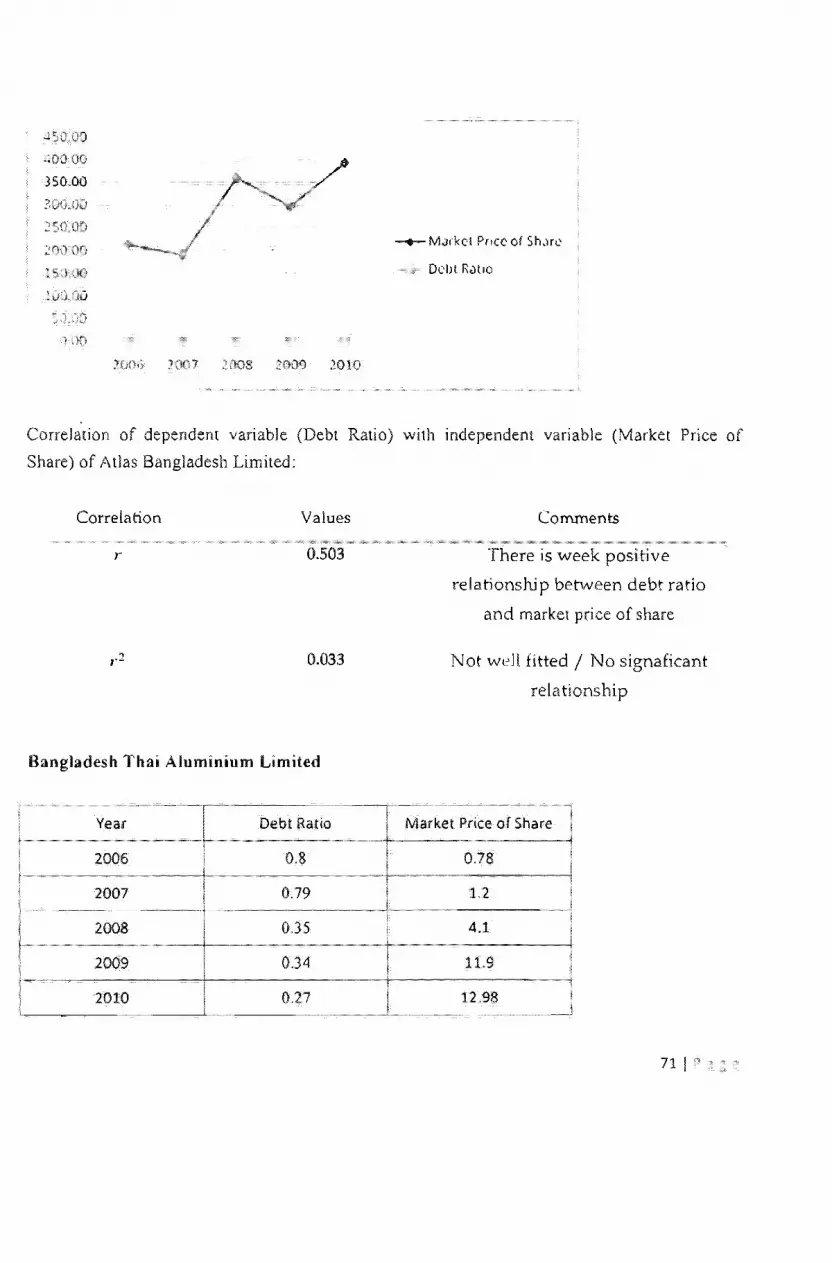
J
350.00
-.- Markel Pncc of Sn.H(,
20
Correlation of dependent variabJe (Debt Ratio) with independent variable (Market Price of
Share) of Atlas Bangladesh Limited:
Correlation Values
r 0.503
0.033
Bangladesh Thai Aluminium Limited
Year Debt Ratio
2006 0.8
2007 0.79
2008 0.35
2009 0.34
2010
Comments
There is week positive
relationship between debt ratio
and market price of share
Not wl'll fitted / No signaficant
rela tionshi p
-
Market Price of Share
0.78
1.2
11.9
12.98 i
71 I

-l .00
L I)
~ . 0
600
-l00
2.00
000
~006 2007 200~ 2000 20]0
()r C l P fll':C of SI1JfC
(In I fu r)dr"cd )
Debt R.HIO
Correlation of dependent variable (Debl Ratio) with independent variable (Market Price of
Share) of Bangladesh Thai Aluminium Limited:
Correlation Values
,. -0.852
0.726
Monno Jute Stanlers Limited
Year Debt Ratio
2006 0.16
2007 O. 13
2008 0.1 J
2009 0.093
2010 0.25
Conunents
There is strong negative
relationship between debt ratio
and market price of share
Well fitted I Signaficant
relationship
Market Price of Share
4
3.2
S.l
10
38

·10.00
25.00 -+-Mar~cl PYlee of Sh,)((;~
l
Debt R,)\IO
0.00
2008 2009 2010
Correlation of dependent variable (Debt Ratio) with independent variable (Market Price of
Share) of Monno J me Sta flI ers Limi ted:
Correlation Values
0.845
0.715
Eastern Cables Limited
Year Debt Ratio
-
2006 0.24
0.28
2008 0.26
2009 , ...
2010 0.23
Comments
There is strong positive
relationship between debt ratio
and market price of share
Well fitted / Signaficant
rela bons hi p
Market Price of Share .-
2.2
6.07
5.59
6.8
73 I

S 00
700
COO
),00
400
300
200
1.00 0,00
2006 2007 2008 2009 2010
MJ(i<.d PrICe of Sh,<rc
lin HW1drcd)
Debl R,HIO
Correlation of dependent variable (Debt Ratio) with independent variable (Market Price of
Share) of Eastern Cables Limited:
Correlation Values
-0.168
0.028
- -
Comments
is week negative
relationship between debt ratio
and market price of share
Not weB fitted / No signaficant
relationship
Correlation of dependent variable (Debt Ratio) with independent variable (Market Price
of Share) of engineering industry of Bangladesh:
Correlation Values
0.033
Comments
is week negative relationship
between debt ratio and market price
of share
Not fitted / No signaficant
relationship
74 I
Here, " = - 0.181 which means Debt Ratio and Market Price of Share have week
negative relationship.
And r ' = 0.033 which is less than 05 (r' < 0.5). We can not reject Hi}<, . So There is no
signaficant relationship between Debt Ratio and Market Price of Share.
H o. is not well fitted.
From the above it can be concluded that the relationship between debt ratio and market
price of share is weekly negative but the relationship is not significant in case of
engineering industries of Bangladesh.
Chapter - 6
Findings and Conclusion
The study shows tha t the listed companies in the engineering ind ustry of Bangladesh
ar<2 using largely different capital structure from each other. Among the six companies
under analysis in recent year, Aftab Automobile Limited uses the lowest leverage (debt
equity ratio o.n and debt ratio 0.12) while Manno Jute Stafllers Limited uses excessive
leverage (debt-equity ratio 0.49 and debt ratio 0.25) in the capital structure.
The industry average debt-equity ratio is 0.24 and debt ratio is 0.13. It implicates that
the average use of debt in the industry is around 24% of equity employed and 13% of
75 I

total assets is financed by debt. The industry is capital intensive one while the long
term debt ratio of the industry is around 0.019. It indicates tha t the industry uses short
term fund to finance its long-term assets.
If 0,50, there is a significant relationship between dependent variable and
independent variable,
From the analysis the relationship between capital structure (debt ratio) and asset
growth rate of engineering industries in Bangladesh:
-Company Name r r2
Singer Bangladesh limited -0.09 0.008 No sign ificant relationsh i p
Aftab Automobile Limited -0.621 0.385 No significant relationship
Atlas Bangladesh Limited 0.879 0.772 relationship
BD Thai Aluminium Limited -0.676 0.457 No significant relationship
Manno Jute Stafllers Limited 0.871 0.758
Eastern Cables Limited 0.87 0.756 Significant relationship
Industry 0.05 0.002 No significant relationship
From the analysis the relationship between capital structure (debt ratio) and operating
leverage of engineering industries in Bangladesh:
Company Name r Relationship
Singer Bangladesh Limited -0.476 No significant relationship
Aftab Automoblle Limited -0.290 0.084 No significant relationship
Atlas Bangladesh Limited 0.965 0.932 Significant relationship
SO Thai Aluminium limited -0.944 0.891 Significant relationship
76 I

Manno Jute Stafllers Limited 0.727
Eastern Cables Limited -0.724 0.524 Significant relationship
-Industry ...0.2.31 0.053 No <IQrIIU .. :u'lt relatiDnship
From the analysis the relationship between capital structure (debt ratio) and financial
leverage of engineering industries in Bangladesh
Company Name r y2 Relationship
Singer Bangladesh Limited No significant relationship
Aftab Automobile Limited 0.139 0.019 No significant relationship
Atlas Bangladesh Limited -0.868 0.753 Significant relationship
BD Thai Aluminium Limited 0.833 0.695 Significant relationship
Monno Jute Stafllers Limited 0.241 0.058 No significant relationship
Eastern Cables Limited 0.686 0.471 No significant relationship
Industry -0.062 0.004 relationship
From the analysis the relationship between capital structure (debt ratio) and tangibility
ratio of engineering industries in Bangladesh
Company Name r y2 Re Ja tionship
0.959 0.919 Significant relationship
Aftab Automobile Limited -0.339 0.115 No significant relationship
Atlas Bangladesh Limited -0.755 0.571 Significant relationship
BO Thai Aluminium -0.973 0.947 Significant relationship
Limited
771

Monno Jure Srafllers Limi
bles Limited
Industry
analysis the
0.487
0,019
of engineering industries in
Company Name y
Bangladesh limited
Automobile Limited
Bangladesh Limited
BD Thai Aluminium mited
Manno Jute Staftlers Limited
Cables Li mited DAD
industry
y2
0.238 No relationship
0.0001 No significant relationship
0.019 No significant relationship
capital structure cost of
Relationship
0.906
0.115 No nt relationship
0.746 relationship
0.007 No rei a tion sh i p
relationship
0.16 No relationship
0.238
the p between capital structure ratio) and market
of share of in Bangladesh
Company r Relationship
Singer Bangladesh Limited
Artab Automobile -0.128 0.016
Bangladesh 0.503 0.033 significant
78 I r 2

BD Thai Aluminium Limited -0.852 0.726 Significant relationship
Monno Jute 0.715 Limited
Eastern CabJes Limited -0.168 0.028 No significant relationship
Industry -0.181 0.033 No significant relationship
From the above analysis the relationship between capital structure (debt ratio) and
some independent variables of engineering industries in Bangladesh:
Variables r
Asset
• Operating Leverage -0.231 0.053
Relationship
The relationship is not sign ifica nt.
Weekly Negative Rei
The Relationship is not
79 I P

Financial Leverage ·0.062 0.004
Tangibility Ratio 0.019
Cost of capital 0.487
Market Price of Share -0.181
Bi bliography
Weekly Negative Relationship.
The Relationship is not significant.
Weekly Positive Relationship.
The relationship is not
sign ificant.
Positive Relationship.
is not
The Relationship is not
sign ificant.
.. Baker, M. P, & Wurgler, r (2002) Market Timing and Capital Structure. fOllnw/ of F'1HmCe, 1-32.
• Baxter, N. (Sep1967). Leverage, Risk of ruin and the cost of capita\. journal of Finance; Vo/.22 .395-
403
.. Bradley, J. a. (2002). A Review of Research on the practices o( corporate finance. South Asinn
jOllnwl of Managemenl; vo/.9 , 29.
• Brealey, R. A, & Myers, S. C (1981). Pnnciples a/Corporate Finance Boston: McGraw-Hili/Irwin.
• G .. S. (2008). Intra-Industry Variations of Capital Srruchlfe in Pharmaceutical Industry in India.
iniernational Research Journal of Finance find £CGno/llIcs, 164.
BO I

M. (1969). The effect of growth and industry on financial structure of
Journal of Finance; Vol. 24 J 517-529.
• Horne, J. & J. M. (2005), Fundementals of Financial IVJarnaqer,ner,rc. Essex: Prentice
Hall.
• J./ C ... rn1.e Investment, financing and valuation of corporation. Homewood: Irwin.
• Jones.W.H., F. M. (1979). Determinants of Financial
Journal of Finrmce; Vol.34 , 631-644.
13. K. (1980), Determ i nan ts of fi nancia 1
Accollntmlt; Vol.9 , 451-456.
A new
Some further evidence", The Charted
• Kajipet, O. (2000). Contemporary in business finance. New Delhi: Discovery Publishing House.
R. K. (1999). The Determinants of
India, 51-69.
structure - An econometric Finance
E. a. (2007), Investment Opportunities and Prediction. Journal of Finance,
24-35.
" Mohanty. (2002). A Review of Research on the practices of Corporate finance. South Asian Journal
of Management; Vol. 9 J 29.
• Morris, M. R. (2001). Shareholder Value Capital Structure
VALUE J 2-3.
• Myers, S. & Majlut N. S. Corporate and investment decisions when firms
have information that investors do not have. foun-tal of Financial Economics, 187-221.
" S, V. (1983). Determinants of financial
519-527.
An empirical extension, The Chartered Accountant J
• C. W. (1977). Determination of rate of return and capital structure; An
econometric Journal of Finance; Vol.32 J 811-821.
81 I

• T, M. (1991). Optional financial leverage the ownership factor finance India, Finance India. 195-
201
• Toy,N" S. A. (1974). A Comparative International Study of Growth, Profitability and Risk as
cteterm I nan l-s of corporate debt ratio in the manufacturing sector, Journal of FIlIa/lewl GIld
Qua/dilative AnalysIs, 875-886,
• www.investopedia.com
• www.en.wikipectia,org
• www.dsebd.org
82 I P (l g E:'