Embed Size (px)
Citation preview
Advances In Management Vol. 5 (10) Oct. (2012)
(59)
Case Study:
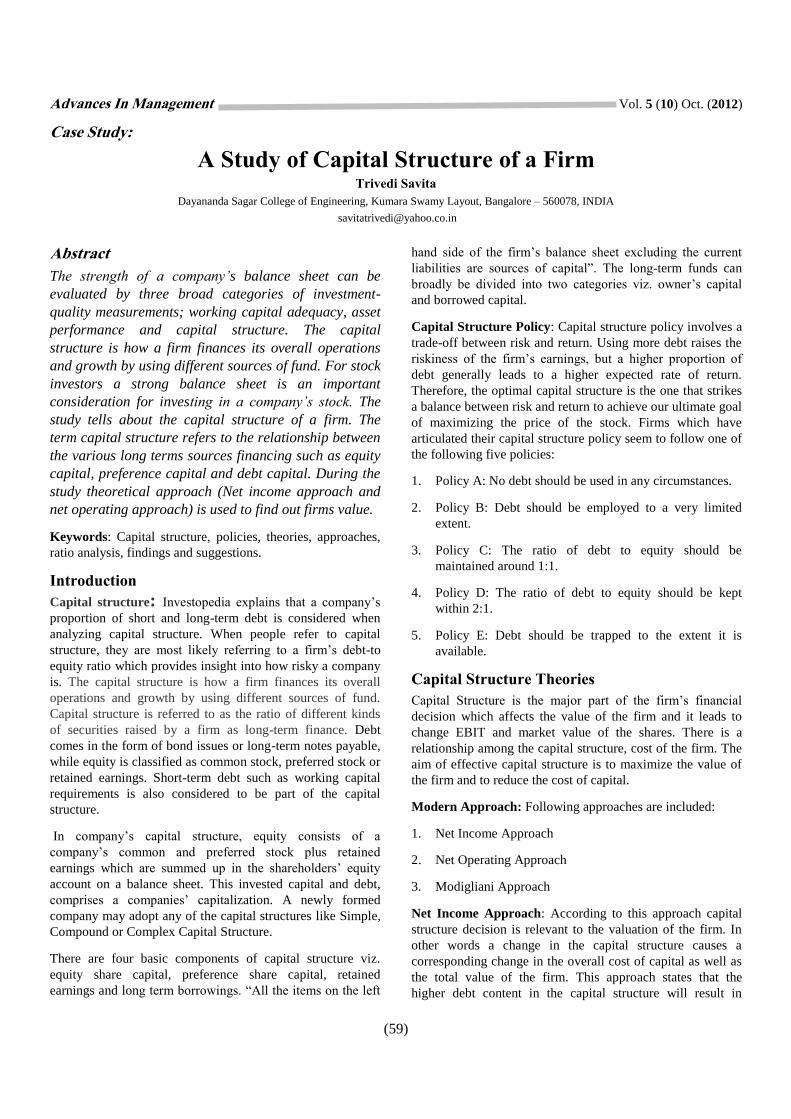
A Study of Capital Structure of a Firm Trivedi Savita
Dayananda Sagar College of Engineering, Kumara Swamy Layout, Bangalore – 560078, INDIA
Abstract
The strength of a company’s balance sheet can be
evaluated by three broad categories of investment-
quality measurements; working capital adequacy, asset
performance and capital structure. The capital
structure is how a firm finances its overall operations
and growth by using different sources of fund. For stock
investors a strong balance sheet is an important
consideration for investing in a company’s stock. The
study tells about the capital structure of a firm. The
term capital structure refers to the relationship between
the various long terms sources financing such as equity
capital, preference capital and debt capital. During the
study theoretical approach (Net income approach and
net operating approach) is used to find out firms value.
Keywords: Capital structure, policies, theories, approaches,
ratio analysis, findings and suggestions.
Introduction
Capital structure: Investopedia explains that a company’s
proportion of short and long-term debt is considered when
analyzing capital structure. When people refer to capital
structure, they are most likely referring to a firm’s debt-to
equity ratio which provides insight into how risky a company
is. The capital structure is how a firm finances its overall
operations and growth by using different sources of fund.
Capital structure is referred to as the ratio of different kinds
of securities raised by a firm as long-term finance. Debt
comes in the form of bond issues or long-term notes payable,
while equity is classified as common stock, preferred stock or
retained earnings. Short-term debt such as working capital
requirements is also considered to be part of the capital
structure.
In company’s capital structure, equity consists of a
company’s common and preferred stock plus retained
earnings which are summed up in the shareholders’ equity
account on a balance sheet. This invested capital and debt,
comprises a companies’ capitalization. A newly formed
company may adopt any of the capital structures like Simple,
Compound or Complex Capital Structure.
There are four basic components of capital structure viz.
equity share capital, preference share capital, retained
earnings and long term borrowings. “All the items on the left
hand side of the firm’s balance sheet excluding the current
liabilities are sources of capital”. The long-term funds can
broadly be divided into two categories viz. owner’s capital
and borrowed capital.
Capital Structure Policy: Capital structure policy involves a
trade-off between risk and return. Using more debt raises the
riskiness of the firm’s earnings, but a higher proportion of
debt generally leads to a higher expected rate of return.
Therefore, the optimal capital structure is the one that strikes
a balance between risk and return to achieve our ultimate goal
of maximizing the price of the stock. Firms which have
articulated their capital structure policy seem to follow one of
the following five policies:
1. Policy A: No debt should be used in any circumstances.
2. Policy B: Debt should be employed to a very limited
extent.
3. Policy C: The ratio of debt to equity should be
maintained around 1:1.
4. Policy D: The ratio of debt to equity should be kept
within 2:1.
5. Policy E: Debt should be trapped to the extent it is
available.
Capital Structure Theories
Capital Structure is the major part of the firm’s financial
decision which affects the value of the firm and it leads to
change EBIT and market value of the shares. There is a
relationship among the capital structure, cost of the firm. The
aim of effective capital structure is to maximize the value of
the firm and to reduce the cost of capital.
Modern Approach: Following approaches are included:
1. Net Income Approach
2. Net Operating Approach
3. Modigliani Approach
Net Income Approach: According to this approach capital
structure decision is relevant to the valuation of the firm. In
other words a change in the capital structure causes a
corresponding change in the overall cost of capital as well as
the total value of the firm. This approach states that the
higher debt content in the capital structure will result in
Advances In Management Vol. 5 (10) Oct. (2012)
(60)
decline in the overall or weighted average cost of capital.
This will cause increase in the value of the firm and
consequently increase in the value of equity shares of the
company. Reverse will happen in a converse situation.
Assumptions: Net Income Approach is based on the
following three assumptions:
1. There are no corporate taxes.
2. The cost of debt is less than cost of equity capitalization
rate.
3. The debt content does not change the risk perception of
the investors.
The value of the firm on the basis of NI Approach can be
ascertained as follows:
V=S+B
where V= Value of firm; S=Market Value of Equity,
B= Market Value of Debt.
Market value of equity can be ascertained as follows:
s=NI/Ke
where S= Market Value of Equity, I= Earnings available for
equity shareholders and Ke= Equity Capitalization Rate.
1. Net Operating Income: This is just opposite of Net
Income approach. According to this approach, the market
value of the firm is not at all affected by the capital
structure changes. The market value of the firm is
ascertained by capitalizing the net operating income at
the overall cost of capital (k) which is considered to be
constant. The market value of equity is ascertained by
deducting the market value of the debt from the market
value of the firm.
2. Assumptions: The Net Operating Income (NOI)
approach is based on the following assumptions:
i. The overall cost of capital (k) remains constant for
all degrees of debt-equity mix or leverages.
ii. The market capitalizes the value of the firm as a
whole and, therefore the split between debt and
equity is not relevant.
iii. The use of debt having low cost increases the risk of
equity shareholders, this result in increase in equity
capitalization rate. Thus, the advantage of debt is set
off exactly capitalization rate.
iv. There are no corporate taxes
Value of the Firm: According the NOI Approach, the value
of the firm can determined by the following equations:
V=EBIT/K
where V = Value of firm, K = Overall cost of capital and
EBIT= Earnings before interest and tax.
Value of Equity: The value of equity (S) is a residual value
which is determined by deducting the total value of debt (B)
from the total value of the firm (V). Thus, the value of equity
(S) can be determined by the following equation:
S= V-B
where S= Value of Equity, V= Value of Firm, B= Value of
Debt
Equity capitalization rate = Ke= EBIT-1 / V-B
Traditional Approach
According to this theory, the value of the firm can be
increased initially or the cost of capital can be decreased by
using more debt as the debt is cheaper source of funds than
equity. Thus optimal capital structure can be reached by a
proper debt-equity mix. Beyond a particular point, the cost of
equity increases because increased debt increases the
financial risk of the equity shareholders.
Methodology
The primary data are collected by conducting discussions
with concerned officers and staff either individually or
collectively. Some of the information had been verified or
supplemented with personal observations. The secondary data
were collected from already published sources such as annual
reports and internal records. The data includes: Collection of
required data from annual reports of the firm (name of the
firm not disclosed) 2005-2009, reference from text books and
relating to financial management and also from the firm’s
website.
Value of the firm can be determined in using several
techniques. These include DCF, CAPM, Relative valuation
and theoretical method. We only use the theoretical methods.
Cost of equity was calculated with CAPM and assumed to be
constant for all the years. The value of the firm should not be
negative; as per our study gave a negative value of the firm.
In net income approach, we calculated firm’s value through
market value of debt and equity .But in net operating income
we calculated firm’s value through overall cost of capital.
Literature review
Myers, Stewart C.12
in his article “The Capital Structure
Puzzle” gave the information on the capital structure of the
firms and how they choose the debt, equity hybrid securities
issued by them. The author wrote “This paper's title is
intended to remind you of Fischer Black's well-known note
on "The Dividend Puzzle," which he closed by saying, "What
should the corporation do about dividend policy? We do not
Advances In Management Vol. 5 (10) Oct. (2012)
(61)
know." I will start by asking, "How do firms choose their
capital structures?" Again, the answer is, “We do not know."
Further he wrote, “By contrast, we know very little about
capital structure. We do not know how firms choose the debt,
equity or hybrid securities they issue. We have only recently
discovered that capital structure changes convey information
to investors.
Wippern, Ronald F.11
examined the optimal capital structure
and the value of the firm and stated the expected earnings
stream from the assets and the rate that the stream is
capitalizes. Boness A. James et al10
have examined the
relationship between stock price behaviour and changes in the
capital structure of a firm.
Schwartz9 discussed a self-
contained theory of the capital structure of the individual
firm. The author suggests that there is a single optimum
capital structure for any firm. Hackbarth8 in his article
“Managerial Traits and capital structure decisions” examined
the well-documented managerial traits into a tradeoff model
of capital structure to study their impact on corporate
financial policy and firm value. Sagnar et al5 wrote that
Managing working capital involves organizing your
company's short-term resources to sustain ongoing activities,
mobilize funds and optimize liquidity. Banos et al6 in their
research examined that how the determinants of cash
conversion cycle (CCC) plays a important role on utilization
of working capital. Bauer7 believes that organizations can
leverage innovative methods to utilize working capital while
balancing the needs of suppliers, procurement, finance, AP
and treasury.
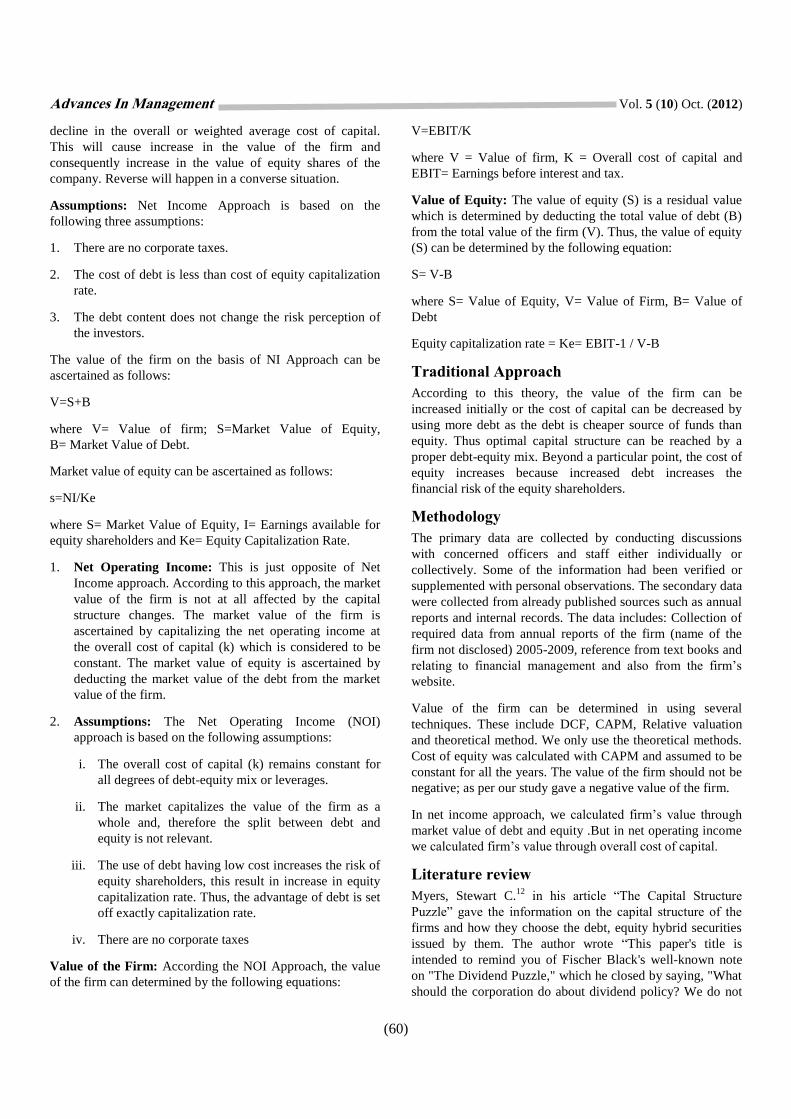
Analysis of Financial Statement
Years Net Profit Net Sales
2005 46.11 318.12
2006 36.18 455.09
2007 -115.21 412.87
2008 6.13 593.14
2009 105.51 768.35
Ratio Analysis
1. Current Ratio: It represents the ratio of current assets to
current liabilities. It is also called working capital ratio. It
is calculated by dividing current assets by current
liabilities.
Current Ratio = Current Assets
Current Liabilities
2. Debt-equity Ratio: This ratio indicates the relative
proportion of debt and equity in financing the assets of a
firm. This ratio is computed by dividing the total debt of
the firm by its net worth.
Debt-equity Ratio = Debt
Equity
3. Gross Profit Ratio:-This ratio expresses the relationship
between gross profit and sales. This ratio is calculated by
dividing gross profit by net sales.
Gross Profit Ratio = Gross profit x 100
Net sales
4. Net profit ratio:It is determined by dividing the net
income after tax to the net sales for the period and
measure the profit per rupee of sales.
Net Profit Ratio = Net profit x100
Sales
5. Proprietary RatioThis ratio shows the long term
solvency of the business. It is calculated by dividing
shareholders’ funds by the total assets.
Proprietary ratio = Shareholders fund
Total assets
6. Return on Total Resources: This ratio is also known as
return on gross capital employed. It is measured the
profitability of investment.
Return on Total Resources =
Net profit x 100
Total assets
Particulars 05 06 07 08 09
Current Ratio 2.97 2 1.94 1.87 1.76
Liquid Ratio 2.53 1.68 1.68 1.55 1.52
Debt-equity Ratio 0.94 0.92 4.35 2.9 1.33
Gross Profit Ratio 19.22 12.78 -24.01 3.93 18.13
Net Profit Ratio 14.49 7.95 -27.9 1.03 13.73
Return on Total Resources 7.03 5.21 -8.81 0.42 4.89
Proprietary Ratio 0.51 0.52 0.19 0.26 0.43
Capital Structure Analysis (Net Income
Method)
COST OF EQUITY CPITALIZATION: It is calculated
with the help of CAPM (Capital Asset Pricing Model). Under
CAPM model, we have to find out how much is the risk free
return, beta of securities and expected return on market
portfolio. To calculate equity capitalization, we have to apply
the given formula:
Advances In Management Vol. 5 (10) Oct. (2012)
(62)
Ke = Rf + beta (Rm-Rf)
where Ke = Equity Capitalization, Rf = Risk Free Return,
Beta = Beta of Security, Rm = Expected Return on Market
Portfolio.
Market Return
Years Closing Price Percentage Change
2000 1263.55
2001 1059.05 -16%
2002 1093.5 3%
2003 1879.75 72%
2004 2080.5 11%
2005 2836.55 36%
2006 3966.4 40%
2007 6138.6 55%
2008 2959.15 -52%
2009 5201.05 76%
2010 6134.5 18%
Average = 24%
Equity Capitalization
Risk
Free Beta
Market
Return
Risk
free
Equity
Capitalization
8.22 0.88 24 8.22 22.1064
2005
Particulars Rs. in Cr
Earnings available to Equity shareholders 46.11
Equity Capitalization 22.1064
Market value of Equity 208.58
Market value of Debt 318.41
Total value of a Firm 526.99
Interpretation:
1. The earnings available to equity shareholders was 46.11
2. The market value of Equity capital of the firm was
208.58
3. The market value of Debt in the firm was 318.41
4. The total value of the firm was 526.99.
2006 Particulars Rs in Cr
Earnings available to Equity Shareholders 36.18
Equity Capitalization 22.1064
Market Value of Equity 163.66
Market Value of Debt 332.29
Total Value of the Firm 495.95
Interpretation:
1. The earnings available to equity shareholders was 36.18
2. The market value of Equity capital in the firm was
163.66
3. The market value of the firm was 332.29
4. The total value of the firm was decreased by 31.04, as
compared to the previous year.
2007
Particulars Rs. in Cr
Earnings available to Equity Shareholders -115.21
Equity Capitalization 22.1064
Market Value of Equity -521.16
Market Value of Debt 1062.77
Total Value of a Firm 541.61
Interpretation:
1. The earnings available to equity shareholders was -
115.21
2. The market value of Equity capital in the firm was -
521.16
3. The market value of Debt was 1062.77
4. The total value of the firm was increased by 45.66 as
compared to the previous year.
2008
Particulars Rs. in Cr
Earnings available to Equity Shareholders 6.13
Equity Capitalization 22.1064
Market Value of Equity 27.73
Market Value of Debt 1097.46
Total Value of a Firm 1125.19
Interpretation:
1. The earnings available to equity shareholders was 6.13
2. The market value of Equity capital in the firm was 27.73
3. The market value of Debt was 1097.46
4. The total value of the firm was increased by 583.58 as
compared to the previous year.
Advances In Management Vol. 5 (10) Oct. (2012)
(63)
2009
Particulars Rs. in Cr
Earnings available to Equity Shareholders 105.51
Equity Capitalization 22.1
Market Value of Equity 477.28
Market Value of Debt 1232.24
Total Value of a Firm 1709.52
Interpretation:
1. The earnings available to equity shareholders was 105.51
2. The market value of Equity capital in the firm was
477.28
3. The market value of Debt was 1232.24
4. The total value of the firm was increased by 584.33, as
compared to the previous year.
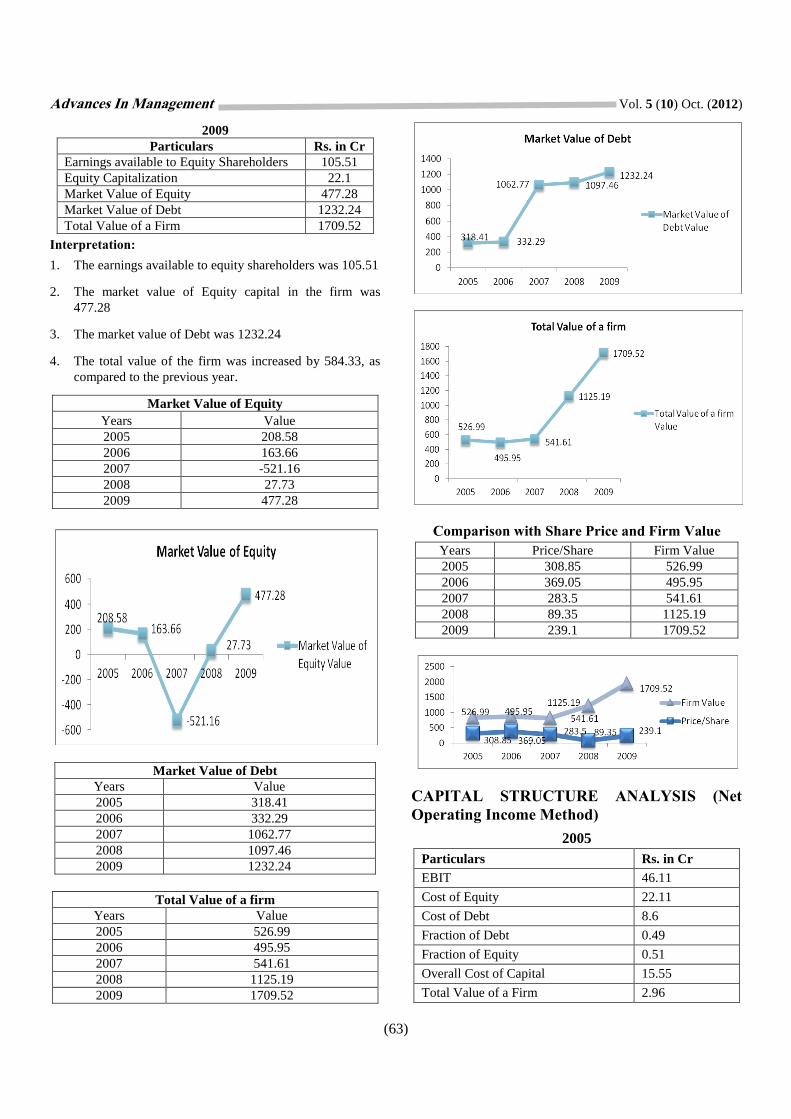
Market Value of Equity
Years Value
2005 208.58
2006 163.66
2007 -521.16
2008 27.73
2009 477.28
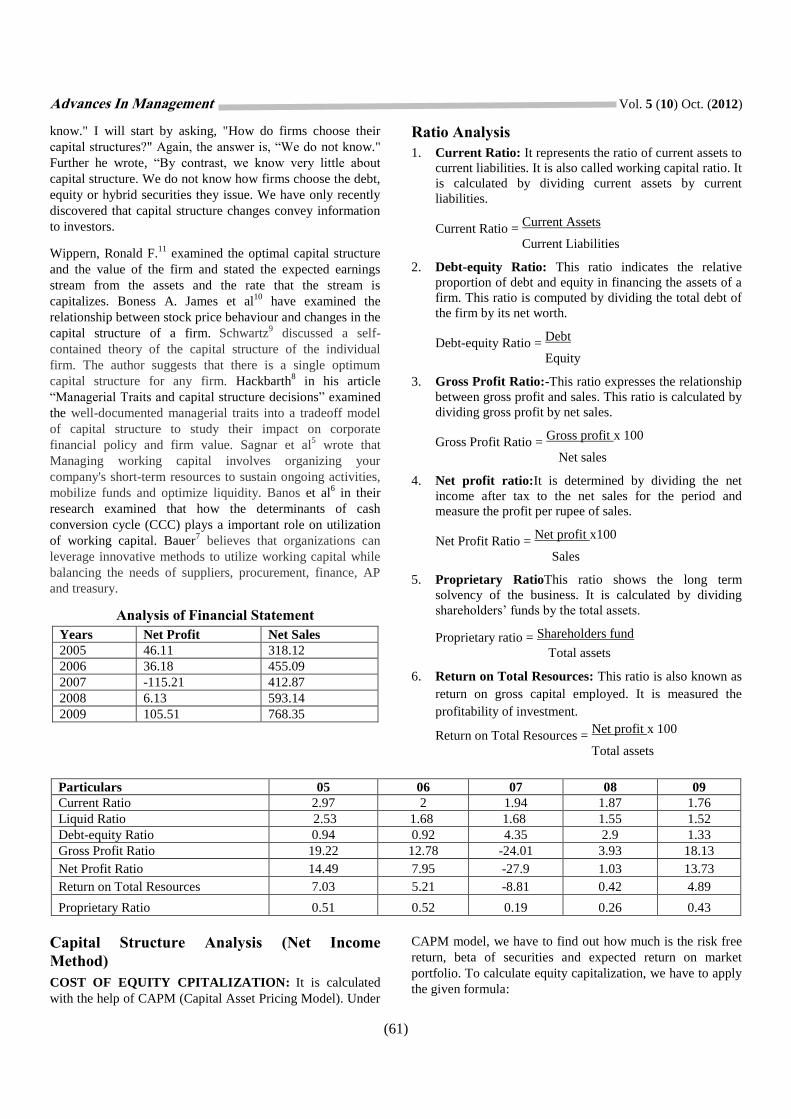
Market Value of Debt
Years Value
2005 318.41
2006 332.29
2007 1062.77
2008 1097.46
2009 1232.24
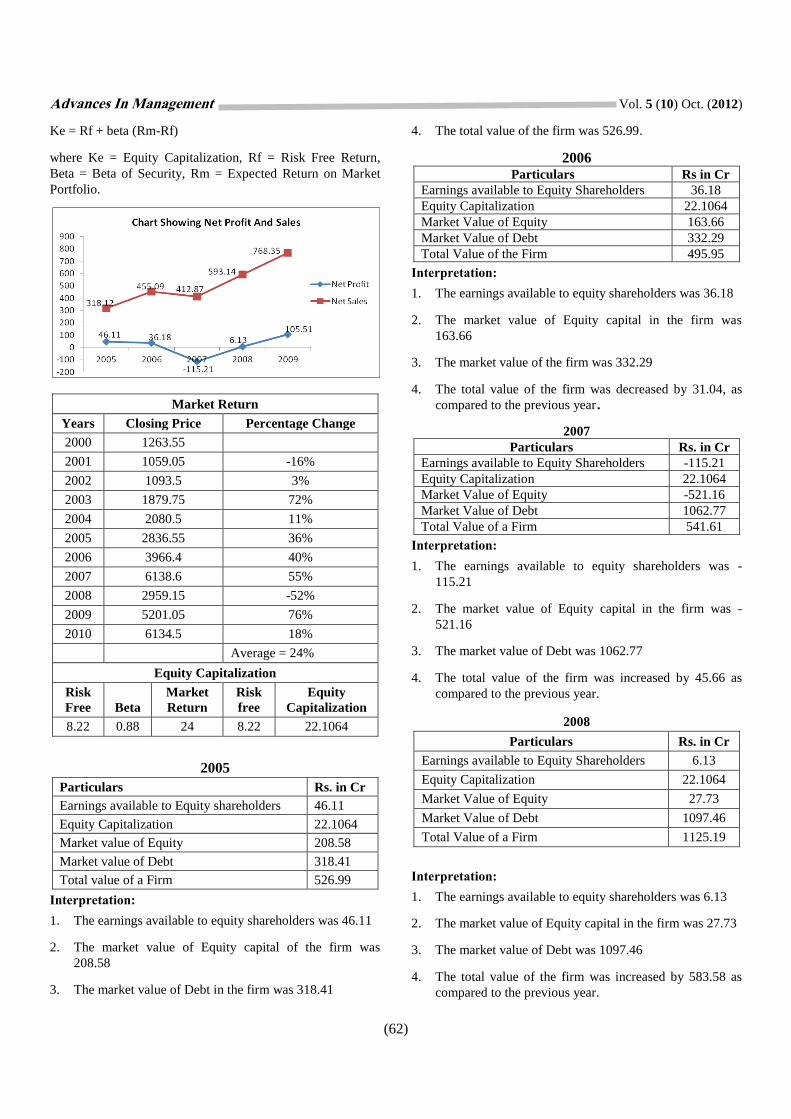
Total Value of a firm
Years Value
2005 526.99
2006 495.95
2007 541.61
2008 1125.19
2009 1709.52
Comparison with Share Price and Firm Value
Years Price/Share Firm Value
2005 308.85 526.99
2006 369.05 495.95
2007 283.5 541.61
2008 89.35 1125.19
2009 239.1 1709.52
CAPITAL STRUCTURE ANALYSIS (Net
Operating Income Method)
2005
Particulars Rs. in Cr
EBIT 46.11
Cost of Equity 22.11
Cost of Debt 8.6
Fraction of Debt 0.49
Fraction of Equity 0.51
Overall Cost of Capital 15.55
Total Value of a Firm 2.96
Advances In Management Vol. 5 (10) Oct. (2012)
(64)
Interpretation:
1. The EBIT of the firm is 46.11
2. The cost of equity is 22.11
3. The cost of debt is 8.6
4. The fraction of debt is 0.49
5. The fraction of equity is 0.51
6. The overall cost of capital is 15.55
7. The value of a firm was 2.96
2006
Particulars Rs. in Cr
EBIT 36.18
Cost of Equity 22.11
Cost of Debt 8.6
Fraction of Debt 0.48
Fraction of Equity 0.52
Overall Cost of Capital 15.64
Total Value of a Firm 2.32
Interpretation:
1. The EBIT of the firm is decreased by 9.93
2. The cost of equity is 22.11
3. The cost of debt is 8.6
4. The fraction of debt is decreased by 0.01
5. The fraction of equity is increased by 0.01
6. The overall cost of capital is increased by 0.09
7. The value of a firm was 2.32
2007
Particulars Rs. in Cr
EBIT -115.21
Cost of Equity 22.11
Cost of Debt 8.6
Fraction of Debt 0.81
Fraction of Equity 0.19
Overall Cost of Capital 11.12
Total Value of a Firm -10.35
Interpretation:
1. The EBIT of the firm is -115.21
2. The cost of equity is 22.11
3. The cost of debt is 8.6
4. The fraction of debt is increased by 0.33
5. The fraction of equity is decreased by 0.33
6. The overall cost of capital is decreased by 4.52
7. The value of a firm was -10.35
2008
Particulars Rs. in Cr
EBIT 6.13
Cost of Equity 22.11
Cost of Debt 8.6
Fraction of Debt 0.74
Fraction of Equity 0.26
Overall Cost of Capital 12.06
Total Value of a Firm 0.51
Interpretation:
1. The EBIT of the firm is 6.13
2. The cost of equity is 22.11
3. The cost of debt is 8.6
4. The fraction of debt is decreased by 0.07
5. The fraction of equity is increased by 0.07
6. The overall cost of capital is increased by 0.94
7. The value of a firm was 0.51.
2009
Particulars Rs. in Cr
EBIT 105.51
Cost of Equity 22.11
Cost of Debt 8.6
Fraction of Debt 1.57
Fraction of Equity 0.43
Overall Cost of Capital 14.39
Total Value of a Firm 7.33
Interpretation:
1. The EBIT of the firm is increased by 99.38
2. The cost of equity in the firm is 22.11
3. The cost of debt is 8.6
4. The fraction of debt is increased by 0.83
5. The fraction of equity is increased by 0.17
6. The overall cost of capital is increased by 2.33
7. The value of a firm was 7.33.
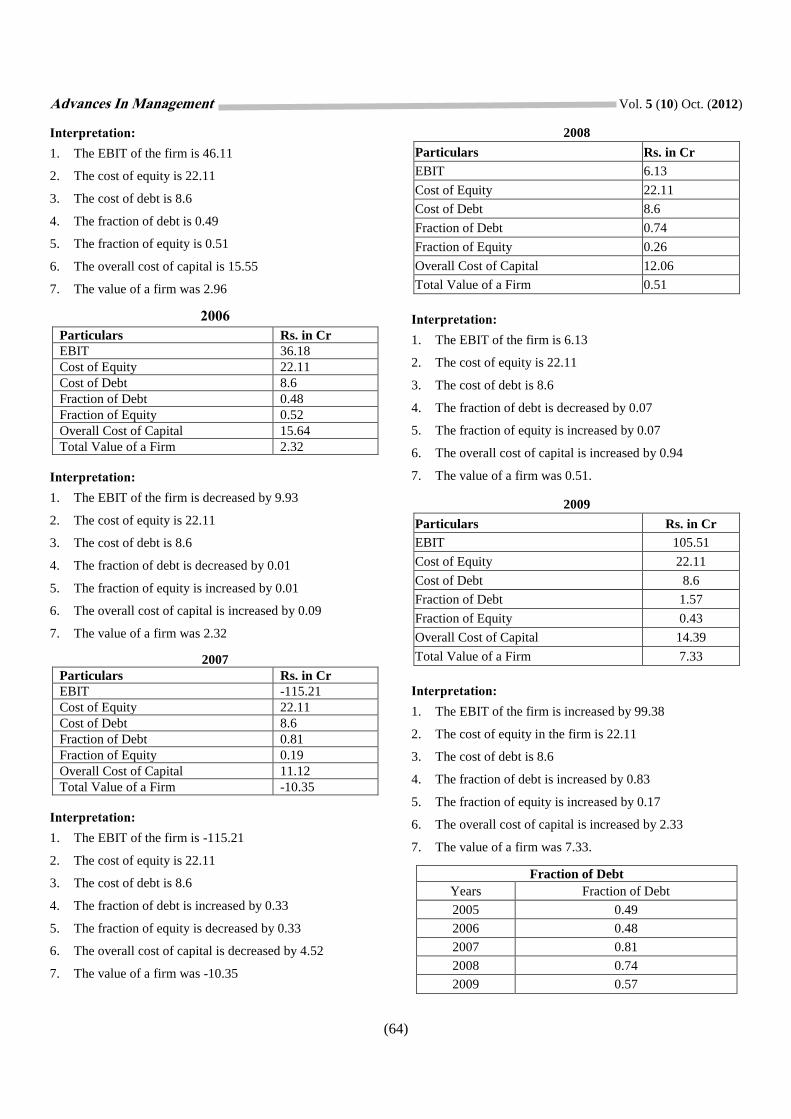
Fraction of Debt
Years Fraction of Debt
2005 0.49
2006 0.48
2007 0.81
2008 0.74
2009 0.57
Advances In Management Vol. 5 (10) Oct. (2012)
(65)
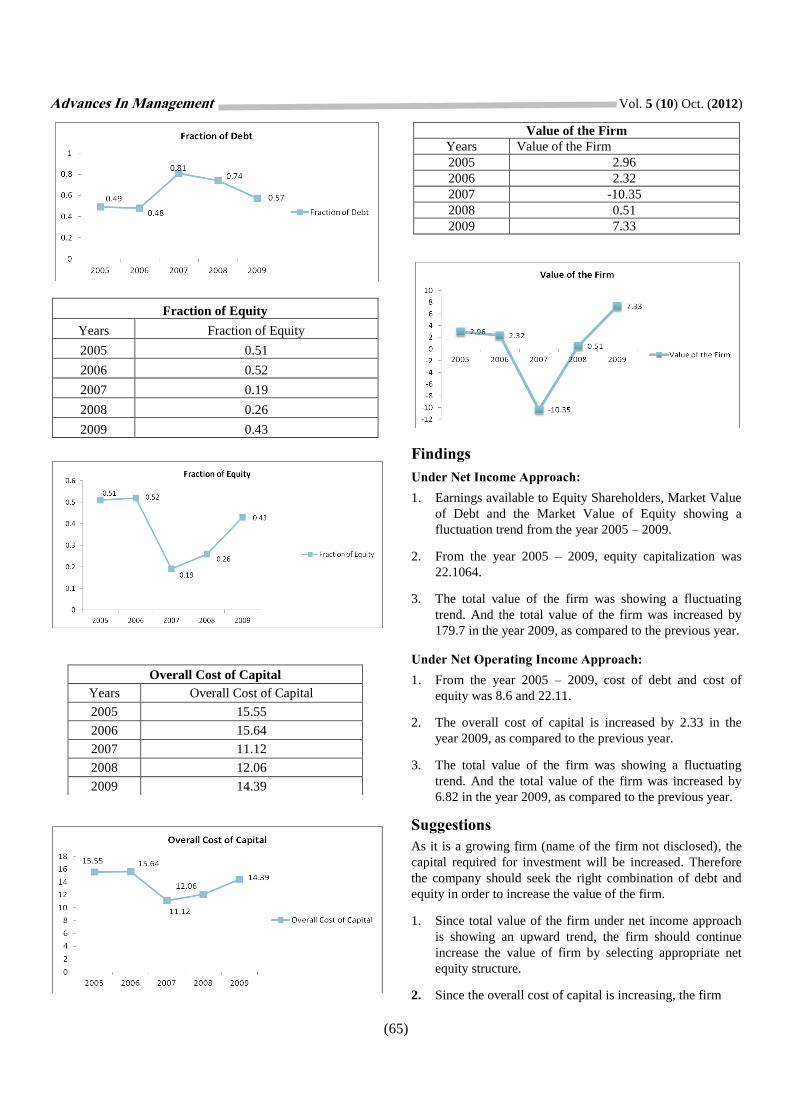
Fraction of Equity
Years Fraction of Equity
2005 0.51
2006 0.52
2007 0.19
2008 0.26
2009 0.43
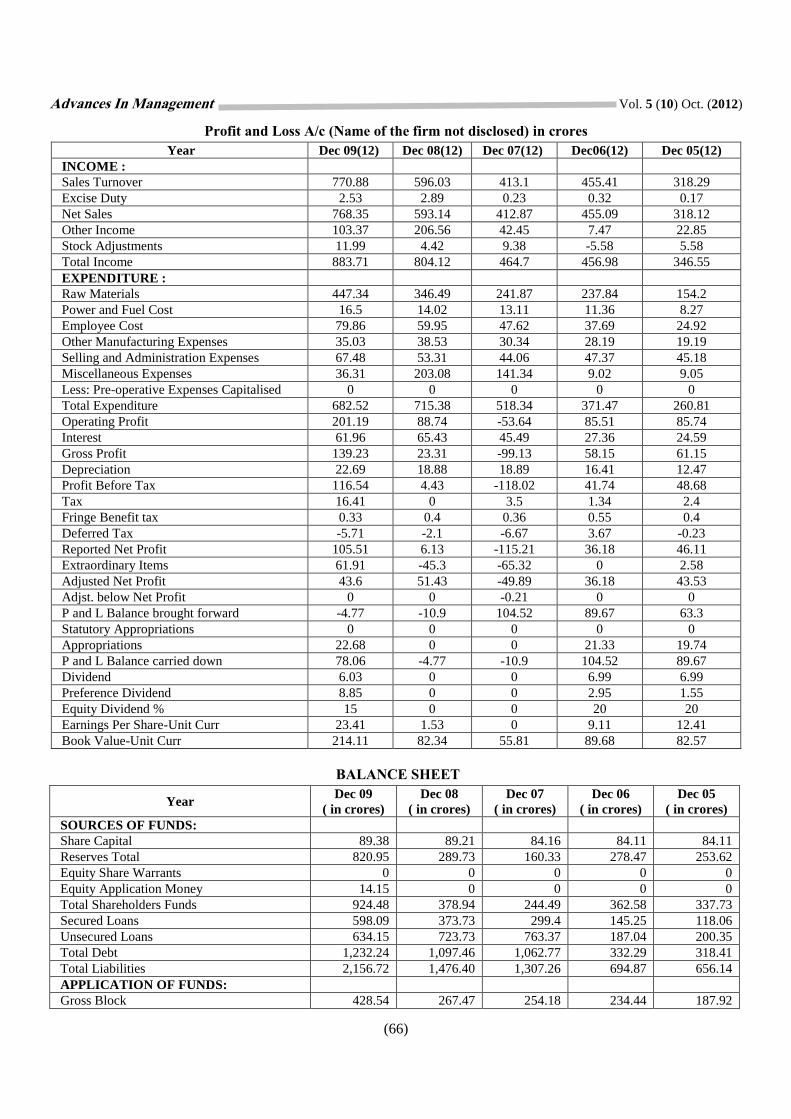
Value of the Firm
Years Value of the Firm
2005 2.96
2006 2.32
2007 -10.35
2008 0.51
2009 7.33
Findings
Under Net Income Approach:
1. Earnings available to Equity Shareholders, Market Value
of Debt and the Market Value of Equity showing a
fluctuation trend from the year 2005 – 2009.
2. From the year 2005 – 2009, equity capitalization was
22.1064.
3. The total value of the firm was showing a fluctuating
trend. And the total value of the firm was increased by
179.7 in the year 2009, as compared to the previous year.
Under Net Operating Income Approach:
1. From the year 2005 – 2009, cost of debt and cost of
equity was 8.6 and 22.11.
2. The overall cost of capital is increased by 2.33 in the
year 2009, as compared to the previous year.
3. The total value of the firm was showing a fluctuating
trend. And the total value of the firm was increased by
6.82 in the year 2009, as compared to the previous year.
Suggestions
As it is a growing firm (name of the firm not disclosed), the
capital required for investment will be increased. Therefore
the company should seek the right combination of debt and
equity in order to increase the value of the firm.
1. Since total value of the firm under net income approach
is showing an upward trend, the firm should continue
increase the value of firm by selecting appropriate net
equity structure.
2. Since the overall cost of capital is increasing, the firm
Overall Cost of Capital
Years Overall Cost of Capital
2005 15.55
2006 15.64
2007 11.12
2008 12.06
2009 14.39
Advances In Management Vol. 5 (10) Oct. (2012)
(66)
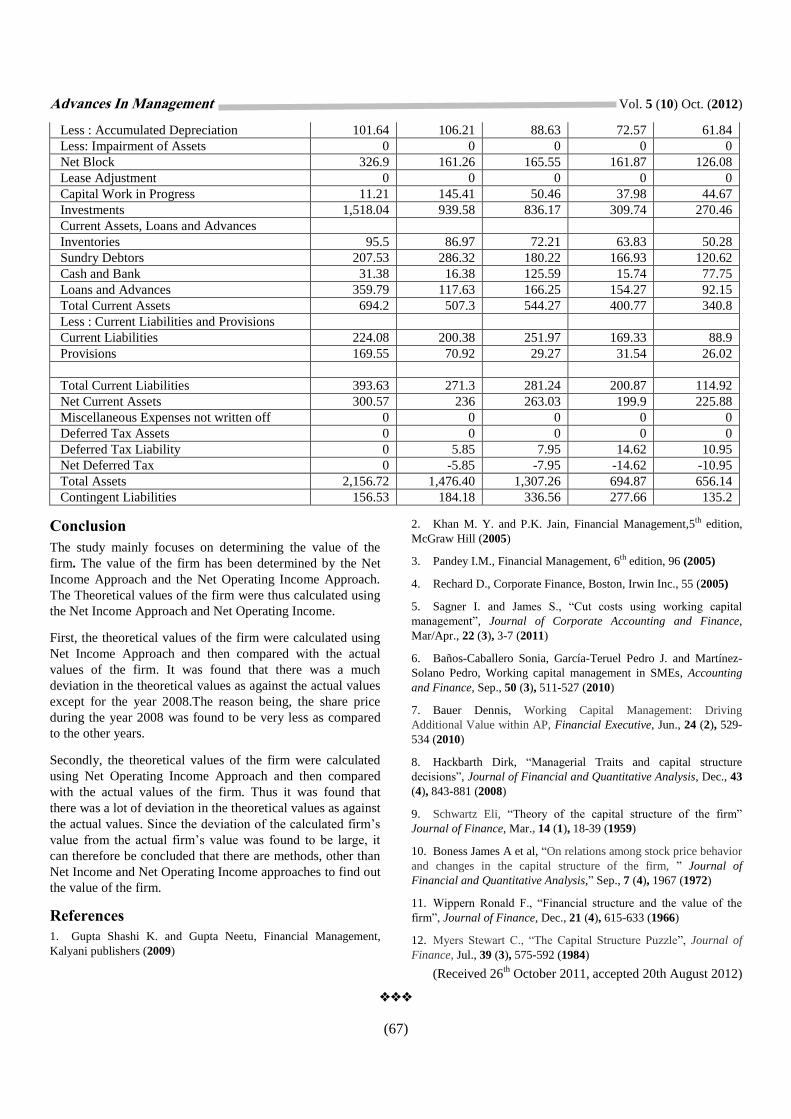
Profit and Loss A/c (Name of the firm not disclosed) in crores
Year Dec 09(12) Dec 08(12) Dec 07(12) Dec06(12) Dec 05(12)
INCOME :
Sales Turnover 770.88 596.03 413.1 455.41 318.29
Excise Duty 2.53 2.89 0.23 0.32 0.17
Net Sales 768.35 593.14 412.87 455.09 318.12
Other Income 103.37 206.56 42.45 7.47 22.85
Stock Adjustments 11.99 4.42 9.38 -5.58 5.58
Total Income 883.71 804.12 464.7 456.98 346.55
EXPENDITURE :
Raw Materials 447.34 346.49 241.87 237.84 154.2
Power and Fuel Cost 16.5 14.02 13.11 11.36 8.27
Employee Cost 79.86 59.95 47.62 37.69 24.92
Other Manufacturing Expenses 35.03 38.53 30.34 28.19 19.19
Selling and Administration Expenses 67.48 53.31 44.06 47.37 45.18
Miscellaneous Expenses 36.31 203.08 141.34 9.02 9.05
Less: Pre-operative Expenses Capitalised 0 0 0 0 0
Total Expenditure 682.52 715.38 518.34 371.47 260.81
Operating Profit 201.19 88.74 -53.64 85.51 85.74
Interest 61.96 65.43 45.49 27.36 24.59
Gross Profit 139.23 23.31 -99.13 58.15 61.15
Depreciation 22.69 18.88 18.89 16.41 12.47
Profit Before Tax 116.54 4.43 -118.02 41.74 48.68
Tax 16.41 0 3.5 1.34 2.4
Fringe Benefit tax 0.33 0.4 0.36 0.55 0.4
Deferred Tax -5.71 -2.1 -6.67 3.67 -0.23
Reported Net Profit 105.51 6.13 -115.21 36.18 46.11
Extraordinary Items 61.91 -45.3 -65.32 0 2.58
Adjusted Net Profit 43.6 51.43 -49.89 36.18 43.53
Adjst. below Net Profit 0 0 -0.21 0 0
P and L Balance brought forward -4.77 -10.9 104.52 89.67 63.3
Statutory Appropriations 0 0 0 0 0
Appropriations 22.68 0 0 21.33 19.74
P and L Balance carried down 78.06 -4.77 -10.9 104.52 89.67
Dividend 6.03 0 0 6.99 6.99
Preference Dividend 8.85 0 0 2.95 1.55
Equity Dividend % 15 0 0 20 20
Earnings Per Share-Unit Curr 23.41 1.53 0 9.11 12.41
Book Value-Unit Curr 214.11 82.34 55.81 89.68 82.57
BALANCE SHEET
Year Dec 09
( in crores)
Dec 08
( in crores)
Dec 07
( in crores)
Dec 06
( in crores)
Dec 05
( in crores)
SOURCES OF FUNDS:
Share Capital 89.38 89.21 84.16 84.11 84.11
Reserves Total 820.95 289.73 160.33 278.47 253.62
Equity Share Warrants 0 0 0 0 0
Equity Application Money 14.15 0 0 0 0
Total Shareholders Funds 924.48 378.94 244.49 362.58 337.73
Secured Loans 598.09 373.73 299.4 145.25 118.06
Unsecured Loans 634.15 723.73 763.37 187.04 200.35
Total Debt 1,232.24 1,097.46 1,062.77 332.29 318.41
Total Liabilities 2,156.72 1,476.40 1,307.26 694.87 656.14
APPLICATION OF FUNDS:
Gross Block 428.54 267.47 254.18 234.44 187.92
Advances In Management Vol. 5 (10) Oct. (2012)
(67)
Less : Accumulated Depreciation 101.64 106.21 88.63 72.57 61.84
Less: Impairment of Assets 0 0 0 0 0
Net Block 326.9 161.26 165.55 161.87 126.08
Lease Adjustment 0 0 0 0 0
Capital Work in Progress 11.21 145.41 50.46 37.98 44.67
Investments 1,518.04 939.58 836.17 309.74 270.46
Current Assets, Loans and Advances
Inventories 95.5 86.97 72.21 63.83 50.28
Sundry Debtors 207.53 286.32 180.22 166.93 120.62
Cash and Bank 31.38 16.38 125.59 15.74 77.75
Loans and Advances 359.79 117.63 166.25 154.27 92.15
Total Current Assets 694.2 507.3 544.27 400.77 340.8
Less : Current Liabilities and Provisions
Current Liabilities 224.08 200.38 251.97 169.33 88.9
Provisions 169.55 70.92 29.27 31.54 26.02
Total Current Liabilities 393.63 271.3 281.24 200.87 114.92
Net Current Assets 300.57 236 263.03 199.9 225.88
Miscellaneous Expenses not written off 0 0 0 0 0
Deferred Tax Assets 0 0 0 0 0
Deferred Tax Liability 0 5.85 7.95 14.62 10.95
Net Deferred Tax 0 -5.85 -7.95 -14.62 -10.95
Total Assets 2,156.72 1,476.40 1,307.26 694.87 656.14
Contingent Liabilities 156.53 184.18 336.56 277.66 135.2
Conclusion
The study mainly focuses on determining the value of the
firm. The value of the firm has been determined by the Net
Income Approach and the Net Operating Income Approach.
The Theoretical values of the firm were thus calculated using
the Net Income Approach and Net Operating Income.
First, the theoretical values of the firm were calculated using
Net Income Approach and then compared with the actual
values of the firm. It was found that there was a much
deviation in the theoretical values as against the actual values
except for the year 2008.The reason being, the share price
during the year 2008 was found to be very less as compared
to the other years.
Secondly, the theoretical values of the firm were calculated
using Net Operating Income Approach and then compared
with the actual values of the firm. Thus it was found that
there was a lot of deviation in the theoretical values as against
the actual values. Since the deviation of the calculated firm’s
value from the actual firm’s value was found to be large, it
can therefore be concluded that there are methods, other than
Net Income and Net Operating Income approaches to find out
the value of the firm.
References
1. Gupta Shashi K. and Gupta Neetu, Financial Management,
Kalyani publishers (2009)
2. Khan M. Y. and P.K. Jain, Financial Management,5th edition,
McGraw Hill (2005)
3. Pandey I.M., Financial Management, 6th edition, 96 (2005)
4. Rechard D., Corporate Finance, Boston, Irwin Inc., 55 (2005)
5. Sagner I. and James S., “Cut costs using working capital
management”, Journal of Corporate Accounting and Finance,
Mar/Apr., 22 (3), 3-7 (2011)
6. Baños-Caballero Sonia, García-Teruel Pedro J. and Martínez-
Solano Pedro, Working capital management in SMEs, Accounting
and Finance, Sep., 50 (3), 511-527 (2010)
7. Bauer Dennis, Working Capital Management: Driving
Additional Value within AP, Financial Executive, Jun., 24 (2), 529-
534 (2010)
8. Hackbarth Dirk, “Managerial Traits and capital structure
decisions”, Journal of Financial and Quantitative Analysis, Dec., 43
(4), 843-881 (2008)
9. Schwartz Eli, “Theory of the capital structure of the firm”
Journal of Finance, Mar., 14 (1), 18-39 (1959)
10. Boness James A et al, “On relations among stock price behavior
and changes in the capital structure of the firm, ” Journal of
Financial and Quantitative Analysis,” Sep., 7 (4), 1967 (1972)
11. Wippern Ronald F., “Financial structure and the value of the
firm”, Journal of Finance, Dec., 21 (4), 615-633 (1966)
12. Myers Stewart C., “The Capital Structure Puzzle”, Journal of
Finance, Jul., 39 (3), 575-592 (1984)
(Received 26th
October 2011, accepted 20th August 2012)

Copyright of Advances in Management is the property of Advances in Management and its content may not be
copied or emailed to multiple sites or posted to a listserv without the copyright holder's express written
permission. However, users may print, download, or email articles for individual use.