Embed Size (px)
Citation preview
Academia Revista Latinoamericana de AdministraciónFirm characteristics and intellectual capital disclosure in IPO prospectusesLeire Alcaniz Fernando Gomez-Bezares Jose Vicente Ugarte
Article information:To cite this document:Leire Alcaniz Fernando Gomez-Bezares Jose Vicente Ugarte , (2015),"Firm characteristicsand intellectual capital disclosure in IPO prospectuses", Academia Revista Latinoamericana deAdministración, Vol. 28 Iss 4 pp. 461 - 483Permanent link to this document:http://dx.doi.org/10.1108/ARLA-09-2014-0134
Downloaded on: 17 May 2016, At: 01:33 (PT)References: this document contains references to 58 other documents.To copy this document: [email protected] fulltext of this document has been downloaded 220 times since 2015*
Users who downloaded this article also downloaded:(2015),"Adoption of IFRS in an emerging market: the Chilean case", Academia RevistaLatinoamericana de Administración, Vol. 28 Iss 4 pp. 442-460 http://dx.doi.org/10.1108/ARLA-11-2014-0191(2015),"Editorial", Academia Revista Latinoamericana de Administración, Vol. 28 Iss 4 pp. 438-441http://dx.doi.org/10.1108/ARLA-09-2015-0251(2015),"Explaining job satisfaction and intentions to quit from a value-risk perspective", AcademiaRevista Latinoamericana de Administración, Vol. 28 Iss 4 pp. 523-540 http://dx.doi.org/10.1108/ARLA-07-2014-0094
Access to this document was granted through an Emerald subscription provided by emerald-srm:551360 []
For AuthorsIf you would like to write for this, or any other Emerald publication, then please use our Emeraldfor Authors service information about how to choose which publication to write for and submissionguidelines are available for all. Please visit www.emeraldinsight.com/authors for more information.
About Emerald www.emeraldinsight.comEmerald is a global publisher linking research and practice to the benefit of society. The companymanages a portfolio of more than 290 journals and over 2,350 books and book series volumes, aswell as providing an extensive range of online products and additional customer resources andservices.
Emerald is both COUNTER 4 and TRANSFER compliant. The organization is a partner of theCommittee on Publication Ethics (COPE) and also works with Portico and the LOCKSS initiative fordigital archive preservation.
*Related content and download information correct at time of download.
Dow
nloa
ded
by U
NIV
ER
SIT
AS
TR
ISA
KT
I, U
ser
Usa
kti A
t 01:
33 1
7 M
ay 2
016
(PT
)
FINANCE
Firm characteristics andintellectual capital disclosure
in IPO prospectuses
Características de las empresasy revelación de capital
intelectual en los folletosde emisión
Leire Alcaniz and Fernando Gomez-BezaresDepartment of Finance and Accounting, University of Deusto, Bilbao, Spain, and
Jose Vicente UgarteDepartment of Quantitative Techniques, University of Deusto, Bilbao, Spain
AbstractPurpose – Initial Public Offerings (IPOs) have been studied from different perspectives. The purposeof this paper is to analyse the type of intellectual capital (IC) information provided in the Spanish IPOprospectuses and the characteristics of the firms that go public and supply more information.The paper also compares the results with similar previous studies carried out in different countries.Design/methodology/approach – The database gathers Spanish IPOs from 1996 to 2007 (after whichthe number of IPOs in Spain plummeted due to the crisis). Content analysis is used to obtain informationabout IC from the IPO prospectuses and, afterwards, the authors apply different statistical methods toanalyse any relation between IC disclosure and firms’ characteristics.Findings – The paper concludes that the companies that provide more information about IC in IPOprospectuses are high-tech companies, larger firms and those whose previous shareholders do notretain the majority after the IPO.Originality/value – The authors have created an original database with the Spanish data. Moreover,this is the first study with these characteristics carried out in Spain, and some original conclusions areobtained, such as the importance of retained share percentage by previous shareholders. The authorshave developed a statistical methodology suitable for the data. Both, the conclusions and the methodologywill be especially useful for markets such as the Latin American ones, which are not as developed asAnglo-Saxon markets.Keywords Initial public offering, IPO prospectus, Intellectual capital, Content analysis,Non-accounting informationPaper type Research paper
Academia RevistaLatinoamericana de
AdministraciónVol. 28 No. 4, 2015
pp. 461-483©Emerald Group Publishing Limited
1012-8255DOI 10.1108/ARLA-09-2014-0134
Received 25 September 2014Revised 31 March 2015
29 April 201514 June 2015
Accepted 22 August 2015
The current issue and full text archive of this journal is available on Emerald Insight at:www.emeraldinsight.com/1012-8255.htm
JEL Classification — G14, G32, M21The authors want to thank the participants at the IVWorld Finance Conference (Cyprus, 2013)
and at the IX International Accounting Research Symposium (Madrid, 2013) for their helpfulcomments on a previous version of this paper. The authors thank specially the comments of theeditors and referees, whose suggestions have considerably improved the paper.
461
IC disclosurein IPO
prospectuses
Dow
nloa
ded
by U
NIV
ER
SIT
AS
TR
ISA
KT
I, U
ser
Usa
kti A
t 01:
33 1
7 M
ay 2
016
(PT
)
Resumen estructuradoPropósito – Las Ofertas Públicas Iniciales (OPIs) se han estudiado desde distintas perspectivas. Esteartículo trata de analizar qué tipo de información sobre capital intelectual se suministra en los folletosde emisión de las OPIs españolas y las características de las empresas que salen a bolsa que proveen demás información. El trabajo también compara los resultados con estudios previos similares llevados acabo en distintos países.Diseño/metodología/enfoque – La base de datos recoge las OPIs españolas desde 1996 a 2007(tras este año, debido a la crisis, las OPIs españolas casi desaparecieron durante varios años). Se empleael análisis de contenidos para recopilar la información sobre capital intelectual (CI) de los folletos deemisión y, tras ello, los autores aplican distintos métodos estadísticos para analizar la relación entre elsuministro de información sobre CI y las características de las empresas.Resultados – El estudio concluye que las compañías que proveen más información sobre CI en losfolletos de emisión son las altamente tecnológicas, las más grandes y aquéllas en las que sus antiguosaccionistas no mantienen la mayoría tras la OPI.Originalidad/valor – Los autores han creado una base de datos original con información española.Además, éste es el primer estudio de estas características realizado en España y obtiene algunasconclusiones originales como la importancia del porcentaje de acciones mantenido por los antiguosaccionistas. Los autores han desarrollado una metodología estadística adecuada a los datos disponibles.Tanto las conclusiones como la metodología serán especialmente útiles para aquellos mercados que no seencuentran tan desarrollados como los anglosajones, como por ejemplo los mercados latinoamericanos.Palabras clave Oferta Pública Inicial, folleto de emision, capital intelectual, análisis de contenido,información no financieraTipo de trabajo Trabajo de investigación
1. IntroductionIn recent years, developed economies have been intensive on services and knowledge-based companies. These kinds of firms base their value creation on intangible resourcesthat cannot be assessed using traditional financial measures. Concepts such as researchand development (R&D), innovation, sustainability and corporate social responsibility aregaining importance and are part of the intellectual capital (IC) of the firm. There is a widelyaccepted definition of IC as knowledge, applied experience, organizational technology,customer relationships and professional abilities, which provide competitive advantage inthe market (Edvinsson andMalone, 1997). IC can be divided into three main pillars: humancapital (HC), structural or internal capital (SC) and relational or external capital (RC). Thefirst one gathers knowledge, abilities, leadership, teamwork and other capacities, whichare possessed by employees individually. Structural capital is possessed by companiesand it takes into account databases, structural organization, management processes,know-how and R&D among other issues. Finally, relational capital deals withinteractions between the firm and its external stakeholders, including elements such as,brand, image or commercial power (Edvinsson and Malone, 1997; Boedker et al., 2005).There is a basic process for knowledge creation, where HC improvements will increasestructural capital, and this will improve the stocks of relational capital ( Jardon andMartos, 2012). These three forms of capital are interlinked (Mention and Bontis, 2013).
These three pillars are sources of competitive advantage and value creation forcompanies and their importance has increased during the last decades (Nakamura,2003). The OECD (1996) recognized HC as the key to increasing competitiveness andwealth at country level; thus, HC should also be considered as a source of competitiveadvantage at firm level. The “knowledge-worker” and the “knowledge-creating company”create “sustained and trusted relationships” as a key for business competitiveness(Martín-de-Castro et al., 2011). Companies with higher levels of IC or better IC efficiency,
462
ARLA28,4
Dow
nloa
ded
by U
NIV
ER
SIT
AS
TR
ISA
KT
I, U
ser
Usa
kti A
t 01:
33 1
7 M
ay 2
016
(PT
)

have more competitive advantage and a better performance (Ireland et al., 2002; Chen et al.,2005; Kamukama et al., 2011; Barrick et al., 2015).
Therefore, firms should disclose information about their IC so that investors knowabout the real situation of the company in terms of physical, financial and IC and can,therefore, make better decisions (Holland, 2003; Riahi-Belkaoui, 2003; Marr, 2005).However, financial rules do not allow us to recognize all these elements as they aredifficult to measure and value; in fact, only some of them are recognized in financialstatements as intangible assets considering they must fulfil hard and specificconditions. Currently, annual accounts are failing to predict the stock price, because ofthe IC resources that are missing in the balance sheet (Lev, 2001). The scarcity ofaccounting information about IC makes it difficult to develop research and ICmanagement (Shakina and Barajas, 2014). That is why firms require the creation ofnew ways to measure and communicate IC, which they have done by employingqualitative methods as well as other methods that try to measure or value elementsrelated to IC, e.g., the Balanced Scorecard (Kaplan and Norton, 1996, 2008) and theInternational Integrated Reporting (IIR Council, 2013).
Accounting rules do not require companies to report on total IC, but there aresituations in which companies may be interested in providing more information than isstrictly required (Beyer et al., 2010). It is of vital importance, for example, for potentialnew investors to know about companies going public for the first time by aninitial public offering (IPO). Unlisted companies often have less impact on the mediaand they are not required to provide as much information as listed companies. In thiscase, when they go public, they do not only offer traditional financial information, butalso complementary data that may be of interest to potential shareholders for a bettervaluation of the company. Financial markets try to be more transparent and for this tohappen a series of European directives try to improve the information supplied in theprospectuses where many of the proposed changes are based on non-accountinginformation. Clearly, the quality of the information offered by companies is highlyappreciated by the market (Martínez-Ferrero, 2014) and that is why this study focuseson IC information that is an increasingly important facet of information.
Currently, there is growing interest in IPOs (Dambra et al., 2015; Doidge et al., 2013).Previous literature has shown that there are excess returns on IPOs (see, e.g. Lowryet al., 2010), implying a higher cost of equity capital. So in an attempt to reduce theinformation asymmetry, firms provide non-financial information, which is considerablydecisive when making investment decisions (Balatbat, 2006; Guo et al., 2004).
Companies going public, in addition to the audited financial statements, supply anIPO prospectus, which includes non-accounting information. It is expected, therefore,that if they provide more information, they will get a better offer price and a lower costof capital (Guo et al., 2006; Hsu et al., 2012). Several studies analyse non-financialinformation provided by companies in the IPO reports in different countries (Bukhet al., 2005 in Denmark; Cordazzo, 2007 in Italy; Cazavan-Jeny and Jeanjean, 2007 inFrance; Rimmel et al., 2009 in Japan) to try to determine what kind of companiesprovide more information on IC in their prospectuses. The objective of this paper is toexamine, first, which IC elements are most frequently commented on by Spanish firmsin the IPO prospectuses and, second, whether the type of information supplied dependson the specific characteristics of firms or IPOs. Although prior studies have addressedthis research question, this paper differs in four different perspectives. First of all, thehypotheses are developed based on the four theories proposed by An et al. (2011) whichenhance voluntary IC disclosure (agency theory, signalling theory, legitimacy theory
463
IC disclosurein IPO
prospectuses
Dow
nloa
ded
by U
NIV
ER
SIT
AS
TR
ISA
KT
I, U
ser
Usa
kti A
t 01:
33 1
7 M
ay 2
016
(PT
)

and stakeholder theory), while prior papers are basically based on agency andsignalling theories. Second, these kinds of studies are undertaken in countries wherestock exchange markets are widely developed. In this case, our market of reference hassome special characteristics that will be explained below. Moreover, the periodconsidered is longer than usual, and this allows us to verify whether the IPO momentinfluences information disclosure. Third, this paper considers some differentexplanatory variables to the common prior literature and, finally, the study uses adifferent statistical approach specific for the characteristics of the market.
For the analysis, we consider the IPOs in Spain. It is very interesting to study theSpanish market because although the stock exchange market has been sophisticatedduring the last 25 years, its IPO development is quite low compared to other Europeancountries or main worldwide capital markets. Spanish companies, a great percentage ofthem SMEs, are reluctant to supply information and be transparent, which is essentialwhen it comes to entering capital markets to obtain funds. Latin American stock marketsare very similar in this sense, as the number of IPOs has been quite low and, culturally,companies are also reluctant to disclose information (Aggarwal et al., 1993; Patel andDallas, 2002). When companies go public, the offer price is usually under-priced all overthe world. Studies in Chile (Gregoire and Castillo, 2009) or Mexico (Hensler et al., 2000),among others, have confirmed this. This means that firms are leaving money on the table.
Moreover, Latin America’s future is linked to the creation of strategic alliances andnetworks among companies in order to innovate and to take advantage of theirindividual resources (Sanz and Jones, 2013). Hence, the information about IC orintangible resources is increasingly important, not only to manage the firm, but also todisclose the reality of the organizations, beyond financial information and get morereliable valuations of the companies. Some of those countries, such as Brazil, Chile orEcuador are improving their accounting information through the adoption of IFRS inorder to “allow the different participants of the market evaluate the company in a moreproper manner” ( Jara Bertín and Arias Moya, 2013, p. 140). In the case of the NovoMercado of BM&F Bovespa of Brazil, companies listed in that market must fulfiladditional information requirements. In doing so, they get a better market value(Rossoni andMachado-da-Silva, 2013), although the information required is mostly relatedto financial statements and corporate governance, and not to IC information. There ismuch to be done in these markets in order to improve transparency and, specifically, ICinformation disclosure. Due to the fact that Latin American and Spanish markets areculturally and legislatively similar and different to Anglo-Saxon markets, our study couldbe interesting for academics, practitioners and LATAM and Spanish regulatory bodies.
The database used in this paper has been gathered specifically for this research usinginformation provided in the IPO prospectuses of companies going public from 1996 to 2007.IC information is measured through the indicator proposed by Bukh et al. (2005) and Cumbyand Conrod (2001), already tested in prior studies. Besides, we explain the IC disclosure withvariables related to company characteristics (sector, size and age) and the IPO (period andretained ownership). We use an original methodology for the analysis adapted to financialmarkets with a smaller number of companies quoting on the stock exchange. This is morecommon in Latin American stock exchanges than in the Anglo-Saxon markets.
The paper concludes that high-tech organizations, larger firms and companieswhose previous shareholders do not retain the majority after the IPO provide moreinformation about their IC. These results demonstrate that firms really think thatthey can mitigate the effect of bad signals, such as low levels of retained ownershipafter the IPO, disclosing more information. They are also aware of the importance of
464
ARLA28,4
Dow
nloa
ded
by U
NIV
ER
SIT
AS
TR
ISA
KT
I, U
ser
Usa
kti A
t 01:
33 1
7 M
ay 2
016
(PT
)
showing their IC when their competitive advantage comes through knowledge or R&Din order to reduce information asymmetries and agency problems. And, finally, wedemonstrate that big companies are persuaded to provide more information in order tobe legitimated by society and to go through a more successful IPO process.
This study will be structured as follows. In the next section, the authors will developthe hypotheses that can affect the amount of information disclosed in prospectuses.In the third section, there will be an explanation of how the database has been created.This explanation will address the sample of firms, their characteristics and also the ICinformation that will be examined. The third section ends by explaining the researchmethodology. In the fourth section, the authors show the results of the econometricmodels. Finally, some conclusions will be discussed.
2. Hypothesis developmentIn this section, we will explain which firm or IPO characteristics could influence theinformation provided by companies in their IPO prospectuses. IC disclosure is basedon four different theories: agency theory, signalling theory, legitimacy theory andstakeholder theory (An et al., 2011). Agency theory ( Jensen and Meckling, 1976) statesthat the objectives of management and shareholders are usually not aligned. This willgenerate a problem of lack of confidence by the latter, aggravated by the asymmetricinformation. The management will have a better knowledge of the company as theyare in the organizational operating activity. In order to decrease the asymmetry,managers should provide additional information. In fact, when the company is goingpublic, the firm needs to attract new investors and as the IC is a value driver fororganizations, firms should be open to disclose this kind of data. Decreasing theasymmetry could reduce the IPO’s cost of capital (Singh and Van der Zahn, 2008).
For example, companies whose sources of competitiveness are knowledge, researchor employees will have more information about IC and will be willing to supply it intheir prospectuses to show their non-financial situation. Many studies have tried tocheck whether the sector influences the information provided by firms studying IPOprospectuses (see Bukh et al., 2005; Bozzolan et al., 2006), or annual financialstatements of listed companies (e.g. Cordazzo, 2007; Mangena et al., 2010). They haveachieved significant results in the proposed sense. According to the accounting rules, themost important factors of competitiveness of technological and knowledge-basedcompanies cannot be shown. The business of those kinds of firms depends on ICcomponents that will be explained to investors through non-financial information.
Specifying by categories, high technology and knowledge-based firms, where employeesare key resources, which cannot be replaced easily, should show more information aboutHC. Their work requires specific knowledge and advanced skills to solve complexproblems, such as creating new products, eradicating diseases, etc. Furthermore, thestructural capital should be higher in high-tech companies, as they are intensive in R&Dand information technologies. Finally, with regard to relational capital, differences are notexpected according to the sector. Any potential investor might be interested in the expecteddemand and the interactions among stakeholders within the firm, regardless of its sector.However, in general, high-tech companies should disclose more IC information. Ourpurpose is to observe whether these kinds of organizations are aware of the importance oftheir IC and prepared to disclose it, in order to obtain more funds in the IPO:
H1. The sector of the individual firm influences the IC information provided in theIPO prospectus.
465
IC disclosurein IPO
prospectuses
Dow
nloa
ded
by U
NIV
ER
SIT
AS
TR
ISA
KT
I, U
ser
Usa
kti A
t 01:
33 1
7 M
ay 2
016
(PT
)

The asymmetric information is different according to the age of the organizations.Younger companies should provide more data as they usually are not well establishedand will not be as well known among investors, who will be assuming a higher risk.Kim and Ritter (1999) explained that younger firms do not get such a positive andaccurate valuation when they use only historical information, as when they use otherindicators, such as the expected profits. We think that non-financial information shouldassist investors in their valuation.
Other studies have raised the same hypothesis in terms of IPOs. Rimmel et al. (2009) orRashid et al. (2012) found significant results in this sense. However, other studies have notachieved significant results related to age (Bukh et al., 2005; Cordazzo, 2007). The purposeof this paper is to add to the discussion around this topic and support the IC disclosure asa way of reducing the information asymmetry and the agency problem, looking at thecharacteristics, which are more decisive in moderately developed markets:
H2. The age of the firm when it goes public negatively influences the IC informationprovided in the IPO prospectus.
On the other hand, if existing shareholders will get less involved in the firm after theIPO, the company will need to sell more shares on the market. In that circumstance,the firm will need to disclose more information so that investors are better informed(Guo et al., 2004; Cazavan-Jeny and Jeanjean, 2007).
In this case, besides the agency problem, the signalling theory (Ross, 1977) also hasan effect on disclosure. The signalling theory specifies that asymmetric informationcould be reduced by signals; that is, actions or behaviours of the firm. In the case of acompany going public, the retained ownership of previous shareholders is a signal ofthe firm’s future performance. If shareholders are selling a high percentage, newinvestors may think that the company will not perform well in the long term. Ifprevious shareholders retain a very high percentage in the company, the market willperceive a positive involvement of the current shareholders and their trust in the futureof the firm (Leland and Pyle, 1977). Therefore, in this paper we will observe whetherlow-retained ownership means that the firm has to compensate for the unsatisfactorysign by disclosing more information:
H3. The retained ownership by previous shareholders negatively influences the ICinformation provided in the IPO prospectus.
The legitimacy theory is the third theory mentioned above to enhance IC disclosure.This theory states that companies have an obligation with society and that they have tooperate within the bounds and norms of their respective societies (Brown and Deegan,1998; Kent and Zunker, 2013). The behaviour of the firm is important and is the way inwhich the organization gets involved with different stakeholders. Consequently, thecompany will have to disclose more information than just financial or compulsory data.
Different studies about information disclosure conclude that bigger companies tendto provide more information than smaller ones. As explained in Chavent et al. (2006),larger, better-known firms, may be more vulnerable to government intervention orlitigation. That is why they will be willing to provide more information. Moreover, asthey can cope with the costs to provide more data and may feel more protected againstcompetitors when revealing information (in this regard see also the results achieved byAhmed and Courtis, 1999), bigger companies are in a better position to fulfil society’sinformation requirements and, as such, gain legitimacy. In addition, larger companieswould have more employees and would need complex processes and elaborated
466
ARLA28,4
Dow
nloa
ded
by U
NIV
ER
SIT
AS
TR
ISA
KT
I, U
ser
Usa
kti A
t 01:
33 1
7 M
ay 2
016
(PT
)

organizational structures in order to operate properly; therefore, they should providemore information about human and structural capital:
H4. The size of the firm positively influences the IC information provided in the IPOprospectus.
Finally, the stakeholder theory (Freeman, 1994) states that the shareholder is not themain component of the firm. Different stakeholders participate by creating competitiveadvantage and a better performance for the company, and some of them are essentialfor the success of the business (Watts and Zimmerman, 1986). Hence, it is not onlyfuture investors that will be interested in the firm going public, but other participantswill also want to know more about the situation of the firm, the IPO and itsimplications. In recent years, different stakeholders have been increasinglyinterested in the information about IC, as this could reduce the informationasymmetry, improving the relationships between managers and the rest of thestakeholders (An et al., 2011).
Thus, the elements within the IC concept have become increasingly relevant forcompanies over time. At the same time, changes in legislation have made it compulsoryfor firms to provide more information about non-financial concepts. Therefore, it isexpected that companies that have recently gone public provide more informationon IC in general terms rather than those which went public before. García-Meca andMartínez (2007) found in a study focused on financial analysts’ reports that inSpain IC information provided in 2003 is better than IC information providedin previous years. An objective of this paper is to check whether the interest in IC hasbeen increasingly important also for this specific moment in the life of the firm, whenit is going public:
H5. The year (or period) when the firm went public positively influences the ICinformation provided in the IPO prospectus.
3. Sample selection, variables and methodologyIn this section, we will describe the sample used in the research, the independent anddependent variables and the methodology we have used in the study.
3.1 Sample selectionFor this study, the sample gathered information about the IPOs performed between1996 and 2007 in the Spanish stock market (63 firms). Companies had to be based inSpain. There were no IPOs in 1995 and prior prospectuses were not available.Due to the economic crisis that began in 2008, the number of IPOs has fallen drastically.Some of them have chosen to be listed on theMercado Alternativo Bursátil (AlternativeStock Market), whose requirements are easier to fulfil and which is aimed at smallercompanies. In fact, there are only two IPOs from 2008 to 2013 that fulfil all therequirements to be included in the database. However, we have not included thembecause they would distort our results. From the total 63 companies which startedtrading in the Spanish stock exchange interconnection system from 1996 to 2007,the first screening of data demonstrated that two companies were based outside ofSpain, the second data screening showed that three firms were already trading in someof the Spanish stock exchange markets and, finally, two companies had alreadygone public before. After applying those filters, the number of companies in the samplediminished to 56. The database has been created ad hoc for this research.
467
IC disclosurein IPO
prospectuses
Dow
nloa
ded
by U
NIV
ER
SIT
AS
TR
ISA
KT
I, U
ser
Usa
kti A
t 01:
33 1
7 M
ay 2
016
(PT
)

3.2 Firm and IPO characteristicsThis study is going to analyse the following company characteristics: the sector; theyear (period) when the firm went public; the age of the company; company size(measured by number of employees, sales and assets); and the shareholders’ ownershipheld after the IPO. These characteristics will operate as explanatory variables in themodels that will be developed to contrast the hypotheses.
Companies are divided into two sectors. High-tech companies, including knowledge,R&D or information technologies based firms, and low-tech companies, includingcommunication, services and production companies. Authors such as Bukh et al. (2005)or Mangena et al. (2010) have also used this division. Table I shows the firms’distribution by sector and year when they went public.
Table II, Panel A, shows the descriptive statistics of size, measured by thenumber of employees when the firm goes public, the total assets and the totalsales of the firm in the year previous to the IPO, age and previous shareholders’ownership after the IPO.
Spanish companies going public are larger than Danish and Japanese firms whenthey are measured by number of employees (Rimmel et al., 2009), and larger thanFrench firms (Cazavan-Jeny and Jeanjean, 2007) when measured in terms of sales.In addition, Spanish companies had an average age of 27 years when they went public,similar to the Danish market, but older than firms in France, Japan, Malaysia (Rashidet al., 2012) or Singapore (Singh and Van der Zahn, 2008).
Table II, Panels B and C, show the relationship between these characteristicsusing Pearson’s and Spearman’s correlation coefficients. As expected, the threevariables measuring size are positively related. Note that although Pearson’scorrelation coefficient reflects no significant relationship between employees andassets, Spearman’s correlation coefficient does.
SectorHigh-tech Low-tech Total no. of IPOs %
Year1996 1 2 3 51997 0 7 7 131998 1 6 7 131999 6 3 9 162000 2 2 4 72001 1 1 2 42002 0 1 1 22004 0 3 3 52005 1 0 1 22006 4 5 9 162007 7 3 10 18Total 23 33 56% 41 59 100 100Notes: This table shows the distribution of companies by sector and year when companies wentpublic (from 1996 to 2007). Companies are divided in two sectors: high-tech companies (includingknowledge, R&D or information technologies based firms) and low-tech companies (includingcommunication, services and production companies)
Table I.Number ofcompanies by firmsector and IPO year
468
ARLA28,4
Dow
nloa
ded
by U
NIV
ER
SIT
AS
TR
ISA
KT
I, U
ser
Usa
kti A
t 01:
33 1
7 M
ay 2
016
(PT
)

3.3 IC informationWe will employ the methodology of content analysis when measuring IC information inIPO prospectuses. The indicator intends to specify the amount of information disclosedin the prospectus. This indicator is developed with various items related to IC and wecan assume that those companies that have more IC will be more interested inmentioning more items rather than companies with a less IC. See Equation (1) forthe indicator measuring the total number of items supplied in the prospectus andEquation (2) for the IC disclosure index (in percentages):
TOTAL IS ¼XM
i¼1
di (1)
IS Disc ð%Þ ¼PM
i¼1 diM
� 100 (2)
where TOTAL IS is the total number of supplied items; di equals 1 when firm talksabout item i in the IPO prospectus and 0 when firm does not talk about it; M the total
Panel A: descriptive statisticsMean SD Minimum Median Maximum
SizeNo. of employees(thousands) 2.991 5.244 0.038 0.984 27.607Sales (mill. €) 533.67 865.32 9.03 218.38 4,361.69Assets (mill. €) 1,288.67 3,593.32 16.55 327.81 25,912.72Age (no. of years) 26.53 25.19 1.00 22.75 115.00Previous shareholders (%) 65.34 15.95 9.38 69.43 96.54
Panel B: Pearson’s correlationsEmployees Assets Sales Age Previous
shareholdersEmployees 1.0000 0.1088 0.7412*** 0.1580 0.0834Assets 0.1088 1.0000 0.4447*** −0.0380 0.1635Sales 0.7412*** 0.4447*** 1.0000 0.0443 0.1473Age 0.1580 −0.0380 0.0443 1.0000 −0.0008Previous shareholders 0.0834 0.1635 0.1473 −0.0008 1.0000
Panel C: Spearman’s correlationsEmployees 1.0000 0.5096*** 0.7239*** 0.0011 0.1538Assets 0.5096*** 1.0000 0.8724*** 0.0417 0.2187Sales 0.7239*** 0.8724*** 1.0000 0.0521 0.1837Age 0.0011 0.0417 0.0521 1.0000 −0.0748Previous shareholders 0.1538 0.2187 0.1837 −0.0748 1.0000Notes: n¼ 56 firms. This table shows in Panel A the basic descriptive statistics of variablesmeasuring the size, age and retained ownership. The size is measured using the number of employees,total sales and total assets. Total sales and assets are in millions of Euros of 1995. The age is thenumber of years from the creation of the company until the moment of the IPO. The previousshareholders (%) is the retained ownership by previous shareholders after the IPO in percentage.Panel B and C show their Pearson’s and Spearman’s correlation coefficients. *,**,***Significant at the5 and 1 per cent and 1 per thousand levels, respectively
Table II.Summary statistics
for size, age andprevious
shareholders’ownership
469
IC disclosurein IPO
prospectuses
Dow
nloa
ded
by U
NIV
ER
SIT
AS
TR
ISA
KT
I, U
ser
Usa
kti A
t 01:
33 1
7 M
ay 2
016
(PT
)
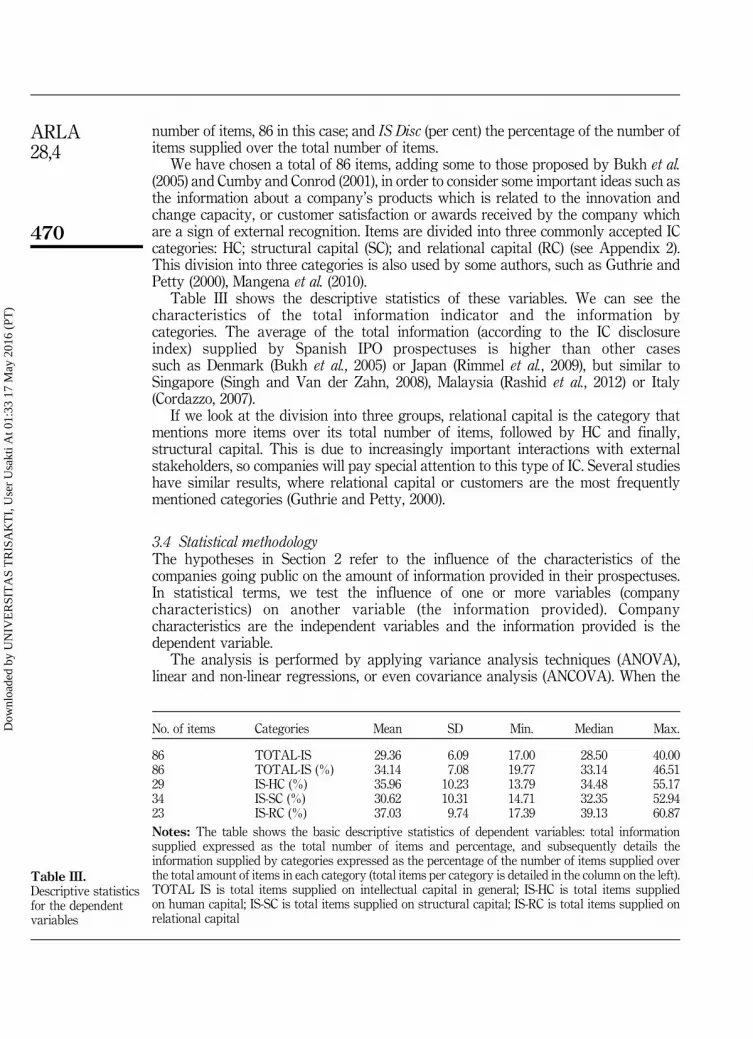
number of items, 86 in this case; and IS Disc (per cent) the percentage of the number ofitems supplied over the total number of items.
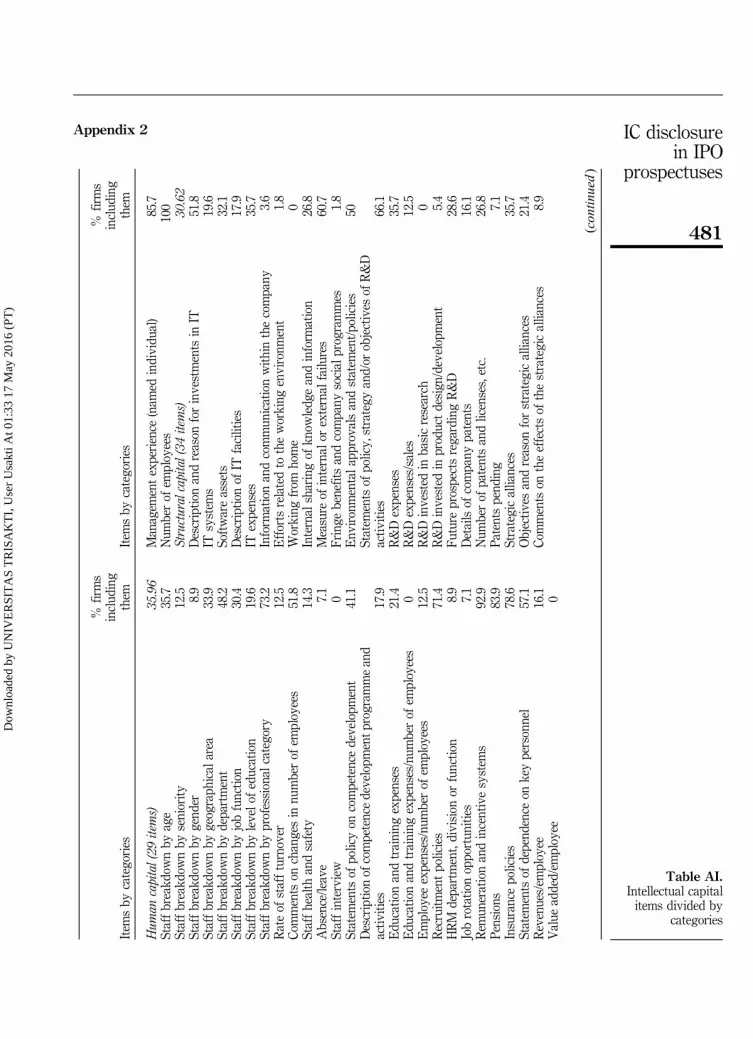
We have chosen a total of 86 items, adding some to those proposed by Bukh et al.(2005) and Cumby and Conrod (2001), in order to consider some important ideas such asthe information about a company’s products which is related to the innovation andchange capacity, or customer satisfaction or awards received by the company whichare a sign of external recognition. Items are divided into three commonly accepted ICcategories: HC; structural capital (SC); and relational capital (RC) (see Appendix 2).This division into three categories is also used by some authors, such as Guthrie andPetty (2000), Mangena et al. (2010).
Table III shows the descriptive statistics of these variables. We can see thecharacteristics of the total information indicator and the information bycategories. The average of the total information (according to the IC disclosureindex) supplied by Spanish IPO prospectuses is higher than other casessuch as Denmark (Bukh et al., 2005) or Japan (Rimmel et al., 2009), but similar toSingapore (Singh and Van der Zahn, 2008), Malaysia (Rashid et al., 2012) or Italy(Cordazzo, 2007).
If we look at the division into three groups, relational capital is the category thatmentions more items over its total number of items, followed by HC and finally,structural capital. This is due to increasingly important interactions with externalstakeholders, so companies will pay special attention to this type of IC. Several studieshave similar results, where relational capital or customers are the most frequentlymentioned categories (Guthrie and Petty, 2000).
3.4 Statistical methodologyThe hypotheses in Section 2 refer to the influence of the characteristics of thecompanies going public on the amount of information provided in their prospectuses.In statistical terms, we test the influence of one or more variables (companycharacteristics) on another variable (the information provided). Companycharacteristics are the independent variables and the information provided is thedependent variable.
The analysis is performed by applying variance analysis techniques (ANOVA),linear and non-linear regressions, or even covariance analysis (ANCOVA). When the
No. of items Categories Mean SD Min. Median Max.
86 TOTAL-IS 29.36 6.09 17.00 28.50 40.0086 TOTAL-IS (%) 34.14 7.08 19.77 33.14 46.5129 IS-HC (%) 35.96 10.23 13.79 34.48 55.1734 IS-SC (%) 30.62 10.31 14.71 32.35 52.9423 IS-RC (%) 37.03 9.74 17.39 39.13 60.87Notes: The table shows the basic descriptive statistics of dependent variables: total informationsupplied expressed as the total number of items and percentage, and subsequently details theinformation supplied by categories expressed as the percentage of the number of items supplied overthe total amount of items in each category (total items per category is detailed in the column on the left).TOTAL IS is total items supplied on intellectual capital in general; IS-HC is total items suppliedon human capital; IS-SC is total items supplied on structural capital; IS-RC is total items supplied onrelational capital
Table III.Descriptive statisticsfor the dependentvariables
470
ARLA28,4
Dow
nloa
ded
by U
NIV
ER
SIT
AS
TR
ISA
KT
I, U
ser
Usa
kti A
t 01:
33 1
7 M
ay 2
016
(PT
)

explanatory variables are nominal or ordinal, we use variance analysis; when they areinterval variables (continuous variables), we use regression analysis; and when theyare mixed categorical and continuous variables, covariance analysis is used.
4. Analysis and resultsFirst, we will proceed with an initial analysis of the influence of each of the firmcharacteristics on the total IC information and the information provided by categories.In the second stage of the analysis, based on the variables selected in the first stage,we will analyse the influence of all the characteristics simultaneously to prove whichone is influencing and develop a model.
4.1 First stage: individual analysis of the characteristicsThe first analysis shows that high-tech companies provide more information on IC ingeneral (26.39 items low-tech firms and 33.61 items high-tech firms). The influence ofthe sector is significant due to structural capital information, which is logical becausewe are talking about R&D or information technologies in high-tech firms (we do notshow the numerical results of the ANOVA in this and following occasions to shortenthe paper, but data are available upon request to the corresponding author).
According to the second analysis, the information provided in the prospectusesvaries depending on the period of the IPO. In fact, there is a main difference betweenthe oldest IPOs (before 1999) and the rest of them. The former supply significantly lessinformation. However, the results achieved by the previous tests can be distorted,because it is possible that sector and period variables are related. To check this,we perform the χ2 test between these two variables (dividing the sector intohigh- low-tech firms and the IPO period into pre- and post-1999 IPOs). See Table IV forthe results of the χ2 test.
The analysis clearly verifies that both variables are closely related, because before1999, of the 17 IPOs analysed only two (11.8 per cent) are high-tech firms, whilefrom 1999, of the 39 IPOs analysed 21 (53.8 per cent) are high-tech. Given thisrelationship, we will determine whether the effect on the information provided (the totalinformation and the information by categories) is due to the sector or the period(see Table V). We propose some analyses of variance models with two attributes(sector and period). We found that the interactions between variables are notsignificant; therefore, we will show the results of the models without interaction.
Panel A: distribution of companies in sector and periodLow-tech High-tech Total
Yearo1999 15 2 17Year⩾ 1999 18 21 39Total 33 23 56
Panel B: test of independenceχ2exp 8.662pWχ2 0.0032**
Notes: n¼ 56 firms. This table shows in Panel A how companies are distributed in sector and IPOperiods and in Panel B the test of independency. Companies are divided in two sectors (high-tech andlow-tech). IPO years are divided in two periods (before and after 1999). *,**,***Significant at the 5 and1 per cent and 1 per thousand levels, respectively
Table IV.Relationship between
firm sector andIPO period
471
IC disclosurein IPO
prospectuses
Dow
nloa
ded
by U
NIV
ER
SIT
AS
TR
ISA
KT
I, U
ser
Usa
kti A
t 01:
33 1
7 M
ay 2
016
(PT
)

As indicated in Table V, although at first we could accept that both sector and IPOperiod had a significant influence on the amount of IC items provided by the companiesin their prospectuses, it is really only the sector which influences the total suppliedinformation and the information on structural capital. However, it is the IPO periodwhich influences the amount of items provided on HC.
Third, in order to test the influence of size on the amount of information disclosed wecarry out several regression models for each of the variables (number of employees,sales and assets). The results indicate that variable asset has no significant relationshipwith the information provided (we do not show the results of the regression, but dataare available upon request). However, the size, measured by employees and sales, has apositive and significant effect on the total IC information supplied, as well as on theitems provided on HC and structural capital. Nonetheless, none of them influence therelational capital. The logarithm of the number of employees shows the greatestexplanatory power: 18.56 per cent for the total information; 14.32 per cent for HC; and14.75 per cent for structural capital.
After performing the regression using the naperian logarithm of employees, throughan analysis of residuals, we detected a more complex non-linear relationship. Different
ANOVA test – two attributesLow-tech sector High-tech sector Total Fexp pWF
Panel A: total items suppliedYearo1999 25.07 27.50 25.71Year⩾ 1999 30.50 33.90 30.95Total 26.39 33.61Year⩾ 1999 2.8573 0.0968Sector-high 18.7792 o0.0001***
Panel B: information supplied – human capitalYearo1999 8.47 11.17 8.76Year⩾ 1999 11.00 11.14 11.15Total 9.94 11.13Year⩾ 1999 6.3821 0.0146*Sector-high 0.2006 0.6561
Panel C: information supplied – structural capitalYearo1999 8.53 8.28 8.94Year⩾ 1999 12.00 13.43 11.05Total 8.39 13.30Year⩾ 1999 0.0041 0.9494Sector-high 41.6313 o0.0001***
Panel D: information supplied – relational capitalYearo1999 8.07 8.06 8.00Year⩾ 1999 7.60 9.33 8.74Total 8.06 9.17Year⩾ 1999 0.2176 0.6428Sector-high 2.3228 0.1334Notes: n¼ 56 firms. This table shows the simultaneous influence of sector and IPO period in theinformation disclosed observing the mean of items supplied and its significativity through the ANOVAtest. Panel A, B, C and D show the test for total information supplied, items about human capital, itemsabout structural capital and items about relational capital, respectively. *,**,***Significant at the 5 and1 per cent and 1 per thousand levels, respectively
Table V.Simultaneousinfluence of sectorand IPO period inthe informationdisclosed
472
ARLA28,4
Dow
nloa
ded
by U
NIV
ER
SIT
AS
TR
ISA
KT
I, U
ser
Usa
kti A
t 01:
33 1
7 M
ay 2
016
(PT
)

options were tested using higher degree polynomial functions for the employeeslogarithm (translogarithmic models), reaching as the ideal final result a cubic functionof the log with no terms of first or second degree. This new option to measure theemployees variable increases the explanatory power to 23.00 per cent for the totalinformation, to 25.15 per cent for the HC, and reduces it to 13.90 per cent for thestructural capital. To use a common approach, we will use the third power of logarithmof employees when measuring firm size through employees.
The three variables that measure the firm size in general (specifically employees andsales) are closely related (see correlations in Table II, Panels B and C). Hence, as it wasdone before with sector and IPO period, we will try to determine which of the two waysof measuring the size is really better influencing or explaining the amount ofinformation supplied. We set out regression models with two explanatory variables(sales log and employees log to the third) and we will try to study which of them is abetter predictor. See results in Table VI. Employees is clearly the variable, which has asignificant influence on both variables: total IC information; and HC information.In fact, including sales does not improve the R2 of these two models very much.However, in terms of structural capital, we cannot distinguish which of the twovariables have more influence. The coefficient of each variable is not significant,although the model as a whole is significant. This effect is due to the high degree ofmulticollinearity between the two variables. So, in conclusion, we can say that amongthe variables used to measure the size, employees has the greatest influence in general,more specifically taking this variable as the third power of the employees logarithm.There is quite an interesting effect here, whereby very small businesses provide lessinformation and very big firms provide much more information on IC, while amongfirms in the intermediate range there is no difference.
After performing the regressions between the information provided and the age ofthe company, there is no significant result. Contrary to the hypothesis, the age does notsignificantly influence the amount of information disclosed on IC (either in generalterms or in any of the three categories), this result coincides with other studies such asBukh et al. (2005).
TOTAL IS IS-HC IS-SC IS-RC
Intercept 29.1515 11.1170 7.8097 10.2248(3.3489) (1.6056) (2.0050) (1.3813)
*** *** *** ***Sales-Ln 0.0465 −0.1265 0.4960 −0.3230
(0.6191) (0.2968) (0.3707) (0.2554)Empl-Ln3 0.2716 0.1518 0.0790 0.0409
(0.0888) (0.0426) (0.0531) (0.0366)** ***
R2 23.01% 25.41% 16.71% 3.24%Fexp 7.9214 9.0260 5.3181 0.8869pWF 0.0010*** 0.0004*** 0.0079** 0.4180SEReg 5.4421 2.6092 3.2582 2.2447AIC 354.368 272.035 296.914 255.181Notes: n¼ 56 firms. IS, items supplied; HC, human capital; SC, structural capital; RC, relational capital.Effect of firm size, measured as sales logarithm and the third power of logarithm of employees, on ICdisclosure. *,**,***Significant at the 5 and 1 per cent and 1 per thousand levels, respectively
Table VI.Effect of firm size on
the IC informationprovided
473
IC disclosurein IPO
prospectuses
Dow
nloa
ded
by U
NIV
ER
SIT
AS
TR
ISA
KT
I, U
ser
Usa
kti A
t 01:
33 1
7 M
ay 2
016
(PT
)

Similarly, the regression models performed to test whether the previous shareholders’ownership retained after the IPO influences the amount of information on IC do notobtain significant results.
The limited sample size could be affecting the non-significant results, which havebeen obtained.
4.2 Second stage: analysis of the characteristics simultaneouslyAt this stage, we proceed to apply all the variables together to determine which of themhave a real influence and acts as a better predictor. First, we establish the initial models,based on the results of individual tests, which will be subsequently corrected andcompleted. Table VII shows the initial models explaining the information provided onIC (TOTAL IS), HC (IS-HC) and structural capital (IS-SC), where every input variableremains significant. There is no model for relational capital, because there was nosignificant variable.
We studied the possibility of including the interaction effect among the explanatoryvariables of models in Table VII. However, none of them have significantly improvedthe models. On the other hand, we must take into account that some of the variables,which were excluded from the initial model because they did not have any significantinfluence individually on the information supplied, may become significant when theyare combined in a model with several variables. It is appropriate, therefore, to examinethe inclusion of other variables (such as: asset, age, former shareholders, etc.).
In the structural capital information model, this process does not produce anychange. But in models for total IC information (TOTAL IS) and for HC information(IS-HC) it seems appropriate to include the variable of previous shareholders’ownership held after the IPO, measuring it as a dichotomous variable where
TOTAL IS IS-HC IS-SC
Intercept 26.8298 9.1679 8.5519(0.7910) (0.6082) (0.4287)*** *** ***
Sector 6.2286 4.5530(1.2499) (4.5530)*** ***
Year⩾ 1999 1.8363(0.7321)
*Employees-Ln3 0.2121 0.1248 0.0769
(0.0586) (0.0321) (0.0318)*** *** *
R2 47.57% 33.09% 53.52%Fexp 24.04 13.1075 30.5089pWF o0.0001*** o0.0001*** o0.0001***SEReg 4.4910 2.4341 2.4341AIC 332.855 265.945 264.2561Notes: n¼ 56 firms. IS, items supplied; HC, human capital; SC, structural capital; Sector, Scores 1when it is a high-tech company, otherwise 0; year ⩾1999, Scores 1 when the IPO was in 1999 or after,otherwise 0; Employees-Ln3, third power of logarithm of employees. This table shows the initial modelexplaining the global intellectual capital information, information on human capital and on structuralcapital. *,**,***Significant at the 5 and 1 per cent and 1 per thousand levels, respectively
Table VII.Initial models
474
ARLA28,4
Dow
nloa
ded
by U
NIV
ER
SIT
AS
TR
ISA
KT
I, U
ser
Usa
kti A
t 01:
33 1
7 M
ay 2
016
(PT
)

shareholders hold the majority after the IPO (Value 1) or not (Value 0), which negativelyinfluences the total information supplied. This new coefficient is significant andimproves the models. Thanks to this new variable, R2 rises up to 53.97 per cent forglobal IC information and up to 39.44 per cent for HC information. In both cases, Akaikecriterion improves.
Finally, we test the introduction of interaction effects among the variables of thenew model, but they are not significant. Final models are shown in Table VIII.
We have also performed residual diagnostics, including, for example, White’sheteroskedasticity test, the Jarque-Bera normality test and various influentialobservation tests have not detected any problem of heteroskedasticity, lack ofnormality or influential observations. Nevertheless, due to the small size of the sampleand in order to avoid the problems of the ordinary least squares method, we haveestimated the three final models using robust least squares through the MM-estimationmethod. The results do not differ from those observed in Table VIII.
5. Discussion and conclusionsThe results of the analyses corroborate the H1 in the expected way; high-techcompanies give more information on IC. These firms carry out a larger investment inR&D or are based on information technologies, so they are able to mention more itemsand they tend to do so. Significant results were obtained in the same sense in the Danish(Bukh et al., 2005), Japanese (Rimmel et al., 2009) and the British (Mangena et al., 2010)
TOTAL IS IS-HC IS-SC
Intercept 30.7437 11.0958 8.5519(1.6364) (1.0117) (0.4287)*** *** ***
Sector 7.1732 4.5530(1.2334) (0.6775)*** ***
Year⩾ 1999 1.9464(0.7048)**
Employees-Ln3 0.2331 0.1382 0.07688(0.0560) (0.0313) (0.0317)*** *** *
Previous shareholdersW50% −4.9128 −2.2887(1.8268) (0.9806)** *
R2 53.97% 39.44% 53.52%Fexp 20.3251 11.2874 30.5089pWF o0.0001*** o0.0001*** o0.0001***SEReg 4.2482 2.3735 2.4341AIC 327.978 262.781 264.256Notes: n¼ 56 firms. Sector, Scores 1 when it is a high-tech company, otherwise 0; year⩾ 1999, Scores 1when the IPO was in 1999 or after, otherwise 0; employees-Ln3, third power of logarithm of employees;previous shareholders W50 per cent, Scores 1 when previous shareholders retain more than 50 per centof shares, otherwise 0. This table shows the final models explaining the total intellectual capitalinformation, the information about human capital and about structural capital. *,**,***Significant at the5 and 1 per cent and 1 per thousand levels, respectively
Table VIII.Final models
475
IC disclosurein IPO
prospectuses
Dow
nloa
ded
by U
NIV
ER
SIT
AS
TR
ISA
KT
I, U
ser
Usa
kti A
t 01:
33 1
7 M
ay 2
016
(PT
)

financial markets. However, Cordazzo (2007) obtained no significant results aftertesting the H1 in Italian IPOs, which seems to be abnormal in the literature, as wehave proved here. We state that knowledge-based companies will need to supplymore information in order to reduce the information asymmetry according to theagency theory.
There are differences in the information provided on HC, structural capital and IC ingeneral. The latter is influenced not only by the sector but also by the size of thecompany (measured by number of employees) and by the fact that former shareholdersretain more than 50 per cent of the shares after the IPO. The employees variablesuggests that as the number of employees increases, the number of items provided inthe prospectus also increases, to a point where the information provided is stagnant,but it increases again in the largest companies. In the three cases (IC, HC and SC), themost important difference is between the very small businesses (providing lessinformation) and the very large firms, which provide more information, and there is lessdifference among firms in the intermediate range (as it is a cubic function). Therefore,we can corroborate the H4. This hypothesis is also significant in studies such asCordazzo (2007) and Bozzolan et al. (2003) for Italy, and Mangena et al. (2010) for theUK. However, neither in Bukh et al. (2005) for Denmark, nor in Rimmel et al. (2009) forJapan are there any significant results. We must consider the variable used to measurethe size of the company. In the case of Italy, it was measured using sales, and in the UK,using the market capitalization. When talking about IC, it makes sense to measure thesize of the company in terms of employees, rather than using sales, assets or otherkinds of measurements, because an increasing number of employees will make itnecessary to standardize internal processes and better human resource policies. Thispaper has positive results using the number of employees, in contrast to the Danish andJapanese cases where this variable was not significant, maybe due to the effect of thecubic function. Very big companies feel more pressure to disclose information in orderto be legitimated by society, due to the fact that they are affecting more people,not only their employees, but also through tax contribution or the effect on localsocieties if they close.
According to the H3, when previous shareholders are not going to keep more than50 per cent of the shares after the IPO, firms provide more information; that is, whencompanies want to attract more capital, they provide more information. Guo et al. (2004)confirmed this hypothesis and we can conclude that firms going public try to avoid thenegative signalling effect caused by a low-retained ownership, by disclosing additionalnon-financial information.
This research, based on a rigorous methodology, provides some new results andcontributions to the literature. First, the paper verifies three of the four theories for ICdisclosure (An et al., 2011), the agency theory, signalling theory and legitimacy theory.Companies are willing to provide more information, apart from financial statements, inorder to decrease the agency problem, to solve the negative signalling effects and to belegitimated by society through a successful IPO process. Second, we establish a newnon-linear relationship between firm size (measured by number of employees) andthe information provided, so that companies in the extremes (those with very fewemployees or many employees) are those that really differ when disclosing less or moreinformation on IC, respectively. Third, there are few studies that have used the variableof retained ownership after the IPO when studying the IC information. In this work,we have achieved a significant result, which confirms the hypothesis, strengthens andgeneralizes the results obtained in this respect by Guo et al. (2004) for the biotechnology
476
ARLA28,4
Dow
nloa
ded
by U
NIV
ER
SIT
AS
TR
ISA
KT
I, U
ser
Usa
kti A
t 01:
33 1
7 M
ay 2
016
(PT
)

firms. Fourth, this is the first study of these characteristics in the Spanish market, witha database created ad hoc, which is a reference for other mid-sized markets such asmany Latin American ones. Finally, none of the variables studied influences relationalcapital, that is, all kinds of businesses, regardless of the sector, size, age, etc. providethe same information about this type of capital. There is a great implication fororganizations, because it seems that nowadays, regardless of the type of company or itsIPO characteristics, all firms provide the same type of information related to externalstakeholders. Therefore, this could be the way to obtain differentiation, whereby theycan improve their non-financial information.
As an additional result, we have to accept that age has no influence, contraryto H2 and that the period affects only HC information; thus, the stakeholder theory ispartially corroborated.
Once we know how different firm characteristics affect the IC disclosure, the nextstep for future research should be to study the implications of information in the IPOperformance, observing the degree in which firms supplying more IC items,achieve a higher offer price. Moreover, in recent months in Spain, the IPO process hasbeen reactivated due to the economic recovery. In a few years, we will be able tocompare the results of this study with the post-crisis period [1], expecting an increaseof IC disclosure.
Finally, we think that our results can be extended to other markets, especially to theLatin American ones, where no studies on IC disclosure in IPOs have been undertaken.The legal and cultural similarities of Ibero-American regions justify this idea.
Note1. Doing this would enable us to test the sample to check the validity of the results obtained in
this study.
References
Aggarwal, R., Leal, R. and Hernandez, L. (1993), “The aftermarket performance of initial publicofferings in Latin America”, Financial Management, Vol. 22 No. 1, pp. 42-53.
Ahmed, K. and Courtis, J.K. (1999), “Association between corporate characteristics and disclosurelevels in annual reports: a meta-analysis”, The British Accounting Review, Vol. 31 No. 1,pp. 35-61.
An, Y., Davey, H. and Eggleton, I.R.C. (2011), “Towards a comprehensive theoretical frameworkfor voluntary disclosure”, Journal of Intellectual Capital, Vol. 12 No. 4, pp. 571-585.
Balatbat, M. (2006), “Discussion of explaining the short- and long-term IPO anomalies in the USby R&D”, Journal of Business Finance & Accounting, Vol. 33 Nos 3/4, pp. 580-586.
Barrick, M.R., Thurgood, G.R., Smith, T.A. and Courtright, S.H. (2015), “Collective organizationalengagement: linking motivational antecedents, strategic implementation, and firmperformance”, Academy of Management Journal, Vol. 58 No. 1, pp. 111-135.
Beyer, A., Cohen, D.A., Lys, T.Z. and Walther, B.R. (2010), “The financial reporting environment:review of the recent literature”, Journal of Accounting and Economics, Vol. 50 Nos 2/3,pp. 296-343.
Boedker, C., Guthrie, J. and Cuganesan, S. (2005), “An integrated framework for visualisingintellectual capital”, Journal of Intellectual Capital, Vol. 6 No. 4, pp. 510-527.
Bozzolan, S., Favotto, F. and Ricceri, F. (2003), “Italian annual intellectual capital disclosure.An empirical analysis”, Journal of Intellectual Capital, Vol. 4 No. 4, pp. 543-558.
477
IC disclosurein IPO
prospectuses
Dow
nloa
ded
by U
NIV
ER
SIT
AS
TR
ISA
KT
I, U
ser
Usa
kti A
t 01:
33 1
7 M
ay 2
016
(PT
)

Bozzolan, S., O’Regan, P. and Ricceri, F. (2006), “Intellectual capital disclosure (ICD): a comparisonof Italy and the UK”, Journal of Human Resource Costing & Accounting, Vol. 10 No. 2,pp. 92-113.
Brown, N. and Deegan, C. (1998), “The public disclosure of environmental performanceinformation – a dual test of media agenda setting theory and legitimacy theory”,Accounting and Business Research, Vol. 29 No. 1, pp. 21-41.
Bukh, P.N., Nielsen, C., Gormsen, P. and Mouritsen, J. (2005), “Disclosure of information onintellectual capital in Danish IPO prospectuses”, Accounting, Auditing & AccountabilityJournal, Vol. 18 No. 6, pp. 713-732.
Cazavan-Jeny, A. and Jeanjean, T. (2007), “Levels of voluntary disclosure in IPO prospectuses:an empirical analysis”, Review of Accounting and Finance, Vol. 6 No. 2, pp. 131-149.
Chavent, M., Ding, Y., Fu, L., Stolowy, H. and Wang, H. (2006), “Disclosure and determinantsstudies: an extension using the Divisive Clustering Method (DIV)”, European AccountingReview, Vol. 15 No. 2, pp. 181-218.
Chen, M.C., Cheng, S.J. and Hwang, Y. (2005), “An empirical investigation of the relationshipbetween intellectual capital and firms’ market value and financial performance”, Journalof Intellectual Capital, Vol. 6 No. 2, pp. 159-176.
Cordazzo, M. (2007), “Intangibles and Italian IPO prospectuses: a disclosure analysis”, Journal ofIntellectual Capital, Vol. 8 No. 2, pp. 288-305.
Cumby, J. and Conrod, J. (2001), “Non-financial performance measures in the Canadianbiotechnology industry”, Journal of Intellectual Capital, Vol. 2 No. 3, pp. 261-272.
Dambra, M., Xasares, L. and Gustafson, M.T. (2015), “The JOBS Act and IPO volume: evidencethat disclosure costs affect the IPO decision”, Journal of Financial Economics, Vol. 116No. 1, pp. 121-143.
Doidge, C., Karolyi, G.A. and Stulz, R.M. (2013), “The US left behind? Financial globalizationand the rise of IPOs outside the US”, Journal of Financial Economics, Vol. 110 No. 3,pp. 546-573.
Edvinsson, L. and Malone, M.S. (1997), Intellectual Capital. The Proven way to Establish YourCompany’s Real Value by Measuring its Hidden Brainpower, Judy Piatkus (Publishers)Limited, London.
Freeman, R.E. (1994), “Stakeholder theory”, Business Ethics Quarterly, Vol. 4 No. 4, pp. 409-421.
García-Meca, E. and Martínez, I. (2007), “The use of intellectual capital information in investmentdecisions. An empirical study using analyst reports”, The International Journal ofAccounting, Vol. 42 No. 1, pp. 57-81.
Gregoire, J. and Castillo, R. (2009), “Factors in IPO underpricing, Chile 1993-2006”,Multidisciplinary Business Review, Vol. 2 No. 1, pp. 36-46.
Guo, R.-J., Lev, B. and Shi, C. (2006), “Explaining the short- and long-term IPO anomalies in the USby R&D”, Journal of Business Finance & Accounting, Vol. 33 Nos 3/4, pp. 550-579.
Guo, R.-J., Lev, B. and Zhou, N. (2004), “Competitive costs of disclosure by Biotech IPOs”, Journalof Accounting Research, Vol. 42 No. 2, pp. 319-355.
Guthrie, J. and Petty, R. (2000), “Intellectual capital: Australian annual reporting practices”,Journal of Intellectual Capital, Vol. 1 No. 3, pp. 241-251.
Hensler, D.A., Herrera, M.J. and Lockwood, L.J. (2000), “The performance of initial public offeringsin the Mexican stock market, 1987-1993”, Journal of International Money and Finance,Vol. 19 No. 1, pp. 93-116.
Holland, J. (2003), “Intellectual capital and the capital market – organisation and competence”,Accounting, Auditing & Accountability Journal, Vol. 16 No. 1, pp. 39-48.
478
ARLA28,4
Dow
nloa
ded
by U
NIV
ER
SIT
AS
TR
ISA
KT
I, U
ser
Usa
kti A
t 01:
33 1
7 M
ay 2
016
(PT
)

Hsu, J., Young, W. and Wang, H.Y. (2012), “Pre-IPO acquirers’ issuance cost and long-runperformance: do their M&A disclosures matter?”, Journal of Business Finance andAccounting, Vol. 39 Nos 1/2, pp. 141-164.
International Integrated Reporting Council (2013), “The international o IRW framework”,available at: www.theiirc.org/international-ir-framework/ (accessed 15 June 2015).
Ireland, R.D., Hitt, M.A. and Vaidyanath, D. (2002), “Alliance management as a source ofcompetitive advantage”, Journal of Management, Vol. 28 No. 3, pp. 413-446.
Jara Bertín, M. and Arias Moya, J.T. (2013), “The effect of mandatory IFRS adoption onaccounting conservatism of reported earnings. Evidence from Chilean firms”, AcademiaRevista Latinoamericana de Administración, Vol. 26 No. 1, pp. 139-169.
Jardon, C.M. and Martos, M.S. (2012), “Intellectual capital as competitive advantage in emergingclusters in Latin America”, Journal of Intellectual Capital, Vol. 13 No. 4, pp. 462-481.
Jensen, M.C. and Meckling, W.H. (1976), “Theory of the firm: managerial behavior, agency costsand ownership structure”, Journal of Financial Economics, Vol. 3 No. 4, pp. 305-360.
Kamukama, N., Ahiauzu, A. and Ntayi, J.M. (2011), “Competitive advantage: mediator ofintellectual capital performance”, Journal of Intellectual Capital, Vol. 12 No. 1, pp. 152-164.
Kaplan, R.S. and Norton, D.P. (1996), The Balanced Scorecard: Translating Strategy Into Action,Harvard Business School Press, Boston, MA.
Kaplan, R.S. and Norton, D.P. (2008), The Execution Premium: Linking Strategy to Operations forCompetitive Advantage, Harvard Business School Press, Boston, MA.
Kent, P. and Zunker, T. (2013), “Attaining legitimacy by employee information in annual reports”,Accounting, Auditing and Accountability Journal, Vol. 26 No. 7, pp. 1072-1106.
Kim, M. and Ritter, J.R. (1999), “Valuing IPOs”, Journal of Financial Economics, Vol. 53 No. 3,pp. 409-437.
Leland, H.E. and Pyle, D.H. (1977), “Informational asymmetries, financial structure and financialintermediation”, The Journal of Finance, Vol. 32 No. 2, pp. 371-387.
Lev, B. (2001), Intangibles –Management, Measurement and Reporting, The Brooking Institution,Washington, DC.
Lowry, M., Officer, M.S. and Schwert, G.W. (2010), “The variability of IPO initial returns”, TheJournal of Finance, Vol. 65 No. 2, pp. 425-465.
Mangena, M., Pike, R. and Li, J. (2010), Intellectual Capital Disclosure Practices and Effects on theCost of Equity Capital: UK Evidence, The Institute of Chartered Accountants of Scotland,Edinburgh.
Marr, B. (2005), Perspectives on Intellectual Capital, Elsevier Inc., Oxford.
Martín-de-Castro, G., Delgado-Verde, M., López-Sáez, P. and Navas-López, J.E. (2011), “Towards‘an intellectual capital-based view of the firm’: origins and nature”, Journal of BusinessEthics, Vol. 98 No. 4, pp. 649-662.
Martínez-Ferrero, J. (2014), “Consequences of financial reporting quality on corporateperformance. Evidence at the international level”, Estudios de Economía, Vol. 41 No. 1,pp. 49-88.
Mention, A. and Bontis, N. (2013), “Intellectual capital and performance within the banking sectorof Luxembourg and Belgium”, Journal of Intellectual Capital, Vol. 14 No. 2, pp. 286-309.
Nakamura, L. (2003), “A trillion dollars a year in intangible investment and the new economy”,in Hand, J. and Lev, B. (Eds), Intangible Assets: Values, Measures and Risks, OxfordUniversity Press, Oxford, pp. 19-47.
OECD (1996), The Knowledge-Based Economy, Organisation for Economic Cooperation andDevelopment, Paris.
479
IC disclosurein IPO
prospectuses
Dow
nloa
ded
by U
NIV
ER
SIT
AS
TR
ISA
KT
I, U
ser
Usa
kti A
t 01:
33 1
7 M
ay 2
016
(PT
)

Patel, S.A. and Dallas, G. (2002), Transparency and Disclosure: Overview of Methodology andStudy Results – United States, Standard and Poor’s, New York, NY.
Rashid, A.A., Ibrahim, M.K., Othman, R. and See, K.F. (2012), “IC disclosures in IPO prospectuses:evidence from Malaysia”, Journal of Intellectual Capital, Vol. 13 No. 1, pp. 57-80.
Riahi-Belkaoui, A. (2003), “Intellectual capital and firm performance of US multinational firms.A study of the resource-based and stakeholder views”, Journal of Intellectual Capital, Vol. 4No. 2, pp. 215-226.
Rimmel, G., Nielsen, C. and Yosano, T. (2009), “Intellectual capital disclosures in JapaneseIPO prospectuses”, Journal of Human Resource Costing & Accounting, Vol. 13 No. 4,pp. 316-337.
Ross, S.A. (1977), “The determination of financial structure: the incentive-signalling approach”,Bell Journal of Economics, Vol. 8 No. 1, pp. 23-40.
Rossoni, L. and Machado-da-Silva, C.L. (2013), “Legitimidade, governança corporativae desempenho: análise das empresas da MB&F Bovespa”, Revista de Administraçao deEmpresas, Vol. 53 No. 4, pp. 350-362.
Sanz, L. and Jones, V. (2013), “Advances in business research in Latin American studies”, Journalof Business Research, Vol. 66 No. 3, pp. 397-400.
Shakina, E. and Barajas, A. (2014), “Value creation through intelectual capital in developedEuropean markets”, Journal of Economic Studies, Vol. 41 No. 2, pp. 272-291.
Singh, I. and Van der Zahn, J.-L.W.M. (2008), “Determinants of intellectual capital disclosure inprospectuses of initial public offerings”, Accounting and Business Research, Vol. 38 No. 5,pp. 409-431.
Watts, R.L. and Zimmerman, J.L. (1986), Positive Accounting Theory, Prentice Hall, EnglewoodCliffs, NJ.
Appendix 1. Variablesdi: equals 1 when the firm mentions item i in the IPO prospectus and 0 when the firm does notmention it.
IS DISC ( per cent): percentage of the number of items supplied in the IPO prospectus over thetotal number of items available.Source: own elaboration from IPO prospectuses.
M: number of companies in the sample.
TOTAL IS: total number of items supplied in the IPO prospectus.Source: own elaboration from IPO prospectuses.
480
ARLA28,4
Dow
nloa
ded
by U
NIV
ER
SIT
AS
TR
ISA
KT
I, U
ser
Usa
kti A
t 01:
33 1
7 M
ay 2
016
(PT
)
Appendix 2Item
sby
categories
%firms
includ
ing
them
Item
sby
categories
%firms
includ
ing
them
Hum
ancapital(29
items)
35.96
Managem
entexperience
(nam
edindividu
al)
85.7
Staffbreakd
ownby
age
35.7
Num
berof
employees
100
Staffbreakd
ownby
seniority
12.5
Structuralcapital(34
items)
30.62
Staffbreakd
ownby
gend
er8.9
Descriptio
nandreason
forinvestments
inIT
51.8
Staffbreakd
ownby
geograph
ical
area
33.9
ITsystem
s19.6
Staffbreakd
ownby
department
48.2
Softwareassets
32.1
Staffbreakd
ownby
jobfunctio
n30.4
Descriptio
nof
ITfacilities
17.9
Staffbreakd
ownby
levelo
feducation
19.6
ITexpenses
35.7
Staffbreakd
ownby
professional
category
73.2
Inform
ationandcommun
icationwith
inthecompany
3.6
Rateof
staffturnover
12.5
Efforts
relatedto
theworking
environm
ent
1.8
Comments
onchangesin
numberof
employees
51.8
Working
from
home
0Staffhealth
andsafety
14.3
Internal
sharingof
know
ledg
eandinform
ation
26.8
Absence/leave
7.1
Measure
ofinternal
orexternal
failu
res
60.7
Staffinterview
0Fringe
benefitsandcompany
social
programmes
1.8
Statem
ents
ofpolicyon
competencedevelopm
ent
41.1
Env
ironmentala
pprovalsandstatem
ent/p
olicies
50Descriptio
nof
competencedevelopm
entp
rogram
meand
activ
ities
17.9
Statem
ents
ofpolicy,strategy
and/or
objectives
ofR&D
activ
ities
66.1
Edu
catio
nandtraining
expenses
21.4
R&Dexpenses
35.7
Edu
catio
nandtraining
expenses/num
berof
employees
0R&Dexpenses/sales
12.5
Employee
expenses/num
berof
employees
12.5
R&Dinvested
inbasicresearch
0Recruitm
entpolicies
71.4
R&Dinvested
inproductdesign
/development
5.4
HRM
department,division
orfunctio
n8.9
Future
prospectsregardingR&D
28.6
Jobrotatio
nopportun
ities
7.1
Detailsof
company
patents
16.1
Rem
unerationandincentivesystem
s92.9
Num
berof
patentsandlicenses,etc.
26.8
Pensions
83.9
Patentspend
ing
7.1
Insurancepolicies
78.6
Strategicalliances
35.7
Statem
ents
ofdepend
ence
onkeypersonnel
57.1
Objectiv
esandreason
forstrategicalliances
21.4
Revenues/em
ployee
16.1
Comments
ontheeffectsof
thestrategicalliances
8.9
Value
added/em
ployee
0
(con
tinued)
Table AI.Intellectual capitalitems divided by
categories
481
IC disclosurein IPO
prospectuses
Dow
nloa
ded
by U
NIV
ER
SIT
AS
TR
ISA
KT
I, U
ser
Usa
kti A
t 01:
33 1
7 M
ay 2
016
(PT
)

Item
sby
categories
%firms
includ
ing
them
Item
sby
categories
%firms
includ
ing
them
Organizationalstructure
94.6
Descriptio
nof
commun
ityinvolvem
ent
23.2
Descriptio
nof
new
productio
ntechnology
8.9
Inform
ationon
corporatesocialresponsibilityandobjective
12.5
Statem
ents
ofcorporatequ
ality
performance
0Num
berof
custom
ers
14.3
Corporatecultu
restatem
ents
8.9
Salesbreakd
ownby
custom
er26.8
Bestpractice
85.7
Ann
ualsales
persegm
entor
product
92.9
Utilizationofenergy
,raw
materialsandotherinp
utgoods
53.6
Average
custom
ersize
51.8
Descriptio
nof
employee
contracts/contractualissues
3.6
Dependenceon
keycustom
ers
64.3
Products
inmarket
100
Descriptio
nof
custom
erinvolvem
ent
62.5
Products
indevelopm
ent
50Descriptio
nof
custom
errelatio
ns44.6
Productdevelopm
enttim
eline
69.6
Edu
catio
n/training
ofcustom
ers
7.1
Relationa
lcapita
l(23
items)
37.03
Custom
ers/em
ployees
1.8
Externalsharing
ofkn
owledg
eandinform
ation
26.8
Value
addedpercustom
eror
segm
ent
3.6
Descriptio
nof
thenetw
orkof
supp
liers
anddistribu
tors
94.6
Marketshare(%
)50
Statem
ents
ofim
ageandbrand
87.5
Relativemarketshare
41.1
Awards
19.6
Marketshare,breakd
ownby
coun
try/segm
ent/p
rodu
ct28.6
Receivedsubsidies
30.4
Repurchase
12.5
Investmentin
theenvironm
ent
37.5
Custom
ersatisfaction
17.9
Sou
rces
:Ownelaborationbasedon
Buk
hetal.(2005)a
ndCu
mby
andCo
nrod
(2001)
Table AI.
482
ARLA28,4
Dow
nloa
ded
by U
NIV
ER
SIT
AS
TR
ISA
KT
I, U
ser
Usa
kti A
t 01:
33 1
7 M
ay 2
016
(PT
)

About the authorsLeire Alcaniz holds an MBA and a PhD in Business Administration from the University ofDeusto. She is an Associate Professor of Financial Accounting at the Deusto Business School andher publications mainly focus on intellectual capital; specifically, intangible assets accounting,intellectual capital reporting and initial public offerings. She belongs to the finance research teamin the University of Deusto. Leire Alcaniz is the corresponding author and can be contacted at:[email protected]
Professor Fernando Gomez-Bezares has a MBA and a PhD in Economics and Business fromthe University of Deusto and he was invested Doctor Honoris Causa by the El SalvadorUniversity (Buenos Aires, Argentina). He is currently a Professor of Finance at the DeustoBusiness School. He is also a Visiting Professor in other European and American universities. Hispublications are mainly on corporate finance, efficiency and valuation and asset management(mainly measuring its performance), topics in which he has also worked professionally. Hebelongs to the finance research team, of which he is the main researcher, in the Universityof Deusto.
Professor Jose Vicente Ugarte holds a PhD in Economics and Business from the University ofDeusto. He is currently a Professor of Mathematics and Econometrics at the Deusto BusinessSchool. His research is focused on mathematics, econometrics, etc., and their empirical applicationin Business Research. He belongs to the Finance Research Team in the University of Deusto.
For instructions on how to order reprints of this article, please visit our website:www.emeraldgrouppublishing.com/licensing/reprints.htmOr contact us for further details: [email protected]
483
IC disclosurein IPO
prospectuses
Dow
nloa
ded
by U
NIV
ER
SIT
AS
TR
ISA
KT
I, U
ser
Usa
kti A
t 01:
33 1
7 M
ay 2
016
(PT
)