Embed Size (px)
Citation preview
International Journal of Business and Management Invention
ISSN (Online): 2319 – 8028, ISSN (Print): 2319 – 801X www.ijbmi.org || Volume 4 Issue 9 || September. 2015 || PP-13-23
www.ijbmi.org 13 | Page
Intellectual Capital And Firm Performances
1Rafrini Amyulianthy,
2Yetty Murni
1,2Faculty of Economic and Business University of Pancasila, Indonesia
ABSTRACT:The purpose of this study was to examine the effect of intellectual capital which proxied by
VAICTM
by Pulic (1999) and the average growth of intellectual capital (VAIC™) to firm performance. The
data used in this study is the first 140 companies listed on the Stock Exchange which is divided into two sectors,
manufacturing and non-manufacturing industry which following to research hypothesis. The results showed that
the intellectual capital has significant effect to firm performance when firm performance is proxied by the ROA,
not by ROE. And the average growth of intellectual capital has a significant effect to firm performance if the
company's performance is proxied by ROE and ROA.
Key words: Intellectual capital, VAICTM
, growth of intellectual capital, firm performances, multiple regression
I. INTRODUCTION Today business face increasing challenges and diverse. Competition among businesses is increasing
and the number of rivals are demanding more and more business people to always innovate to excel and retain
the market. Therefore, the paradigm changes cause changes in accounting reporting paradigm (Budi Hartono,
2001). At first consider the financial statements of the accounting paradigm has the function of stewardship or
accountability of managers to the owners. However, the current paradigm of the new accounting shows that the
financial statements have decision making functions for the stakeholders to economic decision making.
Changes in the accounting paradigm raises demands for changes to the traditional accounting
measurement to the measurement of intellectual capital. Traditional accounting has not been able to identify and
measure intangible assets for knowledge-based organizations (Guthrie et al 1999). Limitations of traditional
financial reporting accounting in explaining the value of the company shows that the economic resources in the
form of physical assets but not the creation of intellectual capital.
Pulic (2000) conducted an indirect measurement of intellectual capital to the company by measuring
the efficiency coefficient value added intellectual capital company known as Value Added Intellectual
Coefficient - VAIC ™. VAIC main components consist of the company's resources include physical capital,
human capital, and structural capital.
Bontis et al. (2000) on the test of intellectual capital consisting of human, structural and customer
capital on firm performance indicate that the human and customer capital became a significant factor in
implementing the company's business and structural capital has a positive effect on firm performance. Reed
(2000) conducted an empirical test the influence of intellectual capital and performance in the banking industry.
The results of these studies indicate that intellectual capital into a powerful factor for predicting bank
performance. Belkaoui (2003) conducted a study to test the performance of intellectual capital in a multinational
company in the United States and the results showed that intellectual capital has a positive effect on firm
performance.
Research conducted by Firer and Williams (2003) a study in South Africa to determine the relationship
between IC and corporate performance. This study uses VAICTM
whose performance is measured by
profitability, productivity and market valuation. The results of this study are the physical resource is the most
influential factor in the company in South Africa compared to human and capital resources. From the results of
these studies provide indications of the benefits of intellectual capital and the need for an empirical study of
intellectual capital on firms go public in Indonesia.
II. LITERATURE REVIEWS & HYPOTHESIS DEVELOPMENT Intellectual Capital According to Stewart (1997) intellectual capital is a resource of knowledge available on the company
that produces high-value assets and economic benefits in the future for the company. Roos et al (1997) stated
that intellectual capital includes all processes and become intangible assets in the balance sheet include
trademarks, patents and brands. In 1996 Brooking defines intellectual capital as a combination of intangible
assets includes the market, intellectual property, human resources, and infrastructure to function within the
company. Meanwhile, Stewart (1997) defines intellectual capital as knowledge that is all intellect, all the
information, and experiences that companies use to create wealth.
Intellectual Capital And Firm…
www.ijbmi.org 14 | Page
Intellectual capital according to some researchers consists of three main parts consisting of human
capital, structural capital, and physical capital.
Human Capital
Human capital is a source of innovation and improvement in an organization, but it becomes an
element that is difficult to measure. Stockley (2003) defines the human capital is the term of human capital is
recognition that people in organization and bisiness are an important an essential asset who contribute to
development and growth, in a similar way as physical asset such as machines and money. The collective
attitude, skill and abilities of people contribute to organization performance and productivity. Any expenditure
in training, development, health and support is an investement not just an expense.
Human capital is a very useful source of knowledge, skills, and competencies in a company. Human
capital reflects the collective ability to produce the best solutions based on the knowledge possessed by the
people who were in the company to add value to the company. Human capital is a combination of knowledge,
expertise (skills), ability to innovate in the completion of assignments include corporate values, culture and
philosophy (Bontis, 2000).
Structural Capital
Structural capital is an organization's ability to meet the company routines and structures that support
employee efforts to produce optimal intellectual performance as well as overall business performance, for
example: the company's operational systems, manufacturing processes, organizational culture, management
philosophy and all forms of intellectual property are owned company. An individual can have a high intellectual
level, but if the organization has poor systems and procedures that intellectual capital can’t achieve optimal
performance and potential can’t be fully utilized.
Structural capital is the infrastructure that supports employees to create optimum performance,
including the ability of the organization to reach the market, hardware, software, databases, organizational
structure, patent, trademark, and all the ability of organizations to support employee productivity (Bontis, 2000).
The concept of the existence of structural capital allows the creation of intellectual capital and be a liaison /
processing of human resources into intellectual capital.
Physical Capital Physical capital or customer capital is the organization's relationship with the people who do business
with the organization. Saint-Onge gave the definition of physical capital as depth (penetration), width
(coverage), and relatedness (loyalty) of the company. Edvinsson added physical capital is the tendency of
customers to keep a company doing business with the company (Stewart, 1997).
Physical capital is often measured or calculated as a source of funding compared to human capital and
structural capital. For example, the brand, is an example of physical capital that have an easy method of
assessment. This method is done by calculating the customer's premiums would be paid for a particular brand of
product compared with other brand products, then by using the cost of capital and the level of remuneration for
the capital to calculate the value of the asset (brand reputation) who created the premium.
Physical capital appears in the form of learning, access, and trust. When a company or someone will
decide to buy from a company, then the decision is based on the quality of their relationship, price and technical
specifications. The better the relationship, the greater the chance purchase plan will happen, and this means that
the greater the chances of a purchase plan will happen, and this means that the larger the company the
opportunity to learn with and from customers and suppliers. Knowledge shared is the highest form of physical
capital. (Sugeng, 2002).
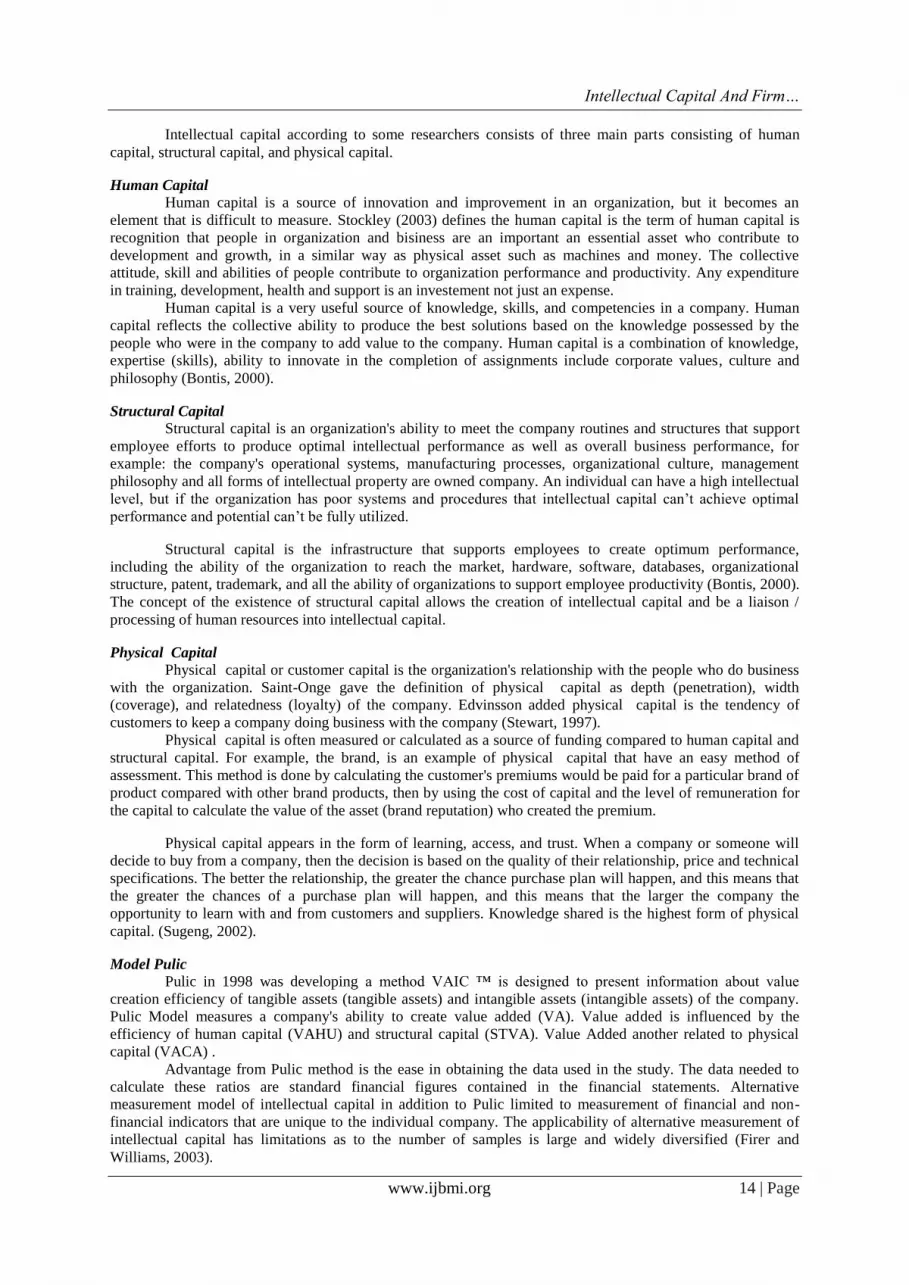
Model Pulic
Pulic in 1998 was developing a method VAIC ™ is designed to present information about value
creation efficiency of tangible assets (tangible assets) and intangible assets (intangible assets) of the company.
Pulic Model measures a company's ability to create value added (VA). Value added is influenced by the
efficiency of human capital (VAHU) and structural capital (STVA). Value Added another related to physical
capital (VACA) .
Advantage from Pulic method is the ease in obtaining the data used in the study. The data needed to
calculate these ratios are standard financial figures contained in the financial statements. Alternative
measurement model of intellectual capital in addition to Pulic limited to measurement of financial and non-
financial indicators that are unique to the individual company. The applicability of alternative measurement of
intellectual capital has limitations as to the number of samples is large and widely diversified (Firer and
Williams, 2003).

Intellectual Capital And Firm…
www.ijbmi.org 15 | Page
Firm Performances
The company's ability to generate profit in operating activities was a major focus in the assessment of
the company's achievements. Gain an indicator of the performance of the company's ability to meet obligations
to creditors and investors, as well as a part in the value creation process related to the company's future
prospects.
Profitability is an important measure for assessing the company that affect an investor to make a
decision. On this research we use Return on Assets (ROA) and Return on Equity (ROE) as indicator of the
performance of the company's.
Intellectual Capital & Firm Performances
Firer and Williams (2003) test to examine the creation of value through the components of physical
capital, human capital and structural capital on profitability, productivity, and market assessment. The results
showed that there was no relationship between Intellectual capital with profitability, except capital employed
has a positive effect on the market value of the company.
Kin Gan and Zakiah Saleh (2008) tested the performance of corporate intellectual capital and
technology intensive company listed on Bursa Malaysia (MESDAQ) using Pulic models. The results showed
that the technology intensive companies still depend on the efficiency of physical capital. Pysical capital
efficiency is a significant variable related to profitability, while human capital has a positive effect on the
productivity of the company. Intellectual capital in the company is not able to explain his relationship with the
market valuation (market valuation).
Chen et al (2005) conducted tests using a model of Pulic the company went public in Taiwan. The
results showed the hypothesis that intellectual capital has a positive influence on the company’s financial
performance and market valuation, as well as an indicator of financial performance in the future. Cost of
research and development into additional information for structural capital and has a positive influence on the
value and profitability of the company.
Because there is between needs and requirement between manufactures company with others company sector,
so in this research we are distinguished between manufacturing company with non manufacturing company.
Furthermore, the hypothesis in this research is:
H1 : There is an effect of intellectual capital to firm performances for manufacture companies
H2 : There is an effect of intellectual capital to firm performances for non- manufacture companies
Figure 1
If the company that owns higher of intellectual capital (VAIC ™) , they will tend to have the future
performance better, then logically, the average growth of the intellectual capital (rate of growth of intellectual
capital - RGIC) will also have a positive relationship with the future financial performance (Tan et al., 2007).
H3 : There is an effect of average growth of intellectual capital to firm performances
Intellectual Capital And Firm…
www.ijbmi.org 16 | Page
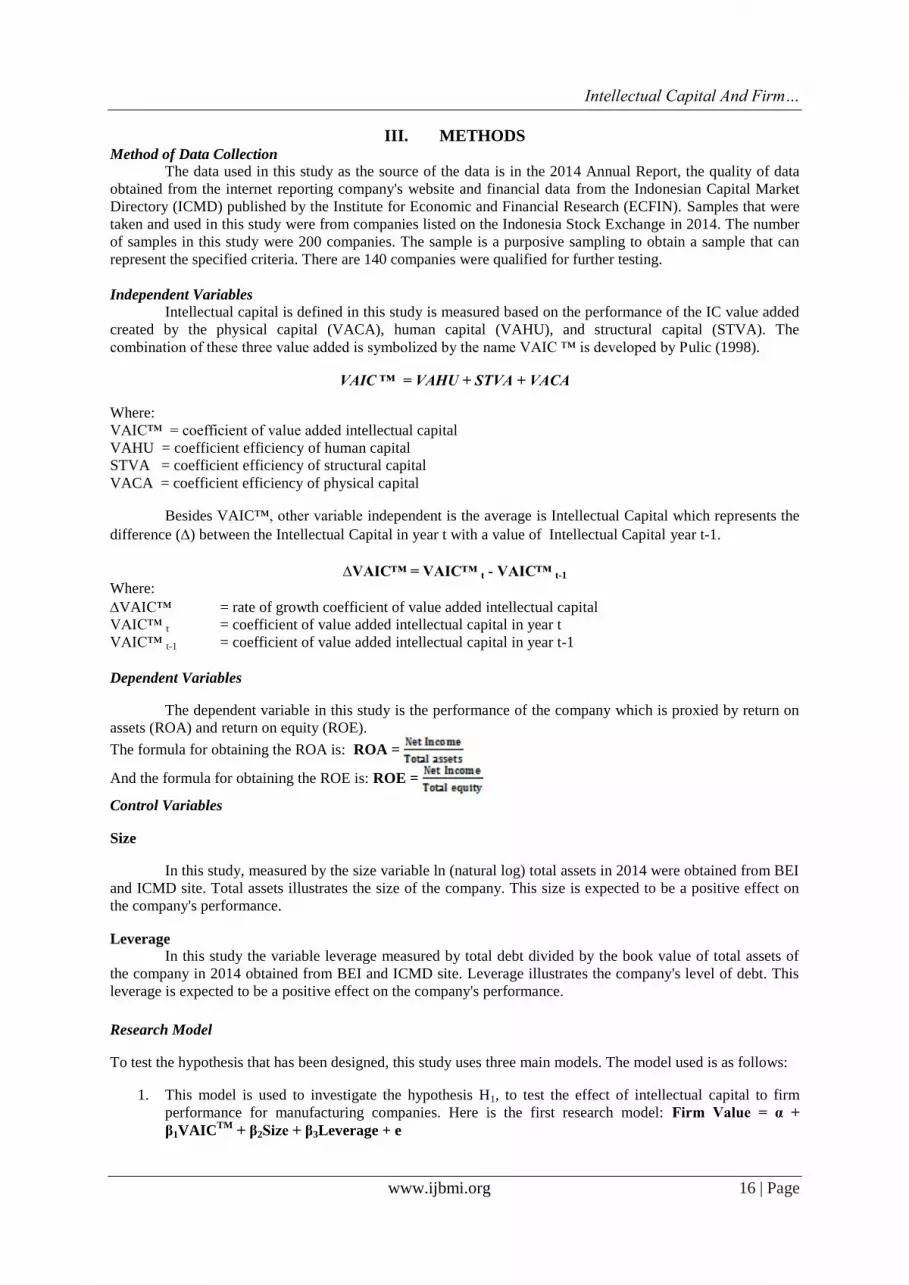
III. METHODS Method of Data Collection
The data used in this study as the source of the data is in the 2014 Annual Report, the quality of data
obtained from the internet reporting company's website and financial data from the Indonesian Capital Market
Directory (ICMD) published by the Institute for Economic and Financial Research (ECFIN). Samples that were
taken and used in this study were from companies listed on the Indonesia Stock Exchange in 2014. The number
of samples in this study were 200 companies. The sample is a purposive sampling to obtain a sample that can
represent the specified criteria. There are 140 companies were qualified for further testing.
Independent Variables
Intellectual capital is defined in this study is measured based on the performance of the IC value added
created by the physical capital (VACA), human capital (VAHU), and structural capital (STVA). The
combination of these three value added is symbolized by the name VAIC ™ is developed by Pulic (1998).
VAIC ™ = VAHU + STVA + VACA
Where:
VAIC™ = coefficient of value added intellectual capital
VAHU = coefficient efficiency of human capital
STVA = coefficient efficiency of structural capital
VACA = coefficient efficiency of physical capital
Besides VAIC™, other variable independent is the average is Intellectual Capital which represents the
difference () between the Intellectual Capital in year t with a value of Intellectual Capital year t-1.
VAIC™ = VAIC™ t - VAIC™ t-1
Where:
VAIC™ = rate of growth coefficient of value added intellectual capital
VAIC™ t = coefficient of value added intellectual capital in year t
VAIC™ t-1 = coefficient of value added intellectual capital in year t-1
Dependent Variables
The dependent variable in this study is the performance of the company which is proxied by return on
assets (ROA) and return on equity (ROE).
The formula for obtaining the ROA is: ROA =
And the formula for obtaining the ROE is: ROE =
Control Variables
Size
In this study, measured by the size variable ln (natural log) total assets in 2014 were obtained from BEI
and ICMD site. Total assets illustrates the size of the company. This size is expected to be a positive effect on
the company's performance.
Leverage
In this study the variable leverage measured by total debt divided by the book value of total assets of
the company in 2014 obtained from BEI and ICMD site. Leverage illustrates the company's level of debt. This
leverage is expected to be a positive effect on the company's performance.
Research Model
To test the hypothesis that has been designed, this study uses three main models. The model used is as follows:
1. This model is used to investigate the hypothesis H1, to test the effect of intellectual capital to firm
performance for manufacturing companies. Here is the first research model: Firm Value = α +
β1VAICTM
+ β2Size + β3Leverage + e

Intellectual Capital And Firm…
www.ijbmi.org 17 | Page
2. This model is used to investigate the hypothesis H2, which is to test the effect of intellectual capital to
firm performance for manufacturing companies. Here is a second research model: Firm Value = α +
β1VAICTM
+ β2Size + β3Leverage + e
3. This model is used to investigate the hypothesis H3, which is to test the effect of the average growth of
intellectual capital to firm performance. The following is the third research model: Firm Value = α +
VAICTM
+ β2Size + β3Leverage + e
Where:
Firm Value = return on equity dan return on assets as firm performances proxy
VAICTM
= value added intellectual coefficient as intellectual capital proxy
VAICTM
= average growth of intellectual capital, which difference between the intellectual capital in year
t with a value of intellectual capital year t-1
Size = ln total assets
Leverage = total debt devided by book value total assets
IV. RESULTS Descriptive Statistics
From 200 companies drawn reduce to be 140 which qualified as sample in this reasearch. The table
shows the descriptive statistics of all variables in this research.
==Insert Table 1 ==
By the tabel shown that VAICTM
, VAICTM
, ROE, ROA, Size and leverage have mean 6.260804,
13.12116, 0.194455, 0.073416, 14.213940 and 69.623843. Meanwhile, standar deviation are 4.937051,
9.288204, 0.284178, 0.044021, 15.988033 and 33.215022.
Hypothesis Testing
Hypothesis testing is using regression linear models to examine the effect of independent and
dependend variables of the research model.
==Insert Table 2 ==
From the test results as the table 2 shown that:
Hypothesis 1 was rejected, if firm performance is measured using ROE for companies that are
categorized as manufactured sector. Between intellectual capital and the firms performances there is
positive relationship (β1 = 0.204842). This means that intellectual capital affected firm performance
but not significant.
Hypothesis 1 was accepted, if firm performance is measured using ROA for companies that are
categorized as manufactured sector. Between intellectual capital and the firms performances there is
positive relationship (β1 = 0.256000) with p value = 5%. This means that intellectual capital affected
firm performance which is significant.
Hypothesis 2 was rejected, if firm performance is measured using ROE for companies that are
categorized as non manufactured sector. Between intellectual capital and the firms performances there
is positive relationship (β1 = 0.335682). This means that intellectual capital affected firm performance
but not significant.
Hypothesis 2 was accepted, if firm performance is measured using ROA for companies that are
categorized as manufactured sector. Between intellectual capital and the firms performances there is
positive relationship (β1 = 0.379504) with p value = 5%. This means that intellectual capital affected
firm performance which is significant.
Hypothesis 3 was accepted, if firm performance is measured using ROE. Between growth of
intellectual capital and firms performances there is positive relationship (β1 = 0.229504) with p value =
5%. This means that growth of intellectual capital affected firm performance which is significant.
Hypothesis 3 was accepted, if firm performance is measured using ROA. Between growth of
intellectual capital and firms performances there is positive relationship (β1 = 5.669178) with p value =
5%. This means that growth of intellectual capital affected firm performance which is significant.

Intellectual Capital And Firm…
www.ijbmi.org 18 | Page
Discussion
Based on the test results as described, the discussion will explore the influence of intellectual capital
(VAIC) and growth of intellectual capital to firm performance. The hypotheses of this study is that intellectual
capital (VAIC) and growth of intellectual capital affect firm performance.
From the test results obtained that intellectual capital significantly affected to firm performance if
indicated by ROA, not ROE. So therefore it means that the hypothesis is accepted, that the intellectual capital
(VAIC) has a significant effect to firm performance. The results are consistent with research Chen et.al.
(2005), Ulum (2008), Ramadan (2009) and Syed Najibullah (2005) which states that there is a positive
significant effect on firm performance proxied by ROA. But inversely proportional to the results Kuryanto
(2008) which states that the VAIC and performance of the company is not positively related.
From the test results obtained that growth of intellectual capital significantly affected to firm
performance which indicated by ROA and ROE. The study's findings consistent with Tan et al. (2007), which
showed a significant influence of the growth of intellectual capital to firm performanceas measured by ROA or
ROE. This means that the companies in Indonesia, has a maximum manage and develop theirs intellectual
property to win the competitive advantage. Intellectual capital has become an interesting theme to be developed
in order to create value for the company. Firms began to focus on the long-term interests, one of which is
increasing the financial return. It can be seen from the level of significant of firm performance measures by
ROA is 3,950, which means significant at p <0:01 (one-tailed) and if measure by ROE is 5669, which means
significant at p <0:01 (one-tailed).
V. CONCLUSION Based on the results of statistical testing and analysis has been discussed in the previous chapter, it can
be concluded as follows:
1. There is a significant relationship between intellectual capital to firm performance when the company's
performance was measured by ROA. This proves the first hypothesis and second hypothesis of this
study is accepted. That there is significant effect between intellectual capital (VAICTM
) to ROA for the
company in a category were categorized as manufactured and non-manufactured companies. These
results suggest that intellectual capital is one of the important variables that determine the performance
of companies in several sectors in Indonesia.
2. There is a significant difference between the average growth of intellectual capital to firm performance
when the company's performance was measured by ROA and ROE. This proves the third hypothesis of
this study is accepted. That there is significant influence between the average growth of intellectual
capital (ΔVAICTM
) on ROA. This means that companies in Indonesia already managed and developed
the intellectual capital in order to win the competition advantage. Intellectual capital has become an
interesting theme to be developed in order to create value for the company. Firms began to focus on the
long-term interests, one of which is increasing the financial return
3. ROE is not considered as a criteria for measurement of firm performance to examine the effect of
intellectual capital
REFERENCES [1] Abdolmohammadi, M.J. 2005. “Intellectual capital disclosure and market capitalization”. Journal of Intellectual Capital. Vol. 6
No. 3. pp. 397-416. [2] Accounting Principles Board. 1970. “Intangible Assets, APB Opinion 17”. American Institute of Certified Public Accountants,
New York, NY.
[3] Accounting Standards Board. 1997. “Goodwill and Intangible Assets, FRS 10”. Accounting Standards Board, London. [4] Achten, J.H.J. 1999. “Transparency in intangible production assets“. Paper presented at the International Symposium Measuring
and Reporting Intellectual Capital: Experiences, Issues and Prospects. June. Amsterdam.
[5] Andriessen, D., M. Frijlink, I.V. Gisbergen, and J. Blom. 1999. “A core competency approach to valuing intangible assets“. Paper presented at the International Symposium Measuring and Reporting Intellectual Capital: Experiences, Issues and Prospects.
June. Amsterdam.
[6] Astuti, P.D. dan A. Sabeni. 2005. “Hubungan Intellectual Capital dan Business Performance”. Proceeding SNA VII. Solo. pp. 694-707
[7] Backhuijs, J.B., W.G.M. Holterman, R.S. Oudman, R.P.M. Overgoor and S.M. Zijlstra. 1999. “Reporting on intangible assets“.
Paper presented at the International Symposium Measuring and Reporting Intellectual Capital: Experiences, Issues and Prospects. June. Amsterdam.
[8] Bank Indonesia. 2007. Statistik Perbankan Indonesia. Direktorat Perizinan dan Informasi Perbankan Bank Indonesia. Jakarta.
[9] Barney, J. 1991. Firm Resources and Sustained Competitive Advantage. Journal of Management 17 (1) : 99-120. [10] Becker,G.S. 1964. Human Capital : A Theoritical & Empirical Analysis, 3rd ed. NY : Columbia University Press.
[11] Belkaoui ,A.R. 2003. Intellectual Capital and Firm Performance of US Multinational Firms’: A Study of The Resource-based and
Stakeholder views. Journal of Intellectual Capital 4 (2) : 215-226 [12] Boekestein, B. 2006. “The relation between intellectual capital and intangible assets of pharmaceutical companies”. Journal of
Intellectual Capital. Vol. 7 No. 2. pp. 241-253.

Intellectual Capital And Firm…
www.ijbmi.org 19 | Page
[13] Bontis,N., Crossan, M and Hulland, J. 2001. Managing an Organizational Learning System by Aligning Stocks and Flows,
Journal of Management Studies 39 (4) : 437-469.
[14] Bontis,Nick, William Chua Chong Keow, and Stanley Richardson. 2000. Intellectual Capital & Business Perfomance in Malaysia Industries. Journal of intellectual Capital 1 (1)
[15] Brooking, A. 1996. Intellectual Capital – Core asset for the Third Millenium Enterprise. International Thompson Business Press
London 8 (12-13) : 76. [16] Bornemann, M., A. Knapp, U. Schneider, and K.I. Sixl. 1999. “Holistic measurement of intellectual capital“. Paper presented at
the International Symposium Measuring and Reporting Intellectual Capital: Experiences, Issues and Prospects. June. Amsterdam.
[17] ____________, and K.H. Leitner. 2002. “Measuring and reporting intellectual capital: the case of a research technology organisation”, Singapore Management Review. Vol. 24 No. 3. pp. 7-19.
[18] Bozzolan, S., F. Favotto, and F. Ricceri. 2003. “Italian annual intellectual capital disclosure; An empirical analysis”. Journal of Intellectual Capital. Vol. 4 No. 4. pp. 543-558.
[19] Brennan, N. 1999. “Reporting and managing intellectual capital: evidence from Ireland”, Paper presented at the International
Symposium Measuring and Reporting Intellectual Capital: Experiences, Issues and Prospects. June. Amsterdam. [20] __________. 2001. “Reporting intellectual capital in annual reports: evidence from Ireland”. Accounting, Auditing &
Accountability Journal. Vol. 14 No. 4. pp. 423-436.
[21] __________, and B. Connell. 2000. “Intellectual capital: current issues and policy implications”. Journal of Intellectual Capital Vol. 1 No. 3. pp. 206-240.
[22] Budi Hartono. 2001. Intellectual Capital : Sebuah Tantangan, Akuntansi Masa Depan. Media Akuntansi 21 ( Oktober) : 65-72.
[23] Bukh, P.N. 2003. “Commentary, the relevance of intellectual capital disclosure: a paradox?”. Accounting, Auditing & Accountability Journal. Vol. 16 No. 1. pp. 49-56.
[24] _________, C. Nielsen, P. Gormsen, and J. Mouritsen. 2005. “Disclosure of information on intellectual capital in Danish IPO
prospectuses”. Accounting, Auditing & Accountability Journal. Vol. 18 No. 6. pp. 713-732. [25] Canibano, L., M.G. Ayuso, M.P. Sanchez, and M. Olea. 1999. “Measuring intangibles to understand and improve innovation
management. Preliminary results”. Paper presented at the International Symposium Measuring and Reporting Intellectual
Capital: Experiences, Issues and Prospects. June. Amsterdam. [26] Chen ,M.C., S.J. Cheng , and Y. Hwang. 2005. An Empirical Investigation of The Relationship between Intellectual Capital and
Firms’ Market Value and Financial Performance. Journal of Intellectual Capital 6 (2): 159- 176.
[27] Cooper, D.R. and C.W. Emory. 1995. Business Research Methods. Richard D. Irwin, Inc. [28] Danish Agency for Trade and Industry. 1999. Developing Intellectual Capital Accounts. Experiences from 19 Companies.
Ministry of Business and Industry. Copenhagen.
[29] Danish Confederation of Trade Unions. 1999. “Your knowledge – can you book it?”. Paper presented at the International Symposium Measuring and Reporting Intellectual Capital: Experiences, Issues and Prospects. June. Amsterdam.
[30] Danish Trade and Industry Development Council. 1997. Intellectual Capital Accounts: Reporting and Managing Intellectual
Capital. Danish Trade and Development Council. Copenhagen. [31] Deegan, C. 2004. Financial Accounting Theory. McGraw-Hill Book Company. Sydney.
[32] Edvinsson, L. and M. Malone. 1997. Intellectual Capital: Realizing Your Company’s True Value by Finding Its Hidden
Brainpower. HarperCollins, New York, NY.
[33] Firer, S., and S.M. Williams. 2003. Intellectual Capital and Traditional Measures of Corporate Performance, Journal of
Intellectual Capital 4 (3) : 348- 360.
[34] Firer,S., and Stainbank,L. 2003. Testing The Relationship Between Intellectual Capital and a Company Performance: Evidence from South Africa. Meditari Accountancy Research 11 : 23-44
[35] Flamholtz,E.G .and Lacey, J.M. 1981. Personnel Management, Human Capital Theory, and Human Resource accounting, 1nd.
LA : Relat.university California. [36] Ghozali, I. 2006. Structural Equation Medeling; Metode Alternatif dengan PLS. Badan Penerbit Undip. Semarang
[37] Grant,R.M. 1991. The Resource Based Theory of Competitive Advantage. California Management Review 33 (3) : 114-135.
[38] Goh, P.C., and K.P. Lim. 2004. “Disclosing intellectual capital in company annual reports; Evidence from Malaysia”. Journal of Intellectual Capital Vol. 5 No. 3. pp. 500-510.
[39] Guthrie, J., and L.D. Parker. 1989. “Corporate social reporting: a rebuttal of legitimacy theory”. Accounting and Business
Research. Vol. 19 No. 76. pp. 343-52. [40] _________, R. Petty, F. Ferrier, and R. Well. 1999. “There is no accounting for intellectual capital in Australia: review of
annual reporting practices and the internal measurement of intangibles within Australian organisations”. Paper presented at the
International Symposium Measuring and Reporting Intellectual Capital: Experiences, Issues and Prospects, OECD, June. Amsterdam.
[41] _________, and _____. 2000. “Intellectual capital: Australian annual reporting practices”. Journal of Intellectual Capital. Vol. 1
No. 3. pp. 241-251. [42] _________, ________, and F. Ricceri. 2006. “The voluntary reporting of intellectual capital; comparing evidence from Hong
Kong and Australia”. Journal of Intellectual Capital. Vol. 7 No. 2. pp. 254-271.
[43] Harrison, S., and P.H. Sullivan. 2000. “Profitting form intellectual capital; Learning from leading companies”. Journal of Intellectual Capital. Vol. 1 No. 1. pp. 33-46.
[44] Hikam, M.A.S. (ed.). 1996. Studi Kebijakan Pemerintah Dalam Masalah Tenaga Kerja: Kinerja dan Produktivitas Tenaga Kerja di Sektor Industri. Puslitbang Ekonomi dan Pembangunan (PEP)-LIPI. Jakarta.
[45] Hoogendoorn, M., A.D. Bos, F. Krens, W. Veerman, and H.T. Beek. 1999. “Transparency in intellectual capital”. Paper
presented at the International Symposium Measuring and Reporting Intellectual Capital: Experiences, Issues and Prospects. June. Amsterdam.
[46] Hudson,W. 1993. Intellectual Capital : How to Build It, Enhance It, Use It, John Wiley, New York.
[47] International Federation of Accountants. 1998. “The Measurement and Management of Intellectual Capital”. available online at: www.ifac.org. (accessed November 2006).
[48] Jackson, E. and Schuler, R.S. 1995. Understanding Human Resource Management in the context of organizations and Their
Environment . Annual Review Psychology 46 : 237-264. [49] Johanson, U., M. Martensson, and M. Skoog. 1999. “Measuring and managing intangibles: 11 Swedish exploratory case
studies”. Paper presented at the International Symposium Measuring and Reporting Intellectual Capital: Experiences, Issues and
Prospects. June. Amsterdam.

Intellectual Capital And Firm…
www.ijbmi.org 20 | Page
[50] ___________, G. Eklov, M. Holmgren, and M. Martensson. 1999. “Human resource costing and accounting versus the balanced
scorecard: a literature survey of experience with the concepts”. Paper presented at the International Symposium Measuring and
Reporting Intellectual Capital: Experiences, Issues and Prospects. June. Amsterdam. [51] Kamath, G.B. 2007. “The intellectual capital performance of Indian banking sector”. Journal of Intellectual Capital. Vol. 8 No.
1. pp. 96-123.
[52] Kaplan, R.S. and D.P. Norton. 1992. “The balanced scorecard – measures that drive performance”. Harvard Business Review. Vol. 70 No. 1. pp. 71-9.
[53] Kin Gan and Zakiah Saleh . 2008. Intellectual Capital and Corporate Performance of Technology-Intensive Companies: Malaysia
Evidence. Asian Journal Of Business and Accounting 1 (1) : 113-130. [54] Kubo, I., and A. Saka. 2002. “An inquairy into the motivations of knowledge workers in the Japanese financial industry”.
Journal of Knowledge Management. Vol. 6 No. 3. pp. 262-271. [55] Mavridis, D.G. 2004. “The intellectual capital performance of the Japanese banking sector”. Journal of Intellectual Capital. Vol.
5 No. 3. pp. 92-115.
[56] Meek ,G.K ., and S.J.Gray. 1988 . The Value Added Statement : An Innovation For The US Companies. Accounting Horizons 12 (2) : 73-81.
[57] Miller, M., B.D. Du Pont, V. Fera, R. Jeffrey, B. Mahon, B.M. Payer, and A. Starr. 1999. “Measuring and reporting intellectual
capital from a diverse Canadian industry perspective”. Paper presented at the International Symposium Measuring and Reporting Intellectual Capital: Experiences, Issues and Prospects. June. Amsterdam.
[58] Nielsen, C., P.N. Bukh, J. Mouritsen, M.R. Johansen, and P. Gormsen. 2006. “Intellectual capital statements on their way to the
stock exchange; Analyzing new reporting systems”. Journal of Intellectual Capital. Vol. 7 No. 2. pp. 221-240. [59] Penrose,E.T. 1959. The Theory of The Growth of The Firm. Basil Blackwell & Mott Ltd. Great Britaino.
[60] Petty, P. and J. Guthrie. 2000. “Intellectual capital literature review: measurement, reporting and management”. Journal of
Intellectual Capital. Vol. 1 No. 2. pp. 155-75. [61] Petrash, G. 1996. “Dow’s journey to a knowledge value management culture”, European Management Journal. Vol. 14 No. 4.
pp. 365-73.
[62] Pfeffer , J. and dan Salancik , G.R. 1978. The External Control of Organizations: A Resource-Dependence Perspective. Harper and Row, New York.
[63] Pratiwi Dwi Astuti. 2005. Hubungan Intellectual Capital dan Business Performance. Jurnal Maksi 5 (januari) : 34-57.
[64] Pulic ,A. 2000. VAIC™- An Accounting Tool For IC Management (on-line) Available http://www.measuring-ip.at/Paper/ham99txt.htm . accessed November 2006.
[65] Pulic, A. 1998. Measuring The Performance of Intellectual Potential in Knowledge Economy. Paper presented at the 2nd
McMaster World Congress on Measuring and Managing Intellectual Capital by the Austrian Team for Intellectual Potential . [66] Reed,K. 2000. The Dynamics of Intellectual Capital. Ph.D Dissertation. University of Connecticut Connecticut , United States of
America.
[67] Roos,G., Roos,J., Edvinsson, L., and Dragonetti, ,N.C. 1997. Intellectual capital- Navigating in the New Business Landscape , NY : New York University Press.
[68] Russel,C.J., Colella A., and Bobko P. 1993. Expanding the Context of Utility : The Strategic impact Personel selection. Pers.
Psychology 46 : 781-801.
[69] Sawarjuwono, T. 2003. “Intellectual capital: perlakuan, pengukuran, dan pelaporan (sebuah library research)”. Jurnal Akuntansi
dan Keuangan. Vol. 5 No. 1. pp. 35-57.
[70] Setiarso, B. 2006. “Pengelolaan Pengetahuan (Knowledge Management) dan Modal Intelektual (Intellectual Capital) Untuk Pemberdayaan UKM”. available online at: www.ilmukomputer.com (accessed April 2007).
[71] Starovic,D., and Marr,B. 2004. Understanding Corporate Value : Managing and Reporting Intellectual Capital . Chartered
Institute of Management Accountants. [72] Stewart,Thomas A. 1997. Intellectual Capital : The New Wealth of Organization (on-line) Available http://
www.fastcompany.com.
[73] Sullivan Jr., P.H. and P.H. Sullivan Sr. 2000. “Valuing intangible companies, an intellectual capital approach”. Journal of Intellectual Capital. Vol. 1 No. 4. pp. 328-340.
[74] Suseno dan P. Abdullah. 2003. Sistem dan Kebijakan Perbankan di Indonesia. Seri Kebanksentralan No. 7. Pusat Pendidikan dan
Studi Kebanksentralan (PPSK) Bank Indonesia. Jakarta. [75] Sveiby, K.E. 2001. “Method for measuring intangible assets”. available online at: www.sveiby.com/articles (accessed December
2006)
[76] Tan ,H.P., D.Plowman, P.Hancock. 2007. Intellectual Capital and Financial Returns of Companies. Journal of Intellectual Capital .8 ( 1 ) : 76- 95.
[77] Wernerfelt, B. 1984. A Resource Based View of the Firm. Strategic Management Journal 5:171-180.
APENDIX
Table 1
Descriptive Statatistics Variables Mean Median Std Deviasi Max Min Skewness
VACA 0.1898511 0.162565 0.3169425 4.7321266 0.037683 0.218239
VAHU 5.723578 4.239123 3.678509 78.22429 1.012145 4.370599
STVA 0.694616 0.751628 0.629143 0.998233 0.011999 0.426121
VAICTM 6.260804 4.583653 4.937051 79.76785 1.047576 5.126656
VAICTM 13.12116 9.100232 9.288204 159.2575 2.083437 9.840291
ROE 0.194455 0.144144 0.284178 1.471975 0.003326 0.630164
ROA 0.073416 0.039835 0.044021 0.426358 -0.06833 0.080419
SIZE 14.213940 14.240854 15.988033 179.668184 10.03771 0.062640
LEVERAGE 69.623843 68.750991 33.215022 280.04083 26.68947 0.448892
Intellectual Capital And Firm…
www.ijbmi.org 21 | Page
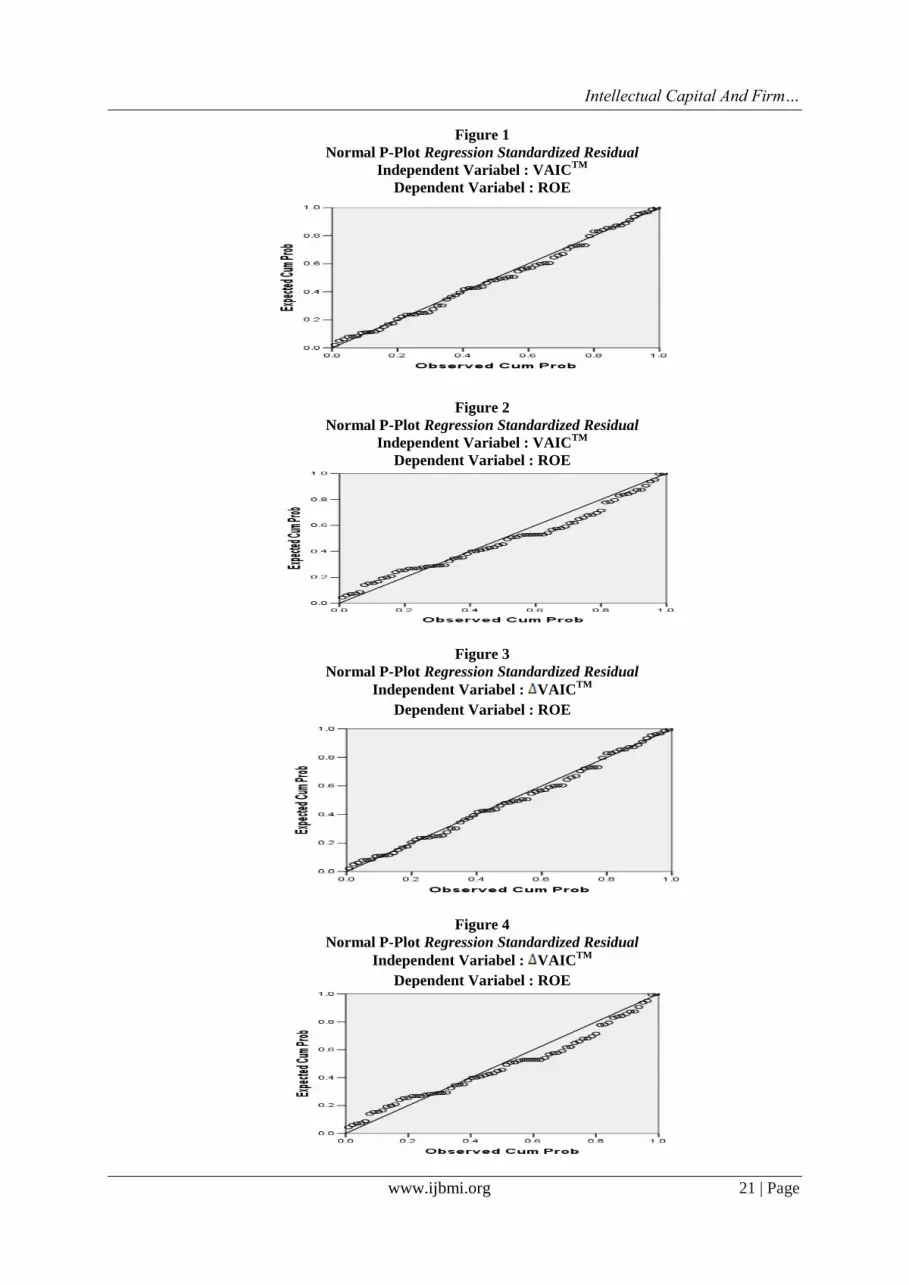
Figure 1
Normal P-Plot Regression Standardized Residual
Independent Variabel : VAICTM
Dependent Variabel : ROE
Figure 2
Normal P-Plot Regression Standardized Residual
Independent Variabel : VAICTM
Dependent Variabel : ROE
Figure 3
Normal P-Plot Regression Standardized Residual
Independent Variabel : VAICTM
Dependent Variabel : ROE
Figure 4
Normal P-Plot Regression Standardized Residual
Independent Variabel : VAICTM
Dependent Variabel : ROE

Intellectual Capital And Firm…
www.ijbmi.org 22 | Page
Table 2
Hypothesis Testing
Hipotesis Coefficient Estimate Sig t Sign Result
H1 (manufactur sectors)
VAICTM FV= ROE VAICTM FV= ROA
0.204842 0.256000
1.866321 2.669178
+ +
Not Significant (H1 rejected) Significant (H1 accepted)
H2 (non- manufactur sectors)
VAICTM FV = ROE VAICTM FV = ROA
0.335682 0.379504
0.463246 5.224920
+ +
Not Significant (H2 rejected) Significant (H2 accepted)
H3 VAICTM FV : ROA
VAICTM FV : ROE
0.229504
5.669178
5.669178
3.950322
+
+
Significant (H3 accepted)
Significant (H3 accepted)
Table 3
OLS Test
Variance Inflation Factor
Variabel VIF
C
VAICTM 9,1243
VAICTM 4,6032
ROE 7,9192
ROA 5,0645
Figure 5
OLS Test
Scatterplot Data Residual Error
Independent Variabel : VAICTM
Dependent Variabel : ROE
Figure 6
OLS Test
Scatterplot Data Residual Error
Independent Variabel : VAICTM
Dependent Variabel : ROA

Intellectual Capital And Firm…
www.ijbmi.org 23 | Page
Figure 7
OLS Test
Scatterplot dari Data Residual Error
Independent Variabel : VAICTM
Dependent Variabel : ROE
Figure 8
OLS Test
Scatterplot dari Data Residual Error
Independent Variabel : VAICTM
Dependent Variabel : ROA