Embed Size (px)
Citation preview
European Journal of Business and Management www.iiste.org
ISSN 2222-1905 (Paper) ISSN 2222-2839 (Online) Vol 4, No.15, 2012
148
Interrelationships between capital structure and financial performance,
firm size and growth: comparison of industrial sector in KSE
Benish Javed
Mohammad Ali Jinnah University, Islamabad
Shehla Akhtar.
Mohammad Ali Jinnah University, Islamabad
Abstract
The purpose of the Study is to explore relationship between the capital structure and financial performance, evidence from
21 industries in Karachi stock exchange in Pakistan. The study has been analyzed capital structure and its impact on
financial performance during year 2004 to 2008. (5 years) financial years of 21 industries in KSE. The study will
empirically investigate the relationship between the capital structure and financial performance, by using correlation and
regression test on financial data which is collected from analysis reports of KSE, Balance sheet analysis and financial
statements of 21 sectors. The results have several Significant implications. The findings of the study show a positive
relationship between the Leverage, financial performance and Growth, Size, of the companies by accepting the alternate
hypothesis H
1 and Ho is rejected.
Key Words: leverage, Financial Performance Size, Growth
INTRODUCTION
Capital is important factor in firm for its survival and growth and it has key role in the financial performance of the firm to
achieve the long term goals and objects of the firm. The capital structure refers to the proportion of finances provided to the
firm through different sources which may include internal and external financers. The capital structure of the companies
may include equity, the funds contributed by internal financers called owners or the shareholders of the company or debt or
hybrid securities provided by external financers called creditors to finance the assets of the company. The ratio of total debt
to total capital employed is referred as firm’s leverage. In reality, capital structure may be highly complex and include
several sources of funds. There are many researches which are conducted about the capital structure in different views.
Franco Modigliani and Merton Miller (1958) wrote a paper about the irrelevance of the capital structure that enthused
researchers to debate on this topic. They proposed that capital structure is not influenced the value of the firm in perfect
market. The reasons may include bankruptcy costs, agency costs, taxes and information asymmetry etc. The trade off theory
of capital structure states that a company should choose how much debt and equity financing while creating a balance
between costs and benefits. Kraus and Litzenberger (1973) observed a balance between costs of bankruptcy and the tax
shield provided by debt. Sometimes the costs of agency are also considered. the theory may illustrate the differences in debt
to equity ratios between different industries but no explanation is provided for the same industry. Stewart C. Myers and
Nicolas Majluf in 1984 proposed another theory of capital structure is called Pecking order hypothesis that provides an idea
of order in which companies use to prioritize their financing sources. They follow the law of least effort and resistance
while making the choice of funds. The sequence lists the internal financing first and ends up with equity as a means of last
resort. Pecking Order theory intends to consider the costs of asymmetric information. Myers (1984) advocates the reason for
equity being a less preferred source for raising funds. The investors perceive the managers to have better know how about
the operations of the firm. If they issue new, equity, the investors may believe the firm to be undervalued and managers are
benefiting from the situation. Ultimately the investors may opt a lower value for the new issue of equity. The market
timings hypothesis suggests an idea of how firms and corporations in the economy decide whether to finance their
investment with equity or with debt instruments by predicting the future price movements of debt and equity. Some
researchers have previously studied the determinants of capital structure while others have suggested various conclusions
for finding out the relationships of leverage with other variables. The issue is still debatable whether leverage affects the
financial performance or the financial performance leads to the choice of capital structure? This study aims at finding out
the relationship of leverage with financial performance of industries in Pakistan.
European Journal of Business and Management www.iiste.org
ISSN 2222-1905 (Paper) ISSN 2222-2839 (Online) Vol 4, No.15, 2012
149
SIGNIFICANCE OF STUDY
There is a general hypothesis that leverage increases the risk of the firm which in turn increases the proportionate returns
leading to the ultimate wealth maximization of the shareholders, which is to be tested in the study. If leverage brings returns
and ultimately the maximization of value to the company, the long term sustainable growth in industrial sector is possible. If
the sector is growing, new developments will be observed, it will lead towards the overall country’s economic growth.
So that the firms may be able to base their decisions by considering the relationship and impact of leverage on financial
performance another important factor is that the study not only weighs account the book measures of financial performance
but also the market performance variables like market to book value and Tobin’s Q. the research under discussion suggests
the basis for decision making not only for companies but for the other stakeholders who have got various concerns or
dealings with the company. For the required rate of return of the shareholders which they can expect from the company for
the increased risk etc. and the potential investors may be interested by keeping in view the relationship of various variables
under consideration. 21 industries listed on KSE are involved in the research. In short, the research study is to be carried out
on 21 diversified industrial sectors taken form the economy of Pakistan.
Problem Statement
To study the relationship between “Financial Leverage and Financial Performance, firm size and growth” of companies
associated with different industrial groups of Pakistan.
Research Objectives
The research is aimed at achieving the following listed objectives;
-To find out whether a significant relationship exists between leverage and financial performance, firm size and growth.
-To provide a guideline for the companies operating in various sector to enhance their financial performance by the choice
of an improved or optimal capital structure via using leverage.
-To recommend the players of different industries whom and how can they progress at their market performance and
proportional returns out of increased risks by leverage.
Study Plan
The research study consists of five major parts. The first section consists of problem statement and objective while the next
chapter consists of review of literature previously done by various authors. It encounters the observations of relevant studies
found in literature history. Methodology and sources of data are given in the third chapter which states the contents of study
like hypothesis, theoretical framework, population and sample and analysis tools to be used. Immediately following section
is composed of all discussion and data analysis regarding the statistical findings of the study.
LITERATURE REVIEW
An extensive definition of stock leverage may be described as the ratio of total liabilities to total assets. It can be seemed as
an alternative for residual claim of shareholders when liquidation takes place. However, it does not provide an adequate
measure of looking at the firm’s risk of default in near future (Rajan and Zingales, 1995).
Leverage for each period remains the same if earnings of the firm are allocated in an independent and identical fashion
(Scott, 1976). According to Barnea, Haugen, and Talmo (1987), tax benefits of the firm are hurt if the firms have sufficient
earnings. Raymar (1991) find that “the leverage increases with the ratio of operating earnings to value.”
In view of Gibbs (1993), as the investment opportunities and initial financial leverage are unrelated, so the free cash flows
may divert to the smaller financial leverage. The returns may reduce proportional to the decreased risk of firm if the
mangers opt to finance the low profitable projects, ignoring the risk of capital market. On the other hand, Jensen (1986) low
financial leverage is one of the indicators of free cash flows. Degree of operating leverage also determines the capital
structure mix, as firm then exposed to industry influence at some scale and those having higher degree of operating leverage
may have less debt percentage and vice versa (Mandelker and Rhee,1984).
In view of Gibbs (1993), The returns may reduce proportional to the decreased risk of firm if the mangers opt to finance the
low profitable projects, ignoring the risk of capital market. On the other hand, Jensen (1986) low financial leverage is one of
the indicators of free cash flows. Haugen and Senbet (1998) suggest the future value of the firm is reduced by the
European Journal of Business and Management www.iiste.org
ISSN 2222-1905 (Paper) ISSN 2222-2839 (Online) Vol 4, No.15, 2012
150
implication of reduced future debt. They further elaborate that the default acts as the limitation to leverage in their model,
and default occurs primarily due to a depressed value of the firm; If the firms are having heterogeneous earning
processes[1], the relationship between the firm’s business risk and its debt usage may not be sufficiently taken into account
by using simple measures of earnings variability.Furthermore, the paper explores possible relationships between a firm's
capital structure and its industry category, variability in income, and operating leverage. They related the firm's
characteristics with the leverage class and found that the industry class is connected to the firm's leverage but in a less
noticeable behavior while the income variation to be measured in different ways can not be associated with the firm's
leverage. Modigliani and Miller (1958, 1963) support this judgment by concluding an insignificant relationship between the
financial leverage and the firm's value until and unless the firms are operating in a taxable environment where the tax
payments may affect the capital structure.
Weston's (1989) commentary on MM’s propositions affirms that a perfect, market equilibrium necessitate no change in
market value by its financing decisions and a linear raise in the required rate of return in equity with financial leverage will
result. The profitability change shows a negative correlation with change in leverage if the dividend and investments remain
fixed when main form of financing is debt financing in short run If the investment opportunities are provided to the smaller
firms, they may enhance their equity base by greater equity issues and the correlation of profitability and leverage may
reduce . (Rajan and Zingales, 1995). Whiting and Gilkison (2000) carried out a research with the conclusion that the
probability of dividend cuts decrease if the level of short term and total leverage is increased. They also found an asset level
and dividend cut more aggressively by poorly operating firms with high levels of leverage rather than that with lower
leverage levels. This shows that even if the firm is not able to payout its dividends from its profits, it may satisfy its owners
by paying out their dividends by the way of increasing leverage which may in turn be a source of attractive investment
opportunities in the firms for potential investors. But at the same time performance of the firm matters as it becomes the
question of sustainability and survival for the firms showing poor performance.
A general perception is that the probability of default and the bankruptcy costs (the costs of financial distress) may increase
with higher levels of leverage and amplified risk of the firm. Rajan and Zingales (1995) wrote that they observe negative
correlation as the costs of financial distress increase in the firms with high market-to-book ratios. Meanwhile, other
potential reasons for negative correlation of leverage with market-to-book value ratio may be use of higher discounts rates
for the shares of highly levered firms in financial distress as the price of distress risk. Fama and French (1992) also provide
support. But in such case firms with low market-to-book value ratio should have a negative correlation but in reality, it
appears to be negative for firms operating with higher market-to-book value ratios which suggests that financial distress is
not the responsible factor for findings of Rajan and Zingales (1995).DeAngelo and Masulis (1980) examined that firms’
efforts to work out Optimal capital structure is determined by various agency costs bankruptcy or tax gain on losses
from leverage usage ,compensating for other tax shield instruments of depletion ,depreciation, amortization and investment
tax credits. More variations were observed for the firms using leverage than that preferring unlevered capital structure. A
study by Hall and Weiss (1967) explained the presence of significant relationship of greater equity/debt ratio with
profitability, but also an influence of reducing risk, resulting in an increased profitability is observed.
In leverage-increasing events, shareholders tender common shares whose aggregate market value and dividend are less than
the liquidation value and annual dividend of the preferred stock issued by the firm. Thus, the net effect on the firm is to
increase its fixed obligations. In our opinion, it may lead to the greater creditors’ influence and the representation in the
board of directors of the company which may lead the management to take risky projects for the company to maximize the
returns as returns are the function of proportionate risks. Moreover, since the common shares tendered generally have one
vote per share, the explicit voting rights of shareholders who participate in the offer are eliminated or reduced (Pinegar and
Lease, 1986). Furthermore the author examines that changes in leverage need not alter the pre-event tax status of initiating
firms to effect changes in firm value. Specifically, announcements of preferred-for-common exchange offers lead to positive
firm revaluations in almost all of the leverage-increasing events. A negative change[2]
in firm value is predicted by the
signaling hypothesis when leverage-decreasing preferred-for-common exchange offers are announced.
According to Bernanke and Gertler (2005) monetary policy creators use their leverage over short-time interest rates to
influence the cost of capital and accordingly expenditure on fixed investments. The authors argue that the credit channel is a
set of factors that increase and spread conventional interest rate effects. The direct effects of monetary policy on interest
rates are then improved by endogenous changes in the external finance premium. A research study used an approach of
instantaneous equation and concluded that leverage inversely measured by equity to assets ratio has got a significant
negative relationship (Baker, 1973). Abor (2005) found that the ratio of debt (short term) to total assets and return on equity
show a positive relationship. While on the other hand, a negative relationship exists between the long term debt and return
on equity. As far as the total debt is concerned, a significant positive relationship was found when its ratio was compared to
the return on equity.
European Journal of Business and Management www.iiste.org
ISSN 2222-1905 (Paper) ISSN 2222-2839 (Online) Vol 4, No.15, 2012
151
The pecking order theory has an over-bearing influence in the financing patterns of the Nigerian firms by keeping some
other variables constant. The research also depicts a highly significant negative relationship between profitability and
financial leverage. While on the other hand, firm age is significantly and positively associated with financial leverage
(Ezeoha, 2008). By making alterations in the level of debt, the value of the firm may increase or decrease to lead the firm
moving towards or far away from industry averages. The authors calculated the ratio of leverage based on equity market
values and book values but the observations stood the same. Negligible or not a significant relationship was seen to the
market when debt level of the firm and that of firm’s industry was observed. The study affirmed that the market is not that
much concerned about the relationship that exists between the firm’s debt level and that for the industry. The research
results confirm the finding of Modigliani and Miller (1958) considering the irrelevance of financial leverage and the firm’s
value (Hatfield, Cheng and Davidson, 1994).The research results confirm the finding of Modigliani and Miller (1958)
considering the irrelevance of financial leverage and the firm’s value (Hatfield, Cheng and Davidson, 1994).
Staking and Babbel (1995) found that the generalizations about market value of the firm are related to the management
decisions for a firm’s financial structure. The value of firm is affected by the way of financial management for interest rate
risk and the financial leverage as the market value of equity suddenly drops by enhancing the risk of interest rates. The
situation happens when the shareholders of the firm are unable to hedge the risk of interest rates or to realize the maximum
franchise value if the firm becomes riskier with enhanced interest rates. With an increase in financial leverage slightly above
the modest levels, franchise value of the firm increases but at a decreasing rate. (Tobin’s Q determines the franchise value).
The levered and unlevered profitability has a negative mean leverage effect but a little positive median effect for leverage.
The two parts of the operating liability leverage effect, the operating liability leverage and the operating liability leverage
spread have a positive relationship characterized by the positive correlation between operating liability leverage and return
on operating assets (i-e, levered profitability). On the other hand, a positive relationship exists between the two constituents
of the financial leverage effect. Such leverage effect is comparatively large at the median and mean. Due to a positive
relationship between the financial leverage and the borrowing rate, the Pearson correlation between financial leverage and
financial spread is negative and insignificant. The reason for positive relationship between financial leverage and borrowing
rate is that higher risk causes the interest rates charged by creditors to rise and usually the profitable firms are likely to have
low levels of financial leverage (Nissim and Penman, 2003). In a study conducted by Weill (2003), an evidence for the
positive relationship between financial leverage and the corporate performance is found. These are the institutional factors
that affect the leverage and performance relationship while the shield for shareholder rights does not explain the reasons for
deviation of such relationship Leverage has got an insignificant positive impact in high debt industries while in recession
periods; total leverage has an insignificant negative impact on firms operating in low debt industries (Campello and Fluck,
2006).
Research Design
The chapter provides the details of research methodology used to conduct the study. It serves as a base to analyze the
statistical data results. There is a general belief that the leverage is correlated and affects the financial performance of the
companies by using the coefficient correlation. This study will measure the relationship between leverage and the financial
performance by using the correlation on the data of 21 industries of KSE. Leverage is measured by employing debt to equity
and debt to total assets ratios. The financial performance will be measured by employing the key book measures or
indicators commonly used return on assets (times) and return on equity (%) while the market performance will be measured
by using Market to book-value ratios and Tobin’s Q
Measurement of Variable:
The Independent Variable is financial Leverage measured by using to indicators represented by total debt to total assets
ratios and debt to equity ratio of 21 industries .The formula used to calculate total debt to asset ratio is given as follows:
Total Debt to Total Assets = Total Debt / Total Assets (1) Equation 2 represents the formula used to calculate debt to equity ratio of the industries is given as:
Debt-to-Equity Ratio = Debt / Common Equity (2) Financial performance is the Dependent Variable which is determined by using f Return on assets (ROA) Return
on equity (ROE) Market to book-value ratios (M/B) Tobin’s Q following ratios.
M/B = MVPS / BVPS (3) Where, M/B represents market to book ratio. MVPS represents market value per share while BVPS represents book
value per share. The market values are taken for measuring the market performance at the end of the company’s financial
period as the other data comes from financial statements formulated at the end of the year
ROE (%) = EAT / CSEq (4) In the above equation, ROE determines return on equity ratio equals to NPAT showing net profit after tax to CSEq
representing common shareholders’ equity.
European Journal of Business and Management www.iiste.org
ISSN 2222-1905 (Paper) ISSN 2222-2839 (Online) Vol 4, No.15, 2012
152
Tobin’s Q = MV Eq+ MV dt (5)
BVEq+ BVdt
The tobin’s Q measures sum of the market values of Equity (MVEq) and market value of debt (MVdt) to the book
value of equity (BVEq) and book value of debt (BVdt). The total debt of the companies is used for study including the
long term and short term debts. The market value of debt is taken for the calculation of Tobin’s Q by assuming the
same value as the book value of debt where sufficient information is not provided.
ROA(x) = NPAT / T A *100 (6) The equation 7 shows Return On Assets (ROA) ratio measured in times(x) the ratio illustrates NPAT net profit after tax as a
percentage of TA total assets
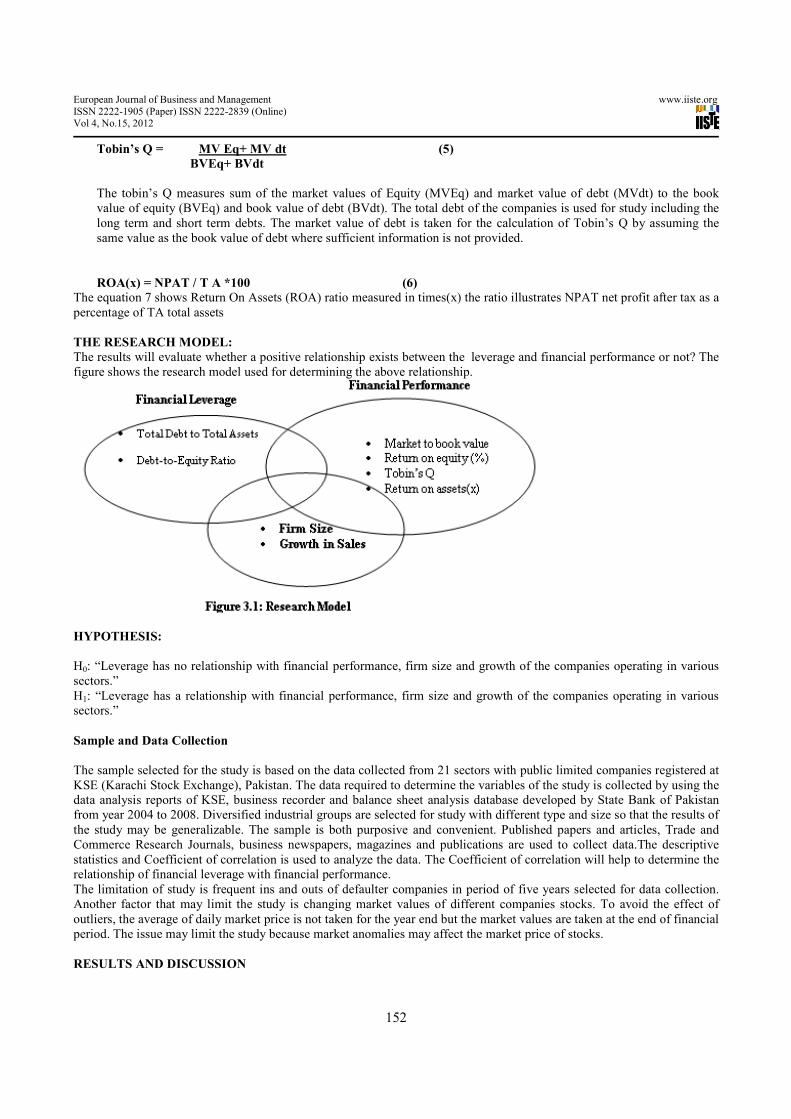
THE RESEARCH MODEL:
The results will evaluate whether a positive relationship exists between the leverage and financial performance or not? The
figure shows the research model used for determining the above relationship.
HYPOTHESIS:
H0: “Leverage has no relationship with financial performance, firm size and growth of the companies operating in various
sectors.”
H1: “Leverage has a relationship with financial performance, firm size and growth of the companies operating in various
sectors.”
Sample and Data Collection
The sample selected for the study is based on the data collected from 21 sectors with public limited companies registered at
KSE (Karachi Stock Exchange), Pakistan. The data required to determine the variables of the study is collected by using the
data analysis reports of KSE, business recorder and balance sheet analysis database developed by State Bank of Pakistan
from year 2004 to 2008. Diversified industrial groups are selected for study with different type and size so that the results of
the study may be generalizable. The sample is both purposive and convenient. Published papers and articles, Trade and
Commerce Research Journals, business newspapers, magazines and publications are used to collect data.The descriptive
statistics and Coefficient of correlation is used to analyze the data. The Coefficient of correlation will help to determine the
relationship of financial leverage with financial performance.
The limitation of study is frequent ins and outs of defaulter companies in period of five years selected for data collection.
Another factor that may limit the study is changing market values of different companies stocks. To avoid the effect of
outliers, the average of daily market price is not taken for the year end but the market values are taken at the end of financial
period. The issue may limit the study because market anomalies may affect the market price of stocks.
RESULTS AND DISCUSSION
European Journal of Business and Management www.iiste.org
ISSN 2222-1905 (Paper) ISSN 2222-2839 (Online) Vol 4, No.15, 2012
153
There are different capital structure theories and various studies that observe the relationship of leverage with the several
others like size of the company, investment opportunities, market value of firms and the growth. The studies review under
literature review measures the required relationships in isolation for analysis. This study determines the relationship of
financial leverage with financial performance but also considers the relationship of other important variables like market
capitalization or size, the sales growth. The capital structure is very important for the firms not only to decide about their
need for funding but also for making the significant decisions about levering their returns. The capital structure provides the
base for the financing decisions and the risk management strategies can be formulated on such basis. Returns are the
proportionate function of the level of risk the firm employs. The studies review under literature review measures the
required relationships in isolation for analysis. This study measures the relationship of financial leverage with financial
performance. The statistical analysis illustrates the observations.
Data Analysis and Interpretation
The data analysis shows the statistical results regarding leverage and the financial performance. Most commonly used
measure of leverage is calculation of financial ratios, of which debt to equity and total debt to total assets ratios are being
analyzed. As per the data summary shown in table 4.1, the debt to equity ratio of all the sectors demonstrates the mean of
1.27 interpreting an average ratio for the whole participants from period 2004 to 2008. The median for all the industry
players is 1.11 showing the middle value of debt to equity ratio. Standard deviation for debt to equity illustrates the degree
of divergence from mean having a value of +13.76. It measures that the debt to equity changes by 13.76 positive or negative
from mean. Sample Variance, the square of standard deviation measuring the disparity from mean is 189.31 on both positive
and negative sides of number line.
TABLE 4.1: Descriptive Statistics of Variables
Debt to
Equity
ratios(X)
ROE After
Tax(%)
Debt to
Assets
ratio(X) Tobin’s' Q
Log (market
capitalization)
Growth in
Sales(%)
Mean 1.12 15.60 2.80 2.81 2.89 56.47
Median 1.01 11.35 0.65 1.012 2.79 11.28
Standard
Deviation 13.80 107.12 18.30 16.00 1.97 421.88
Table 4.2
Correlation between ‘debt to equity’ ratio and ‘return on equity’ along with the other variables
ROE %
after tax
Debt to
equity
log(market
capitalization)
Sales Growth%
age
ROE % after tax 1
Debt to equity -0.69662 1
log(market capitalization) 0.05024 0.031114 1
Sales Growth% age 0.000617 0.008031 0.037334 1
The statistical analysis show a negative relationship of Debt to equity ratio with the return on equity by showing a
Coefficient of Correlation equal to -0.69662. The relationship is significantly negative 69.66% correlated. It proves the
hypothesis that a relationship exists between leverage and financial performance in companies operating Pakistan while
considering the given sample. As the debt is increased, the risk of the firm increases with increased costs of financial
distress and financial expenses may increase, decreasing the return in turn. The creditors may increase the costs of debt to
avoid the problem of asset substitution and underinvestment. An important reason for negative relationship may be
explained as the local market lenders may be sensitive to protect their loan repayments. The creditors may put restrictions
European Journal of Business and Management www.iiste.org
ISSN 2222-1905 (Paper) ISSN 2222-2839 (Online) Vol 4, No.15, 2012
154
on the companies not to take the risky projects because their money is on risk. If the companies are not taking risky projects
bringing maximum chances of proportionate returns, their return on equity may squeeze. Sometimes the creditors put their
representative in the board of directors of the companies to examine the companies’ activities and have greater influence if
the amount loan is greater. They don’t let the firm’s earnings grow to the desired extent and the firms make conservative
investments earning lower returns. Another important factor that might be contributed towards the negative relationship
may be the time period of the data taken. In such time horizon, a lot of volatility in the country markets took place. The
returns of the companies are also affected overall. The importance of the study is that it does not include and takes into
account the relationship of two variables under discussion in isolation but also measures the effect of moderating variables
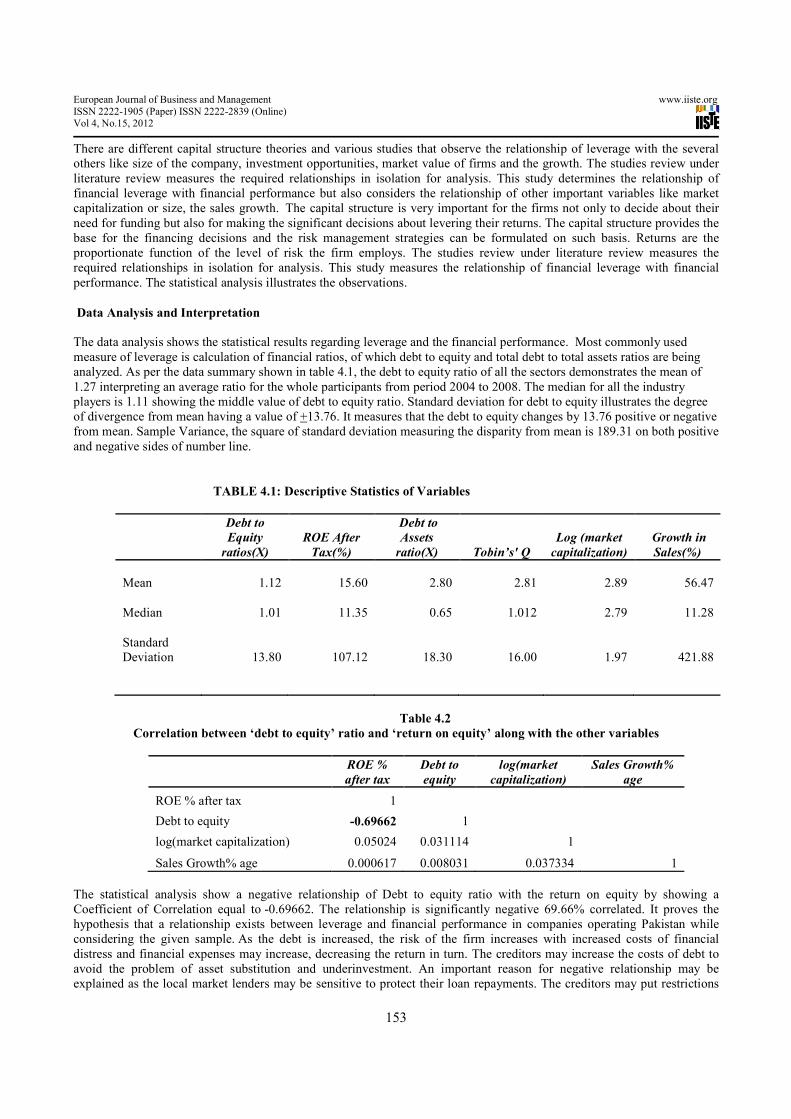
i-e the firm size, sales growth. The correlation of variables is shown in figure 4.1.
Figure 4.1
Correlation for ‘debt to equity’ ratio and ‘return on equity’ along with the other variables
Total debt to total assets measures the contribution of external financers for assets investment. The average shown in table
4.3 for debt to total assets is 2.16 for the firms lying in all the industries deviating from mean by 18.30 and may vary by
334.71 on both sides of the mean in normal distribution curve.
TABLE 4.4 Correlation between total Debts to total Assets and Tobin’s Q with firm size and growth
total Debt to
total assets Tobin’s' Q Firm size Growth%
Debt to total assets 1
Tobin’s' Q 0.859723 1
Log(market capitalization) -0.16456 -0.11787 1
Sales Growth% age -0.01716 -0.01091 0.037334 1
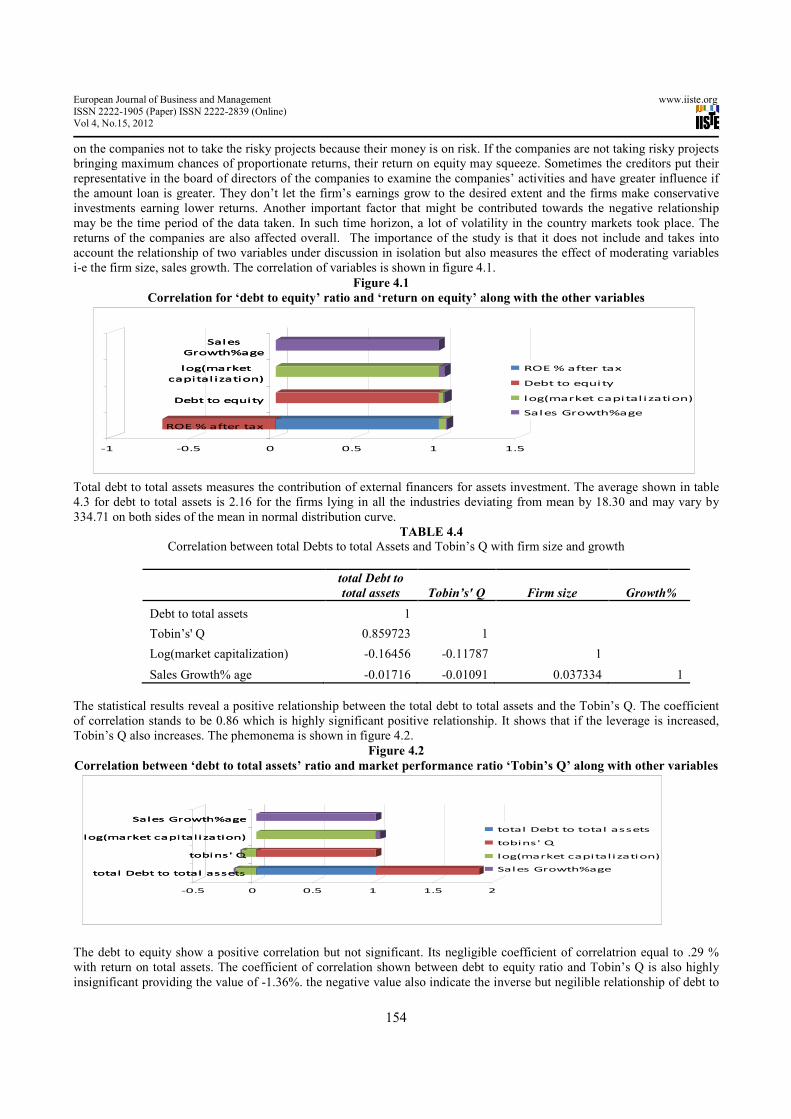
The statistical results reveal a positive relationship between the total debt to total assets and the Tobin’s Q. The coefficient
of correlation stands to be 0.86 which is highly significant positive relationship. It shows that if the leverage is increased,
Tobin’s Q also increases. The phemonema is shown in figure 4.2.
Figure 4.2
Correlation between ‘debt to total assets’ ratio and market performance ratio ‘Tobin’s Q’ along with other variables
The debt to equity show a positive correlation but not significant. Its negligible coefficient of correlatrion equal to .29 %
with return on total assets. The coefficient of correlation shown between debt to equity ratio and Tobin’s Q is also highly
insignificant providing the value of -1.36%. the negative value also indicate the inverse but negilible relationship of debt to
ROE % after tax
Debt to equity
log(market
capitalization)
Sales
Growth%age
-1 -0.5 0 0.5 1 1.5
ROE % after tax
Debt to equity
log(market
capitalization)
Sales
Growth%age
ROE % after tax
Debt to equity
log(market capitalization)
Sales Growth%age
total Debt to total assets
tobins' Q
log(market capitalization)
Sales Growth%age
-0.5 0 0.5 1 1.5 2
total Debt to total assets
tobins' Q
log(market capitalization)
Sales Growth%age
total Debt to total assets
tobins' Q
log(market capitalization)
Sales Growth%age
European Journal of Business and Management www.iiste.org
ISSN 2222-1905 (Paper) ISSN 2222-2839 (Online) Vol 4, No.15, 2012
155
equity ratio with Tobin’s Q. the linkage between debt to equity ratio and market to book value is positive but highly
insignificant demonstrating a value of 0.90%. the debt to equity ratio is negligibly correlated with EPS by 1.67%.
The total debt to total assets ratio is negatively correlated with return on equity and reveal insignificant statistical results
having a value of -2.24. the market to book value of the companies included in all the sample industries has a highly
insignificant negative correlation -4.27% with total debt to total assets. The total debt to total assets has a negative
correlation -4.23% with EPS but insignificant.
DISCUSSION AND CONCLUSIONS:
The research examined the relationship between leverage and financial performance along with the effect of size, growth
and industry. The relationship between debt to equity ratio and return on equity is found to be significantly negative with
confidence interval more than 95%. The relationship of total debt to total assets is found to be highly significant and
positive relationship with Tobin’s Q. Null hypothesis rejected that assumes no relationship of leverage with financial
performance. H1 hypothesis accepted as the results of research indicate that leverage has a relationship with financial
performance which is positive with Tobin’s Q while negative with return on equity after tax. The growth of the companies
does not make a considerable impact. On the other hand, size of the firm makes a significant impact in making a choice of
capital structure for maximizing the returns. The industry impact analysis show that the sugar, automobile assembling,
accessories and parts, engineering, pharmaceutical industry and miscellaneous sectors including tobacco, paper and board,
food and personal care, vegetable oil, food and personal care and glass and ceramics industries have a significant impact of
leverage on financial performance of the companies.
Modigliani and Miller (1958, 1963) conclude an insignificant relationship between the financial leverage and the firm's
value until and unless the firms are operating in a taxable environment where the tax payments may affect the capital
structure. The study results may not agree to some extent with the findings of authors as the leverage and market
capitalization of the firms may have significant impact in two cases i-e return on equity and Tobin’s Q. One factor
responsible for the inconsistent results with the findings of Modigiliani and Miller may be the tax effect. The research also
depicts a highly significant negative relationship between profitability and financial leverage. Weill (2003) illustrates a
positive relationship between financial leverage and the corporate performance. On the other hand, the impact of debt to
equity ratio on return on equity is negative and significant. In short, the results of the study support the existance of
significant relationship between leverage and financial performance. The study results are more consistant with the opnion
of Staking and Babbel (1995), who states that with an increase in financial leverage slightly above the modest levels,
franchise value of the firm increases but at a decreasing rate. (Tobin’s Q determines the franchise value). The study
examines a positive relationship and impact of leverage ratio on Tobin’s Q.
Ferri and Jones (1979) has observed the connection between size of the firm and leverage as it is a general perception that
larger firms may be more diversified as they take the benefit of an easy access to the capital markets. Such firms also enjoy
higher credit ratings for the issuance of their debt while paying a lower rate of interest on borrowed capital. The study
indicates that the increase in size of the firms may bring improved financial performance. It may infer that such firms have
room to absorb enhanced risks due to leverage and also can employ higher levels of leverage. Abor (2007) suggests that
financial performance is affected by the capital structure but not extensively. The research proves the impact of leverage on
financial performance of the companies but significantly.
Rajan and Zingales (1995) found that the change in profitability shows a negative correlation with change in leverage if the
dividend and investments remain fixed when main form of financing is debt financing in short run. Harris and Raviv (1991)
distinguished that there are corresponding leverage ratios commonly accepted by the firm in a given industry whereas
leverage ratios vary across industries. The consequences proved by the study analysis as the return on equity has a negative
correlation with debt to equity ratio and a negative coefficient when tested for regression results.
Haugen and Senbet (1998) related the firm's characteristics with the leverage class and found that the industry class is
connected to the firm's leverage but in a less noticeable behavior. The research proves that the impact of leverage on most of
industries is not significant except a few mentioned above. Weston's (1989) commentary on MM’s propositions affirms that
a perfect market equilibrium necessitate no change in market value by its financing decisions and a linear raise in the
required rate of return in equity with financial leverage will result. The authors’ conclusion is supported by the statistical
results as the market to book value is not significantly related to the leverage when tested along with other variables.
In short, the discussion can be concluded by summing up the results that alternate hypothesis is accepted. The hypothesis is
proved by the study that leverage has a significant relationship with financial performance. By considering the impact of
size, growth and industry, leverage has also a significant impact on the financial performance of the companies and may
provide them a base for decision making.
European Journal of Business and Management www.iiste.org
ISSN 2222-1905 (Paper) ISSN 2222-2839 (Online) Vol 4, No.15, 2012
156
DIRECTION FOR FUTURE RESEARCH
The relationship between the leverage and the financial performance is determined; a further study to measure the
significance of operating leverage for various sectors can be carried out. An emerging issue of further studies can be the
determination of impact of financial performance on choice of capital structure. By employing various levels of financial
leverage as the firms may enjoy high credit ratings etc. Role and Relationship of leverage with future investment
opportunities as the risk of firm increases via increased financial leverage may prove a significant contribution to future
research studies. A number of questions can be asked while considering the above issues. These are some questions which
may be answered in several studies for the different important sectors like Fuel and energy, Cement sector and Textile
sector in Pakistan, engineering and automobile sector to lead towards the sustainable future growth.
REFERENCES Abor, J. (2005). “The effect of capital structure on profitability: an empirical analysis of listed firms in Ghana.” The journal
of risk finance, Vol. 6, No. 5, pp. 438 - 445
Abor, J. (2007). “Debt policy and performance of SMEs.” The Journal of Risk Finance, Vol. 8, No. 4, pp. 364 - 379
Baker S. (1973). “Risk, Leverage and Profitability: An Industry Analysis.” The Review of Economics and Statistics, Vol. 55,
No. 4, pp. 503-507.
“Balance sheet analysis of Joint stock companies Listed on the Karachi stock exchange (2000-2005).” State bank of
Pakistan Statistics and DWH department, State Bank of Pakistan.
“Balance sheet analysis of Joint stock companies Listed on the Karachi stock exchange (2002-2007).” State bank of
Pakistan Statistics and DWH department, State Bank of Pakistan.
Barnea, A., R. Haugen, and E. Talmor. (1987). "Debt and Taxes: A Multiperiod Investigation." Journal of Banking and
Finance, Vol. 11, pp. 79-97.
Bernanke, Benjamin, John Campbell, and Toni Whited, (1990). “U.S. corporate leverage: developments in 1987 and
1988.” Brookings Papers on Economic Activity, Vol. I, pp. 255-278.
Campello, Murillo and Fluck, Zsuzsanna, (2006). “Product Market Performance, Switching Costs, and Liquidation Values:
The Real Effects of Financial Leverage.” AFA 2007 Chicago Meetings Paper. Available at
SSRN: http://ssrn.com/abstract=686435
DeAngelo, H., and R.W. Masulis, (1980). "Optimal Capital Structure under Corporate and Personal Taxation." Journal of
Financial Economics, Vol. 8, pp. 3-29.
Ezeoha, A. (2008). “Firm size and corporate financial-leverage choice in a developing economy Evidence from
Nigeria.” The Journal of Risk Finance, Vol. 9, No. 4, pp. 351 - 364
Fama, E. F., and Kenneth R. French, (1992). “The cross-section of expected returns.” Journal of Finance, Vol. 46, 427-
466.
Ferri, M. and W. Jones, (1979). “Determinants of Financial Structure: A New Methodological Approach.” The Journal of
Finance, Vol. 34, No. 3, pp. 631-644.
Galai, D. and R. Masulis, (1976). “The option pricing model and the risk factor of stock.” Journal of Financial
Economics, Vol.3, 53-81.
Gonenc, H., (2005). “Comparison of debt financing between international and domestic firms Evidence from Turkey,
Germany and UK.” International Journal of Managerial Finance, Vol. 1, No. 1, pp. 49-68
Hall, M., and L. Weiss, (1967). “Firm Size and Profitability." Technology, Profit Risk, and Assessments of this review, Vol.
49, 319-331.
Hamada, R. S. (1972). "The Effect of the Firm's Capital Structure on the Systematic Risk of Common Stocks." Journal of
Finance, pp. 435-452.
Harris, Milton, and Arthut Raviv, (1991). "The Theory of Capital Structure." Journal of Finance Vol. 46, March 1991, pp.
297-355.
Hatfield, G., L. Cheng, and Wallace N. Davidson, (1994). “The determination of optimal Capital structure: the effect of firm
and Industry debt ratios on market value." Journal of Financial and Strategic Decisions, Vol. 7, No. 3.
Haugen, R. and L. Senbet, (1988). “ Bankruptcy and Agency Costs: Their Significance to the Theory of Optimal Capital
Structure.” The Journal of Financial and Quantitative Analysis, Vol. 23, No. 1. pp. 27-38.
Hull, R. (1999). “Leverage Ratios, Industry Norms, and Stock Price Reaction: An Empirical Investigation of Stock-for-Debt
Transactions.” Financial Management, Vol. 28, No. 2, pages 32 - 45
Kraus and R.H. Litzenberger, (1973). "A State-Preference Model of Optimal Financial Leverage." Journal of Finance, pp.
911-922.
European Journal of Business and Management www.iiste.org
ISSN 2222-1905 (Paper) ISSN 2222-2839 (Online) Vol 4, No.15, 2012
157
MacKay, P., and G. Phillips, (2005). “How Does Industry Affect Firm Financial Structure?” The Review of Financial
Studies, Vol. 18, No. 4 pp. 1433-1466
Madan, K. (2007). “An analysis of the debt-equity structure of leading hotel chains in India.” International Journal of
Contemporary Hospitality Management, Vol. 19, No. 5, pp. 397-414
Modigliani, F., and M.H. Miller, (1958). "The Cost of Capital, Corporate Finance and the Theory of Investment." American
Economic Review, Vol. 48, pp. 261-296
Modigliani, F., and M.H. Miller, (1963). "Taxes and the Cost of Capital: A Correction." American Economic Review, Vol.
53, pp. 433-443.
Mandelker, G. N., and S.G. Rhee, (1984). "The Impact of the Degrees of Operating and Financial Leverage on Systematic
Risk of Common Stock." Journal of Financial and Quantitative Analysis, Vol.19, pp. 45-57.
Myers, Stewart C. and Nicholas S. Majluf, (1984). “Corporate financing and investment decisions when firms have
information that investors do not have.” NBER Working Paper Series, Vol. w1396. Available at
SSRN: http://ssrn.com/abstract=274547
Nissim, D., and S. H. Penman, (2003). “Financial Statement Analysis of Leverage and How It Informs About Profitability
and Price-to-Book Ratios.” Review of Accounting Studies, Vol. 8, No. 4, pages 531-560
Padron, Y. G. , Rosa M. C. Apolinario, Octavio M. Santana, Maria C. V. Martel, and Lourdes J. Sales, (2005).
“Determinant factors of leverage; An empirical analysis of Spanish corporations.” The Journal of Risk Finance, Vol. 6, No.
1, pp. 60 - 68
Pinegar, M., and Ronald C. Lease, (1986). “The Impact of Preferred-for-Common Exchange Offers on Firm Value.” The
Journal of Finance, Vol. 41, No. 4, pp. 795-814.
Rajan, R., and Luigi Zingales, (1995). “What Do We Know about Capital Structure? Some Evidence from International
Data.” The Journal of Finance, Vol. 50, No. 5, pp. 1421-1460.
Raymar, S. (1991). “A Model of Capital Structure when Earnings are Mean-Reverting.” The Journal of Financial and
Quantitative Analysis, Vol. 26, No. 3, pp. 327-344.
Scott, J. (1976). “A Theory of Optimal Capital Structure.” Bell Journal of Economics and Management Science, Vol. 7, pp.
33-54.
Scott, J., and G. Pascoe, (1986). “Beyond Firm and Industry Effects on Profitability in Imperfect Markets.” The Review of
Economics and Statistics, Vol. 68, No. 2, pp. 284-292
Staking, K. and David F. Babbel, (1995). “The Relation between Capital Structure, Interest Rate Sensitivity, and Market
Value in the Property-Liability Insurance Industry.” Journal of Risk and Insurance, Vol. 62, No. 4, pp. 690-718
Weill, L. (2003). “Leverage and Corporate Performance: A Frontier Efficiency Analysis on European Countries.” EFMA
Helsinki Meetings. Available at SSRN: http://ssrn.com/abstract=300640 or DOI: 10.2139/ssrn.300640
Weston, F. (1989). “What MM Have Wrought?” Financial Management, Vol. 18, No. 2, pp. 29-38.
Whiting, R., and S. Gilkison, (2000). "Financial Leverage and Firm Response to Poor Performance." Pacific Accounting
Review, Vol. 12, No. 2, pp. 1-35
[1] The heterogeneous firm’s earnings may be reflected by firm’s earnings sensitivity or in a generalized manner.
[2] The variables which explain the negative revaluation most successfully are: (1) the change in the aggregate liquidation
value of the preferred stock retired; (2) the existence of dividend arrearages; and (3) the strength of the preferred stock's
protective covenants.
This academic article was published by The International Institute for Science,
Technology and Education (IISTE). The IISTE is a pioneer in the Open Access
Publishing service based in the U.S. and Europe. The aim of the institute is
Accelerating Global Knowledge Sharing.
More information about the publisher can be found in the IISTE’s homepage:
http://www.iiste.org
CALL FOR PAPERS
The IISTE is currently hosting more than 30 peer-reviewed academic journals and
collaborating with academic institutions around the world. There’s no deadline for
submission. Prospective authors of IISTE journals can find the submission
instruction on the following page: http://www.iiste.org/Journals/
The IISTE editorial team promises to the review and publish all the qualified
submissions in a fast manner. All the journals articles are available online to the
readers all over the world without financial, legal, or technical barriers other than
those inseparable from gaining access to the internet itself. Printed version of the
journals is also available upon request of readers and authors.
IISTE Knowledge Sharing Partners
EBSCO, Index Copernicus, Ulrich's Periodicals Directory, JournalTOCS, PKP Open
Archives Harvester, Bielefeld Academic Search Engine, Elektronische
Zeitschriftenbibliothek EZB, Open J-Gate, OCLC WorldCat, Universe Digtial
Library , NewJour, Google Scholar