Embed Size (px)
Citation preview
551
Cap
ital
Bud
geti
ng
PA
RT
4
17FINANCIAL LEVERAGE AND CAPITAL STRUCTURE POLICY
551
In addition to being well-known tech companies, what
do Cisco and Oracle have in common? The answer
is that both companies issued debt for the first time
in 2006. In January 2006, Oracle sold $5.75 billion in
bonds. Cisco followed suit in February, selling bonds
worth $6.5 billion. Investors eagerly snapped up the
bonds, and, in fact, Cisco had offers totaling $20 billion
for its bonds before they were sold. Of course, these
weren’t the only two tech companies altering their bal-
ance sheets. Affiliated Computer Services, Inc., issued
$5 billion in debt to buy back part of its stock, a move
that reduced the company’s credit rating to junk status.
So why would Cisco and Oracle issue debt after
all these years? And, perhaps more important, why
would Affiliated Computer Services issue debt to
repurchase stock, a move that lowered the company’s
credit rating? To answer these questions, this chapter
covers the basic
ideas underly-
ing optimal debt
policies and how
firms establish
them.
Thus far, we have taken the firm’s capital structure as given. Debt– equity ratios don’t just drop on firms from the sky, of course, so now it’s time to wonder where they come from. Going back to Chapter 1, recall that we refer to decisions about a firm’s debt– equity ratio as capital structure decisions.1
For the most part, a firm can choose any capital structure it wants. If management so desired, a firm could issue some bonds and use the proceeds to buy back some stock, thereby increasing the debt– equity ratio. Alternatively, it could issue stock and use the money to pay off some debt, thereby reducing the debt– equity ratio. Activities such as these, which alter the firm’s existing capital structure, are called capital restructurings. In general, such restructurings take place whenever the firm substitutes one capital structure for another while leaving the firm’s assets unchanged. Because the assets of a firm are not directly affected by a capital restructuring, we can examine the firm’s capital structure decision separately from its other activities. This means that a firm can consider capital restructuring decisions in isolation from its invest-ment decisions. In this chapter, then, we will ignore investment decisions and focus on the long-term financing, or capital structure, question. What we will see in this chapter is that capital structure decisions can have important impli-cations for the value of the firm and its cost of capital. We will also find that important elements of the capital structure decision are easy to identify, but precise measures of these elements
1It is conventional to refer to decisions regarding debt and equity as capital structure decisions. However, the term fi nancial structure decisions would be more accurate, and we use the terms interchangeably.
Visit us at www.mhhe.com/rwj
DIGITAL STUDY TOOLS• Self-Study Software• Multiple-Choice Quizzes• Flashcards for Testing and Key
Terms
Cost
of
Cap
ital
and
Lon
g-Te
rm F
inan
cial
Pol
icy
PA
RT
6
ros3062x_Ch17.indd 551ros3062x_Ch17.indd 551 2/23/07 11:50:11 AM2/23/07 11:50:11 AM
552 P A R T 6 Cost of Capital and Long-Term Financial Policy
are generally not obtainable. As a result, we are only able to give an incomplete answer to the question of what the best capital structure might be for a particular firm at a particular time.
The Capital Structure QuestionHow should a firm go about choosing its debt– equity ratio? Here, as always, we assume that the guiding principle is to choose the course of action that maximizes the value of a share of stock. As we discuss next, however, when it comes to capital structure decisions, this is essentially the same thing as maximizing the value of the whole firm, and, for con-venience, we will tend to frame our discussion in terms of firm value.
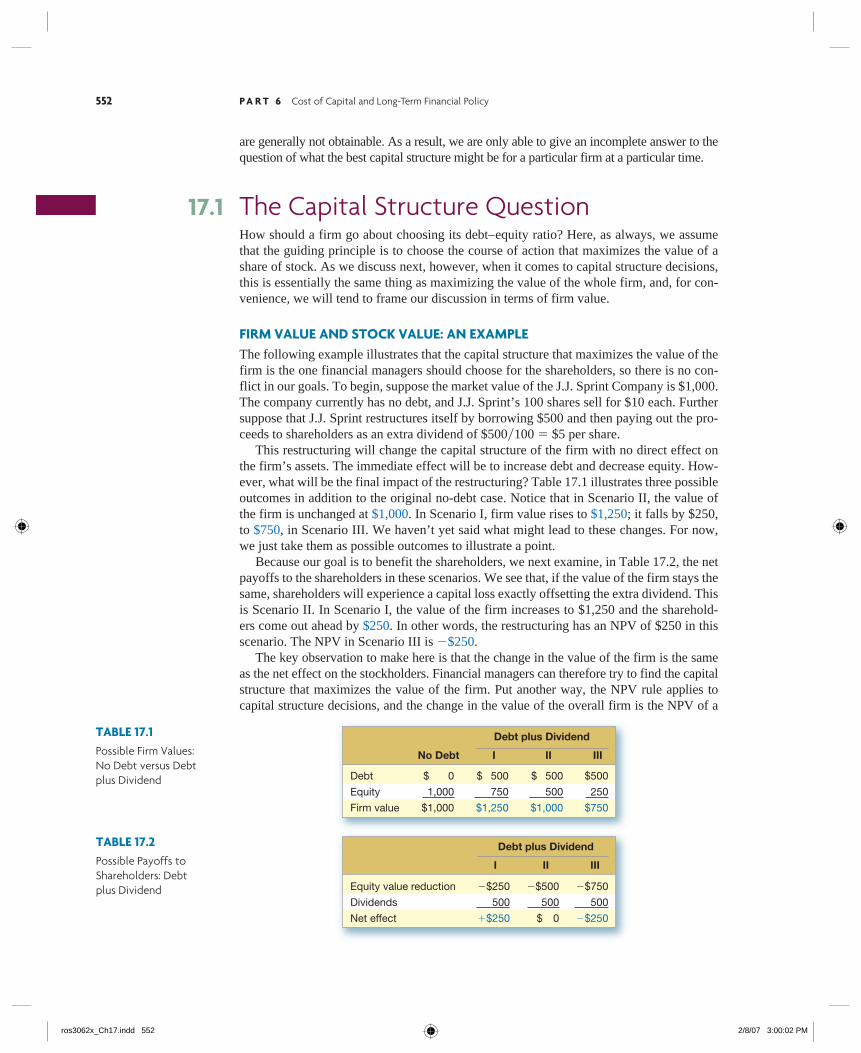
FIRM VALUE AND STOCK VALUE: AN EXAMPLEThe following example illustrates that the capital structure that maximizes the value of the firm is the one financial managers should choose for the shareholders, so there is no con-flict in our goals. To begin, suppose the market value of the J.J. Sprint Company is $1,000. The company currently has no debt, and J.J. Sprint’s 100 shares sell for $10 each. Further suppose that J.J. Sprint restructures itself by borrowing $500 and then paying out the pro-ceeds to shareholders as an extra dividend of $500�100 � $5 per share. This restructuring will change the capital structure of the firm with no direct effect on the firm’s assets. The immediate effect will be to increase debt and decrease equity. How-ever, what will be the final impact of the restructuring? Table 17.1 illustrates three possible outcomes in addition to the original no-debt case. Notice that in Scenario II, the value of the firm is unchanged at $1,000. In Scenario I, firm value rises to $1,250; it falls by $250, to $750, in Scenario III. We haven’t yet said what might lead to these changes. For now, we just take them as possible outcomes to illustrate a point. Because our goal is to benefit the shareholders, we next examine, in Table 17.2, the net payoffs to the shareholders in these scenarios. We see that, if the value of the firm stays the same, shareholders will experience a capital loss exactly offsetting the extra dividend. This is Scenario II. In Scenario I, the value of the firm increases to $1,250 and the sharehold-ers come out ahead by $250. In other words, the restructuring has an NPV of $250 in this scenario. The NPV in Scenario III is �$250. The key observation to make here is that the change in the value of the firm is the same as the net effect on the stockholders. Financial managers can therefore try to find the capital structure that maximizes the value of the firm. Put another way, the NPV rule applies to capital structure decisions, and the change in the value of the overall firm is the NPV of a
17.1
Debt plus Dividend
I II III
Equity value reduction �$250 �$500 �$750
Dividends 500 500 500
Net effect �$250 $ 0 �$250
TABLE 17.2Possible Payoffs to Shareholders: Debt plus Dividend
TABLE 17.1Possible Firm Values: No Debt versus Debt plus Dividend
Debt plus Dividend
No Debt I II III
Debt $ 0 $ 500 $ 500 $500
Equity 1,000 750 500 250
Firm value $1,000 $1,250 $1,000 $750
ros3062x_Ch17.indd 552ros3062x_Ch17.indd 552 2/8/07 3:00:02 PM2/8/07 3:00:02 PM
C H A P T E R 17 Financial Leverage and Capital Structure Policy 553
restructuring. Thus, J.J. Sprint should borrow $500 if it expects Scenario I. The crucial ques-tion in determining a firm’s capital structure is, of course, which scenario is likely to occur.
CAPITAL STRUCTURE AND THE COST OF CAPITALIn Chapter 15, we discussed the concept of the firm’s weighted average cost of capital, or WACC. You may recall that the WACC tells us that the firm’s overall cost of capital is a weighted average of the costs of the various components of the firm’s capital structure. When we described the WACC, we took the firm’s capital structure as given. Thus, one important issue that we will want to explore in this chapter is what happens to the cost of capital when we vary the amount of debt financing, or the debt– equity ratio. A primary reason for studying the WACC is that the value of the firm is maximized when the WACC is minimized. To see this, recall that the WACC is the appropriate discount rate for the firm’s overall cash flows. Because values and discount rates move in opposite direc-tions, minimizing the WACC will maximize the value of the firm’s cash flows. Thus, we will want to choose the firm’s capital structure so that the WACC is mini-mized. For this reason, we will say that one capital structure is better than another if it results in a lower weighted average cost of capital. Further, we say that a particular debt– equity ratio represents the optimal capital structure if it results in the lowest pos-sible WACC. This optimal capital structure is sometimes called the firm’s target capital structure as well.
17.1a Why should fi nancial managers choose the capital structure that maximizes the value of the fi rm?
17.1b What is the relationship between the WACC and the value of the fi rm?
17.1c What is an optimal capital structure?
Concept Questions
The Effect of Financial LeverageThe previous section described why the capital structure that produces the highest firm value (or the lowest cost of capital) is the one most beneficial to stockholders. In this sec-tion, we examine the impact of financial leverage on the payoffs to stockholders. As you may recall, financial leverage refers to the extent to which a firm relies on debt. The more debt financing a firm uses in its capital structure, the more financial leverage it employs. As we describe, financial leverage can dramatically alter the payoffs to shareholders in the firm. Remarkably, however, financial leverage may not affect the overall cost of capital. If this is true, then a firm’s capital structure is irrelevant because changes in capital structure won’t affect the value of the firm. We will return to this issue a little later.
THE BASICS OF FINANCIAL LEVERAGEWe start by illustrating how financial leverage works. For now, we ignore the impact of taxes. Also, for ease of presentation, we describe the impact of leverage in terms of its effects on earnings per share, EPS, and return on equity, ROE. These are, of course, accounting numbers and, as such, are not our primary concern. Using cash flows instead of these accounting numbers would lead to precisely the same conclusions, but a little more work would be needed. We discuss the impact on market values in a subsequent section.
17.2
ros3062x_Ch17.indd 553ros3062x_Ch17.indd 553 2/8/07 3:00:03 PM2/8/07 3:00:03 PM
554 P A R T 6 Cost of Capital and Long-Term Financial Policy
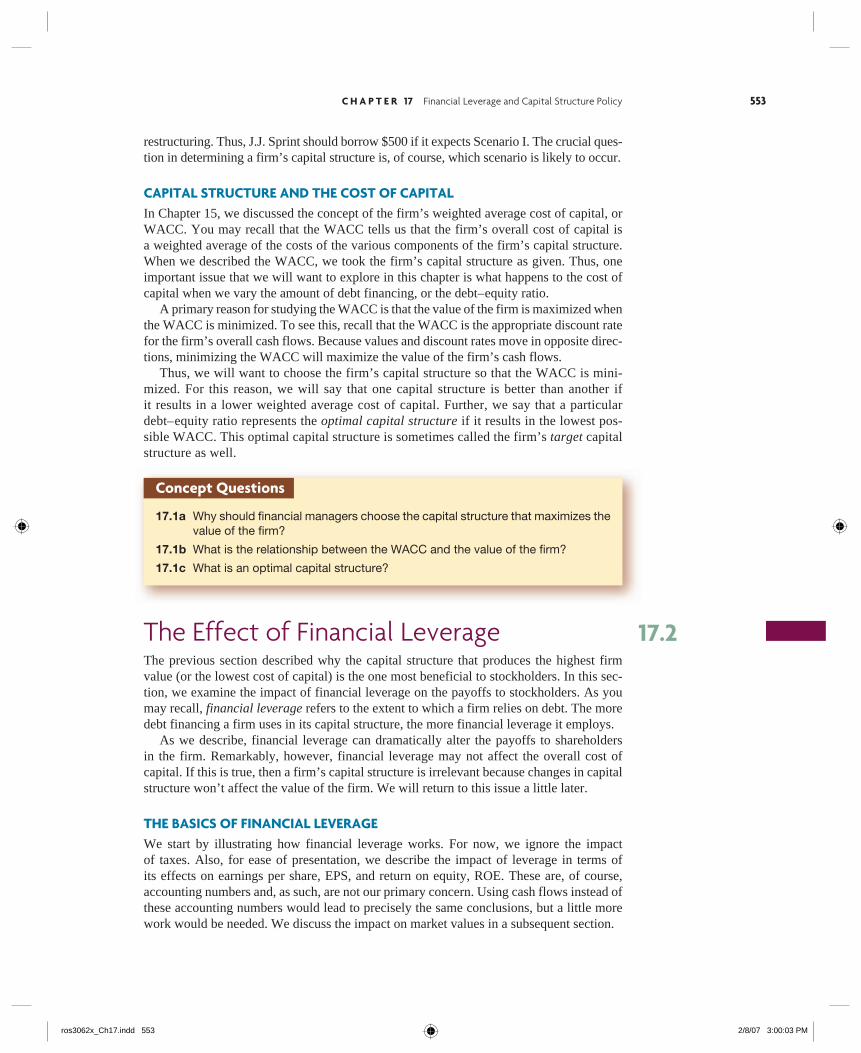
Financial Leverage, EPS, and ROE: An Example The Trans Am Corporation currently has no debt in its capital structure. The CFO, Ms. Morris, is considering a restructuring that would involve issuing debt and using the proceeds to buy back some of the outstanding equity. Table 17.3 presents both the current and proposed capital structures. As shown, the firm’s assets have a market value of $8 million, and there are 400,000 shares outstanding. Because Trans Am is an all-equity firm, the price per share is $20. The proposed debt issue would raise $4 million; the interest rate would be 10 percent. Because the stock sells for $20 per share, the $4 million in new debt would be used to pur-chase $4 million�20 � 200,000 shares, leaving 200,000. After the restructuring, Trans Am would have a capital structure that was 50 percent debt, so the debt– equity ratio would be 1. Notice that, for now, we assume that the stock price will remain at $20. To investigate the impact of the proposed restructuring, Ms. Morris has prepared Table 17.4, which compares the firm’s current capital structure to the proposed capital structure under three scenarios. The scenarios reflect different assumptions about the firm’s EBIT. Under the expected scenario, the EBIT is $1 million. In the recession scenario, EBIT falls to $500,000. In the expansion scenario, it rises to $1.5 million. To illustrate some of the calculations behind the figures in Table 17.4, consider the expansion case. EBIT is $1.5 million. With no debt (the current capital structure) and no taxes, net income is also $1.5 million. In this case, there are 400,000 shares worth $8 million total. EPS is therefore $1.5 million/400,000 � $3.75. Also, because account-ing return on equity, ROE, is net income divided by total equity, ROE is $1.5 million/8 million � 18.75%.2
TABLE 17.3Current and Proposed Capital Structures for the Trans Am Corporation
Current Proposed
Assets $8,000,000 $8,000,000
Debt $ 0 $4,000,000
Equity $8,000,000 $4,000,000
Debt– equity ratio 0 1
Share price $ 20 $ 20
Shares outstanding 400,000 200,000
Interest rate 10% 10%
2ROE is discussed in some detail in Chapter 3.
TABLE 17.4Capital Structure Scenarios for the Trans Am Corporation
Current Capital Structure: No Debt
Recession Expected Expansion
EBIT $500,000 $1,000,000 $1,500,000
Interest 0 0 0
Net income $500,000 $1,000,000 $1,500,000
ROE 6.25% 12.50% 18.75%
EPS $ 1.25 $ 2.50 $ 3.75
Proposed Capital Structure: Debt � $4 million
EBIT $500,000 $1,000,000 $1,500,000
Interest 400,000 400,000 400,000
Net income $100,000 $ 600,000 $1,100,000
ROE 2.50% 15.00% 27.50%
EPS $ .50 $ 3.00 $ 5.50
ros3062x_Ch17.indd 554ros3062x_Ch17.indd 554 2/8/07 3:00:04 PM2/8/07 3:00:04 PM
C H A P T E R 17 Financial Leverage and Capital Structure Policy 555
With $4 million in debt (the proposed capital structure), things are somewhat differ-ent. Because the interest rate is 10 percent, the interest bill is $400,000. With EBIT of $1.5 million, interest of $400,000, and no taxes, net income is $1.1 million. Now there are only 200,000 shares worth $4 million total. EPS is therefore $1.1 million/200,000 � $5.50, versus the $3.75 that we calculated in the previous scenario. Furthermore, ROE is $1.1 million/4 million � 27.5%. This is well above the 18.75 percent we calculated for the current capital structure.
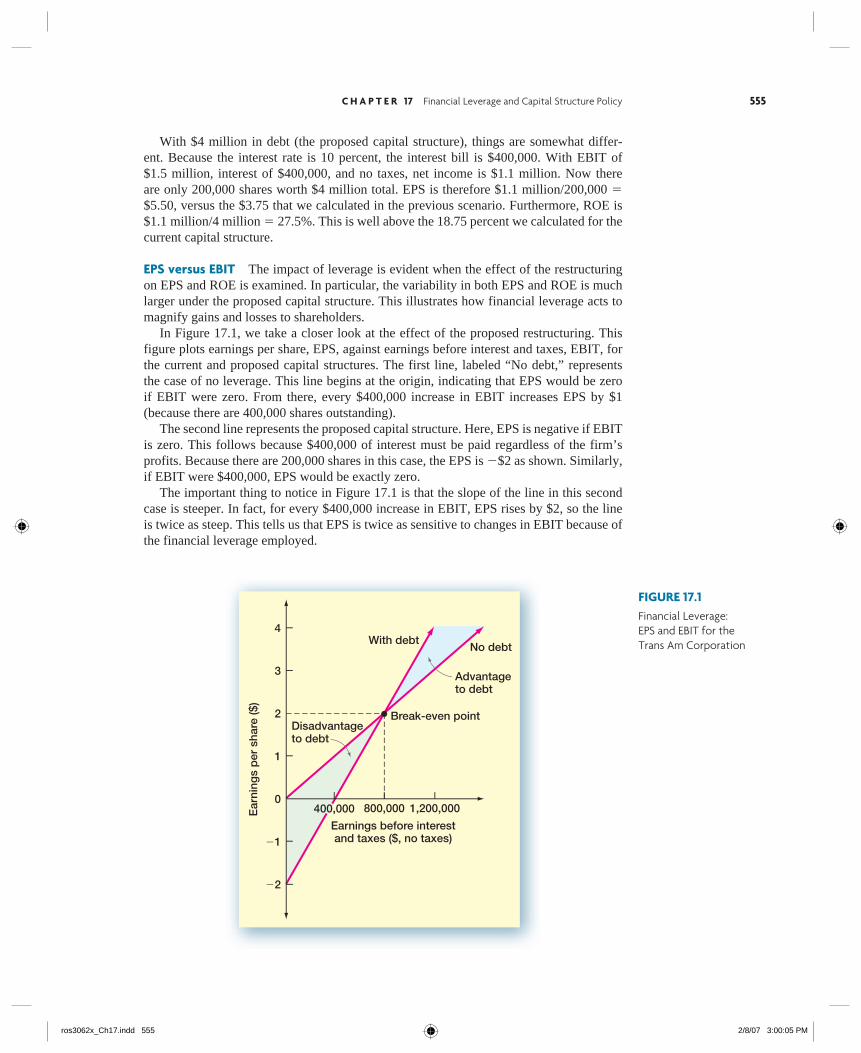
EPS versus EBIT The impact of leverage is evident when the effect of the restructuring on EPS and ROE is examined. In particular, the variability in both EPS and ROE is much larger under the proposed capital structure. This illustrates how financial leverage acts to magnify gains and losses to shareholders. In Figure 17.1, we take a closer look at the effect of the proposed restructuring. This figure plots earnings per share, EPS, against earnings before interest and taxes, EBIT, for the current and proposed capital structures. The first line, labeled “No debt,” represents the case of no leverage. This line begins at the origin, indicating that EPS would be zero if EBIT were zero. From there, every $400,000 increase in EBIT increases EPS by $1 (because there are 400,000 shares outstanding). The second line represents the proposed capital structure. Here, EPS is negative if EBIT is zero. This follows because $400,000 of interest must be paid regardless of the firm’s profits. Because there are 200,000 shares in this case, the EPS is �$2 as shown. Similarly, if EBIT were $400,000, EPS would be exactly zero. The important thing to notice in Figure 17.1 is that the slope of the line in this second case is steeper. In fact, for every $400,000 increase in EBIT, EPS rises by $2, so the line is twice as steep. This tells us that EPS is twice as sensitive to changes in EBIT because of the financial leverage employed.
FIGURE 17.1Financial Leverage: EPS and EBIT for the Trans Am Corporation
Ear
ning
s p
er s
hare
($)
4
3
2
1
0
�1
�2
Earnings before interestand taxes ($, no taxes)
With debtNo debt
Advantageto debt
Break-even pointDisadvantageto debt
800,000 1,200,000400,000
ros3062x_Ch17.indd 555ros3062x_Ch17.indd 555 2/8/07 3:00:05 PM2/8/07 3:00:05 PM
556 P A R T 6 Cost of Capital and Long-Term Financial Policy
Another observation to make in Figure 17.1 is that the lines intersect. At that point, EPS is exactly the same for both capital structures. To find this point, note that EPS is equal to EBIT�400,000 in the no-debt case. In the with-debt case, EPS is (EBIT � $400,000)�200,000. If we set these equal to each other, EBIT is:
EBIT�400,000 � (EBIT � $400,000)�200,000
EBIT � 2 � (EBIT � $400,000)
� $800,000
When EBIT is $800,000, EPS is $2 under either capital structure. This is labeled as the break-even point in Figure 17.1; we could also call it the indifference point. If EBIT is above this level, leverage is beneficial; if it is below this point, it is not. There is another, more intuitive, way of seeing why the break-even point is $800,000. Notice that, if the firm has no debt and its EBIT is $800,000, its net income is also $800,000. In this case, the ROE is 10 percent. This is precisely the same as the interest rate on the debt, so the firm earns a return that is just sufficient to pay the interest.
The MPD Corporation has decided in favor of a capital restructuring. Currently, MPD uses no debt financing. Following the restructuring, however, debt will be $1 million. The inter-est rate on the debt will be 9 percent. MPD currently has 200,000 shares outstanding, and the price per share is $20. If the restructuring is expected to increase EPS, what is the minimum level for EBIT that MPD’s management must be expecting? Ignore taxes in answering. To answer, we calculate the break-even EBIT. At any EBIT above this, the increased financial leverage will increase EPS, so this will tell us the minimum level for EBIT. Under the old capital structure, EPS is simply EBIT�200,000. Under the new capital structure, the interest expense will be $1 million � .09 � $90,000. Furthermore, with the $1 million proceeds, MPD will repurchase $1 million�20 � 50,000 shares of stock, leaving 150,000 outstanding. EPS will thus be (EBIT � $90,000)�150,000. Now that we know how to calculate EPS under both scenarios, we set them equal to each other and solve for the break-even EBIT:
EBIT�200,000 � (EBIT � $90,000)�150,000
EBIT � 4�3 � (EBIT � $90,000)
� $360,000
Verify that, in either case, EPS is $1.80 when EBIT is $360,000. Management at MPD is apparently of the opinion that EPS will exceed $1.80.
EXAMPLE 17.1 Break-Even EBIT
CORPORATE BORROWING AND HOMEMADE LEVERAGEBased on Tables 17.3 and 17.4 and Figure 17.1, Ms. Morris draws the following conclusions:
1. The effect of financial leverage depends on the company’s EBIT. When EBIT is rela-tively high, leverage is beneficial.
2. Under the expected scenario, leverage increases the returns to shareholders, as measured by both ROE and EPS.
ros3062x_Ch17.indd 556ros3062x_Ch17.indd 556 2/8/07 3:00:05 PM2/8/07 3:00:05 PM
C H A P T E R 17 Financial Leverage and Capital Structure Policy 557
3. Shareholders are exposed to more risk under the proposed capital structure because the EPS and ROE are much more sensitive to changes in EBIT in this case.
4. Because of the impact that financial leverage has on both the expected return to stockholders and the riskiness of the stock, capital structure is an important consideration.
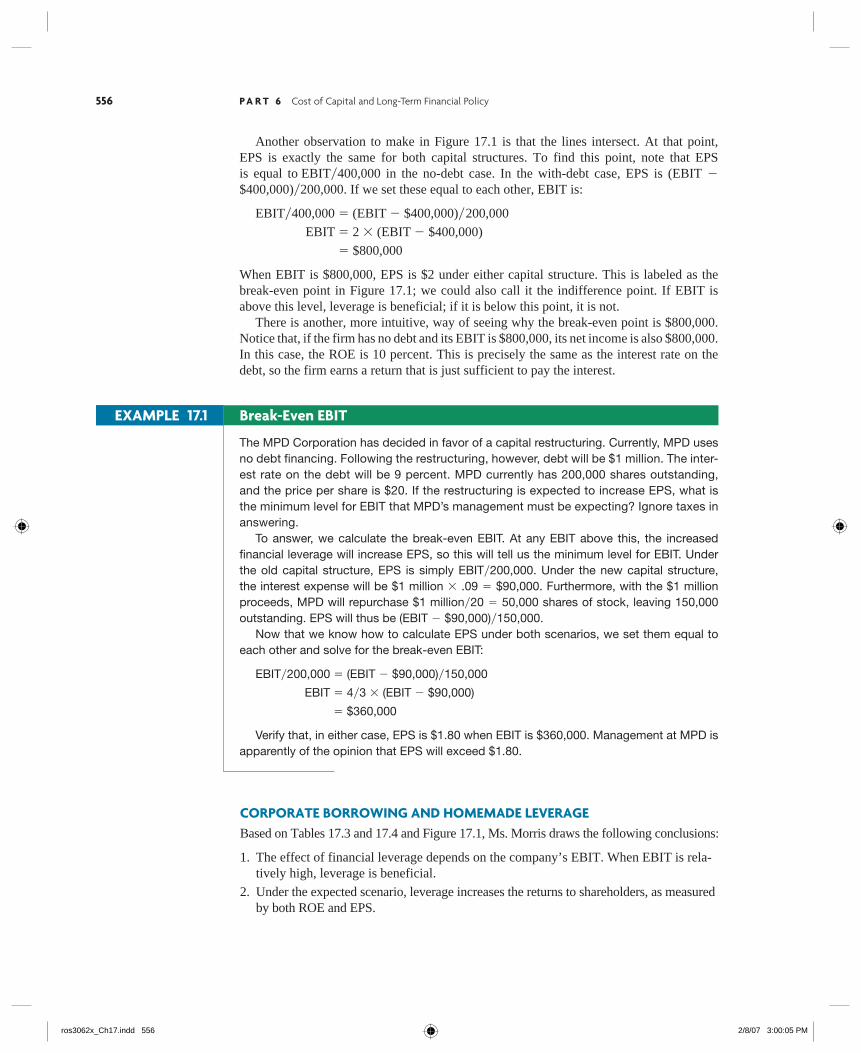
The first three of these conclusions are clearly correct. Does the last conclusion nec-essarily follow? Surprisingly, the answer is no. As we discuss next, the reason is that shareholders can adjust the amount of financial leverage by borrowing and lending on their own. This use of personal borrowing to alter the degree of financial leverage is called homemade leverage. We will now illustrate that it actually makes no difference whether or not Trans Am adopts the proposed capital structure, because any stockholder who prefers the proposed capital structure can simply create it using homemade leverage. To begin, the first part of Table 17.5 shows what will happen to an investor who buys $2,000 worth of Trans Am stock if the proposed capital structure is adopted. This investor purchases 100 shares of stock. From Table 17.4, we know that EPS will be $.50, $3, or $5.50, so the total earnings for 100 shares will be either $50, $300, or $550 under the proposed capital structure. Now, suppose that Trans Am does not adopt the proposed capital structure. In this case, EPS will be $1.25, $2.50, or $3.75. The second part of Table 17.5 demonstrates how a stockholder who prefers the payoffs under the proposed structure can create them using personal borrowing. To do this, the stockholder borrows $2,000 at 10 percent on her or his own. Our investor uses this amount, along with the original $2,000, to buy 200 shares of stock. As shown, the net payoffs are exactly the same as those for the proposed capital structure. How did we know to borrow $2,000 to create the right payoffs? We are trying to rep-licate Trans Am’s proposed capital structure at the personal level. The proposed capital structure results in a debt– equity ratio of 1. To replicate this structure at the personal level, the stockholder must borrow enough to create this same debt– equity ratio. Because the stockholder has $2,000 in equity invested, the borrowing of another $2,000 will create a personal debt– equity ratio of 1. This example demonstrates that investors can always increase financial leverage them-selves to create a different pattern of payoffs. It thus makes no difference whether Trans Am chooses the proposed capital structure.
Proposed Capital Structure
Recession Expected Expansion
EPS $ .50 $ 3.00 $ 5.50
Earnings for 100 shares 50.00 300.00 550.00
Net cost � 100 shares � $20 � $2,000
Original Capital Structure and Homemade Leverage
EPS $ 1.25 $ 2.50 $ 3.75
Earnings for 200 shares 250.00 500.00 750.00
Less: Interest on $2,000 at 10% 200.00 200.00 200.00
Net earnings $ 50.00 $300.00 $550.00
Net cost � 200 shares � $20 � Amount borrowed � $4,000 � 2,000 � $2,000
homemade leverageThe use of personal borrowing to change the overall amount of fi nancial leverage to which the individual is exposed.
TABLE 17.5Proposed Capital Structure versus Original Capital Structure with Homemade Leverage
ros3062x_Ch17.indd 557ros3062x_Ch17.indd 557 2/8/07 3:00:06 PM2/8/07 3:00:06 PM
558 P A R T 6 Cost of Capital and Long-Term Financial Policy
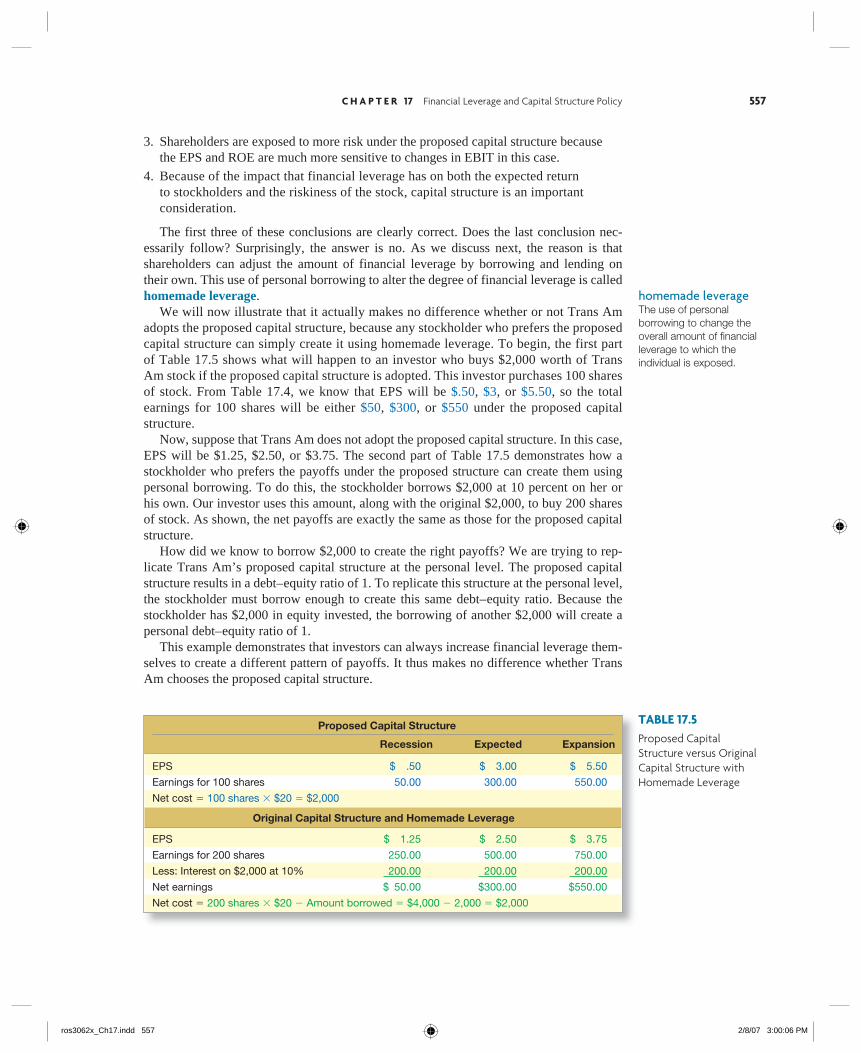
In our Trans Am example, suppose management adopts the proposed capital structure. Further suppose that an investor who owned 100 shares preferred the original capital struc-ture. Show how this investor could “unlever” the stock to recreate the original payoffs. To create leverage, investors borrow on their own. To undo leverage, investors must lend money. In the case of Trans Am, the corporation borrowed an amount equal to half its value. The investor can unlever the stock by simply lending money in the same propor-tion. In this case, the investor sells 50 shares for $1,000 total and then lends the $1,000 at 10 percent. The payoffs are calculated in the following table:
Recession Expected Expansion
EPS (proposed structure) $ .50 $ 3.00 $ 5.50Earnings for 50 shares 25.00 150.00 275.00Plus: Interest on $1,000 100.00 100.00 100.00Total payoff $125.00 $250.00 $375.00
These are precisely the payoffs the investor would have experienced under the original capital structure.
EXAMPLE 17.2 Unlevering the Stock
17.2a What is the impact of fi nancial leverage on stockholders?
17.2b What is homemade leverage?
17.2c Why is Trans Am’s capital structure irrelevant?
Concept Questions
Capital Structure and the Cost of Equity CapitalWe have seen that there is nothing special about corporate borrowing because investors can borrow or lend on their own. As a result, whichever capital structure Trans Am chooses, the stock price will be the same. Trans Am’s capital structure is thus irrelevant, at least in the simple world we have examined. Our Trans Am example is based on a famous argument advanced by two Nobel laure-ates, Franco Modigliani and Merton Miller, whom we will henceforth call M&M. What we illustrated for the Trans Am Corporation is a special case of M&M Proposition I. M&M Proposition I states that it is completely irrelevant how a firm chooses to arrange its finances.
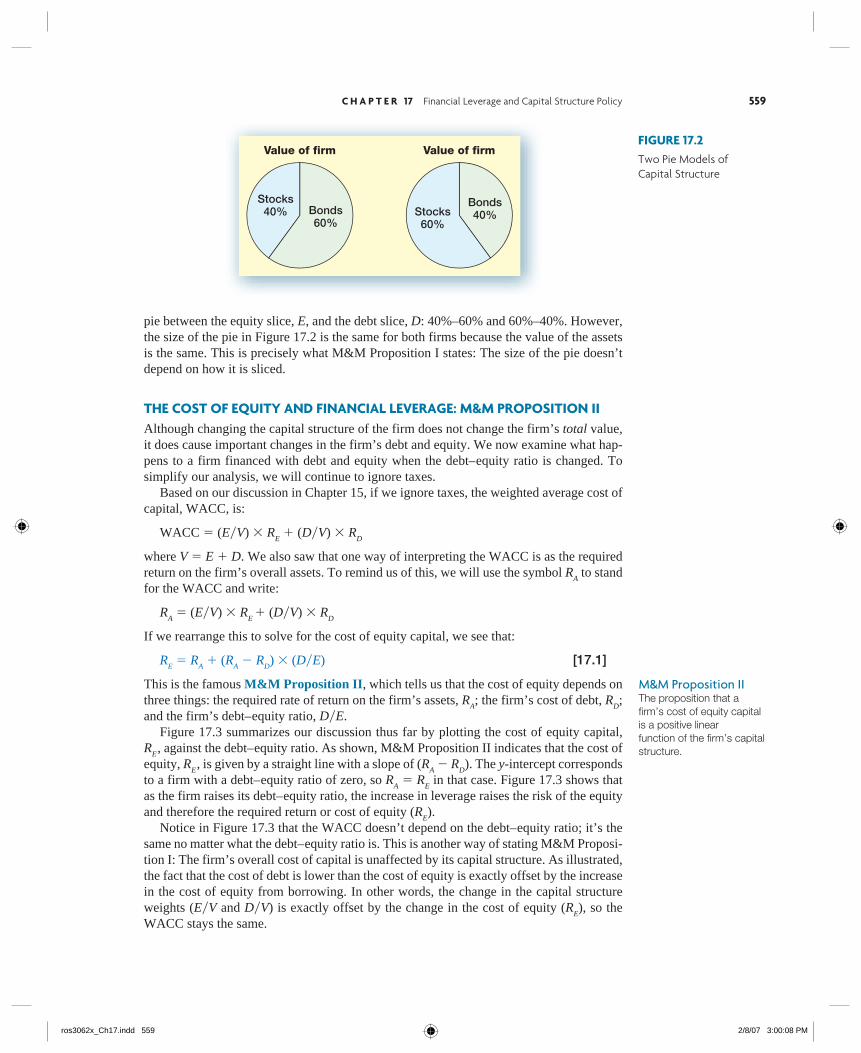
M&M PROPOSITION I: THE PIE MODELOne way to illustrate M&M Proposition I is to imagine two firms that are identical on the left side of the balance sheet. Their assets and operations are exactly the same. The right sides are different because the two firms finance their operations differently. In this case, we can view the capital structure question in terms of a “pie” model. Why we choose this name is apparent from Figure 17.2. Figure 17.2 gives two possible ways of cutting up the
17.3
M&M Proposition IThe proposition that the value of the fi rm is independent of the fi rm’s capital structure.
ros3062x_Ch17.indd 558ros3062x_Ch17.indd 558 2/8/07 3:00:07 PM2/8/07 3:00:07 PM
C H A P T E R 17 Financial Leverage and Capital Structure Policy 559
pie between the equity slice, E, and the debt slice, D: 40%–60% and 60%–40%. However, the size of the pie in Figure 17.2 is the same for both firms because the value of the assets is the same. This is precisely what M&M Proposition I states: The size of the pie doesn’t depend on how it is sliced.
THE COST OF EQUITY AND FINANCIAL LEVERAGE: M&M PROPOSITION IIAlthough changing the capital structure of the firm does not change the firm’s total value, it does cause important changes in the firm’s debt and equity. We now examine what hap-pens to a firm financed with debt and equity when the debt– equity ratio is changed. To simplify our analysis, we will continue to ignore taxes. Based on our discussion in Chapter 15, if we ignore taxes, the weighted average cost of capital, WACC, is:
WACC � (E�V) � RE � (D�V) � R
D
where V � E � D. We also saw that one way of interpreting the WACC is as the required return on the firm’s overall assets. To remind us of this, we will use the symbol R
A to stand
for the WACC and write:
RA � (E�V) � R
E � (D�V) � R
D
If we rearrange this to solve for the cost of equity capital, we see that:
RE � R
A � (R
A � R
D) � (D�E) [17.1]
This is the famous M&M Proposition II, which tells us that the cost of equity depends on three things: the required rate of return on the firm’s assets, R
A; the firm’s cost of debt, R
D;
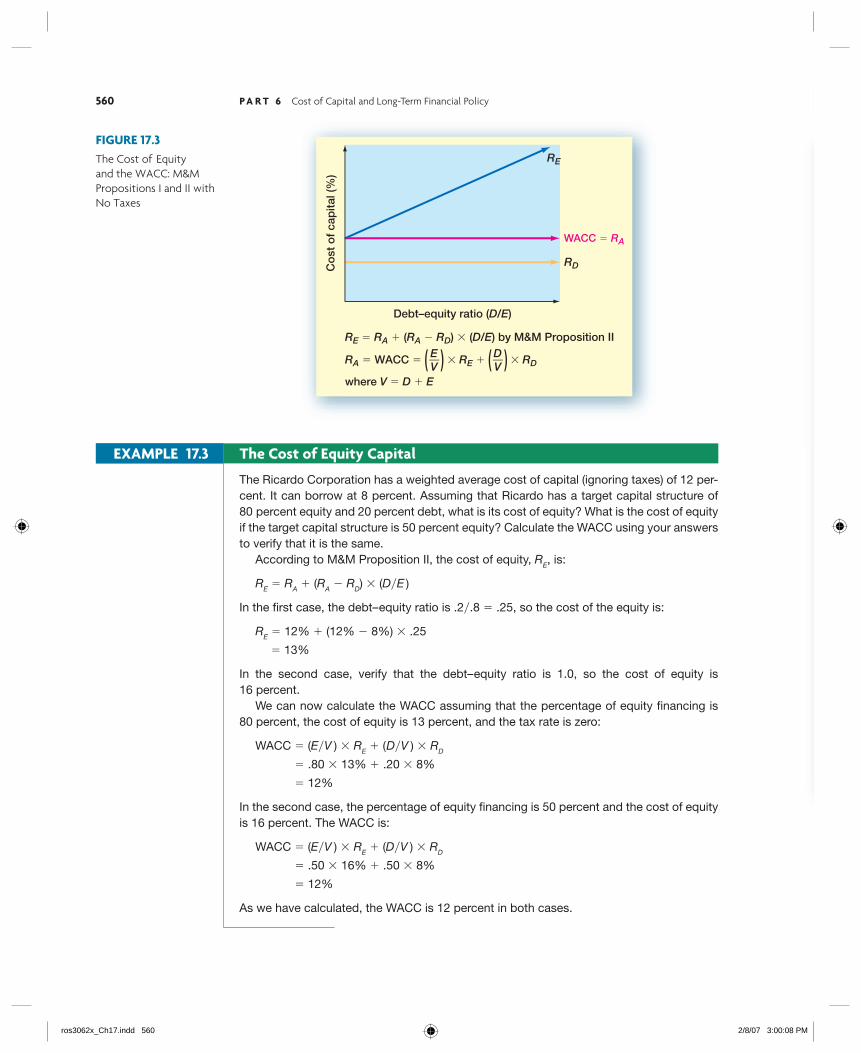
and the firm’s debt– equity ratio, D�E. Figure 17.3 summarizes our discussion thus far by plotting the cost of equity capital, R
E, against the debt– equity ratio. As shown, M&M Proposition II indicates that the cost of
equity, RE, is given by a straight line with a slope of (R
A � R
D). The y-intercept corresponds
to a firm with a debt– equity ratio of zero, so RA � R
E in that case. Figure 17.3 shows that
as the firm raises its debt– equity ratio, the increase in leverage raises the risk of the equity and therefore the required return or cost of equity (R
E).
Notice in Figure 17.3 that the WACC doesn’t depend on the debt– equity ratio; it’s the same no matter what the debt– equity ratio is. This is another way of stating M&M Proposi-tion I: The firm’s overall cost of capital is unaffected by its capital structure. As illustrated, the fact that the cost of debt is lower than the cost of equity is exactly offset by the increase in the cost of equity from borrowing. In other words, the change in the capital structure weights (E�V and D�V) is exactly offset by the change in the cost of equity (R
E), so the
WACC stays the same.
FIGURE 17.2Two Pie Models of Capital Structure
M&M Proposition IIThe proposition that a fi rm’s cost of equity capital is a positive linear function of the fi rm’s capital structure.
Value of firm Value of firm
Stocks40% Bonds
60%Stocks60%
Bonds40%
ros3062x_Ch17.indd 559ros3062x_Ch17.indd 559 2/8/07 3:00:08 PM2/8/07 3:00:08 PM
560 P A R T 6 Cost of Capital and Long-Term Financial Policy
FIGURE 17.3The Cost of Equity and the WACC: M&M Propositions I and II with No Taxes
The Ricardo Corporation has a weighted average cost of capital (ignoring taxes) of 12 per-cent. It can borrow at 8 percent. Assuming that Ricardo has a target capital structure of 80 percent equity and 20 percent debt, what is its cost of equity? What is the cost of equity if the target capital structure is 50 percent equity? Calculate the WACC using your answers to verify that it is the same. According to M&M Proposition II, the cost of equity, RE, is:
RE � RA � (RA � RD) � (D�E )
In the first case, the debt– equity ratio is .2�.8 � .25, so the cost of the equity is:
RE � 12% � (12% � 8%) � .25
� 13%
In the second case, verify that the debt– equity ratio is 1.0, so the cost of equity is 16 percent. We can now calculate the WACC assuming that the percentage of equity financing is 80 percent, the cost of equity is 13 percent, and the tax rate is zero:
WACC � (E�V ) � RE � (D�V ) � RD
� .80 � 13% � .20 � 8%
� 12%
In the second case, the percentage of equity financing is 50 percent and the cost of equity is 16 percent. The WACC is:
WACC � (E�V ) � RE � (D�V ) � RD
� .50 � 16% � .50 � 8%
� 12%
As we have calculated, the WACC is 12 percent in both cases.
EXAMPLE 17.3 The Cost of Equity Capital
Co
st o
f ca
pita
l (%
)
WACC � RA
Debt–equity ratio (D/E)
RE
RD
RE � RA � (RA � RD) � (D/E) by M&M Proposition II
RA � WACC � � RE � � RD
where V � D � E
EV( ( D
V( (
ros3062x_Ch17.indd 560ros3062x_Ch17.indd 560 2/8/07 3:00:08 PM2/8/07 3:00:08 PM
C H A P T E R 17 Financial Leverage and Capital Structure Policy 561
BUSINESS AND FINANCIAL RISKM&M Proposition II shows that the firm’s cost of equity can be broken down into two components. The first component, R
A, is the required return on the firm’s assets overall,
and it depends on the nature of the firm’s operating activities. The risk inherent in a firm’s operations is called the business risk of the firm’s equity. Referring back to Chapter 13, note that this business risk depends on the systematic risk of the firm’s assets. The greater a
IN THEIR OWN WORDS . . .
Merton H. Miller on Capital Structure: M&M 30 Years Later
How difficult it is to summarize briefly the contribution of these papers was brought home to me very clearly after Franco Modigliani was awarded the Nobel Prize in Economics, in part—but, of course, only in part—for the work in finance. The television camera crews from our local stations in Chicago immediately descended upon me. “We understand,” they said, “that you worked with Modigliani some years back in developing these M&M theorems, and we wonder if you could explain them briefly to our television viewers.” “How briefly?” I asked. “Oh, take 10 seconds,” was the reply. Ten seconds to explain the work of a lifetime! Ten seconds to describe two carefully reasoned articles, each running to more than 30 printed pages and each with 60 or so long footnotes! When they saw the look of dismay on my face, they said, “You don’t have to go into details. Just give us the main points in simple, commonsense terms.” The main point of the cost-of- capital article was, in principle at least, simple enough to make. It said that in an economist’s ideal world, the total market value of all the securities issued by a firm would be governed by the earning power and risk of its underlying real assets and would be independent of how the mix of securities issued to finance it was divided between debt instruments and equity capital. Some corporate treasurers might well think that they could enhance total value by increasing the proportion of debt instruments because yields on debt instruments, given their lower risk, are, by and large, substantially below those on equity capital. But, under the ideal conditions assumed, the added risk to the shareholders from issuing more debt will raise required yields on the equity by just enough to offset the seeming gain from use of low-cost debt. Such a summary would not only have been too long, but it relied on shorthand terms and concepts that are rich in connotations to economists, but hardly so to the general public. I thought, instead, of an analogy that we ourselves had invoked in the original paper. “Think of the firm,” I said, “as a gigantic tub of whole milk. The farmer can sell the whole milk as is. Or he can separate out the cream and sell it at a consider-ably higher price than the whole milk would bring. (Selling cream is the analog of a firm selling low-yield and hence high-priced debt securities.) But, of course, what the farmer would have left would be skim milk, with low butterfat content, and that would sell for much less than whole milk. Skim milk corresponds to the levered equity. The M&M proposition says that if there were no costs of separation (and, of course, no government dairy support programs), the cream plus the skim milk would bring the same price as the whole milk.” The television people conferred among themselves for a while. They informed me that it was still too long, too complicated, and too academic. “Have you anything simpler?” they asked. I thought of another way in which the M&M proposition is presented that stresses the role of securities as devices for “partition-ing” a firm’s payoffs among the group of its capital suppliers. “Think of the firm,” I said, “as a gigantic pizza, divided into quarters. If, now, you cut each quarter in half into eighths, the M&M proposition says that you will have more pieces, but not more pizza.” Once again whispered conversation. This time, they shut the lights off. They folded up their equipment. They thanked me for my cooperation. They said they would get back to me. But I knew that I had somehow lost my chance to start a new career as a packager of economic wisdom for TV viewers in convenient 10-second sound bites. Some have the talent for it; and some just don’t.
The late Merton H. Miller was famous for his pathbreaking work with Franco Modigliani on corporate capital structure, cost of capital, and dividend policy. He received the Nobel Prize in Economics for his contributions shortly after this essay was prepared.
business riskThe equity risk that comes from the nature of the fi rm’s operating activities.
561
ros3062x_Ch17.indd 561ros3062x_Ch17.indd 561 2/8/07 3:00:11 PM2/8/07 3:00:11 PM
562 P A R T 6 Cost of Capital and Long-Term Financial Policy
firm’s business risk, the greater RA will be, and, all other things being the same, the greater
will be the firm’s cost of equity. The second component in the cost of equity, (R
A � R
D) � (D�E), is determined by the
firm’s financial structure. For an all-equity firm, this component is zero. As the firm begins to rely on debt financing, the required return on equity rises. This occurs because the debt financing increases the risks borne by the stockholders. This extra risk that arises from the use of debt financing is called the financial risk of the firm’s equity. The total systematic risk of the firm’s equity thus has two parts: business risk and finan-cial risk. The first part (the business risk) depends on the firm’s assets and operations and is not affected by capital structure. Given the firm’s business risk (and its cost of debt), the second part (the financial risk) is completely determined by financial policy. As we have illustrated, the firm’s cost of equity rises when the firm increases its use of financial leverage because the financial risk of the equity increases while the business risk remains the same.
17.3a What does M&M Proposition I state?
17.3b What are the three determinants of a fi rm’s cost of equity?
17.3c The total systematic risk of a fi rm’s equity has two parts. What are they?
Concept Questions
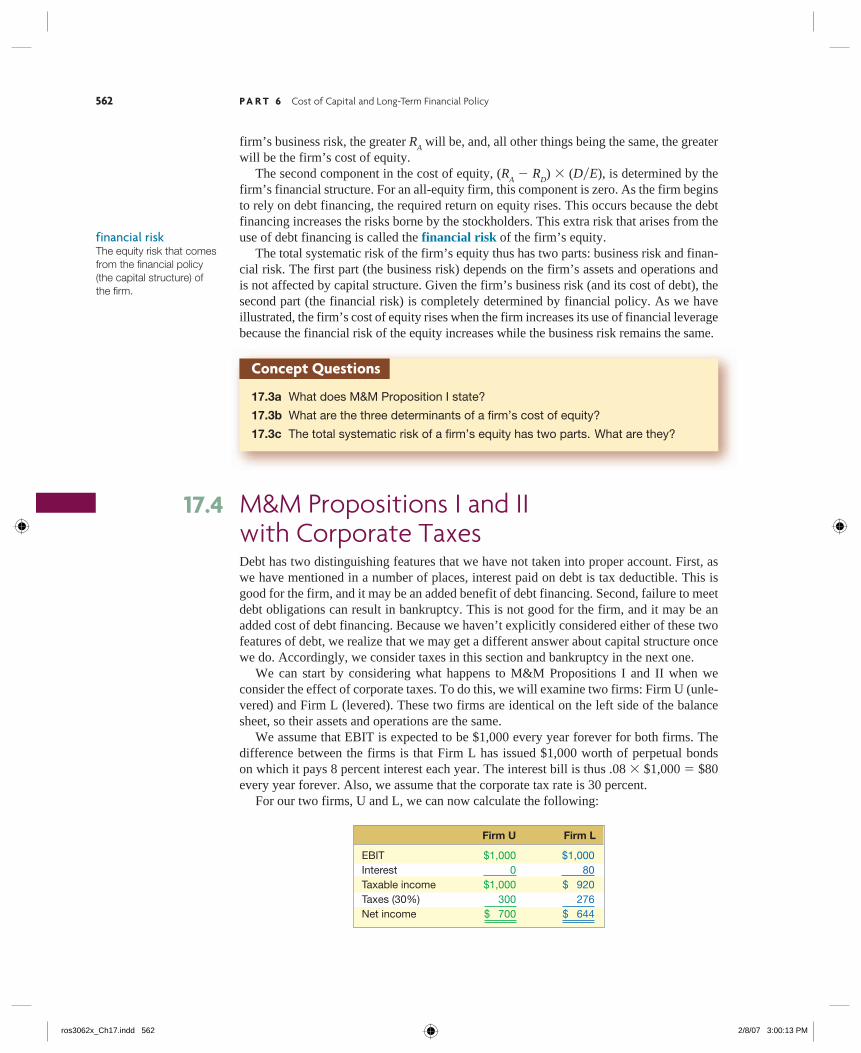
M&M Propositions I and II with Corporate TaxesDebt has two distinguishing features that we have not taken into proper account. First, as we have mentioned in a number of places, interest paid on debt is tax deductible. This is good for the firm, and it may be an added benefit of debt financing. Second, failure to meet debt obligations can result in bankruptcy. This is not good for the firm, and it may be an added cost of debt financing. Because we haven’t explicitly considered either of these two features of debt, we realize that we may get a different answer about capital structure once we do. Accordingly, we consider taxes in this section and bankruptcy in the next one. We can start by considering what happens to M&M Propositions I and II when we consider the effect of corporate taxes. To do this, we will examine two firms: Firm U (unle-vered) and Firm L (levered). These two firms are identical on the left side of the balance sheet, so their assets and operations are the same. We assume that EBIT is expected to be $1,000 every year forever for both firms. The difference between the firms is that Firm L has issued $1,000 worth of perpetual bonds on which it pays 8 percent interest each year. The interest bill is thus .08 � $1,000 � $80 every year forever. Also, we assume that the corporate tax rate is 30 percent. For our two firms, U and L, we can now calculate the following:
Firm U Firm L
EBIT $1,000 $1,000Interest 0 80Taxable income $1,000 $ 920Taxes (30%) 300 276Net income $ 700 $ 644
financial riskThe equity risk that comes from the fi nancial policy (the capital structure) of the fi rm.
17.4
ros3062x_Ch17.indd 562ros3062x_Ch17.indd 562 2/8/07 3:00:13 PM2/8/07 3:00:13 PM
C H A P T E R 17 Financial Leverage and Capital Structure Policy 563
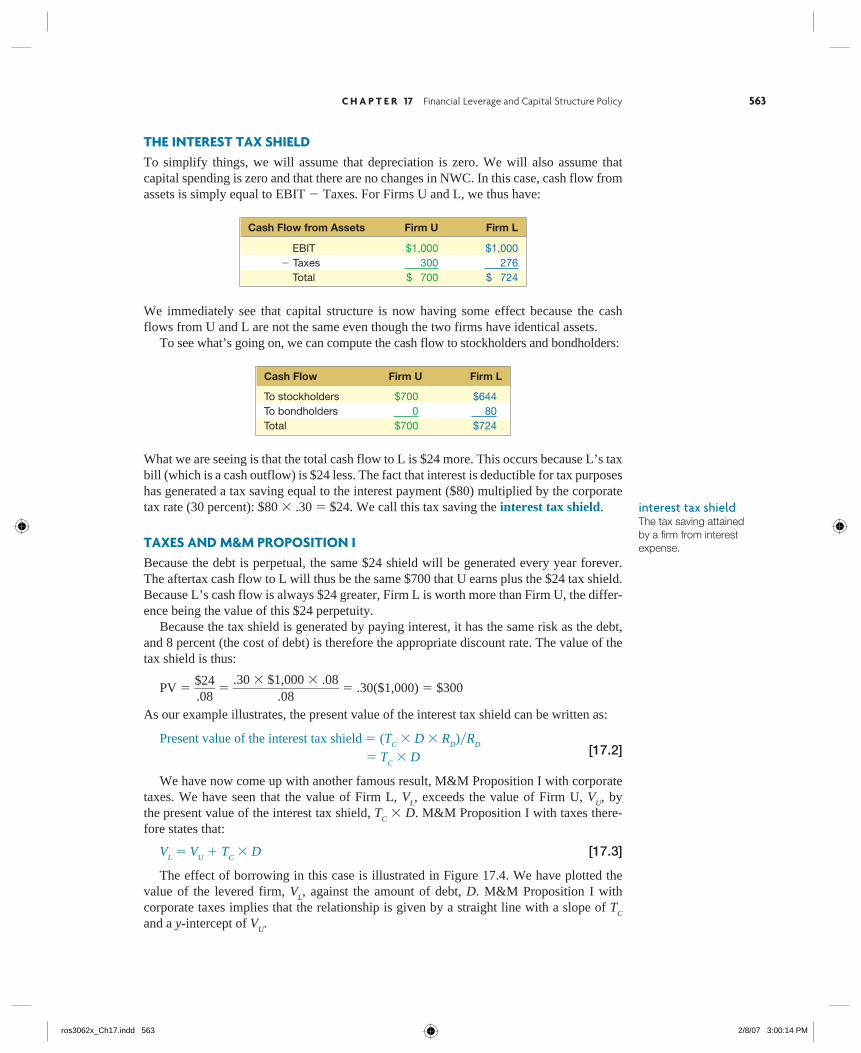
THE INTEREST TAX SHIELDTo simplify things, we will assume that depreciation is zero. We will also assume that capital spending is zero and that there are no changes in NWC. In this case, cash flow from assets is simply equal to EBIT � Taxes. For Firms U and L, we thus have:
Cash Flow from Assets Firm U Firm L
EBIT $1,000 $1,000 � Taxes 300 276 Total $ 700 $ 724
We immediately see that capital structure is now having some effect because the cash flows from U and L are not the same even though the two firms have identical assets. To see what’s going on, we can compute the cash flow to stockholders and bondholders:
Cash Flow Firm U Firm L
To stockholders $700 $644To bondholders 0 80Total $700 $724
What we are seeing is that the total cash flow to L is $24 more. This occurs because L’s tax bill (which is a cash outflow) is $24 less. The fact that interest is deductible for tax purposes has generated a tax saving equal to the interest payment ($80) multiplied by the corporate tax rate (30 percent): $80 � .30 � $24. We call this tax saving the interest tax shield.
TAXES AND M&M PROPOSITION IBecause the debt is perpetual, the same $24 shield will be generated every year forever. The aftertax cash flow to L will thus be the same $700 that U earns plus the $24 tax shield. Because L’s cash flow is always $24 greater, Firm L is worth more than Firm U, the differ-ence being the value of this $24 perpetuity. Because the tax shield is generated by paying interest, it has the same risk as the debt, and 8 percent (the cost of debt) is therefore the appropriate discount rate. The value of the tax shield is thus:
PV � $24
____ .08
� .30 � $1,000 � .08
________________ .08
� .30($1,000) � $300
As our example illustrates, the present value of the interest tax shield can be written as:
Present value of the interest tax shield � (TC � D � R
D)�R
D
[17.2] � T
C � D
We have now come up with another famous result, M&M Proposition I with corporate taxes. We have seen that the value of Firm L, V
L, exceeds the value of Firm U, V
U, by
the present value of the interest tax shield, TC � D. M&M Proposition I with taxes there-
fore states that:
VL � V
U � T
C � D [17.3]
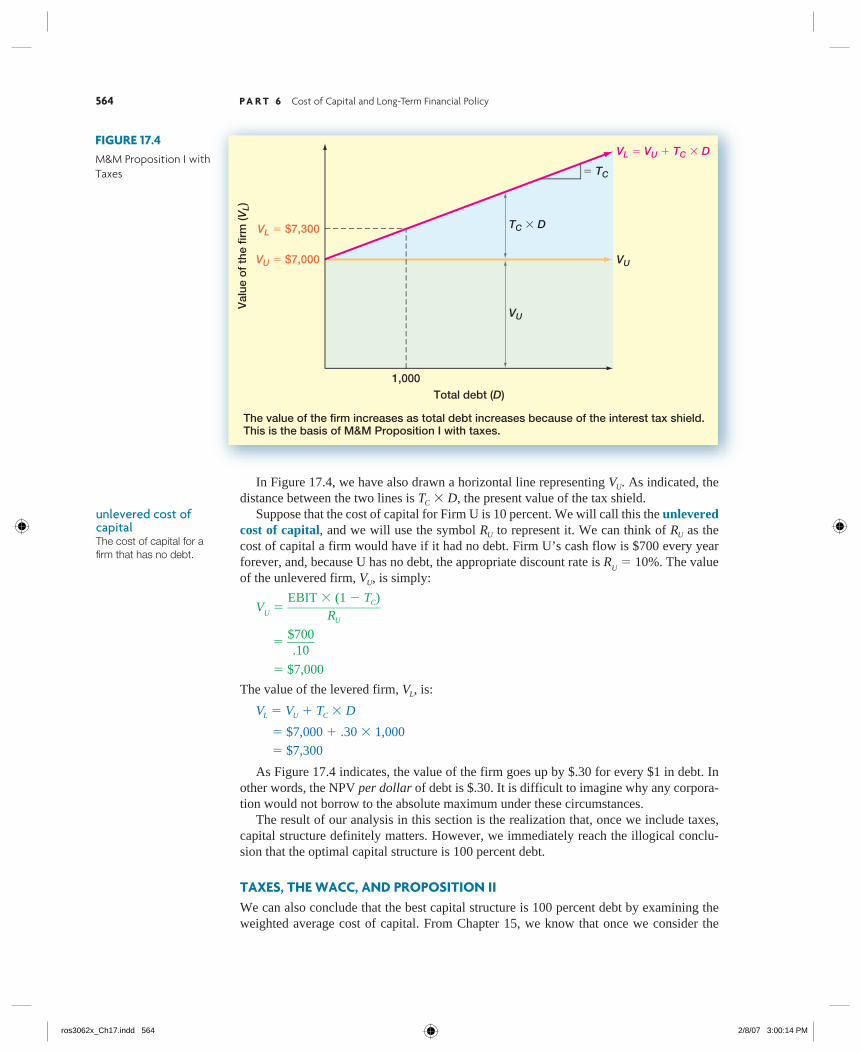
The effect of borrowing in this case is illustrated in Figure 17.4. We have plotted the value of the levered firm, V
L, against the amount of debt, D. M&M Proposition I with
corporate taxes implies that the relationship is given by a straight line with a slope of TC
and a y-intercept of VU.
interest tax shieldThe tax saving attained by a fi rm from interest expense.
ros3062x_Ch17.indd 563ros3062x_Ch17.indd 563 2/8/07 3:00:14 PM2/8/07 3:00:14 PM
564 P A R T 6 Cost of Capital and Long-Term Financial Policy
unlevered cost of capitalThe cost of capital for a fi rm that has no debt.
Val
ue o
f th
e fir
m (V
L)
Total debt (D)
VL � VU � TC � D
VU
VU
� TC
TC � D
1,000
VU � $7,000
VL � $7,300
The value of the firm increases as total debt increases because of the interest tax shield.This is the basis of M&M Proposition I with taxes.
In Figure 17.4, we have also drawn a horizontal line representing V U . As indicated, the distance between the two lines is T C � D, the present value of the tax shield. Suppose that the cost of capital for Firm U is 10 percent. We will call this the unlevered cost of capital, and we will use the symbol R U to represent it. We can think of R U as the cost of capital a firm would have if it had no debt. Firm U’s cash flow is $700 every year forever, and, because U has no debt, the appropriate discount rate is R
U � 10%. The value
of the unlevered firm, V U , is simply:
VU �
EBIT � (1 � T C ) _______________
R U
� $700
_____ .10
� $7,000
The value of the levered firm, V L , is:
V L � V U � T C � D
� $7,000 � .30 � 1,000
� $7,300
As Figure 17.4 indicates, the value of the firm goes up by $.30 for every $1 in debt. In other words, the NPV per dollar of debt is $.30. It is difficult to imagine why any corpora-tion would not borrow to the absolute maximum under these circumstances. The result of our analysis in this section is the realization that, once we include taxes, capital structure definitely matters. However, we immediately reach the illogical conclu-sion that the optimal capital structure is 100 percent debt.
TAXES, THE WACC, AND PROPOSITION IIWe can also conclude that the best capital structure is 100 percent debt by examining the weighted average cost of capital. From Chapter 15, we know that once we consider the
FIGURE 17.4M&M Proposition I with Taxes
ros3062x_Ch17.indd 564ros3062x_Ch17.indd 564 2/8/07 3:00:14 PM2/8/07 3:00:14 PM
C H A P T E R 17 Financial Leverage and Capital Structure Policy 565
Co
st o
f ca
pita
l (%
)
RE � 10.22%
Debt–equity ratio (D/E)
RU � 10%
WACC � 9.6%
$1,000/6,300 � D/E
M&M Proposition I with taxes implies that a firm’s WACC decreasesas the firm relies more heavily on debt financing:
M&M Proposition II with taxes implies that a firm’s cost of equity,RE, rises as the firm relies more heavily on debt financing:RE � RU � (RU � RD) � (D/E) � (1 � TC)
WACCRD � (1 � TC)RD � (1 � TC)
� 8% � (1 � .30)� 5.6%
RE
RU
WACC � � RE � � RD � (1 � TC)EV( ( D
V( (
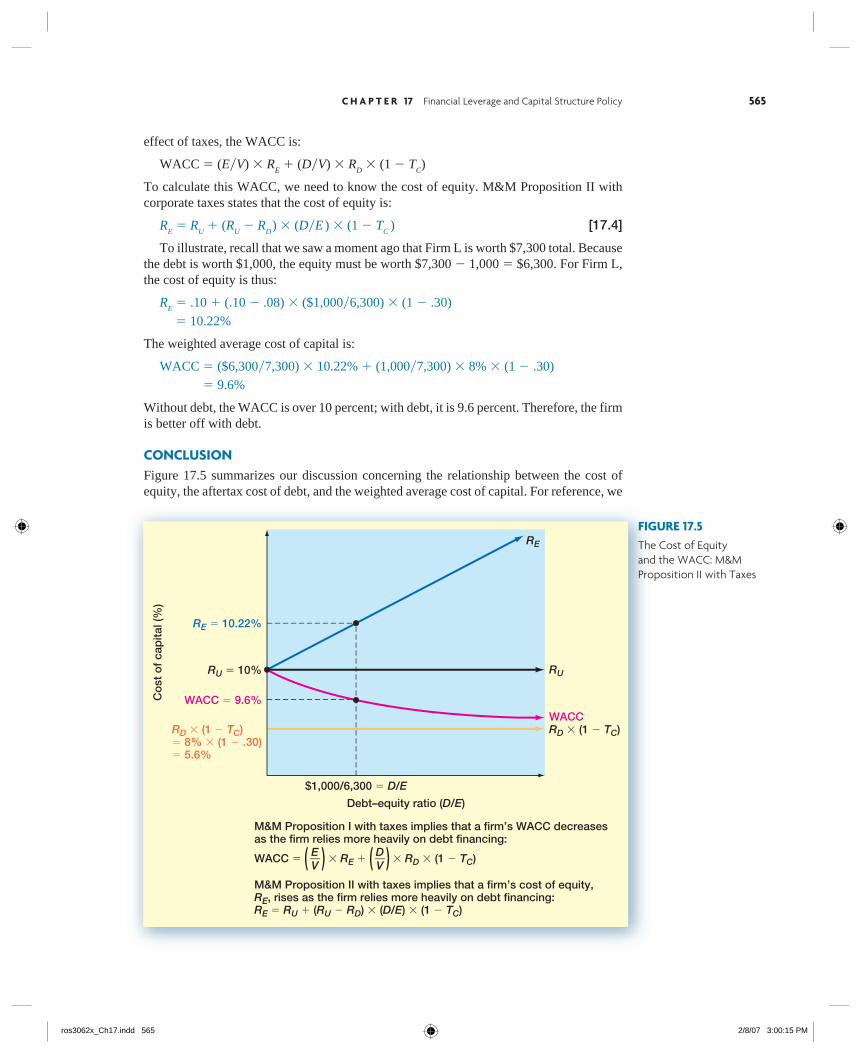
effect of taxes, the WACC is:
WACC � (E�V) � RE � (D�V) � R
D � (1 � T
C)
To calculate this WACC, we need to know the cost of equity. M&M Proposition II with corporate taxes states that the cost of equity is:
RE � R
U � (R
U � R
D ) � (D�E ) � (1 � T
C ) [17.4]
To illustrate, recall that we saw a moment ago that Firm L is worth $7,300 total. Because the debt is worth $1,000, the equity must be worth $7,300 � 1,000 � $6,300. For Firm L, the cost of equity is thus:
RE � .10 � (.10 � .08) � ($1,000�6,300) � (1 � .30)
� 10.22%
The weighted average cost of capital is:
WACC � ($6,300�7,300) � 10.22% � (1,000�7,300) � 8% � (1 � .30)
� 9.6%
Without debt, the WACC is over 10 percent; with debt, it is 9.6 percent. Therefore, the firm is better off with debt.
CONCLUSIONFigure 17.5 summarizes our discussion concerning the relationship between the cost of equity, the aftertax cost of debt, and the weighted average cost of capital. For reference, we
FIGURE 17.5The Cost of Equity and the WACC: M&M Proposition II with Taxes
ros3062x_Ch17.indd 565ros3062x_Ch17.indd 565 2/8/07 3:00:15 PM2/8/07 3:00:15 PM
566 P A R T 6 Cost of Capital and Long-Term Financial Policy
This is a comprehensive example that illustrates most of the points we have discussed thus far. You are given the following information for the Format Co.:
EBIT � $151.52
TC � .34
D � $500
RU � .20
The cost of debt capital is 10 percent. What is the value of Format’s equity? What is the cost of equity capital for Format? What is the WACC?
(continued)
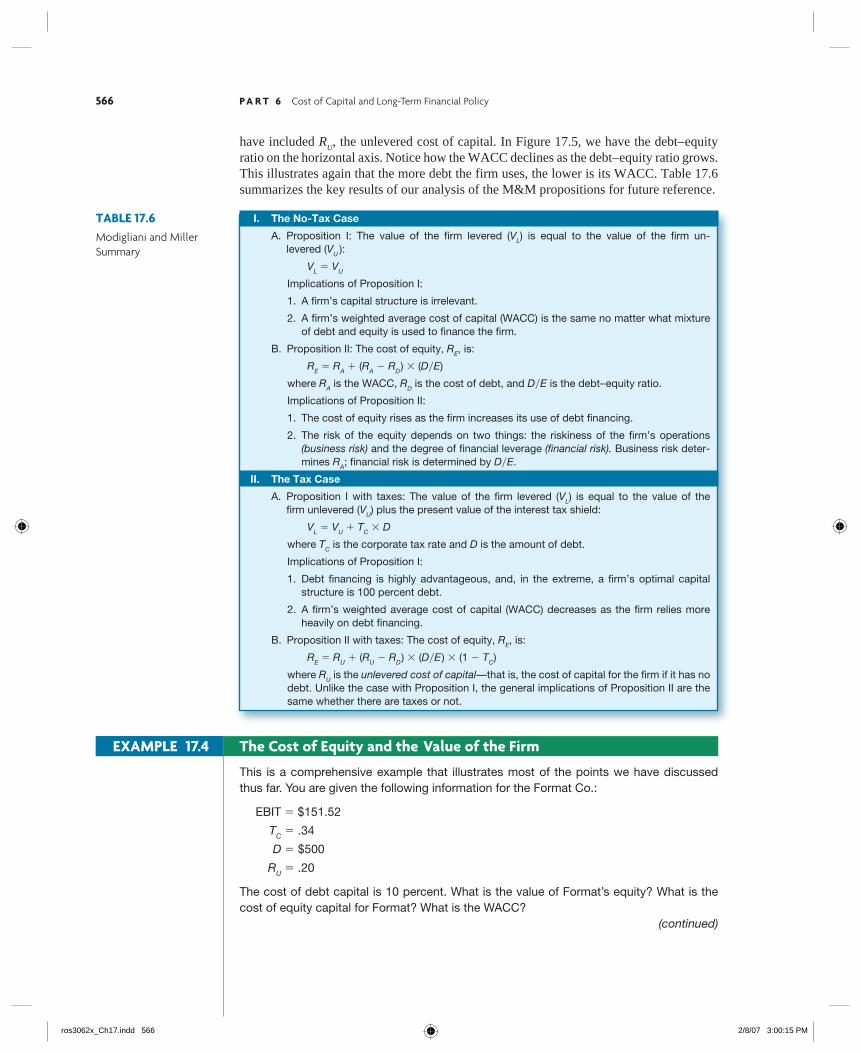
I. The No-Tax Case
A. Proposition I: The value of the firm levered (VL) is equal to the value of the firm un -levered (VU ):
VL � VU
Implications of Proposition I:
1. A firm’s capital structure is irrelevant.
2. A firm’s weighted average cost of capital (WACC) is the same no matter what mixture of debt and equity is used to finance the firm.
B. Proposition II: The cost of equity, RE, is:
RE � RA � (RA � RD ) � (D�E)
where RA is the WACC, RD is the cost of debt, and D�E is the debt– equity ratio.
Implications of Proposition II:
1. The cost of equity rises as the firm increases its use of debt financing.
2. The risk of the equity depends on two things: the riskiness of the firm’s operations (business risk) and the degree of financial leverage (financial risk). Business risk deter-mines RA; financial risk is determined by D�E.
II. The Tax Case
A. Proposition I with taxes: The value of the firm levered (VL) is equal to the value of the firm unlevered (VU) plus the present value of the interest tax shield:
VL � VU � TC � D
where TC is the corporate tax rate and D is the amount of debt.
Implications of Proposition I:
1. Debt financing is highly advantageous, and, in the extreme, a firm’s optimal capital structure is 100 percent debt.
2. A firm’s weighted average cost of capital (WACC) decreases as the firm relies more heavily on debt financing.
B. Proposition II with taxes: The cost of equity, RE, is:
RE � RU � (RU � RD ) � (D�E) � (1 � TC)
where RU is the unlevered cost of capital—that is, the cost of capital for the firm if it has no debt. Unlike the case with Proposition I, the general implications of Proposition II are the same whether there are taxes or not.
TABLE 17.6Modigliani and Miller Summary
have included RU, the unlevered cost of capital. In Figure 17.5, we have the debt– equity
ratio on the horizontal axis. Notice how the WACC declines as the debt– equity ratio grows. This illustrates again that the more debt the firm uses, the lower is its WACC. Table 17.6 summarizes the key results of our analysis of the M&M propositions for future reference.
EXAMPLE 17.4 The Cost of Equity and the Value of the Firm
ros3062x_Ch17.indd 566ros3062x_Ch17.indd 566 2/8/07 3:00:15 PM2/8/07 3:00:15 PM
C H A P T E R 17 Financial Leverage and Capital Structure Policy 567
17.4a What is the relationship between the value of an unlevered fi rm and the value of a levered fi rm once we consider the effect of corporate taxes?
17.4b If we consider only the effect of taxes, what is the optimal capital structure?
Concept Questions
Bankruptcy CostsOne limiting factor affecting the amount of debt a firm might use comes in the form of bankruptcy costs. As the debt– equity ratio rises, so too does the probability that the firm will be unable to pay its bondholders what was promised to them. When this hap-pens, owner ship of the firm’s assets is ultimately transferred from the stockholders to the bondholders. In principle, a firm becomes bankrupt when the value of its assets equals the value of its debt. When this occurs, the value of equity is zero, and the stockholders turn over control
17.5
This one’s easier than it looks. Remember that all the cash flows are perpetuities. The value of the firm if it has no debt, VU, is:
VU � EBIT � Taxes _____________ RU
� EBIT � (1 � TC)
_______________ RU
� $100
_____ .20
� $500
From M&M Proposition I with taxes, we know that the value of the firm with debt is:
VL � VU � TC � D
� $500 � .34 � 500
� $670
Because the firm is worth $670 total and the debt is worth $500, the equity is worth $170:
E � VL � D
� $670 � 500
� $170
Based on M&M Proposition II with taxes, the cost of equity is:
RE � RU � (RU � RD) � (D�E) � (1 � TC)
� .20 � (.20 � .10) � ($500�170) � (1 � .34)
� 39.4%
Finally, the WACC is:
WACC � ($170�670) � 39.4% � (500�670) � 10% � (1 � .34)
� 14.92%
Notice that this is substantially lower than the cost of capital for the firm with no debt (RU � 20%), so debt financing is highly advantageous.
ros3062x_Ch17.indd 567ros3062x_Ch17.indd 567 2/8/07 3:00:17 PM2/8/07 3:00:17 PM
568 P A R T 6 Cost of Capital and Long-Term Financial Policy
of the firm to the bondholders. When this takes place, the bondholders hold assets whose value is exactly equal to what is owed on the debt. In a perfect world, there are no costs associated with this transfer of ownership, and the bondholders don’t lose anything. This idealized view of bankruptcy is not, of course, what happens in the real world. Ironically, it is expensive to go bankrupt. As we discuss, the costs associated with bank-ruptcy may eventually offset the tax-related gains from leverage.
DIRECT BANKRUPTCY COSTSWhen the value of a firm’s assets equals the value of its debt, then the firm is economi-cally bankrupt in the sense that the equity has no value. However, the formal turning over of the assets to the bondholders is a legal process, not an economic one. There are legal and administrative costs to bankruptcy, and it has been remarked that bankruptcies are to lawyers what blood is to sharks. For example, in December 2001, energy products giant Enron filed for bankruptcy in the largest U.S. bankruptcy to date. Over the next three years, the company went through the bankruptcy process, finally emerging in November 2004. The direct bankruptcy costs were staggering: Enron spent over $1 billion on lawyers, accountants, consultants, and examiners, and the final tally may be higher. Other recent expensive bankruptcies include WorldCom ($600 million), Adelphia Communications ($370 million), and United Airlines ($335 million). Because of the expenses associated with bankruptcy, bondholders won’t get all that they are owed. Some fraction of the firm’s assets will “disappear” in the legal process of going bankrupt. These are the legal and administrative expenses associated with the bankruptcy proceeding. We call these costs direct bankruptcy costs. These direct bankruptcy costs are a disincentive to debt financing. If a firm goes bank-rupt, then, suddenly, a piece of the firm disappears. This amounts to a bankruptcy “tax.” So a firm faces a trade-off: Borrowing saves a firm money on its corporate taxes, but the more a firm borrows, the more likely it is that the firm will become bankrupt and have to pay the bankruptcy tax.
INDIRECT BANKRUPTCY COSTSBecause it is expensive to go bankrupt, a firm will spend resources to avoid doing so. When a firm is having significant problems in meeting its debt obligations, we say that it is expe-riencing financial distress. Some financially distressed firms ultimately file for bankruptcy, but most do not because they are able to recover or otherwise survive. The costs of avoiding a bankruptcy filing incurred by a financially distressed firm are called indirect bankruptcy costs. We use the term financial distress costs to refer generically to the direct and indirect costs associated with going bankrupt or avoiding a bankruptcy filing. The problems that come up in financial distress are particularly severe, and the finan-cial distress costs are thus larger, when the stockholders and the bondholders are different groups. Until the firm is legally bankrupt, the stockholders control it. They, of course, will take actions in their own economic interests. Because the stockholders can be wiped out in a legal bankruptcy, they have a very strong incentive to avoid a bankruptcy filing. The bondholders, on the other hand, are primarily concerned with protecting the value of the firm’s assets and will try to take control away from stockholders. They have a strong incentive to seek bankruptcy to protect their interests and keep stockholders from further dissipating the assets of the firm. The net effect of all this fighting is that a long, drawn-out, and potentially quite expensive legal battle gets started.
indirect bankruptcy costsThe costs of avoiding a bankruptcy fi ling incurred by a fi nancially distressed fi rm.
fi nancial distress costsThe direct and indirect costs associated with going bankrupt or experiencing fi nancial distress.
direct bankruptcy costsThe costs that aredirectly associated withbankruptcy, such aslegal and administrativeexpenses.
ros3062x_Ch17.indd 568ros3062x_Ch17.indd 568 2/8/07 3:00:18 PM2/8/07 3:00:18 PM
C H A P T E R 17 Financial Leverage and Capital Structure Policy 569
Meanwhile, as the wheels of justice turn in their ponderous way, the assets of the firm lose value because management is busy trying to avoid bankruptcy instead of running the business. Normal operations are disrupted, and sales are lost. Valuable employees leave, potentially fruitful programs are dropped to preserve cash, and otherwise profitable invest-ments are not taken. For example, in 2006, both General Motors and Ford were experiencing significant financial difficulty, and many people felt that one or both companies would eventually file for bankruptcy. As a result of the bad news surrounding both companies, there was a loss of confidence in the companies’ automobiles. A study showed that 75 percent of Americans would not purchase an automobile from a bankrupt company because the company might not honor the warranty and it might be difficult to obtain replacement parts. This concern resulted in lost potential sales for both companies, which only added to their financial distress. These are all indirect bankruptcy costs, or costs of financial distress. Whether or not the firm ultimately goes bankrupt, the net effect is a loss of value because the firm chose to use debt in its capital structure. It is this possibility of loss that limits the amount of debt that a firm will choose to use.
17.5a What are direct bankruptcy costs?
17.5b What are indirect bankruptcy costs?
Concept Questions
Optimal Capital StructureOur previous two sections have established the basis for determining an optimal capital structure. A firm will borrow because the interest tax shield is valuable. At relatively low debt levels, the probability of bankruptcy and financial distress is low, and the benefit from debt outweighs the cost. At very high debt levels, the possibility of financial distress is a chronic, ongoing problem for the firm, so the benefit from debt financing may be more than offset by the financial distress costs. Based on our discussion, it would appear that an optimal capital structure exists somewhere in between these extremes.
THE STATIC THEORY OF CAPITAL STRUCTUREThe theory of capital structure that we have outlined is called the static theory of capital structure. It says that firms borrow up to the point where the tax benefit from an extra dollar in debt is exactly equal to the cost that comes from the increased probability of financial distress. We call this the static theory because it assumes that the firm is fixed in terms of its assets and operations and it considers only possible changes in the debt– equity ratio. The static theory is illustrated in Figure 17.6, which plots the value of the firm, V
L,
against the amount of debt, D. In Figure 17.6, we have drawn lines corresponding to three different stories. The first represents M&M Proposition I with no taxes. This is the hori-zontal line extending from V
U, and it indicates that the value of the firm is unaffected by its
capital structure. The second case, M&M Proposition I with corporate taxes, is represented by the upward-sloping straight line. These two cases are exactly the same as the ones we previously illustrated in Figure 17.4.
17.6
static theory of capital structureThe theory that a fi rmborrows up to the pointwhere the tax benefi tfrom an extra dollar indebt is exactly equal tothe cost that comes fromthe increased probabilityof fi nancial distress.
ros3062x_Ch17.indd 569ros3062x_Ch17.indd 569 2/8/07 3:00:18 PM2/8/07 3:00:18 PM
570 P A R T 6 Cost of Capital and Long-Term Financial Policy
Val
ue o
f th
e fir
m (V
L)Maximum
firm value VL*
Total debt (D)
Financial distresscosts
Actual firm value
VU � Value of firm with no debt
Present value oftax shield on debt
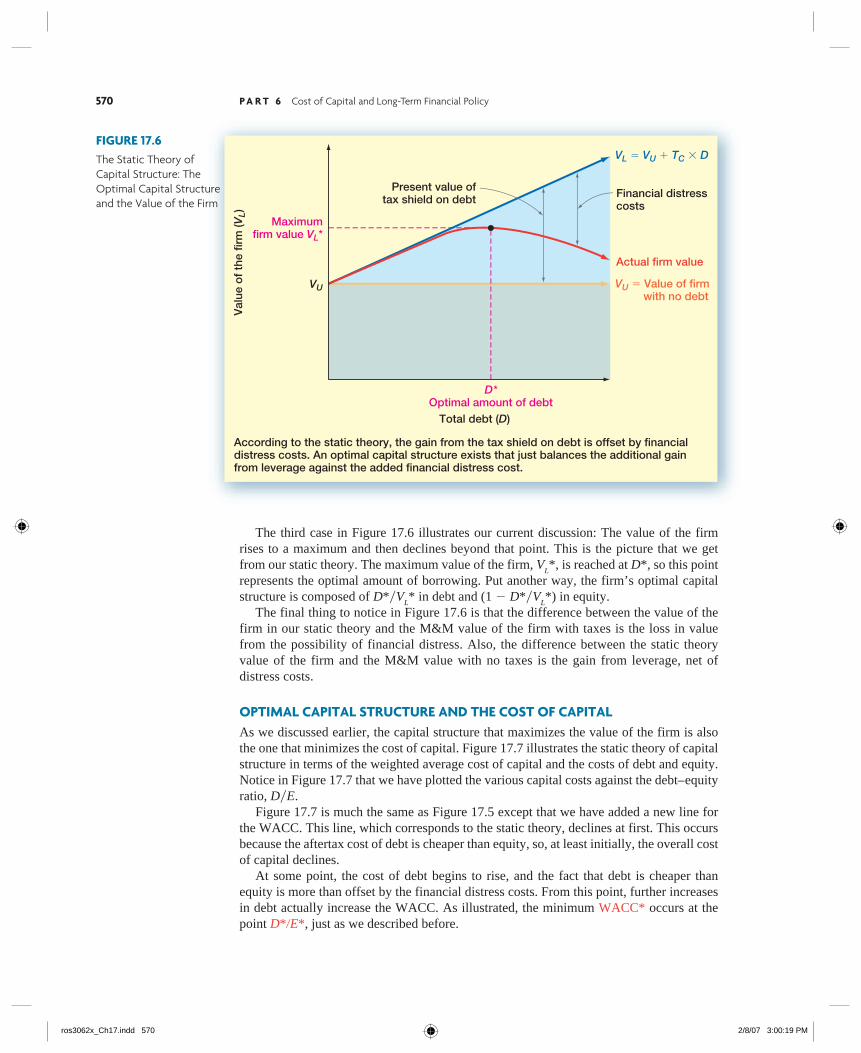
According to the static theory, the gain from the tax shield on debt is offset by financialdistress costs. An optimal capital structure exists that just balances the additional gainfrom leverage against the added financial distress cost.
D*Optimal amount of debt
VU
VL � VU � TC � DFIGURE 17.6The Static Theory of Capital Structure: The Optimal Capital Structure and the Value of the Firm
The third case in Figure 17.6 illustrates our current discussion: The value of the firm rises to a maximum and then declines beyond that point. This is the picture that we get from our static theory. The maximum value of the firm, V
L*, is reached at D*, so this point
represents the optimal amount of borrowing. Put another way, the firm’s optimal capital structure is composed of D*�V
L* in debt and (1 � D*�V
L*) in equity.
The final thing to notice in Figure 17.6 is that the difference between the value of the firm in our static theory and the M&M value of the firm with taxes is the loss in value from the possibility of financial distress. Also, the difference between the static theory value of the firm and the M&M value with no taxes is the gain from leverage, net of distress costs.
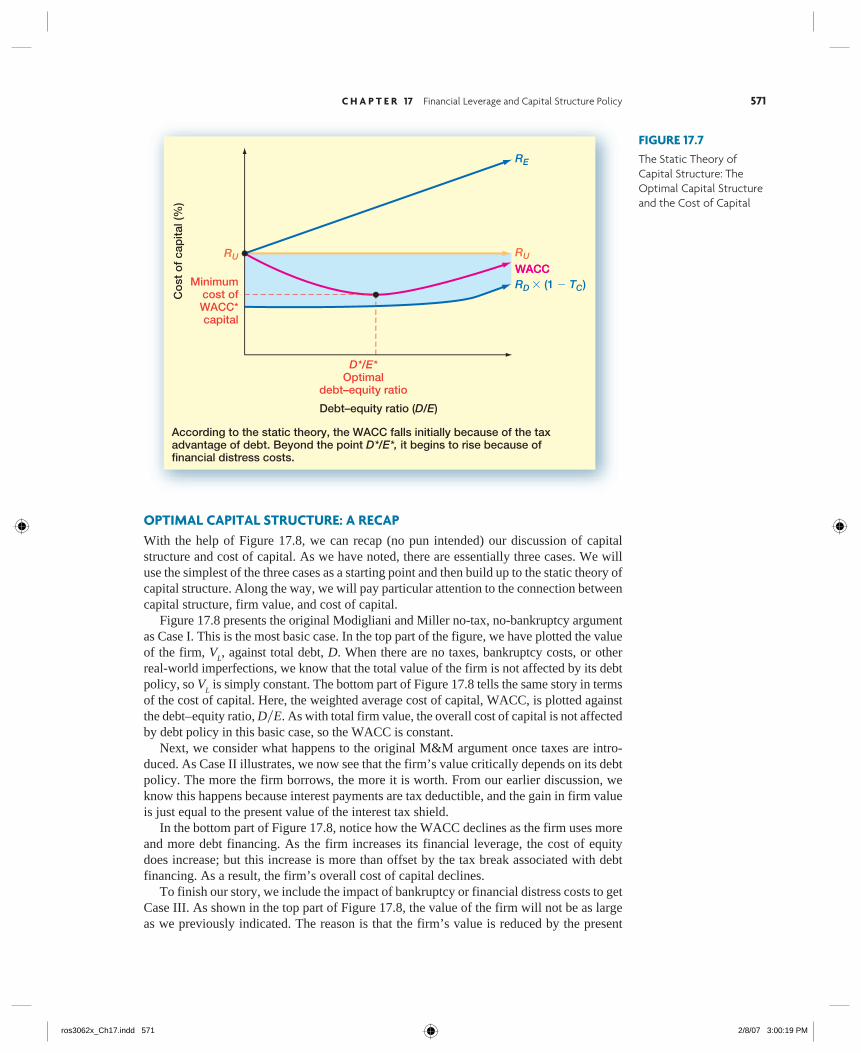
OPTIMAL CAPITAL STRUCTURE AND THE COST OF CAPITALAs we discussed earlier, the capital structure that maximizes the value of the firm is also the one that minimizes the cost of capital. Figure 17.7 illustrates the static theory of capital structure in terms of the weighted average cost of capital and the costs of debt and equity. Notice in Figure 17.7 that we have plotted the various capital costs against the debt– equity ratio, D�E. Figure 17.7 is much the same as Figure 17.5 except that we have added a new line for the WACC. This line, which corresponds to the static theory, declines at first. This occurs because the aftertax cost of debt is cheaper than equity, so, at least initially, the overall cost of capital declines. At some point, the cost of debt begins to rise, and the fact that debt is cheaper than equity is more than offset by the financial distress costs. From this point, further increases in debt actually increase the WACC. As illustrated, the minimum WACC* occurs at the point D*�E*, just as we described before.
ros3062x_Ch17.indd 570ros3062x_Ch17.indd 570 2/8/07 3:00:19 PM2/8/07 3:00:19 PM
C H A P T E R 17 Financial Leverage and Capital Structure Policy 571
FIGURE 17.7The Static Theory of Capital Structure: The Optimal Capital Structure and the Cost of Capital
According to the static theory, the WACC falls initially because of the taxadvantage of debt. Beyond the point D*/E*, it begins to rise because offinancial distress costs.
Co
st o
f ca
pita
l (%
)
Minimumcost ofWACC*capital
Debt–equity ratio (D/E)
D*/E*Optimal
debt–equity ratio
RD � (1 � TC)
RE
RU RU
WACCWACC
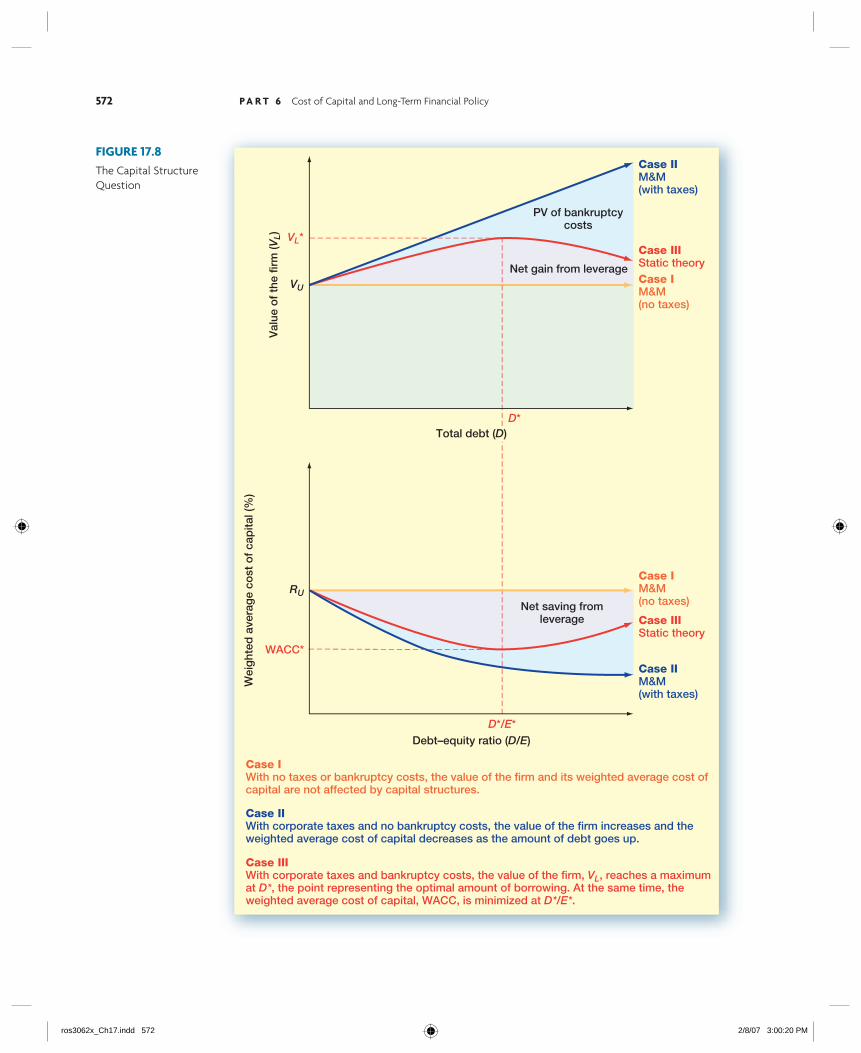
OPTIMAL CAPITAL STRUCTURE: A RECAPWith the help of Figure 17.8, we can recap (no pun intended) our discussion of capital structure and cost of capital. As we have noted, there are essentially three cases. We will use the simplest of the three cases as a starting point and then build up to the static theory of capital structure. Along the way, we will pay particular attention to the connection between capital structure, firm value, and cost of capital. Figure 17.8 presents the original Modigliani and Miller no-tax, no-bankruptcy argument as Case I. This is the most basic case. In the top part of the figure, we have plotted the value of the firm, V
L, against total debt, D. When there are no taxes, bankruptcy costs, or other
real-world imperfections, we know that the total value of the firm is not affected by its debt policy, so V
L is simply constant. The bottom part of Figure 17.8 tells the same story in terms
of the cost of capital. Here, the weighted average cost of capital, WACC, is plotted against the debt– equity ratio, D�E. As with total firm value, the overall cost of capital is not affected by debt policy in this basic case, so the WACC is constant. Next, we consider what happens to the original M&M argument once taxes are intro-duced. As Case II illustrates, we now see that the firm’s value critically depends on its debt policy. The more the firm borrows, the more it is worth. From our earlier discussion, we know this happens because interest payments are tax deductible, and the gain in firm value is just equal to the present value of the interest tax shield. In the bottom part of Figure 17.8, notice how the WACC declines as the firm uses more and more debt financing. As the firm increases its financial leverage, the cost of equity does increase; but this increase is more than offset by the tax break associated with debt financing. As a result, the firm’s overall cost of capital declines. To finish our story, we include the impact of bankruptcy or financial distress costs to get Case III. As shown in the top part of Figure 17.8, the value of the firm will not be as large as we previously indicated. The reason is that the firm’s value is reduced by the present
ros3062x_Ch17.indd 571ros3062x_Ch17.indd 571 2/8/07 3:00:19 PM2/8/07 3:00:19 PM
572 P A R T 6 Cost of Capital and Long-Term Financial Policy
FIGURE 17.8The Capital Structure Question
Case IWith no taxes or bankruptcy costs, the value of the firm and its weighted average cost ofcapital are not affected by capital structures.
Case IIWith corporate taxes and no bankruptcy costs, the value of the firm increases and theweighted average cost of capital decreases as the amount of debt goes up.
Case IIIWith corporate taxes and bankruptcy costs, the value of the firm, VL, reaches a maximumat D*, the point representing the optimal amount of borrowing. At the same time, theweighted average cost of capital, WACC, is minimized at D*/E*.
Val
ue o
f th
e fir
m (V
L)
Total debt (D)
VUCase IM&M(no taxes)
Wei
ght
ed a
vera
ge
cost
of
cap
ital (
%)
Debt–equity ratio (D/E)
RU
Case IM&M(no taxes)
Case IIM&M(with taxes)
Case IIM&M(with taxes)
D*/E*
Net saving fromleverage Case III
Static theory
Case IIIStatic theory
D*
PV of bankruptcycosts
Net gain from leverage
WACC*
VL*
ros3062x_Ch17.indd 572ros3062x_Ch17.indd 572 2/8/07 3:00:20 PM2/8/07 3:00:20 PM
C H A P T E R 17 Financial Leverage and Capital Structure Policy 573
value of the potential future bankruptcy costs. These costs grow as the firm borrows more and more, and they eventually overwhelm the tax advantage of debt financing. The optimal capital structure occurs at D*, the point at which the tax saving from an additional dollar in debt financing is exactly balanced by the increased bankruptcy costs associated with the additional borrowing. This is the essence of the static theory of capital structure. The bottom part of Figure 17.8 presents the optimal capital structure in terms of the cost of capital. Corresponding to D*, the optimal debt level, is the optimal debt– equity ratio, D*�E*. At this level of debt financing, the lowest possible weighted average cost of capital, WACC*, occurs.
CAPITAL STRUCTURE: SOME MANAGERIAL RECOMMENDATIONSThe static model that we have described is not capable of identifying a precise optimal capital structure, but it does point out two of the more relevant factors: taxes and financial distress. We can draw some limited conclusions concerning these.
Taxes First of all, the tax benefit from leverage is obviously important only to firms that are in a tax-paying position. Firms with substantial accumulated losses will get little value from the interest tax shield. Furthermore, firms that have substantial tax shields from other sources, such as depreciation, will get less benefit from leverage. Also, not all firms have the same tax rate. The higher the tax rate, the greater the incen-tive to borrow.
Financial Distress Firms with a greater risk of experiencing financial distress will bor-row less than firms with a lower risk of financial distress. For example, all other things being equal, the greater the volatility in EBIT, the less a firm should borrow. In addition, financial distress is more costly for some firms than others. The costs of financial distress depend primarily on the firm’s assets. In particular, financial distress costs will be determined by how easily ownership of those assets can be transferred. For example, a firm with mostly tangible assets that can be sold without great loss in value will have an incentive to borrow more. For firms that rely heavily on intangibles, such as employee talent or growth opportunities, debt will be less attractive because these assets effectively cannot be sold.
17.6a Can you describe the trade-off that defi nes the static theory of capital structure?
17.6b What are the important factors in making capital structure decisions?
Concept Questions
The Pie AgainAlthough it is comforting to know that the firm might have an optimal capital structure when we take account of such real-world matters as taxes and financial distress costs, it is disquieting to see the elegant original M&M intuition (that is, the no-tax version) fall apart in the face of these matters. Critics of the M&M theory often say that it fails to hold as soon as we add in real-world issues and that the M&M theory is really just that: a theory that doesn’t have much to say about the real world that we live in. In fact, they would argue that it is the M&M theory
17.7
ros3062x_Ch17.indd 573ros3062x_Ch17.indd 573 2/8/07 3:00:20 PM2/8/07 3:00:20 PM
574 P A R T 6 Cost of Capital and Long-Term Financial Policy
that is irrelevant, not capital structure. As we discuss next, however, taking that view blinds critics to the real value of the M&M theory.
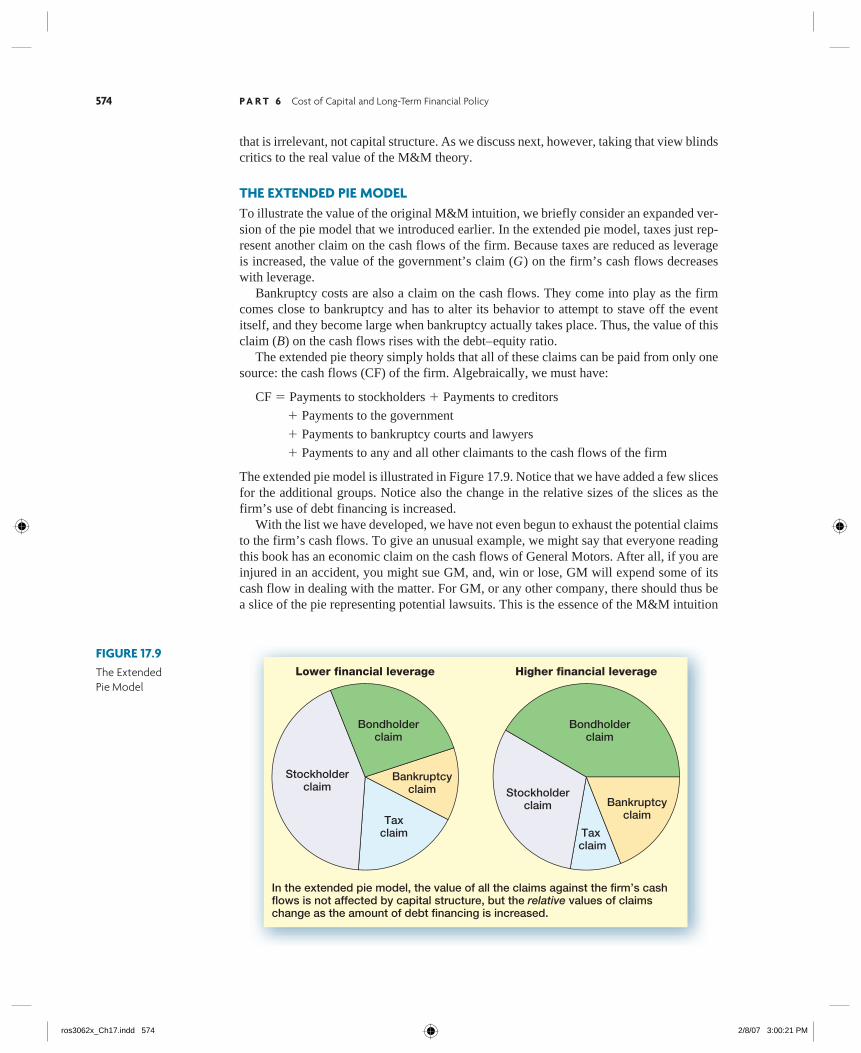
THE EXTENDED PIE MODELTo illustrate the value of the original M&M intuition, we briefly consider an expanded ver-sion of the pie model that we introduced earlier. In the extended pie model, taxes just rep-resent another claim on the cash flows of the firm. Because taxes are reduced as leverage is increased, the value of the government’s claim (G) on the firm’s cash flows decreases with leverage. Bankruptcy costs are also a claim on the cash flows. They come into play as the firm comes close to bankruptcy and has to alter its behavior to attempt to stave off the event itself, and they become large when bankruptcy actually takes place. Thus, the value of this claim (B) on the cash flows rises with the debt– equity ratio. The extended pie theory simply holds that all of these claims can be paid from only one source: the cash flows (CF) of the firm. Algebraically, we must have:
CF � Payments to stockholders � Payments to creditors
� Payments to the government
� Payments to bankruptcy courts and lawyers
� Payments to any and all other claimants to the cash flows of the firm
The extended pie model is illustrated in Figure 17.9. Notice that we have added a few slices for the additional groups. Notice also the change in the relative sizes of the slices as the firm’s use of debt financing is increased. With the list we have developed, we have not even begun to exhaust the potential claims to the firm’s cash flows. To give an unusual example, we might say that everyone reading this book has an economic claim on the cash flows of General Motors. After all, if you are injured in an accident, you might sue GM, and, win or lose, GM will expend some of its cash flow in dealing with the matter. For GM, or any other company, there should thus be a slice of the pie representing potential lawsuits. This is the essence of the M&M intuition
FIGURE 17.9The Extended Pie Model
Lower financial leverage Higher financial leverage
Bondholderclaim
Stockholderclaim
Bankruptcyclaim
Taxclaim
Bondholderclaim
Stockholderclaim Bankruptcy
claim
Tax claim
In the extended pie model, the value of all the claims against the firm’s cashflows is not affected by capital structure, but the relative values of claimschange as the amount of debt financing is increased.
ros3062x_Ch17.indd 574ros3062x_Ch17.indd 574 2/8/07 3:00:21 PM2/8/07 3:00:21 PM
C H A P T E R 17 Financial Leverage and Capital Structure Policy 575
and theory: The value of the firm depends on the total cash flow of the firm. The firm’s capital structure just cuts that cash flow up into slices without altering the total. What we recognize now is that the stockholders and the bondholders may not be the only ones who can claim a slice.
MARKETED CLAIMS VERSUS NONMARKETED CLAIMSWith our extended pie model, there is an important distinction between claims such as those of stockholders and bondholders, on the one hand, and those of the government and potential litigants in lawsuits on the other. The first set of claims are marketed claims, and the second set are nonmarketed claims. A key difference is that the marketed claims can be bought and sold in financial markets and the nonmarketed claims cannot. When we speak of the value of the firm, we are generally referring to just the value of the marketed claims, V M , and not the value of the nonmarketed claims, V N . If we write V T for the total value of all the claims against a corporation’s cash flows, then:
V T � E � D � G � B � . . .
� V M � V N
The essence of our extended pie model is that this total value, V T , of all the claims to the
firm’s cash flows is unaltered by capital structure. However, the value of the marketed claims, V M , may be affected by changes in the capital structure. Based on the pie theory, any increase in V M must imply an identical decrease in V N . The optimal capital structure is thus the one that maximizes the value of the marketed claims or, equivalently, minimizes the value of nonmarketed claims such as taxes and bank-ruptcy costs.
17.7a What are some of the claims to a fi rm’s cash fl ows?
17.7b What is the difference between a marketed claim and a nonmarketed claim?
17.7c What does the extended pie model say about the value of all the claims to a fi rm’s cash fl ows?
Concept Questions
The Pecking-Order TheoryThe static theory we have developed in this chapter has dominated thinking about capital structure for a long time, but it has some shortcomings. Perhaps the most obvious is that many large, financially sophisticated, and highly profitable firms use little debt. This is the opposite of what we would expect. Under the static theory, these are the firms that should use the most debt because there is little risk of bankruptcy and the value of the tax shield is substantial. Why do they use so little debt? The pecking-order theory, which we consider next, may be part of the answer.
INTERNAL FINANCING AND THE PECKING ORDERThe pecking-order theory is an alternative to the static theory. A key element in the pecking-order theory is that firms prefer to use internal financing whenever possible. A simple reason is that selling securities to raise cash can be expensive, so it makes sense to avoid doing so if
17.8
ros3062x_Ch17.indd 575ros3062x_Ch17.indd 575 2/8/07 3:00:21 PM2/8/07 3:00:21 PM
576 P A R T 6 Cost of Capital and Long-Term Financial Policy
possible. If a firm is very profitable, it might never need external financing; so it would end up with little or no debt. For example, in mid-2006, Google’s balance sheet showed assets of $14.4 billion, of which almost $10 billion was classified as either cash or marketable securi-ties. In fact, Google held so much of its assets in the form of securities that it was in danger of being regulated as a mutual fund! There is a more subtle reason that companies may prefer internal financing. Suppose you are the manager of a firm, and you need to raise external capital to fund a new venture. As an insider, you are privy to a lot of information that isn’t known to the public. Based on your knowledge, the firm’s future prospects are considerably brighter than outside inves-tors realize. As a result, you think your stock is currently undervalued. Should you issue debt or equity to finance the new venture? If you think about it, you definitely don’t want to issue equity in this case. The reason is that your stock is undervalued, and you don’t want to sell it too cheaply. So, you issue debt instead. Would you ever want to issue equity? Suppose you thought your firm’s stock was overvalued. It makes sense to raise money at inflated prices, but a problem crops up. If you try to sell equity, investors will realize that the shares are probably overvalued, and your stock price will take a hit. In other words, if you try to raise money by selling equity, you run the risk of signaling to investors that the price is too high. In fact, in the real world, companies rarely sell new equity, and the market reacts negatively to such sales when they occur. So, we have a pecking order. Companies will use internal financing first. Then, they will issue debt if necessary. Equity will be sold pretty much as a last resort.
IMPLICATIONS OF THE PECKING ORDERThe pecking-order theory has several significant implications, a couple of which are at odds with our static trade-off theory:
1. No target capital structure: Under the pecking-order theory, there is no target or optimal debt– equity ratio. Instead, a firm’s capital structure is determined by its need for external financing, which dictates the amount of debt the firm will have.
2. Profitable firms use less debt: Because profitable firms have greater internal cash flow, they will need less external financing and will therefore have less debt. As we mentioned earlier, this is a pattern that we seem to observe, at least for some companies.
3. Companies will want financial slack: To avoid selling new equity, companies will want to stockpile internally generated cash. Such a cash reserve is known as financial slack. It gives management the ability to finance projects as they appear and to move quickly if necessary.
Which theory, static trade-off or pecking order, is correct? Financial researchers have not reached a definitive conclusion on this issue, but we can make a few observations. The trade-off theory speaks more to long-run financial goals or strategies. The issues of tax shields and financial distress costs are plainly important in that context. The pecking-order theory is more concerned with the shorter-run, tactical issue of raising external funds to finance investments. So both theories are useful ways of understanding corporate use of debt. For example, it is probably the case that firms have long-run, target capital structures, but it is also probably true that they will deviate from those long-run targets as needed to avoid issuing new equity.
ros3062x_Ch17.indd 576ros3062x_Ch17.indd 576 2/8/07 3:00:22 PM2/8/07 3:00:22 PM
C H A P T E R 17 Financial Leverage and Capital Structure Policy 577
17.8a Under the pecking-order theory, what is the order in which fi rms will obtain fi nancing?
17.8b Why might fi rms prefer not to issue new equity?
17.8c What are some differences in implications of the static and pecking-order theories?
Concept Questions
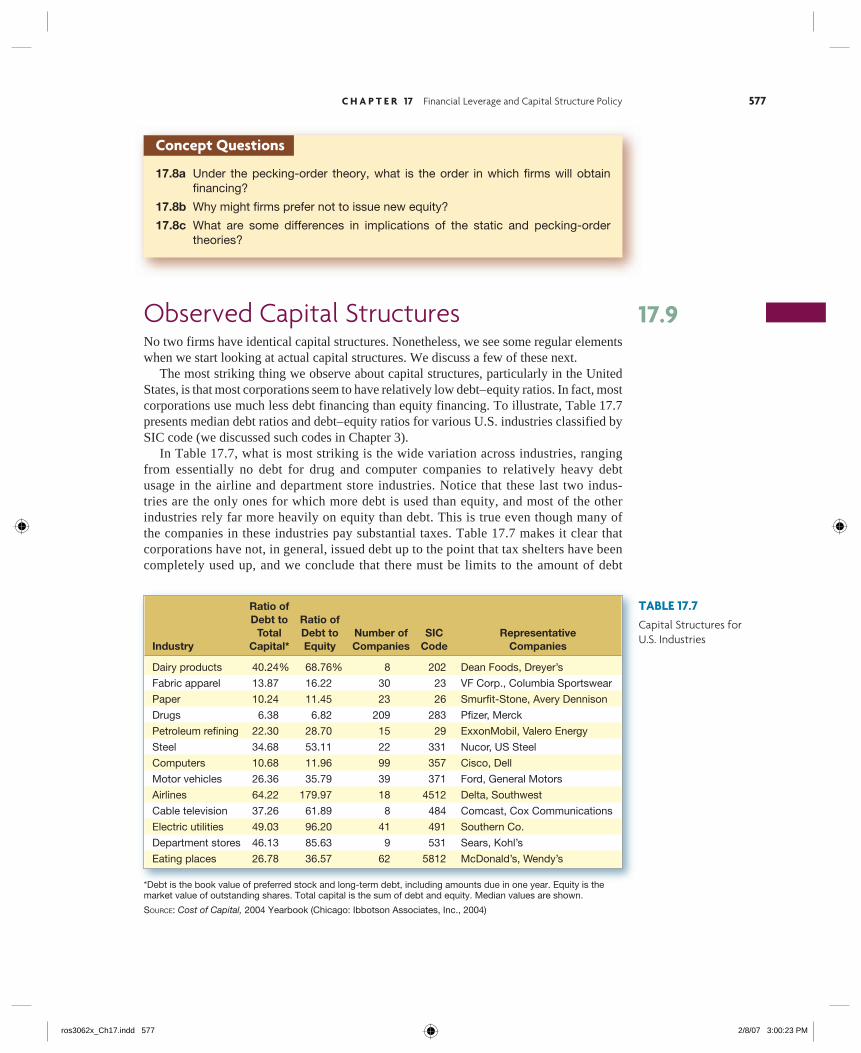
Observed Capital StructuresNo two firms have identical capital structures. Nonetheless, we see some regular elements when we start looking at actual capital structures. We discuss a few of these next. The most striking thing we observe about capital structures, particularly in the United States, is that most corporations seem to have relatively low debt– equity ratios. In fact, most corporations use much less debt financing than equity financing. To illustrate, Table 17.7 presents median debt ratios and debt– equity ratios for various U.S. industries classified by SIC code (we discussed such codes in Chapter 3). In Table 17.7, what is most striking is the wide variation across industries, ranging from essentially no debt for drug and computer companies to relatively heavy debt usage in the airline and department store industries. Notice that these last two indus-tries are the only ones for which more debt is used than equity, and most of the other industries rely far more heavily on equity than debt. This is true even though many of the companies in these industries pay substantial taxes. Table 17.7 makes it clear that corporations have not, in general, issued debt up to the point that tax shelters have been completely used up, and we conclude that there must be limits to the amount of debt
17.9
TABLE 17.7Capital Structures for U.S. Industries
Ratio of Debt to Ratio of Total Debt to Number of SIC Representative Industry Capital* Equity Companies Code Companies
Dairy products 40.24% 68.76% 8 202 Dean Foods, Dreyer’s
Fabric apparel 13.87 16.22 30 23 VF Corp., Columbia Sportswear
Paper 10.24 11.45 23 26 Smurfi t-Stone, Avery Dennison
Drugs 6.38 6.82 209 283 Pfi zer, Merck
Petroleum refi ning 22.30 28.70 15 29 ExxonMobil, Valero Energy
Steel 34.68 53.11 22 331 Nucor, US Steel
Computers 10.68 11.96 99 357 Cisco, Dell
Motor vehicles 26.36 35.79 39 371 Ford, General Motors
Airlines 64.22 179.97 18 4512 Delta, Southwest
Cable television 37.26 61.89 8 484 Comcast, Cox Communications
Electric utilities 49.03 96.20 41 491 Southern Co.
Department stores 46.13 85.63 9 531 Sears, Kohl’s
Eating places 26.78 36.57 62 5812 McDonald’s, Wendy’s
*Debt is the book value of preferred stock and long-term debt, including amounts due in one year. Equity is the market value of outstanding shares. Total capital is the sum of debt and equity. Median values are shown.
SOURCE: Cost of Capital, 2004 Yearbook (Chicago: Ibbotson Associates, Inc., 2004)
ros3062x_Ch17.indd 577ros3062x_Ch17.indd 577 2/8/07 3:00:23 PM2/8/07 3:00:23 PM

578 P A R T 6 Cost of Capital and Long-Term Financial Policy
corporations can use. Take a look at our nearby Work the Web box for more about actual capital structures. Because different industries have different operating characteristics in terms of, for example, EBIT volatility and asset types, there does appear to be some connection between these characteristics and capital structure. Our story involving tax savings, finan-cial distress costs, and potential pecking orders undoubtedly supplies part of the reason; but, to date, there is no fully satisfactory theory that explains these regularities in capital structures.
17.9a Do U.S. corporations rely heavily on debt fi nancing?
17.9b What regularities do we observe in capital structures?
Concept Questions
WORK THE WEB
When it comes to capital structure, all companies (and industries) are not created equal. To illustrate, we looked up some capital structure information on Allied Waste Industries (AW) and Johnson & Johnson (JNJ) using the Ratio Comparison area of yahoo.investor.reuters.com. Allied Waste’s capital structure looks like this:
For every dollar of equity, Allied has long-term debt of $2.01 and total debt of $2.07. Compare this result to Johnson & Johnson:
For every dollar of equity, Johnson & Johnson has only $0.05 of long-term debt and total debt of $0.07. When we examine the industry and sector averages, the differences are again apparent. Although the choice of capital structure is a management decision, it is clearly infl uenced by industry characteristics.
ros3062x_Ch17.indd 578ros3062x_Ch17.indd 578 2/8/07 3:00:24 PM2/8/07 3:00:24 PM

C H A P T E R 17 Financial Leverage and Capital Structure Policy 579
A Quick Look at the Bankruptcy ProcessAs we have discussed, one consequence of using debt is the possibility of financial distress, which can be defined in several ways:
1. Business failure: This term is usually used to refer to a situation in which a business has terminated with a loss to creditors; but even an all-equity firm can fail.
2. Legal bankruptcy: Firms or creditors bring petitions to a federal court for bankruptcy. Bankruptcy is a legal proceeding for liquidating or reorganizing a business.
3. Technical insolvency: Technical insolvency occurs when a firm is unable to meet its financial obligations.
4. Accounting insolvency: Firms with negative net worth are insolvent on the books. This happens when the total book liabilities exceed the book value of the total assets.
We now very briefly discuss some of the terms and more relevant issues associated with bankruptcy and financial distress.
LIQUIDATION AND REORGANIZATIONFirms that cannot or choose not to make contractually required payments to creditors have two basic options: liquidation or reorganization. Liquidation means termination of the firm as a going concern, and it involves selling off the assets of the firm. The proceeds, net of selling costs, are distributed to creditors in order of established priority. Reorganizationis the option of keeping the firm a going concern; it often involves issuing new securities to replace old securities. Liquidation or reorganization is the result of a bankruptcy proceed-ing. Which occurs depends on whether the firm is worth more “dead or alive.”
Bankruptcy Liquidation Chapter 7 of the Federal Bankruptcy Reform Act of 1978 deals with “straight” liquidation. The following sequence of events is typical:
1. A petition is filed in a federal court. Corporations may file a voluntary petition, or involuntary petitions may be filed against the corporation by several of its creditors.
2. A trustee-in-bankruptcy is elected by the creditors to take over the assets of the debtor corporation. The trustee will attempt to liquidate the assets.
3. When the assets are liquidated, after payment of the bankruptcy administration costs, the proceeds are distributed among the creditors.
4. If any proceeds remain, after expenses and payments to creditors, they are distributed to the shareholders.
The distribution of the proceeds of the liquidation occurs according to the following priority list:
1. Administrative expenses associated with the bankruptcy.
2. Other expenses arising after the filing of an involuntary bankruptcy petition but before the appointment of a trustee.
3. Wages, salaries, and commissions.
4. Contributions to employee benefit plans.
5. Consumer claims.
6. Government tax claims.
17.10
bankruptcyA legal proceeding for liquidating or reorganizing a business.
liquidationTermination of the fi rm as a going concern.
reorganizationFinancial restructuring of a failing fi rm to attempt to continue operations as a going concern.
The SEC has a good overview of the bankruptcy process in its “online publications” section: www.sec.gov.
ros3062x_Ch17.indd 579ros3062x_Ch17.indd 579 2/8/07 3:00:27 PM2/8/07 3:00:27 PM
580 P A R T 6 Cost of Capital and Long-Term Financial Policy
7. Payment to unsecured creditors.
8. Payment to preferred stockholders.
9. Payment to common stockholders.
This priority list for liquidation is a reflection of the absolute priority rule (APR). The higher a claim is on this list, the more likely it is to be paid. In many of these categories, there are various limitations and qualifications that we omit for the sake of brevity. Two qualifications to this list are in order. The first concerns secured creditors. Such creditors are entitled to the proceeds from the sale of the security and are outside this ordering. However, if the secured property is liquidated and provides cash insufficient to cover the amount owed, the secured creditors join with unsecured creditors in dividing the remaining liquidated value. In contrast, if the secured property is liquidated for proceeds greater than the secured claim, the net proceeds are used to pay unsecured creditors and others. The second qualification to the APR is that, in reality, what happens, and who gets what, in the event of bankruptcy are subject to much negotiation; as a result, the APR is frequently not followed.
Bankruptcy Reorganization Corporate reorganization takes place under Chapter 11 of the Federal Bankruptcy Reform Act of 1978. The general objective of a proceeding under Chapter 11 is to plan to restructure the corporation with some provision for repayment of creditors. A typical sequence of events follows:
1. A voluntary petition can be filed by the corporation, or an involuntary petition can be filed by creditors.
2. A federal judge either approves or denies the petition. If the petition is approved, a time for filing proofs of claims is set.
3. In most cases, the corporation (the “debtor in possession”) continues to run the business.
4. The corporation (and, in certain cases, the creditors) submits a reorganization plan.
5. Creditors and shareholders are divided into classes. A class of creditors accepts the plan if a majority of the class agrees to the plan.
6. After its acceptance by creditors, the plan is confirmed by the court.
7. Payments in cash, property, and securities are made to creditors and shareholders. The plan may provide for the issuance of new securities.
8. For some fixed length of time, the firm operates according to the provisions of the reorganization plan.
The corporation may wish to allow the old stockholders to retain some participation in the firm. Needless to say, this may involve some protest by the holders of unsecured debt. So-called prepackaged bankruptcies are a relatively common phenomenon. What hap-pens is that the corporation secures the necessary approval of a bankruptcy plan from a majority of its creditors first, and then it files for bankruptcy. As a result, the company enters bankruptcy and reemerges almost immediately. For example, in November 2004, Trump Hotels and Casinos filed for Chapter 11 bank-ruptcy. This was the second bankruptcy proceeding for the company. Fortunately for “The Donald,” creditors didn’t say “You’re fired!” Instead, under the terms of the prepack, Trump’s stake in the company was cut, but he stayed on as chairman of the board and CEO. He also received, among other things, a 25 percent stake in the Miss America Pageant and four acres of land in Atlantic City. The current bondholders agreed to exchange their bonds for a combination of new bonds with a lower coupon rate, along with cash and stock.
absolute priority rule (APR)The rule establishing priority of claims in liquidation.
Get the latest on bankruptcy at www.bankruptcydata.com.
ros3062x_Ch17.indd 580ros3062x_Ch17.indd 580 2/8/07 3:00:29 PM2/8/07 3:00:29 PM
C H A P T E R 17 Financial Leverage and Capital Structure Policy 581
In some cases, the bankruptcy procedure is needed to invoke the “cram-down” power of the bankruptcy court. Under certain circumstances, a class of creditors can be forced to accept a bankruptcy plan even if they vote not to approve it—hence the remarkably apt description “cram down.” In 2005, Congress passed the most significant overhaul of U.S. bankruptcy laws in the last 25 years, the Bankruptcy Abuse Prevention and Consumer Protection Act of 2005 (BAPCPA). Most of the changes were aimed at individual debtors, but corporations were also affected. Before BAPCPA, a bankrupt company had the exclusive right to submit reorganization plans to the bankruptcy court. It has been argued that this exclusivity is one reason some companies have remained in bankruptcy for so long. Under the new law, after 18 months, creditors can submit their own plan for the court’s consideration. This change is likely to speed up bankruptcies and also lead to more prepacks. One controversial change made by BAPCPA has to do with so-called key employee retention plans or KERPs. Strange as it may sound, bankrupt companies routinely give bonus payments to executives, even though the executives may be the same ones who led the company into bankruptcy in the first place. Such bonuses are intended to keep valuable employees from moving to more successful firms, but critics have argued they are often abused. The new law permits KERPs only if the employee in question actually has a job offer from another company.
FINANCIAL MANAGEMENT AND THE BANKRUPTCY PROCESSIt may seem a little odd, but the right to go bankrupt is very valuable. There are several reasons why this is true. First, from an operational standpoint, when a firm files for bank-ruptcy, there is an immediate “stay” on creditors, usually meaning that payments to credi-tors will cease, and creditors will have to await the outcome of the bankruptcy process to find out if and how much they will be paid. This stay gives the firm time to evaluate its options, and it prevents what is usually termed a “race to the courthouse steps” by creditors and others. Beyond this, some bankruptcy filings are actually strategic actions intended to improve a firm’s competitive position, and firms have filed for bankruptcy even though they were not insolvent at the time. Probably the most famous example is Continental Airlines. In 1983, following deregulation of the airline industry, Continental found itself compet-ing with newly established airlines that had much lower labor costs. Continental filed for reorganization under Chapter 11 even though it was not insolvent. Continental argued that, based on pro forma data, it would become insolvent in the future, and a reorganization was therefore necessary. By filing for bankruptcy, Con-tinental was able to terminate its existing labor agreements, lay off large numbers of workers, and slash wages for the remaining employees. In other words, at least in the eyes of critics, Continental essentially used the bankruptcy process as a vehicle for reducing labor costs. Congress subsequently modified bankruptcy laws to make it more difficult, though not impossible, for companies to abrogate a labor contract through the bankruptcy process. Other famous examples of strategic bankruptcies exist. For example, Manville (then known as Johns-Manville) and Dow Corning filed for bankruptcy because of expected future losses resulting from litigation associated with asbestos and silicone breast implants, respectively. In fact, by 2006, at least 75 companies had filed for Chapter 11 bankruptcy because of asbestos litigation. In 2000, for example, Owens Corning, known for its pink fiberglass insulation, threw in the towel after settling about 240,000 cases with no end in sight. As of May 2006, the company was still in bankruptcy. In that month, the company
ros3062x_Ch17.indd 581ros3062x_Ch17.indd 581 2/8/07 3:00:29 PM2/8/07 3:00:29 PM
582 P A R T 6 Cost of Capital and Long-Term Financial Policy
reached a tentative agreement to repay senior trade creditors, bondholders, and holders of bank debt an estimated 43 to 49 percent of the debt owed. Other well-known compa-nies that filed for bankruptcy due to the asbestos nightmare include Congoleum, Federal Mogul, and two subsidiaries of Halliburton.
AGREEMENTS TO AVOID BANKRUPTCYWhen a firm defaults on an obligation, it can avoid a bankruptcy filing. Because the legal process of bankruptcy can be lengthy and expensive, it is often in everyone’s best inter-est to devise a “workout” that avoids a bankruptcy filing. Much of the time, creditors can work with the management of a company that has defaulted on a loan contract. Voluntary arrangements to restructure or “reschedule” the company’s debt can be and often are made. This may involve extension, which postpones the date of payment, or composition, which involves a reduced payment.
17.10a What is the APR?
17.10b What is the difference between liquidation and reorganization?
Concept Questions
Summary and ConclusionsThe ideal mixture of debt and equity for a firm—its optimal capital structure—is the one that maximizes the value of the firm and minimizes the overall cost of capital. If we ignore taxes, financial distress costs, and any other imperfections, we find that there is no ideal mixture. Under these circumstances, the firm’s capital structure is simply irrelevant. If we consider the effect of corporate taxes, we find that capital structure matters a great deal. This conclusion is based on the fact that interest is tax deductible and thus gener-ates a valuable tax shield. Unfortunately, we also find that the optimal capital structure is 100 percent debt, which is not something we observe in healthy firms. We next introduced costs associated with bankruptcy, or, more generally, financial dis-tress. These costs reduce the attractiveness of debt financing. We concluded that an optimal capital structure exists when the net tax saving from an additional dollar in interest just equals the increase in expected financial distress costs. This is the essence of the static theory of capital structure. We also considered the pecking-order theory of capital structure as an alternative to the static trade-off theory. This theory suggests that firms will use internal financing as much as possible, followed by debt financing if needed. Equity will not be issued if possible. As a result, a firm’s capital structure just reflects its historical needs for external financing, so there is no optimal capital structure. When we examine actual capital structures, we find two regularities. First, firms in the United States typically do not use great amounts of debt, but they pay substantial taxes. This suggests that there is a limit to the use of debt financing to generate tax shields. Sec-ond, firms in similar industries tend to have similar capital structures, suggesting that the nature of their assets and operations is an important determinant of capital structure.
17.11
Vis
it u
s at
ww
w.m
hhe.
com
/rw
j
ros3062x_Ch17.indd 582ros3062x_Ch17.indd 582 2/9/07 4:07:46 PM2/9/07 4:07:46 PM
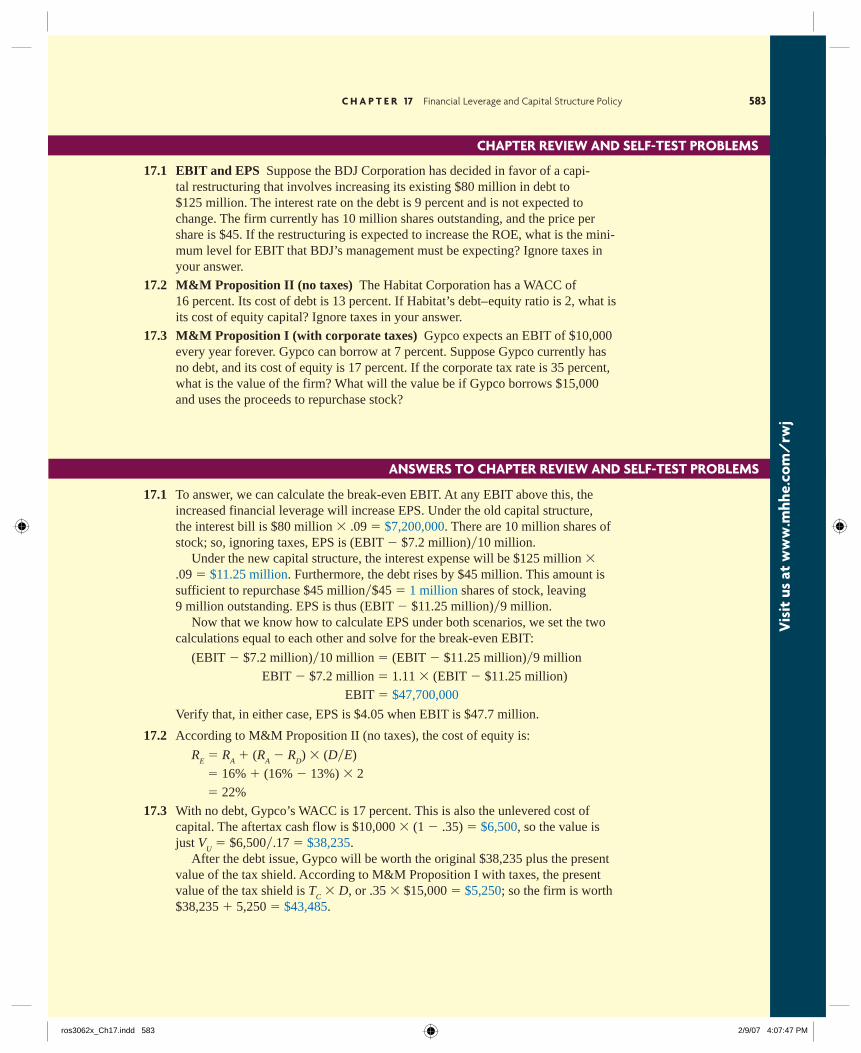
C H A P T E R 17 Financial Leverage and Capital Structure Policy 583
ANSWERS TO CHAPTER REVIEW AND SELF-TEST PROBLEMS
CHAPTER REVIEW AND SELF-TEST PROBLEMS
Vis
it u
s at
ww
w.m
hhe.
com
/rw
j
17.1 EBIT and EPS Suppose the BDJ Corporation has decided in favor of a capi-tal restructuring that involves increasing its existing $80 million in debt to $125 million. The interest rate on the debt is 9 percent and is not expected to change. The firm currently has 10 million shares outstanding, and the price per share is $45. If the restructuring is expected to increase the ROE, what is the mini-mum level for EBIT that BDJ’s management must be expecting? Ignore taxes in your answer.
17.2 M&M Proposition II (no taxes) The Habitat Corporation has a WACC of 16 percent. Its cost of debt is 13 percent. If Habitat’s debt– equity ratio is 2, what is its cost of equity capital? Ignore taxes in your answer.
17.3 M&M Proposition I (with corporate taxes) Gypco expects an EBIT of $10,000 every year forever. Gypco can borrow at 7 percent. Suppose Gypco currently has no debt, and its cost of equity is 17 percent. If the corporate tax rate is 35 percent, what is the value of the firm? What will the value be if Gypco borrows $15,000 and uses the proceeds to repurchase stock?
17.1 To answer, we can calculate the break-even EBIT. At any EBIT above this, the increased financial leverage will increase EPS. Under the old capital structure, the interest bill is $80 million � .09 � $7,200,000. There are 10 million shares of stock; so, ignoring taxes, EPS is (EBIT � $7.2 million)�10 million.
Under the new capital structure, the interest expense will be $125 million � .09 � $11.25 million. Furthermore, the debt rises by $45 million. This amount is sufficient to repurchase $45 million�$45 � 1 million shares of stock, leaving 9 million outstanding. EPS is thus (EBIT � $11.25 million)�9 million.
Now that we know how to calculate EPS under both scenarios, we set the two calculations equal to each other and solve for the break-even EBIT:
(EBIT � $7.2 million)�10 million � (EBIT � $11.25 million)�9 million
EBIT � $7.2 million � 1.11 � (EBIT � $11.25 million) EBIT � $47,700,000
Verify that, in either case, EPS is $4.05 when EBIT is $47.7 million.
17.2 According to M&M Proposition II (no taxes), the cost of equity is:
RE � R
A � (R
A � R
D) � (D�E)
� 16% � (16% � 13%) � 2
� 22%
17.3 With no debt, Gypco’s WACC is 17 percent. This is also the unlevered cost of capital. The aftertax cash flow is $10,000 � (1 � .35) � $6,500, so the value is just V
U � $6,500�.17 � $38,235.
After the debt issue, Gypco will be worth the original $38,235 plus the pres ent value of the tax shield. According to M&M Proposition I with taxes, the present value of the tax shield is T
C � D, or .35 � $15,000 � $5,250; so the firm is worth
$38,235 � 5,250 � $43,485.
ros3062x_Ch17.indd 583ros3062x_Ch17.indd 583 2/9/07 4:07:47 PM2/9/07 4:07:47 PM
584 P A R T 6 Cost of Capital and Long-Term Financial Policy
1. Business Risk versus Financial Risk Explain what is meant by business risk and financial risk. Suppose Firm A has greater business risk than Firm B. Is it true that Firm A also has a higher cost of equity capital? Explain.
2. M&M Propositions How would you answer in the following debate?
Q: Isn’t it true that the riskiness of a firm’s equity will rise if the firm increases its use of debt financing?
A: Yes, that’s the essence of M&M Proposition II. Q: And isn’t it true that, as a firm increases its use of borrowing, the likelihood of
default increases, thereby increasing the risk of the firm’s debt? A: Yes. Q: In other words, increased borrowing increases the risk of the equity and the
debt? A: That’s right. Q: Well, given that the firm uses only debt and equity financing, and given that
the risks of both are increased by increased borrowing, does it not follow that increasing debt increases the overall risk of the firm and therefore decreases the value of the firm?
A: ??
3. Optimal Capital Structure Is there an easily identifiable debt– equity ratio that will maximize the value of a firm? Why or why not?
4. Observed Capital Structures Refer to the observed capital structures given in Table 17.7 of the text. What do you notice about the types of industries with respect to their average debt– equity ratios? Are certain types of industries more likely to be highly leveraged than others? What are some possible reasons for this observed segmentation? Do the operating results and tax history of the firms play a role? How about their future earnings prospects? Explain.
5. Financial Leverage Why is the use of debt financing referred to as financial “leverage”?
6. Homemade Leverage What is homemade leverage?
7. Bankruptcy and Corporate Ethics As mentioned in the text, some firms have filed for bankruptcy because of actual or likely litigation-related losses. Is this a proper use of the bankruptcy process?
8. Bankruptcy and Corporate Ethics Firms sometimes use the threat of a bank-ruptcy filing to force creditors to renegotiate terms. Critics argue that in such cases, the firm is using bankruptcy laws “as a sword rather than a shield.” Is this an ethical tactic?
9. Bankruptcy and Corporate Ethics As mentioned in the text, Continental Airlines filed for bankruptcy, at least in part, as a means of reducing labor costs. Whether this move was ethical, or proper, was hotly debated. Give both sides of the argument.
10. Capital Structure Goal What is the basic goal of financial management with regard to capital structure?
CONCEPTS REVIEW AND CRITICAL THINKING QUESTIONS
Vis
it u
s at
ww
w.m
hhe.
com
/rw
j
ros3062x_Ch17.indd 584ros3062x_Ch17.indd 584 2/8/07 3:00:32 PM2/8/07 3:00:32 PM

C H A P T E R 17 Financial Leverage and Capital Structure Policy 585
QUESTIONS AND PROBLEMS
Vis
it u
s at
ww
w.m
hhe.
com
/rw
j
1. EBIT and Leverage Wild Side, Inc., has no debt outstanding and a total market value of $200,000. Earnings before interest and taxes, EBIT, are projected to be $25,000 if economic conditions are normal. If there is strong expansion in the economy, then EBIT will be 40 percent higher. If there is a recession, then EBIT will be 60 percent lower. Wild Side is considering a $70,000 debt issue with a 6 percent interest rate. The proceeds will be used to repurchase shares of stock. There are currently 4,000 shares outstanding. Ignore taxes for this problem.
a. Calculate earnings per share (EPS) under each of the three economic scenarios before any debt is issued. Also calculate the percentage changes in EPS when the economy expands or enters a recession.
b. Repeat part (a) assuming that Wild Side goes through with recapitalization. What do you observe?
2. EBIT, Taxes, and Leverage Repeat parts (a) and (b) in Problem 1 assuming Wild Side has a tax rate of 35 percent.
3. ROE and Leverage Suppose the company in Problem 1 has a market-to-book ratio of 1.0.
a. Calculate return on equity (ROE) under each of the three economic scenarios before any debt is issued. Also calculate the percentage changes in ROE for economic expansion and recession, assuming no taxes.
b. Repeat part (a) assuming the firm goes through with the proposed recapitalization.
c. Repeat parts (a) and (b) of this problem assuming the firm has a tax rate of 35 percent.
4. Break-Even EBIT Petty Corporation is comparing two different capital structures: an all-equity plan (Plan I) and a levered plan (Plan II). Under Plan I, Petty would have 200,000 shares of stock outstanding. Under Plan II, there would be 90,000 shares of stock outstanding and $1.5 million in debt outstanding. The interest rate on the debt is 8 percent, and there are no taxes.
a. If EBIT is $150,000, which plan will result in the higher EPS? b. If EBIT is $300,000, which plan will result in the higher EPS? c. What is the break-even EBIT?
5. M&M and Stock Value In Problem 4, use M&M Proposition I to find the price per share of equity under each of the two proposed plans. What is the value of the firm?
6. Break-Even EBIT and Leverage Kolby Corp. is comparing two different capital structures. Plan I would result in 1,500 shares of stock and $20,000 in debt. Plan II would result in 1,100 shares of stock and $30,000 in debt. The interest rate on the debt is 10 percent.
a. Ignoring taxes, compare both of these plans to an all-equity plan assuming that EBIT will be $12,000. The all-equity plan would result in 2,300 shares of stock outstanding. Which of the three plans has the highest EPS? The lowest?
BASIC(Questions 1–15)
ros3062x_Ch17.indd 585ros3062x_Ch17.indd 585 2/8/07 3:00:32 PM2/8/07 3:00:32 PM

Vis
it u
s at
ww
w.m
hhe.
com
/rw
j586 P A R T 6 Cost of Capital and Long-Term Financial Policy
b. In part (a), what are the break-even levels of EBIT for each plan as compared to that for an all-equity plan? Is one higher than the other? Why?
c. Ignoring taxes, when will EPS be identical for Plans I and II? d. Repeat parts (a), (b), and (c) assuming that the corporate tax rate is 40 percent.
Are the break-even levels of EBIT different from before? Why or why not?
7. Leverage and Stock Value Ignoring taxes in Problem 6, what is the price per share of equity under Plan I? Plan II? What principle is illustrated by your answers?
8. Homemade Leverage Home Body, Inc., a prominent consumer products firm, is debating whether to convert its all-equity capital structure to one that is 50 percent debt. Currently, there are 5,000 shares outstanding, and the price per share is $60. EBIT is expected to remain at $28,000 per year forever. The interest rate on new debt is 8 percent, and there are no taxes.
a. Allison, a shareholder of the firm, owns 100 shares of stock. What is her cash flow under the current capital structure, assuming the firm has a dividend payout rate of 100 percent?
b. What will Allison’s cash flow be under the proposed capital structure of the firm? Assume she keeps all 100 of her shares.
c. Suppose Home Body does convert, but Allison prefers the current all-equity capital structure. Show how she could unlever her shares of stock to recreate the original capital structure.
d. Using your answer to part (c), explain why Home Body’s choice of capital structure is irrelevant.
9. Homemade Leverage and WACC ABC Co. and XYZ Co. are identical firms in all respects except for their capital structure. ABC is all equity financed with $800,000 in stock. XYZ uses both stock and perpetual debt; its stock is worth $400,000 and the interest rate on its debt is 10 percent. Both firms expect EBIT to be $90,000. Ignore taxes.
a. Rico owns $30,000 worth of XYZ’s stock. What rate of return is he expecting?
b. Show how Rico could generate exactly the same cash flows and rate of return by investing in ABC and using homemade leverage.
c. What is the cost of equity for ABC? What is it for XYZ? d. What is the WACC for ABC? For XYZ? What principle have you illustrated?
10. M&M Lamont Corp. uses no debt. The weighted average cost of capital is 11 percent. If the current market value of the equity is $25 million and there are no taxes, what is EBIT?
11. M&M and Taxes In the previous question, suppose the corporate tax rate is 35 percent. What is EBIT in this case? What is the WACC? Explain.
12. Calculating WACC Maxwell Industries has a debt– equity ratio of 1.5. Its WACC is 11 percent, and its cost of debt is 8 percent. The corporate tax rate is 35 percent.
a. What is Maxwell’s cost of equity capital? b. What is Maxwell’s unlevered cost of equity capital? c. What would the cost of equity be if the debt– equity ratio were 2? What if it were
1.0? What if it were zero?
13. Calculating WACC Second Base Corp. has no debt but can borrow at 7.5 percent. The firm’s WACC is currently 10 percent, and the tax rate is 35 percent.
a. What is Second Base’s cost of equity? b. If the firm converts to 25 percent debt, what will its cost of equity be?
ros3062x_Ch17.indd 586ros3062x_Ch17.indd 586 2/8/07 3:00:33 PM2/8/07 3:00:33 PM
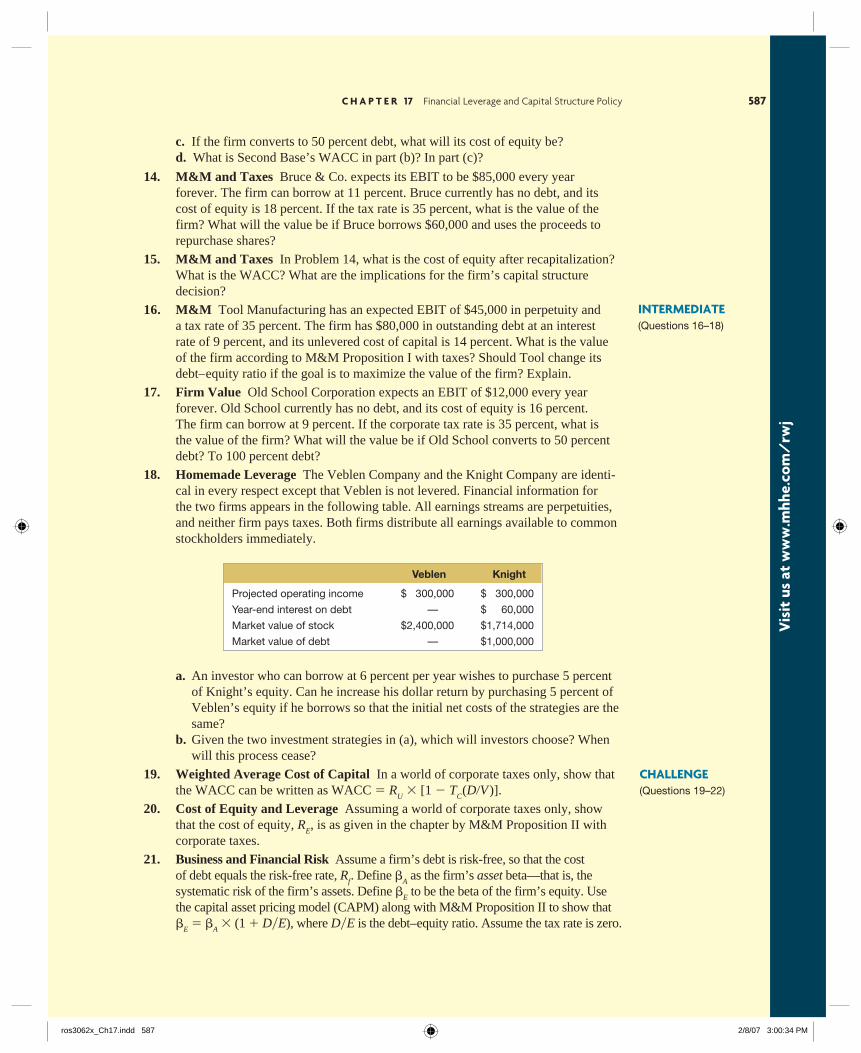
C H A P T E R 17 Financial Leverage and Capital Structure Policy 587
Vis
it u
s at
ww
w.m
hhe.
com
/rw
j
c. If the firm converts to 50 percent debt, what will its cost of equity be? d. What is Second Base’s WACC in part (b)? In part (c)?
14. M&M and Taxes Bruce & Co. expects its EBIT to be $85,000 every year forever. The firm can borrow at 11 percent. Bruce currently has no debt, and its cost of equity is 18 percent. If the tax rate is 35 percent, what is the value of the firm? What will the value be if Bruce borrows $60,000 and uses the proceeds to repurchase shares?
15. M&M and Taxes In Problem 14, what is the cost of equity after recapitalization? What is the WACC? What are the implications for the firm’s capital structure decision?
16. M&M Tool Manufacturing has an expected EBIT of $45,000 in perpetuity and a tax rate of 35 percent. The firm has $80,000 in outstanding debt at an interest rate of 9 percent, and its unlevered cost of capital is 14 percent. What is the value of the firm according to M&M Proposition I with taxes? Should Tool change its debt– equity ratio if the goal is to maximize the value of the firm? Explain.
17. Firm Value Old School Corporation expects an EBIT of $12,000 every year forever. Old School currently has no debt, and its cost of equity is 16 percent. The firm can borrow at 9 percent. If the corporate tax rate is 35 percent, what is the value of the firm? What will the value be if Old School converts to 50 percent debt? To 100 percent debt?
18. Homemade Leverage The Veblen Company and the Knight Company are identi-cal in every respect except that Veblen is not levered. Financial information for the two firms appears in the following table. All earnings streams are perpetuities, and neither firm pays taxes. Both firms distribute all earnings available to common stockholders immediately.
Veblen Knight
Projected operating income $ 300,000 $ 300,000
Year-end interest on debt — $ 60,000
Market value of stock $2,400,000 $1,714,000
Market value of debt — $1,000,000
a. An investor who can borrow at 6 percent per year wishes to purchase 5 percent of Knight’s equity. Can he increase his dollar return by purchasing 5 percent of Veblen’s equity if he borrows so that the initial net costs of the strategies are the same?
b. Given the two investment strategies in (a), which will investors choose? When will this process cease?
19. Weighted Average Cost of Capital In a world of corporate taxes only, show that the WACC can be written as WACC � R
U � [1 � T
C(D�V )].
20. Cost of Equity and Leverage Assuming a world of corporate taxes only, show that the cost of equity, R
E, is as given in the chapter by M&M Proposition II with
corporate taxes.
21. Business and Financial Risk Assume a firm’s debt is risk-free, so that the cost of debt equals the risk-free rate, R
f . Define �
A as the firm’s asset beta—that is, the
systematic risk of the firm’s assets. Define �E to be the beta of the firm’s equity. Use
the capital asset pricing model (CAPM) along with M&M Proposition II to show that �
E � �
A � (1 � D�E), where D�E is the debt– equity ratio. Assume the tax rate is zero.
INTERMEDIATE(Questions 16–18)
CHALLENGE(Questions 19–22)
ros3062x_Ch17.indd 587ros3062x_Ch17.indd 587 2/8/07 3:00:34 PM2/8/07 3:00:34 PM
17.1 Capital Structure Go to yahoo.investors.reuters.com and enter the ticker symbol AMGM for Amgen, a biotechnology company. Follow the “Ratio Comparison” link and find long-term debt– equity and total debt– equity ratios. How does Amgen compare to the industry, sector, and S&P 500 in these areas? Now answer the same question for Edison International (EIX), the parent company of Southern California Edison, a utility company. How do the capital structures of Amgen and Edison International compare? Can you think of possible explanations for the difference between these two companies?
17.2 Capital Structure Go to finance.yahoo.com and follow the “Screener” link. Using the Total Debt/Equity screen on the Java Screener, how many companies have debt– equity ratios greater than 2? Greater than 5? Greater than 10? What company has the highest debt– equity ratio? What is the ratio? Now find how many compa-nies have a negative debt– equity ratio. What is the lowest debt– equity ratio? What does it mean if a company has a negative debt– equity ratio? Repeat these questions for the Long-Term Debt/Equity screen.
WEB EXERCISES
MINICASE
Stephenson Real Estate RecapitalizationStephenson Real Estate Company was founded 25 years ago by the current CEO, Robert Stephenson. The company purchases real estate, including land and buildings, and rents the property to tenants. The company has shown a profit every year for the past 18 years, and the shareholders are satisfied with the com-pany’s management. Prior to founding Stephenson Real Estate, Robert was the founder and CEO of a failed alpaca farming operation. The resulting bankruptcy made him extremely averse to debt financing. As a result, the company is entirely equity financed, with 15 million shares of common stock outstanding. The stock currently trades at $32.50 per share. Stephenson is evaluating a plan to purchase a huge tract of land in the southeastern United States for $100 million. The land will subsequently be leased to tenant farmers. This purchase is expected to increase Stephenson’s annual pretax earnings by $25 million in perpetuity. Kim Weyand, the com-pany’s new CFO, has been put in charge of the project. Kim has determined that the company’s current cost of capital is 12.5 percent. She feels that the company would be more valu-able if it included debt in its capital structure, so she is evaluat-ing whether the company should issue debt to entirely finance
the project. Based on some conversations with investment banks, she thinks that the company can issue bonds at par value with an 8 percent coupon rate. From her analysis, she also believes that a capital structure in the range of 70 percent equity/30 percent debt would be optimal. If the company goes beyond 30 percent debt, its bonds would carry a lower rating and a much higher coupon because the possibility of financial distress and the associated costs would rise sharply. Stephen-son has a 40 percent corporate tax rate (state and federal).
1. If Stephenson wishes to maximize its total market value, would you recommend that it issue debt or equity to finance the land purchase? Explain.
2. Construct Stephenson’s market value balance sheet before it announces the purchase.
3. Suppose Stephenson decides to issue equity to finance the purchase.
a. What is the net present value of the project? b. Construct Stephenson’s market value balance sheet
after it announces that the firm will finance the
MINICASE
Vis
it u
s at
ww
w.m
hhe.
com
/rw
j588 P A R T 6 Cost of Capital and Long-Term Financial Policy
22. Stockholder Risk Suppose a firm’s business operations are such that they mirror movements in the economy as a whole very closely; that is, the firm’s asset beta is 1.0. Use the result of Problem 21 to find the equity beta for this firm for debt– equity ratios of 0, 1, 5, and 20. What does this tell you about the relationship between capital structure and shareholder risk? How is the shareholders’ required return on equity affected? Explain.
ros3062x_Ch17.indd 588ros3062x_Ch17.indd 588 2/8/07 3:00:34 PM2/8/07 3:00:34 PM
purchase using equity. What would be the new price per share of the firm’s stock? How many shares will Stephenson need to issue to finance the purchase?
c. Construct Stephenson’s market value balance sheet after the equity issue but before the purchase has been made. How many shares of common stock does Stephenson have outstanding? What is the price per share of the firm’s stock?
d. Construct Stephenson’s market value balance sheet after the purchase has been made.
4. Suppose Stephenson decides to issue debt to finance the purchase.
a. What will the market value of the Stephenson com-pany be if the purchase is financed with debt?
b. Construct Stephenson’s market value balance sheet after both the debt issue and the land purchase. What is the price per share of the firm’s stock?
5. Which method of financing maximizes the per-share stock price of Stephenson’s equity?
C H A P T E R 17 Financial Leverage and Capital Structure Policy 589
Vis
it u
s at
ww
w.m
hhe.
com
/rw
j
ros3062x_Ch17.indd 589ros3062x_Ch17.indd 589 2/8/07 3:00:35 PM2/8/07 3:00:35 PM