Embed Size (px)
Citation preview
10
Effect of Leverage on Financial Performance of
Selected Companies Listed in the Nairobi Securities
Exchange, Kenya
1Zachary Mwangi Gathara;
2James M. Kilika, PhD;
3James N. Maingi, PhD.
1Department of Accounting & Finance
School of Business, Kenyatta University, Kenya
+254 722300708
2Lecturer, Department of Business Administration
School of Business, Kenyatta University, Kenya
+254 721620145
3Lecturer, Department of Applied Economics,
School of Economics, Kenyatta University, Kenya
+254 738043482
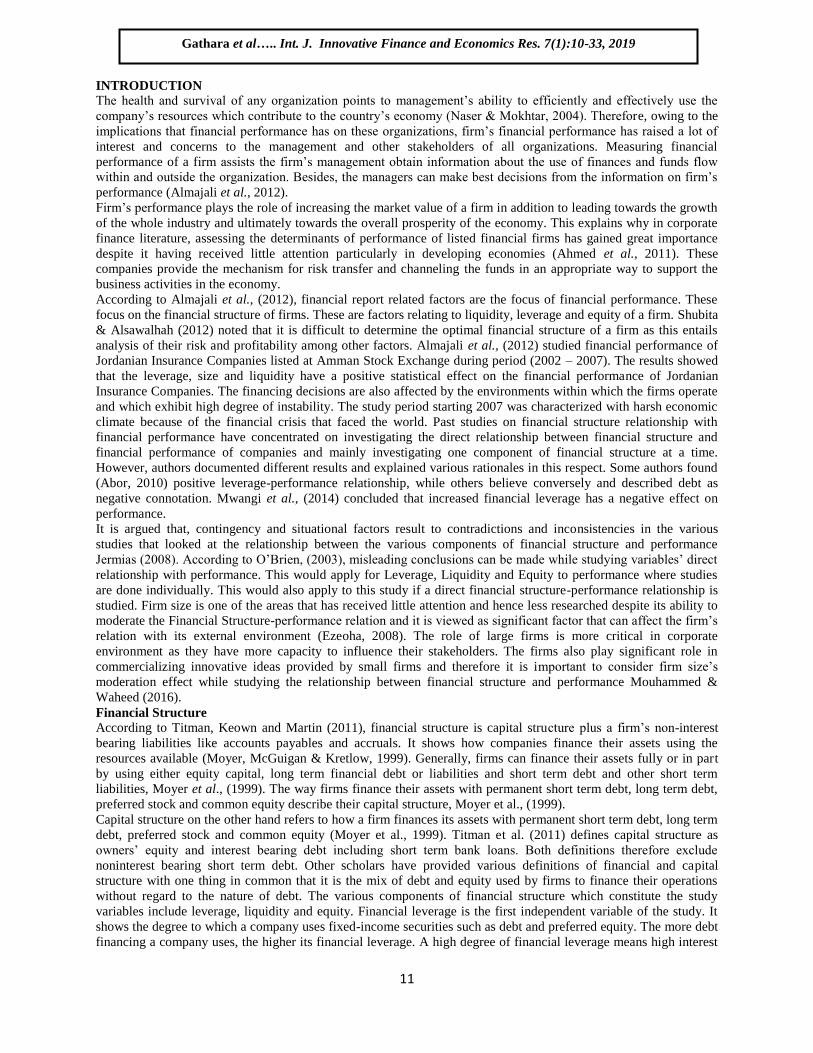
ABSTRACT
A high number of firms especially quoted companies have registered declining financial performance in the recent
years contrary to the stakeholders‟ expectations. Poor financial performance of quoted companies adversely affects
the economic growth of the Kenyan economy. Majority of these firms have been facing financial difficulties. The
management of these companies is concerned whether the firm financial structure affects their performance.
Financial structure of a company is important for the management and stakeholders as it defines the various modes
of financing that the company uses to support its investments and operations. The general objective of this study was
to investigate the effect of financial structure on performance of selected companies listed at (NSE), Kenya. The
specific study objective was to determine the effect of leverage on the performance of Companies listed on the
Nairobi Securities Exchange (NSE). Causal or explanatory research design was employed in the study due to the
nature of problem and available. Quantitative data was used. Multivariate tests using panel data model examined the
effects of the independent variable on company‟s financial performance. Data was collected for 30 selected
companies for the period 2007-2015. The study adopted positivist philosophy as it focused on objectivity and fits a
quantitative study with objective of testing hypotheses. Various diagnostic tests including, Auto-correlation test,
Normality test, Heteroscedasticity test, Unit root test and Test for pooling were carried out. Regression coefficients
were used to test for significance using t-statistic at 5% level of significance and conclusions drawn. The coefficient
of determination (R2) was used to rank the explanatory variable‟s contribution to the response variable. The study
utilized secondary panel data contained in the annual reports and financial statements of selected companies. The
research contributed to the existing literature of international business and finance by jointly testing the effects of
leverage on performance of selected companies listed at the (NSE), Kenya. Breach-Pagan lagrange multiplier (LM)
test was used showing that there were no panel effects (implying that ordinary least square should be used (pooling).
Therefore, the data was pooled. The study found out that Leverage had significant positive effect on financial
performance of selected companies listed at NSE, Kenya. The recommendations of the study were that managers of
the selected companies listed at NSE, Kenya could utilize the various sources of finance since financial structure has
a positive effect on the performance of the listed firms. The proportion of leverage could be increased in financing
the companies due to its high contribution to performance.
Keywords: Equity, financial performance, leverage, liquidity risk, financial risk, liquidity and under- investment.
International Journal of Innovative Finance and Economics Research 7(1):10-33, Jan.-Mar., 2019
© SEAHI PUBLICATIONS, 2019 www.seahipaj.org ISSN: 2360-896X
11
INTRODUCTION
The health and survival of any organization points to management‟s ability to efficiently and effectively use the
company‟s resources which contribute to the country‟s economy (Naser & Mokhtar, 2004). Therefore, owing to the
implications that financial performance has on these organizations, firm‟s financial performance has raised a lot of
interest and concerns to the management and other stakeholders of all organizations. Measuring financial
performance of a firm assists the firm‟s management obtain information about the use of finances and funds flow
within and outside the organization. Besides, the managers can make best decisions from the information on firm‟s
performance (Almajali et al., 2012).
Firm‟s performance plays the role of increasing the market value of a firm in addition to leading towards the growth
of the whole industry and ultimately towards the overall prosperity of the economy. This explains why in corporate
finance literature, assessing the determinants of performance of listed financial firms has gained great importance
despite it having received little attention particularly in developing economies (Ahmed et al., 2011). These
companies provide the mechanism for risk transfer and channeling the funds in an appropriate way to support the
business activities in the economy.
According to Almajali et al., (2012), financial report related factors are the focus of financial performance. These
focus on the financial structure of firms. These are factors relating to liquidity, leverage and equity of a firm. Shubita
& Alsawalhah (2012) noted that it is difficult to determine the optimal financial structure of a firm as this entails
analysis of their risk and profitability among other factors. Almajali et al., (2012) studied financial performance of
Jordanian Insurance Companies listed at Amman Stock Exchange during period (2002 – 2007). The results showed
that the leverage, size and liquidity have a positive statistical effect on the financial performance of Jordanian
Insurance Companies. The financing decisions are also affected by the environments within which the firms operate
and which exhibit high degree of instability. The study period starting 2007 was characterized with harsh economic
climate because of the financial crisis that faced the world. Past studies on financial structure relationship with
financial performance have concentrated on investigating the direct relationship between financial structure and
financial performance of companies and mainly investigating one component of financial structure at a time.
However, authors documented different results and explained various rationales in this respect. Some authors found
(Abor, 2010) positive leverage-performance relationship, while others believe conversely and described debt as
negative connotation. Mwangi et al., (2014) concluded that increased financial leverage has a negative effect on
performance.
It is argued that, contingency and situational factors result to contradictions and inconsistencies in the various
studies that looked at the relationship between the various components of financial structure and performance
Jermias (2008). According to O‟Brien, (2003), misleading conclusions can be made while studying variables‟ direct
relationship with performance. This would apply for Leverage, Liquidity and Equity to performance where studies
are done individually. This would also apply to this study if a direct financial structure-performance relationship is
studied. Firm size is one of the areas that has received little attention and hence less researched despite its ability to
moderate the Financial Structure-performance relation and it is viewed as significant factor that can affect the firm‟s
relation with its external environment (Ezeoha, 2008). The role of large firms is more critical in corporate
environment as they have more capacity to influence their stakeholders. The firms also play significant role in
commercializing innovative ideas provided by small firms and therefore it is important to consider firm size‟s
moderation effect while studying the relationship between financial structure and performance Mouhammed &
Waheed (2016).
Financial Structure
According to Titman, Keown and Martin (2011), financial structure is capital structure plus a firm‟s non-interest
bearing liabilities like accounts payables and accruals. It shows how companies finance their assets using the
resources available (Moyer, McGuigan & Kretlow, 1999). Generally, firms can finance their assets fully or in part
by using either equity capital, long term financial debt or liabilities and short term debt and other short term
liabilities, Moyer et al., (1999). The way firms finance their assets with permanent short term debt, long term debt,
preferred stock and common equity describe their capital structure, Moyer et al., (1999).
Capital structure on the other hand refers to how a firm finances its assets with permanent short term debt, long term
debt, preferred stock and common equity (Moyer et al., 1999). Titman et al. (2011) defines capital structure as
owners‟ equity and interest bearing debt including short term bank loans. Both definitions therefore exclude
noninterest bearing short term debt. Other scholars have provided various definitions of financial and capital
structure with one thing in common that it is the mix of debt and equity used by firms to finance their operations
without regard to the nature of debt. The various components of financial structure which constitute the study
variables include leverage, liquidity and equity. Financial leverage is the first independent variable of the study. It
shows the degree to which a company uses fixed-income securities such as debt and preferred equity. The more debt
financing a company uses, the higher its financial leverage. A high degree of financial leverage means high interest
Gathara et al….. Int. J. Innovative Finance and Economics Res. 7(1):10-33, 2019
12
payments, which negatively affect the company's bottom-line and earnings per share. Although increasing financial
leverage might enable a firm to increase its value by profiting from tax shields on debt (Modigliani and Miller,
1963), higher financial leverage might lead to higher expected direct and indirect financial distress costs, which
decrease the firm‟s value (Ross et al., 2002).
According to the tradeoff theory, the optimum financing mix coincides with the level of financial leverage at which
the benefits and costs of debt financing are exactly balanced. Businesses use debt because it offers them potential to
increase the volume of their operations and increase the average ROE and ROA through tax savings. In many
authorities, interest on debt is an allowable expense against profits. The use of debt will have this effect only if the
rate of return on the investment or assets is greater than the rate of return on the debt (Watkins, 2002). The study
will use a ratio of Non-Current Assets to Total Net Assets as a measure of firms‟ leverage in this study. Liquidity is
the second independent variable of the study. Liquidity of a company is a financial measurement that is primarily
associated with company performance and the firm‟s ability to meet its short-term obligations. Geczy et al., (2006)
argues that liquidity ratios measure a business‟ ability to meet the payment obligations by comparing the cash and
near cash with the payment obligations. Liquidity-based variables rest on the assumption that firms are more likely
to forego positive net present value projects and thus suffer from underinvestment when their cash holding are low.
When a firm uses more current assets, it means that it can generate internal inflows which can then be used to
finance its operating and investments activities. Therefore, if a negative relation is confirmed, that is an implication
that firms finance their activities following the financing pattern implied by the pecking order theory. Firm with high
liquidity can generate high cash inflows and in turn, can employ the excess cash inflow to finance their operations
and investment activities. Therefore, they use less debt compared to those firms that have low liquidity as suggested
in pecking order theory. As for low liquidity firms, they tend to go for debt in financing their activities (Suhaila &
Wan Mansor, 2008).
Liquidity of a company which is expressed as a ratio of current assets to current liabilities is a measure a company's
ability to provide sufficient cash to cover its short-term obligations (debt). The most common liquidity ratios
include; the current ratio and the quick ratio. The current ratio indicates the extent to which the claims of short-term
creditors are covered by assets that are expected to be converted to cash in a period roughly corresponding to the
maturity of the liabilities. A current liability represents money a company owes and is due in the near future- less
than one year. A current asset, on the other hand, is cash or others short-term assets that can be converted into cash
soon (i.e. less than a year). By dividing the current assets by the current liabilities, we can determine whether a
company can pay off its short-term debt (current liabilities). It also shows the working capital management by the
firm. The study will adopt current ratio as the measure of firms‟ liquidity. The trade-off theory predicts a positive
relationship between liquidity and the debt level (Hasan, eternal, 2009)
Owners‟ Equity constitutes the third independent variable of the study. Equity capital is that part of capital which is
free of debt and represents ownership interest in a firm (Moyer et al., 1999). It is therefore that amount contributed
by the owners and normally includes ordinary share capital, preferential capital, retained earnings and reserves. Like
debt providers, equity providers also earn returns in form of dividends from the profits generated by the firm
(Titman et al., 2011). Preference shareholders receive their dividends at an agreed rate before the ordinary
shareholders and any un-appropriated profit is retained for firm‟s expansion programs (Titman et al., 2011). Suffice
to say that a good financial performance leads to a high retention. If a firm reports a loss, then it has a retained loss
which reduces the shareholders‟ funds. In terms of measurement of equity, preference stock, ordinary stock and
retained earnings will be used. The study used the ratio of Owners‟ Equity to Total Net assets to measure for firm‟s
equity.
According to Dare and Sola (2010), Ishaya and Abduljeleel (2014) when firms combine debt and equity in their
capital structure, they enjoy the benefits of combined debt and equity. The cash flows generated are shared between
equity and debt providers. Financial structure decisions assist in maximizing shareholders‟ wealth due to their
impact on sustainability and ability to satisfy external objectives of a firm (Ishaya & Abduljeleel, 2014). The
concept of Assets structure also becomes important in this study. The financial structure of a firm determines the
asset structure of a firm and by extension the firm size. Asset structure has been defined using various aspects by
different scholars based on the direction of the study. According to Koralun-Bereźnicka (2013) asset structure is a
combination of the various asset components which were identified as: financial fixed assets; tangible fixed assets;
current assets; and current investments and cash in hand and at bank. This affects the financial structure of a
company significantly. A similar approach is taken by Schmidt (2014), where asset structure is described in terms
of: current assets; long term investments and funds; Property, Plant and Equipment; intangible assets; and others
assets. The assets structure is comprised of total assets, which gives the firm size.
According to Lievenbruck and Schmidt (2014), firm size has important economic impact in any financial policies
and hence an important predictor of the financial performance as it helps in achieving economies of scale. Larger
firms show better profitability while smaller firms do not have the ability to compete with larger firms in this
Gathara et al….. Int. J. Innovative Finance and Economics Res. 7(1):10-33, 2019
13
regards. The size of the firm is represented by total net assets and computed as natural log of total net assets. This
will be used as the moderating variable of the study to evaluate if its introduction can enhance performance.
Financial Performance
A firm‟s financial performance refers to a firm‟s ability to generate new resources from day to day operations over a
given period (Bora, 2008). It involves enhancing shareholders‟ wealth and profit making which are among the major
objectives of a firm (Pandey, 2005). Accounting ratios derived from the balance sheet and income statement and
also from data on stock market prices, are used to measure how better off a shareholder has become over time
(Berger & Patti, 2002). The growth in firms‟ sales, the improvement in their profit margin, their capital investment
decisions and capital structure decisions mainly influence the shareholder‟s wealth (Arnott & Asness, 2003).
Various indicators have been used to measure the financial performance of the firms by various scholars. The
various ways of measuring company‟s financial performance are reflected in the company‟s ratios of Return on
Investment (ROI), Return on Assets (ROA), Return on Equity (ROE), value added, among others which measure
whether the owners „objectives are being met; the objectives of increasing shareholders‟ wealth through investing in
business. Therefore, financial performance is a general measure of a firm‟s overall financial health over a given
period, and can be used to compare similar firms across the same industry or to compare industries or sectors in
aggregation.
A study by Okwo et al., (2012), used operating profit margin to measure financial performance of firms within the
brewery sector. Olatunji et al., (2014) used Net profit of the commercial banks as the measure of their financial
performance. A study by Wamugo et al., (2014), on the relationship between capital structure and performance of
non-financial listed firms, used ROA and ROE as the indicators of Firm performance. The current study developed
an all profitability ratios index for financial performance by computing a simple average for return on assets, return
on equity and profit margin (return on sales) of the firms under study. This approach was also taken by the study on
the effects of asset structure on the financial performance of listed manufacturing firms where an evaluation of
financial performance of these firms was through the use of ROA and ROE (Mawih, 2014).
The Nairobi Securities Exchange
According to NSE (2015), trading in securities was informal, manual and was purely on a gentleman‟s agreement
until 1954 when the Nairobi Stock Exchange was constituted as a voluntary association of stockbrokers registered
under the Societies Act. From the first privatization of 20% government stake in Kenya Commercial Bank (KCB) in
1988, NSE has grown in trading volumes, boosted by among others efficient settlement of deals though automated
trading system introduced in in September 2006. The market capitalization of the already demutualized (on July
2014) NSE as at the last day of trading in 2014 was over sh. 2.2 Trillion with 64 firms listed. The Nairobi 20-Share
Index had as at end of 2014 surpassed the 5000 points mark, an indication of the huge capital mobilization through
NSE. Bonds of sh. 494 billion were issued in 2014 up from sh. 253 billion in 2013 (NSE, 2015). Nairobi Securities
Exchange plays an important role in the process of economic development and helps in mobilizing domestic savings
which bringing about the reallocation of financial resources. It has also facilitated transfer of securities between
shareholders by making long-term liquid. It also enabled companies to engage local participation in their equity,
thereby giving Kenyans a chance to own shares. Companies can also raise extra finance which is essential for
expansion and development. Nairobi Securities Exchange also enhances the inflow of international capital. They can
also be useful tools for privatization programs.
Statement of the Problem
The period starting 2007 saw majority of companies experiencing financing difficulties due financial crisis that hit
most parts of the world including Kenya. Management of these companies was concerned with whether the
companies‟ financing decisions affected their financial performance and especially at that time when majority of the
companies were facing financial crisis. The components of financial structure include leverage, liquidity and equity,
liquidity being current assets minus current liabilities. Majority of studies investigating the effect of financial
structure on performance have investigated individual components of financial structure at a time and therefore
failing to link all the components of financial structure and their effect on financial performance in one study.
Similarly, majority of the studies used measures of profitability, ROA, ROE, ROS and others to proxy for financial
performance and failed to come up with a unique measure of financial performance, which generated mixed results.
Studies done so far, for instance, focused on the effects of financial leverage on performance alone (Mwangi et al.,
2014) and measured performance as either ROA or ROE. Haq, Sohail, Zaman and Alam (2011), in their studies
examined the influence of liquidity on return on assets while Ishaya and Abduljeleel (2014) studied the direct effect
of debt on profitability and equity and profitability. The existing literature in Kenya lacked a specific study that
investigated the effect of leverage on financial structure on financial performance for listed companies in Kenya.
The need to study leverage, as an element of financial structure and its effect on financial performance of NSE
Listed Companies motivated this study.
Objectives of the Study
Gathara et al….. Int. J. Innovative Finance and Economics Res. 7(1):10-33, 2019
14
The main objective of the study was to investigate the effect of financial structure on performance of selected
companies listed at (NSE), Kenya. The Specific objective of the study was to determine the effect of leverage on
performance of selected companies listed at NSE, Kenya.
METHODOLOGY
This study adopted a positivism research philosophy. The philosophy focuses on objectivity, where the researcher is
independent of the research project, free of bias and personal value, without influence on the data or research results
Creswell (2003). The study adopted a causal or explanatory research design due to the nature of problem and
availability of data. The study targeted all the 39 selected companies listed under selected sectors of Nairobi
securities exchange, Kenya as at 31st December 2016. These companies were drawn from seven sectors of the
economy comprising of Agricultural sector, Commercial services sector, Telecommunications sector, Automobiles
sector, Manufacturing and Allied sectors, Construction and Allied sector and Energy and Petroleum sector of NSE.
Census sampling was done for all the thirty-nine firms in these seven sectors. The study was also guided by a panel
regression model that involved analyzing the explanatory variables and the moderating variable to analyze the effect
of financial structure on financial performance of selected companies listed at NSE, Kenya. A research permit
obtained from National Commission for Science, Technology and Innovation allowed for the utilization of
secondary data from published financial statements of selected companies listed on the NSE, Kenya. The data
consisted of time series (years 2007 to 2015) and cross-sections (companies). The study used descriptive statistics,
correlation analysis and panel linear multiple regression analysis. Regression coefficients were tested for
significance using t-statistic at 5% level of significance and conclusions drawn.
THEORETICAL LITERATURE REVIEW
This study was underpinned by capital Structure theories. These theories included, the pecking order theory, the
stakeholder theory, Modigliani and Miller theory, agency cost theory and the trade-off Theory. The pecking order
theory by Myers (1984) posit that in designing their capital structure, businesses should first use internally generated
funds, followed by external debt and finally the external equity. The stakeholder theory by Freeman (1984) looks at
the equilibrium of stakeholder interests as the main determinant of corporate policy while the Modigliani and Miller
theory by Modigliani and Miller (1958), states that, without taxes and under assumptions of perfect markets, capital
structure financing decisions are irrelevant since the value of the levered firm is equal to the value of the unlevered
firm. The agency theory on the other hand by Jensen and Meckling (1976), argues that a firm‟s optimal capital
structure will depend on the value of debt which helps mitigate conflicts among stakeholders. This theory is based
on the various forms of financial structures that may exist in a company, as well as the various financial
performance measures. The Trade-off theory advocates that firms‟ management should emphasis favorable liquidity
level to balance the costs and benefits of cash holdings. The cost of cash holdings is the low yield of these liquid
assets because of liquidity premium and tax disadvantages (Ajao & Small, 2012).
Empirical Literature Review
Empirical Literature is reviewed in this section. Zikmund, Babin, Carr and Griffin (2010), indicated that empirical
literature review is a directed search of published works, including periodicals and books that discuss theories and
present empirical findings by other scholars that are relevant to the research topic under study. It therefore provides
a platform for analyzing the variables, their relationships and to critique the findings where necessary.
Effect of Leverage on Performance
Researchers have reported various empirical findings on the effect of financial structure and performance.
Mwangi et al., (2014) studied the relationship between capital structure and performance of non-financial companies
listed in the Nairobi Securities Exchange in Kenya. The study employed an explanatory non-experimental research
design. A census of non-financial companies listed in the Nairobi Securities Exchange, Kenya was taken. The study
used secondary panel data contained in the annual reports and financial statements of listed non-financial companies
for the period 2006-2012. The study concluded that increased financial leverage has a negative effect on
performance. However, the study only considered leverage and did not study other components of financial structure
that influence performance like firm size, liquidity and integrate in the study. Khalid et al., (2014) investigated non-
financial firms listed on Karachi Stock Exchange. The used panel data spans from 1988-2008. The study found that
in Pakistan leverage has positive significant impact on corporate performance. Almajali et al., (2012) studied
financial performance of Jordanian Insurance Companies listed at Amman Stock Exchange during period (2002 –
2007). The results showed that the leverage, size and liquidity have a positive statistical effect on the financial
performance of Jordanian Insurance Companies.
Hasan et al., (2014) investigated Bangladeshi firms listed in Dhaka Stock Exchange during the period 2007 to 2012.
They used ROA, EPS and Tobin‟s Q to measure performance. They found that there is significant negative
Gathara et al….. Int. J. Innovative Finance and Economics Res. 7(1):10-33, 2019
15
correlation between ROA and Capital leverage. While there is no significant relationship between leverage and
firm‟s performance as measured by ROE and Tobin‟s Q. They associated the negative relationship to higher cost of
debt and strong covenants attached to the use of debt. Mahmoudi (2014) conducted a study using panel data from
cement firms listed at the Tehran Stock Exchange for a period from 2008 to 2011. He investigated the effects of
leverage on firm‟s profitability measured by ROA and ROE. He found a significant negative relationship between
leverage and firm profitability. Siahaan et al., (2014) conducted a study research on listed firms at the Indonesia
Stock Exchange. The firms were clustered into two, 30 firms as the large listed firms and another cluster of 30 firms
listed as small firms. He found that large firms had an insignificant positive relationship between leverage and firm
value but a significant negative relationship for small firms.
Tsuji (2013) studied the relationship between firm capital structure and profitability in the Japanese machinery firms
listed on Tokyo Stock Exchange using panel data from 1981-2011. The results showed that leverage has a negative
relationship with profitability. Dogan (2013) investigated firm profitability of 200 companies listed at the Istanbul
stock exchange using data from 2008 to 2011 by a multivariate regression model. He found that liquidity was
positively related to profitability as measured by ROA while leverage was negatively related to profitability.
Abbasali and Esfandiar (2012) investigated the impact of capital structure on the financial performance of
companies listed in the Tehran Stock Exchange and tested a sample of 400 firm. They concluded that there was a
significant negative relationship between debt ratio and financial performance of companies, and a significant
positive relationship between asset turnover, firm size, asset tangibility ratio, and growth opportunities with financial
performance measures. The study tested all sectors and did not isolate the financial sectors whose objective in use of
derivative is both for risk hedging and for speculation to make profits.
Abdul (2012) studied the relationship between capital structure decisions and the performance of firms in Pakistan.
ROA, GM, and Tobin‟s Q were used to measure firm performance and he concluded that financial leverage had a
significant negative relationship with firm performance while there was negative but not statistically significant
relationship between financial leverage and firm performance when measured as return on equity (ROE). Majority
of these studies looked at the effect of Leverage on specific measures of profitability and performance mainly ROA,
ROI, ROE, Tobin Q, EPS and Profit Margin but failed to obtain an average measure of financial performance to take
care of the various stakeholders‟ interests. Additionally, majority of these studies looked at leverage as the only
component of financial structure and failed to incorporate other components in their studies. This is the gap that this
study aims to cover by incorporating the various components of financial structure in the study and taking care of all
stakeholder interests by incorporating various measures of profitability in measuring financial performance.
RESULTS Leverage, as a component of the financial structure of a firm focus on the ratio of long term debt to total net assets.
The computed ratios for the companies, sectors, industry aggregates and 9-year annual averages are presented in
Tables 1, 2, 3 and Figures 1, 2 and 3. From the table, the mean value for leverage for the 9-year period is 0.2515
(25.15%) and the standard deviation of 0.2096. Leverage represents the organizations debt ratio measured as Total
Non-Current Liabilities to Total Net Assets. According to this finding, 25.15% is relatively moderate average.
Gathara et al….. Int. J. Innovative Finance and Economics Res. 7(1):10-33, 2019
16
Table 1: Companywide Average for Leverage
Company Mean Std. Dev Median Maximum Minimum Skewness Kurtosis
1 0.157778 0.067598 0.15 0.23 0.06 -0.23616 1.5507
2 0.227778 0.059745 0.2 0.35 0.18 1.154179 2.930124
3 0.256667 0.018028 0.25 0.28 0.24 0.528005 1.5
4 0.213333 0.033166 0.22 0.28 0.17 0.714707 2.868285
5 0.213333 0.047697 0.23 0.27 0.13 -0.65165 1.986898
6 0.186667 0.020616 0.19 0.22 0.15 -0.07062 2.66263
7 0.165556 0.086039 0.18 0.29 0.02 -0.46702 2.29643
8 0.248889 0.295992 0.06 0.76 0 0.741998 1.977781
9 0.05 0.020616 0.05 0.07 0 -1.63428 5.122837
10 0.437778 0.120497 0.47 0.65 0.22 -0.10106 2.946871
11 0.666667 0.153216 0.62 1.06 0.57 2.139515 6.171369
12 0.025556 0.018105 0.02 0.07 0.01 1.781823 5.266375
13 0.031111 0.025712 0.03 0.07 0 0.150986 1.674617
14 0.305556 0.124108 0.29 0.47 0.09 -0.12347 2.165259
15 0.283333 0.043012 0.29 0.33 0.21 -0.74202 2.197407
16 0.561111 0.070966 0.53 0.65 0.47 0.02845 1.332876
17 0.168889 0.047813 0.15 0.27 0.13 1.375447 3.297053
18 0.067778 0.040859 0.08 0.11 0 -0.71696 1.940829
19 0.457778 0.080588 0.45 0.6 0.3 -0.21217 3.490987
20 0.067778 0.041767 0.05 0.12 0.02 0.154922 1.328254
21 0.594444 0.366166 0.53 1.52 0.31 2.000421 5.847376
22 0.523333 0.158588 0.56 0.81 0.25 0.106328 2.84724
23 0.231111 0.17546 0.25 0.51 0.06 0.410924 1.738537
24 0.232222 0.039299 0.24 0.27 0.17 -0.46411 1.733402
25 0.386667 0.322102 0.21 0.76 0.09 0.212927 1.115424
26 0.248889 0.13779 0.21 0.54 0.06 1.020853 3.46562
27 0.226667 0.064031 0.27 0.29 0.12 -0.47506 1.631953
28 0.104444 0.045308 0.1 0.17 0.02 -0.23058 2.669263
29 0.107757 0.015632 0.11 0.13 0.09 0.182324 1.855769
30 0.096667 0.049244 0.11 0.15 0 -0.79345 2.551228
Industry Aggregate 0.251518 0.209637 0.21 1.52 0 1.634733 7.755598
Source: Survey Data (2018).
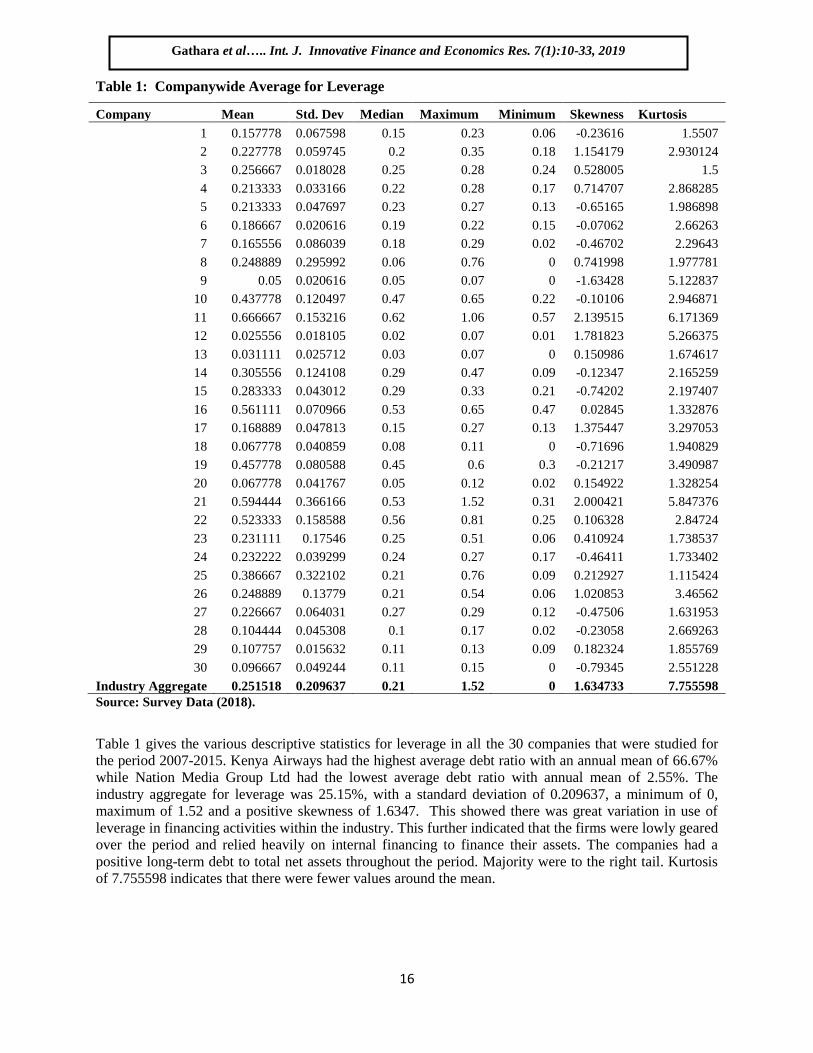
Table 1 gives the various descriptive statistics for leverage in all the 30 companies that were studied for
the period 2007-2015. Kenya Airways had the highest average debt ratio with an annual mean of 66.67%
while Nation Media Group Ltd had the lowest average debt ratio with annual mean of 2.55%. The
industry aggregate for leverage was 25.15%, with a standard deviation of 0.209637, a minimum of 0,
maximum of 1.52 and a positive skewness of 1.6347. This showed there was great variation in use of
leverage in financing activities within the industry. This further indicated that the firms were lowly geared
over the period and relied heavily on internal financing to finance their assets. The companies had a
positive long-term debt to total net assets throughout the period. Majority were to the right tail. Kurtosis
of 7.755598 indicates that there were fewer values around the mean.
Gathara et al….. Int. J. Innovative Finance and Economics Res. 7(1):10-33, 2019
17
-
0.100
0.200
0.300
0.400
0.500
0.600
0.700
1 2 3 4 5 6 7 8 9 10 11 12 13 14 15 16 17 18 19 20 21 22 23 24 25 26 27 28 29 30
LEV
ER
AG
E -
ME
AN
COMPANY
LEVERAGE-MEAN DEBT RATIO PER COMPANY.
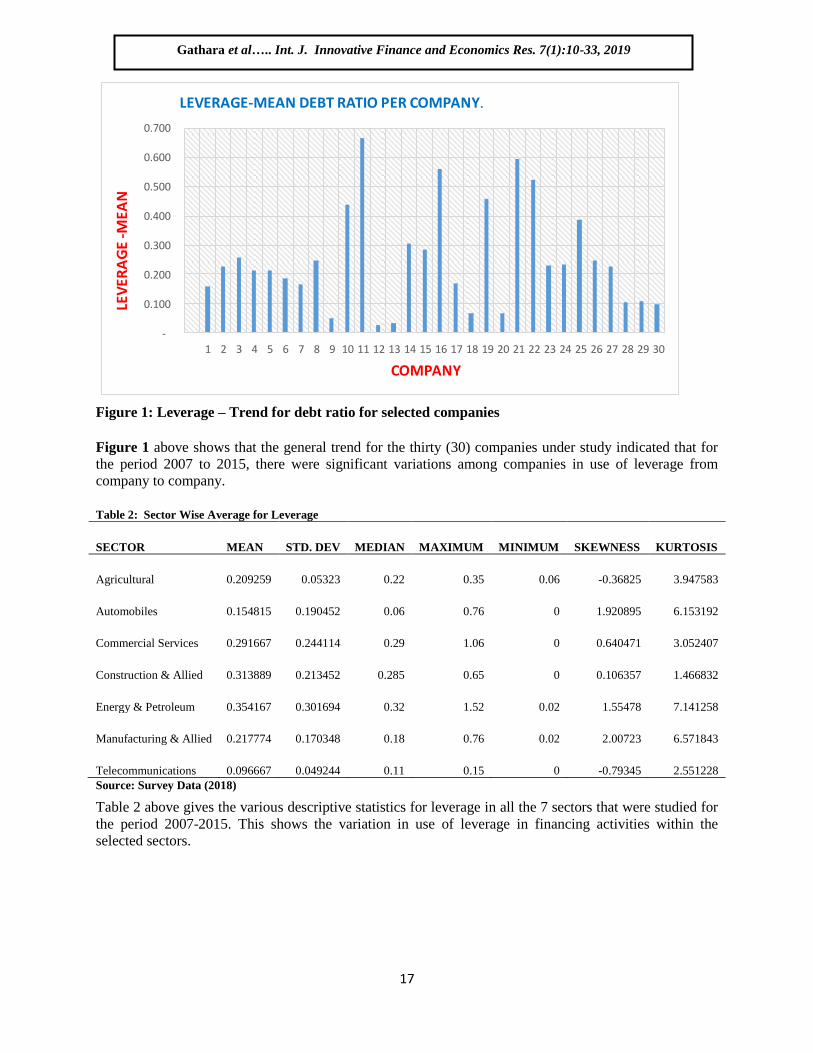
Figure 1: Leverage – Trend for debt ratio for selected companies
Figure 1 above shows that the general trend for the thirty (30) companies under study indicated that for
the period 2007 to 2015, there were significant variations among companies in use of leverage from
company to company.
Table 2: Sector Wise Average for Leverage
SECTOR MEAN STD. DEV MEDIAN MAXIMUM MINIMUM SKEWNESS KURTOSIS
Agricultural 0.209259 0.05323 0.22 0.35 0.06 -0.36825 3.947583
Automobiles 0.154815 0.190452 0.06 0.76 0 1.920895 6.153192
Commercial Services 0.291667 0.244114 0.29 1.06 0 0.640471 3.052407
Construction & Allied 0.313889 0.213452 0.285 0.65 0 0.106357 1.466832
Energy & Petroleum 0.354167 0.301694 0.32 1.52 0.02 1.55478 7.141258
Manufacturing & Allied 0.217774 0.170348 0.18 0.76 0.02 2.00723 6.571843
Telecommunications 0.096667 0.049244 0.11 0.15 0 -0.79345 2.551228
Source: Survey Data (2018)
Table 2 above gives the various descriptive statistics for leverage in all the 7 sectors that were studied for
the period 2007-2015. This shows the variation in use of leverage in financing activities within the
selected sectors.
Gathara et al….. Int. J. Innovative Finance and Economics Res. 7(1):10-33, 2019
18
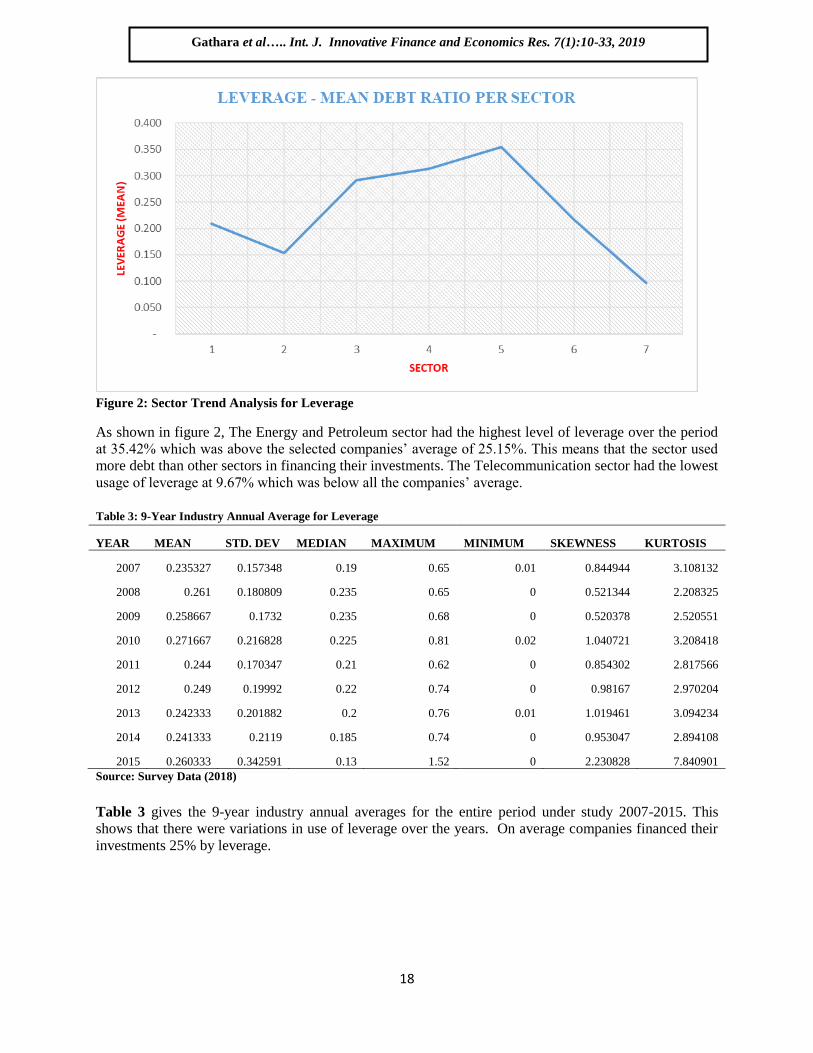
Figure 2: Sector Trend Analysis for Leverage
As shown in figure 2, The Energy and Petroleum sector had the highest level of leverage over the period
at 35.42% which was above the selected companies‟ average of 25.15%. This means that the sector used
more debt than other sectors in financing their investments. The Telecommunication sector had the lowest
usage of leverage at 9.67% which was below all the companies‟ average.
Table 3: 9-Year Industry Annual Average for Leverage
YEAR MEAN STD. DEV MEDIAN MAXIMUM MINIMUM SKEWNESS KURTOSIS
2007 0.235327 0.157348 0.19 0.65 0.01 0.844944 3.108132
2008 0.261 0.180809 0.235 0.65 0 0.521344 2.208325
2009 0.258667 0.1732 0.235 0.68 0 0.520378 2.520551
2010 0.271667 0.216828 0.225 0.81 0.02 1.040721 3.208418
2011 0.244 0.170347 0.21 0.62 0 0.854302 2.817566
2012 0.249 0.19992 0.22 0.74 0 0.98167 2.970204
2013 0.242333 0.201882 0.2 0.76 0.01 1.019461 3.094234
2014 0.241333 0.2119 0.185 0.74 0 0.953047 2.894108
2015 0.260333 0.342591 0.13 1.52 0 2.230828 7.840901
Source: Survey Data (2018)
Table 3 gives the 9-year industry annual averages for the entire period under study 2007-2015. This
shows that there were variations in use of leverage over the years. On average companies financed their
investments 25% by leverage.
Gathara et al….. Int. J. Innovative Finance and Economics Res. 7(1):10-33, 2019
19
0.210
0.220
0.230
0.240
0.250
0.260
0.270
0.280
2007 2008 2009 2010 2011 2012 2013 2014 2015
LEV
ERA
GE
(ME
AN
)
YEAR
MEAN LEVERAGE -INDUSTRY ANNUAL TREND
ANALYSIS
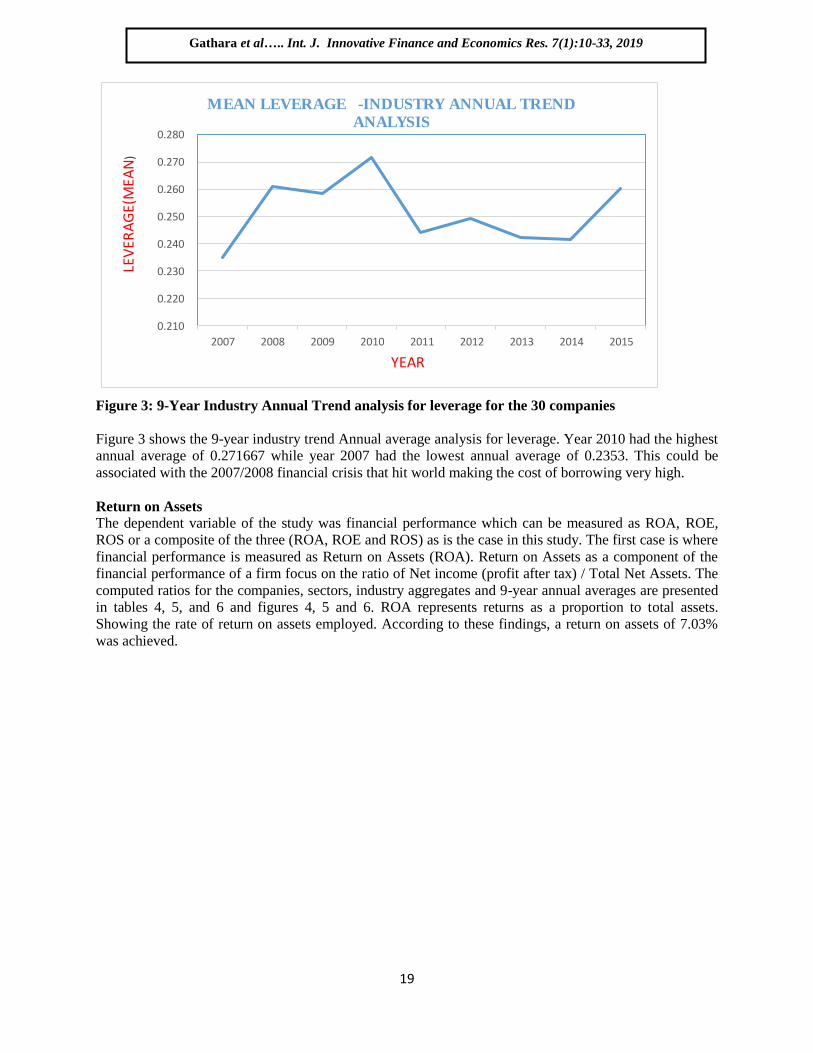
Figure 3: 9-Year Industry Annual Trend analysis for leverage for the 30 companies
Figure 3 shows the 9-year industry trend Annual average analysis for leverage. Year 2010 had the highest
annual average of 0.271667 while year 2007 had the lowest annual average of 0.2353. This could be
associated with the 2007/2008 financial crisis that hit world making the cost of borrowing very high.
Return on Assets
The dependent variable of the study was financial performance which can be measured as ROA, ROE,
ROS or a composite of the three (ROA, ROE and ROS) as is the case in this study. The first case is where
financial performance is measured as Return on Assets (ROA). Return on Assets as a component of the
financial performance of a firm focus on the ratio of Net income (profit after tax) / Total Net Assets. The
computed ratios for the companies, sectors, industry aggregates and 9-year annual averages are presented
in tables 4, 5, and 6 and figures 4, 5 and 6. ROA represents returns as a proportion to total assets.
Showing the rate of return on assets employed. According to these findings, a return on assets of 7.03%
was achieved.
Gathara et al….. Int. J. Innovative Finance and Economics Res. 7(1):10-33, 2019
20
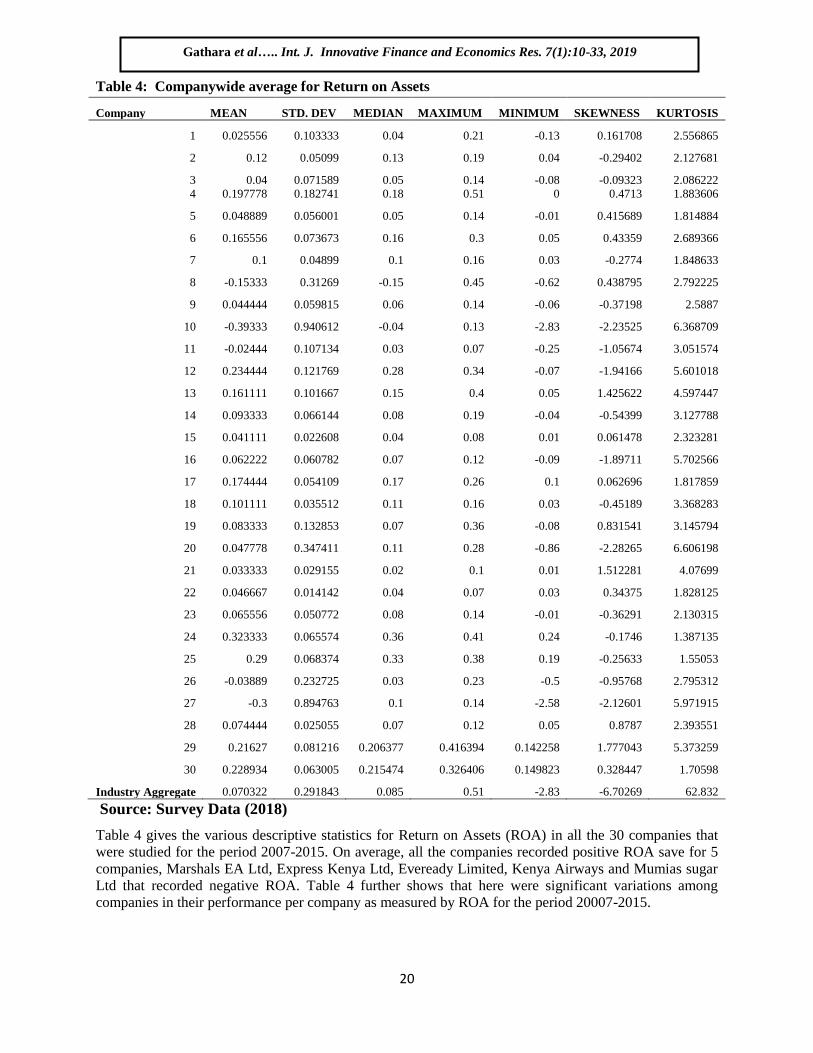
Table 4: Companywide average for Return on Assets
Company MEAN STD. DEV MEDIAN MAXIMUM MINIMUM SKEWNESS KURTOSIS
1 0.025556 0.103333 0.04 0.21 -0.13 0.161708 2.556865
2 0.12 0.05099 0.13 0.19 0.04 -0.29402 2.127681
3 0.04 0.071589 0.05 0.14 -0.08 -0.09323 2.086222
4 0.197778 0.182741 0.18 0.51 0 0.4713 1.883606
5 0.048889 0.056001 0.05 0.14 -0.01 0.415689 1.814884
6 0.165556 0.073673 0.16 0.3 0.05 0.43359 2.689366
7 0.1 0.04899 0.1 0.16 0.03 -0.2774 1.848633
8 -0.15333 0.31269 -0.15 0.45 -0.62 0.438795 2.792225
9 0.044444 0.059815 0.06 0.14 -0.06 -0.37198 2.5887
10 -0.39333 0.940612 -0.04 0.13 -2.83 -2.23525 6.368709
11 -0.02444 0.107134 0.03 0.07 -0.25 -1.05674 3.051574
12 0.234444 0.121769 0.28 0.34 -0.07 -1.94166 5.601018
13 0.161111 0.101667 0.15 0.4 0.05 1.425622 4.597447
14 0.093333 0.066144 0.08 0.19 -0.04 -0.54399 3.127788
15 0.041111 0.022608 0.04 0.08 0.01 0.061478 2.323281
16 0.062222 0.060782 0.07 0.12 -0.09 -1.89711 5.702566
17 0.174444 0.054109 0.17 0.26 0.1 0.062696 1.817859
18 0.101111 0.035512 0.11 0.16 0.03 -0.45189 3.368283
19 0.083333 0.132853 0.07 0.36 -0.08 0.831541 3.145794
20 0.047778 0.347411 0.11 0.28 -0.86 -2.28265 6.606198
21 0.033333 0.029155 0.02 0.1 0.01 1.512281 4.07699
22 0.046667 0.014142 0.04 0.07 0.03 0.34375 1.828125
23 0.065556 0.050772 0.08 0.14 -0.01 -0.36291 2.130315
24 0.323333 0.065574 0.36 0.41 0.24 -0.1746 1.387135
25 0.29 0.068374 0.33 0.38 0.19 -0.25633 1.55053
26 -0.03889 0.232725 0.03 0.23 -0.5 -0.95768 2.795312
27 -0.3 0.894763 0.1 0.14 -2.58 -2.12601 5.971915
28 0.074444 0.025055 0.07 0.12 0.05 0.8787 2.393551
29 0.21627 0.081216 0.206377 0.416394 0.142258 1.777043 5.373259
30 0.228934 0.063005 0.215474 0.326406 0.149823 0.328447 1.70598
Industry Aggregate 0.070322 0.291843 0.085 0.51 -2.83 -6.70269 62.832
Source: Survey Data (2018)
Table 4 gives the various descriptive statistics for Return on Assets (ROA) in all the 30 companies that
were studied for the period 2007-2015. On average, all the companies recorded positive ROA save for 5
companies, Marshals EA Ltd, Express Kenya Ltd, Eveready Limited, Kenya Airways and Mumias sugar
Ltd that recorded negative ROA. Table 4 further shows that here were significant variations among
companies in their performance per company as measured by ROA for the period 20007-2015.
Gathara et al….. Int. J. Innovative Finance and Economics Res. 7(1):10-33, 2019
21
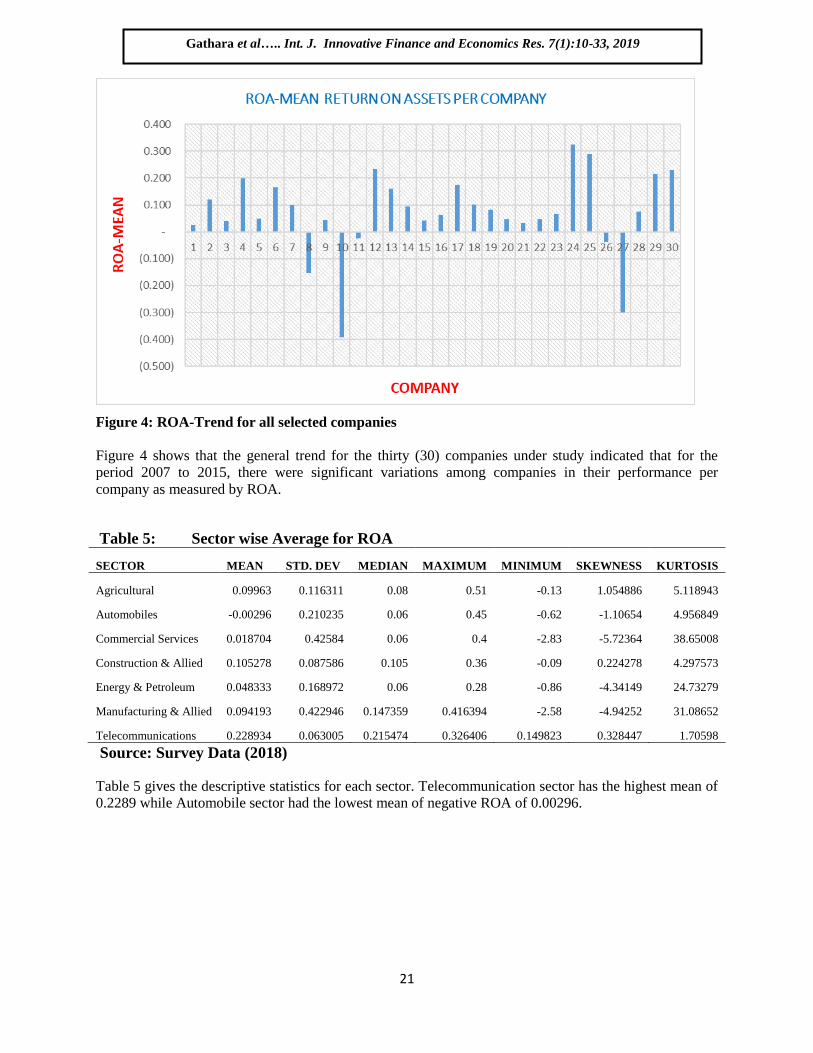
Figure 4: ROA-Trend for all selected companies
Figure 4 shows that the general trend for the thirty (30) companies under study indicated that for the
period 2007 to 2015, there were significant variations among companies in their performance per
company as measured by ROA.
Table 5: Sector wise Average for ROA
SECTOR MEAN STD. DEV MEDIAN MAXIMUM MINIMUM SKEWNESS KURTOSIS
Agricultural 0.09963 0.116311 0.08 0.51 -0.13 1.054886 5.118943
Automobiles -0.00296 0.210235 0.06 0.45 -0.62 -1.10654 4.956849
Commercial Services 0.018704 0.42584 0.06 0.4 -2.83 -5.72364 38.65008
Construction & Allied 0.105278 0.087586 0.105 0.36 -0.09 0.224278 4.297573
Energy & Petroleum 0.048333 0.168972 0.06 0.28 -0.86 -4.34149 24.73279
Manufacturing & Allied 0.094193 0.422946 0.147359 0.416394 -2.58 -4.94252 31.08652
Telecommunications 0.228934 0.063005 0.215474 0.326406 0.149823 0.328447 1.70598
Source: Survey Data (2018)
Table 5 gives the descriptive statistics for each sector. Telecommunication sector has the highest mean of
0.2289 while Automobile sector had the lowest mean of negative ROA of 0.00296.
Gathara et al….. Int. J. Innovative Finance and Economics Res. 7(1):10-33, 2019
22
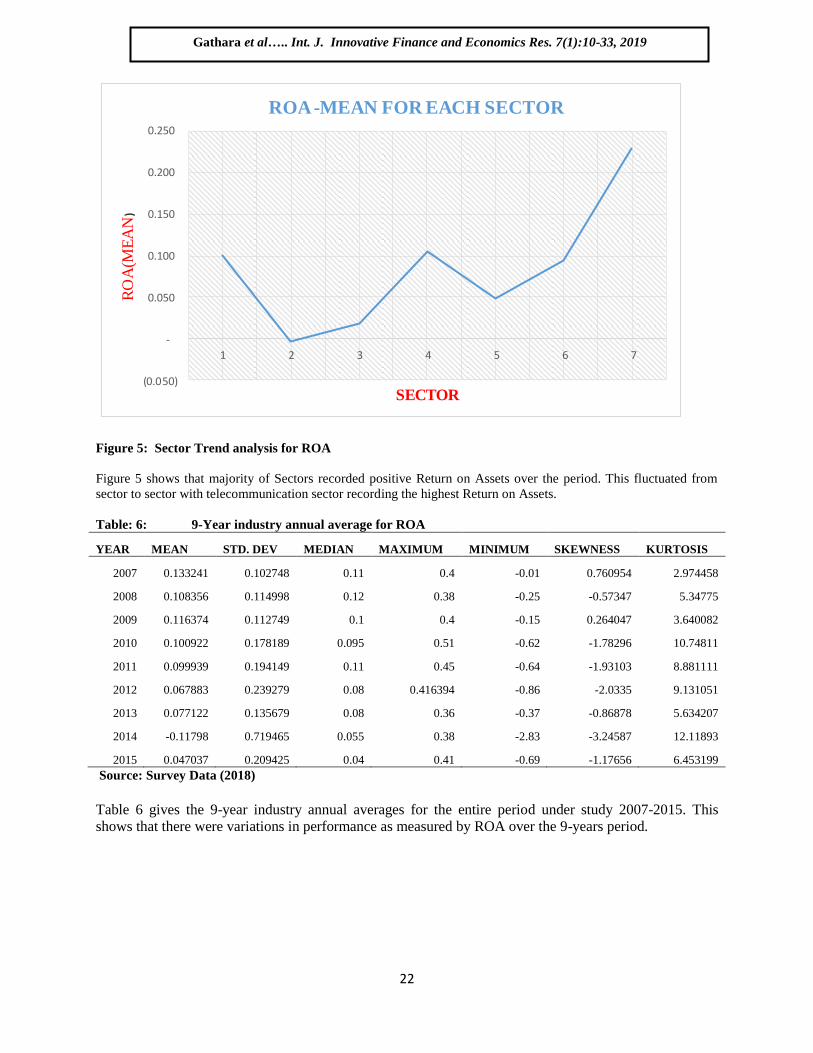
Figure 5: Sector Trend analysis for ROA
Figure 5 shows that majority of Sectors recorded positive Return on Assets over the period. This fluctuated from
sector to sector with telecommunication sector recording the highest Return on Assets.
Table: 6: 9-Year industry annual average for ROA
YEAR MEAN STD. DEV MEDIAN MAXIMUM MINIMUM SKEWNESS KURTOSIS
2007 0.133241 0.102748 0.11 0.4 -0.01 0.760954 2.974458
2008 0.108356 0.114998 0.12 0.38 -0.25 -0.57347 5.34775
2009 0.116374 0.112749 0.1 0.4 -0.15 0.264047 3.640082
2010 0.100922 0.178189 0.095 0.51 -0.62 -1.78296 10.74811
2011 0.099939 0.194149 0.11 0.45 -0.64 -1.93103 8.881111
2012 0.067883 0.239279 0.08 0.416394 -0.86 -2.0335 9.131051
2013 0.077122 0.135679 0.08 0.36 -0.37 -0.86878 5.634207
2014 -0.11798 0.719465 0.055 0.38 -2.83 -3.24587 12.11893
2015 0.047037 0.209425 0.04 0.41 -0.69 -1.17656 6.453199
Source: Survey Data (2018)
Table 6 gives the 9-year industry annual averages for the entire period under study 2007-2015. This
shows that there were variations in performance as measured by ROA over the 9-years period.
(0.050)
-
0.050
0.100
0.150
0.200
0.250
1 2 3 4 5 6 7
RO
A(M
EA
N)
SECTOR
ROA -MEAN FOR EACH SECTOR
Gathara et al….. Int. J. Innovative Finance and Economics Res. 7(1):10-33, 2019
23
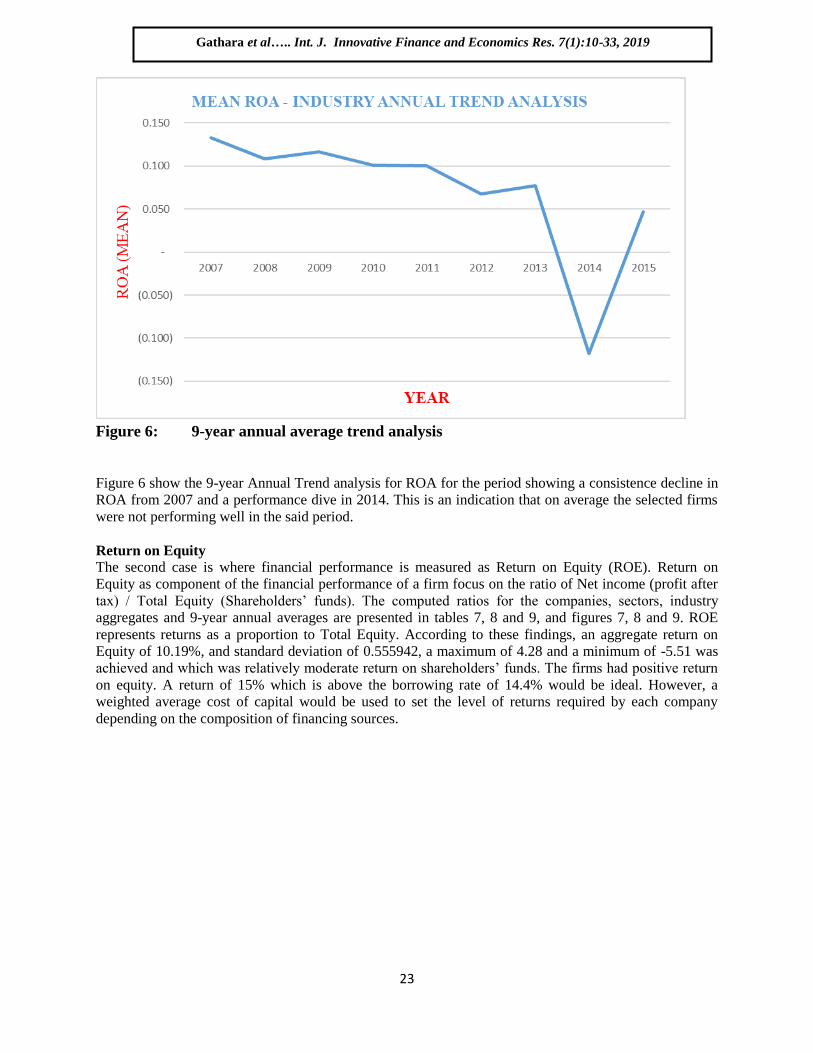
Figure 6: 9-year annual average trend analysis
Figure 6 show the 9-year Annual Trend analysis for ROA for the period showing a consistence decline in
ROA from 2007 and a performance dive in 2014. This is an indication that on average the selected firms
were not performing well in the said period.
Return on Equity
The second case is where financial performance is measured as Return on Equity (ROE). Return on
Equity as component of the financial performance of a firm focus on the ratio of Net income (profit after
tax) / Total Equity (Shareholders‟ funds). The computed ratios for the companies, sectors, industry
aggregates and 9-year annual averages are presented in tables 7, 8 and 9, and figures 7, 8 and 9. ROE
represents returns as a proportion to Total Equity. According to these findings, an aggregate return on
Equity of 10.19%, and standard deviation of 0.555942, a maximum of 4.28 and a minimum of -5.51 was
achieved and which was relatively moderate return on shareholders‟ funds. The firms had positive return
on equity. A return of 15% which is above the borrowing rate of 14.4% would be ideal. However, a
weighted average cost of capital would be used to set the level of returns required by each company
depending on the composition of financing sources.
Gathara et al….. Int. J. Innovative Finance and Economics Res. 7(1):10-33, 2019
24
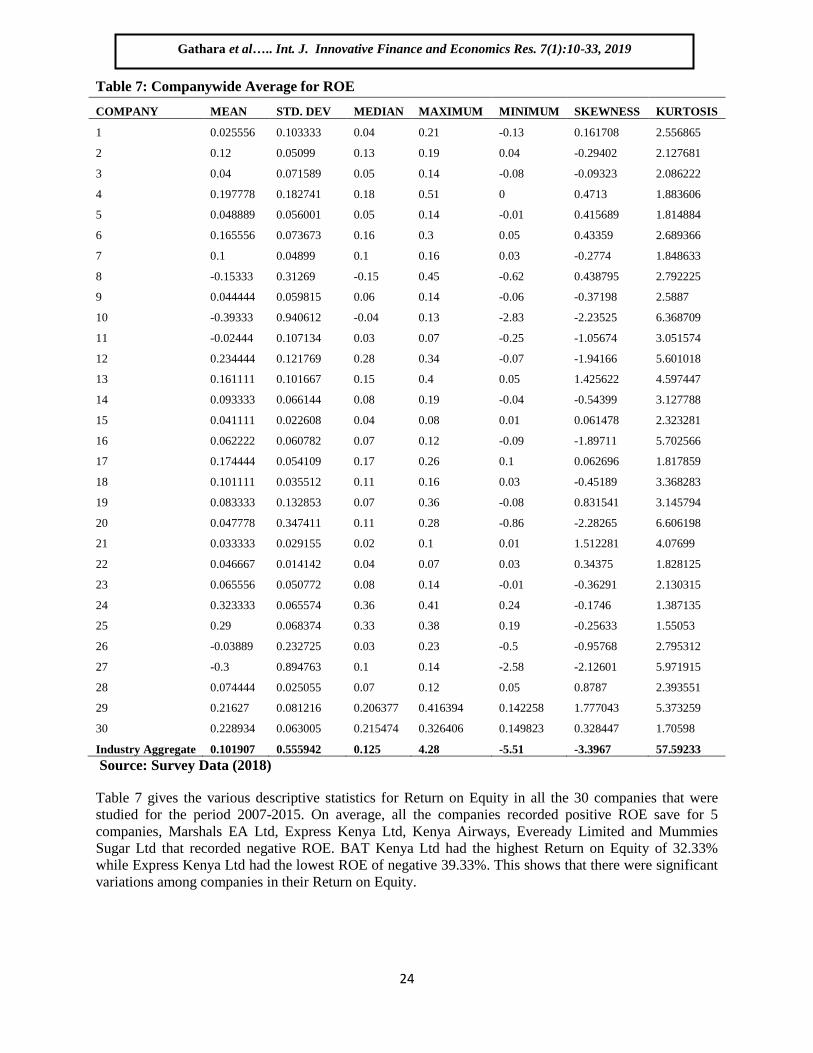
Table 7: Companywide Average for ROE
COMPANY MEAN STD. DEV MEDIAN MAXIMUM MINIMUM SKEWNESS KURTOSIS
1 0.025556 0.103333 0.04 0.21 -0.13 0.161708 2.556865
2 0.12 0.05099 0.13 0.19 0.04 -0.29402 2.127681
3 0.04 0.071589 0.05 0.14 -0.08 -0.09323 2.086222
4 0.197778 0.182741 0.18 0.51 0 0.4713 1.883606
5 0.048889 0.056001 0.05 0.14 -0.01 0.415689 1.814884
6 0.165556 0.073673 0.16 0.3 0.05 0.43359 2.689366
7 0.1 0.04899 0.1 0.16 0.03 -0.2774 1.848633
8 -0.15333 0.31269 -0.15 0.45 -0.62 0.438795 2.792225
9 0.044444 0.059815 0.06 0.14 -0.06 -0.37198 2.5887
10 -0.39333 0.940612 -0.04 0.13 -2.83 -2.23525 6.368709
11 -0.02444 0.107134 0.03 0.07 -0.25 -1.05674 3.051574
12 0.234444 0.121769 0.28 0.34 -0.07 -1.94166 5.601018
13 0.161111 0.101667 0.15 0.4 0.05 1.425622 4.597447
14 0.093333 0.066144 0.08 0.19 -0.04 -0.54399 3.127788
15 0.041111 0.022608 0.04 0.08 0.01 0.061478 2.323281
16 0.062222 0.060782 0.07 0.12 -0.09 -1.89711 5.702566
17 0.174444 0.054109 0.17 0.26 0.1 0.062696 1.817859
18 0.101111 0.035512 0.11 0.16 0.03 -0.45189 3.368283
19 0.083333 0.132853 0.07 0.36 -0.08 0.831541 3.145794
20 0.047778 0.347411 0.11 0.28 -0.86 -2.28265 6.606198
21 0.033333 0.029155 0.02 0.1 0.01 1.512281 4.07699
22 0.046667 0.014142 0.04 0.07 0.03 0.34375 1.828125
23 0.065556 0.050772 0.08 0.14 -0.01 -0.36291 2.130315
24 0.323333 0.065574 0.36 0.41 0.24 -0.1746 1.387135
25 0.29 0.068374 0.33 0.38 0.19 -0.25633 1.55053
26 -0.03889 0.232725 0.03 0.23 -0.5 -0.95768 2.795312
27 -0.3 0.894763 0.1 0.14 -2.58 -2.12601 5.971915
28 0.074444 0.025055 0.07 0.12 0.05 0.8787 2.393551
29 0.21627 0.081216 0.206377 0.416394 0.142258 1.777043 5.373259
30 0.228934 0.063005 0.215474 0.326406 0.149823 0.328447 1.70598
Industry Aggregate 0.101907 0.555942 0.125 4.28 -5.51 -3.3967 57.59233
Source: Survey Data (2018)
Table 7 gives the various descriptive statistics for Return on Equity in all the 30 companies that were
studied for the period 2007-2015. On average, all the companies recorded positive ROE save for 5
companies, Marshals EA Ltd, Express Kenya Ltd, Kenya Airways, Eveready Limited and Mummies
Sugar Ltd that recorded negative ROE. BAT Kenya Ltd had the highest Return on Equity of 32.33%
while Express Kenya Ltd had the lowest ROE of negative 39.33%. This shows that there were significant
variations among companies in their Return on Equity.
Gathara et al….. Int. J. Innovative Finance and Economics Res. 7(1):10-33, 2019
25
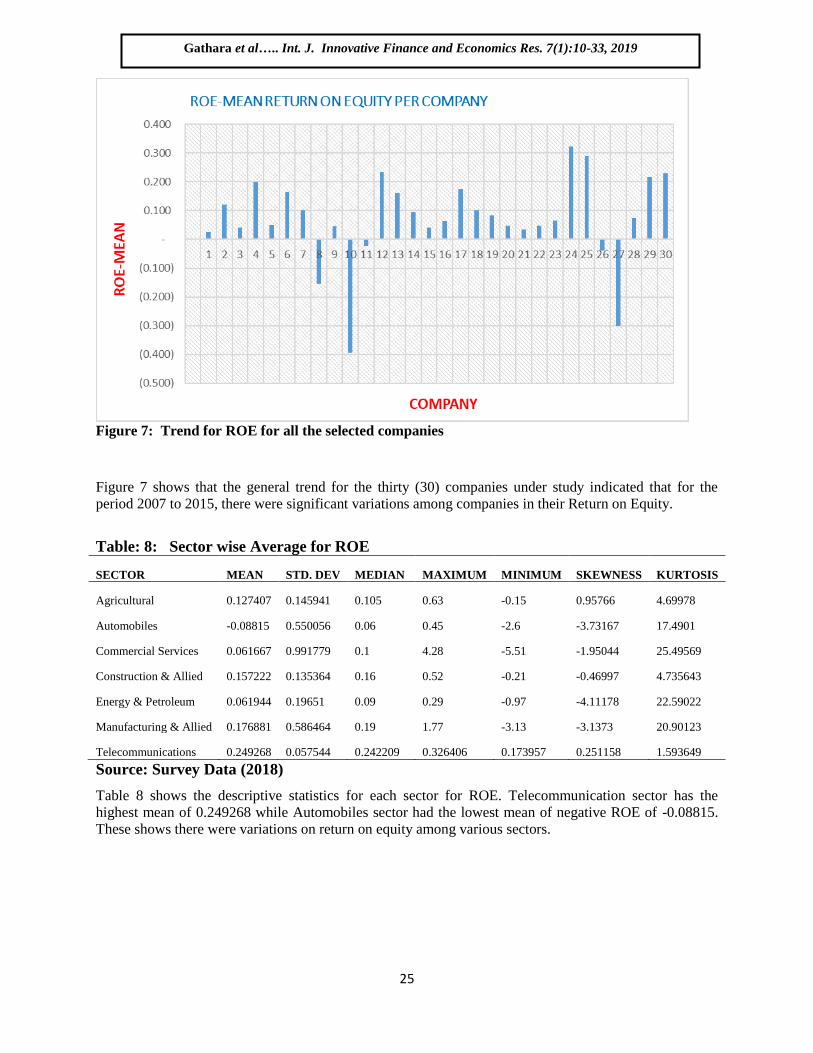
Figure 7: Trend for ROE for all the selected companies
Figure 7 shows that the general trend for the thirty (30) companies under study indicated that for the
period 2007 to 2015, there were significant variations among companies in their Return on Equity.
Table: 8: Sector wise Average for ROE
SECTOR MEAN STD. DEV MEDIAN MAXIMUM MINIMUM SKEWNESS KURTOSIS
Agricultural 0.127407 0.145941 0.105 0.63 -0.15 0.95766 4.69978
Automobiles -0.08815 0.550056 0.06 0.45 -2.6 -3.73167 17.4901
Commercial Services 0.061667 0.991779 0.1 4.28 -5.51 -1.95044 25.49569
Construction & Allied 0.157222 0.135364 0.16 0.52 -0.21 -0.46997 4.735643
Energy & Petroleum 0.061944 0.19651 0.09 0.29 -0.97 -4.11178 22.59022
Manufacturing & Allied 0.176881 0.586464 0.19 1.77 -3.13 -3.1373 20.90123
Telecommunications 0.249268 0.057544 0.242209 0.326406 0.173957 0.251158 1.593649
Source: Survey Data (2018)
Table 8 shows the descriptive statistics for each sector for ROE. Telecommunication sector has the
highest mean of 0.249268 while Automobiles sector had the lowest mean of negative ROE of -0.08815.
These shows there were variations on return on equity among various sectors.
Gathara et al….. Int. J. Innovative Finance and Economics Res. 7(1):10-33, 2019
26
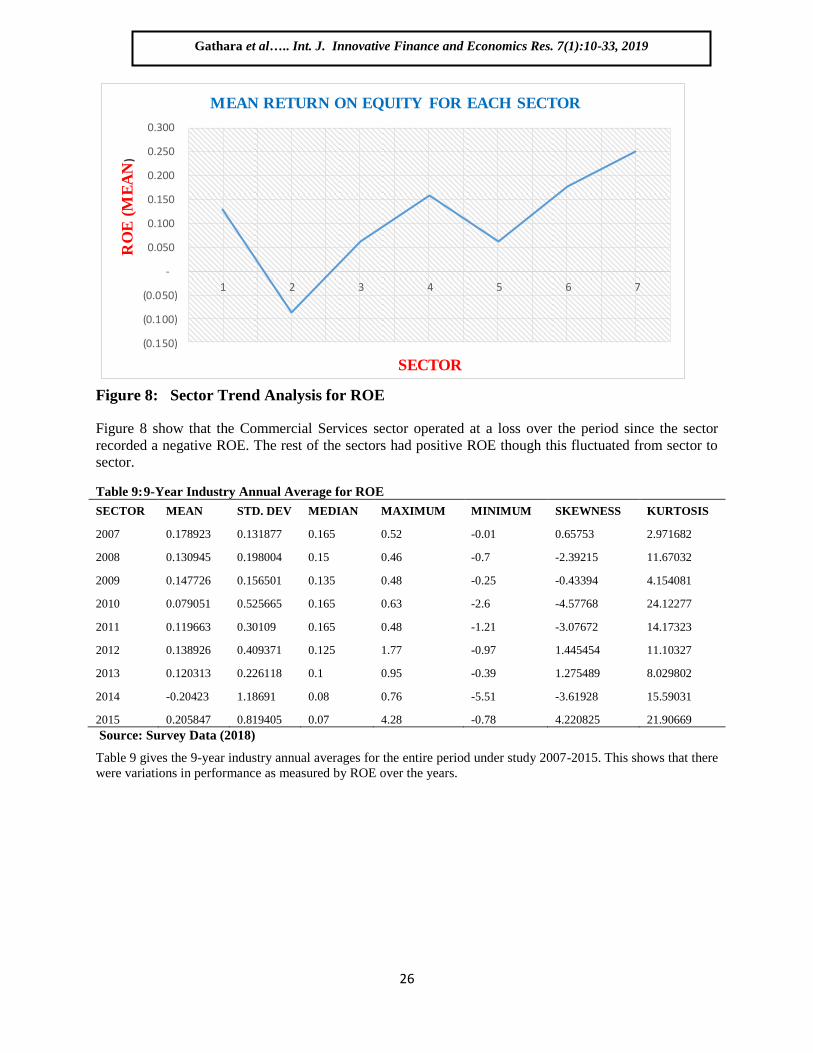
Figure 8: Sector Trend Analysis for ROE
Figure 8 show that the Commercial Services sector operated at a loss over the period since the sector
recorded a negative ROE. The rest of the sectors had positive ROE though this fluctuated from sector to
sector.
Table 9: 9-Year Industry Annual Average for ROE
SECTOR MEAN STD. DEV MEDIAN MAXIMUM MINIMUM SKEWNESS KURTOSIS
2007 0.178923 0.131877 0.165 0.52 -0.01 0.65753 2.971682
2008 0.130945 0.198004 0.15 0.46 -0.7 -2.39215 11.67032
2009 0.147726 0.156501 0.135 0.48 -0.25 -0.43394 4.154081
2010 0.079051 0.525665 0.165 0.63 -2.6 -4.57768 24.12277
2011 0.119663 0.30109 0.165 0.48 -1.21 -3.07672 14.17323
2012 0.138926 0.409371 0.125 1.77 -0.97 1.445454 11.10327
2013 0.120313 0.226118 0.1 0.95 -0.39 1.275489 8.029802
2014 -0.20423 1.18691 0.08 0.76 -5.51 -3.61928 15.59031
2015 0.205847 0.819405 0.07 4.28 -0.78 4.220825 21.90669
Source: Survey Data (2018)
Table 9 gives the 9-year industry annual averages for the entire period under study 2007-2015. This shows that there
were variations in performance as measured by ROE over the years.
(0.150)
(0.100)
(0.050)
-
0.050
0.100
0.150
0.200
0.250
0.300
1 2 3 4 5 6 7
RO
E (
ME
AN
)
SECTOR
MEAN RETURN ON EQUITY FOR EACH SECTOR
Gathara et al….. Int. J. Innovative Finance and Economics Res. 7(1):10-33, 2019
27
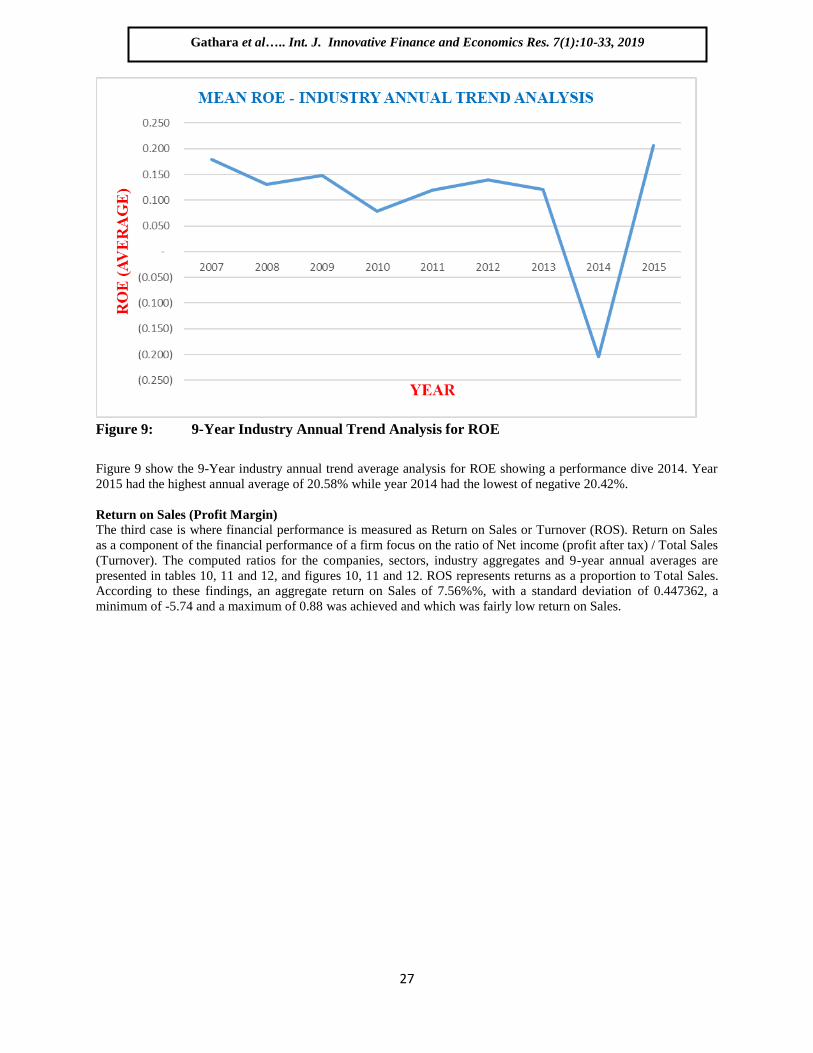
Figure 9: 9-Year Industry Annual Trend Analysis for ROE
Figure 9 show the 9-Year industry annual trend average analysis for ROE showing a performance dive 2014. Year
2015 had the highest annual average of 20.58% while year 2014 had the lowest of negative 20.42%.
Return on Sales (Profit Margin)
The third case is where financial performance is measured as Return on Sales or Turnover (ROS). Return on Sales
as a component of the financial performance of a firm focus on the ratio of Net income (profit after tax) / Total Sales
(Turnover). The computed ratios for the companies, sectors, industry aggregates and 9-year annual averages are
presented in tables 10, 11 and 12, and figures 10, 11 and 12. ROS represents returns as a proportion to Total Sales.
According to these findings, an aggregate return on Sales of 7.56%%, with a standard deviation of 0.447362, a
minimum of -5.74 and a maximum of 0.88 was achieved and which was fairly low return on Sales.
Gathara et al….. Int. J. Innovative Finance and Economics Res. 7(1):10-33, 2019
28
Table 10: Companywide Average for ROS
COMPANY MEAN STD. DEV MEDIAN MAXIMUM MINIMUM SKEWNESS KURTOSIS
1 -0.00222 0.411879 0.1 0.42 -0.87 -1.11579 3.233803
2 0.176667 0.056125 0.18 0.27 0.09 0.006999 2.160053
3 0.028889 0.082681 0.02 0.15 -0.12 -0.18688 2.412029
4 0.294444 0.293262 0.27 0.88 0 0.882838 2.713415
5 0.203333 0.233238 0.17 0.61 -0.04 0.50195 1.900322
6 0.455556 0.275595 0.65 0.69 0.09 -0.47513 1.378612
7 0.06 0.027839 0.07 0.09 0.01 -0.8849 2.336629
8 -0.18111 0.411322 -0.19 0.69 -0.71 0.842063 3.378915
9 0.03 0.041231 0.03 0.1 -0.04 -0.19294 2.664576
10 -0.74 1.888558 -0.03 0.08 -5.74 -2.40879 6.931019
11 -0.02 0.094604 0.02 0.07 -0.23 -1.2364 3.66681
12 0.136667 0.075333 0.16 0.2 -0.05 -1.86406 5.427264
13 0.164444 0.080949 0.19 0.27 0.05 -0.15291 1.520384
14 0.058889 0.052068 0.05 0.11 -0.06 -1.3024 4.082959
15 0.077778 0.037006 0.09 0.12 0.02 -0.63015 2.075143
16 0.087778 0.110655 0.11 0.18 -0.2 -2.22959 6.511737
17 0.152222 0.040242 0.15 0.23 0.11 0.682605 2.488708
18 0.038889 0.021473 0.04 0.09 0.01 1.436854 4.986537
19 0.148889 0.284932 0.07 0.85 -0.11 1.800852 5.303219
20 0.01 0.016583 0.01 0.03 -0.03 -1.56993 5.095041
21 0.265556 0.138032 0.18 0.51 0.14 0.768965 2.080938
22 0.081111 0.019003 0.09 0.1 0.05 -0.39882 1.682663
23 0.007778 0.00441 0.01 0.01 0 -1.33631 2.785714
24 0.117778 0.044096 0.11 0.22 0.08 1.493418 4.278924
25 0.187778 0.059954 0.2 0.28 0.11 0.054019 1.810795
26 -0.01444 0.071783 0.01 0.06 -0.15 -0.8085 2.297317
27 -0.31222 0.897089 0.1 0.14 -2.55 -1.99468 5.507713
28 0.043333 0.059161 0.02 0.2 0.02 2.411801 6.936429
29 0.54279 0.121577 0.49908 0.841436 0.430776 1.807189 5.262992
30 0.166942 0.034319 0.159101 0.225736 0.11802 0.285267 2.038099
Industry Aggregate 0.075584 0.447362 0.09 0.88 -5.74 -8.89517 111.4538
Source: Survey Data (2018)
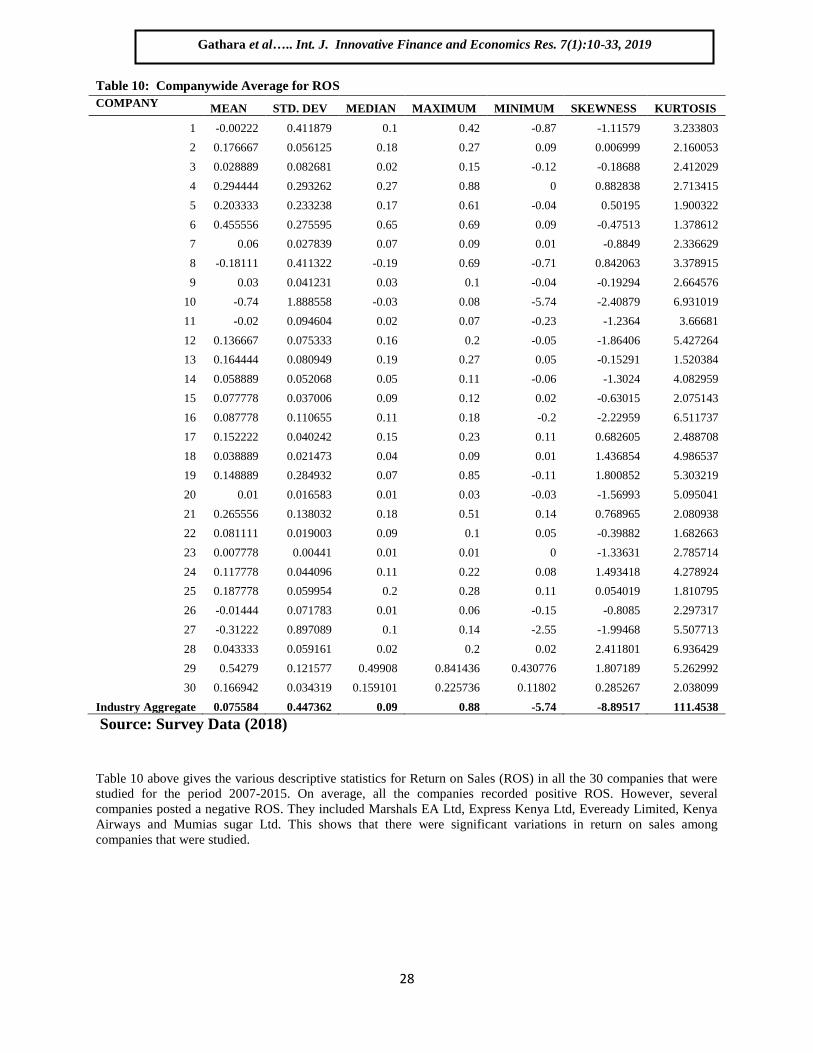
Table 10 above gives the various descriptive statistics for Return on Sales (ROS) in all the 30 companies that were
studied for the period 2007-2015. On average, all the companies recorded positive ROS. However, several
companies posted a negative ROS. They included Marshals EA Ltd, Express Kenya Ltd, Eveready Limited, Kenya
Airways and Mumias sugar Ltd. This shows that there were significant variations in return on sales among
companies that were studied.
Gathara et al….. Int. J. Innovative Finance and Economics Res. 7(1):10-33, 2019
29
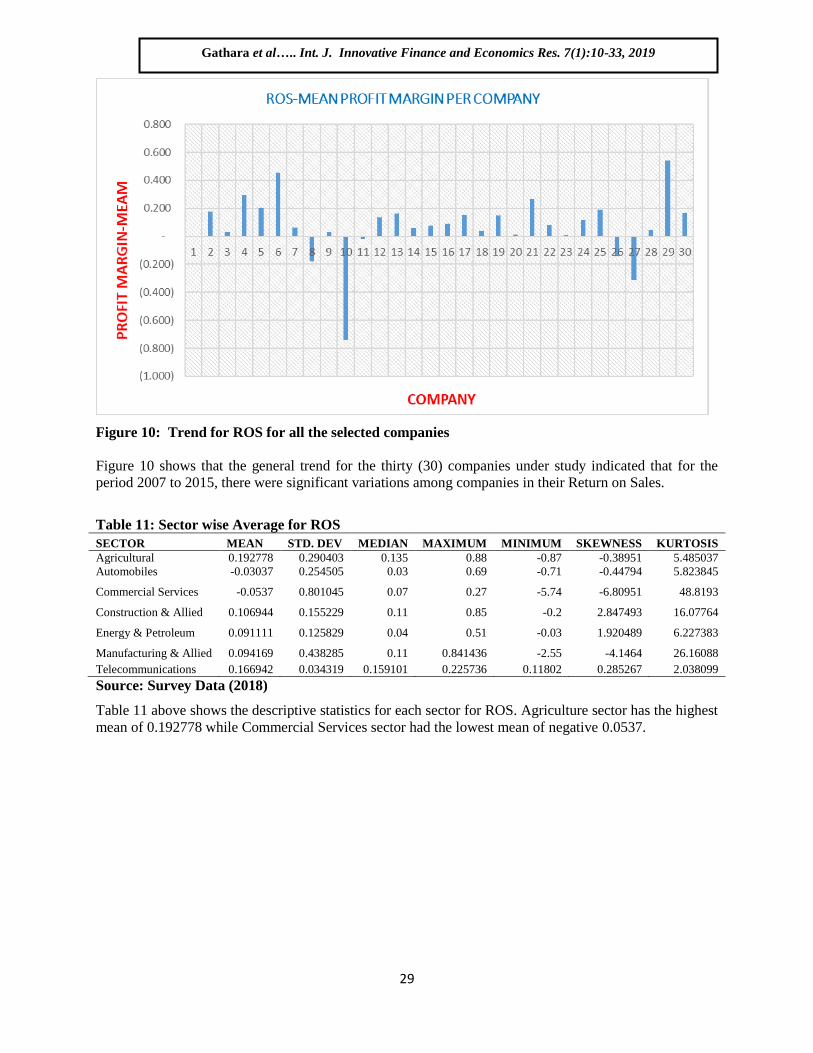
Figure 10: Trend for ROS for all the selected companies
Figure 10 shows that the general trend for the thirty (30) companies under study indicated that for the
period 2007 to 2015, there were significant variations among companies in their Return on Sales.
Table 11: Sector wise Average for ROS
SECTOR MEAN STD. DEV MEDIAN MAXIMUM MINIMUM SKEWNESS KURTOSIS
Agricultural 0.192778 0.290403 0.135 0.88 -0.87 -0.38951 5.485037
Automobiles -0.03037 0.254505 0.03 0.69 -0.71 -0.44794 5.823845
Commercial Services -0.0537 0.801045 0.07 0.27 -5.74 -6.80951 48.8193
Construction & Allied 0.106944 0.155229 0.11 0.85 -0.2 2.847493 16.07764
Energy & Petroleum 0.091111 0.125829 0.04 0.51 -0.03 1.920489 6.227383
Manufacturing & Allied 0.094169 0.438285 0.11 0.841436 -2.55 -4.1464 26.16088
Telecommunications 0.166942 0.034319 0.159101 0.225736 0.11802 0.285267 2.038099
Source: Survey Data (2018)
Table 11 above shows the descriptive statistics for each sector for ROS. Agriculture sector has the highest
mean of 0.192778 while Commercial Services sector had the lowest mean of negative 0.0537.
Gathara et al….. Int. J. Innovative Finance and Economics Res. 7(1):10-33, 2019
30
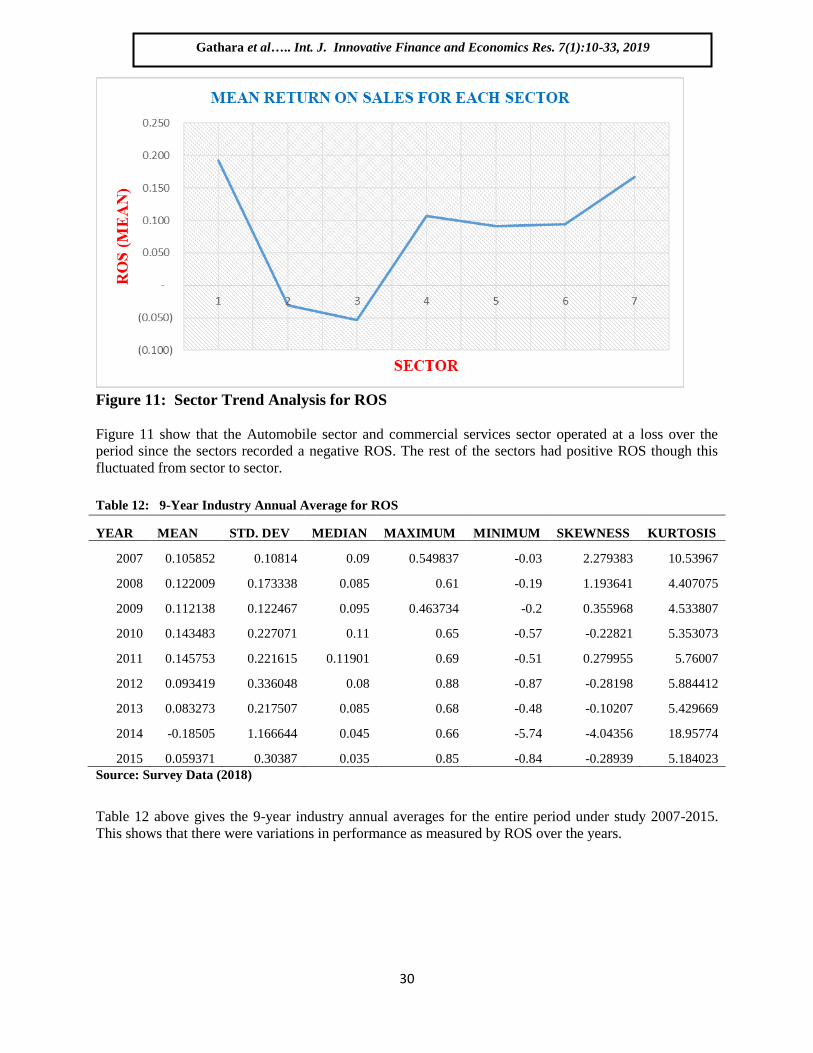
Figure 11: Sector Trend Analysis for ROS
Figure 11 show that the Automobile sector and commercial services sector operated at a loss over the
period since the sectors recorded a negative ROS. The rest of the sectors had positive ROS though this
fluctuated from sector to sector.
Table 12: 9-Year Industry Annual Average for ROS
YEAR MEAN STD. DEV MEDIAN MAXIMUM MINIMUM SKEWNESS KURTOSIS
2007 0.105852 0.10814 0.09 0.549837 -0.03 2.279383 10.53967
2008 0.122009 0.173338 0.085 0.61 -0.19 1.193641 4.407075
2009 0.112138 0.122467 0.095 0.463734 -0.2 0.355968 4.533807
2010 0.143483 0.227071 0.11 0.65 -0.57 -0.22821 5.353073
2011 0.145753 0.221615 0.11901 0.69 -0.51 0.279955 5.76007
2012 0.093419 0.336048 0.08 0.88 -0.87 -0.28198 5.884412
2013 0.083273 0.217507 0.085 0.68 -0.48 -0.10207 5.429669
2014 -0.18505 1.166644 0.045 0.66 -5.74 -4.04356 18.95774
2015 0.059371 0.30387 0.035 0.85 -0.84 -0.28939 5.184023
Source: Survey Data (2018)
Table 12 above gives the 9-year industry annual averages for the entire period under study 2007-2015.
This shows that there were variations in performance as measured by ROS over the years.
Gathara et al….. Int. J. Innovative Finance and Economics Res. 7(1):10-33, 2019
31
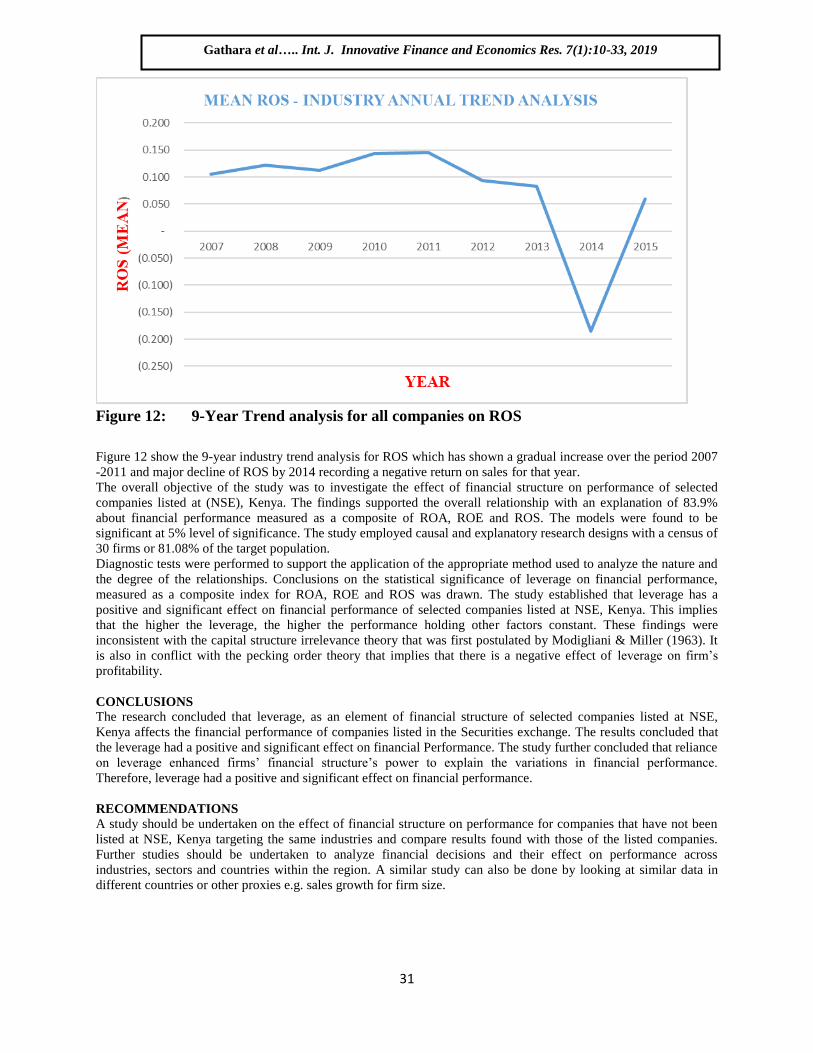
Figure 12: 9-Year Trend analysis for all companies on ROS
Figure 12 show the 9-year industry trend analysis for ROS which has shown a gradual increase over the period 2007
-2011 and major decline of ROS by 2014 recording a negative return on sales for that year.
The overall objective of the study was to investigate the effect of financial structure on performance of selected
companies listed at (NSE), Kenya. The findings supported the overall relationship with an explanation of 83.9%
about financial performance measured as a composite of ROA, ROE and ROS. The models were found to be
significant at 5% level of significance. The study employed causal and explanatory research designs with a census of
30 firms or 81.08% of the target population.
Diagnostic tests were performed to support the application of the appropriate method used to analyze the nature and
the degree of the relationships. Conclusions on the statistical significance of leverage on financial performance,
measured as a composite index for ROA, ROE and ROS was drawn. The study established that leverage has a
positive and significant effect on financial performance of selected companies listed at NSE, Kenya. This implies
that the higher the leverage, the higher the performance holding other factors constant. These findings were
inconsistent with the capital structure irrelevance theory that was first postulated by Modigliani & Miller (1963). It
is also in conflict with the pecking order theory that implies that there is a negative effect of leverage on firm‟s
profitability.
CONCLUSIONS
The research concluded that leverage, as an element of financial structure of selected companies listed at NSE,
Kenya affects the financial performance of companies listed in the Securities exchange. The results concluded that
the leverage had a positive and significant effect on financial Performance. The study further concluded that reliance
on leverage enhanced firms‟ financial structure‟s power to explain the variations in financial performance.
Therefore, leverage had a positive and significant effect on financial performance.
RECOMMENDATIONS
A study should be undertaken on the effect of financial structure on performance for companies that have not been
listed at NSE, Kenya targeting the same industries and compare results found with those of the listed companies.
Further studies should be undertaken to analyze financial decisions and their effect on performance across
industries, sectors and countries within the region. A similar study can also be done by looking at similar data in
different countries or other proxies e.g. sales growth for firm size.
Gathara et al….. Int. J. Innovative Finance and Economics Res. 7(1):10-33, 2019
32
REFERENCES Abdul, G.K. (2012). The Relationship of Capital Structure Decisions with Firm Performance: A Study of the
Engineering Sector of Pakistan. International Journal of Accounting and Financial Reporting, 2(1): 2162-
3082.
Abor, J. (2005). “The effect of capital structure on profitability: an empirical analysis of listed firms in Ghana”,
Journal of Risk Finance, 6, pp. 438-47.
Abor, J. (2007). Debt policy and performance of SMEs. The Journal of Risk Finance, 8(4), 64- 379.
Abor, J. (2010). Debt policy and performance of SMEs Evidence from Ghanaian and South African. The Journal of
Risk Finance, 8(4), 364–379. doi:10.1108/15265940710777315.
Arnott, D., & Asness, S. (2003). Surprise! Higher Dividend = Higher Earnings Growth. Financial Analyst Journal,
59, 70-89
Almajali A. Y., Alamro S.A. and Al-Soub, Y. Z. (2012). Factors Affecting the Financial Performance of Jordanian
Insurance Companies Listed at Amman Stock Exchange. Journal of Management research, Vol. 4(2), pp
266-289.
Ajao, O. S., & Small, O. S. (2012). Liquidity Management and Corporate Profitability: Case Study of
Selected Manufacturing Companies Listed on the Nigerian Stock Exchange. Business Management
Dynamics, 2(2), 10-25.
Berger, Allen, and Patti, Emilia Bonaccorsi di (2002); Capital Structure and Firm Performance: A new approach
to testing agency theory and an application to the Banking Industry. Retrieved from www. federal
reserve. Gov /pubs/ feds/2002 /200254 /200254pap.pdf.
Creswell, J. W. (2004). Research design: Qualitative, quantitative, and mixed methods approaches. (Second
Edition). California: Sage Publications Inc.
Dare, F.D., & Sola, O. (2010). Capital Structure and Corporate Performance in Nigeria Petroleum Industry: Panel
Data Analysis. Journal of Mathematics and Statistics 6(2), 168-173.
Dogan, M. (2013). Does firm size affect firm profitability? Evidence from Turkey. Journal of Finance and
Accounting, 4(4), pp 53-59.
Ezeoha, A. E. (2008). Firm size and corporate financial-leverage choice in a developing economy: Evidence from
Nigeria. The Journal of Risk Finance, 9(4), 351–364. doi:10.1108/15265940810895016
Freeman, R. E. 1984. Strategic management: A stakeholder approach. Boston: Pitman. 1994. The politics of
stakeholder theory: Some future directions. Business Ethics Quarterly, 4: 409-421.
Géczy, Christopher, Bernadette A. M and, Schrand, C. (2006), Why firms use currency derivatives. The Journal of
Finance, 52(4), 1323-1354.
Hassan, M.D., Ahsan, A.F., Rahman, A.M., and Nurul Alam, M. (2014). Influence of Capital Structure on Firm
Performance: Evidence from Bangladesh. International Journal of Business and Management, Vol. 9(5):
184-194.
Haq, I. U., Sohail, M., Zaman, K., & Alam, Z. (2011). The Relationship between Working Capital Management and
Profitability: A Case Study of Cement Industry in Pakistan. Mediterranean Journal of Social Sciences,
2(2), 365-372
Hasan, A. & Javed, T. (2009). An empirical Investigation of the Causal Relationship among Monetary variables and
Equity markets returns. The Lahore Journal of Economics, 14, 115-137.
Ishaya, L. C., & Abduljeleel, B. O. (2014). Capital Structure and Profitability of Nigerian Quoted: The Agency Cost
Theory Perspective. American International Journal of Social Science, 3(1), 139-140.
Jensen, M.C., & Meckling, W.H. (1976). „Theory of the Firm: Managerial Behaviour, Agency Costs and Ownership
Structure. Journal of Financial Economics, 3 (4), 305-360.
Jermias, J. (2008). The relative influence of competitive intensity and business strategy on the relationship between
financial leverage and performance. The British Accounting Review, 40, 71–86. doi:
10.1016/j.bar.2007.11.001
Khalid, S., Ali, A., Baloch, M.Q., and Ali, N. (2014). Analysis of the impact of leverage on various measures of
corporate performance, using Arellano and Bond dynamic panel data estimation technique. Abasyn Journal
of Social Sciences, Vol.7, No. 1, pp 1-10.
Mahmoudi, S., (2014). The Effect of Leverage on Cement Industry Profitability. Reef Resources Assessment and
Management Technical Paper, Vol. 40, 2014, pp 673-676.
Modigliani, F., & Miller, M. H. (1958). The cost of capital, corporation finance and the theory of investment. The
American economic review, 261-297.
Modigliani, F., & Miller, M. H. (1963). Corporate income taxes and the cost of capital: a correction. The American
economic review, 433-443.
Mawih, K. A. (2014). Effects of Assets Structure on the Financial Performance: Evidence from Sultanate of Oman.
Gathara et al….. Int. J. Innovative Finance and Economics Res. 7(1):10-33, 2019
33
Mitnick, B. M. (2006). Origin of the Theory of Agency. Mervice hall: Pittsburgh.
Mouhammed, A. J., Waheed, A. (2016). “Firm Size as Moderator to Leverage-Performance Relation: An
Emerging Market Review. Journal of Poverty, Investments and Development, 23, 2016.
Moyer, R.C., McGiugan, J.R., & Kretlow, W.J. (1999). Contemporary Financial Management (5th ed). New York:
West publishers.
Mwangi, L. W., Muathe, S.K., and Kosimbei, G. (2014). Relationship between Capital Structure and Performance
of Non-Financial Companies Listed in the Nairobi Securities Exchange, Kenya. Global Journal of
Contemporary Research in Accounting, Auditing and Business Ethics, 1(2). 72-90.
Nairobi Securities Exchange, 2015 Handbook
Naser, K., & Mokhtar, M.Z. (2004). Firm Performance, Macro- economic Variables and Firm Size, Journal of
Finance, 543-679.
Nairobi Securities Exchange (2015). History of Organisations. Retrieved from https://www.nse.co.ke/nse/history-
of-organisation.html
O‟Brien, J. (2003). The capital structure implication of pursuing a strategy of innovation. Strategic Management
Journal, 24(2), 415–431.
Okwo, I. M., Okelue, U. D., & Nweze, A. U. (2012). Investment in fixed assets and firm profitability: Evidence
from the Nigerian brewery industry. European Journal of Business and Management, 4(20), 10-17
Olatunji, T.E. & Tajudeen A.A. (2014). Investment in Fixed Assets and Firm Profitability: Empirical Evidence
from the Nigerian Banking Sector. Asian Journal of Social Sciences and Management Studies. ISSN:2313-
7401 Vol. 1.
O‟Brien, J. (2003). The capital structure implication of pursuing a strategy of innovation. Strategic Management
Journal, 24(2), 415–431.
Ross, S.A., Westerfield, R.W., & Jaffe, J.F. (2002). Corporate finance. Boston: McGraw- Hill/Irwin.
Schmidt M. (2014) Business Case Essentials. 4th Edition: Solution Matrix Limited. Ebook.
Shubita, M. F., & Alsawalhah, J.F. (2012). The Effect of Capital Structure and Profitability. International Journal of
Business and Social Science, 3(16).
Suhaila, Mat Kila and Wan Mahmood, Wan Mansor (2008): Capital Structure and Firm Characteristics: Some
Evidence from Malaysian Companies.Mpra Paper
Siahaan, U. M., Ragil, S.S., and Solimon H. (2014). The Influence of Company Size and Capital Structure towards
Liquidity, Corporate Performance and Firm Value, for Large and Small Group Companies. European
Journal of Business and Management Vol.6 No. 18, pp 148- 156.
Tsuji, C., (2013). Corporate Profitability and Capital Structure: The Case of the Machinery Industry Firms of the
Tokyo Stock Exchange. International Journal of Business Administration, Vol. 4, No.3, pp 14-21.
Titman, S., Keown, A.J., & Martin, J. D. (2011). Financial Management: Principles and applications (11th Ed).
New Delhi: Pearson Education, Inc.
Watkins, T. (2002), Leverage and the Risks to Shareholders and Bondholders, San Jose: San Jose State University.
Zikmund, G.W., Babin, B.J., Carr,C.J. & Griffin, M. (2010). Business Research Methods (8th ed.) South-Western:
Cengage Learning.
Gathara et al….. Int. J. Innovative Finance and Economics Res. 7(1):10-33, 2019