Embed Size (px)
Citation preview

Volume 22 Issue 2 Article 4
10-28-2020
Optimal Capital Structure and Leverage Adjustment Speed of Optimal Capital Structure and Leverage Adjustment Speed of
European Public and Private Firms European Public and Private Firms
Klemen Stegovec
Matjaž Črnigoj
Follow this and additional works at: https://www.ebrjournal.net/home
Recommended Citation Recommended Citation Stegovec, K., & Črnigoj, M. (2020). Optimal Capital Structure and Leverage Adjustment Speed of European Public and Private Firms. Economic and Business Review, 22(2). https://doi.org/10.15458/ebr103
This Original Article is brought to you for free and open access by Economic and Business Review. It has been accepted for inclusion in Economic and Business Review by an authorized editor of Economic and Business Review.

261ECONOMIC AND BUSINESS REVIEW | VOL. 22 | No. 2 | 2020 | 261-288
OPTIMAL CAPITAL STRUCTURE AND LEVERAGE ADJUSTMENT SPEED OF EUROPEAN PUBLIC AND PRIVATE FIRMSKLEMEN STEGOVEC1 Received: March 9, 2018 MATJAŽ ČRNIGOJ2 Accepted: July13, 2019
ABSTRACT: In this research paper, the dynamic trade-off theory is tested by applying European public and private firms, since as much of the existing research remains in the US public firm context only. The results of our research show that European firms, both private and public, follow the optimal capital structure path consistent with the dynamic trade-off theory. We find that above optimally levered firms adjust their leverage towards the optimal capital structure faster than the below optimally levered ones. In addition, the results show that public and private firms seem to make similar leverage adjustment decisions and that there are the size of the firms and the public/private status that account for the differences.Key words: optimal capital structure, leverage adjustment speed, partial adjustment model, unified capital structure theoryJEL classification: F33; G15; G32DOI: 10.15458/ebr103
1 INTRODUCTION
Despite capital structure decisions being one of the most extensively studied topics in corporate finance, no consensus has been reached about the main forces driving a corporate capital structure choice. One group of researches argues that firms aim at operating with an optimal capital structure that is found by trading-off the benefits and the costs of debt, as put forward by Modigliani and Miller (1963), while others argue in favour of the pecking-order theory (Myers and Majluf, 1984) which refutes the existence of the optimal capital structure and suggests that financing is driven by asymmetric information on the financial markets and the resulting pecking-order of the financing choices. The third theory of capital structure suggests that capital structure is merely a result of previous market timing attempts as firms raise capital when conditions on the market are favourable (Baker and Wurgler, 2002). Only recently have some authors (Byoun, 2008; Faulkender et al., 2012) tried to merge these theories in a unified capital structure framework in which factors proposed by alternative theories interact.
1 University of Ljubljana, School of Economics and Business, Ljubljana, Slovenia, PhD Student
2 Corresponding author, Institute for Economic Research, Ljubljana, Slovenia, e-mail: [email protected]
ECONOMIC AND BUSINESS REVIEW | VOL. 22 | No. 2 | 2020 262
The dynamic trade-off theory hypothesizes that the firm’s debt-equity mix often deviates from the target leverage because firms face substantial adjustment costs when rebalancing their capital structures (Fischer et al., 1989). If adjustment costs exceed the benefits of operating with the optimal capital structure, firms are not motivated to adjust their leverage. Thus, firms rebalance only if their actual leverage diverges from the target leverage substantially (Strebulaev, 2007). A unified theory of capital structure adds to the dynamic trade-off theory model by proposing other possible leverage adjustment scenarios, which stem from the pecking-order theory and the market timing theory. The dynamic trade-off theory has been widely empirically tested so far, however, researchers have mainly addressed US public firms (Fama and French, 2002; Flannery and Rangan, 2006; Kayhan and Titman, 2007; Byoun, 2008; Huang and Ritter, 2009; Cook and Tang, 2010). Based on the empirical findings, one can conclude that the dynamic trade-off theory that assumes a partial convergence of leverage towards the firm’s optimal capital structure is a prevalent explanation of the capital structure choice and leverage dynamics in practice.
In this paper, the optimal capital structure choice and leverage adjustment speed of European firms is investigated. In addition to public firms, we address also private firms. Both the selected European as well as private firms have received significantly less attention in the literature so far. By addressing a large sample of public and private European firms, we contribute to the existing literature by providing further empirical tests of the dynamic trade-off theory outside the context of the US firms and large public firms. Based on the scarce available literature, one could infer that the capital structure choice of European firms does not depart from the practices observed in the US firms. However, the extant literature does not provide a conclusive answer whether the capital structure choice and leverage adjustment process differ in public and private firms. Lemmon et al. (2008), Hanousek and Shamshur (2011), and Marinšek et al. (2016), for example, found that the capital structure decisions of public firms do not differ from the decisions in private firms, while Bartholdy and Mateus (2011), and Goyal et al. (2011) provide the opposite findings. To gain further insights into the capital structure choice and leverage adjustment process of the European private firms, we address a significantly larger sample than those used in similar studies. In addition to the robustness test of the theory for private firms, this allows us to test the theory for firms of different sizes.
Our empirical models build on a unified setting in which the leverage target is consistent with the dynamic trade-off theory, while the leverage adjustment process depends on the interacting effects proposed by various capital structure theories, especially the pecking-order theory. The approach follows the idea of Gaud et al. (2007) who found that the capital structure choice of European firms cannot be sufficiently explained by relying solely on the rationale of one capital structure theory alone. In our research, the unified capital structure framework is tested by first predicting the firms’ optimal capital structure using the optimal capital structure model. Then, the gap between the target and actual leverage is calculated. Knowing this gap and the change of leverage in the period allows us to analyse the leverage adjustment process, i.e. to estimate the leverage adjustment speed. As argued by Byoun (2008), the pecking-order theory provides us with an additional explanation
K. STEGOVEC, M. ČRNIGOJ | OPTIMAL CAPITAL STRUCTURE AND LEVERAGE ... 263
of the leverage adjustment process, as it was found that the leverage adjustment speed depends also on the firm’s cash flow imbalances. We expand Byoun’s view by hypothesising that the effect of the firm’s cash flow imbalances could also be analysed from the trade-off theory perspective, which is related to the findings of Strebulaev (2007). However, as recognised in many previous capital structure studies, these two approaches should not be understood as mutually exclusive.3 We also analyse the impact of the financial crisis that emerged in 2008 on the leverage adjustment process. According to Goyal et al. (2011), the existing literature assumes infinitely elastic supply of debt and equity, which leaves no room for the market timing arguments. Conversely, Cook and Tang (2010), and Dang et al. (2014) argue that a reduction of the leverage adjustment speed is likely to occur in a stressed economic environment, which provides evidence that external market forces are important capital structure determinants too.
In our empirical study, we found strong empirical evidence that European firms adjust their leverage towards the optimal capital structure and that both public and private firms have a similar leverage adjustment speed. The results show that the above optimally levered firms adjust towards the target leverage faster than the below optimally levered firms. Investigating the impact of the firm’s cash flow imbalances on the leverage adjustment process, we found that it should be studied from both the trade-off and the pecking-order perspectives. In addition to providing the evidence for the robustness of the theory outside of the context of the US large public firms, it was found that the leverage adjustment speed depends significantly on the size of the private firm. Moreover, the results show that the leverage adjustment speed is related more to the size of the firm than to the public/private status of the firm. Somewhat in contrast to our expectations, smaller firms adjust their leverage towards the optimum faster than larger firms, and we observe an opposite asymmetry in the adjustment speed in the group of the smallest private firms as the adjustment speed of the bellow optimally levered firms exceeds the adjustment speed of the above optimally levered firms.
The rest of the paper is structured as follows. In section 2, the literature is reviewed, in section 3, the empirical models and estimation techniques described, in section 4, the collected data analysed, in section 5, the results presented, and in section 6, concluding remarks provided.
3 The interacting effects of alternative theories have been found also when studying security issuance. See, for example, Dong et al. (2012) who show how the effects of market timing and the pecking order interact when a firm issues and repurchases equity.
ECONOMIC AND BUSINESS REVIEW | VOL. 22 | No. 2 | 2020 264
2 LITERATURE REVIEW
The trade-off theory describes the optimal capital structure choice as a process of weighing the benefits and costs of debt financing. The benefits of debt result from the interest tax shield (Modigliani and Miller, 1963). Debt also mitigates the agency conflict between managers and shareholders and reduces the free cash flow problem (Jensen, 1986). The costs of debt financing refer to the costs of financial distress (Baxter, 1967) and agency costs related to the underinvestment problem and debt overhang problem (Myers, 1977). According to the static trade-off theory, a firm estimates its optimal capital structure, i.e. capital structure that maximizes the value of the firm, and then adjusts the leverage to adopt the optimal debt-equity mix. The static trade-off theory, however, ignores the adjustment costs that make firms reluctant to continuously adjust their capital structure and operate with the optimal capital structure. Fischer et al. (1989) show that even low adjustment costs lead to a wide capital structure interval that is optimal for the firm, in contrast to a precise estimate of the optimal debt-equity mix and the required continuous rebalancing. Leary and Roberts (2005) show that because of the adjustment cost, firms rebalance their capital structure only infrequently. Strebulaev (2007) argues that even though a firm follows the optimal capital structure path and converges to the target leverage, the actual leverage is likely to deviate from the target leverage most of the time, as the adjustments occur only in the refinancing points.
The alternative pecking-order hypothesis is built on another key capital market imperfection. Myers and Majluf (1984) argue that because of asymmetric information and the transaction costs faced by the firms when raising capital, the firm’s financing process follows a pecking-order. According to the pecking-order, firms always first exhaust all internal financing resources and when external sources are required, firms first issue debt, while they choose to issue equity only as the last resort option. Consequently, there is no optimal capital structure in a pecking-order explanation of the firm’s capital structure choice. Bessler et al. (2011) explain the pecking-order behaviour also in a dynamic context in which information asymmetry is time varying and firms have more external financing options than in the static pecking-order hypothesis. As opposed to the static pecking-order hypothesis, equity issues are not discouraged. Probability of issuing equity increases with the fall in the firm-level information asymmetry and firms exploit such opportunities for large equity offerings to build up cash reserves. The fall in the firm-level information asymmetry can be a consequence of a share price increase (decrease in the relative value of information asymmetry) or the firm’s previous information disclosures needed for accessing external financial resources.
Most of researchers agree that the dynamic trade-off theory that assumes a partial convergence of leverage towards the firm’s optimal capital structure is a prevalent explanation of the capital structure choice and leverage dynamics in practice. This behaviour is inter alia empirically confirmed by Fama and French (2002), Flannery and Rangan (2006), Kayhan and Titman (2007), and Huang and Ritter (2009) who all show that the US public firms adjust their leverage towards the optimal capital structure.
K. STEGOVEC, M. ČRNIGOJ | OPTIMAL CAPITAL STRUCTURE AND LEVERAGE ... 265
However, Lemmon et al. (2008) found that sub-optimally levered firms, operating with above or below optimal leverage, even though they converge to the target on a long run, remain sub-optimally levered for a long time. Byoun (2008) shows that firms operating with above optimal leverage adjust their leverage faster than the firms operating with below optimal leverage. He also shows that the adjustment speed depends on the firm’s cash flow imbalances, as it looks like that firms that operate with above optimal leverage adjust their leverage faster when having a financial surplus, while firms that operate with below optimal leverage adjust faster when having a financial deficit. Similar findings were obtained by Faulkender et al. (2012) who show that firms with ample operating cash flow make larger leverage adjustments than firms with low operating cash flow. By studying the impact of cash flow imbalances on the leverage adjustment process, both Byoun (2008) and Faulkender et al. (2012) attempt to develop a unified capital structure framework that incorporates the elements of both alternative capital structure theories.
Compared to the empirical studies addressing the US public firms, the literature investigating European firms and private firms is rather scarce. What is more, there is mixed evidence available whether private firms exhibit the behaviour proposed by the dynamic trade-off theory. In a recent study, Marinšek et al. (2016) who addressed the EU public and private firms found that the leverage adjustment speed towards the optimal capital structure is similar for firms regardless of their size, public/private status, ownership structure and origin. Similar findings were obtained by Hanousek and Shamshur (2011) who addressed private firms from the European transition economies. On the other hand, Bartholdy and Mateus (2011) argue that small private firms that are predominantly bank-financed differ from large public firms in terms of agency problem and information asymmetry. Therefore, they conclude that their behaviour cannot be explained by the determinants used to model the capital structure choice of large public firms. Brav (2009) argues that private firms rely exclusively on debt financing when raising capital and that their capital structures are very sensitive to fluctuations in their performance. The same argument was brought forward by Goyal et al. (2011), and Saunders and Steffen (2011).
We conclude this literature review with the contributions studying the impact of the macroeconomic conditions and the conditions on the financial market on the capital structure choice. Cook and Tang (2010) show that US firms adjust their leverage towards the optimal capital structure faster in times of good macroeconomic conditions than in times of crisis. Dang et al. (2014) found that the impact of the recent financial crisis on the leverage adjustment speed is asymmetric as financially constrained firms experience more pronounced reduction in the leverage adjustment speed than unconstrained firms, while Caglayan and Rashid (2014) show that the macroeconomic risk affects public and private firms’ leverage choices similarly. Öztekin and Flannery (2012) link firms’ leverage adjustment speed to the legal, institutional and financial development of particular countries. They show that firms in the US, the UK, Canada and New Zealand exhibit a significantly higher leverage adjustment speed than firms from South America or Central Asia.
ECONOMIC AND BUSINESS REVIEW | VOL. 22 | No. 2 | 2020 266
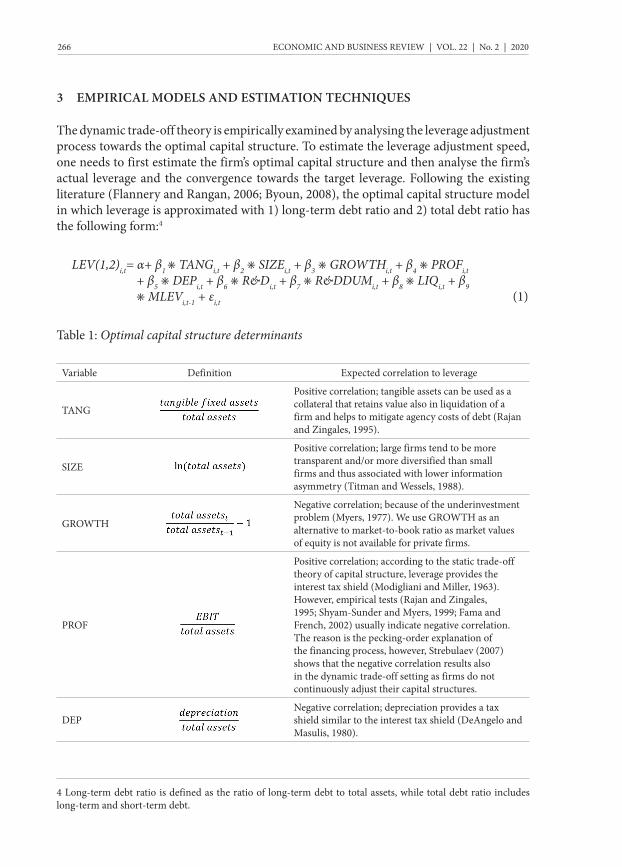
3 EMPIRICAL MODELS AND ESTIMATION TECHNIQUES
The dynamic trade-off theory is empirically examined by analysing the leverage adjustment process towards the optimal capital structure. To estimate the leverage adjustment speed, one needs to first estimate the firm’s optimal capital structure and then analyse the firm’s actual leverage and the convergence towards the target leverage. Following the existing literature (Flannery and Rangan, 2006; Byoun, 2008), the optimal capital structure model in which leverage is approximated with 1) long-term debt ratio and 2) total debt ratio has the following form:4
LEV(1,2)i,t= α+ β1 ✳ TANGi,t + β2 ✳ SIZEi,t + β3 ✳ GROWTHi,t + β4 ✳ PROFi,t + β5 ✳ DEPi,t + β6 ✳ R&Di,t + β7 ✳ R&DDUMi,t + β8 ✳ LIQi,t + β9 ✳ MLEVi,t-1 + εi,t (1)
Table 1: Optimal capital structure determinants
4 Long-term debt ratio is defined as the ratio of long-term debt to total assets, while total debt ratio includes long-term and short-term debt.
Variable Definition Expected correlation to leverage
TANG
Positive correlation; tangible assets can be used as a collateral that retains value also in liquidation of a firm and helps to mitigate agency costs of debt (Rajan and Zingales, 1995).
SIZE
Positive correlation; large firms tend to be more transparent and/or more diversified than small firms and thus associated with lower information asymmetry (Titman and Wessels, 1988).
GROWTH
Negative correlation; because of the underinvestment problem (Myers, 1977). We use GROWTH as an alternative to market-to-book ratio as market values of equity is not available for private firms.
PROF
Positive correlation; according to the static trade-off theory of capital structure, leverage provides the interest tax shield (Modigliani and Miller, 1963). However, empirical tests (Rajan and Zingales, 1995; Shyam-Sunder and Myers, 1999; Fama and French, 2002) usually indicate negative correlation. The reason is the pecking-order explanation of the financing process, however, Strebulaev (2007) shows that the negative correlation results also in the dynamic trade-off setting as firms do not continuously adjust their capital structures.
DEPNegative correlation; depreciation provides a tax shield similar to the interest tax shield (DeAngelo and Masulis, 1980).
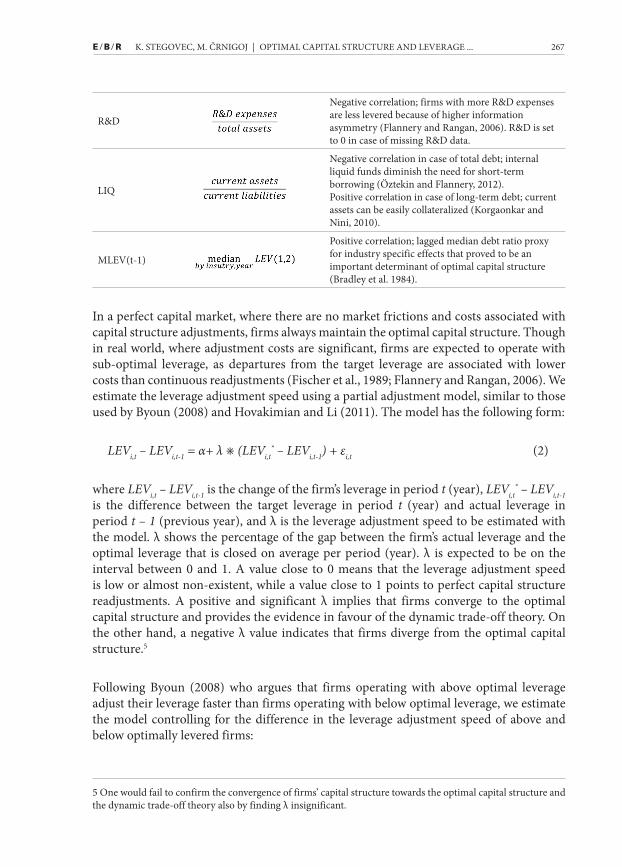
K. STEGOVEC, M. ČRNIGOJ | OPTIMAL CAPITAL STRUCTURE AND LEVERAGE ... 267
In a perfect capital market, where there are no market frictions and costs associated with capital structure adjustments, firms always maintain the optimal capital structure. Though in real world, where adjustment costs are significant, firms are expected to operate with sub-optimal leverage, as departures from the target leverage are associated with lower costs than continuous readjustments (Fischer et al., 1989; Flannery and Rangan, 2006). We estimate the leverage adjustment speed using a partial adjustment model, similar to those used by Byoun (2008) and Hovakimian and Li (2011). The model has the following form:
LEVi,t – LEVi,t-1 = α+ λ ✳ (LEVi,t* – LEVi,t-1) + εi,t (2)
where LEVi,t – LEVi,t-1 is the change of the firm’s leverage in period t (year), LEVi,t* – LEVi,t-1
is the difference between the target leverage in period t (year) and actual leverage in period t – 1 (previous year), and λ is the leverage adjustment speed to be estimated with the model. λ shows the percentage of the gap between the firm’s actual leverage and the optimal leverage that is closed on average per period (year). λ is expected to be on the interval between 0 and 1. A value close to 0 means that the leverage adjustment speed is low or almost non-existent, while a value close to 1 points to perfect capital structure readjustments. A positive and significant λ implies that firms converge to the optimal capital structure and provides the evidence in favour of the dynamic trade-off theory. On the other hand, a negative λ value indicates that firms diverge from the optimal capital structure.5
Following Byoun (2008) who argues that firms operating with above optimal leverage adjust their leverage faster than firms operating with below optimal leverage, we estimate the model controlling for the difference in the leverage adjustment speed of above and below optimally levered firms:
5 One would fail to confirm the convergence of firms’ capital structure towards the optimal capital structure and the dynamic trade-off theory also by finding λ insignificant.
R&D
Negative correlation; firms with more R&D expenses are less levered because of higher information asymmetry (Flannery and Rangan, 2006). R&D is set to 0 in case of missing R&D data.
LIQ
Negative correlation in case of total debt; internal liquid funds diminish the need for short-term borrowing (Öztekin and Flannery, 2012).Positive correlation in case of long-term debt; current assets can be easily collateralized (Korgaonkar and Nini, 2010).
MLEV(t-1)
Positive correlation; lagged median debt ratio proxy for industry specific effects that proved to be an important determinant of optimal capital structure (Bradley et al. 1984).
ECONOMIC AND BUSINESS REVIEW | VOL. 22 | No. 2 | 2020 268
RAdji,t= α+ λ1 ✳ OAdji,t ✳ Di,tabove + λ2 ✳ OAdji,t ✳ Di,t
below + εi,t (3)
where RAdji,t and OAdji,t are abbreviations for LEVi,t – LEVi,t-1 and LEVi,t* – LEVi,t-1 from
equation (2), respectively. Di,tabove is a dummy variable that takes value 1 if the firm is above
optimally levered and 0 otherwise. Di,tbelow is a dummy variable that takes value 1 if the
firm is below optimally levered and 0 otherwise. λ1 is the leverage adjustment speed of the above optimally levered firms and λ2 is the leverage adjustment speed of the below optimally levered firms to be estimated.
Byoun (2008) and Faulkender et al. (2012) also show that the adjustment speed depends on the firm’s cash flow imbalances. When firms operate with (high) financial deficit or surplus adverse selection costs arising from the information asymmetry and transaction costs of capital structure adjustments are addressed simultaneously and are consequently lower. There are several possible outcomes of this phenomenon, each with different implications for the leverage adjustment process. According to the traditional pecking-order hypothesis (Myers and Majluf, 1984), firms would decrease (increase) debt, if they had a financial surplus (deficit), regardless of their leverage position relative to the optimal capital structure. Byoun (2008) found that although the above (below) optimally levered firms with a financial surplus (deficit) adjust faster than similar firms with a financial deficit (surplus), the above (below) optimally levered firms with the financial deficit (surplus) still make leverage adjustments towards the optimal capital structure. This can be labelled as a quasi pecking-order behaviour. According to the dynamic pecking-order theory (Bessler et al., 2011), the probability of issuing equity increases with the fall in the firm-level information asymmetry and firms exploit such opportunities for large equity offerings to build up cash reserves or rebalance the capital structure. Acknowledging these various explanations, the results of the leverage adjustment process are in these specific circumstances difficult to predict as the level of information asymmetry guides firms’ decisions either towards or away from the optimal capital structure.
It is clear that the leverage adjustment speed depends on the financial surplus and financial deficit of the firm, however, as argued by Byoun (2008), the pecking-order theory alone could not provide us with a complete explanation on how the leverage adjustment speed is affected. We thus extend his framework by introducing an alternative, the trade-off based explanation that is linked to the findings obtained by Strebulaev (2007). He argues that the above (below) optimally levered firms with a financial deficit (surplus) adjust faster than their peers due to the fact that they are more likely to reach the “refinancing point”, which requires an active response from the firm.
To control for the forces beyond the traditional trade-off theory model, we test a unified capital structure model that accommodates interactions of forces proposed by various capital structure theories. We first calculate the firm’s financial deficit (FDi,t). A positive value of FDi,t indicates that the firm does not generate enough internal funds to cover its needs and that it has a financial deficit. A negative value of FDi,t indicates, on the contrary,
K. STEGOVEC, M. ČRNIGOJ | OPTIMAL CAPITAL STRUCTURE AND LEVERAGE ... 269
that the firm has a financial surplus. We use an approach similar to the one of Kayhan and Titman (2007) and Byoun (2008), according to which financial deficit is calculated as follows:
FDi,t = Divi,t + Invi,t + ΔWCi,t – NIi,t (4)
where Invi,t denotes the yearly net investment in fixed assets, ΔWCi,t is the change in the net working capital, while NIi,t represents the net income.6
Based on the value of the firm’s financial deficit (FDi,t), we calculate two dummy variables. The dummy variable Di,t
surplus takes value 1 if the firm has a financial surplus and is 0 otherwise. The dummy variable Di,t
deficit takes value 1 if the firm has a financial deficit and is 0 otherwise.
A partial adjustment model that incorporates information about the firm’s cash flow imbalances, as well as its leverage relative to the optimal capital structure, can be written as:
RAdji,t = α + λ1 ✳ OAdji,t ✳ Di,tabove ✳ Di,t
surplus + λ2 ✳ OAdji,t ✳ Di,tabove ✳ Di,t
deficit + λ3 ✳ OAdji,t ✳ Di,t
below ✳ Di,tsurplus + λ4 ✳ OAdji,t ✳ Di,t
below ✳ Di,tdeficit + εi,t (5)
Not least, to estimate the impact of the recent financial crisis, we expand our models from equitation (2) and equation (3) by including a dummy variable Dt
crisis which takes the value 1 in the years after the emergence of the crisis and 0 otherwise. We expect that the leverage adjustment speed decreases during the crisis, as the troubles in financial sector are likely to impede availability of financial resources, while the economic downturn hampers the firm’s profitability. Such results would show that the market timing factors related to the external supply of debt and equity also have important implications for the capital structure choice.
Being aware of the possible differences in the optimal capital structure choice and its dynamics in public and private firms, we estimate the leverage adjustment speed, as well as the optimal capital structure model separately for public and private firms. Due to the fact that we are particularly interested in the European private firms and we expect high heterogeneity within this group, we estimate the leverage adjustment speed also separately for three different groups of private firms according to the size of the firm. We construct groups based on the value of total assets; in the first group we included the firms with total assets below 10 million EUR, in the second group we included the firms with total assets between 10 and 100 million EUR, while the third group includes the firms with total assets larger than 100 million EUR.
6 As we do not have data about firms’ pay-out policies, we set Divi,t = 0.
ECONOMIC AND BUSINESS REVIEW | VOL. 22 | No. 2 | 2020 270
We estimate the optimal capital structure model using a panel regression model with fixed effects. Petersen (2009) argues that in short datasets the use of a fixed effect model is appropriate because in such a setting it is hard to differentiate between a permanent (fixed) effect and a temporary effect. In addition, Lemmon et al. (2008) show that the firm’s leverage remains stable over a long period of time and that most of the variation in leverage is time-invariant. Graham and Leary (2011), and Rauh and Sufi (2012) argue that the firm’s fixed effect is a crucial determinant of capital structure. However, in a recent study, DeAngelo and Roll (2015) come to a different conclusion about the capital structure developments over the long run, but note that in the short run the capital structure stability hypothesis is not violated. Partial adjustment models outlined in equation (2), equation (3) and equation (5) are estimated using OLS. Due to the overlapping intervals, the bootstrapping technique is applied to determine the statistical significance of the estimated coefficients (Kayhan and Titman,2007).7
4 DATA
We use the data from the Bureau van Dijk’s Amadeus database. Our sample consists of firms from EU15 countries excluding Austria, Denmark and Luxembourg because we lack reliable information on the financial debt for the firms from these countries. The analysis is based on an unbalanced panel for the period 2006-2012. As typical for capital structure research, we exclude banking and insurance companies (NACE revision 2 codes K64 and K65) for the reason of their capital structure being subject to regulatory rules, and utility firms (NACE revision 2 codes D35 to E39) for the reason of usually operating under special government concessions. We limit our sample to the firms that had at least 2 million EUR of total assets at the end of year 2012. Our panel consists of 1,188,762 firm-year observations and 183,130 unique firms,8 with 14,570 firm-year observations of public firms and 1,174,192 firm-years observations of private firms.
As seen in Table 2, there are significant differences in the size of an average public and private firm. Public firms are significantly larger on average than private firms. The distribution of sales, net income and number of employees is skewed to the right for both private and public firms which indicates the presence of some very large firms in both groups.
7 The bootstrapping technique derives standard errors that are robust to heteroscedasticity and autocorrelation concerns.
8 The firm-year observations that do not contain all the variables needed for the calculation of the optimal capital structure determinants are excluded and the data bellow and above the 1st and 99th percentile winsorized in order to remove any outliers from our analysis.
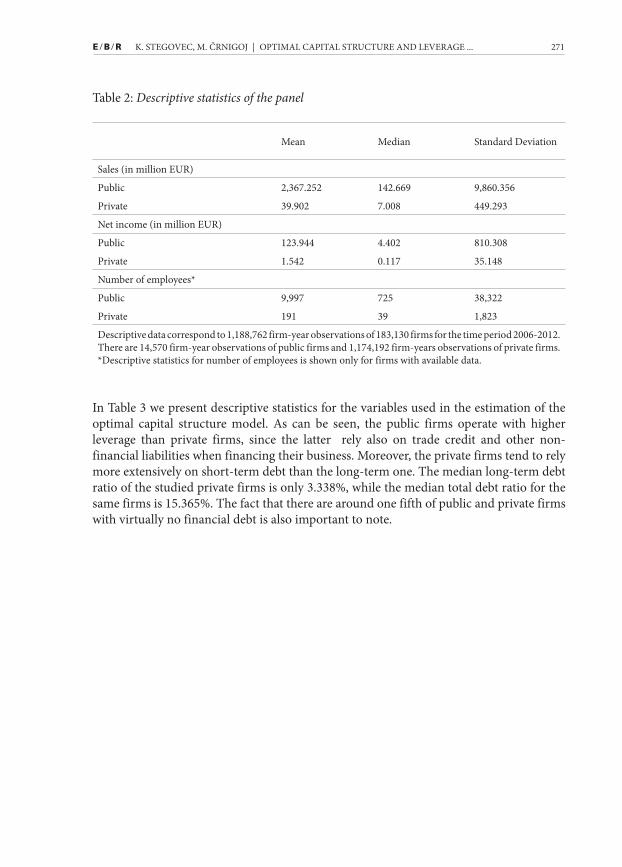
K. STEGOVEC, M. ČRNIGOJ | OPTIMAL CAPITAL STRUCTURE AND LEVERAGE ... 271
Table 2: Descriptive statistics of the panel
In Table 3 we present descriptive statistics for the variables used in the estimation of the optimal capital structure model. As can be seen, the public firms operate with higher leverage than private firms, since the latter rely also on trade credit and other non-financial liabilities when financing their business. Moreover, the private firms tend to rely more extensively on short-term debt than the long-term one. The median long-term debt ratio of the studied private firms is only 3.338%, while the median total debt ratio for the same firms is 15.365%. The fact that there are around one fifth of public and private firms with virtually no financial debt is also important to note.
Mean Median Standard Deviation
Sales (in million EUR)
Public 2,367.252 142.669 9,860.356
Private 39.902 7.008 449.293
Net income (in million EUR)
Public 123.944 4.402 810.308
Private 1.542 0.117 35.148
Number of employees*
Public 9,997 725 38,322
Private 191 39 1,823
Descriptive data correspond to 1,188,762 firm-year observations of 183,130 firms for the time period 2006-2012. There are 14,570 firm-year observations of public firms and 1,174,192 firm-years observations of private firms. *Descriptive statistics for number of employees is shown only for firms with available data.
ECONOMIC AND BUSINESS REVIEW | VOL. 22 | No. 2 | 2020 272
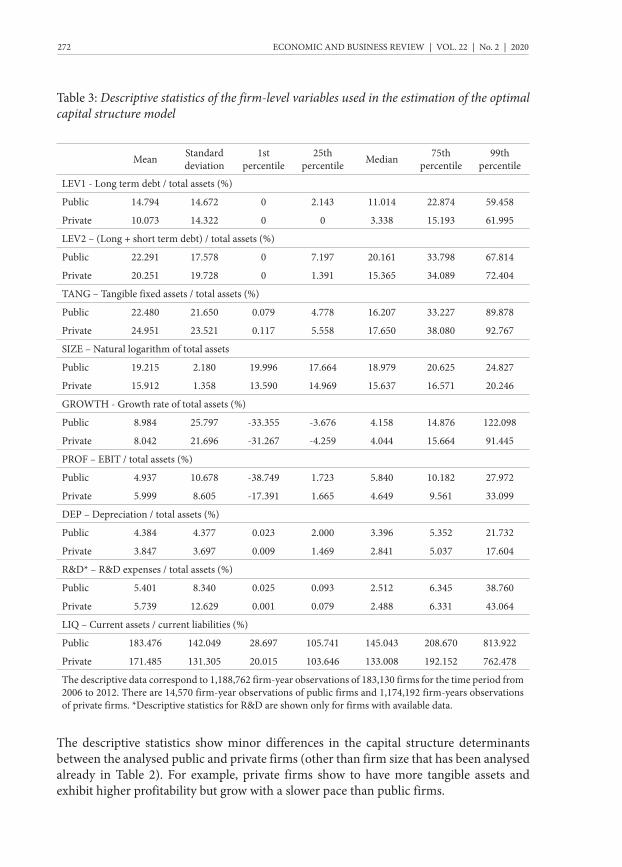
Table 3: Descriptive statistics of the firm-level variables used in the estimation of the optimal capital structure model
The descriptive statistics show minor differences in the capital structure determinants between the analysed public and private firms (other than firm size that has been analysed already in Table 2). For example, private firms show to have more tangible assets and exhibit higher profitability but grow with a slower pace than public firms.
Mean Standard deviation
1st percentile
25th percentile Median 75th
percentile99th
percentile
LEV1 - Long term debt / total assets (%)
Public 14.794 14.672 0 2.143 11.014 22.874 59.458
Private 10.073 14.322 0 0 3.338 15.193 61.995
LEV2 – (Long + short term debt) / total assets (%)
Public 22.291 17.578 0 7.197 20.161 33.798 67.814
Private 20.251 19.728 0 1.391 15.365 34.089 72.404
TANG – Tangible fixed assets / total assets (%)
Public 22.480 21.650 0.079 4.778 16.207 33.227 89.878
Private 24.951 23.521 0.117 5.558 17.650 38.080 92.767
SIZE – Natural logarithm of total assets
Public 19.215 2.180 19.996 17.664 18.979 20.625 24.827
Private 15.912 1.358 13.590 14.969 15.637 16.571 20.246
GROWTH - Growth rate of total assets (%)
Public 8.984 25.797 -33.355 -3.676 4.158 14.876 122.098
Private 8.042 21.696 -31.267 -4.259 4.044 15.664 91.445
PROF – EBIT / total assets (%)
Public 4.937 10.678 -38.749 1.723 5.840 10.182 27.972
Private 5.999 8.605 -17.391 1.665 4.649 9.561 33.099
DEP – Depreciation / total assets (%)
Public 4.384 4.377 0.023 2.000 3.396 5.352 21.732
Private 3.847 3.697 0.009 1.469 2.841 5.037 17.604
R&D* – R&D expenses / total assets (%)
Public 5.401 8.340 0.025 0.093 2.512 6.345 38.760
Private 5.739 12.629 0.001 0.079 2.488 6.331 43.064
LIQ – Current assets / current liabilities (%)
Public 183.476 142.049 28.697 105.741 145.043 208.670 813.922
Private 171.485 131.305 20.015 103.646 133.008 192.152 762.478
The descriptive data correspond to 1,188,762 firm-year observations of 183,130 firms for the time period from 2006 to 2012. There are 14,570 firm-year observations of public firms and 1,174,192 firm-years observations of private firms. *Descriptive statistics for R&D are shown only for firms with available data.
K. STEGOVEC, M. ČRNIGOJ | OPTIMAL CAPITAL STRUCTURE AND LEVERAGE ... 273
5 RESULTS
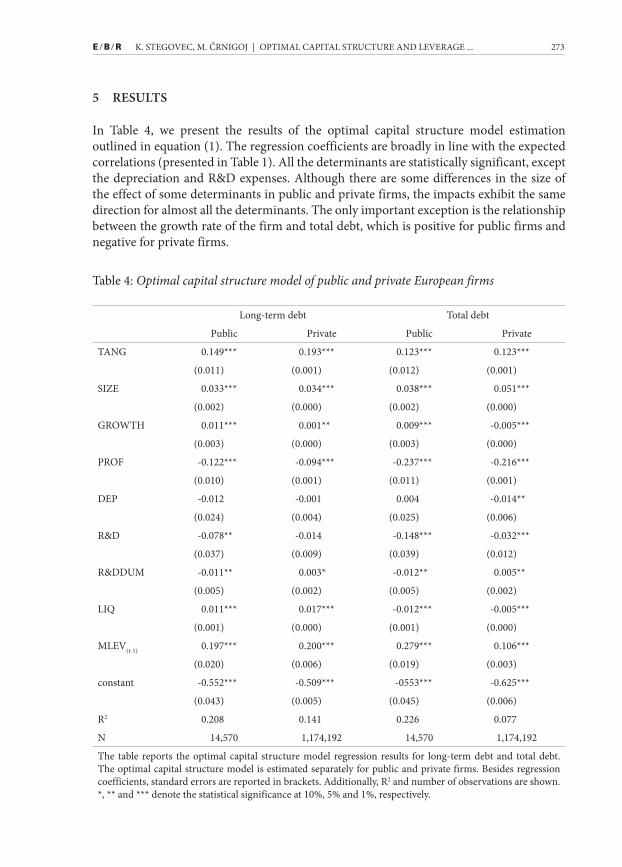
In Table 4, we present the results of the optimal capital structure model estimation outlined in equation (1). The regression coefficients are broadly in line with the expected correlations (presented in Table 1). All the determinants are statistically significant, except the depreciation and R&D expenses. Although there are some differences in the size of the effect of some determinants in public and private firms, the impacts exhibit the same direction for almost all the determinants. The only important exception is the relationship between the growth rate of the firm and total debt, which is positive for public firms and negative for private firms.
Table 4: Optimal capital structure model of public and private European firms
Long-term debt Total debt
Public Private Public Private
TANG 0.149*** 0.193*** 0.123*** 0.123***
(0.011) (0.001) (0.012) (0.001)
SIZE 0.033*** 0.034*** 0.038*** 0.051***
(0.002) (0.000) (0.002) (0.000)
GROWTH 0.011*** 0.001** 0.009*** -0.005***
(0.003) (0.000) (0.003) (0.000)
PROF -0.122*** -0.094*** -0.237*** -0.216***
(0.010) (0.001) (0.011) (0.001)
DEP -0.012 -0.001 0.004 -0.014**
(0.024) (0.004) (0.025) (0.006)
R&D -0.078** -0.014 -0.148*** -0.032***
(0.037) (0.009) (0.039) (0.012)
R&DDUM -0.011** 0.003* -0.012** 0.005**
(0.005) (0.002) (0.005) (0.002)
LIQ 0.011*** 0.017*** -0.012*** -0.005***
(0.001) (0.000) (0.001) (0.000)
MLEV(t-1) 0.197*** 0.200*** 0.279*** 0.106***
(0.020) (0.006) (0.019) (0.003)
constant -0.552*** -0.509*** -0553*** -0.625***
(0.043) (0.005) (0.045) (0.006)
R2 0.208 0.141 0.226 0.077
N 14,570 1,174,192 14,570 1,174,192
The table reports the optimal capital structure model regression results for long-term debt and total debt. The optimal capital structure model is estimated separately for public and private firms. Besides regression coefficients, standard errors are reported in brackets. Additionally, R2 and number of observations are shown. *, ** and *** denote the statistical significance at 10%, 5% and 1%, respectively.
ECONOMIC AND BUSINESS REVIEW | VOL. 22 | No. 2 | 2020 274
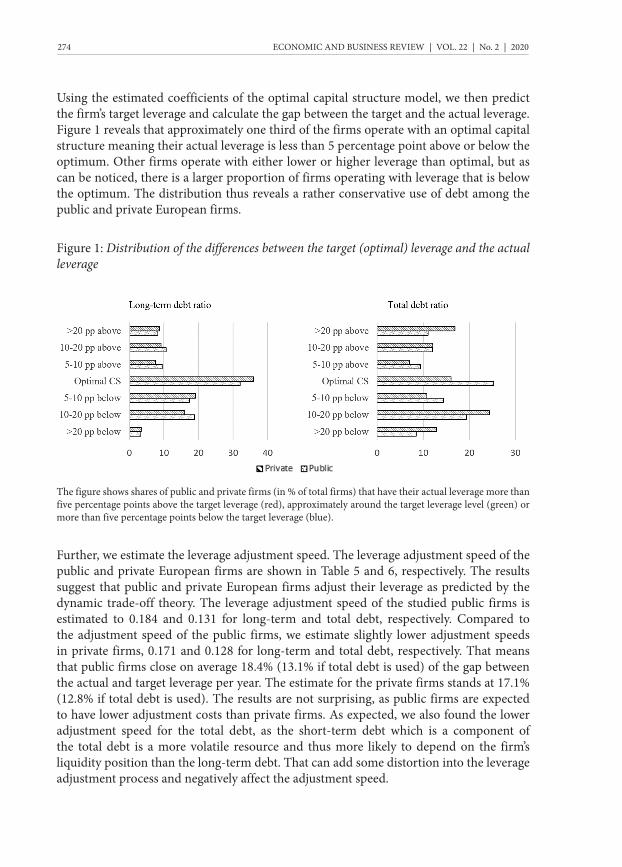
Using the estimated coefficients of the optimal capital structure model, we then predict the firm’s target leverage and calculate the gap between the target and the actual leverage. Figure 1 reveals that approximately one third of the firms operate with an optimal capital structure meaning their actual leverage is less than 5 percentage point above or below the optimum. Other firms operate with either lower or higher leverage than optimal, but as can be noticed, there is a larger proportion of firms operating with leverage that is below the optimum. The distribution thus reveals a rather conservative use of debt among the public and private European firms.
Figure 1: Distribution of the differences between the target (optimal) leverage and the actual leverage
The figure shows shares of public and private firms (in % of total firms) that have their actual leverage more than five percentage points above the target leverage (red), approximately around the target leverage level (green) or more than five percentage points below the target leverage (blue).
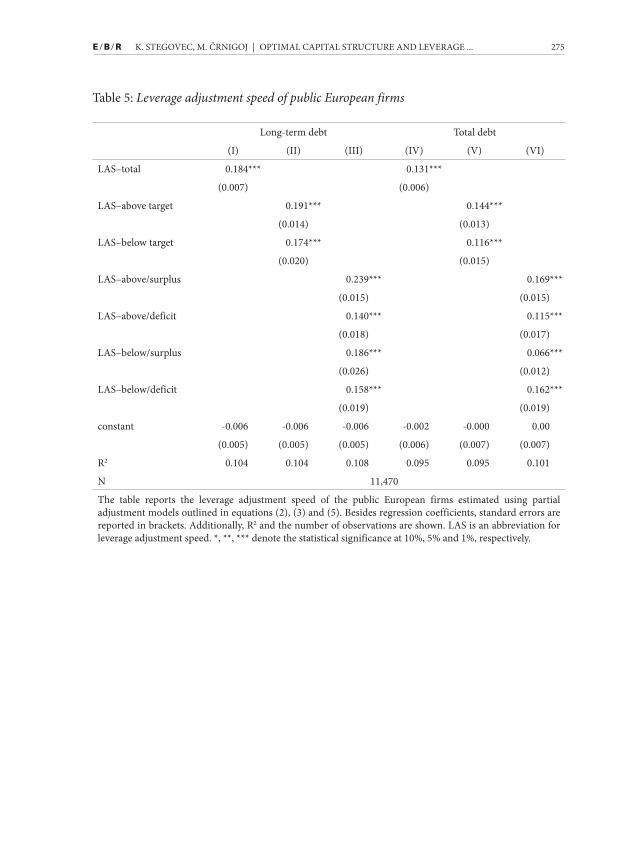
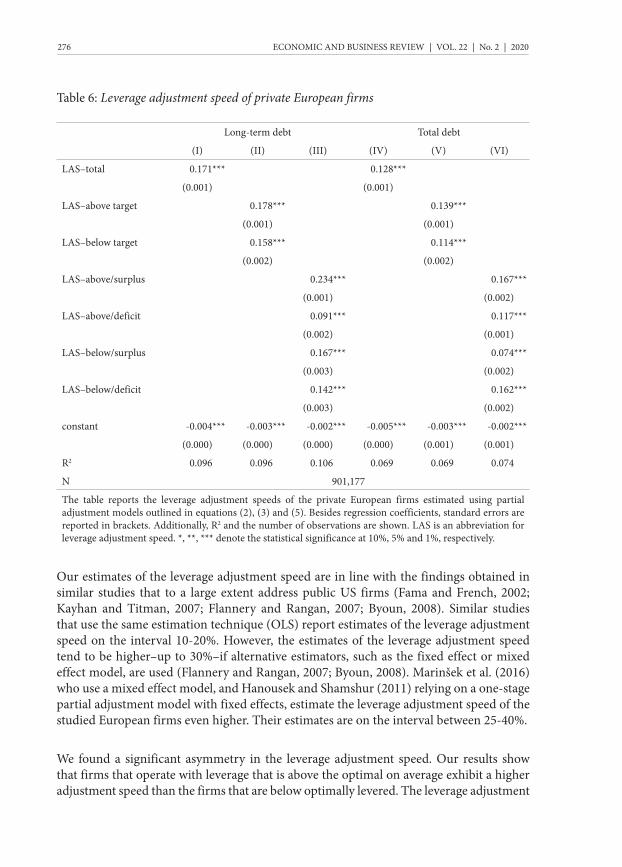
Further, we estimate the leverage adjustment speed. The leverage adjustment speed of the public and private European firms are shown in Table 5 and 6, respectively. The results suggest that public and private European firms adjust their leverage as predicted by the dynamic trade-off theory. The leverage adjustment speed of the studied public firms is estimated to 0.184 and 0.131 for long-term and total debt, respectively. Compared to the adjustment speed of the public firms, we estimate slightly lower adjustment speeds in private firms, 0.171 and 0.128 for long-term and total debt, respectively. That means that public firms close on average 18.4% (13.1% if total debt is used) of the gap between the actual and target leverage per year. The estimate for the private firms stands at 17.1% (12.8% if total debt is used). The results are not surprising, as public firms are expected to have lower adjustment costs than private firms. As expected, we also found the lower adjustment speed for the total debt, as the short-term debt which is a component of the total debt is a more volatile resource and thus more likely to depend on the firm’s liquidity position than the long-term debt. That can add some distortion into the leverage adjustment process and negatively affect the adjustment speed.
K. STEGOVEC, M. ČRNIGOJ | OPTIMAL CAPITAL STRUCTURE AND LEVERAGE ... 275
Table 5: Leverage adjustment speed of public European firms
Long-term debt Total debt
(I) (II) (III) (IV) (V) (VI)
LAS–total 0.184*** 0.131***
(0.007) (0.006)
LAS–above target 0.191*** 0.144***
(0.014) (0.013)
LAS–below target 0.174*** 0.116***
(0.020) (0.015)
LAS–above/surplus 0.239*** 0.169***
(0.015) (0.015)
LAS–above/deficit 0.140*** 0.115***
(0.018) (0.017)
LAS–below/surplus 0.186*** 0.066***
(0.026) (0.012)
LAS–below/deficit 0.158*** 0.162***
(0.019) (0.019)
constant -0.006 -0.006 -0.006 -0.002 -0.000 0.00
(0.005) (0.005) (0.005) (0.006) (0.007) (0.007)
R2 0.104 0.104 0.108 0.095 0.095 0.101
N 11,470
The table reports the leverage adjustment speed of the public European firms estimated using partial adjustment models outlined in equations (2), (3) and (5). Besides regression coefficients, standard errors are reported in brackets. Additionally, R2 and the number of observations are shown. LAS is an abbreviation for leverage adjustment speed. *, **, *** denote the statistical significance at 10%, 5% and 1%, respectively.
ECONOMIC AND BUSINESS REVIEW | VOL. 22 | No. 2 | 2020 276
Table 6: Leverage adjustment speed of private European firms
Our estimates of the leverage adjustment speed are in line with the findings obtained in similar studies that to a large extent address public US firms (Fama and French, 2002; Kayhan and Titman, 2007; Flannery and Rangan, 2007; Byoun, 2008). Similar studies that use the same estimation technique (OLS) report estimates of the leverage adjustment speed on the interval 10-20%. However, the estimates of the leverage adjustment speed tend to be higher–up to 30%–if alternative estimators, such as the fixed effect or mixed effect model, are used (Flannery and Rangan, 2007; Byoun, 2008). Marinšek et al. (2016) who use a mixed effect model, and Hanousek and Shamshur (2011) relying on a one-stage partial adjustment model with fixed effects, estimate the leverage adjustment speed of the studied European firms even higher. Their estimates are on the interval between 25-40%.
We found a significant asymmetry in the leverage adjustment speed. Our results show that firms that operate with leverage that is above the optimal on average exhibit a higher adjustment speed than the firms that are below optimally levered. The leverage adjustment
Long-term debt Total debt
(I) (II) (III) (IV) (V) (VI)
LAS–total 0.171*** 0.128***
(0.001) (0.001)
LAS–above target 0.178*** 0.139***
(0.001) (0.001)
LAS–below target 0.158*** 0.114***
(0.002) (0.002)
LAS–above/surplus 0.234*** 0.167***
(0.001) (0.002)
LAS–above/deficit 0.091*** 0.117***
(0.002) (0.001)
LAS–below/surplus 0.167*** 0.074***
(0.003) (0.002)
LAS–below/deficit 0.142*** 0.162***
(0.003) (0.002)
constant -0.004*** -0.003*** -0.002*** -0.005*** -0.003*** -0.002***
(0.000) (0.000) (0.000) (0.000) (0.001) (0.001)
R2 0.096 0.096 0.106 0.069 0.069 0.074
N 901,177
The table reports the leverage adjustment speeds of the private European firms estimated using partial adjustment models outlined in equations (2), (3) and (5). Besides regression coefficients, standard errors are reported in brackets. Additionally, R2 and the number of observations are shown. LAS is an abbreviation for leverage adjustment speed. *, **, *** denote the statistical significance at 10%, 5% and 1%, respectively.
K. STEGOVEC, M. ČRNIGOJ | OPTIMAL CAPITAL STRUCTURE AND LEVERAGE ... 277
speed estimates of the above optimally levered firms are between 10-25% higher than the estimates for the below optimally levered firms for both, long-term and total debt. Byoun (2008), for example, reports a slightly more pronounced asymmetry in the adjustment speed between the above and below optimally levered public US firms.
Moreover, we documented significant effects of the firm’s cash flow imbalances. We ascertained that the above optimally levered firms that have a financial surplus exhibit a higher leverage adjustment speed. The result is consistent with the pecking-order explanation and is in line with the results obtained by Byoun (2008). The differences in the adjustment speed of the firms with a financial surplus and those with a financial deficit are more evident in the models with the long-term debt, implying that the financial surplus is being primarily used to lower the long-term debt. On the other hand, the positive adjustment speed found for the above optimally levered firms with a financial deficit point to the leverage adjustment consistent with the trade-off rationale (Strebulaev, 2007), according to which firms that have accumulated too much debt divest by selling their assets or issue new equity to rebalance their capital structures. On the other hand, we detected to some extent different capital structure dynamics for the below optimally levered EU firms, when compared to the behaviour of the US public firms (as found by Byoun, 2008). Our results show that the leverage adjustment speed for the long-term debt is approximately 15% higher for the firms with a financial surplus in comparison to those with a financial deficit. The obtained results are however consistent with the trade-off theory, as well-performing firms that operate with large profits issue debt to take advantage of the interest tax shield. Moreover, one can also infer that the supply of debt impacts corporate capital structure decisions, as creditors are unwilling to enter in long-term relationship with the firms with insufficient probability of survival. For total debt we found a significantly lower leverage adjustment speed for the firms with a financial surplus than for those with a financial deficit, which indicates that the below optimally levered firms with a financial deficit rely heavily on short-term financing that carries less debt-related agency problems (Titman and Wessels, 1988). Again, both the pecking-order and the trade-off theories should be considered when explaining the impact of financial performance of firms on their leverage adjustment process.
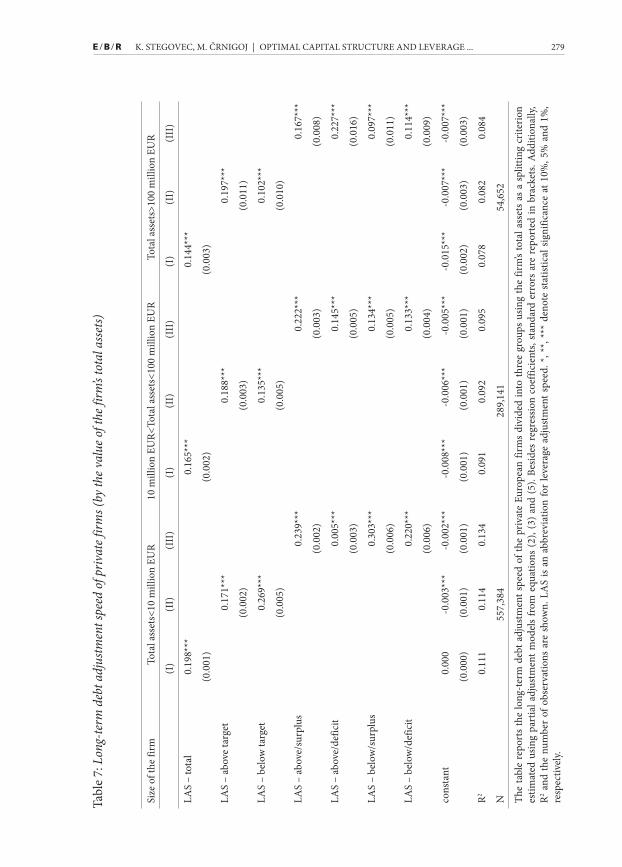
Next, we estimate the leverage adjustment speed for private firms of different sizes. As seen in Table 7 and Table 8, the leverage adjustment speed is on average negatively associated with the size of the firms. It can be noticed that there are far the largest differences in the leverage adjustment speed identified for the below optimally levered private firms. The observed decrease in the leverage adjustment speeds between the group of the smallest and the largest private firms of the below optimally levered private firms is approximately 60% (from 0.269 to 0.102) and 80% (from 0.225 to 0.043) for long -term and total debt, respectively. However, the leverage adjustment speeds of the above optimally levered private firms remain more stable along the groups of firms of different sizes (or slightly increase with the size). Furthermore, the smallest group of the below optimally levered private firms exhibits a higher adjustment speed than the smallest above optimally levered private firms, indicating a certain level of aggression in the use of debt, a relatively low
ECONOMIC AND BUSINESS REVIEW | VOL. 22 | No. 2 | 2020 278
ability to control excessive leverage, pointing to a high risk taking appetite of those private firms.9 The same phenomenon is not observed for larger private firms, as the above optimally levered firms adjust faster towards the target leverage than the below optimally levered firms. Even more, the asymmetries between the leverage adjustment speed of both the above and below optimally levered private firms with more than 10 million EUR of total assets are higher than those found for public firms. This leads us to the conclusion that larger private firms are likely to be more risk averse than public firms in the capital structure choice.
When estimating the impact of the firm’s cash flow imbalances on the leverage adjustment speed, we notice that again both the pecking-order and the trade-off theories should be used to explain the leverage adjustment process. As found for the sample of public and the sample of private firms, a financial surplus enables the above optimally levered firms to adjust their capital structure towards the target leverage faster than the firms operating with a financial deficit. However, we found that the firm’s cash flows imbalances only marginally impact the leverage adjustment speed of the below optimally levered private firms from the two groups of the largest private firms, leading us to a conclusion that it is hard to distinguish whether the pecking-order or the trade-off theory is the dominant explanation for the leverage adjustment process of those firms. On the other hand, leverage dynamics is much more interesting for the group of the smallest below optimally levered private firms. We observe the below optimally levered private firms operating with a financial surplus to have a higher leverage adjustment speed for long-term debt than the comparable firms with a financial deficit (0.303 versus 0.220). The trade-off consistent leverage adjustment process also points to a limited access to a long-term debt for the smallest private firms, as the smallest below optimally levered private firms with a financial deficit rely mainly on short-term debt financing.10
9 Additionally, Croci et al. (2011) argue that debt financing can be viewed as a non-control-diluting security for family controlled firms, while those firms issue external equity only rarely. The majority of the smallest firms from our sample are likely to be family controlled.
10 The leverage adjustment speed of the smallest below optimally levered private firms operating with a financial deficit is 0.318, which is considerably higher in comparison to similar firms operating with a financial surplus, which stands at 0.126.
K. STEGOVEC, M. ČRNIGOJ | OPTIMAL CAPITAL STRUCTURE AND LEVERAGE ... 279
Size
of t
he fi
rmTo
tal a
sset
s<10
mill
ion
EUR
10 m
illio
n EU
R<To
tal a
sset
s<10
0 m
illio
n EU
RTo
tal a
sset
s>10
0 m
illio
n EU
R
(I)
(II)
(III
)(I
)(I
I)(I
II)
(I)
(II)
(III
)
LAS
– to
tal
0.19
8***
0.16
5***
0.14
4***
(0.0
01)
(0.0
02)
(0.0
03)
LAS
– ab
ove
targ
et
0.17
1***
0.18
8***
0.19
7***
(0.0
02)
(0.0
03)
(0.0
11)
LAS
– be
low
targ
et0.
269*
**0.
135*
**0.
102*
**
(0.0
05)
(0.0
05)
(0.0
10)
LAS
– ab
ove/
surp
lus
0.23
9***
0.22
2***
0.16
7***
(0.0
02)
(0.0
03)
(0.0
08)
LAS
– ab
ove/
defic
it0.
005*
**0.
145*
**0.
227*
**
(0.0
03)
(0.0
05)
(0.0
16)
LAS
– be
low
/sur
plus
0.30
3***
0.13
4***
0.09
7***
(0.0
06)
(0.0
05)
(0.0
11)
LAS
– be
low
/def
icit
0.22
0***
0.13
3***
0.11
4***
(0.0
06)
(0.0
04)
(0.0
09)
cons
tant
0.00
0-0
.003
***
-0.0
02**
*-0
.008
***
-0.0
06**
*-0
.005
***
-0.0
15**
*-0
.007
***
-0.0
07**
*
(0.0
00)
(0.0
01)
(0.0
01)
(0.0
01)
(0.0
01)
(0.0
01)
(0.0
02)
(0.0
03)
(0.0
03)
R20.
111
0.11
40.
134
0.09
10.
092
0.09
50.
078
0.08
20.
084
N55
7,38
428
9,14
154
,652
The
tabl
e re
port
s th
e lo
ng-t
erm
deb
t adj
ustm
ent s
peed
of t
he p
rivat
e Eu
rope
an fi
rms
divi
ded
into
thre
e gr
oups
usin
g th
e fir
m’s
tota
l ass
ets
as a
spl
ittin
g cr
iterio
n es
timat
ed u
sing
part
ial a
djus
tmen
t mod
els
from
equ
atio
ns (
2), (
3) a
nd (
5). B
esid
es r
egre
ssio
n co
effic
ient
s, st
anda
rd e
rror
s ar
e re
port
ed in
bra
cket
s. A
dditi
onal
ly,
R2 and
the
num
ber
of o
bser
vatio
ns a
re s
how
n. L
AS
is an
abb
revi
atio
n fo
r le
vera
ge a
djus
tmen
t spe
ed. *
, **,
***
deno
te s
tatis
tical
sig
nific
ance
at 1
0%, 5
% a
nd 1
%,
resp
ectiv
ely.
Tabl
e 7:
Lon
g-te
rm d
ebt a
djus
tmen
t spe
ed o
f priv
ate f
irms (
by th
e val
ue o
f the
firm
’s to
tal a
sset
s)

ECONOMIC AND BUSINESS REVIEW | VOL. 22 | No. 2 | 2020 280
Size
of t
he fi
rmTo
tal a
sset
s<10
mill
ion
EUR
10 m
illio
n EU
R<To
tal a
sset
s<10
0 m
illio
n EU
RTo
tal a
sset
s>10
0 m
illio
n EU
R
(I)
(II)
(III
)(I
)(I
I)(I
II)
(I)
(II)
(III
)
LAS
– to
tal
0.16
0***
0.10
7***
0.09
9***
(0.0
01)
(0.0
01)
(0.0
02)
LAS
– ab
ove
targ
et
0.12
9***
0.13
2***
0.23
1***
(0.0
02)
(0.0
03)
(0.0
09)
LAS
– be
low
targ
et0.
225*
**0.
081*
**0.
043*
**
(0.0
04)
(0.0
03)
(0.0
05)
LAS
– ab
ove/
surp
lus
0.15
4***
0.17
6***
0.26
6***
(0.0
02)
(0.0
03)
(0.0
12)
LAS
– ab
ove/
defic
it0.
117*
**0.
093*
**0.
200*
**
(0.0
02)
(0.0
03)
(0.0
11)
LAS
– be
low
/sur
plus
0.12
6***
0.06
7***
0.04
5***
(0.0
04)
(0.0
03)
(0.0
05)
LAS
– be
low
/def
icit
0.31
8***
0.10
2***
0.04
2***
(0.0
05)
(0.0
03)
(0.0
05)
Con
stan
t-0
.000
-0.0
06**
*-0
.003
***
-0.0
09**
*-0
.005
***
-0.0
04**
*-0
.019
***
-0.0
03-0
.003
(0.0
01)
(0.0
01)
(0.0
01)
(0.0
01)
(0.0
01)
(0.0
01)
(0.0
02)
(0.0
02)
(0.0
02)
R20.
088
0.09
00.
099
0.05
60.
058
0.06
20.
051
0.06
80.
069
N55
7,38
428
9,14
154
,652
The t
able
repo
rts t
he to
tal d
ebt a
djus
tmen
t spe
ed o
f the
priv
ate E
urop
ean
firm
s div
ided
into
thre
e gro
ups u
sing
the f
irm’s
tota
l ass
ets a
s a sp
littin
g cr
iterio
n es
timat
ed
usin
g th
e pa
rtia
l adj
ustm
ent m
odel
s fr
om e
quat
ions
(2),
(3) a
nd (5
). Be
sides
the
regr
essio
n co
effic
ient
s, st
anda
rd e
rror
s ar
e re
port
ed in
bra
cket
s. A
dditi
onal
ly, R
2 an
d th
e nu
mbe
r of
obs
erva
tions
are
sho
wn.
LA
S is
an a
bbre
viat
ion
for
the
leve
rage
adj
ustm
ent s
peed
. *, *
*, **
* de
note
sta
tistic
al s
igni
fican
ce a
t 10%
, 5%
and
1%
, re
spec
tivel
y.
Tabl
e 8:
Tot
al d
ebt a
djus
tmen
t spe
ed o
f priv
ate f
irms (
by th
e val
ue o
f the
firm
’s to
tal a
sset
s)
K. STEGOVEC, M. ČRNIGOJ | OPTIMAL CAPITAL STRUCTURE AND LEVERAGE ... 281
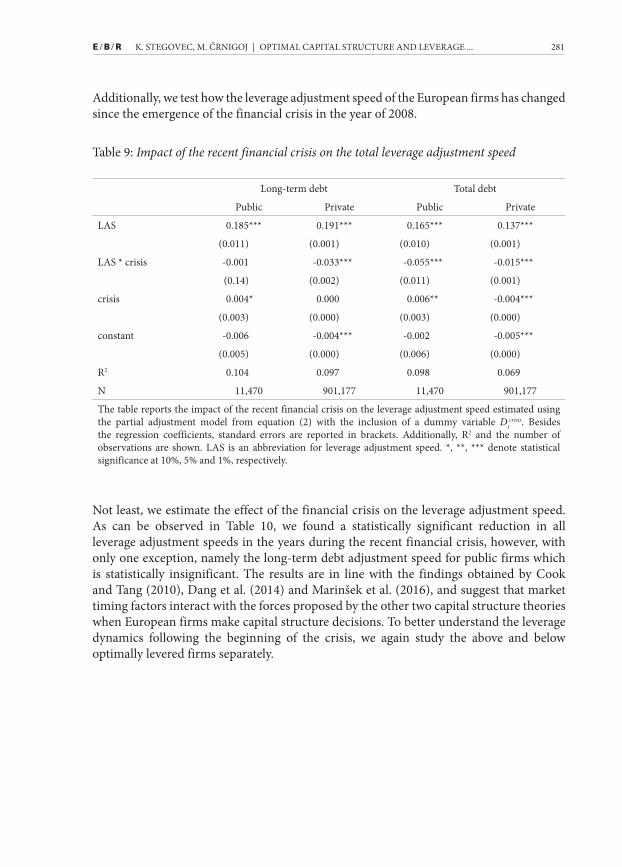
Additionally, we test how the leverage adjustment speed of the European firms has changed since the emergence of the financial crisis in the year of 2008.
Table 9: Impact of the recent financial crisis on the total leverage adjustment speed
Not least, we estimate the effect of the financial crisis on the leverage adjustment speed. As can be observed in Table 10, we found a statistically significant reduction in all leverage adjustment speeds in the years during the recent financial crisis, however, with only one exception, namely the long-term debt adjustment speed for public firms which is statistically insignificant. The results are in line with the findings obtained by Cook and Tang (2010), Dang et al. (2014) and Marinšek et al. (2016), and suggest that market timing factors interact with the forces proposed by the other two capital structure theories when European firms make capital structure decisions. To better understand the leverage dynamics following the beginning of the crisis, we again study the above and below optimally levered firms separately.
Long-term debt Total debt
Public Private Public Private
LAS 0.185*** 0.191*** 0.165*** 0.137***
(0.011) (0.001) (0.010) (0.001)
LAS * crisis -0.001 -0.033*** -0.055*** -0.015***
(0.14) (0.002) (0.011) (0.001)
crisis 0.004* 0.000 0.006** -0.004***
(0.003) (0.000) (0.003) (0.000)
constant -0.006 -0.004*** -0.002 -0.005***
(0.005) (0.000) (0.006) (0.000)
R2 0.104 0.097 0.098 0.069
N 11,470 901,177 11,470 901,177
The table reports the impact of the recent financial crisis on the leverage adjustment speed estimated using the partial adjustment model from equation (2) with the inclusion of a dummy variable Dt
crisis. Besides the regression coefficients, standard errors are reported in brackets. Additionally, R2 and the number of observations are shown. LAS is an abbreviation for leverage adjustment speed. *, **, *** denote statistical significance at 10%, 5% and 1%, respectively.
ECONOMIC AND BUSINESS REVIEW | VOL. 22 | No. 2 | 2020 282
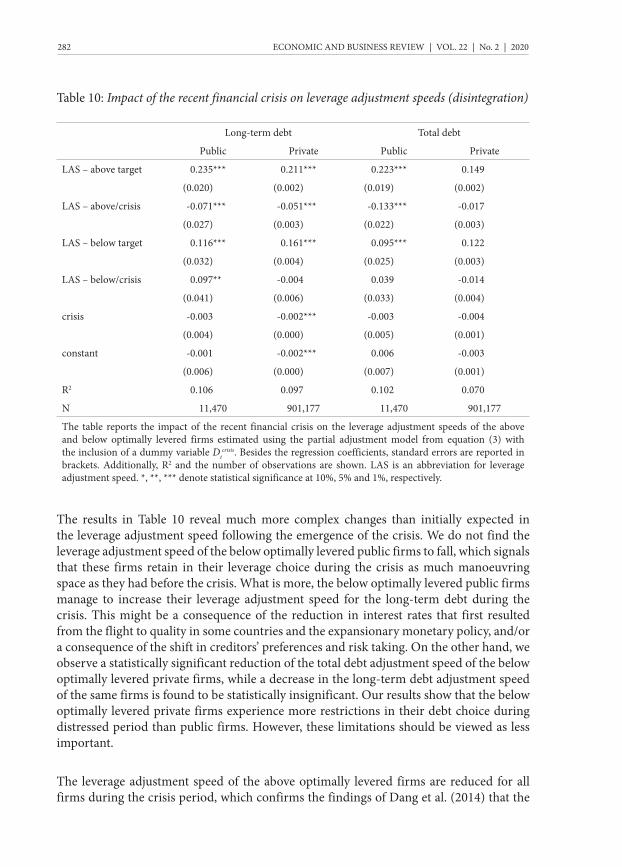
Table 10: Impact of the recent financial crisis on leverage adjustment speeds (disintegration)
The results in Table 10 reveal much more complex changes than initially expected in the leverage adjustment speed following the emergence of the crisis. We do not find the leverage adjustment speed of the below optimally levered public firms to fall, which signals that these firms retain in their leverage choice during the crisis as much manoeuvring space as they had before the crisis. What is more, the below optimally levered public firms manage to increase their leverage adjustment speed for the long-term debt during the crisis. This might be a consequence of the reduction in interest rates that first resulted from the flight to quality in some countries and the expansionary monetary policy, and/or a consequence of the shift in creditors’ preferences and risk taking. On the other hand, we observe a statistically significant reduction of the total debt adjustment speed of the below optimally levered private firms, while a decrease in the long-term debt adjustment speed of the same firms is found to be statistically insignificant. Our results show that the below optimally levered private firms experience more restrictions in their debt choice during distressed period than public firms. However, these limitations should be viewed as less important.
The leverage adjustment speed of the above optimally levered firms are reduced for all firms during the crisis period, which confirms the findings of Dang et al. (2014) that the
Long-term debt Total debt
Public Private Public Private
LAS – above target 0.235*** 0.211*** 0.223*** 0.149
(0.020) (0.002) (0.019) (0.002)
LAS – above/crisis -0.071*** -0.051*** -0.133*** -0.017
(0.027) (0.003) (0.022) (0.003)
LAS – below target 0.116*** 0.161*** 0.095*** 0.122
(0.032) (0.004) (0.025) (0.003)
LAS – below/crisis 0.097** -0.004 0.039 -0.014
(0.041) (0.006) (0.033) (0.004)
crisis -0.003 -0.002*** -0.003 -0.004
(0.004) (0.000) (0.005) (0.001)
constant -0.001 -0.002*** 0.006 -0.003
(0.006) (0.000) (0.007) (0.001)
R2 0.106 0.097 0.102 0.070
N 11,470 901,177 11,470 901,177
The table reports the impact of the recent financial crisis on the leverage adjustment speeds of the above and below optimally levered firms estimated using the partial adjustment model from equation (3) with the inclusion of a dummy variable Dt
crisis. Besides the regression coefficients, standard errors are reported in brackets. Additionally, R2 and the number of observations are shown. LAS is an abbreviation for leverage adjustment speed. *, **, *** denote statistical significance at 10%, 5% and 1%, respectively.
K. STEGOVEC, M. ČRNIGOJ | OPTIMAL CAPITAL STRUCTURE AND LEVERAGE ... 283
impact of the financial crisis on leverage adjustment speeds is asymmetric, with financially constrained firms being more adversely affected. While the decrease in the long-term debt adjustment speed is at around 25% when compared to the pre-crisis levels for both the above optimally levered public and private firms, the total debt adjustment speed is sharply reduced for the above optimally levered public firms and only marginally for the above optimally levered private firms, which is a rather unexpected outcome. For that reason, we also look at the profitability of the above optimally levered firms and notice that the median above optimally levered public firm was more profitable in the years before the crisis than the comparable private firm, while the opposite is true for the crisis period. Additionally, following the market timing theory of capital structure (Baker and Wurgler, 2002) or the dynamic pecking-order theory (Bessler et al., 2011), firms tend to issue new equity capital when share prices are high and the relative level of information asymmetry is low. As the European stock markets declined sharply during the crisis, we assume that the public firms’ propensities to issue new equity capital with the purpose of lowering their (short-term) leverage also decreased in the same time period.11
6 CONCLUSION
Our research paper looks into a large sample of the European public and private firms that have received significantly less attention in the existing literature and examine their capital structure choice. We estimate an empirical model that is based on a unified setting in which leverage targets remain consistent with the dynamic trade-off theory, while the leverage adjustment process depends on the interacting effects proposed by different capital structure theories. We estimate the leverage adjustment speed and point at factors that explain the differences in the leverage dynamics.
We find strong empirical evidence that the European firms adjust their leverage towards the optimal capital structure and that both public and private firms have a similar leverage adjustment speed. The above optimally levered firms are found to adjust faster than the below optimally levered firms, while the impact of the firm’s cash flow imbalances on the leverage adjustment process should be studied from both the trade-off and the pecking-order perspectives. The acquired results imply that private firms should have very similar adjustment costs and rebalance their capital structures as often as the public firms. Analysing private firms further, our results show that private firms represent a very diverse group of firms and that the size of the firm is a far more important factor that determines the capital structure dynamics than its public/private status. Somewhat in contrast to our expectations, we ascertain that smaller firms adjust their leverage towards the target faster than larger firms. Moreover, we observe the opposite asymmetry in the adjustment speed in the group of the smallest firms compared to the asymmetry found in the larger firms.
11 Taking into account all of our results, we additionally argue that the low asymmetry between the leverage adjustment speed of the above and below optimally levered firms reported in the Tables 5 and 6 might be a consequence of the recent financial crisis, as the above optimally levered firms experience a more pronounced reduction in leverage adjustment speeds during the period of stress than the below optimally levered firms.
ECONOMIC AND BUSINESS REVIEW | VOL. 22 | No. 2 | 2020 284
Analysing the group of the smallest firms, we find that the adjustment speed of the bellow optimally levered firms exceeds the adjustment speed of the above optimally levered firms.
Analysing the effect of the recent financial crisis, we document a reduction in the leverage adjustment speed for all firms on average. By disintegrating the total leverage adjustment speed into two components (separate estimations for the above and below optimally levered firms), we notice much more complex changes in the leverage adjustment speed than expected, with the above optimally levered firms being more adversely impacted than the below optimally levered firms.
Our findings have several important implications, as , on the one hand, they confirm the robustness of the dynamic trade-off theory outside the context of the US large public firms, and on the other hand, that including the interactive effects proposed by alternative capital structure theories can substantially contribute to the understanding of the complex leverage adjustment process. By incorporating parts of the pecking-order and the market timing related logic in the dynamic trade-off theory framework, we were able to better explain the leverage adjustment process compared to the explanation that would be obtained relying solely on the trade-off theory rationale. What is probably more important and goes beyond the test of the theory robustness is that the results imply that the idea of an optimal capital structure is not relevant only in large but also small firms. The results of our research show the optimal capital structure could prove even more important.
REFERENCES
Akbar, S., ur Rehman, S., and Ormrod, P. (2013). The Impact of Recent Financial Shocks on the Financing and Investment Policies of UK Private Firms. International Review of Financial Analysis, 26, 59-70.
Baker, M. and Wurgler, J. (2002). Market Timing and Capital Structure. The Journal of Finance, 57(1), 1-32.
Bartholdy, J. and Mateus, C. (2011). Debt and taxes for private firms. International Review of Financial Analysis, 20(3), 177-189.
Baxter, N. (1967). Leverage, Risk of Ruin, and the Cost of Capital.” Journal of Finance, 22(3), 395-403.
Bessler, W., Drobetz, W. and Grüninger, M. C. (2011). Information Asymmetry and Financing Decisions. International Review of Finance, 11(1), 123-154.
K. STEGOVEC, M. ČRNIGOJ | OPTIMAL CAPITAL STRUCTURE AND LEVERAGE ... 285
Bradley, M., Jarrell, G. A. and Kim, E. H. (1984). On the Existence of an Optimal Capital Structure: Theory and Evidence. The Journal of Finance, 39(3), 857-878.
Brav, O. (2009). Access to Capital, Capital Structure, and the Funding of the Firm. The Journal of Finance, 64(1), 263-308.
Bureau van Dijk (2014). Amadeus database of comparable financial information for public and private companies across Europe. https://amadeus.bvdinfo.com (accessed March 15, 2015).
Byoun, S. (2008). How and When Do Firms Adjust Their Capital Structures towards Targets? The Journal of Finance, 63(6), 3069-3096.
Caglayan, M. and Rashid, A. (2014). The Response of Firms’ Leverage to Risk: Evidence from UK Public versus Nonpublic Manufacturing Firms. Economic Inquiry, 52(1), 341-363.
Cook, D. and Tang, T. (2010). Macroeconomic Conditions and Capital Structure Adjustment Speed. Journal of Corporate Finance, 16(1), 73-87.
Croci, E., Doukas, J. A. and Gonenc, H. (2011). Family Control and Financing Decisions. European Financial Management, 17(5), 860-897.
Dang, V. A, Kim, M. and Shin, Y. (2014). Asymmetric Adjustment towards Optimal Capital Structure: Evidence from a Crisis. International Review of Financial Analysis, 33, 226-242.
DeAngelo, H. and Masulis, R.W. (1980). Optimal Capital Structure under Corporate and
Personal Taxation. Journal of Financial Economics, 8(1), 3-29.
DeAngelo, H. and Roll, R. (2015). How Stable Are Corporate Capital Structures? The Journal of Finance, 70(1), 373-418.
Dong, M., Loncarski, I. ter Horst, J. and Veld C. (2012). What Drives Security Issuance Decisions: Market Timing, Pecking Order, or Both? Financial Management, 41(3), 637-663.
Fama, E. F. and French, K. R. (2002). Testing Trade-Off and Pecking Order Predictions about Dividends and Debt. Review of Financial Studies, 15(1), 1-33.
ECONOMIC AND BUSINESS REVIEW | VOL. 22 | No. 2 | 2020 286
Faulkender, M., Flannery, M., Hankins, K. and Smith, J. (2012). Cash Flows and Leverage Adjustments. Journal of Financial Economics, 103(3), 632-646.
Fischer, E. O., Heinkel, R. and Zechner, J. (1989). Dynamic Capital Structure Choice: Theory and Tests. The Journal of Finance, 44(1), 19-40.
Flannery, M. J. and Rangan, K. P. (2006). Partial Adjustment towards Target Capital Structures. Journal of Financial Economics, 79(3), 469-506.
Gaud, P., Hoesli, M. and Bender, A. (2007). Debt-equity Choice in Europe. International Review of Financial Analysis, 16(3), 201-222.
Goyal, V. K., Nova, A. and Zanetti, L. (2011). Capital Market Access and Financing of Private Firms. International Review of Finance, 11(2), 155-179.
Graham, J. R. and Leary, M. T. (2011). A Review of Empirical Capital Structure Research and Directions for the Future. Annual Review of Financial Economics, 3, 309-345.
Hanousek, J. and Shamshur, A. (2011). A Stubborn Persistence: Is the Stability of Leverage Ratios Determined by the Stability of the Economy? Journal of Corporate Finance, 17(5), 1360-1376.
Hovakimian, A. and Li, G. (2011). In Search of Conclusive Evidence: How to Test for Adjustment to Target Capital Structure. Journal of Corporate Finance, 17(1), 33-44.
Huang, R. and Ritter, J. R. (2009). Testing Theories of Capital Structure and Estimating the Speed of Adjustment. Journal of Financial and Quantitative Analysis, 44(2), 237-271.
Jensen, M. C. (1986). Agency Costs of Free Cash Flow, Corporate Finance, and Takeovers. The American Economic Review, 76(2), 323-329.
Kayhan, A. and Titman, S. (2007). Firms’ Histories and Their Capital Structures. Journal of Financial Economics, 83(1), 1-32.
Korgaonkar, S. and Nini, G. (2010). Special Purpose Vehicles and Nonfinancial Corporate Finance. SSRN working paper. http://papers.ssrn.com/sol3/papers.cfm?abstract_id=1639548 (accessed 15 March, 2015).
Korteweg, A. (2010). The Net Benefits to Leverage. The Journal of Finance, 65(6), 2137-2170.
K. STEGOVEC, M. ČRNIGOJ | OPTIMAL CAPITAL STRUCTURE AND LEVERAGE ... 287
Kraus, A. and Litzenberger, R. H. (1973). A State-preference Model of Optimal Financial Leverage. The Journal of Finance, 28(4), 911-922.
Leary, M. T. & Roberts, M. R. (2005). Do Firms Rebalance Their Capital Structures? The Journal of Finance, 60(6), 2575-2619.
Leland, H. E. (1994). Corporate Debt Value, Bond Covenants, and Optimal Capital Structure. The Journal of Finance, 49(4), 1213-1252.
Lemmon, M. L., Roberts, M. R. and Zender, J. F. (2008). Back To The Beginning: Persistence And The Cross-Section Of Corporate Capital Structure. The Journal of Finance, 63(4), 1575-1608.
Marinšek, D., Pahor, M., Mramor, D. and Luštrik, R. (2016). Do European Firms Behave as if they Converge towards a Target Capital Structure? Journal of International Financial Management & Accounting, 27(2), 97-125.
Modigliani, F. and Miller, M. H. (1963). Corporate Income Taxes and the Cost of Capital: A Correction. The American Economic Review, 53(3), 433-443.
Morellec, E. (2004). Can Managerial Discretion Explain Observed Leverage Ratios?. Review of Financial Studies, 17(1), 257-294.
Myers, S. C. (1977). Determinants of Corporate Borrowing. Journal of Financial Economics, 5(2), 147-175.
Myers, S. C. and Majluf, N. S. (1984). Corporate Financing and Investment Decisions When Firms Have Information That Investors Do Not Have. Journal of Financial Economics, 13(2), 187-221.
Öztekin, Ö. and Flannery, M. (2012). Institutional Determinants of Capital Structure Adjustment Speeds. Journal of Financial Economics, 103(1), 88-112.
Petersen, M. (2009). Estimating Standard Errors in Finance Panel Data Sets: Comparing Approaches. Review of Financial Studies, 22(1), 435-480.
Rajan, R. G. and Zingales, L. (1995). What Do We Know about Capital Structure? Some Evidence from International Data. The Journal of Finance, 50(5), 1421-1460.
ECONOMIC AND BUSINESS REVIEW | VOL. 22 | No. 2 | 2020 288
Rauh, J. D. and Sufi, A. (2012). Explaining Corporate Capital Structure: Product Markets, Leases, and Asset Similarity. Review of Finance, 16(1), 115-155.
Saunders, A. and Steffen, S. (2011). The Costs of Being Private: Evidence from the Loan Market. The Review of Financial Studies, 24(12), 4091-4122.
Shyam-Sunder, L. and Myers, S. C. (1999). Testing Static Tradeoff against Pecking Order Models of Capital Structure. Journal of Financial Economics, 51(2), 219-244.
Strebulaev, I. A. (2007). Do Tests of Capital Structure Theory Mean What They Say? The Journal of Finance, 62(4), 1747-1787.
Titman, S. and Wessels, R. (1988). The Determinants of Capital Structure Choice. The Journal of Finance, 43(1), 1-19.
van Binsbergen, J. H., Graham, J. R. and Yang, J. (2010). The Cost of Debt. The Journal of Finance, 65(6), 2089-2136.