Embed Size (px)
Citation preview
Financial Performance of Selected Private
Banks in IndiaMs. Sunita Sukhija* and Dr. Arti Gaur**
_____________________________________________
________Abstract
The banking sector is the most dominant sector of the financial system in India,
and with good valuations and increasing profits, the sector has been among the
top performers in the markets. Undoubtedly, being tech-savvy and full of
expertise, private banks have played a major role in the development of Indian
banking industry. In the process they have jolted public sector banks out of
complacency and forced them to become more competitive. At present, Private
Banks in India includes leading banks like ICICI Banks, ING Vysya Bank, Kotak
Mahindra Bank, SBI Commercial and International Bank, etc. Private Banks such
as HDFC Bank and ICICI Bank are posting a rapid increase in their asset base
every year as compared to public sector banks. The objective of present paper is
to analyze the financial position of the private sector banks. The analysis reveals
that HDFC is the most efficient bank in terms of generating earning per share.
KM B has higher P/B Ratio it shows that, the higher the premium the market is
willing to pay for the company above its hard assets.
Keywords: Financial Performance, Indian Private Banks, EPS,
CR, QR, DER, ROCE, PBR, PER, CAR, RONW
_____________________________________________
_________*Assistant Professor, Department of Management Studies, Jan Nayak Ch. Devi Lal Memorial College of Engineering, SIRSA (Haryana)-125055 email- [email protected]
** Assistant Professor, Deptt. Of Business Administration, Ch. Devi lal University, Sirsa. [email protected]
IntroductionThe banking sector is the most dominant sector of the
financial system in India, and with good valuations and
increasing profits, the sector has been among the top
performers in the markets. Undoubtedly, being tech-savvy and
full of expertise, private banks have played a major role in
the development of Indian banking industry. They have made
banking more efficient and customer friendly. In the process
they have jolted public sector banks out of complacency and
forced them to become more competitive. At present, Private
Banks in India includes leading banks like ICICI Banks, ING
Vysya Bank, Jammu & Kashmir Bank, Karnataka Bank, Kotak
Mahindra Bank, SBI Commercial and International Bank, etc.
In 1994, the Reserve Bank of India issued a policy of
liberalization to license limited number of private banks,
which came to be known as New Generation tech-savvy banks.
Global Trust Bank was, thus, the first private bank after
liberalization; it was later amalgamated with Oriental Bank
of Commerce (OBC). Then Housing Development Finance
Corporation Limited (HDFC) became the first (still existing)
to receive an 'in principle' approval from the Reserve Bank
of India (RBI) to set up a bank in the private sector.
Without a sound and effective banking system in India it
cannot have a healthy economy. The banking sector is the
most dominant sector of the financial system in India, and
with good valuations and increasing profits, the sector has
been among the top performers in the markets. According to a
FICCI survey, the regulatory systems of Indian banks are
rated above China and Russia; and at par with Japan and
Singapore. Indian banking sector is at 6th position among
emerging economies, says ASSOCHAM.
Current scenario of Private Banks
Private Banks such as HDFC Bank and ICICI Bank are posting a
rapid increase in their asset base every year as compared to
public sector banks. A comparison between all profit-making
21 public sector banks and 18 private banks operating in the
country revealed that private banks' price earning (P/E)
ratio was more than public sector banks on June, 2008 and in
June, 2007. The Dun & Bradstreet study revealed that new
private sector banks dominated the banking industry in terms
of growth with an average year-on-year growth in assets,
with 38.7 per cent for deposits, advances at 39.9 per cent
and operating profit at 46.7 per cent. They fared better in
net profit, which increased by 30 per cent. All bank groups
recorded a capital adequacy ratio of more than 12 per cent.
Axis Bank's net profit surged by 32 per cent to US$ 115.4
million on 21.2 per cent rise in total income to US$ 852.16
million in the second quarter of 2009-10, over the
corresponding period last year. HDFC Bank has posted a 32
per cent rise in its net profit at US$ 175.4 million for the
quarter ended December 31, 2009 over the figure of US$
128.05 million for the same quarter in the previous year.
MethodologyThe present study adopts an analytical and descriptive
research design. The data of the sample companies (for a
period of ten years 2000 to 2009) has been collected from
the annual reports and the balance sheet published by the
companies and the websites of the companies.
Objectives To take investment decision cautiously after studying
financial performance.
To analyze the financial position of the private
sector banks.
To get familiarity of scheming comparative efficiency
of different private sector banks.
HypothesesThe following hypotheses have been put on test:
H1 : The Debt Equity Ratio (DER) position of HDFC, ICICI,
AXIS B, F B, INGV B and KM B differ significantly.
H2 : The Return on Capital Employed (ROCE) position of HDFC,
ICICI, AXIS B, F B, INGV B and KM B differ significantly.
H3 : The Price Earning Ratio (PER) position of HDFC, ICICI,
AXIS B, F B, INGV B and KM B differ significantly.
H4 : The Earning Per Share (EPS) position of HDFC, ICICI,
AXIS B, F B, INGV B and KM B differ significantly.
H5 : The Return on Net Worth (RONW) position HDFC, ICICI,
AXIS B, F B, INGV B and KM B differ significantly.
H6 : The Current Ratio (CE) position of HDFC, ICICI, AXIS B,
F B, INGV B and KM B differ significantly.
H7 : The Quick Ratio (QR) position of HDFC, ICICI, AXIS B, F
B, INGV B and KM B differ significantly.
H8 : The Capital Adequacy Ratio (CAR) position of HDFC,
ICICI, AXIS B, F B, INGV B and KM B differ significantly.
H9 : The Price to Book Ratio (PB) position of HDFC, ICICI,
AXIS B, F B, INGV B and KM B differ significantly.
Sampling: The study is done with special reference toprivate sector banks. The technique of ‘Convenience
Sampling’ has been adopted for the study. The selection of

sample of companies is made on the basis of market
Capitalization.
Sample Size: Six Indian Private sector Banks have beenchosen as sample for the study on account of having the
highest market capitalization. These are:
HDFC: Housing Development Finance Corporation
ICICI: Industrial Credit and Investment Corporation of India
AXIS B: AXIS Bank
F B: Federal Bank Limited
INGV B: ING Vysya Bank
KM B: Kotak Mahindra Bank
Source of Data
Financial statements are the raw data collected from the
prowess and various banks websites. Data collected from
prowess is more reliable and accurate.
Tools for AnalysisThe statistical tool used for analysis is one–way Analysis
of Variance (ANOVA) using SPSS package. Parameters used are:
Ratio Analysis: Ratios have been calculated for the
past ten years for the purpose of analysis. Ratios
being designed are named as:
Earning Per Share (EPS), Current Ratio (CR), Quick
Ratio (QR), Debt Equity Ratio (DER), Return on Capital
Employed (ROCE), Price to Book Ratio (PBR), Price
Earning Ratio (PER), Capital Adequacy Ratio (CAR) and
Return on Net Worth (RONW).
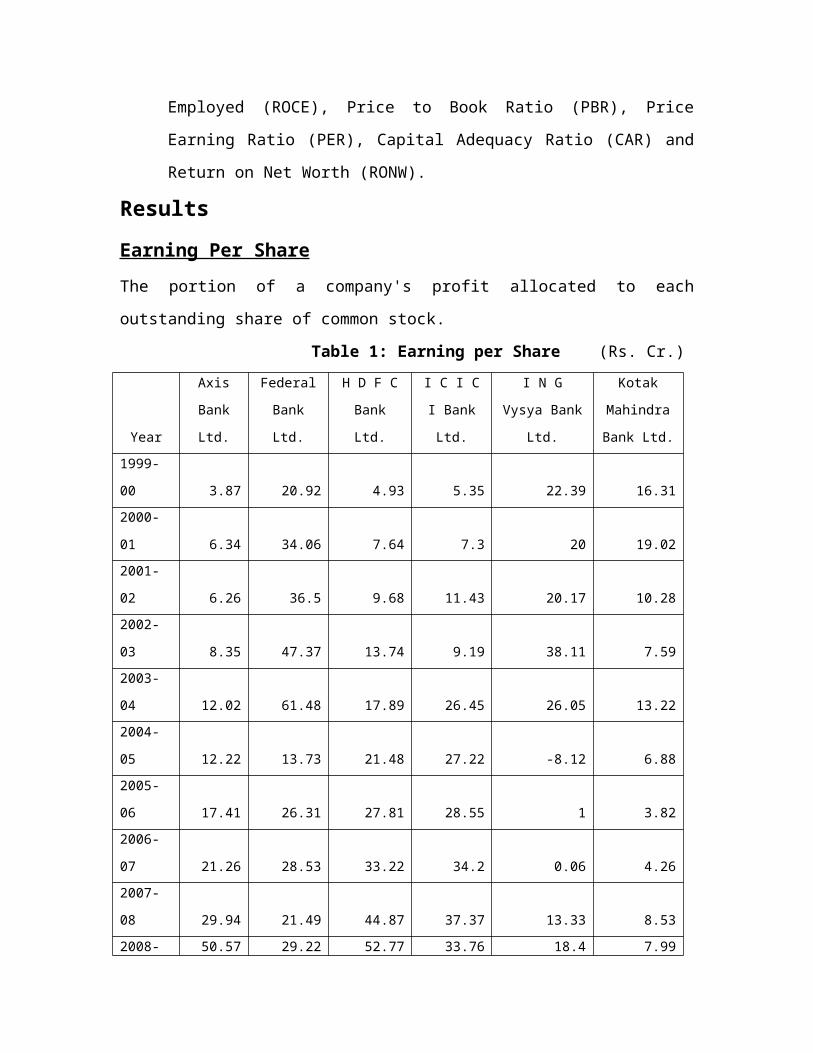
ResultsEarning Per ShareThe portion of a company's profit allocated to each
outstanding share of common stock.
Table 1: Earning per Share (Rs. Cr.)
Year
Axis
Bank
Ltd.
Federal
Bank
Ltd.
H D F C
Bank
Ltd.
I C I C
I Bank
Ltd.
I N G
Vysya Bank
Ltd.
Kotak
Mahindra
Bank Ltd.1999-
00 3.87 20.92 4.93 5.35 22.39 16.312000-
01 6.34 34.06 7.64 7.3 20 19.022001-
02 6.26 36.5 9.68 11.43 20.17 10.282002-
03 8.35 47.37 13.74 9.19 38.11 7.592003-
04 12.02 61.48 17.89 26.45 26.05 13.222004-
05 12.22 13.73 21.48 27.22 -8.12 6.882005-
06 17.41 26.31 27.81 28.55 1 3.822006-
07 21.26 28.53 33.22 34.2 0.06 4.262007-
08 29.94 21.49 44.87 37.37 13.33 8.532008- 50.57 29.22 52.77 33.76 18.4 7.99
09Averag
e 16.824 31.961 23.403 22.082 15.139 9.79
Source: Data complied from software,’ PROWESS’.
F = 3.460, d.f. = (5, 54,), P < 0.05 Significant
As shown in Table 1, the EPS of HDFC, ICICI, AXIS B, F B,
INGV B shows an increasing trend except KM B. EPS of HDFC is
substantially higher in current years compare to other
banks. On an average, FB has generated EPS of Rs. 31.961,
highest among all, followed by HDFC (23.403), ICICI
(22.082), AXIS B (16.824), INGV B (15.139) and then KM B
(9.79), the lowest among all six sample banks. The analysis
reveals that HDFC is the most efficient bank in terms of
generating earning per share.
Since F = 3.460 (P<0.05), it is concluded that the EPS
position of HDFC, ICICI, AXIS B, F B, INGV B and KM B differ
significantly.
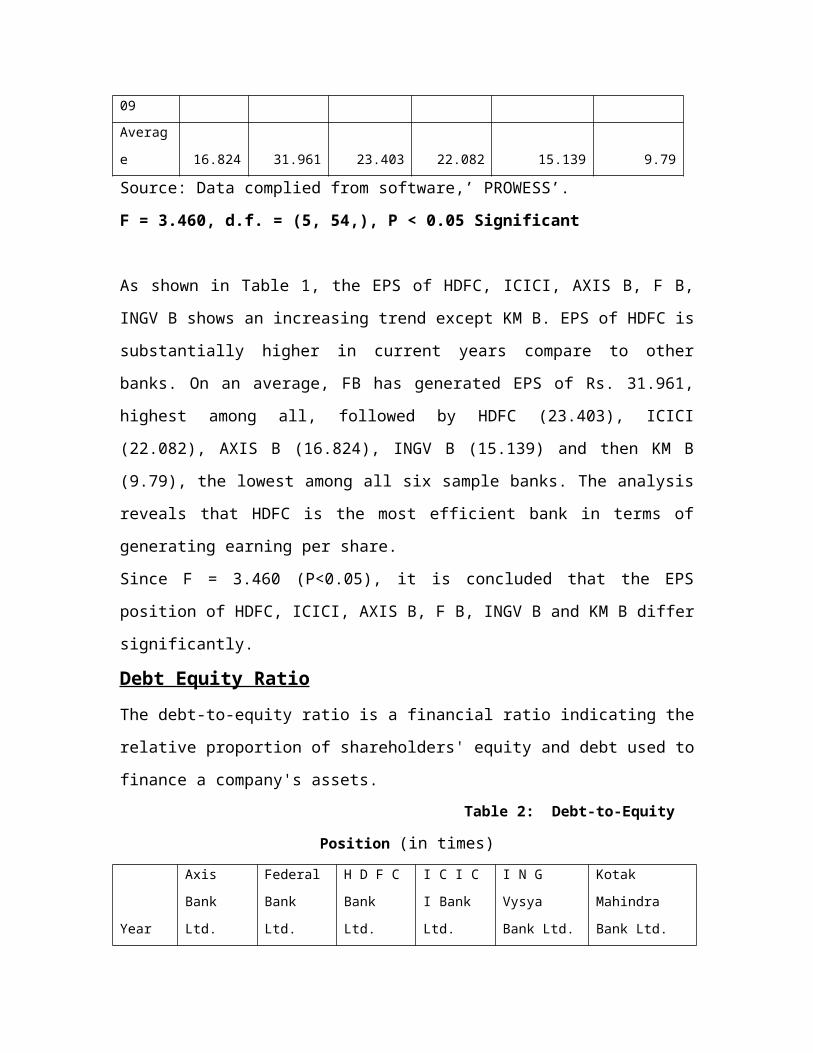
Debt Equity RatioThe debt-to-equity ratio is a financial ratio indicating the
relative proportion of shareholders' equity and debt used to
finance a company's assets. Table 2: Debt-to-Equity
Position (in times)
Year
Axis
Bank
Ltd.
Federal
Bank
Ltd.
H D F C
Bank
Ltd.
I C I C
I Bank
Ltd.
I N G
Vysya
Bank Ltd.
Kotak
Mahindra
Bank Ltd.
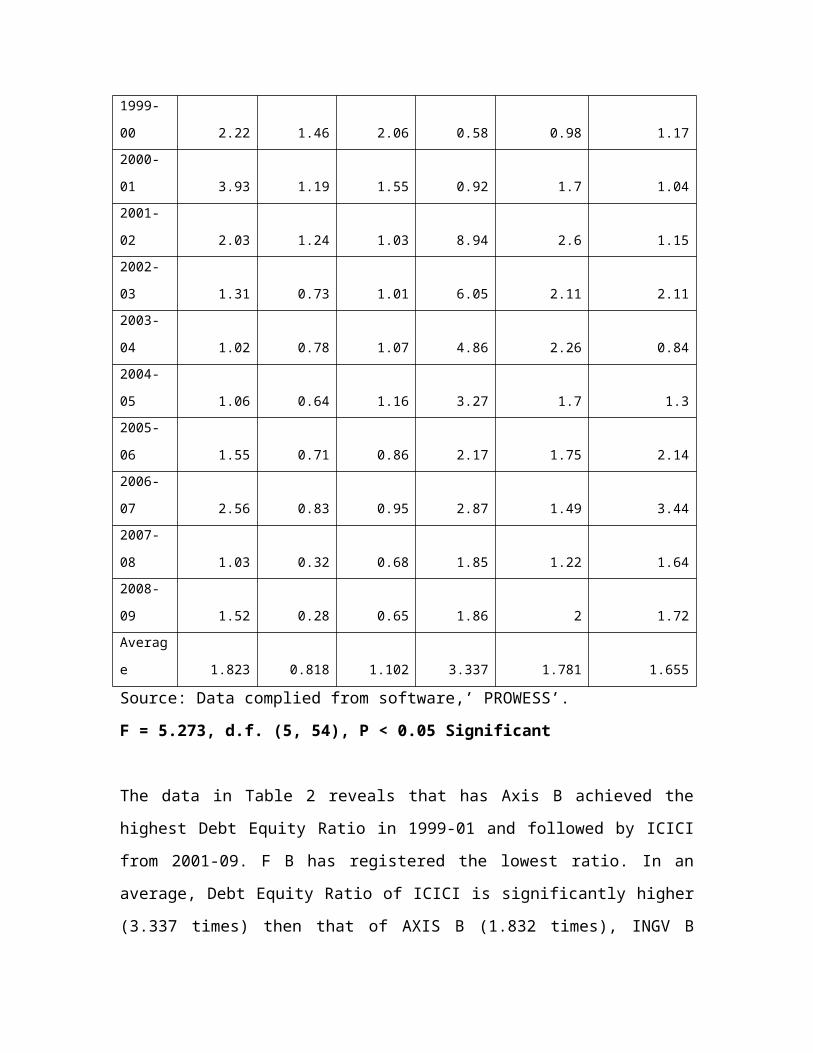
1999-
00 2.22 1.46 2.06 0.58 0.98 1.172000-
01 3.93 1.19 1.55 0.92 1.7 1.042001-
02 2.03 1.24 1.03 8.94 2.6 1.152002-
03 1.31 0.73 1.01 6.05 2.11 2.112003-
04 1.02 0.78 1.07 4.86 2.26 0.842004-
05 1.06 0.64 1.16 3.27 1.7 1.32005-
06 1.55 0.71 0.86 2.17 1.75 2.142006-
07 2.56 0.83 0.95 2.87 1.49 3.442007-
08 1.03 0.32 0.68 1.85 1.22 1.642008-
09 1.52 0.28 0.65 1.86 2 1.72Averag
e 1.823 0.818 1.102 3.337 1.781 1.655
Source: Data complied from software,’ PROWESS’.
F = 5.273, d.f. (5, 54), P < 0.05 Significant
The data in Table 2 reveals that has Axis B achieved the
highest Debt Equity Ratio in 1999-01 and followed by ICICI
from 2001-09. F B has registered the lowest ratio. In an
average, Debt Equity Ratio of ICICI is significantly higher
(3.337 times) then that of AXIS B (1.832 times), INGV B
(1.781 times), KM B (1.655 times), HDFC (1.102 times) and F
B (0.818 times). Thus, it is inferred that F B has the least
proportion of debt fund in its total capital and hence is
the most efficient bank among all other sample companies. It
has the highest portion of its self owned funds in the
capital structure followed by other sample banks.
Since F=5.273 (P<0.05), it is concluded that the D/E
position of HDFC, ICICI, AXIS B, F B, INGV B and KM B differ
significantly.
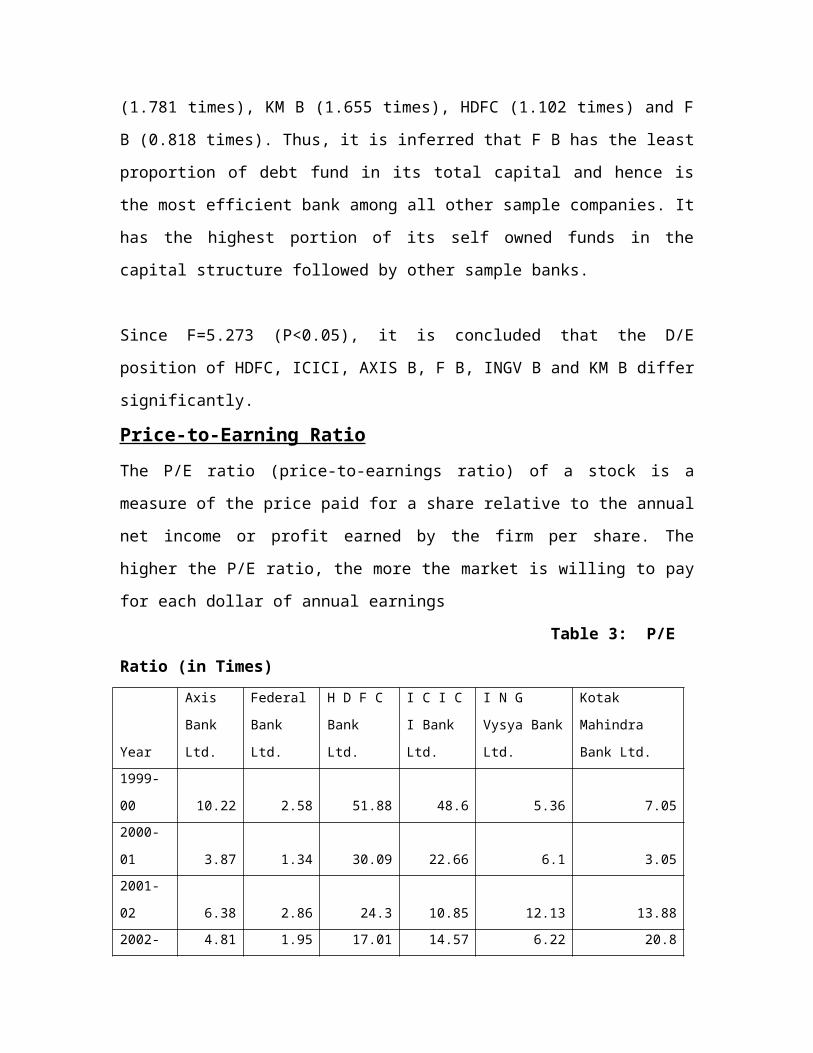
Price-to-Earning RatioThe P/E ratio (price-to-earnings ratio) of a stock is a
measure of the price paid for a share relative to the annual
net income or profit earned by the firm per share. The
higher the P/E ratio, the more the market is willing to pay
for each dollar of annual earnings
Table 3: P/E
Ratio (in Times)
Year
Axis
Bank
Ltd.
Federal
Bank
Ltd.
H D F C
Bank
Ltd.
I C I C
I Bank
Ltd.
I N G
Vysya Bank
Ltd.
Kotak
Mahindra
Bank Ltd.1999-
00 10.22 2.58 51.88 48.6 5.36 7.052000-
01 3.87 1.34 30.09 22.66 6.1 3.052001-
02 6.38 2.86 24.3 10.85 12.13 13.882002- 4.81 1.95 17.01 14.57 6.22 20.8

032003-
04 12.21 6.05 21.15 11.19 18.24 30.562004-
05 19.81 11.25 25.34 14.44 -18.97 49.472005-
06 20.47 7.66 27.82 20.64 142.99 72.732006-
07 23.05 7.56 28.58 24.94 2878.46 112.682007-
08 26.09 10.06 29.42 20.61 25.47 73.712008-
09 8.2 4.73 18.34 9.85 7.04 35.42Averag
e 13.511 5.604 27.393 19.835 308.304 41.935
Source: Data compiled from software,’ PROWESS’.
F = 1.015, d.f. = (5, 54), P > 0.05, Not Significant
Table 3 reveals that, On an average INGV B has generated P/E
Ratio (308.304), highest among all, followed by KM B
(41.935), HDFC (27.393), ICICI (19.835), AXIS B (13.511) and
FB (5.604) the lowest among all six sample banks. Thus, it
is inferred that there is more responsiveness between the
earning capacity and share price in case of INGV B than that
of other banks and it also has done better in the share
market.
Since F=1.015 (P>0.05), it is concluded that the P/E
position of HDFC, ICICI, AXIS B, F B, INGV B and KM B does
not differ significantly.
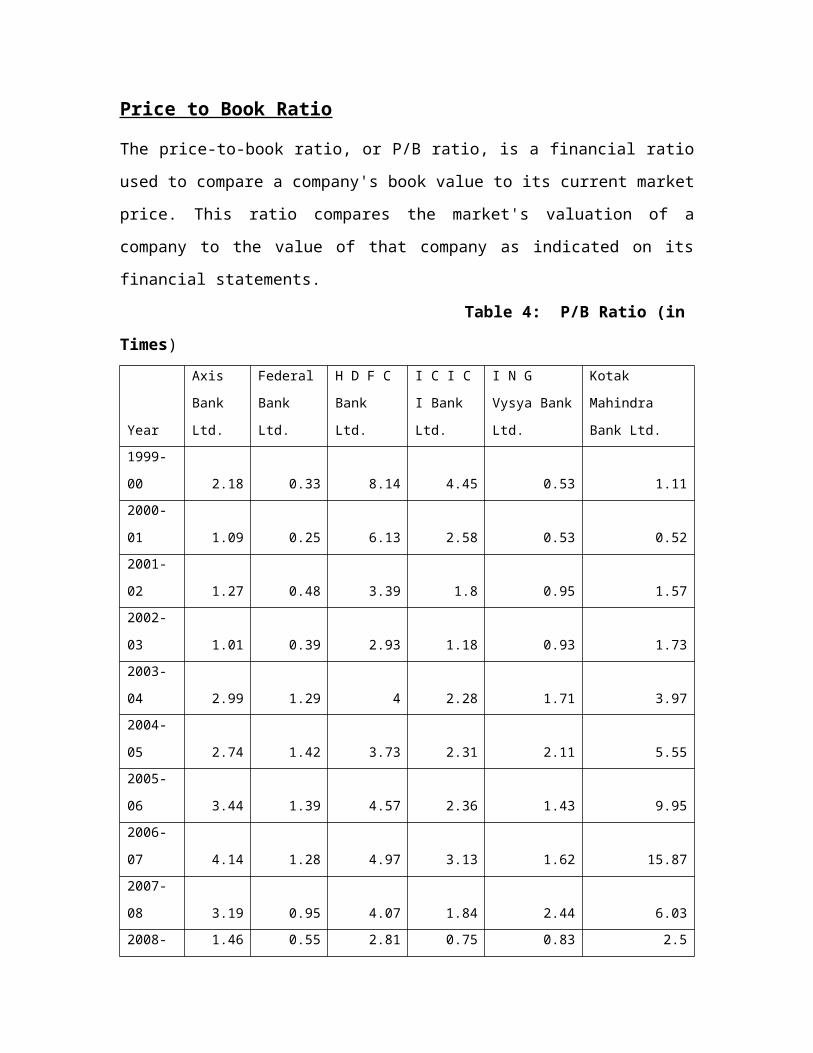
Price to Book Ratio
The price-to-book ratio, or P/B ratio, is a financial ratio
used to compare a company's book value to its current market
price. This ratio compares the market's valuation of a
company to the value of that company as indicated on its
financial statements.
Table 4: P/B Ratio (in
Times)
Year
Axis
Bank
Ltd.
Federal
Bank
Ltd.
H D F C
Bank
Ltd.
I C I C
I Bank
Ltd.
I N G
Vysya Bank
Ltd.
Kotak
Mahindra
Bank Ltd.1999-
00 2.18 0.33 8.14 4.45 0.53 1.112000-
01 1.09 0.25 6.13 2.58 0.53 0.522001-
02 1.27 0.48 3.39 1.8 0.95 1.572002-
03 1.01 0.39 2.93 1.18 0.93 1.732003-
04 2.99 1.29 4 2.28 1.71 3.972004-
05 2.74 1.42 3.73 2.31 2.11 5.552005-
06 3.44 1.39 4.57 2.36 1.43 9.952006-
07 4.14 1.28 4.97 3.13 1.62 15.872007-
08 3.19 0.95 4.07 1.84 2.44 6.032008- 1.46 0.55 2.81 0.75 0.83 2.5
09Averag
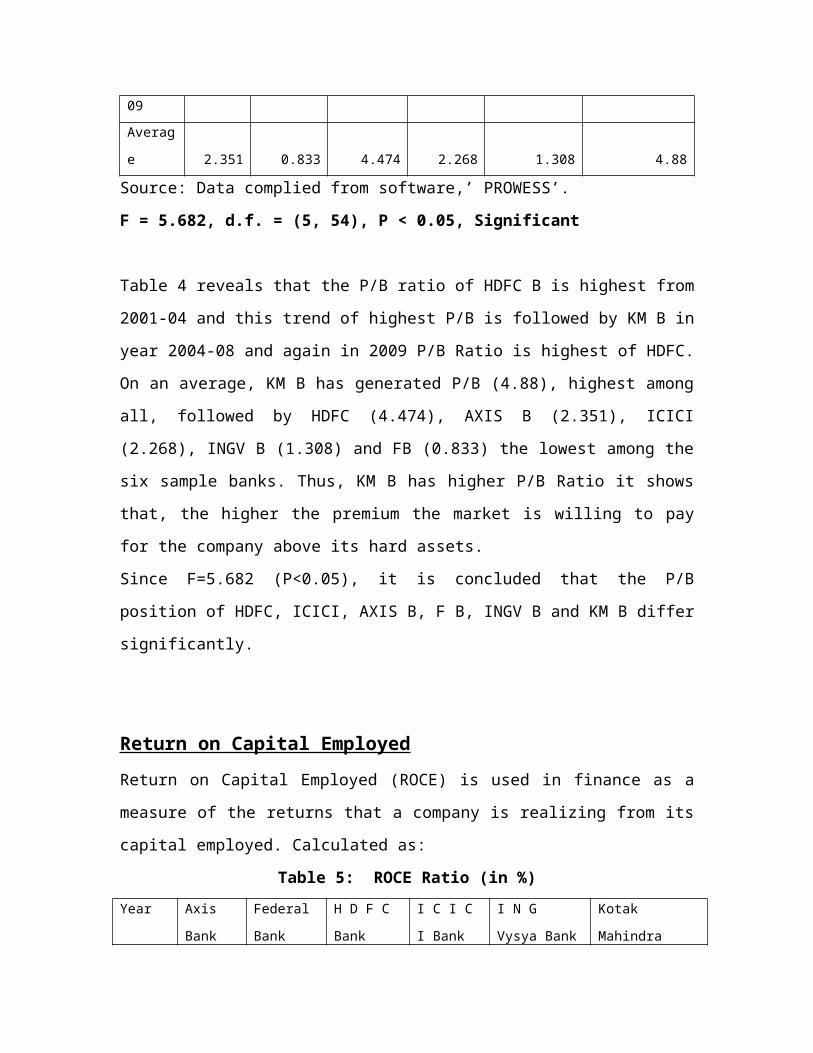
e 2.351 0.833 4.474 2.268 1.308 4.88
Source: Data complied from software,’ PROWESS’.
F = 5.682, d.f. = (5, 54), P < 0.05, Significant
Table 4 reveals that the P/B ratio of HDFC B is highest from
2001-04 and this trend of highest P/B is followed by KM B in
year 2004-08 and again in 2009 P/B Ratio is highest of HDFC.
On an average, KM B has generated P/B (4.88), highest among
all, followed by HDFC (4.474), AXIS B (2.351), ICICI
(2.268), INGV B (1.308) and FB (0.833) the lowest among the
six sample banks. Thus, KM B has higher P/B Ratio it shows
that, the higher the premium the market is willing to pay
for the company above its hard assets.
Since F=5.682 (P<0.05), it is concluded that the P/B
position of HDFC, ICICI, AXIS B, F B, INGV B and KM B differ
significantly.
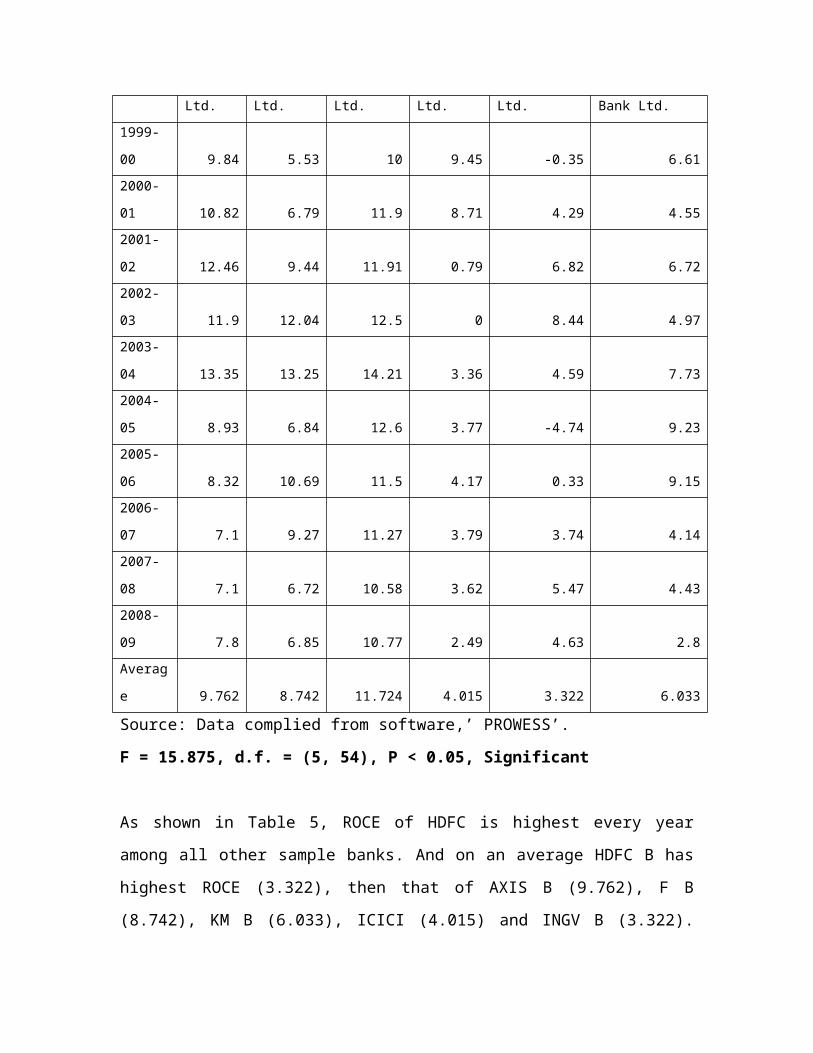
Return on Capital EmployedReturn on Capital Employed (ROCE) is used in finance as a
measure of the returns that a company is realizing from its
capital employed. Calculated as:
Table 5: ROCE Ratio (in %)Year Axis
Bank
Federal
Bank
H D F C
Bank
I C I C
I Bank
I N G
Vysya Bank
Kotak
Mahindra
Ltd. Ltd. Ltd. Ltd. Ltd. Bank Ltd.1999-
00 9.84 5.53 10 9.45 -0.35 6.612000-
01 10.82 6.79 11.9 8.71 4.29 4.552001-
02 12.46 9.44 11.91 0.79 6.82 6.722002-
03 11.9 12.04 12.5 0 8.44 4.972003-
04 13.35 13.25 14.21 3.36 4.59 7.732004-
05 8.93 6.84 12.6 3.77 -4.74 9.232005-
06 8.32 10.69 11.5 4.17 0.33 9.152006-
07 7.1 9.27 11.27 3.79 3.74 4.142007-
08 7.1 6.72 10.58 3.62 5.47 4.432008-
09 7.8 6.85 10.77 2.49 4.63 2.8Averag
e 9.762 8.742 11.724 4.015 3.322 6.033
Source: Data complied from software,’ PROWESS’.
F = 15.875, d.f. = (5, 54), P < 0.05, Significant
As shown in Table 5, ROCE of HDFC is highest every year
among all other sample banks. And on an average HDFC B has
highest ROCE (3.322), then that of AXIS B (9.762), F B
(8.742), KM B (6.033), ICICI (4.015) and INGV B (3.322).
Thus, it is inferred that HDFC generates enough returns to
pay for its cost of capital.
Since F=15.875 (P<0.05) , it is concluded that the ROCE
position of HDFC, ICICI, AXIS B, F B, INGV B and KM B differ
significantly.
Return on Net WorthThis ratio indicates the return on stockholder's total
equity. It is a basic ratio that tells a shareholder what he
is getting out of his investment in the company.
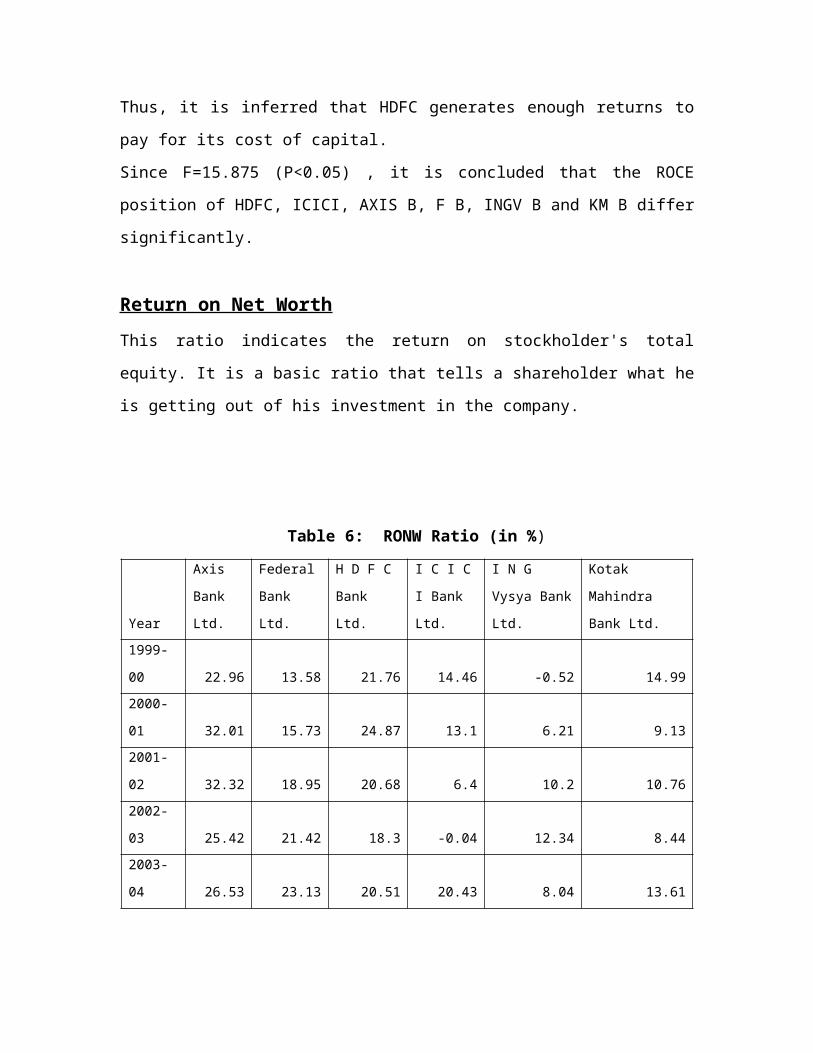
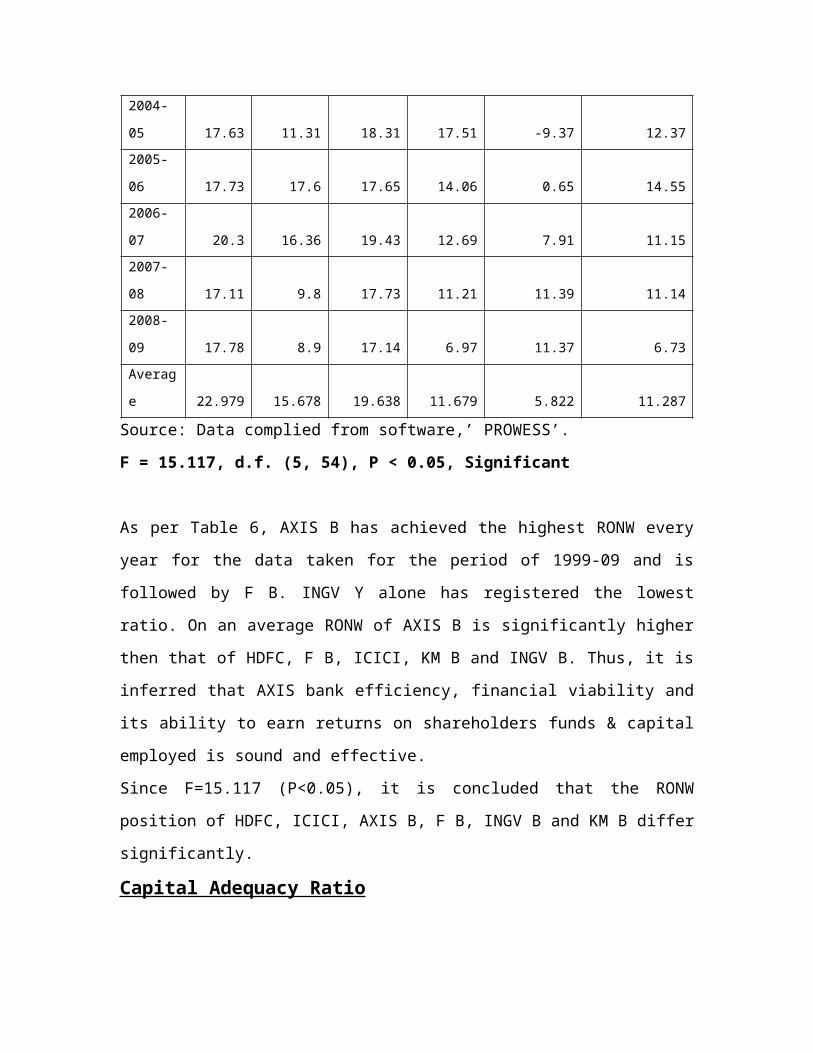
Table 6: RONW Ratio (in %)
Year
Axis
Bank
Ltd.
Federal
Bank
Ltd.
H D F C
Bank
Ltd.
I C I C
I Bank
Ltd.
I N G
Vysya Bank
Ltd.
Kotak
Mahindra
Bank Ltd.1999-
00 22.96 13.58 21.76 14.46 -0.52 14.992000-
01 32.01 15.73 24.87 13.1 6.21 9.132001-
02 32.32 18.95 20.68 6.4 10.2 10.762002-
03 25.42 21.42 18.3 -0.04 12.34 8.442003-
04 26.53 23.13 20.51 20.43 8.04 13.61
2004-
05 17.63 11.31 18.31 17.51 -9.37 12.372005-
06 17.73 17.6 17.65 14.06 0.65 14.552006-
07 20.3 16.36 19.43 12.69 7.91 11.152007-
08 17.11 9.8 17.73 11.21 11.39 11.142008-
09 17.78 8.9 17.14 6.97 11.37 6.73Averag
e 22.979 15.678 19.638 11.679 5.822 11.287
Source: Data complied from software,’ PROWESS’.
F = 15.117, d.f. (5, 54), P < 0.05, Significant
As per Table 6, AXIS B has achieved the highest RONW every
year for the data taken for the period of 1999-09 and is
followed by F B. INGV Y alone has registered the lowest
ratio. On an average RONW of AXIS B is significantly higher
then that of HDFC, F B, ICICI, KM B and INGV B. Thus, it is
inferred that AXIS bank efficiency, financial viability and
its ability to earn returns on shareholders funds & capital
employed is sound and effective.
Since F=15.117 (P<0.05), it is concluded that the RONW
position of HDFC, ICICI, AXIS B, F B, INGV B and KM B differ
significantly.
Capital Adequacy Ratio
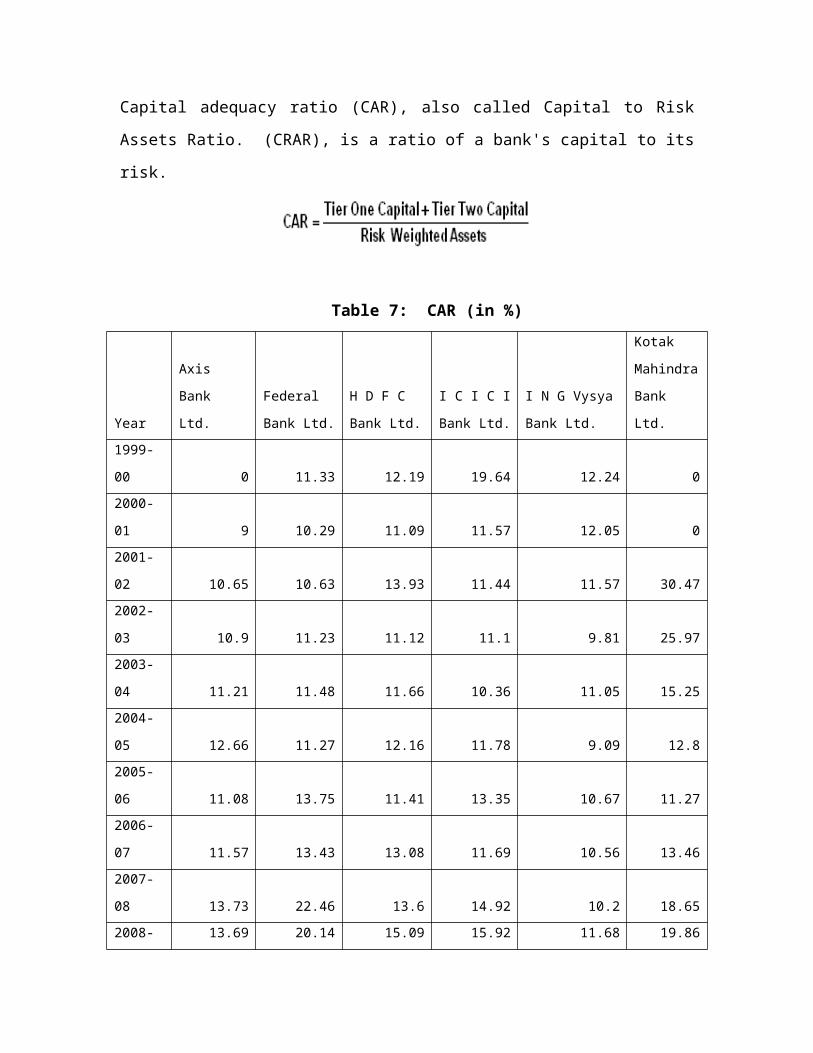
Capital adequacy ratio (CAR), also called Capital to Risk
Assets Ratio. (CRAR), is a ratio of a bank's capital to its
risk.
Table 7: CAR (in %)
Year
Axis
Bank
Ltd.
Federal
Bank Ltd.
H D F C
Bank Ltd.
I C I C I
Bank Ltd.
I N G Vysya
Bank Ltd.
Kotak
Mahindra
Bank
Ltd.1999-
00 0 11.33 12.19 19.64 12.24 02000-
01 9 10.29 11.09 11.57 12.05 02001-
02 10.65 10.63 13.93 11.44 11.57 30.472002-
03 10.9 11.23 11.12 11.1 9.81 25.972003-
04 11.21 11.48 11.66 10.36 11.05 15.252004-
05 12.66 11.27 12.16 11.78 9.09 12.82005-
06 11.08 13.75 11.41 13.35 10.67 11.272006-
07 11.57 13.43 13.08 11.69 10.56 13.462007-
08 13.73 22.46 13.6 14.92 10.2 18.652008- 13.69 20.14 15.09 15.92 11.68 19.86
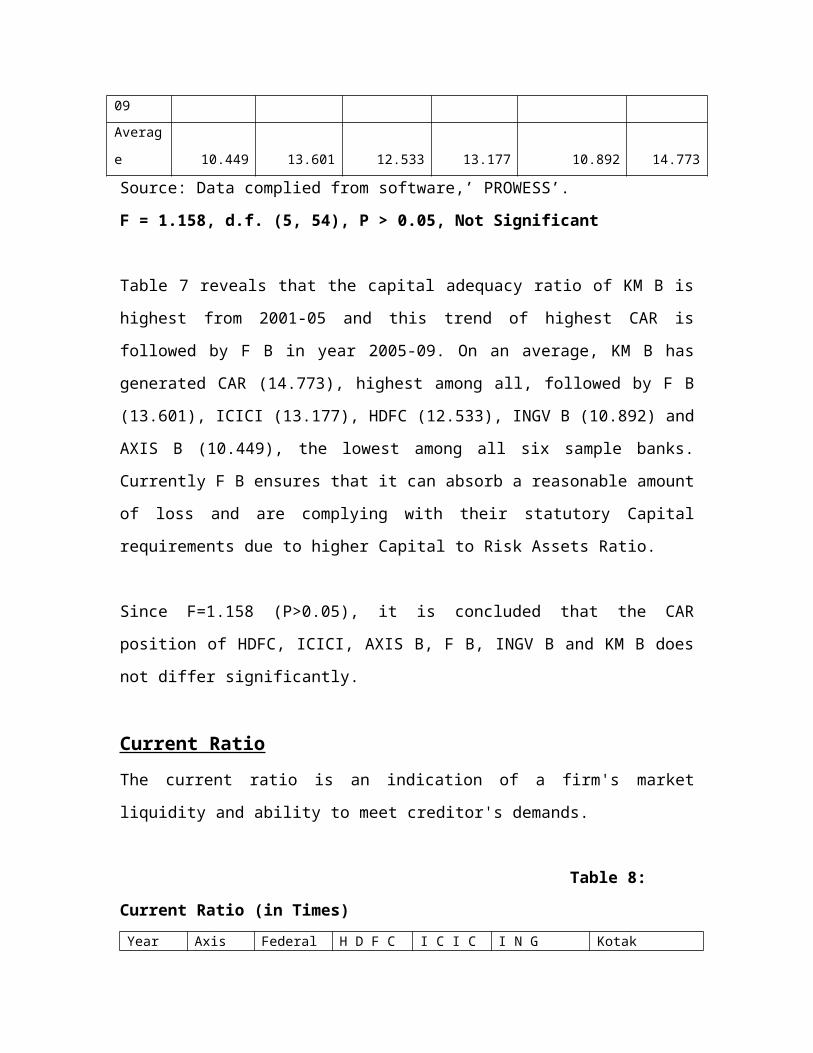
09Averag
e 10.449 13.601 12.533 13.177 10.892 14.773
Source: Data complied from software,’ PROWESS’.
F = 1.158, d.f. (5, 54), P > 0.05, Not Significant
Table 7 reveals that the capital adequacy ratio of KM B is
highest from 2001-05 and this trend of highest CAR is
followed by F B in year 2005-09. On an average, KM B has
generated CAR (14.773), highest among all, followed by F B
(13.601), ICICI (13.177), HDFC (12.533), INGV B (10.892) and
AXIS B (10.449), the lowest among all six sample banks.
Currently F B ensures that it can absorb a reasonable amount
of loss and are complying with their statutory Capital
requirements due to higher Capital to Risk Assets Ratio.
Since F=1.158 (P>0.05), it is concluded that the CAR
position of HDFC, ICICI, AXIS B, F B, INGV B and KM B does
not differ significantly.
Current RatioThe current ratio is an indication of a firm's market
liquidity and ability to meet creditor's demands.
Table 8:
Current Ratio (in Times)Year Axis Federal H D F C I C I C I N G Kotak
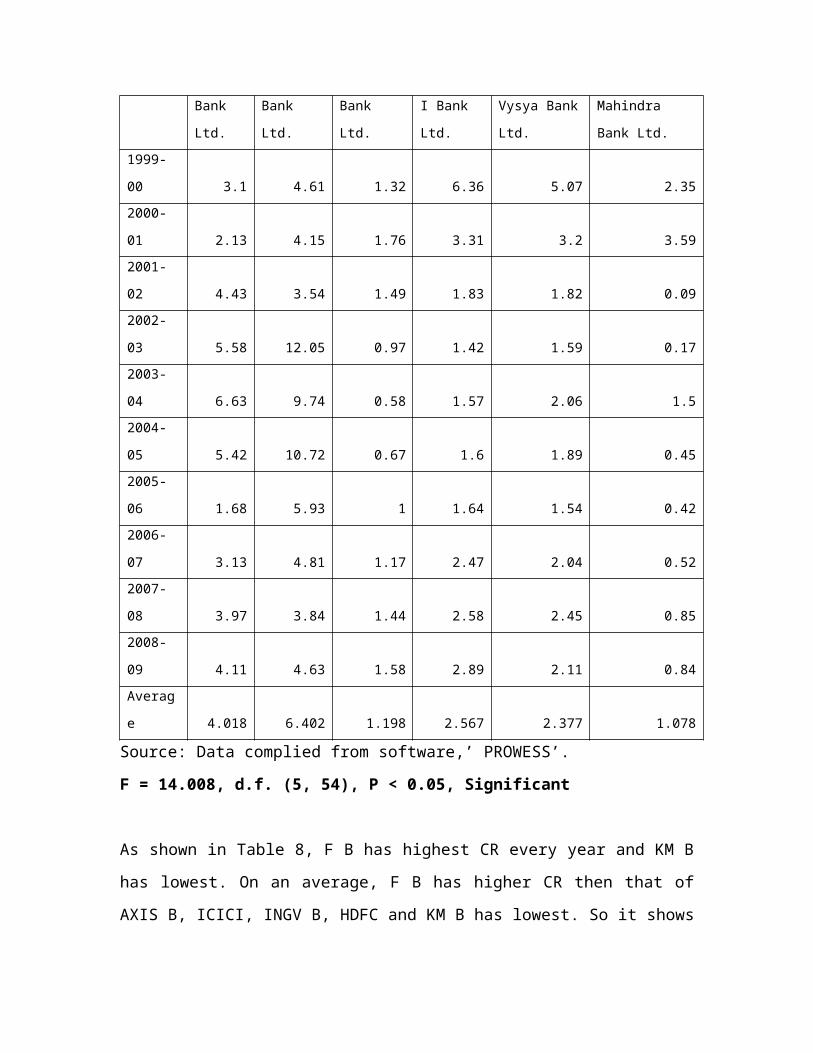
Bank
Ltd.
Bank
Ltd.
Bank
Ltd.
I Bank
Ltd.
Vysya Bank
Ltd.
Mahindra
Bank Ltd.1999-
00 3.1 4.61 1.32 6.36 5.07 2.352000-
01 2.13 4.15 1.76 3.31 3.2 3.592001-
02 4.43 3.54 1.49 1.83 1.82 0.092002-
03 5.58 12.05 0.97 1.42 1.59 0.172003-
04 6.63 9.74 0.58 1.57 2.06 1.52004-
05 5.42 10.72 0.67 1.6 1.89 0.452005-
06 1.68 5.93 1 1.64 1.54 0.422006-
07 3.13 4.81 1.17 2.47 2.04 0.522007-
08 3.97 3.84 1.44 2.58 2.45 0.852008-
09 4.11 4.63 1.58 2.89 2.11 0.84Averag
e 4.018 6.402 1.198 2.567 2.377 1.078
Source: Data complied from software,’ PROWESS’.
F = 14.008, d.f. (5, 54), P < 0.05, Significant
As shown in Table 8, F B has highest CR every year and KM B
has lowest. On an average, F B has higher CR then that of
AXIS B, ICICI, INGV B, HDFC and KM B has lowest. So it shows
that FB has enough resources to pay its debts over the next
12 months. It has good short-term financial strength.
Since F=14.008 (P<0.05), it is concluded that the Current
Ratio position of HDFC, ICICI, AXIS B, F B, INGV B and KM B
differ significantly.
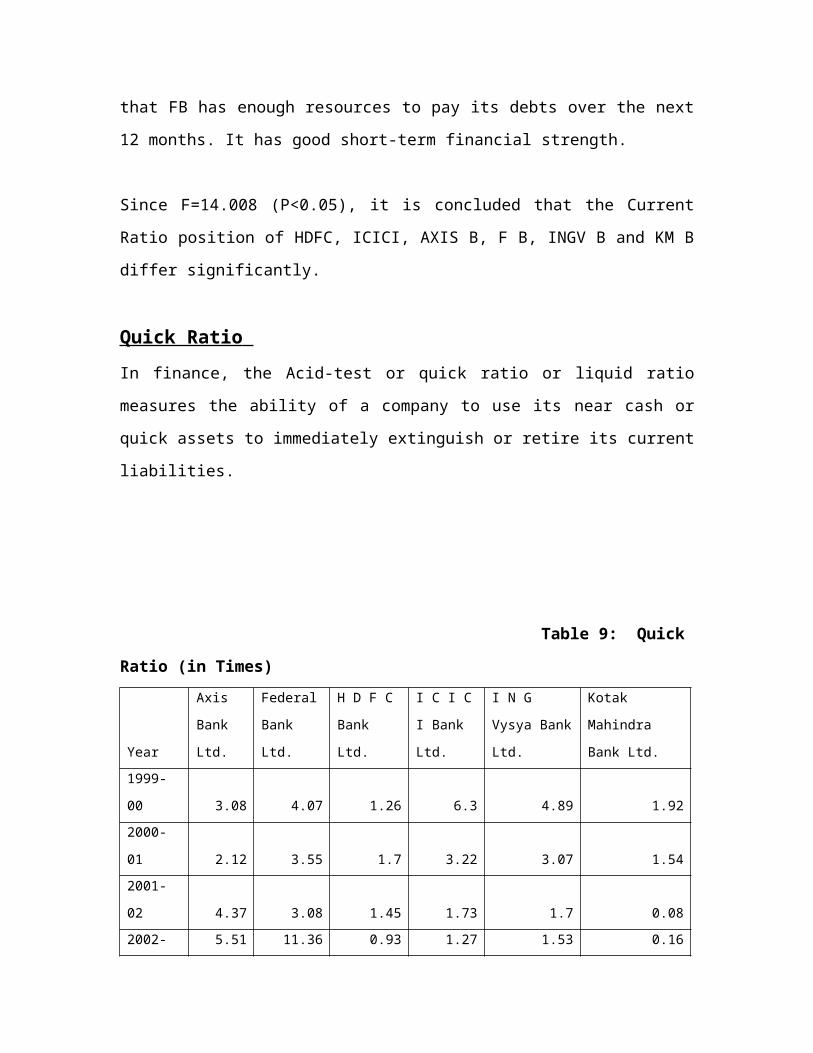
Quick Ratio In finance, the Acid-test or quick ratio or liquid ratio
measures the ability of a company to use its near cash or
quick assets to immediately extinguish or retire its current
liabilities.
Table 9: Quick
Ratio (in Times)
Year
Axis
Bank
Ltd.
Federal
Bank
Ltd.
H D F C
Bank
Ltd.
I C I C
I Bank
Ltd.
I N G
Vysya Bank
Ltd.
Kotak
Mahindra
Bank Ltd.1999-
00 3.08 4.07 1.26 6.3 4.89 1.922000-
01 2.12 3.55 1.7 3.22 3.07 1.542001-
02 4.37 3.08 1.45 1.73 1.7 0.082002- 5.51 11.36 0.93 1.27 1.53 0.16
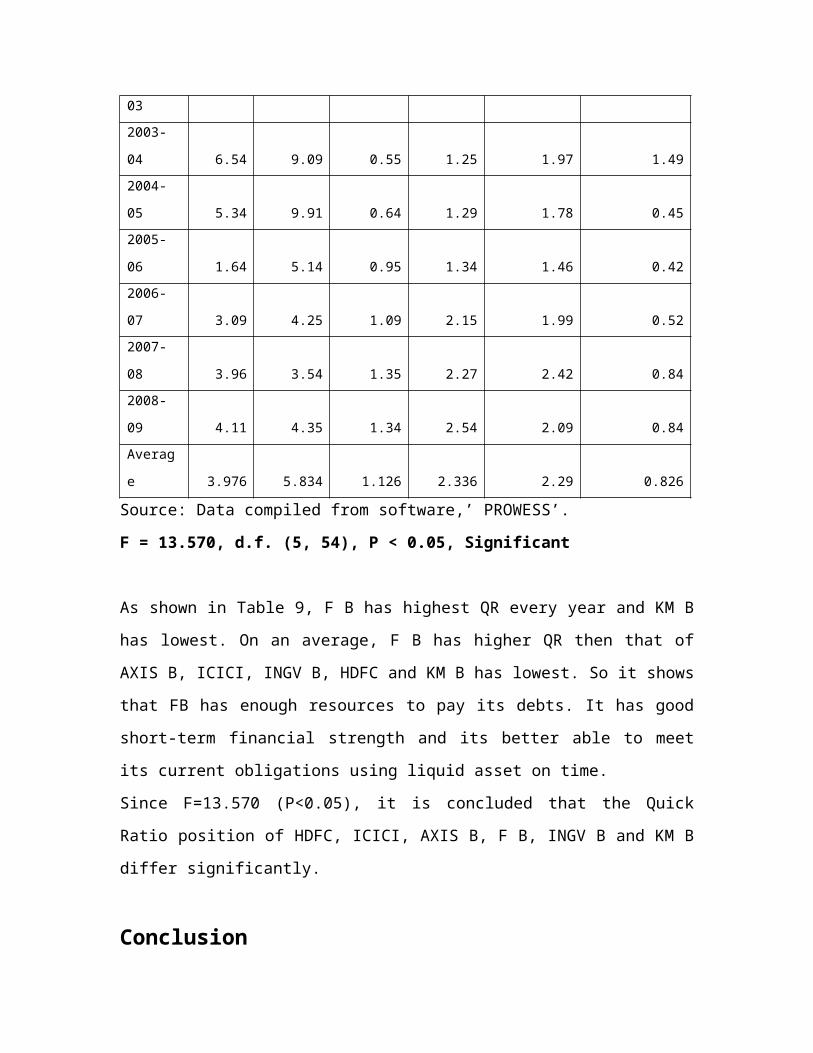
032003-
04 6.54 9.09 0.55 1.25 1.97 1.492004-
05 5.34 9.91 0.64 1.29 1.78 0.452005-
06 1.64 5.14 0.95 1.34 1.46 0.422006-
07 3.09 4.25 1.09 2.15 1.99 0.522007-
08 3.96 3.54 1.35 2.27 2.42 0.842008-
09 4.11 4.35 1.34 2.54 2.09 0.84Averag
e 3.976 5.834 1.126 2.336 2.29 0.826
Source: Data compiled from software,’ PROWESS’.
F = 13.570, d.f. (5, 54), P < 0.05, Significant
As shown in Table 9, F B has highest QR every year and KM B
has lowest. On an average, F B has higher QR then that of
AXIS B, ICICI, INGV B, HDFC and KM B has lowest. So it shows
that FB has enough resources to pay its debts. It has good
short-term financial strength and its better able to meet
its current obligations using liquid asset on time.
Since F=13.570 (P<0.05), it is concluded that the Quick
Ratio position of HDFC, ICICI, AXIS B, F B, INGV B and KM B
differ significantly.
Conclusion
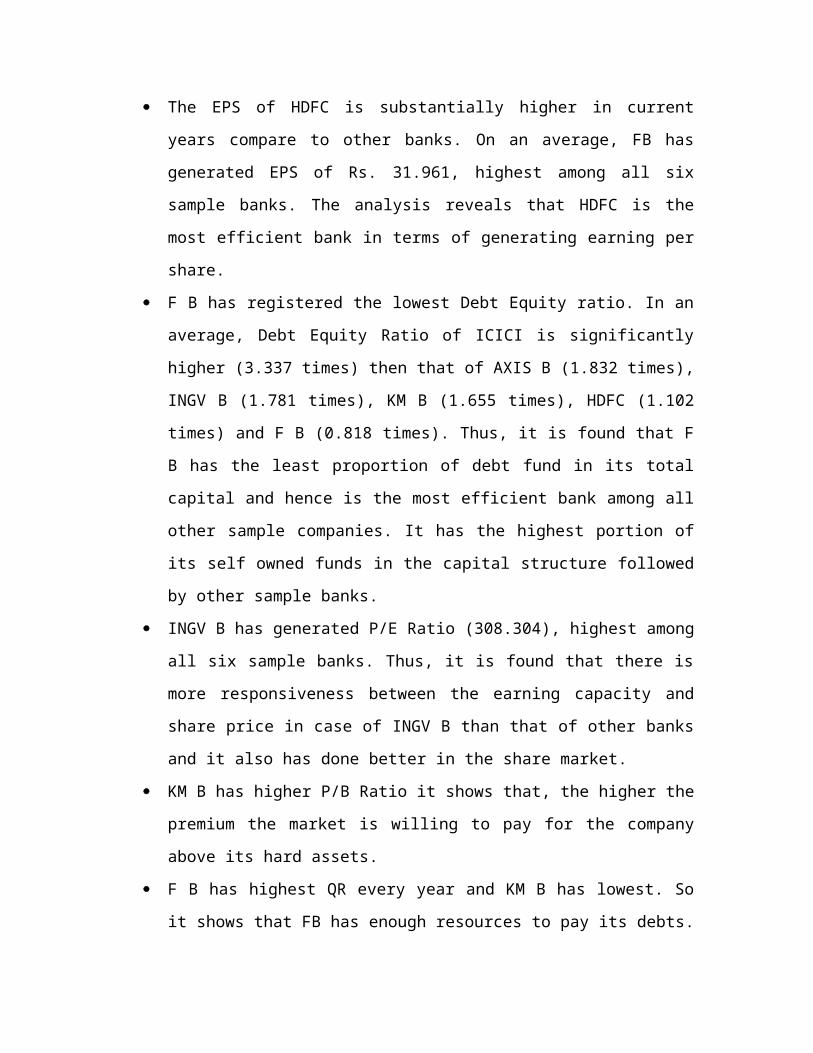
The EPS of HDFC is substantially higher in current
years compare to other banks. On an average, FB has
generated EPS of Rs. 31.961, highest among all six
sample banks. The analysis reveals that HDFC is the
most efficient bank in terms of generating earning per
share.
F B has registered the lowest Debt Equity ratio. In an
average, Debt Equity Ratio of ICICI is significantly
higher (3.337 times) then that of AXIS B (1.832 times),
INGV B (1.781 times), KM B (1.655 times), HDFC (1.102
times) and F B (0.818 times). Thus, it is found that F
B has the least proportion of debt fund in its total
capital and hence is the most efficient bank among all
other sample companies. It has the highest portion of
its self owned funds in the capital structure followed
by other sample banks.
INGV B has generated P/E Ratio (308.304), highest among
all six sample banks. Thus, it is found that there is
more responsiveness between the earning capacity and
share price in case of INGV B than that of other banks
and it also has done better in the share market.
KM B has higher P/B Ratio it shows that, the higher the
premium the market is willing to pay for the company
above its hard assets.
F B has highest QR every year and KM B has lowest. So
it shows that FB has enough resources to pay its debts.
It has good short-term financial strength and its
better able to meet its current obligations using
liquid asset on time.
ROCE of HDFC is highest every year among all other
sample banks. This concludes that HDFC generates enough
returns to pay for its cost of capital.
AXIS B has achieved the highest RONW every year for the
data taken for the period of 1999-09 and is followed by
F B. This concludes that AXIS bank efficiency,
financial viability and its ability to earn returns on
shareholders funds & capital employed is sound and
effective.
Currently F B ensures that it can absorb a reasonable
amount of loss and are complying with their statutory
Capital requirements due to higher Capital to Risk
Assets Ratio.
FB has enough resources to pay its debts over the next
12 months. It has good short-term financial strength,
because F B has highest CR every year.
SuggestionsAfter performing a profound analysis of the major players of
the Indian Private sector banking industry, the following
suggestions might be looked over:
For effective control banks required to maintain proper
ratio of liquidity, solvency and profitability.
Banks should locate the weak spots in business and
remedial measure should take to correct them.
KM B, HDFC has current ratio less then ideal current
ratio 2:1, it indicates lack of liquidity and shortage
of working capital. So proper action required to taken
by them for improving their current ratio.
AXIS B (10.449), with the lowest CAR are not complying
with their statutory Capital requirements due to lower
Capital to Risk Assets Ratio, which required corrective
measures for improving it.
Axis B achieved the highest Debt Equity Ratio, it is
inferred that it has the high proportion of debt fund
in its total capital which is not a good sign of
financial position, so bank has required maintaining a
proper ratio of debt to equity in order to provide
sufficient protection to long term lenders.
References Joseph F. Healey (2001), “Statistics: A
Tool for Social Research” fifth edition, Wadsworth
Publishing Company, pp.280-289.
Eugene F. Brigham and Michael C.
Ehrhardt (2006), “Financial Management: Theory &
Practice”.
SAS Institute (2008), SAS/STAT 9.2
User's guide: Introduction to Nonparametric Analysis.
Cary, NC. Author.
Pal, Ved and Malik, N.S. (2007),”ICFAI Journal of Bank
Management, “Vol. 6, No. 3, pp. 29-42.
Dhade, Aruna and Mittal, Manish (2008), “The ICFAI
Journal of Bank Management”,’ Vol. 12, No. 2, pp. 62-
74.
Mengi, Pooja (2009),”The IUP Journal of Management
Research”,’ Vol. VIII, No. 9, pp. 7-17.
Hazra, Sandip Ghosh and Srivastava, Kailash B. L.
(2009),”The ICFAI Journal of Marketing Management”,
‘Vol. VIII, Nos. 3 & 4, pp. 74-95.


