Embed Size (px)
Citation preview
341
IRA-International Journal of Management &
Social Sciences
ISSN 2455-2267; Vol.05, Issue 02 (2016)
Pg. no. 341-354
Institute of Research Advances
http://research-advances.org/index.php/RAJMSS
Progress of Foreign Banks Vis-À- Indian Banks
T. Vinila
Assistant Professor of Commerce
Social Welfare Residential Govt Degree College (w) Chittoor, India.
Type of Review: Peer Reviewed.
DOI: http://dx.doi.org/10.21013/jmss.v5.n2.p12
How to cite this paper:
Vinila, T. (2016). Progress of Foreign Banks Vis-À- Indian Banks. IRA-International
Journal of Management & Social Sciences (ISSN 2455-2267), 5(2), 341-354.
doi:http://dx.doi.org/10.21013/jmss.v5.n2.p12
© Institute of Research Advances
This work is licensed under a Creative Commons Attribution-Non Commercial 4.0
International License subject to proper citation to the publication source of the work.
Disclaimer: The scholarly papers as reviewed and published by the Institute of Research
Advances (IRA) are the views and opinions of their respective authors and are not the
views or opinions of the IRA. The IRA disclaims of any harm or loss caused due to the
published content to any party.
IRA-International Journal of Management & Social Sciences
342
ABSTRACT
A review of comparative progress made by the foreign banks in India vis-à-vis their counterpart Indian
banks in terms of basic banking performance indicators for a 15 year period commencing from 1999-
2000 is made in this Chapter so as to trace their status, strengths and limitations so far as their
operations in India are concerned. The basic performance indicators that are taken into consideration
are number of employees working, deposits, advances, branches, income and expenditure, profit, etc. It
is to further mention here that the entire period of study is divided into three comprising each of five year
duration so as to observe periodical trends and appropriately compound growth rates for each period are
calculated for logical analysis and interpretation.
Key words: Public Sector Banks, Private Sector Banks and Foreign Banks
INTRODUCTION:
Historically, Foreign Banks took the lead in introducing the latest technology and the
innovative product and services introduced gradually diffused in the Indian banking system. This trend
has now changed. The domestic banks have responded to market demands by introducing more tailor-
made and innovative products. Some of the domestic banks had been accredited to introduce new
products, for instance Andhra Bank, for the “credit card business in India” and the Kisan credit card by
Dena Bank, even in adopting the concept of” micro finance “ domestic banks took the lead for instance,
the pigmy deposit seen started by syndicate Bank in 1928.Therefore, even with respect to the trickling
down of the innovative products of Foreign Banks as a result on their technological lead, they have lost
ground. All the banks have now become technology savvy.
Even the case for granting greater freedom to Foreign Banks, thereby expecting that it would
help domestic private banks in easily accessing the capital market, seems to have lost its fervor, as the
need for foreign capital is no longer critical when India has sufficient forex reserves. Moreover, the
present day domestic banks have grown practically in all spheres of banking activities, such as, depository
participatory services, investment banking, bank assurance and treasury operations. Above all, there has
been a realization and change in the mind set of the Public Sector Banks, in particular, of the need to align
with the globalization process. In fact, a number of domestic banks, have been seriously considering,
globalizing their operations. Reddy believes that a few large domestic private sector banks have already
attained world standards. In view of the above, there is no reason to enter to persist with promoting the
aggressive expansion of foreign Banks in India.
The comparative performance of foreign banks in India with that of their counterparts under
public and private sector is reviewed in terms of number of employees, branch expansion, deposits, loans
and advances, total business, income, expenditure, profit, etc with the aid of ratios and growth rates.
NEED FOR THE STUDY:
Though a number of studies have focused on the different aspects of foreign banks operations,
majority of these studies were conducted during the period prior to 1995. In view of the importance
attached to the foreign banks in India to that Indian banks and the contribution of these banks to the
Indian economy as become a challenge to the present banking scenario and a competitive spirit as been
developed between the foreign banks and Indian banks.
IRA-International Journal of Management & Social Sciences
343
OBJECTIVES OF THE STUDY :
The objectives of the proposed study are to:
To study the progress of Foreign banks in India with that of Indian banks during 1999-00 to
2013-14.
To make a comparative study on the growth of public sector banks and total foreign banks.
Methodology
The information is gathered from different books Reserve Bank of India Publications,
Indian Bankers Association, Banking at a glance etc.
Number of Employees
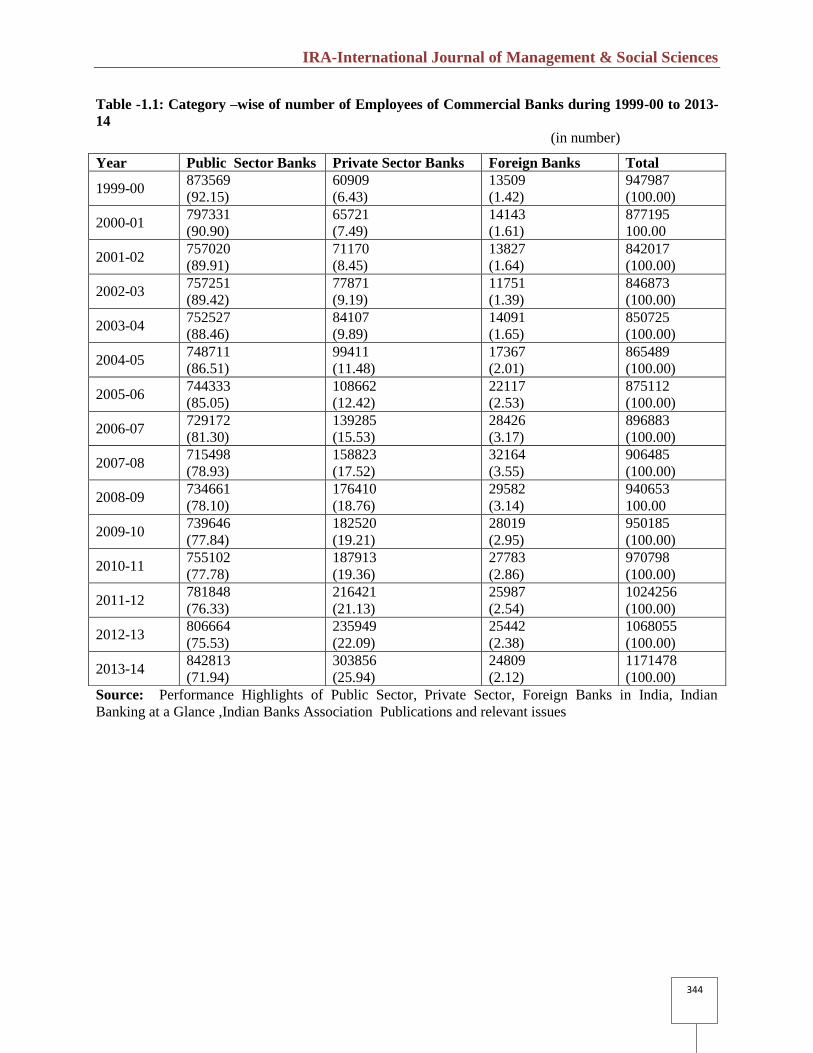
The comparative trends with regard to Number of Employees working in Public Sector, Private
Sector, Foreign Banks for the study period 1999-2014 are presented in Table 1.1. It can be gauged from
table that the total number of employees working in the banking industry registered a little above three
per cent growth rate during the above period, though there was a sharp decline in the share of public
sector banks from 92.15 percent during 1999-00 to 71.94 per cent during 2013-14. However in case of
private sector banks and foreign banks, noticeable increase in their relative share during the same period
can be noticed. These trends might be due to the increasing momentum of branch expansion programme
of Private Sector Banks and Foreign Banks, as a sequel to RBI’s soft policy towards Private Sector Banks
as part of Banking Sector Reforms.
Branch Expansion
The trends relating to branch expansion programme by Public Sector Banks, Private Sector Banks
and Foreign Banks during 1999 to 2014 are presented in Table 1.2. It is significant to observe that there
has been almost 100 per cent increase in total number of branches of all the banks together during the
period under study. However it is pertinent to notice that the share of Public Sector Banks in total
branches has been on the gradual decline, while phenomenal increase in case of Private Sector Banks and
a modest rise in respect of Foreign Banks have been recorded during post reforms period. This can be
attributed to the RBI’s policy of encouraging Private Sector Banks both domestic along with
consolidating the branch net work of Public Sector banks both domestic and foreign can also be observed
from the table that the foreign banks though exhibited a modest increase in its relative share 0.30 per cent
of total branches during the study period in absolute terms they improved their presences from 138 to 329
locations which itself is a land able one.
IRA-International Journal of Management & Social Sciences
344
Table -1.1: Category –wise of number of Employees of Commercial Banks during 1999-00 to 2013-
14
(in number)
Source: Performance Highlights of Public Sector, Private Sector, Foreign Banks in India, Indian
Banking at a Glance ,Indian Banks Association Publications and relevant issues
Year Public Sector Banks Private Sector Banks Foreign Banks Total
1999-00 873569
(92.15)
60909
(6.43)
13509
(1.42)
947987
(100.00)
2000-01 797331
(90.90)
65721
(7.49)
14143
(1.61)
877195
100.00
2001-02 757020
(89.91)
71170
(8.45)
13827
(1.64)
842017
(100.00)
2002-03 757251
(89.42)
77871
(9.19)
11751
(1.39)
846873
(100.00)
2003-04 752527
(88.46)
84107
(9.89)
14091
(1.65)
850725
(100.00)
2004-05 748711
(86.51)
99411
(11.48)
17367
(2.01)
865489
(100.00)
2005-06 744333
(85.05)
108662
(12.42)
22117
(2.53)
875112
(100.00)
2006-07 729172
(81.30)
139285
(15.53)
28426
(3.17)
896883
(100.00)
2007-08 715498
(78.93)
158823
(17.52)
32164
(3.55)
906485
(100.00)
2008-09 734661
(78.10)
176410
(18.76)
29582
(3.14)
940653
100.00
2009-10 739646
(77.84)
182520
(19.21)
28019
(2.95)
950185
(100.00)
2010-11 755102
(77.78)
187913
(19.36)
27783
(2.86)
970798
(100.00)
2011-12 781848
(76.33)
216421
(21.13)
25987
(2.54)
1024256
(100.00)
2012-13 806664
(75.53)
235949
(22.09)
25442
(2.38)
1068055
(100.00)
2013-14 842813
(71.94)
303856
(25.94)
24809
(2.12)
1171478
(100.00)
IRA-International Journal of Management & Social Sciences
345
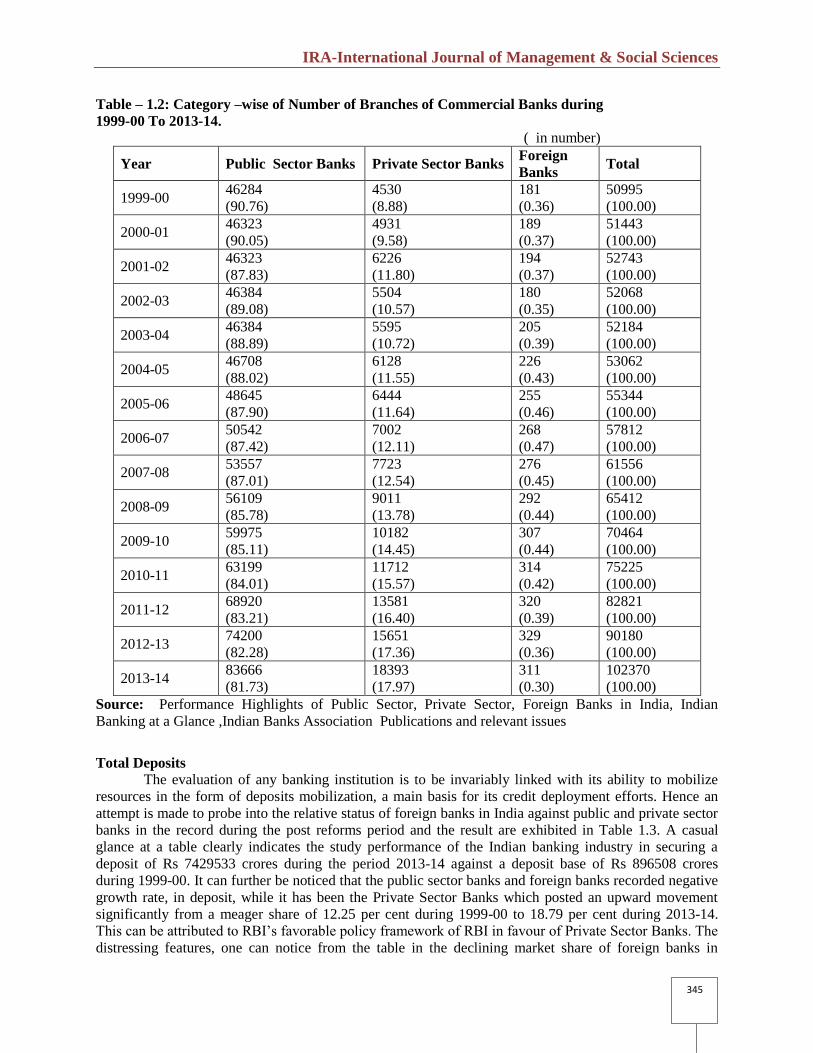
Table – 1.2: Category –wise of Number of Branches of Commercial Banks during
1999-00 To 2013-14.
( in number)
Year Public Sector Banks Private Sector Banks Foreign
Banks Total
1999-00 46284
(90.76)
4530
(8.88)
181
(0.36)
50995
(100.00)
2000-01 46323
(90.05)
4931
(9.58)
189
(0.37)
51443
(100.00)
2001-02 46323
(87.83)
6226
(11.80)
194
(0.37)
52743
(100.00)
2002-03 46384
(89.08)
5504
(10.57)
180
(0.35)
52068
(100.00)
2003-04 46384
(88.89)
5595
(10.72)
205
(0.39)
52184
(100.00)
2004-05 46708
(88.02)
6128
(11.55)
226
(0.43)
53062
(100.00)
2005-06 48645
(87.90)
6444
(11.64)
255
(0.46)
55344
(100.00)
2006-07 50542
(87.42)
7002
(12.11)
268
(0.47)
57812
(100.00)
2007-08 53557
(87.01)
7723
(12.54)
276
(0.45)
61556
(100.00)
2008-09 56109
(85.78)
9011
(13.78)
292
(0.44)
65412
(100.00)
2009-10 59975
(85.11)
10182
(14.45)
307
(0.44)
70464
(100.00)
2010-11 63199
(84.01)
11712
(15.57)
314
(0.42)
75225
(100.00)
2011-12 68920
(83.21)
13581
(16.40)
320
(0.39)
82821
(100.00)
2012-13 74200
(82.28)
15651
(17.36)
329
(0.36)
90180
(100.00)
2013-14 83666
(81.73)
18393
(17.97)
311
(0.30)
102370
(100.00)
Source: Performance Highlights of Public Sector, Private Sector, Foreign Banks in India, Indian
Banking at a Glance ,Indian Banks Association Publications and relevant issues
Total Deposits
The evaluation of any banking institution is to be invariably linked with its ability to mobilize
resources in the form of deposits mobilization, a main basis for its credit deployment efforts. Hence an
attempt is made to probe into the relative status of foreign banks in India against public and private sector
banks in the record during the post reforms period and the result are exhibited in Table 1.3. A casual
glance at a table clearly indicates the study performance of the Indian banking industry in securing a
deposit of Rs 7429533 crores during the period 2013-14 against a deposit base of Rs 896508 crores
during 1999-00. It can further be noticed that the public sector banks and foreign banks recorded negative
growth rate, in deposit, while it has been the Private Sector Banks which posted an upward movement
significantly from a meager share of 12.25 per cent during 1999-00 to 18.79 per cent during 2013-14.
This can be attributed to RBI’s favorable policy framework of RBI in favour of Private Sector Banks. The
distressing features, one can notice from the table in the declining market share of foreign banks in
IRA-International Journal of Management & Social Sciences
346
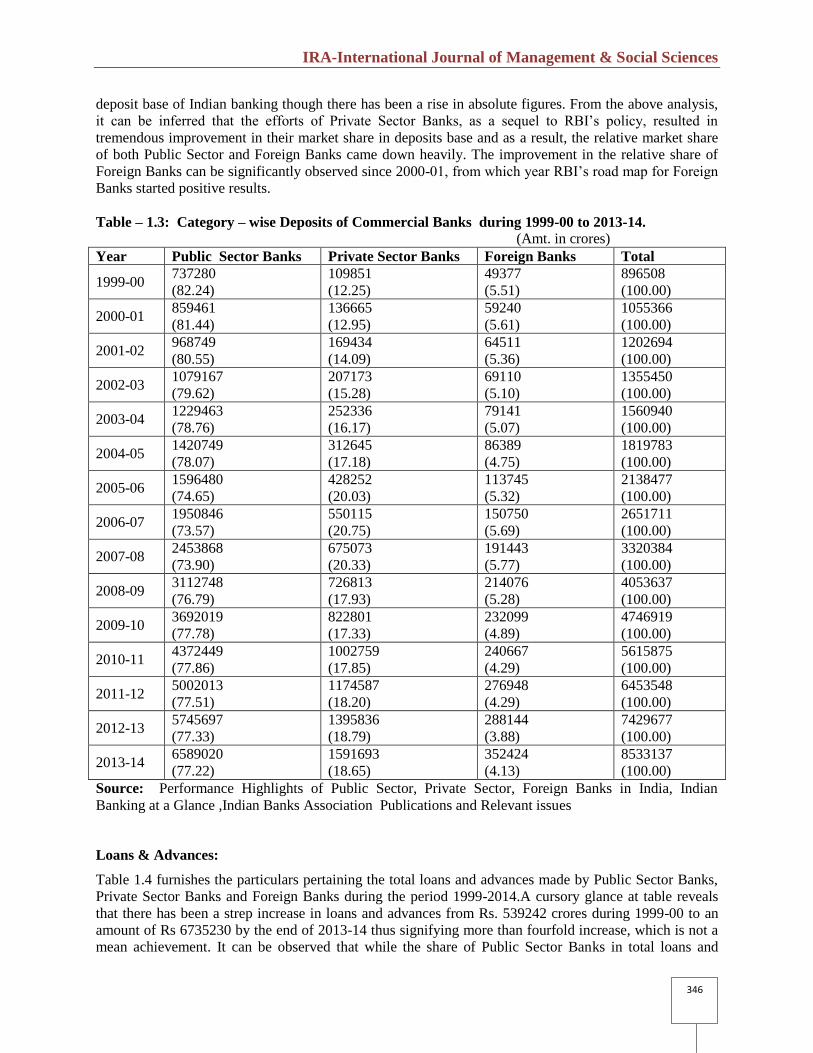
deposit base of Indian banking though there has been a rise in absolute figures. From the above analysis,
it can be inferred that the efforts of Private Sector Banks, as a sequel to RBI’s policy, resulted in
tremendous improvement in their market share in deposits base and as a result, the relative market share
of both Public Sector and Foreign Banks came down heavily. The improvement in the relative share of
Foreign Banks can be significantly observed since 2000-01, from which year RBI’s road map for Foreign
Banks started positive results.
Table – 1.3: Category – wise Deposits of Commercial Banks during 1999-00 to 2013-14.
(Amt. in crores)
Year Public Sector Banks Private Sector Banks Foreign Banks Total
1999-00 737280
(82.24)
109851
(12.25)
49377
(5.51)
896508
(100.00)
2000-01 859461
(81.44)
136665
(12.95)
59240
(5.61)
1055366
(100.00)
2001-02 968749
(80.55)
169434
(14.09)
64511
(5.36)
1202694
(100.00)
2002-03 1079167
(79.62)
207173
(15.28)
69110
(5.10)
1355450
(100.00)
2003-04 1229463
(78.76)
252336
(16.17)
79141
(5.07)
1560940
(100.00)
2004-05 1420749
(78.07)
312645
(17.18)
86389
(4.75)
1819783
(100.00)
2005-06 1596480
(74.65)
428252
(20.03)
113745
(5.32)
2138477
(100.00)
2006-07 1950846
(73.57)
550115
(20.75)
150750
(5.69)
2651711
(100.00)
2007-08 2453868
(73.90)
675073
(20.33)
191443
(5.77)
3320384
(100.00)
2008-09 3112748
(76.79)
726813
(17.93)
214076
(5.28)
4053637
(100.00)
2009-10 3692019
(77.78)
822801
(17.33)
232099
(4.89)
4746919
(100.00)
2010-11 4372449
(77.86)
1002759
(17.85)
240667
(4.29)
5615875
(100.00)
2011-12 5002013
(77.51)
1174587
(18.20)
276948
(4.29)
6453548
(100.00)
2012-13 5745697
(77.33)
1395836
(18.79)
288144
(3.88)
7429677
(100.00)
2013-14 6589020
(77.22)
1591693
(18.65)
352424
(4.13)
8533137
(100.00)
Source: Performance Highlights of Public Sector, Private Sector, Foreign Banks in India, Indian
Banking at a Glance ,Indian Banks Association Publications and Relevant issues
Loans & Advances:
Table 1.4 furnishes the particulars pertaining the total loans and advances made by Public Sector Banks,
Private Sector Banks and Foreign Banks during the period 1999-2014.A cursory glance at table reveals
that there has been a strep increase in loans and advances from Rs. 539242 crores during 1999-00 to an
amount of Rs 6735230 by the end of 2013-14 thus signifying more than fourfold increase, which is not a
mean achievement. It can be observed that while the share of Public Sector Banks in total loans and
IRA-International Journal of Management & Social Sciences
347
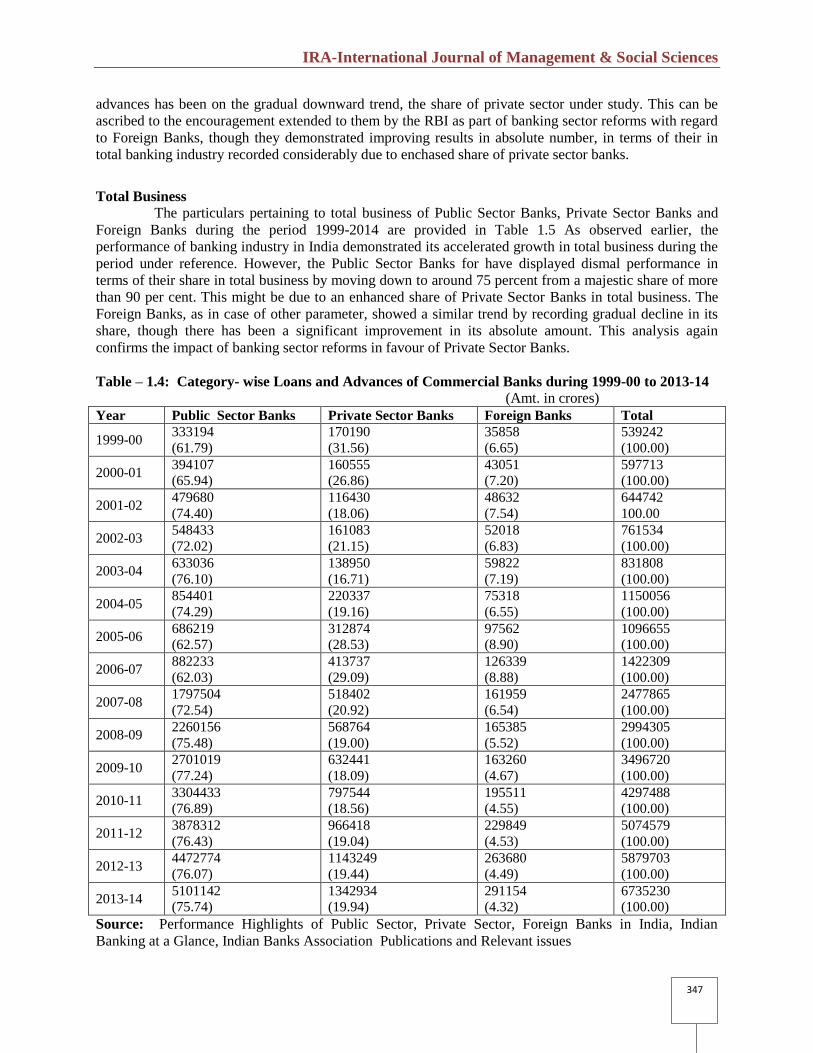
advances has been on the gradual downward trend, the share of private sector under study. This can be
ascribed to the encouragement extended to them by the RBI as part of banking sector reforms with regard
to Foreign Banks, though they demonstrated improving results in absolute number, in terms of their in
total banking industry recorded considerably due to enchased share of private sector banks.
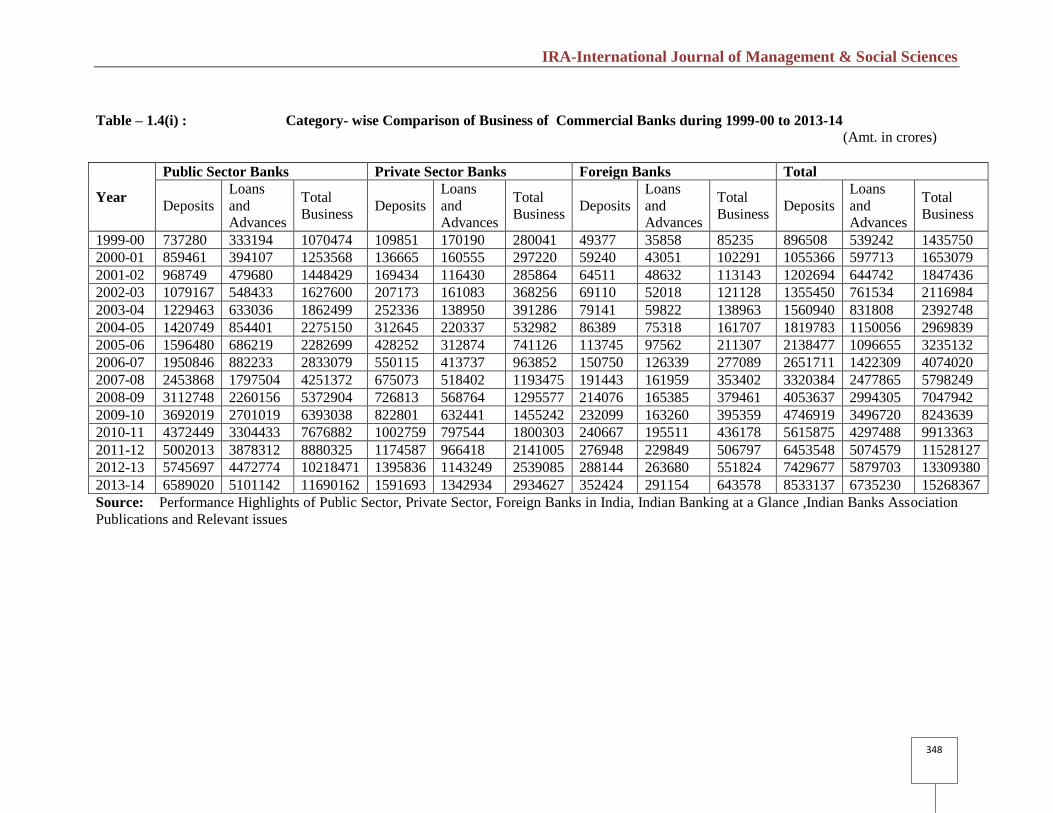
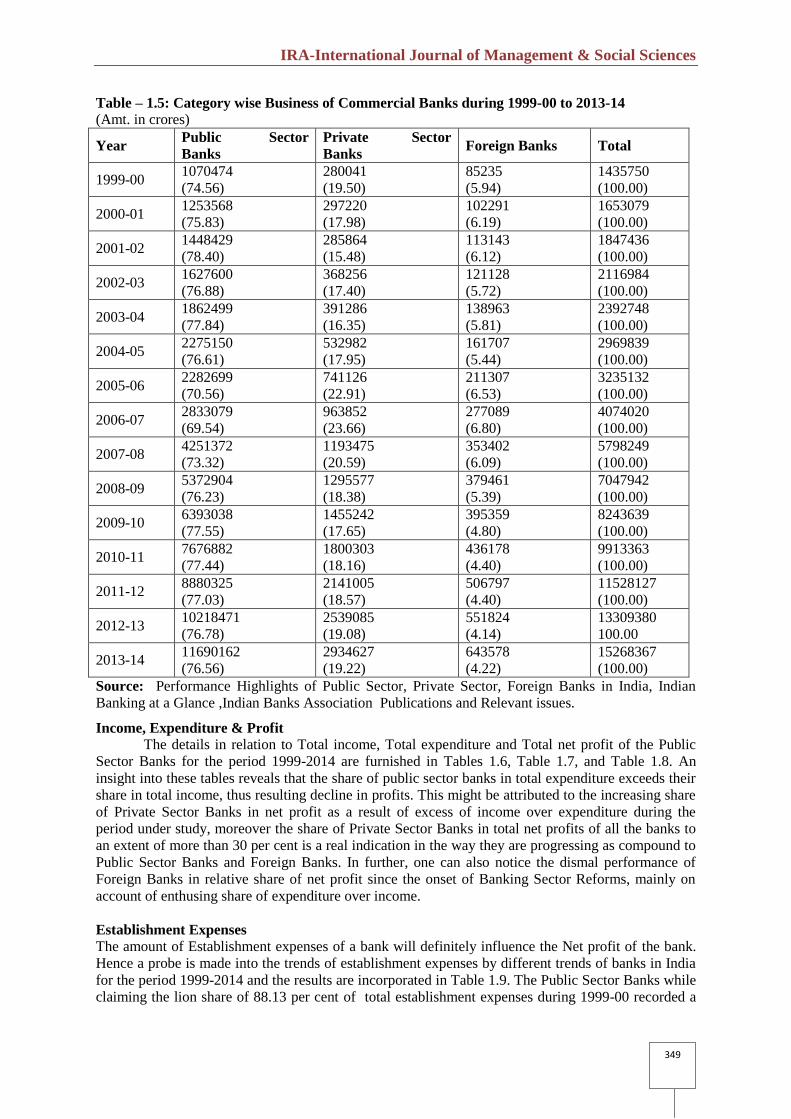
Total Business
The particulars pertaining to total business of Public Sector Banks, Private Sector Banks and
Foreign Banks during the period 1999-2014 are provided in Table 1.5 As observed earlier, the
performance of banking industry in India demonstrated its accelerated growth in total business during the
period under reference. However, the Public Sector Banks for have displayed dismal performance in
terms of their share in total business by moving down to around 75 percent from a majestic share of more
than 90 per cent. This might be due to an enhanced share of Private Sector Banks in total business. The
Foreign Banks, as in case of other parameter, showed a similar trend by recording gradual decline in its
share, though there has been a significant improvement in its absolute amount. This analysis again
confirms the impact of banking sector reforms in favour of Private Sector Banks.
Table – 1.4: Category- wise Loans and Advances of Commercial Banks during 1999-00 to 2013-14
(Amt. in crores)
Year Public Sector Banks Private Sector Banks Foreign Banks Total
1999-00 333194
(61.79)
170190
(31.56)
35858
(6.65)
539242
(100.00)
2000-01 394107
(65.94)
160555
(26.86)
43051
(7.20)
597713
(100.00)
2001-02 479680
(74.40)
116430
(18.06)
48632
(7.54)
644742
100.00
2002-03 548433
(72.02)
161083
(21.15)
52018
(6.83)
761534
(100.00)
2003-04 633036
(76.10)
138950
(16.71)
59822
(7.19)
831808
(100.00)
2004-05 854401
(74.29)
220337
(19.16)
75318
(6.55)
1150056
(100.00)
2005-06 686219
(62.57)
312874
(28.53)
97562
(8.90)
1096655
(100.00)
2006-07 882233
(62.03)
413737
(29.09)
126339
(8.88)
1422309
(100.00)
2007-08 1797504
(72.54)
518402
(20.92)
161959
(6.54)
2477865
(100.00)
2008-09 2260156
(75.48)
568764
(19.00)
165385
(5.52)
2994305
(100.00)
2009-10 2701019
(77.24)
632441
(18.09)
163260
(4.67)
3496720
(100.00)
2010-11 3304433
(76.89)
797544
(18.56)
195511
(4.55)
4297488
(100.00)
2011-12 3878312
(76.43)
966418
(19.04)
229849
(4.53)
5074579
(100.00)
2012-13 4472774
(76.07)
1143249
(19.44)
263680
(4.49)
5879703
(100.00)
2013-14 5101142
(75.74)
1342934
(19.94)
291154
(4.32)
6735230
(100.00)
Source: Performance Highlights of Public Sector, Private Sector, Foreign Banks in India, Indian
Banking at a Glance, Indian Banks Association Publications and Relevant issues
IRA-International Journal of Management & Social Sciences
348
Table – 1.4(i) : Category- wise Comparison of Business of Commercial Banks during 1999-00 to 2013-14
(Amt. in crores)
Year
Public Sector Banks Private Sector Banks Foreign Banks Total
Deposits
Loans
and
Advances
Total
Business Deposits
Loans
and
Advances
Total
Business Deposits
Loans
and
Advances
Total
Business Deposits
Loans
and
Advances
Total
Business
1999-00 737280 333194 1070474 109851 170190 280041 49377 35858 85235 896508 539242 1435750
2000-01 859461 394107 1253568 136665 160555 297220 59240 43051 102291 1055366 597713 1653079
2001-02 968749 479680 1448429 169434 116430 285864 64511 48632 113143 1202694 644742 1847436
2002-03 1079167 548433 1627600 207173 161083 368256 69110 52018 121128 1355450 761534 2116984
2003-04 1229463 633036 1862499 252336 138950 391286 79141 59822 138963 1560940 831808 2392748
2004-05 1420749 854401 2275150 312645 220337 532982 86389 75318 161707 1819783 1150056 2969839
2005-06 1596480 686219 2282699 428252 312874 741126 113745 97562 211307 2138477 1096655 3235132
2006-07 1950846 882233 2833079 550115 413737 963852 150750 126339 277089 2651711 1422309 4074020
2007-08 2453868 1797504 4251372 675073 518402 1193475 191443 161959 353402 3320384 2477865 5798249
2008-09 3112748 2260156 5372904 726813 568764 1295577 214076 165385 379461 4053637 2994305 7047942
2009-10 3692019 2701019 6393038 822801 632441 1455242 232099 163260 395359 4746919 3496720 8243639
2010-11 4372449 3304433 7676882 1002759 797544 1800303 240667 195511 436178 5615875 4297488 9913363
2011-12 5002013 3878312 8880325 1174587 966418 2141005 276948 229849 506797 6453548 5074579 11528127
2012-13 5745697 4472774 10218471 1395836 1143249 2539085 288144 263680 551824 7429677 5879703 13309380
2013-14 6589020 5101142 11690162 1591693 1342934 2934627 352424 291154 643578 8533137 6735230 15268367
Source: Performance Highlights of Public Sector, Private Sector, Foreign Banks in India, Indian Banking at a Glance ,Indian Banks Association
Publications and Relevant issues
IRA-International Journal of Management & Social Sciences
349
Table – 1.5: Category wise Business of Commercial Banks during 1999-00 to 2013-14
(Amt. in crores)
Year Public Sector
Banks
Private Sector
Banks Foreign Banks Total
1999-00 1070474
(74.56)
280041
(19.50)
85235
(5.94)
1435750
(100.00)
2000-01 1253568
(75.83)
297220
(17.98)
102291
(6.19)
1653079
(100.00)
2001-02 1448429
(78.40)
285864
(15.48)
113143
(6.12)
1847436
(100.00)
2002-03 1627600
(76.88)
368256
(17.40)
121128
(5.72)
2116984
(100.00)
2003-04 1862499
(77.84)
391286
(16.35)
138963
(5.81)
2392748
(100.00)
2004-05 2275150
(76.61)
532982
(17.95)
161707
(5.44)
2969839
(100.00)
2005-06 2282699
(70.56)
741126
(22.91)
211307
(6.53)
3235132
(100.00)
2006-07 2833079
(69.54)
963852
(23.66)
277089
(6.80)
4074020
(100.00)
2007-08 4251372
(73.32)
1193475
(20.59)
353402
(6.09)
5798249
(100.00)
2008-09 5372904
(76.23)
1295577
(18.38)
379461
(5.39)
7047942
(100.00)
2009-10 6393038
(77.55)
1455242
(17.65)
395359
(4.80)
8243639
(100.00)
2010-11 7676882
(77.44)
1800303
(18.16)
436178
(4.40)
9913363
(100.00)
2011-12 8880325
(77.03)
2141005
(18.57)
506797
(4.40)
11528127
(100.00)
2012-13 10218471
(76.78)
2539085
(19.08)
551824
(4.14)
13309380
100.00
2013-14 11690162
(76.56)
2934627
(19.22)
643578
(4.22)
15268367
(100.00)
Source: Performance Highlights of Public Sector, Private Sector, Foreign Banks in India, Indian
Banking at a Glance ,Indian Banks Association Publications and Relevant issues.
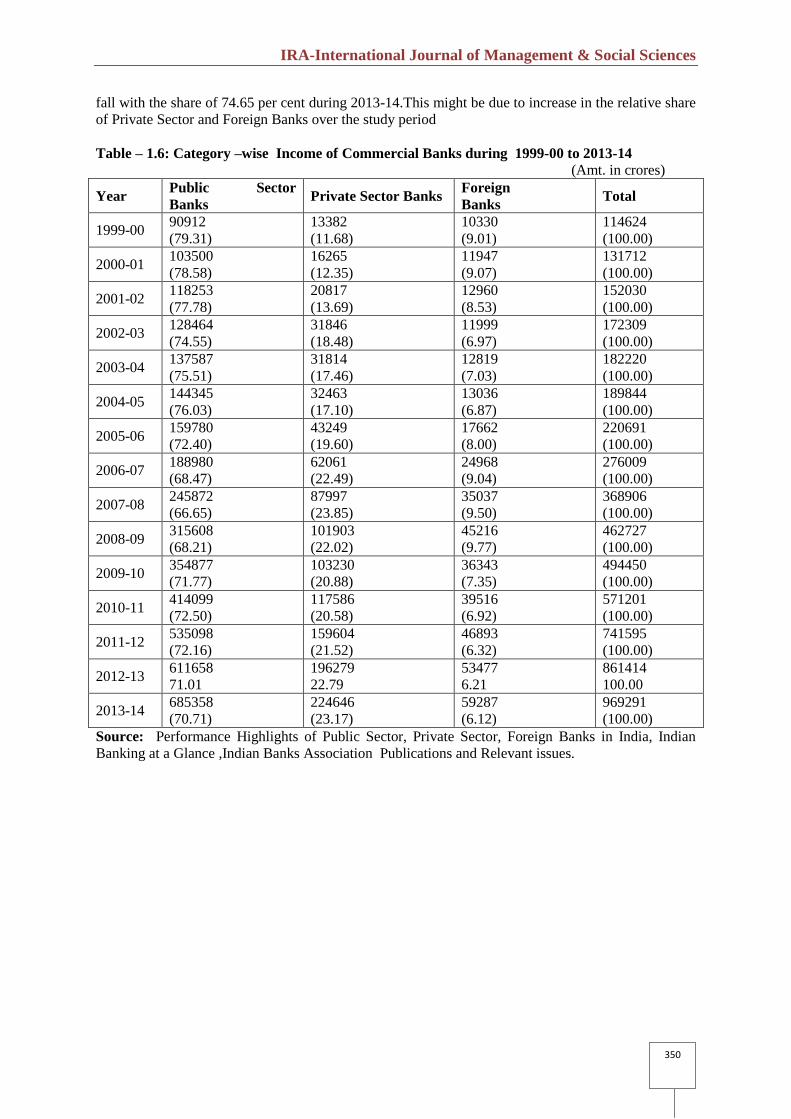
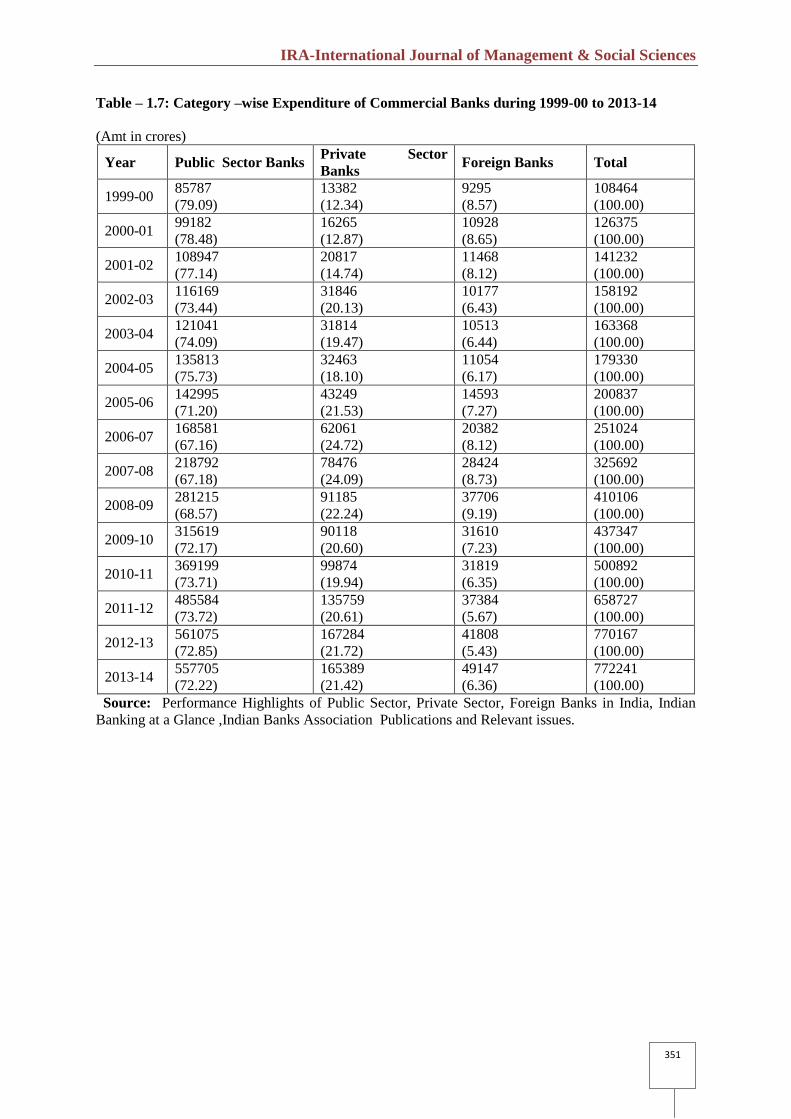
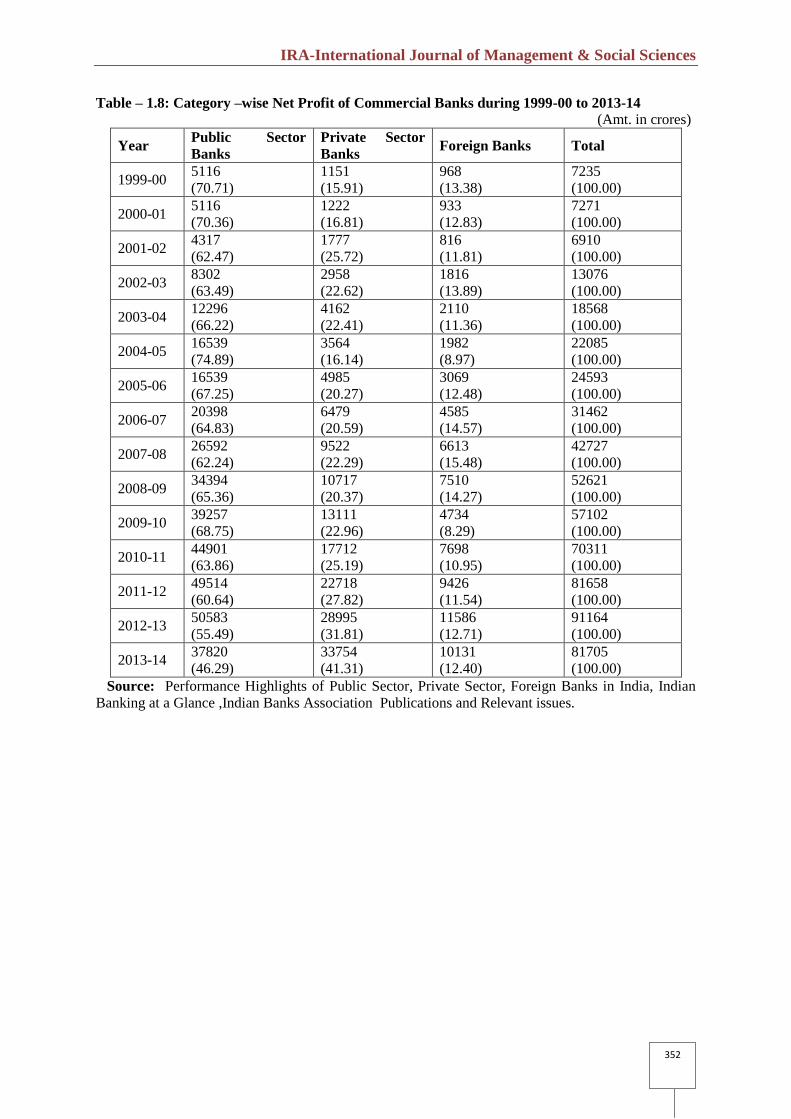
Income, Expenditure & Profit
The details in relation to Total income, Total expenditure and Total net profit of the Public
Sector Banks for the period 1999-2014 are furnished in Tables 1.6, Table 1.7, and Table 1.8. An
insight into these tables reveals that the share of public sector banks in total expenditure exceeds their
share in total income, thus resulting decline in profits. This might be attributed to the increasing share
of Private Sector Banks in net profit as a result of excess of income over expenditure during the
period under study, moreover the share of Private Sector Banks in total net profits of all the banks to
an extent of more than 30 per cent is a real indication in the way they are progressing as compound to
Public Sector Banks and Foreign Banks. In further, one can also notice the dismal performance of
Foreign Banks in relative share of net profit since the onset of Banking Sector Reforms, mainly on
account of enthusing share of expenditure over income.
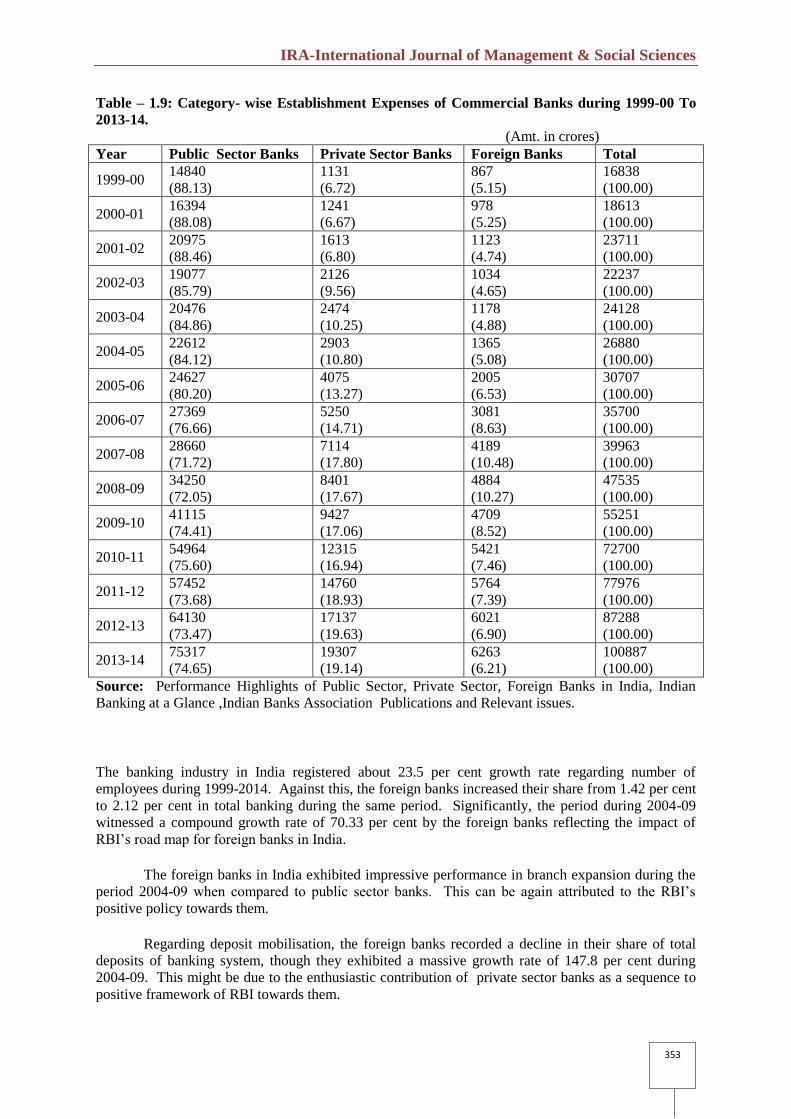
Establishment Expenses
The amount of Establishment expenses of a bank will definitely influence the Net profit of the bank.
Hence a probe is made into the trends of establishment expenses by different trends of banks in India
for the period 1999-2014 and the results are incorporated in Table 1.9. The Public Sector Banks while
claiming the lion share of 88.13 per cent of total establishment expenses during 1999-00 recorded a
IRA-International Journal of Management & Social Sciences
350
fall with the share of 74.65 per cent during 2013-14.This might be due to increase in the relative share
of Private Sector and Foreign Banks over the study period
Table – 1.6: Category –wise Income of Commercial Banks during 1999-00 to 2013-14
(Amt. in crores)
Year Public Sector
Banks Private Sector Banks
Foreign
Banks Total
1999-00 90912
(79.31)
13382
(11.68)
10330
(9.01)
114624
(100.00)
2000-01 103500
(78.58)
16265
(12.35)
11947
(9.07)
131712
(100.00)
2001-02 118253
(77.78)
20817
(13.69)
12960
(8.53)
152030
(100.00)
2002-03 128464
(74.55)
31846
(18.48)
11999
(6.97)
172309
(100.00)
2003-04 137587
(75.51)
31814
(17.46)
12819
(7.03)
182220
(100.00)
2004-05 144345
(76.03)
32463
(17.10)
13036
(6.87)
189844
(100.00)
2005-06 159780
(72.40)
43249
(19.60)
17662
(8.00)
220691
(100.00)
2006-07 188980
(68.47)
62061
(22.49)
24968
(9.04)
276009
(100.00)
2007-08 245872
(66.65)
87997
(23.85)
35037
(9.50)
368906
(100.00)
2008-09 315608
(68.21)
101903
(22.02)
45216
(9.77)
462727
(100.00)
2009-10 354877
(71.77)
103230
(20.88)
36343
(7.35)
494450
(100.00)
2010-11 414099
(72.50)
117586
(20.58)
39516
(6.92)
571201
(100.00)
2011-12 535098
(72.16)
159604
(21.52)
46893
(6.32)
741595
(100.00)
2012-13 611658
71.01
196279
22.79
53477
6.21
861414
100.00
2013-14 685358
(70.71)
224646
(23.17)
59287
(6.12)
969291
(100.00)
Source: Performance Highlights of Public Sector, Private Sector, Foreign Banks in India, Indian
Banking at a Glance ,Indian Banks Association Publications and Relevant issues.
IRA-International Journal of Management & Social Sciences
351
Table – 1.7: Category –wise Expenditure of Commercial Banks during 1999-00 to 2013-14
(Amt in crores)
Year Public Sector Banks Private Sector
Banks Foreign Banks Total
1999-00 85787
(79.09)
13382
(12.34)
9295
(8.57)
108464
(100.00)
2000-01 99182
(78.48)
16265
(12.87)
10928
(8.65)
126375
(100.00)
2001-02 108947
(77.14)
20817
(14.74)
11468
(8.12)
141232
(100.00)
2002-03 116169
(73.44)
31846
(20.13)
10177
(6.43)
158192
(100.00)
2003-04 121041
(74.09)
31814
(19.47)
10513
(6.44)
163368
(100.00)
2004-05 135813
(75.73)
32463
(18.10)
11054
(6.17)
179330
(100.00)
2005-06 142995
(71.20)
43249
(21.53)
14593
(7.27)
200837
(100.00)
2006-07 168581
(67.16)
62061
(24.72)
20382
(8.12)
251024
(100.00)
2007-08 218792
(67.18)
78476
(24.09)
28424
(8.73)
325692
(100.00)
2008-09 281215
(68.57)
91185
(22.24)
37706
(9.19)
410106
(100.00)
2009-10 315619
(72.17)
90118
(20.60)
31610
(7.23)
437347
(100.00)
2010-11 369199
(73.71)
99874
(19.94)
31819
(6.35)
500892
(100.00)
2011-12 485584
(73.72)
135759
(20.61)
37384
(5.67)
658727
(100.00)
2012-13 561075
(72.85)
167284
(21.72)
41808
(5.43)
770167
(100.00)
2013-14 557705
(72.22)
165389
(21.42)
49147
(6.36)
772241
(100.00)
Source: Performance Highlights of Public Sector, Private Sector, Foreign Banks in India, Indian
Banking at a Glance ,Indian Banks Association Publications and Relevant issues.
IRA-International Journal of Management & Social Sciences
352
Table – 1.8: Category –wise Net Profit of Commercial Banks during 1999-00 to 2013-14
(Amt. in crores)
Year Public Sector
Banks
Private Sector
Banks Foreign Banks Total
1999-00 5116
(70.71)
1151
(15.91)
968
(13.38)
7235
(100.00)
2000-01 5116
(70.36)
1222
(16.81)
933
(12.83)
7271
(100.00)
2001-02 4317
(62.47)
1777
(25.72)
816
(11.81)
6910
(100.00)
2002-03 8302
(63.49)
2958
(22.62)
1816
(13.89)
13076
(100.00)
2003-04 12296
(66.22)
4162
(22.41)
2110
(11.36)
18568
(100.00)
2004-05 16539
(74.89)
3564
(16.14)
1982
(8.97)
22085
(100.00)
2005-06 16539
(67.25)
4985
(20.27)
3069
(12.48)
24593
(100.00)
2006-07 20398
(64.83)
6479
(20.59)
4585
(14.57)
31462
(100.00)
2007-08 26592
(62.24)
9522
(22.29)
6613
(15.48)
42727
(100.00)
2008-09 34394
(65.36)
10717
(20.37)
7510
(14.27)
52621
(100.00)
2009-10 39257
(68.75)
13111
(22.96)
4734
(8.29)
57102
(100.00)
2010-11 44901
(63.86)
17712
(25.19)
7698
(10.95)
70311
(100.00)
2011-12 49514
(60.64)
22718
(27.82)
9426
(11.54)
81658
(100.00)
2012-13 50583
(55.49)
28995
(31.81)
11586
(12.71)
91164
(100.00)
2013-14 37820
(46.29)
33754
(41.31)
10131
(12.40)
81705
(100.00)
Source: Performance Highlights of Public Sector, Private Sector, Foreign Banks in India, Indian
Banking at a Glance ,Indian Banks Association Publications and Relevant issues.
IRA-International Journal of Management & Social Sciences
353
Table – 1.9: Category- wise Establishment Expenses of Commercial Banks during 1999-00 To
2013-14.
(Amt. in crores)
Year Public Sector Banks Private Sector Banks Foreign Banks Total
1999-00 14840
(88.13)
1131
(6.72)
867
(5.15)
16838
(100.00)
2000-01 16394
(88.08)
1241
(6.67)
978
(5.25)
18613
(100.00)
2001-02 20975
(88.46)
1613
(6.80)
1123
(4.74)
23711
(100.00)
2002-03 19077
(85.79)
2126
(9.56)
1034
(4.65)
22237
(100.00)
2003-04 20476
(84.86)
2474
(10.25)
1178
(4.88)
24128
(100.00)
2004-05 22612
(84.12)
2903
(10.80)
1365
(5.08)
26880
(100.00)
2005-06 24627
(80.20)
4075
(13.27)
2005
(6.53)
30707
(100.00)
2006-07 27369
(76.66)
5250
(14.71)
3081
(8.63)
35700
(100.00)
2007-08 28660
(71.72)
7114
(17.80)
4189
(10.48)
39963
(100.00)
2008-09 34250
(72.05)
8401
(17.67)
4884
(10.27)
47535
(100.00)
2009-10 41115
(74.41)
9427
(17.06)
4709
(8.52)
55251
(100.00)
2010-11 54964
(75.60)
12315
(16.94)
5421
(7.46)
72700
(100.00)
2011-12 57452
(73.68)
14760
(18.93)
5764
(7.39)
77976
(100.00)
2012-13 64130
(73.47)
17137
(19.63)
6021
(6.90)
87288
(100.00)
2013-14 75317
(74.65)
19307
(19.14)
6263
(6.21)
100887
(100.00)
Source: Performance Highlights of Public Sector, Private Sector, Foreign Banks in India, Indian
Banking at a Glance ,Indian Banks Association Publications and Relevant issues.
The banking industry in India registered about 23.5 per cent growth rate regarding number of
employees during 1999-2014. Against this, the foreign banks increased their share from 1.42 per cent
to 2.12 per cent in total banking during the same period. Significantly, the period during 2004-09
witnessed a compound growth rate of 70.33 per cent by the foreign banks reflecting the impact of
RBI’s road map for foreign banks in India.
The foreign banks in India exhibited impressive performance in branch expansion during the
period 2004-09 when compared to public sector banks. This can be again attributed to the RBI’s
positive policy towards them.
Regarding deposit mobilisation, the foreign banks recorded a decline in their share of total
deposits of banking system, though they exhibited a massive growth rate of 147.8 per cent during
2004-09. This might be due to the enthusiastic contribution of private sector banks as a sequence to
positive framework of RBI towards them.

IRA-International Journal of Management & Social Sciences
354
The performance of foreign banks during the study period in respect of loans and advances
was far below the level of public sector and private sector banks, though they registered a growth rate
of 119.58 per cent during 2004-09 in which period RBI’s road map towards foreign banks was
released.
There has been absolute increase in net profit of foreign banks during the period under
reference. owever, their share in total banking was on the decline mainly on account of increasing
share of private sector banks in earning net profit.
REFERENCE:
Performance Highlights of Public Sector, Private Sector, Foreign Banks in India, Indian Banking at a
Glance, Indian Banks Association Publications and Relevant issues.


