Embed Size (px)
Citation preview
VIS Credit Rating Company Limited www.vis.com.pk
1
RATING REPORT
Interloop Limited REPORT DATE: June 03, 2022
RATING ANALYSTS: Asfia Aziz [email protected] Sundus Qureshi [email protected]
COMPANY INFORMATION
Incorporated on April 1992 External auditors: Kreston Hyder Bhimji & Co.
Chartered Accountants
Public Limited Company Chief Executive Officer: Mr. Navid Fazil
Key Shareholders (with stake 5% or more): Chairman of the Board: Musadaq Zulqarnain
Mr. Musadaq Zulqarnain – 32.49%
Mr. Navid Fazil – 34.33%
Mrs. Shereen Aftab – 7.98%
APPLICABLE METHODOLOGY(IES) VIS Entity Rating Criteria Methodology – Industrial Corporates (August 2021) https://docs.vis.com.pk/docs/CorporateMethodology202108.pdf
RATING DETAILS
Rating Category
Latest Ratings Previous Ratings
Long-term
Short-term
Long-term Short-term
Entity A+ A-1 A+ A-1 Rating Date June 03, 2022 April 20, 2021
Rating Action Reaffirm Initial
Rating Outlook Stable Stable
VIS Credit Rating Company Limited www.vis.com.pk
2
Interloop Limited
OVERVIEW OF THE
INSTITUTION RATING RATIONALE
Interloop Limited (ILP) was incorporated on
April 1992 as a private limited company.
Subsequently it was converted into public unlisted company on
July 2008 and was listed on Pakistan Stock
Exchange (PSX) on April 2019. The
registered office of the company is situated at
Al Sadiq Plaza, Faisalabad.
Profile of Chairman Musadaq Zulqarnain is
the Chairman of Interloop Limited
(ILP), CEO & Chairman of Interloop
Holdings (Pvt.) Limited and Chairman of Interloop Dairies
Limited . He has more than 40 years of
experience in the leadership positions.
He is a Member of the Board of Karandaz
Pakistan and President of Interloop Welfare
Trust. He is also associated with The Citizens Foundation (TCF). A mechanical
engineer by professional training, Mr Musadaq worked for 14 years at senior
positions with a gas transmission company
in Pakistan prior to establishing ILP.
Profile of CEO
Navid Fazil is a Founding Director & CEO of ILP. He
is a seasoned professional with over 28 years of experience as a
business leader and entrepreneur. He is
also a Member of the Board of Interloop Holdings (Pvt.) Ltd and Vice President
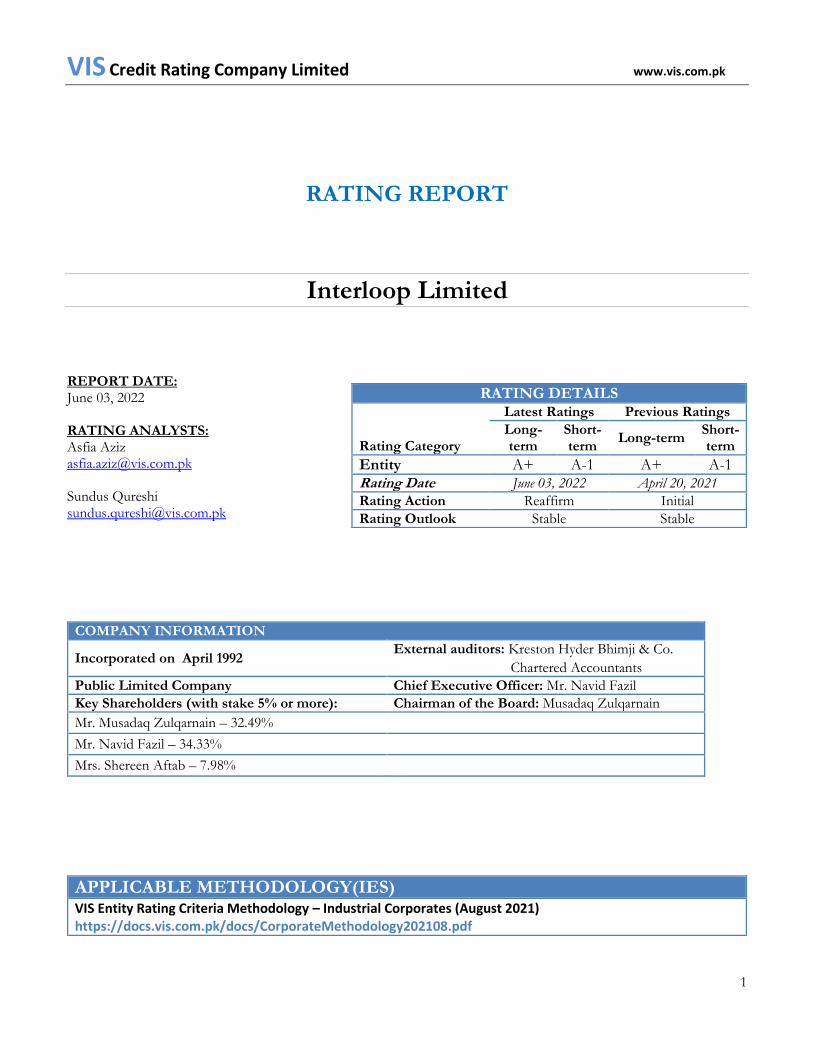
Interloop Ltd. (ILP) is Pakistan’s leading hosiery products manufacturer with vertically
integrated operations. The company is engaged in the business of manufacturing and sale
of socks, tights, leggings, yarn, denim, and apparels (knitwear and seamless active-wear).
The company has six manufacturing plants (including denim plant), with two plants based
in Lahore, while the remaining four are located in Faisalabad. The company enjoys a
production infrastructure based in Pakistan and Sri Lanka with marketing offices in USA,
Europe and Japan. The brief description of the company’s product lines is presented below:
Divisions Unit of Measurement FY20 FY21
HOSIERY
Installed Capacity - Knitting [DZN] 59,480 60,733
Actual Production - Knitting [DZN] 41,694 51,656
Capacity Utilization 70% 85%
SPINNING
Installed capacity after conversion into 20/s [LBS] 29,949 29,949
Actual production after conversion into 20/s [LBS] 23,204 25,178
Capacity Utilization 77% 84%
YARN DYEING
Installed capacity [KGS] 4,928 4,873
Actual Production [KGS] 3,438 4,052
Capacity Utilization 70% 83%
DENIM
Installed capacity [Pieces] 4,322 6,000
Actual Production [Pieces] 2,448 3,377
Capacity Utilization 57% 56%
Hosiery: This business division includes manufacturing of tights, leggings and wide variety
of socks. ILP was established as a hosiery manufacturing Company in 1992 and it continues
to remain the core business of the Company to date. Over the last three decades, ILP has
become one of the largest suppliers of socks globally to major brands and retailers such as
Nike, Adidas, Puma, Target, H&M, C&A, Amazon, Hugo Boss, Guess, Mustang and
Uniqlo. ILP in total has the capacity to produce 700 million pairs of socks and tights
annually. The company is in process of expanding its capacity to 6,500 knitting machines
across Pakistan and Sri Lanka. This unit contributes 80% to the total sales revenue of the
company.
Annual installed capacity of this segment is 60.7m Dozens (DZNs of Pairs). During FY21,
utilization level stood at 85% vis-à-vis 70% in FY20. The utilization level in FY21 increased
VIS Credit Rating Company Limited www.vis.com.pk
3
of Interloop Welfare Trust. Mr. Navid is
an Electrical engineer and holds a
Master’s Degree in Industrial
Management from University of Oxford, UK.
to meet the increasing demand post relaxation in COVID-19 lockdown measures across the
world. Capacity utilization continued to remain above 80% during HY22. As per company’s
Vision 2025, the management plans to install Plant 6 of hosiery by FY24 projected to cost
around $ 60m which will be financed in a debt: equity mix of 40:60. The plant will comprise
1,400 additional machines raising installed capacity to 72-74m Dozens (DZNs of Pairs) post
expansion.
Yarn:
Spinning – ILP produces over 26 million kgs of yarn annually for various textile
customers. Multiple varieties of yarn produced include: Plain, Slub, Multi Count,
Slub Lycra Core, Lycra Core, Polyamide Core, Siro, etc. Out of the total yarn
produced, approximately 40% is consumed in-house, while the remaining is sold to
weavers, knitters, and denim and towel producers.
Yarn Dyeing & Air Covering – With 4 million kgs annual dyeing capacity, ILP
provides a wide variety of colors in yarn including Polyester, Nylon, Acrylic,
Coolmax, Modal, Tencel, Viscose, Wool, Bamboo, Blended, Microfibers, and
Recycled Yarns.
Capacity utilization for both yarn and yarn dyeing increased to 84% (FY20: 77%) and 83%
(FY20: 70%) during FY21. The increase was an outcome of recovery in global markets.
Capacity utilization was reported higher at 85% for the same during HY22. Spinning
segment contributed 9% in the total sales revenue during FY21. As a part of Vision 2025,
around $ 70m has been targeted for expansion in the yarn division financed in a 40:60 ratio
of debt to equity. As per the plan, ILP aims to add in-house dyeing capacity of 20 MT spun
cotton yarns per day, going forward.
Denim: In December 2019, ILP established Denim Apparel manufacturing plant with
production capacity of 500,000 pieces per month (6m pieces per annum). Product line
encompasses bottoms, shorts, skirts, jackets, work wear cargos to brands and retailers
including Diesel, Guess, Hugo Boss, Mustang, ALDI, NYDJ, INDITEX. The contribution
of denim in sales revenue of the company is around 7% (FY20: 3%) in FY21.
The Capacity utilization of this division was reported at 56% in FY21 as this unit was
established in December 2019. Capacity utilization was reported higher at 59% during
HY22. The management aims to double the production capacity to 1m pieces per month
(12m pieces per annum) by FY26 as a part of its Vision 2025 plan. Estimated cost of the
project is around $ 40m which will be financed through debt: equity mix of 40: 60.
Apparel: In 2019, ILP established IL Apparel (a wholly owned subsidiary), which handled
the knitwear business of the company. However, IL Apparel has been amalgamated with
and into Interloop with effect from January 31, 2021. The stitching plant has the production
capacity of 1.5 million garments per month (18m garments per year). Product portfolio
includes a combination of t-shirts, polos, sweatshirts and fleece jackets catering to brands
in USA, UK, and EU including Target, Tom Tailor, Carhartt, Ben Sherman, Katin, Russel
VIS Credit Rating Company Limited www.vis.com.pk
4
Athletic, Penfield Original, Penguin, Elle, and Juicy Couture. Apparel segment contributed
around 2% in the total sales revenue during FY21.
Going forward, the management plans to establish a complete vertically integrated (fabric
production to cut & sew) garment manufacturing complex with 175 knitting machines and
42 tons’ of knitting/dyeing capacity per day, producing over 2.0 m garments per month by
1HFY23. The total cost of the expansion is estimated at $ 100m. The investment will be
funded 40% by debt resources and the remaining through internal cash generation and
equity injection.
Seamless Active Wear: In 2018, the company set up seamless active wear manufacturing
unit at Interloop Industrial Park in Faisalabad. Current production capacity of this segment
is 345,000 pieces per month. The product range includes active & performance wear, base
layers, seamless innerwear and shape wears for both men & women. As a part of Vision
2025, $40m is targeted for expansion in the active wear segment which will be financed in a
debt to equity ratio of 40:60.
ILP previously had a 31.61% equity stake in IL Bangla Limited (Associate) which is a private
limited company engaged in the business of manufacturing and sales/export of socks and
hosieries. At end-June’21, the investment has been sold as per the BoD’s decision in
December 2020.
Rating Drivers
Recovery in industry wide exports post ease in COVID-19 lockdown measures
support business risk profile of the company.
Subsequent to posting export contraction in FY20 - owing to the pandemic-
induced slowdown experienced in H2’FY20 – Pakistan’s export base grew by 14%
in FY21, which is partly attributable to a low base effect. Pakistan’s export proceeds
have oscillated in the range of USD 22-25b during the past decade (FY11-FY21).
Therefore, the uptick is largely aligned with historical numbers and is not
considered material.
Share of textile exports in total exports has oscillated in the range of 54-59%,
coming in at 57% during the past 2-years (FY20-21). In FY21, owing to the similar
low-base effect, as discussed above, textile exports were up 13%.
In USD’ terms textile exports have grown at a CAGR of 4.4% during the past 3-
year period (FY19-FY21), despite depreciation in average USD/PKR parity of
24%, 16%, and 1% in FY19, FY20 and FY21 respectively.
In the textile sector, the highest exports were of Knitwear segment with a growth
of 37% on a YoY basis. The Knitwear exports were $ 3.83 billion in FY21
compared to $ 2.80 billion in FY20. Whereas, Exports of Bed Wear and Readymade
Garment’s segments had substantial growth by 29% YoY and 19% YoY,
respectively.
VIS Credit Rating Company Limited www.vis.com.pk
5
Textile exports in Q1’FY22 were 37% higher than SPLY. Inclusive of textile
exports for Oct’2021, the number for 4M’FY22 textile exports came in at USD 6b.
With additional capacities coming online in January 2022, textile exports for FY22
are likely to exceed the annualized figure of USD 18b.
The composition of textile exports has depicted improvement in the last 4-yar
period, with contribution from higher value added segment increasing from 72.9%
in FY18 to 80.7% in FY21 of aggregate textile exports.
Cotton production in Pakistan, on the other hand, was at its lowest level in decades
for FY21. Cotton prices rose to a new 11-year high of ~Rs. 13,000/maund as a
result of the production shortage, and cotton imports have climbed by 59.8% in
quantity and 68.1% in USD terms, for FY21 vis-à-vis preceding year.
Given favorable weather conditions, cotton production in Pakistan posted strong
growth in FY22, with cotton crop for Jul-Nov’22 (Rabi) season being 81% higher
than SPLY. Nevertheless, the upward momentum in cotton pricing continued in
FY22, with prices as of November 2022 hovering at ~Rs. 16,000 per mound.
The margins of textile operators have broadly depicted improvement despite the
uptick in raw material costs, given that the same was offset by exchange rate
movement. Nevertheless, higher raw material pricing has increased the working
capital requirements for textile operators, which is likely to weigh on the liquidity
of textile players. VIS expects the order book for the industry to remain adequate
in the ongoing year along with transfer orders of neighboring countries, easing our
business risk concerns.
ILP is the largest hosiery manufacturer in Pakistan with the next largest competitor
being ten times smaller in size in terms of production capacity. Hence, local
competition is considered limited. The ratings draw comfort from more than 60%
market share of ILP within hosiery exports of Pakistan. Long term established
relationships with key customers across all business segments provide cushion to
the company in terms of partly passing on the increase in raw material prices to the
customers.
Revenue of the company has registered healthy growth in FY21 on account of
increase in average selling price, rupee devaluation and growth in volumes; similar
trend is expected to continue going forward given the healthy order book and
expansion plans
Net Sales of the company grew by 53% in FY21 (FY21: Rs. 55.0b; FY20: Rs. 36.3b) led by
a 48% increase in volumes and the remaining being a function of higher average selling price
led by rupee devaluation. Growth across all segments were noted during FY21 due to BMR
in Denim plant and Hosiery Plant 5. The merger of IL Apparel also contributed to the
growth in topline. In 9MFY22, topline was reported higher at Rs. 60.6b with further
recovery in global markets and dollar devaluation benefits. Sales mix of the company
indicates that export sales have historically constituted ~ 90% of the total topline of the
company. The company has a diversified product range; however, socks and yarn comprise
more than 90% net sales of the company.
VIS Credit Rating Company Limited www.vis.com.pk
6
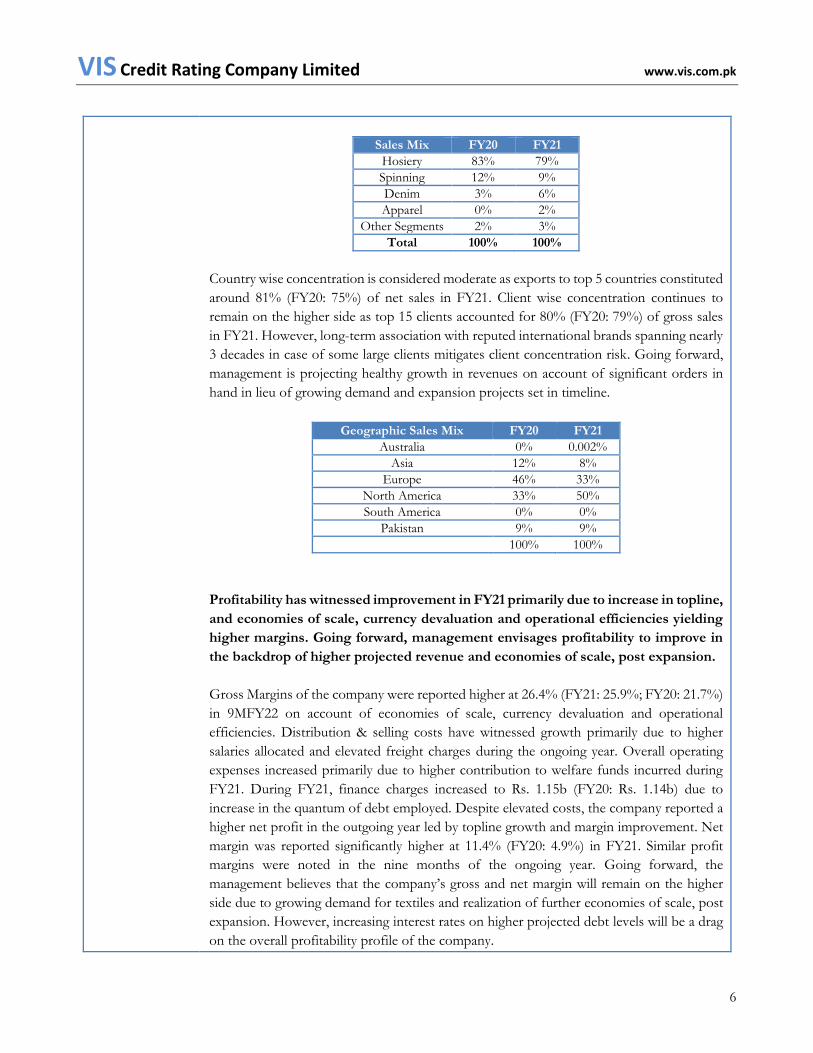
Sales Mix FY20 FY21
Hosiery 83% 79%
Spinning 12% 9%
Denim 3% 6%
Apparel 0% 2%
Other Segments 2% 3%
Total 100% 100%
Country wise concentration is considered moderate as exports to top 5 countries constituted
around 81% (FY20: 75%) of net sales in FY21. Client wise concentration continues to
remain on the higher side as top 15 clients accounted for 80% (FY20: 79%) of gross sales
in FY21. However, long-term association with reputed international brands spanning nearly
3 decades in case of some large clients mitigates client concentration risk. Going forward,
management is projecting healthy growth in revenues on account of significant orders in
hand in lieu of growing demand and expansion projects set in timeline.
Geographic Sales Mix FY20 FY21
Australia 0% 0.002%
Asia 12% 8%
Europe 46% 33%
North America 33% 50%
South America 0% 0%
Pakistan 9% 9% 100% 100%
Profitability has witnessed improvement in FY21 primarily due to increase in topline,
and economies of scale, currency devaluation and operational efficiencies yielding
higher margins. Going forward, management envisages profitability to improve in
the backdrop of higher projected revenue and economies of scale, post expansion.
Gross Margins of the company were reported higher at 26.4% (FY21: 25.9%; FY20: 21.7%)
in 9MFY22 on account of economies of scale, currency devaluation and operational
efficiencies. Distribution & selling costs have witnessed growth primarily due to higher
salaries allocated and elevated freight charges during the ongoing year. Overall operating
expenses increased primarily due to higher contribution to welfare funds incurred during
FY21. During FY21, finance charges increased to Rs. 1.15b (FY20: Rs. 1.14b) due to
increase in the quantum of debt employed. Despite elevated costs, the company reported a
higher net profit in the outgoing year led by topline growth and margin improvement. Net
margin was reported significantly higher at 11.4% (FY20: 4.9%) in FY21. Similar profit
margins were noted in the nine months of the ongoing year. Going forward, the
management believes that the company’s gross and net margin will remain on the higher
side due to growing demand for textiles and realization of further economies of scale, post
expansion. However, increasing interest rates on higher projected debt levels will be a drag
on the overall profitability profile of the company.

VIS Credit Rating Company Limited www.vis.com.pk
7
Healthy cash flow generation has resulted in strong liquidity profile. Despite
projected debt drawdown on a timeline basis, overall long-term and short-term debt
coverages are expected to remain strong.
In absolute terms, Funds from Operations (FFO) amounted to Rs. 9.6b (FY20: Rs. 4.3b)
depicting a sizeable increase on account of higher overall profitability during FY21. In line
with improvement in profitability during FY21 and 9MFY22, Debt Service Coverage Ratio
(DSCR), FFO/Long-Term Debt, and FFO/ Total Debt are considered adequate in view of
sufficient cash flows in relation to outstanding obligations, satisfactory debt servicing ability
and aging of trade debts which remain within manageable levels. Liquidity profile of the
company is supported by short-term investments to the tune of Rs. 500.0m in TFCs.
Inventory and trade debts coverage for short-term debt obligations has declined in 9MFY22
as a result of higher short term borrowings to meet working capital needs for procurement
of raw material in relation to the orders on books. Current ratio was reported at 1.2x at end-
Mar’22. Working capital cycle was extended in 9MFY22; maintaining the same and
inventory days due to bulk buying of raw material in anticipation of increasing prices will
also be important from a liquidity perspective. Trade debts aging also remains comfortable
with majority of receivables due within 60 days. In view of the aforementioned indicators,
overall liquidity profile is considered sound.
Elevated capitalization indicators to finance working capital requirements and BMR
expansion. Given additional funds planned to be drawn for further expansion in the
medium term, leverage indicators are expected to remain within manageable given
projected equity growth through funds injection and profit retention.
Equity base of the company has been increasing on a timeline basis and was reported at Rs.
24.8b (FY21: Rs. 20.5b; FY20: Rs. 17.3b) at end-Mar’22 on account of bonus shares issued
and profit retention. As per management, internal dividend payout policy was 50% in the
outgoing year. However, the same may vary due to aggressive expansion plans and greater
cashflow requirements. Quantum of total debt increased to Rs.50.4b (FY21: Rs. 30.6b;
FY20: Rs. 21.7b) at end-Mar’22 to finance working capital requirements and BMR
expansion in the Hosiery and Apparel segment. Resultantly, gearing and leverage ratios were
reported at 2.0x (FY21: 1.5x; FY20: 1.3x) and 2.6x (FY21: 2.0x; FY20: 1.6x), respectively at
end-Mar’22. Given additional funds planned to be drawn for the expansion in Hosiery,
Apparel, Denim, Yarn and Active Wear units segments in the medium term, leverage
indicators are expected to remain within manageable given projected equity growth through
funds injection and profit retention.
Sound governance and control framework
The Board of Directors (BoD) at ILP comprises seven members including two independent
directors. In line with best practices, a female director is also present on the Board. All the
Board members possess sound experience. In order to ensure effective oversight, three
committees are also present at Board level including Audit Committee, HR & Remuneration
VIS Credit Rating Company Limited www.vis.com.pk
8
Committee and Nomination Committee. Senior management team also includes seasoned
professionals. An independent internal audit function is also present which reports directly
to the Board Audit Committee. The company uses customized ERP application and Oracle
E-Business Suite Release 12 to manage its operations. ILP operates business applications
from its Production Data Center in Hosiery Plant 2 with a Disaster Recovery Data Center
in Hosiery Plant 1. Both onsite and offsite data backup is maintained. Daily backup of data
is undertaken, which is an automated process executing at set intervals.
VIS Credit Rating Company Limited www.vis.com.pk
9
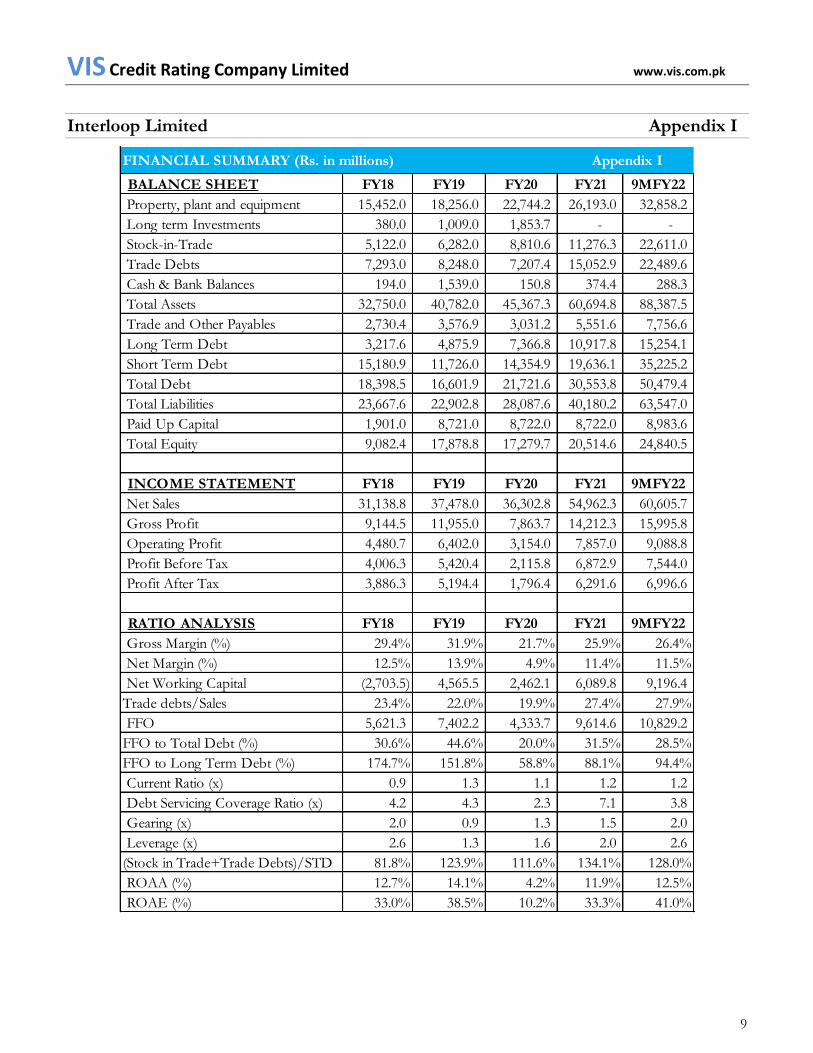
Interloop Limited Appendix I
BALANCE SHEET FY18 FY19 FY20 FY21 9MFY22
Property, plant and equipment 15,452.0 18,256.0 22,744.2 26,193.0 32,858.2
Long term Investments 380.0 1,009.0 1,853.7 - -
Stock-in-Trade 5,122.0 6,282.0 8,810.6 11,276.3 22,611.0
Trade Debts 7,293.0 8,248.0 7,207.4 15,052.9 22,489.6
Cash & Bank Balances 194.0 1,539.0 150.8 374.4 288.3
Total Assets 32,750.0 40,782.0 45,367.3 60,694.8 88,387.5
Trade and Other Payables 2,730.4 3,576.9 3,031.2 5,551.6 7,756.6
Long Term Debt 3,217.6 4,875.9 7,366.8 10,917.8 15,254.1
Short Term Debt 15,180.9 11,726.0 14,354.9 19,636.1 35,225.2
Total Debt 18,398.5 16,601.9 21,721.6 30,553.8 50,479.4
Total Liabilities 23,667.6 22,902.8 28,087.6 40,180.2 63,547.0
Paid Up Capital 1,901.0 8,721.0 8,722.0 8,722.0 8,983.6
Total Equity 9,082.4 17,878.8 17,279.7 20,514.6 24,840.5
INCOME STATEMENT FY18 FY19 FY20 FY21 9MFY22
Net Sales 31,138.8 37,478.0 36,302.8 54,962.3 60,605.7
Gross Profit 9,144.5 11,955.0 7,863.7 14,212.3 15,995.8
Operating Profit 4,480.7 6,402.0 3,154.0 7,857.0 9,088.8
Profit Before Tax 4,006.3 5,420.4 2,115.8 6,872.9 7,544.0
Profit After Tax 3,886.3 5,194.4 1,796.4 6,291.6 6,996.6
RATIO ANALYSIS FY18 FY19 FY20 FY21 9MFY22
Gross Margin (%) 29.4% 31.9% 21.7% 25.9% 26.4%
Net Margin (%) 12.5% 13.9% 4.9% 11.4% 11.5%
Net Working Capital (2,703.5) 4,565.5 2,462.1 6,089.8 9,196.4
Trade debts/Sales 23.4% 22.0% 19.9% 27.4% 27.9%
FFO 5,621.3 7,402.2 4,333.7 9,614.6 10,829.2
FFO to Total Debt (%) 30.6% 44.6% 20.0% 31.5% 28.5%
FFO to Long Term Debt (%) 174.7% 151.8% 58.8% 88.1% 94.4%
Current Ratio (x) 0.9 1.3 1.1 1.2 1.2
Debt Servicing Coverage Ratio (x) 4.2 4.3 2.3 7.1 3.8
Gearing (x) 2.0 0.9 1.3 1.5 2.0
Leverage (x) 2.6 1.3 1.6 2.0 2.6
(Stock in Trade+Trade Debts)/STD 81.8% 123.9% 111.6% 134.1% 128.0%
ROAA (%) 12.7% 14.1% 4.2% 11.9% 12.5%
ROAE (%) 33.0% 38.5% 10.2% 33.3% 41.0%
FINANCIAL SUMMARY (Rs. in millions) Appendix I
VIS Credit Rating Company Limited www.vis.com.pk
10
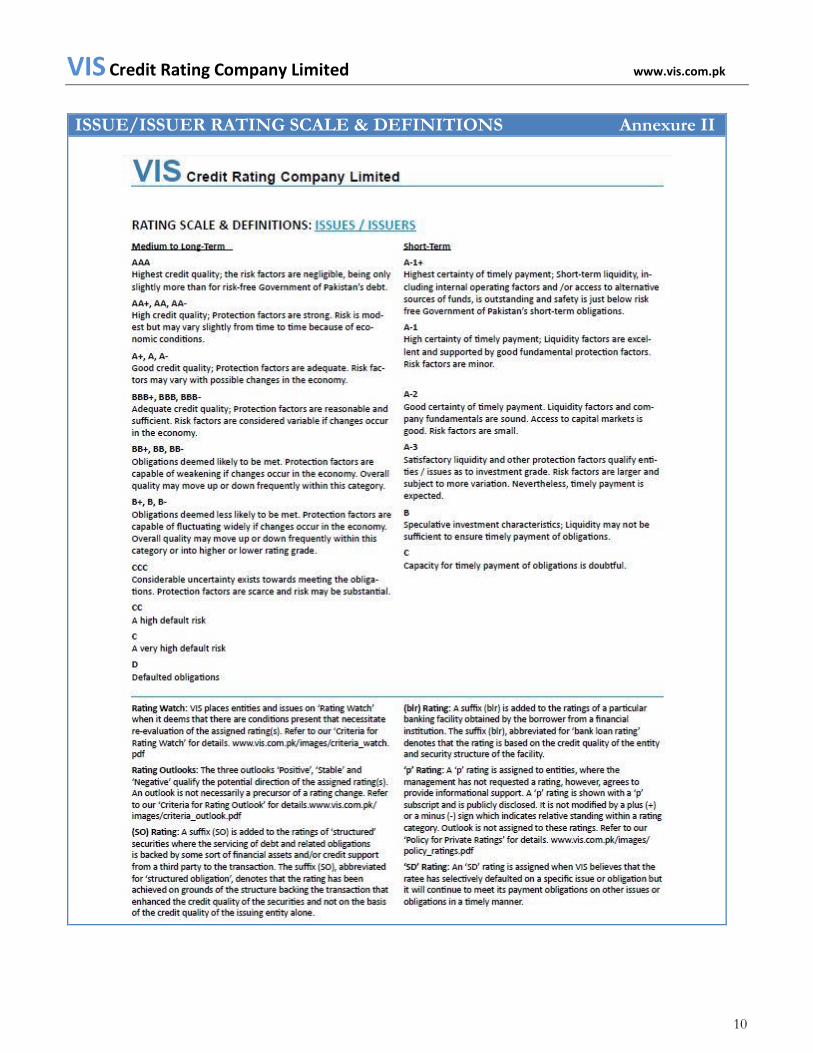
ISSUE/ISSUER RATING SCALE & DEFINITIONS Annexure II
VIS Credit Rating Company Limited www.vis.com.pk
11
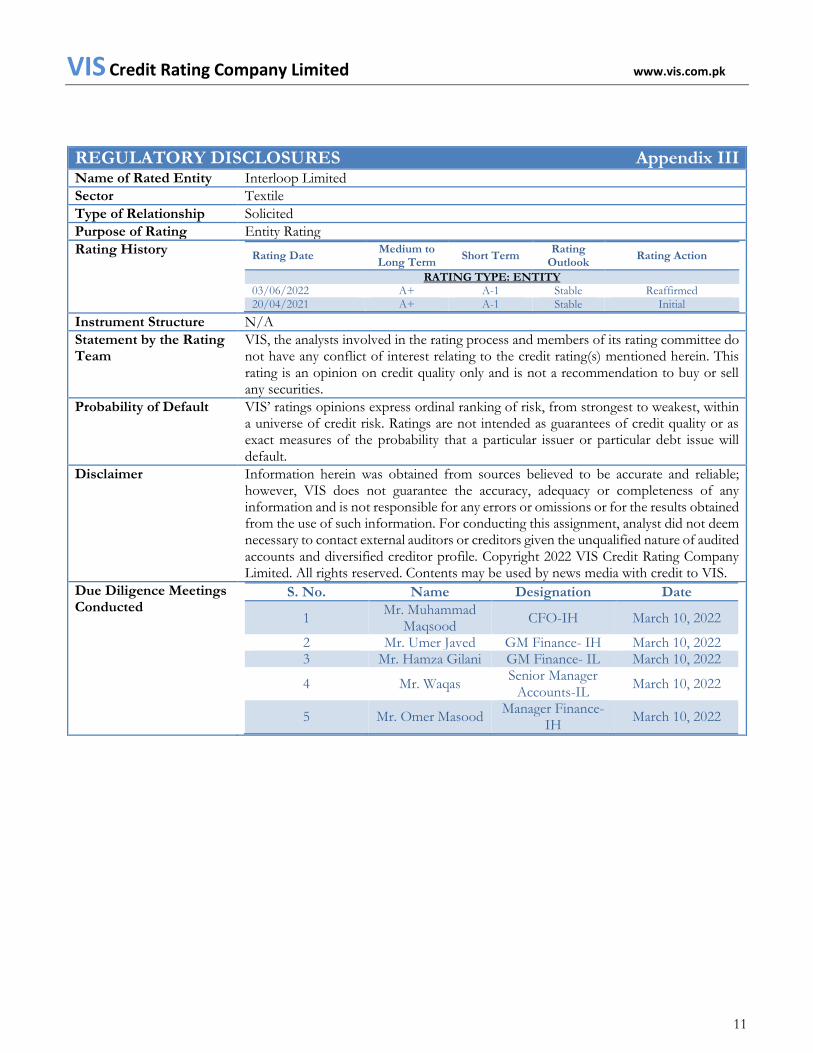
REGULATORY DISCLOSURES Appendix III
Name of Rated Entity Interloop Limited
Sector Textile
Type of Relationship Solicited
Purpose of Rating Entity Rating
Rating History Rating Date
Medium to Long Term
Short Term Rating
Outlook Rating Action
RATING TYPE: ENTITY 03/06/2022 A+ A-1 Stable Reaffirmed 20/04/2021 A+ A-1 Stable Initial
Instrument Structure N/A
Statement by the Rating Team
VIS, the analysts involved in the rating process and members of its rating committee do not have any conflict of interest relating to the credit rating(s) mentioned herein. This rating is an opinion on credit quality only and is not a recommendation to buy or sell any securities.
Probability of Default VIS’ ratings opinions express ordinal ranking of risk, from strongest to weakest, within a universe of credit risk. Ratings are not intended as guarantees of credit quality or as exact measures of the probability that a particular issuer or particular debt issue will default.
Disclaimer Information herein was obtained from sources believed to be accurate and reliable; however, VIS does not guarantee the accuracy, adequacy or completeness of any information and is not responsible for any errors or omissions or for the results obtained from the use of such information. For conducting this assignment, analyst did not deem necessary to contact external auditors or creditors given the unqualified nature of audited accounts and diversified creditor profile. Copyright 2022 VIS Credit Rating Company Limited. All rights reserved. Contents may be used by news media with credit to VIS.
Due Diligence Meetings Conducted
S. No. Name Designation Date
1 Mr. Muhammad
Maqsood CFO-IH March 10, 2022
2 Mr. Umer Javed GM Finance- IH March 10, 2022 3 Mr. Hamza Gilani GM Finance- IL March 10, 2022
4 Mr. Waqas Senior Manager
Accounts-IL March 10, 2022
5 Mr. Omer Masood Manager Finance-
IH March 10, 2022