Embed Size (px)
Citation preview

Credit Agricole CIB Auto Credit DayOctober 5, 2021

2
Further InformationFORD FIXED INCOME INVESTOR RELATIONS:
Karen Rocoff [email protected]
Kristi [email protected]
INFORMATION ON FORD:
www.shareholder.ford.com• 10-K Annual Reports• 10-Q Quarterly Reports• 8-K Current Reports
INFORMATION ON FORD MOTOR CREDIT COMPANY:
www.fordcredit.com/investor-center• 10-K Annual Reports• 10-Q Quarterly Reports• 8-K Current Reports
3
FORWARD-LOOKING STATEMENTS
This presentation includes forward-looking statements. Forward-looking statements are based on expectations, forecasts, and assumptions by our management and involve a number of risks, uncertainties, and other factors that could cause actual results to differ materially from those stated. For a discussion of these risks, uncertainties, and other factors, please see the “Cautionary Note on Forward-Looking Statements” at the end of this presentation and “Item 1A. Risk Factors” in our Annual Report on Form 10-K for the year ended December 31, 2020, as updated by subsequent Quarterly Reports on Form 10-Q and Current Reports on Form 8-K.
GAAP AND NON-GAAP FINANCIAL MEASURES
This presentation includes financial measures calculated in accordance with Generally Accepted Accounting Principles (“GAAP”) and non-GAAP financial measures. The non-GAAP financial measures are intended to be considered supplemental information to their comparable GAAP financial measures. The non-GAAP financial measures are defined and reconciled to the most comparable GAAP financial measures in the Appendix to this presentation.
ADDITIONAL INFORMATION
Calculated results may not sum due to rounding. N / M denotes “Not Meaningful.” All variances are year-over-year unless otherwise noted.
REPORTING CHANGES
Effective with 2021 reporting, certain costs for the benefit of the global enterprise previously reported in Automotive are now reported in Corporate Other, and costs and benefits related to connectivity previously reported in Mobility are now reported in Automotive. Prior period results have been updated to be consistent with 2021 reporting. For details, see Slides A12 - A14 of the Ford Motor Company Q4 & Full Year 2020 Earnings Presentation.
In addition, consistent with our adoption of ASU 2019-12 as of January 1, 2021, we no longer allocate a portion of our consolidated U.S. current and deferred tax expense to certain U.S. subsidiaries. As a result, Ford Credit’s income tax expense is reduced, and since this ASU was adopted on a retrospective basis, $875M of tax sharing payments from Ford Credit to Ford Motor Company in 2020 are now reclassified as distributions from Ford Credit and included in Adjusted Free Cash Flow.
Information Regarding This Presentation

Corporate
5
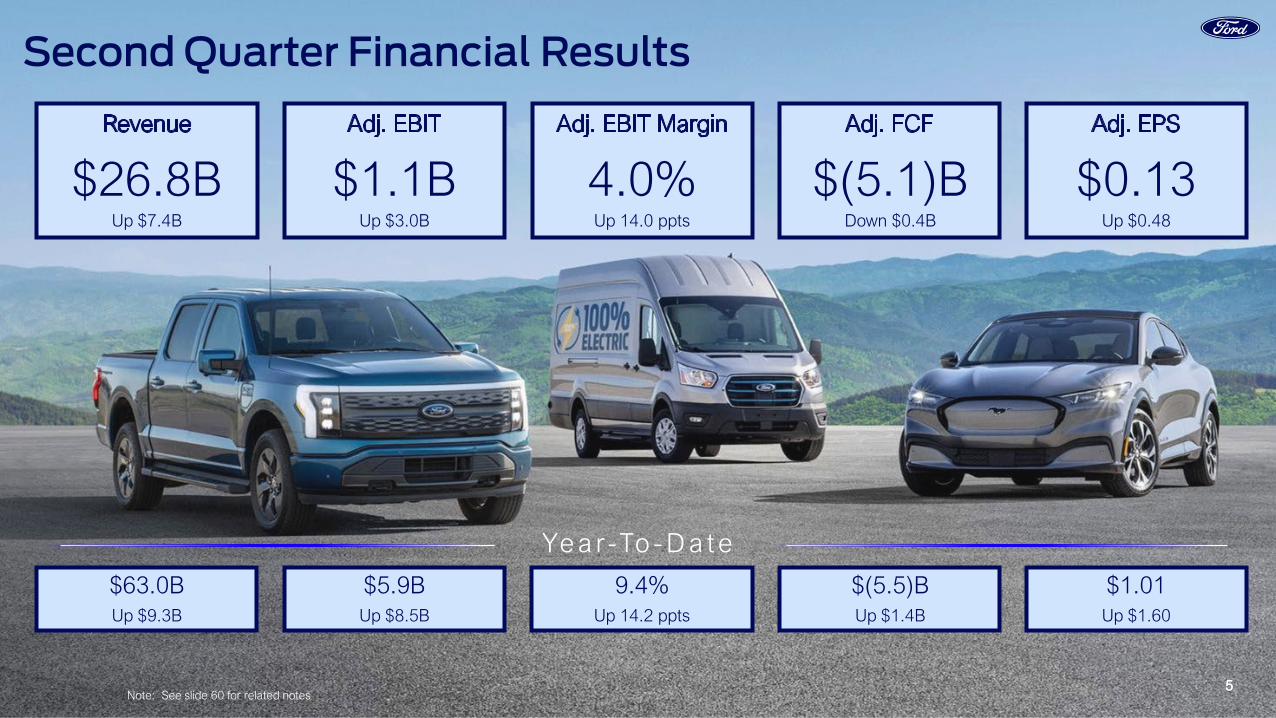
Second Quarter Financial Results
55
Ye a r-To - D a t e
$(5.1)BDown $0.4B
$26.8BUp $7.4B
$1.1BUp $3.0B
4.0%Up 14.0 ppts
$0.13Up $0.48
$1.01Up $1.60
$(5.5)B$63.0B $5.9B 9.4%Up $1.4BUp 14.2 pptsUp $8.5BUp $9.3B
Note: See slide 60 for related notes
6
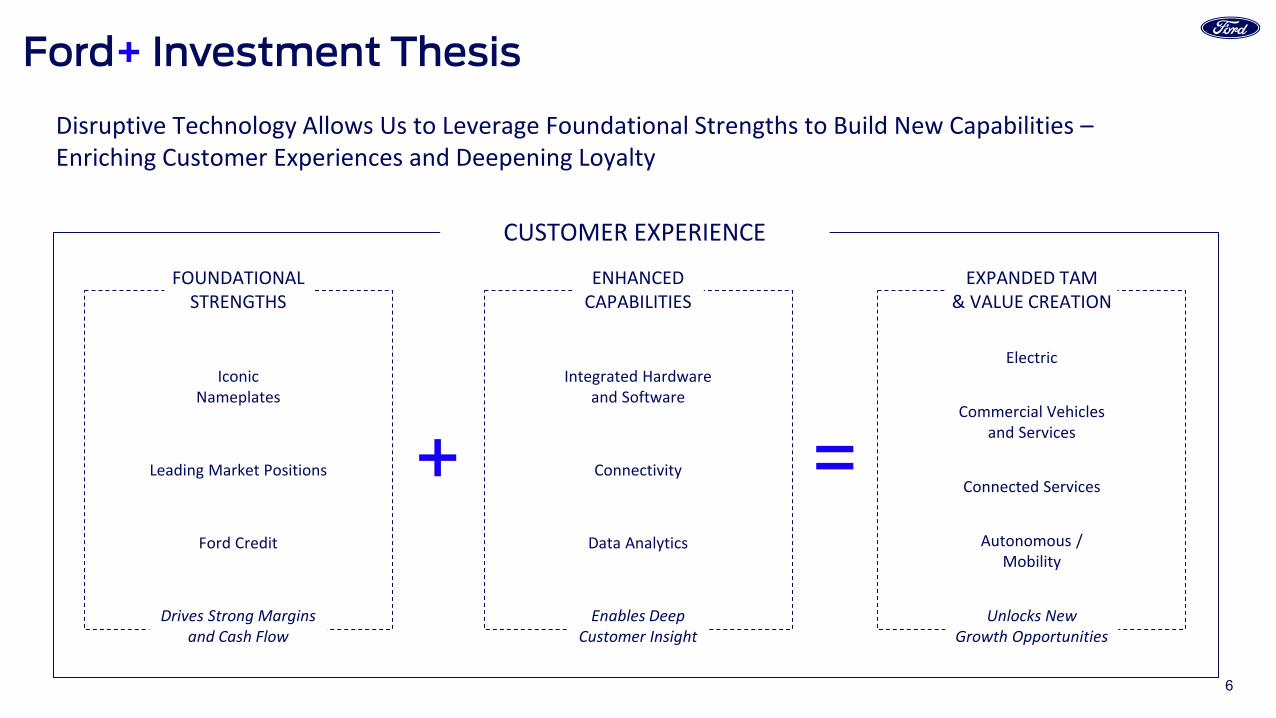
Disruptive Technology Allows Us to Leverage Foundational Strengths to Build New Capabilities –Enriching Customer Experiences and Deepening Loyalty
IconicNameplates
Leading Market Positions
Ford Credit
Connected Services
Autonomous /Mobility
Electric
Commercial Vehiclesand Services
Integrated Hardware and Software
Connectivity
Data Analytics
+ =
Ford+ Investment Thesis
CUSTOMER EXPERIENCE
FOUNDATIONAL STRENGTHS
Drives Strong Margins and Cash Flow
ENHANCED CAPABILITIES
Enables Deep Customer Insight
EXPANDED TAM & VALUE CREATION
Unlocks New Growth Opportunities
7
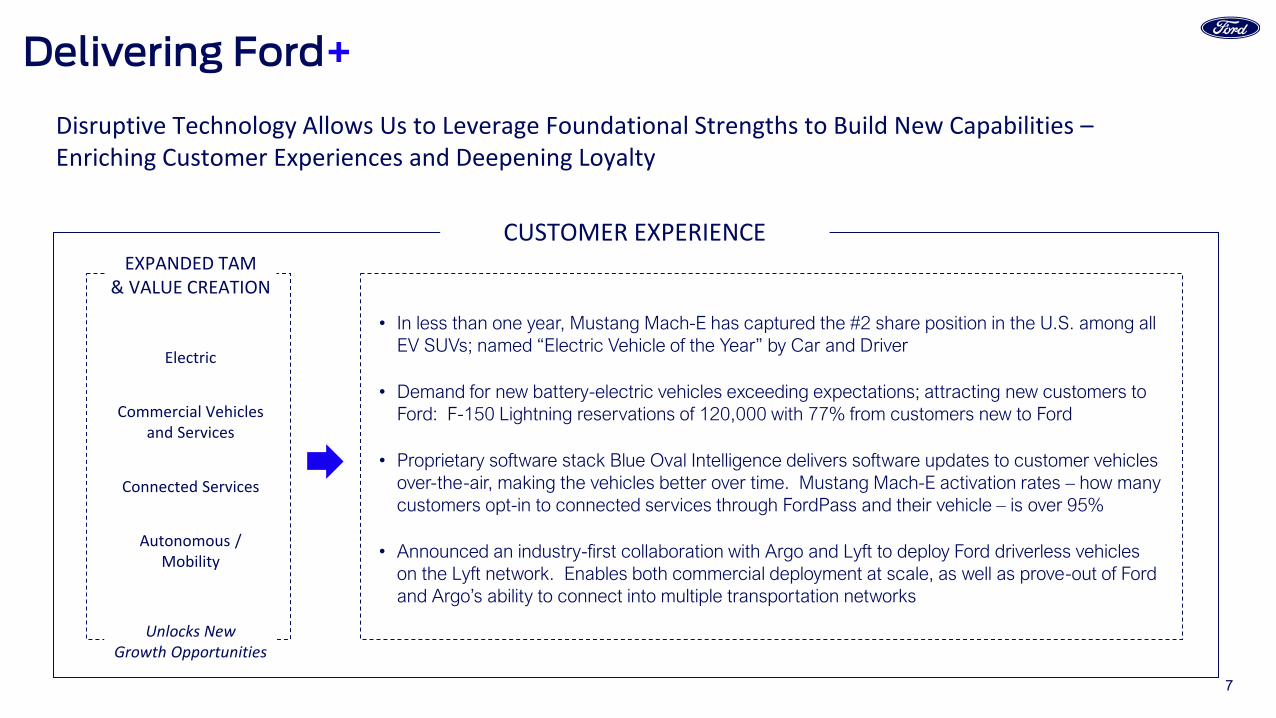
Delivering Ford+
CUSTOMER EXPERIENCE
Disruptive Technology Allows Us to Leverage Foundational Strengths to Build New Capabilities –Enriching Customer Experiences and Deepening Loyalty
• In less than one year, Mustang Mach-E has captured the #2 share position in the U.S. among all EV SUVs; named “Electric Vehicle of the Year” by Car and Driver
• Demand for new battery-electric vehicles exceeding expectations; attracting new customers to Ford: F-150 Lightning reservations of 120,000 with 77% from customers new to Ford
• Proprietary software stack Blue Oval Intelligence delivers software updates to customer vehicles over-the-air, making the vehicles better over time. Mustang Mach-E activation rates – how many customers opt-in to connected services through FordPass and their vehicle – is over 95%
• Announced an industry-first collaboration with Argo and Lyft to deploy Ford driverless vehicles on the Lyft network. Enables both commercial deployment at scale, as well as prove-out of Ford and Argo’s ability to connect into multiple transportation networks
Disruptive Technology Allows Us to Leverage Foundational Strengths to Build New Capabilities –Enriching Customer Experiences and Deepening Loyalty
Connected Services
Autonomous /Mobility
Electric
Commercial Vehiclesand Services
EXPANDED TAM & VALUE CREATION
Unlocks New Growth Opportunities
8
$(0.6)
$(1.9)
$3.6
$1.7
$4.8
$1.1
Q1 Q2 Q3 Q4 Q1 Q2
$34.3
$19.4
$37.5 $36.0 $36.2
$26.8
1,126
645
1,1781,238
1,062
764
Q1 Q2 Q3 Q4 Q1 Q2
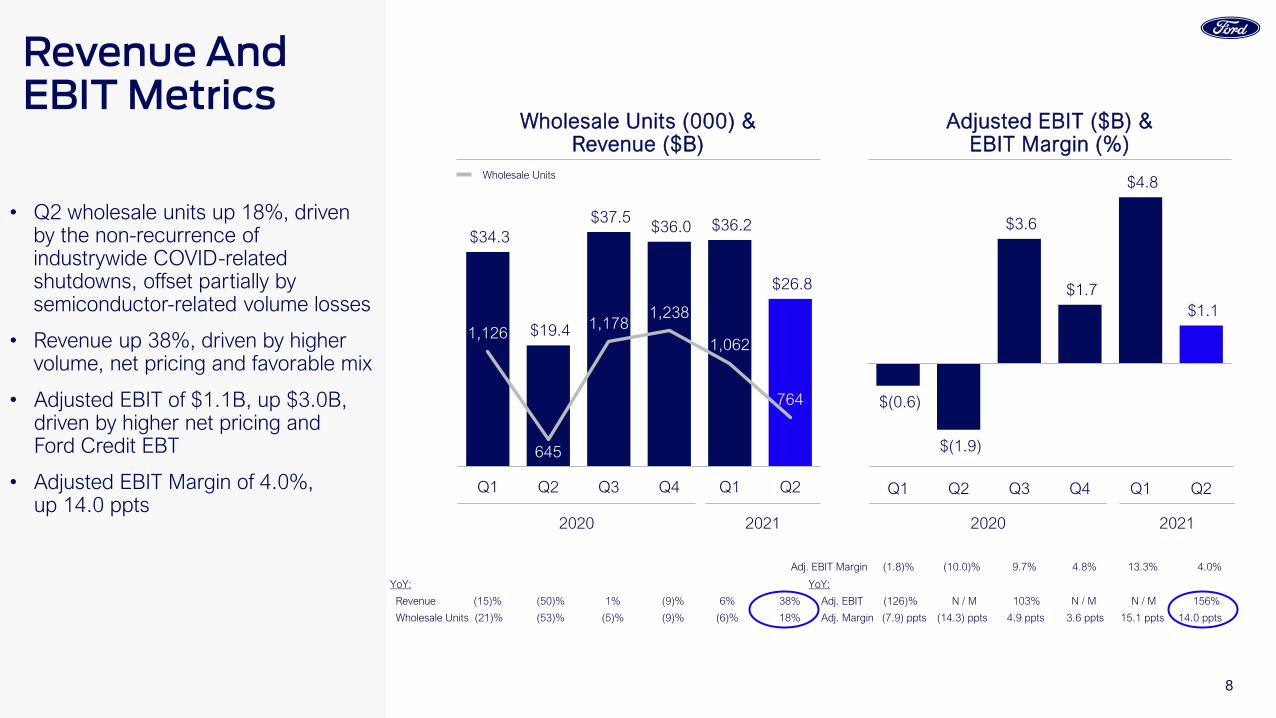
• Q2 wholesale units up 18%, driven by the non-recurrence of industrywide COVID-related shutdowns, offset partially by semiconductor-related volume losses
• Revenue up 38%, driven by higher volume, net pricing and favorable mix
• Adjusted EBIT of $1.1B, up $3.0B, driven by higher net pricing and Ford Credit EBT
• Adjusted EBIT Margin of 4.0%, up 14.0 ppts
Revenue And EBIT Metrics
Wholesale Units
YoY: YoY:
Revenue (15)% (50)% 1% (9)% 6% 38% Adj. EBIT (126)% N / M 103% N / M N / M 156%
Wholesale Units (21)% (53)% (5)% (9)% (6)% 18% Adj. Margin (7.9) ppts (14.3) ppts 4.9 ppts 3.6 ppts 15.1 ppts 14.0 ppts
Adj. EBIT Margin (1.8)% (10.0)% 9.7% 4.8% 13.3% 4.0%
Wholesale Units (000) &Revenue ($B)
Adjusted EBIT ($B) &EBIT Margin (%)
2020 2021 2020 2021

9
$(2.2)
$(4.8)
$6.6
$1.9
$(0.4)
$(5.1)
Q1 Q2 Q3 Q4 Q1 Q2
$34.3
$39.3
$29.5 $30.8 $31.3
$25.1
$35.1
$39.8
$45.5 $46.9 $47.2
$41.0
Q1 Q2 Q3 Q4 Q1 Q2
• Q2 Adjusted FCF of $(5.1)B driven by:‒ Expected adverse working capital
and timing differences due to semiconductor-related volume losses
‒ Offset partially by higher Ford Credit distributions
• Ended Q2 with a cash balance of $25.1B and ample liquidity of $41.0B
Cash Flow, Cash Balance And Liquidity ($B) Adjusted Free Cash Flow Cash Balance & Liquidity
Liquidity
2020 2021 2020 2021
10
$(0.1) $(0.2)
$1.6
$(0.3)
$1.1
$(0.5)
$0.1
$(0.2)
$0.6
Automotive Net Income / (Loss)
Ford CreditMobility CorporateOther
Company Adj. EBIT
Interest On Debt
SpecialItems
Taxes /Non-Controlling
Interests
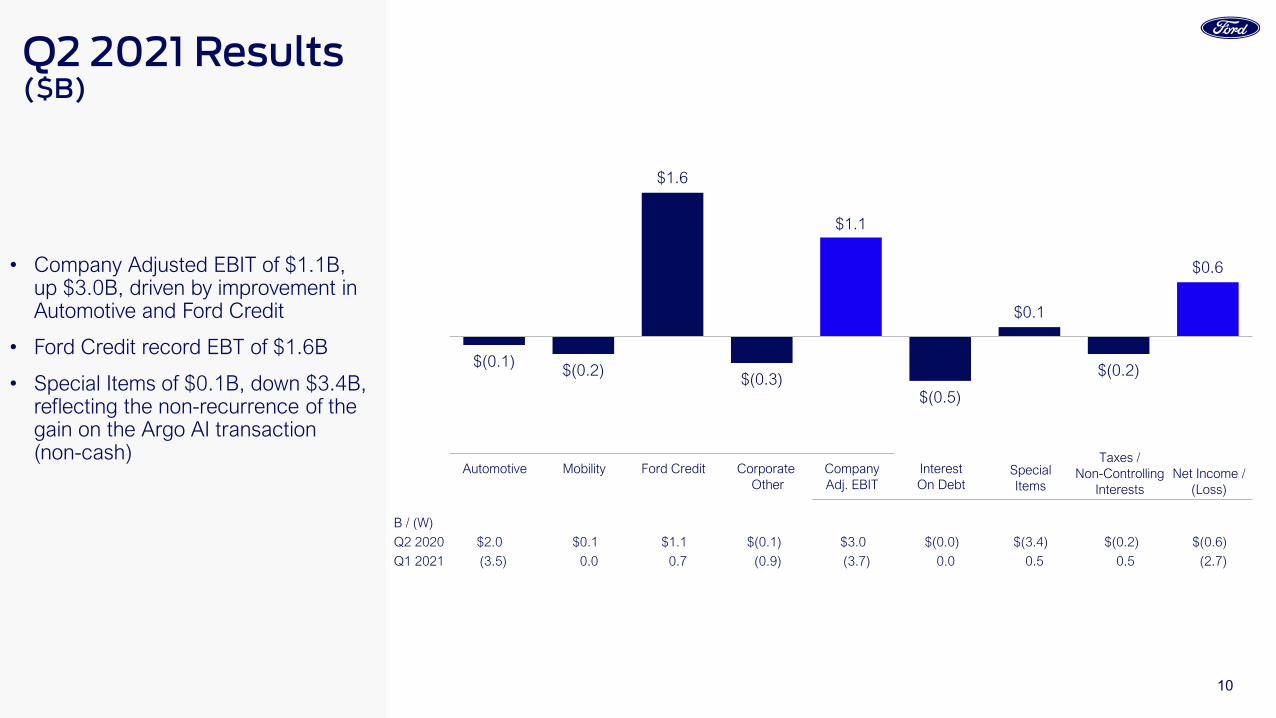
B / (W)
Q2 2020 $2.0 $0.1 $1.1 $(0.1) $3.0 $(0.0) $(3.4) $(0.2) $(0.6)
Q1 2021 (3.5) 0.0 0.7 (0.9) (3.7) 0.0 0.5 0.5 (2.7)
• Company Adjusted EBIT of $1.1B, up $3.0B, driven by improvement in Automotive and Ford Credit
• Ford Credit record EBT of $1.6B
• Special Items of $0.1B, down $3.4B, reflecting the non-recurrence of the gain on the Argo AI transaction (non-cash)
Q2 2021 Results ($B)
11
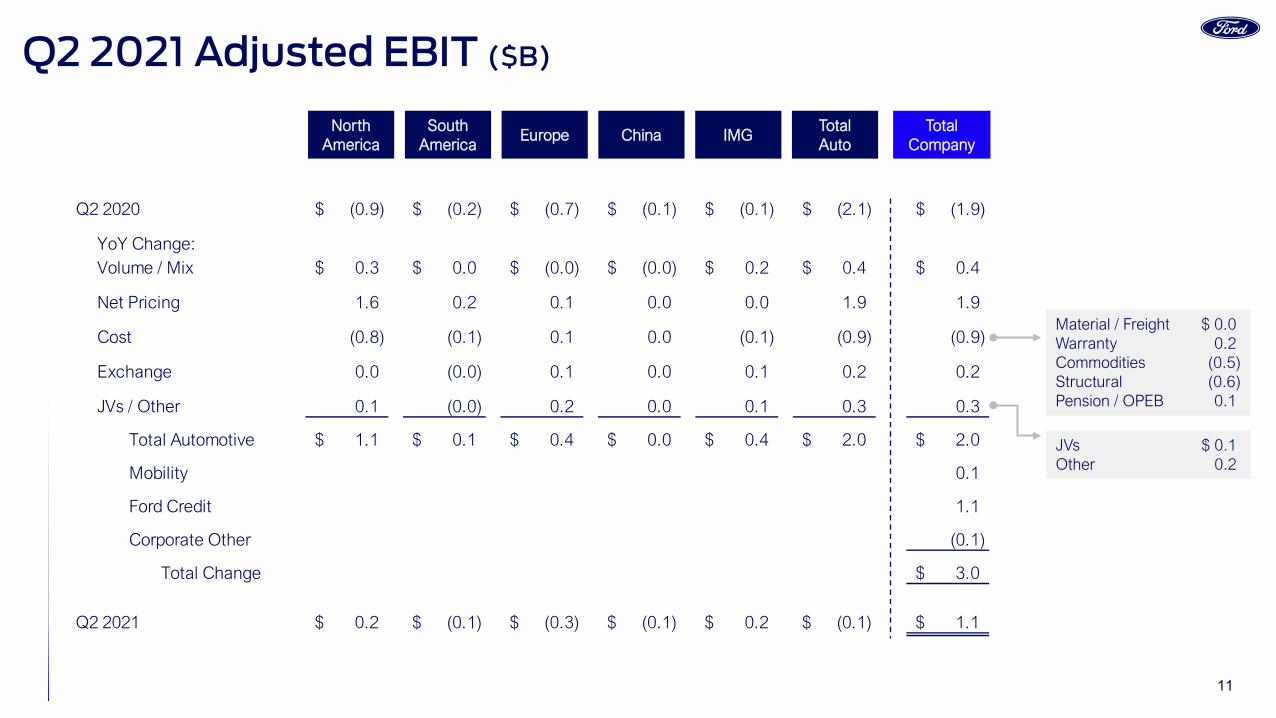
Q2 2020 (0.9)$ (0.2)$ (0.7)$ (0.1)$ (0.1)$ (2.1)$ (1.9)$
YoY Change:Volume / Mix 0.3$ 0.0$ (0.0)$ (0.0)$ 0.2$ 0.4$ 0.4$
Net Pricing 1.6 0.2 0.1 0.0 0.0 1.9 1.9
Cost (0.8) (0.1) 0.1 0.0 (0.1) (0.9) (0.9)
Exchange 0.0 (0.0) 0.1 0.0 0.1 0.2 0.2
JVs / Other 0.1 (0.0) 0.2 0.0 0.1 0.3 0.3
Total Automotive 1.1$ 0.1$ 0.4$ 0.0$ 0.4$ 2.0$ 2.0$
Mobility 0.1
Ford Credit 1.1
Corporate Other (0.1)
Total Change 3.0$
Q2 2021 0.2$ (0.1)$ (0.3)$ (0.1)$ 0.2$ (0.1)$ 1.1$
NorthAmerica
SouthAmerica
Europe China IMGTotalAuto
TotalCompany
JVs $ 0.1Other 0.2
Material / Freight $ 0.0Warranty 0.2Commodities (0.5)Structural (0.6)Pension / OPEB 0.1
Q2 2021 Adjusted EBIT ($B)
12
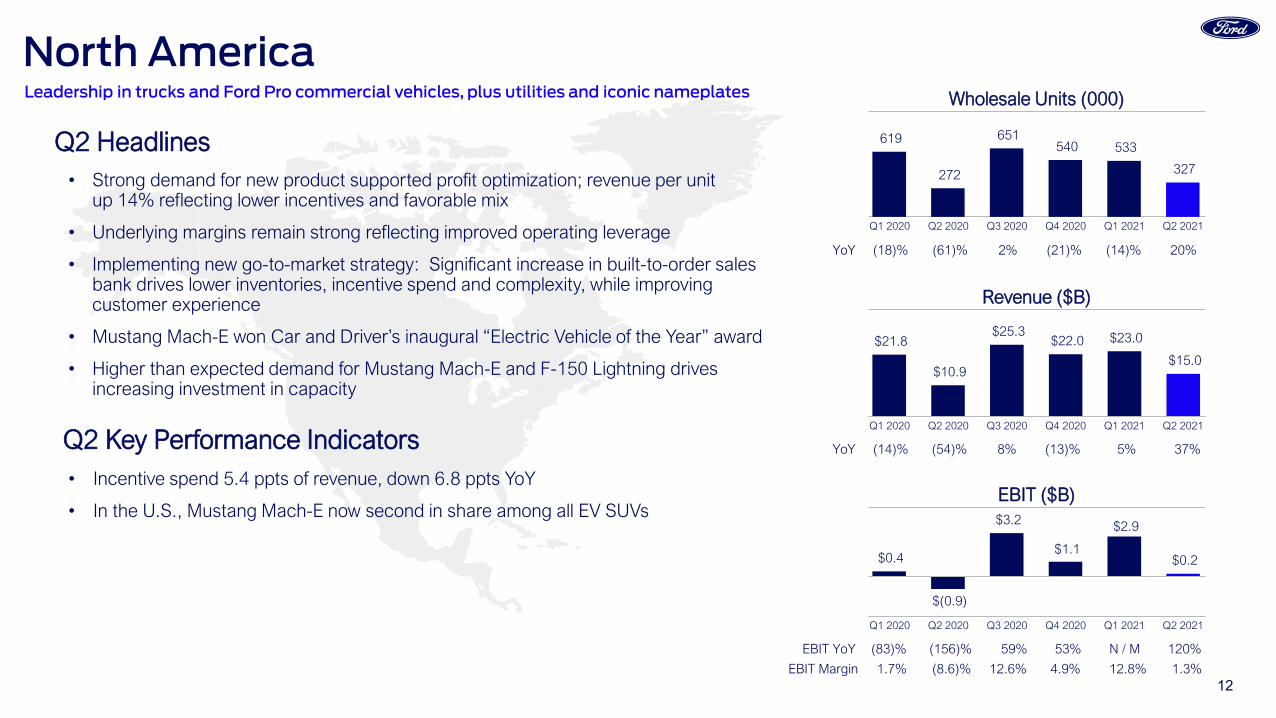
Q2 Headlines
Q1 2020 Q4 2020Q2 2020 Q3 2020 Q1 2021 Q2 2021
Q1 2020 Q4 2020Q2 2020 Q3 2020 Q1 2021 Q2 2021
Q1 2020 Q4 2020Q2 2020 Q3 2020 Q1 2021 Q2 2021
Wholesale Units (000)
Revenue ($B)
EBIT ($B)
$0.4
$(0.9)
$3.2
$1.1
$2.9
$0.2
$21.8
$10.9
$25.3 $22.0 $23.0
$15.0
YoY (14)% (54)% 8% (13)% 5% 37%
EBIT YoY (83)% (156)% 59% 53% N / M 120%
EBIT Margin 1.7% (8.6)% 12.6% 4.9% 12.8% 1.3%
619
272
651 540 533
327
YoY (18)% (61)% 2% (21)% (14)% 20%
North America
• Strong demand for new product supported profit optimization; revenue per unit up 14% reflecting lower incentives and favorable mix
• Underlying margins remain strong reflecting improved operating leverage
• Implementing new go-to-market strategy: Significant increase in built-to-order sales bank drives lower inventories, incentive spend and complexity, while improving customer experience
• Mustang Mach-E won Car and Driver’s inaugural “Electric Vehicle of the Year” award
• Higher than expected demand for Mustang Mach-E and F-150 Lightning drives increasing investment in capacity
Q2 Key Performance Indicators• Incentive spend 5.4 ppts of revenue, down 6.8 ppts YoY
• In the U.S., Mustang Mach-E now second in share among all EV SUVs
Leadership in trucks and Ford Pro commercial vehicles, plus utilities and iconic nameplates
13
Q2 Headlines
Q1 2020 Q4 2020Q2 2020 Q3 2020 Q1 2021 Q2 2021
Q1 2020 Q4 2020Q2 2020 Q3 2020 Q1 2021 Q2 2021
Q1 2020 Q4 2020Q2 2020 Q3 2020 Q1 2021 Q2 2021
Wholesale Units (000)
Revenue ($B)
EBIT ($B)
$(0.1)
$(0.2)
$(0.1) $(0.1)$(0.1) $(0.1)
$0.7
$0.2
$0.6 $0.9
$0.4 $0.5
59
14
48 63
18 18
South America
• Restructuring on track
• Seventh consecutive quarter of YoY EBIT improvement
• Preparation for Transit van launch underway. Introduced Bronco Sport and Mustang Mach 1 to select markets
• Launched new vehicle subscription model in Brazil – “Ford Go” to attract new customers to Ford
YoY (21)% (75)% (39)% (10)% (40)% 124%
YoY (13)% (81)% (39)% (15)% (70)% 25%
• Ranger segment share down from 19.6% to 12.4%, reflecting manufacturing shutdown in preparation for new model launch
• Structural costs down 13% YoY, continue addressing legacy cost
• Headcount down 39% YoY
EBIT YoY 28% 19% 34% 40% 35% 48%
EBIT Margin (15.4)% (68.1)% (17.0)% (12.2)% (16.7)% (15.9)%
Lean, de-risked and asset-light business, focused on key franchises like Ranger and Transit
Q2 Key Performance Indicators
14
Q2 Headlines
Q1 2020 Q4 2020Q2 2020 Q3 2020 Q1 2021 Q2 2021
Q1 2020 Q4 2020Q2 2020 Q3 2020 Q1 2021 Q2 2021
Q1 2020 Q4 2020Q2 2020 Q3 2020 Q1 2021 Q2 2021
Wholesale Units (000)
Revenue ($B)
EBIT ($B)
$(0.1)
$(0.7)$(0.4)
$0.4 $0.3
$(0.3)
$6.2
$3.6
$5.7 $7.1 $7.1
$5.6
288
154 239
339 278
182
Europe
• EBIT up $0.4B driven by improved mix of utilities, commercial vehicles and cost reductions
• Underlying run-rate of the business improved and strengthening
• Continued commercial vehicle brand leadership; launch preparations for E-Transit in Spring 2022 underway. Announced new all-electric light commercial vehicle from Romania, one of our low-cost manufacturing sources in Europe
• Mustang Mach-E retailed 7K year-to-date with 80% of customers new to Ford; Kuga PHEV best-selling PHEV in Europe
* Includes Ford brand vehicles produced and sold by our unconsolidated affiliate in Turkey(about 9K units in Q2 2020 and 13K units in Q2 2021). Revenue does not include these sales
YoY (16)% (51)% (10)% 1% 13% 55%
YoY (25)% (58)% (20)% (1)% (4)% 18%
• EU20 commercial vehicle share 13.8%; utility mix 37%, up 12 ppts
• Net pricing up $0.1B; cost lower $0.1B including improvements in warranty expense
• Western Europe personnel further reduced by 1K from Q1 2021
EBIT YoY N / M N / M N / M N / M N / M 57%
EBIT Margin (2.4)% (18.5)% (7.8)% 5.8% 4.8% (5.1)%
Wholesale Units* (000)Commercial vehicle strength with Ford Pro, focused passenger portfolio with key imports
Q2 Key Performance Indicators
15
Q2 Headlines
Q1 2020 Q4 2020Q2 2020 Q3 2020 Q1 2021 Q2 2021
Q1 2020 Q4 2020Q2 2020 Q3 2020 Q1 2021 Q2 2021
Q1 2020 Q4 2020Q2 2020 Q3 2020 Q1 2021 Q2 2021
Wholesale Units (000)
Revenue ($B)
EBIT ($B)
Total
China YoY (29)% 34% 22% 27% 85% (11)%
$(0.2)
$(0.1)
$(0.1) $(0.1) $(0.0)
$(0.1)
$0.6 $0.8
$1.0 $0.8 $0.8
$0.6
China
• Fifth consecutive quarter of YoY EBIT improvement, driven by strength of localized Lincoln, improved mix of Ford utilities and commercial vehicles
• Lincoln profitable with best-ever quarterly retail sales; Lincoln captures #1 in J.D. Power’s 2021 China Sales Satisfaction Index Study from 11-year incumbent
• Commercial vehicle sales continue to grow, now 52% of Ford’s total China sales with strength in light truck, van and bus, and pickup segments
• Preparations underway for launch of localized Mustang Mach-E
• Connectivity: “Always On” with Lincoln digital One ID, an interactive tool for customers to effortlessly access comprehensive digital brand touchpoints, plus 100% uptime for commercial customers with Transit Pro
YoY (31)% (12)% 15% (17)% 39% (31)%
81
169 164 202
150 150
72
156 146 190
140 149
JV Volume
• Total China market share 2.3%; total utility mix 33%, up 7 ppts
• Dealer network profitability remains positive
• 97% of Lincolns produced locally, up 41 ppts
EBIT YoY (91)% 11% 79% 68% 94% 9%
EBIT Margin (40.6)% (16.9)% (5.7)% (8.2)% (1.8)% (22.3)%
Ford Equity Income / (Loss) $(0.1) $0.0 $0.1 $0.1 $0.0 $0.0
Wholesale Units* (000)Focused on strength in Lincoln brand, commercial vehicles and Ford utility portfolio
* Wholesale units includes Ford brand and Jiangling Motors Corporation (JMC) brand vehicles produced and sold in China by our unconsolidated affiliates. Revenue does not include these sales. From Q2 2021, JV volume includes Lio Ho Group’s Taiwan produced Ford brand vehicles
Q2 Key Performance Indicators
16
Q2 Headlines
Q1 2020 Q4 2020Q2 2020 Q3 2020 Q1 2021 Q2 2021
Q1 2020 Q4 2020Q2 2020 Q3 2020 Q1 2021 Q2 2021
Q1 2020 Q4 2020Q2 2020 Q3 2020 Q1 2021 Q2 2021
Wholesale Units (000)
Revenue ($B)
EBIT ($B)
$(0.0)$(0.1)
$0.1
$(0.1)
$0.2 $0.2
$2.0
$1.0
$2.0 $2.5
$2.3 $2.5
78
36
76 93
82 87
International Markets Group
• Accelerating IMG’s transformation by focusing on key markets driving record quarterly EBIT, up $0.4B
• Capitalizing on our strengths with Ranger / Everest – momentum delivering overall IMG share of 1.8%, up 0.2 ppts
• Improving brand health metrics delivering net pricing and mix
• Introducing new Ford Guest sales and service quality standards and concierge program across the region to improve customer experience
• Launched the new Mustang Mach 1 in South Africa and Australia
• Continue to assess our business in India; more to say later in the year
* Includes Ford brand vehicles produced and sold by our unconsolidated affiliate in Russia(about 2K units in Q2 2020 and 5K units in Q2 2021). Revenue does not include these sales
YoY (25)% (60)% (11)% 5% 15% 141%
YoY (27)% (64)% (18)% (5)% 5% 138%
• Total share 1.8%, up 0.2 ppts
• Ranger total segment share 15.4%, up 2.3 ppts
• Everest total segment share 16.7%, up 2.9 ppts
• Net pricing and mix up $63M
EBIT YoY N / M (115)% 181% 64% N / M N / M
EBIT Margin (1.3)% (14.6)% 3.6% (2.4)% 8.9% 8.3%
Wholesale Units* (000)Portfolio strengths of Ranger pickup truck and Everest
Q2 Key Performance Indicators
17
Q1 2020 Q4 2020Q2 2020 Q3 2020 Q1 2021 Q2 2021
EBIT ($B)
Q2 Headlines
Q2 EBIT YoY ($B)
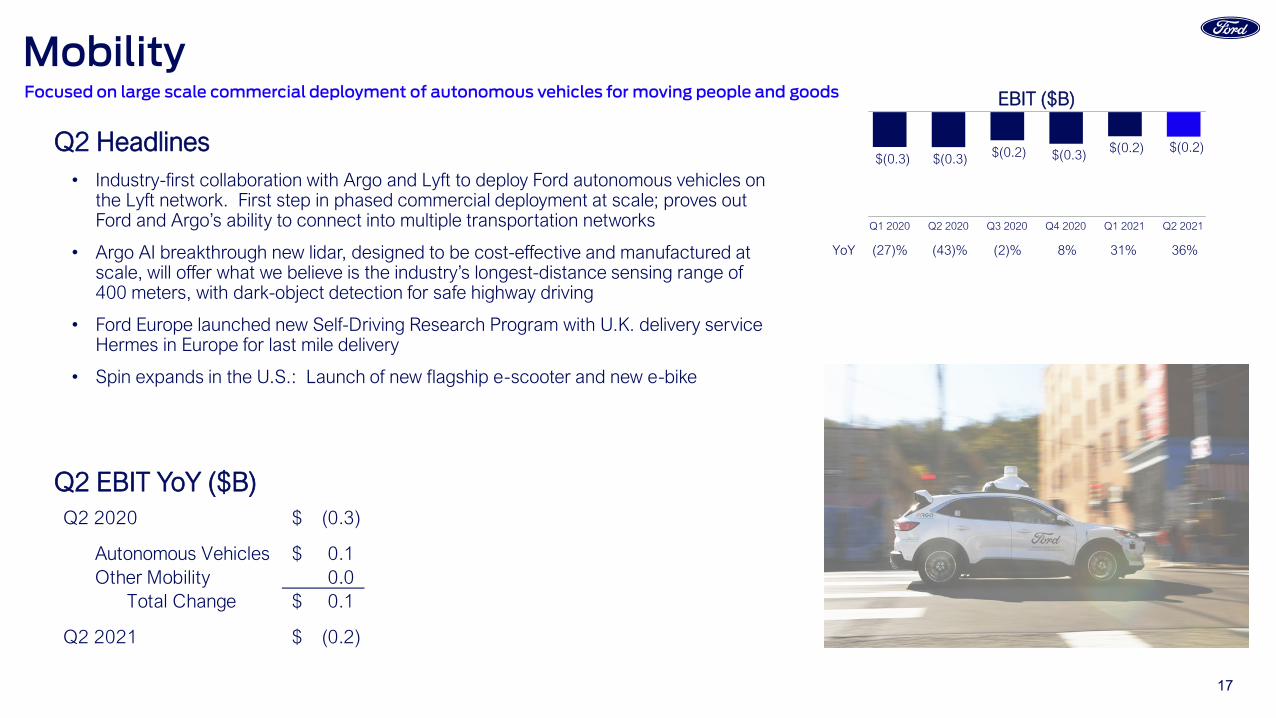
Mobility
• Industry-first collaboration with Argo and Lyft to deploy Ford autonomous vehicles on the Lyft network. First step in phased commercial deployment at scale; proves out Ford and Argo’s ability to connect into multiple transportation networks
• Argo AI breakthrough new lidar, designed to be cost-effective and manufactured at scale, will offer what we believe is the industry’s longest-distance sensing range of 400 meters, with dark-object detection for safe highway driving
• Ford Europe launched new Self-Driving Research Program with U.K. delivery service Hermes in Europe for last mile delivery
• Spin expands in the U.S.: Launch of new flagship e-scooter and new e-bike
$(0.3) $(0.3) $(0.2) $(0.3) $(0.2) $(0.2)
YoY (27)% (43)% (2)% 8% 31% 36%
Q2 2020 (0.3)$
Autonomous Vehicles 0.1$ Other Mobility 0.0
Total Change 0.1$
Q2 2021 (0.2)$
Focused on large scale commercial deployment of autonomous vehicles for moving people and goods
18
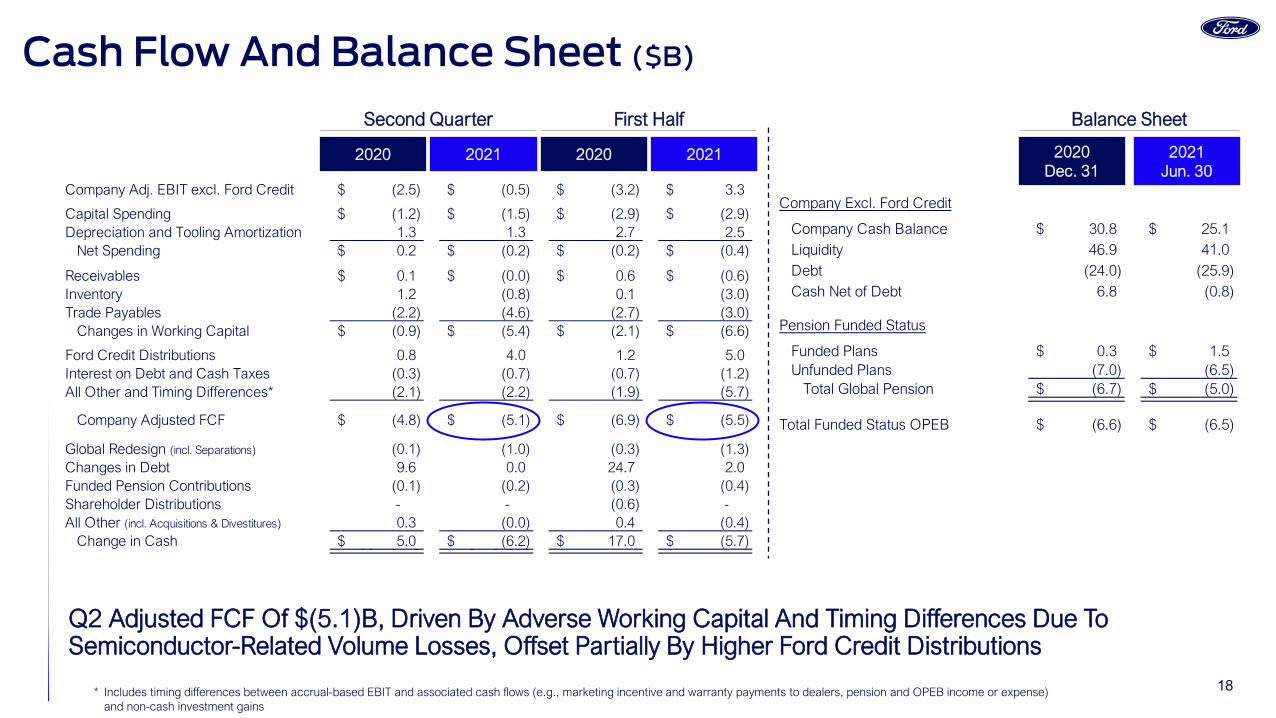
Cash Flow And Balance Sheet ($B)
Company Adj. EBIT excl. Ford Credit (2.5)$ (0.5)$ (3.2)$ 3.3$
Capital Spending (1.2)$ (1.5)$ (2.9)$ (2.9)$ Depreciation and Tooling Amortization 1.3 1.3 2.7 2.5
Net Spending 0.2$ (0.2)$ (0.2)$ (0.4)$
Receivables 0.1$ (0.0)$ 0.6$ (0.6)$ Inventory 1.2 (0.8) 0.1 (3.0) Trade Payables (2.2) (4.6) (2.7) (3.0)
Changes in Working Capital (0.9)$ (5.4)$ (2.1)$ (6.6)$
Ford Credit Distributions 0.8 4.0 1.2 5.0Interest on Debt and Cash Taxes (0.3) (0.7) (0.7) (1.2)All Other and Timing Differences* (2.1) (2.2) (1.9) (5.7)
Company Adjusted FCF (4.8)$ (5.1)$ (6.9)$ (5.5)$
Global Redesign (incl. Separations) (0.1) (1.0) (0.3) (1.3) Changes in Debt 9.6 0.0 24.7 2.0 Funded Pension Contributions (0.1) (0.2) (0.3) (0.4) Shareholder Distributions - - (0.6) - All Other (incl. Acquisitions & Divestitures) 0.3 (0.0) 0.4 (0.4)
Change in Cash 5.0$ (6.2)$ 17.0$ (5.7)$ 00 9 9 9 5 509
Balance Sheet
2021Jun. 30
2020Dec. 31
Second Quarter
20212020
Company Excl. Ford Credit
Company Cash Balance 30.8$ 25.1$ Liquidity 46.9 41.0Debt (24.0) (25.9)Cash Net of Debt 6.8 (0.8)
Pension Funded Status
Funded Plans 0.3$ 1.5$ Unfunded Plans (7.0) (6.5)
Total Global Pension (6.7)$ (5.0)$
Total Funded Status OPEB (6.6)$ (6.5)$
20212020
First Half
Q2 Adjusted FCF Of $(5.1)B, Driven By Adverse Working Capital And Timing Differences Due To Semiconductor-Related Volume Losses, Offset Partially By Higher Ford Credit Distributions
* Includes timing differences between accrual-based EBIT and associated cash flows (e.g., marketing incentive and warranty payments to dealers, pension and OPEB income or expense) and non-cash investment gains
19
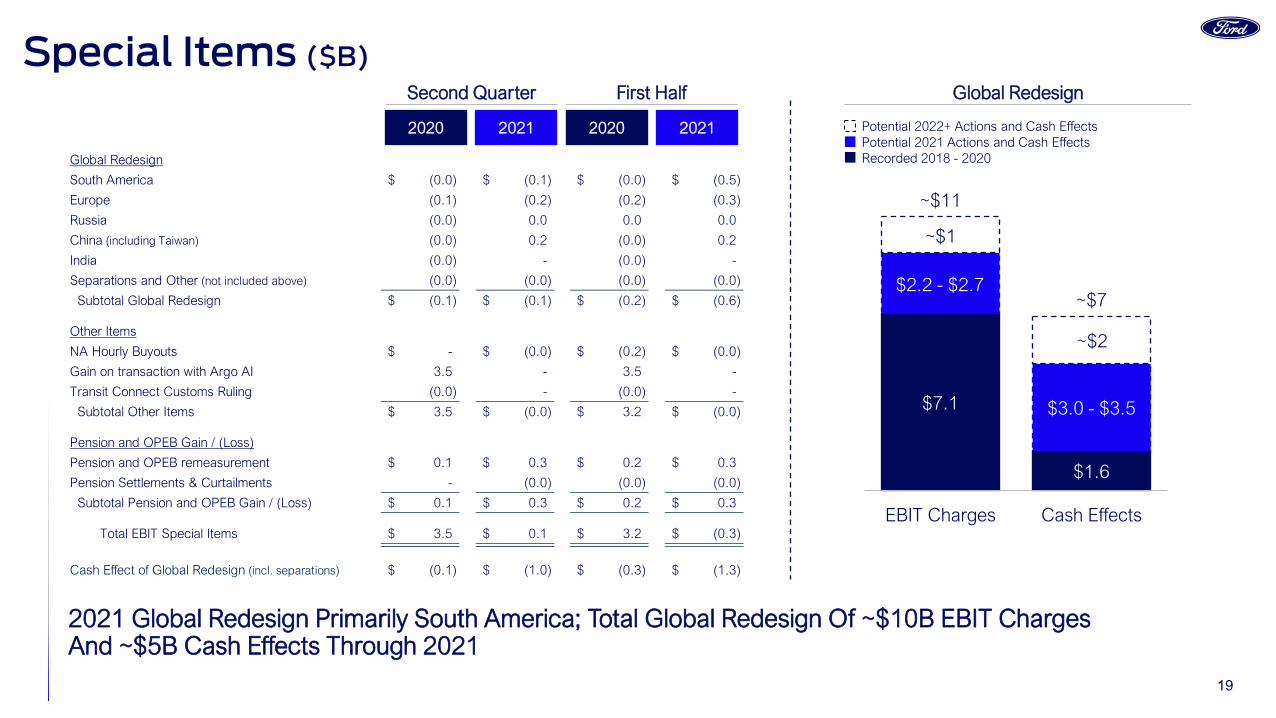
Special Items ($B)Global Redesign
Potential 2022+ Actions and Cash EffectsPotential 2021 Actions and Cash EffectsRecorded 2018 - 2020
$7.1
$1.6
1.45
1.9
~$11
~$7
EBIT Charges Cash Effects
$2.2 - $2.7
$3.0 - $3.5
~$1
~$2
Second Quarter
20212020 20212020
First Half
2021 Global Redesign Primarily South America; Total Global Redesign Of ~$10B EBIT Charges And ~$5B Cash Effects Through 2021
Global Redesign
South America (0.0)$ (0.1)$ (0.0)$ (0.5)$
Europe (0.1) (0.2) (0.2) (0.3)
Russia (0.0) 0.0 0.0 0.0
China (including Taiwan) (0.0) 0.2 (0.0) 0.2
India (0.0) - (0.0) -
Separations and Other (not included above) (0.0) (0.0) (0.0) (0.0)
Subtotal Global Redesign (0.1)$ (0.1)$ (0.2)$ (0.6)$
Other Items
NA Hourly Buyouts -$ (0.0)$ (0.2)$ (0.0)$
Gain on transaction with Argo AI 3.5 - 3.5 -
Transit Connect Customs Ruling (0.0) - (0.0) -
Subtotal Other Items 3.5$ (0.0)$ 3.2$ (0.0)$
Pension and OPEB Gain / (Loss)
Pension and OPEB remeasurement 0.1$ 0.3$ 0.2$ 0.3$
Pension Settlements & Curtailments - (0.0) (0.0) (0.0)
Subtotal Pension and OPEB Gain / (Loss) 0.1$ 0.3$ 0.2$ 0.3$
Total EBIT Special Items 3.5$ 0.1$ 3.2$ (0.3)$
Cash Effect of Global Redesign (incl. separations) (0.1)$ (1.0)$ (0.3)$ (1.3)$

20
Ford Credit
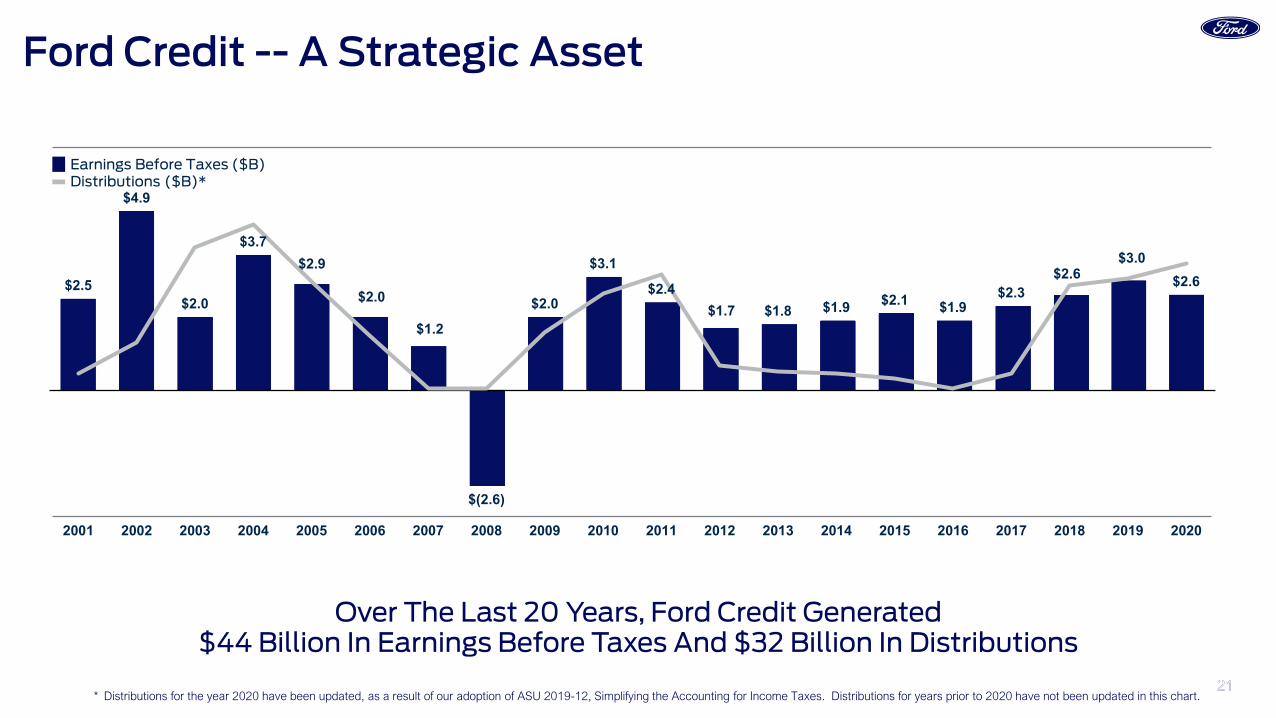
2121
$2.5
$4.9
$2.0
$3.7 $2.9
$2.0
$1.2
$(2.6)
$2.0
$3.1
$2.4 $1.7 $1.8 $1.9 $2.1 $1.9
$2.3 $2.6
$3.0 $2.6
2001 2002 2003 2004 2005 2006 2007 2008 2009 2010 2011 2012 2013 2014 2015 2016 2017 2018 2019 2020
Earnings Before Taxes ($B)Distributions ($B)*
Over The Last 20 Years, Ford Credit Generated $44 Billion In Earnings Before Taxes And $32 Billion In Distributions
Ford Credit -- A Strategic Asset
* Distributions for the year 2020 have been updated, as a result of our adoption of ASU 2019-12, Simplifying the Accounting for Income Taxes. Distributions for years prior to 2020 have not been updated in this chart.
22
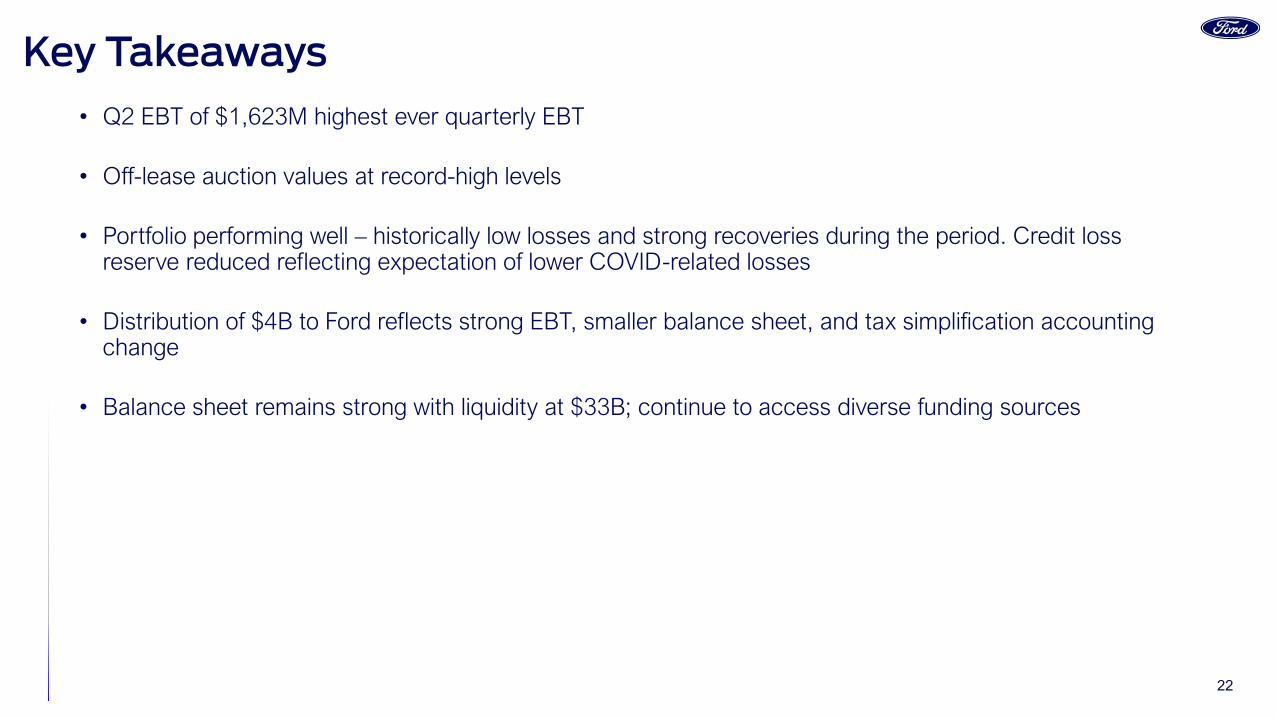
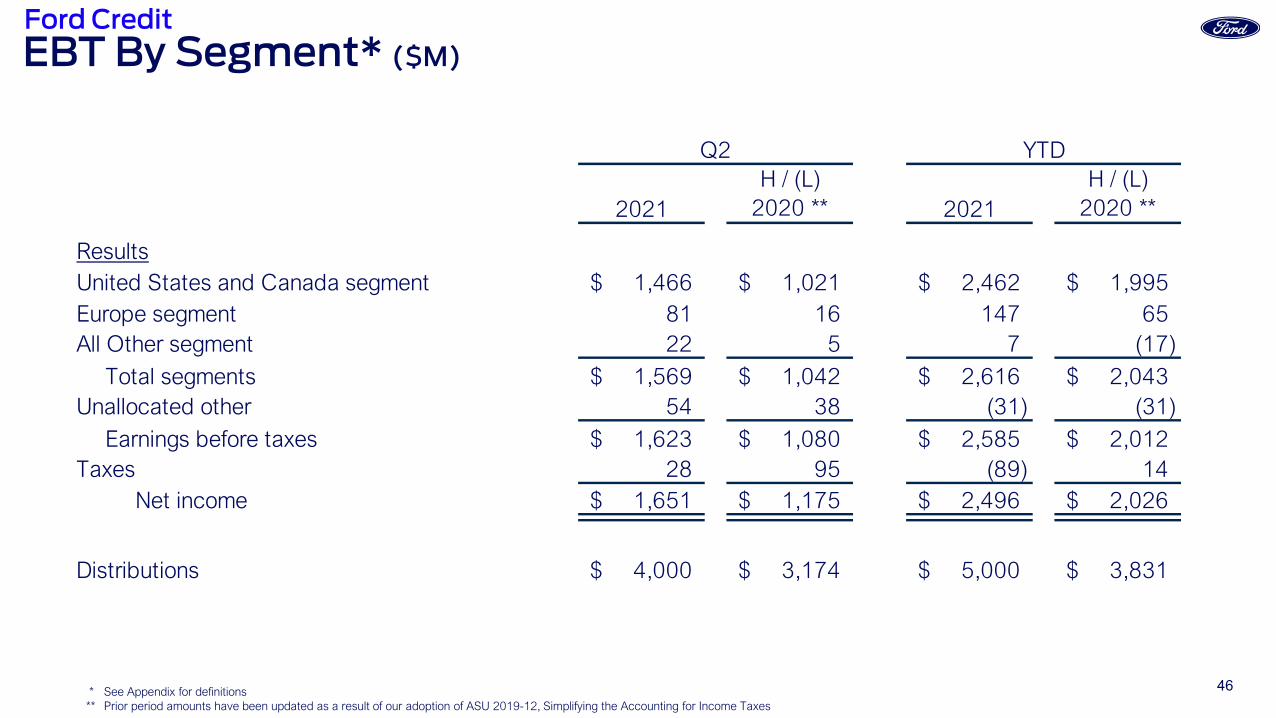
Key Takeaways• Q2 EBT of $1,623M highest ever quarterly EBT
• Off-lease auction values at record-high levels
• Portfolio performing well – historically low losses and strong recoveries during the period. Credit loss reserve reduced reflecting expectation of lower COVID-related losses
• Distribution of $4B to Ford reflects strong EBT, smaller balance sheet, and tax simplification accounting change
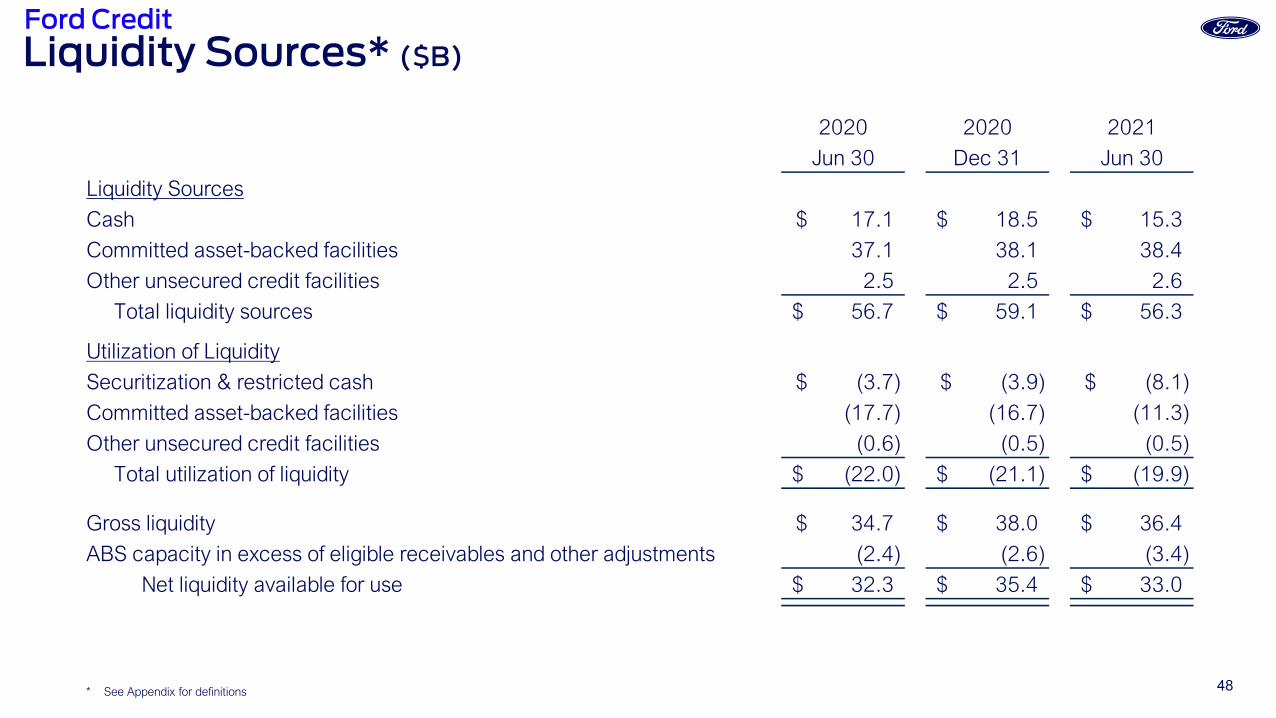
• Balance sheet remains strong with liquidity at $33B; continue to access diverse funding sources
23
Q2 Headlines
Q1 2020 Q4 2020Q2 2020 Q3 2020 Q1 2021 Q2 2021
Q1 2020 Q4 2020Q2 2020 Q3 2020 Q1 2021 Q2 2021
Q1 2020 Q4 2020Q2 2020 Q3 2020 Q1 2021 Q2 2021
EBT ($M)
U.S. Retail LTR Ratios (%)
Auction Values (Per Unit)*
Q2 EBT YoY ($M)
0.62%
0.15%0.30%
0.37%0.22%
Key Metrics
• Launched the first loyalty-building Ford Pro FinSimple products and services with digital commercial lines of credit and digital combined billing
• Established product teams to increase speed and robustness of our digital portfolio and modernize operations globally
• Record EBT of $1,623M, up $1,080M, reflecting record-high auction values and the reduction of retail COVID-19 reserves
• Portfolio performing well – historically low losses and strong net recoveries
* U.S. 36-month off-lease auction values at Q2 2021 mix
$19,505 $20,110 $21,670 $20,770 $22,280
$28,030
$30
$543
$1,123 $912 $962
$1,623
Volume /Mix
FinancingMargin
LeaseResidual
Credit Loss
Q2 2021Q2 2020 Exchange Other
Distributions $343 $826 $831 $1,290 $1,000 $4,000
(0.07)%
24
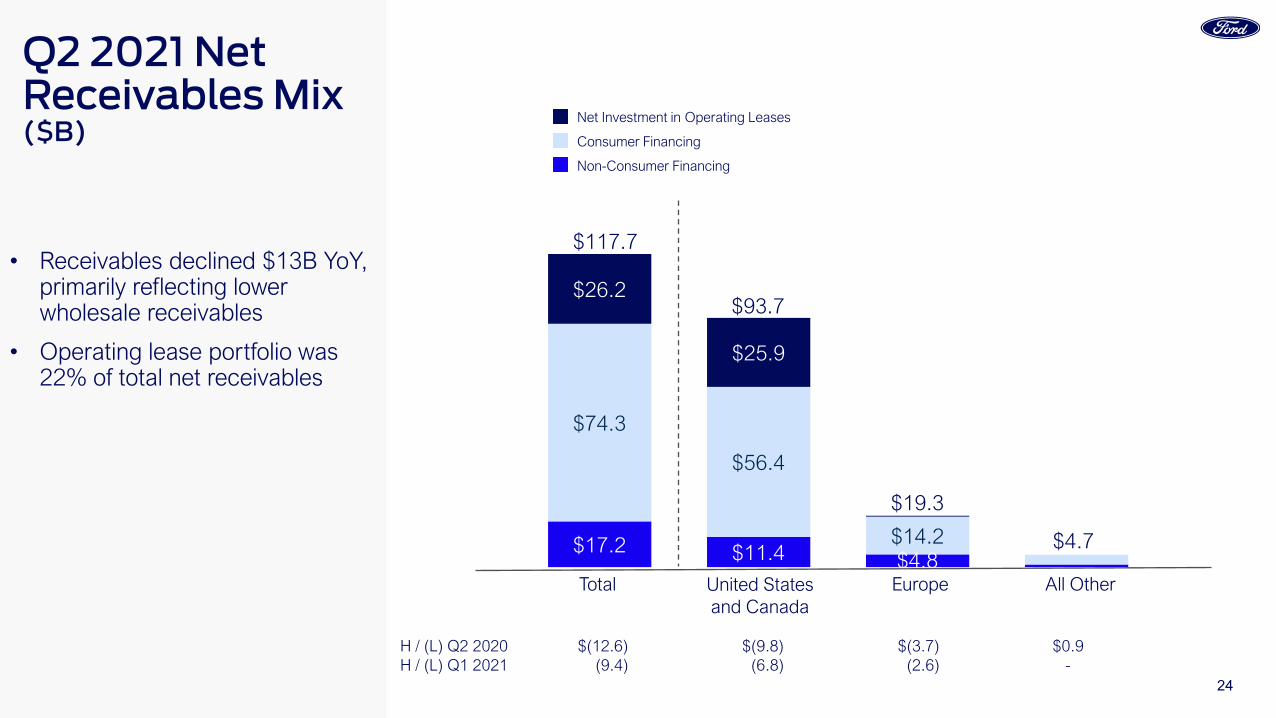
• Receivables declined $13B YoY, primarily reflecting lower wholesale receivables
• Operating lease portfolio was 22% of total net receivables
Q2 2021 Net Receivables Mix ($B)
$17.2 $11.4 $4.8
$74.3
$56.4
$14.2
$26.2
$25.9
Total All OtherUnited Statesand Canada
Net Investment in Operating Leases
Consumer Financing
Non-Consumer Financing
Europe
$117.7
$93.7
$19.3
$4.7
H / (L) Q2 2020 $(12.6) $(9.8) $(3.7) $0.9H / (L) Q1 2021 (9.4) (6.8) (2.6) -
25
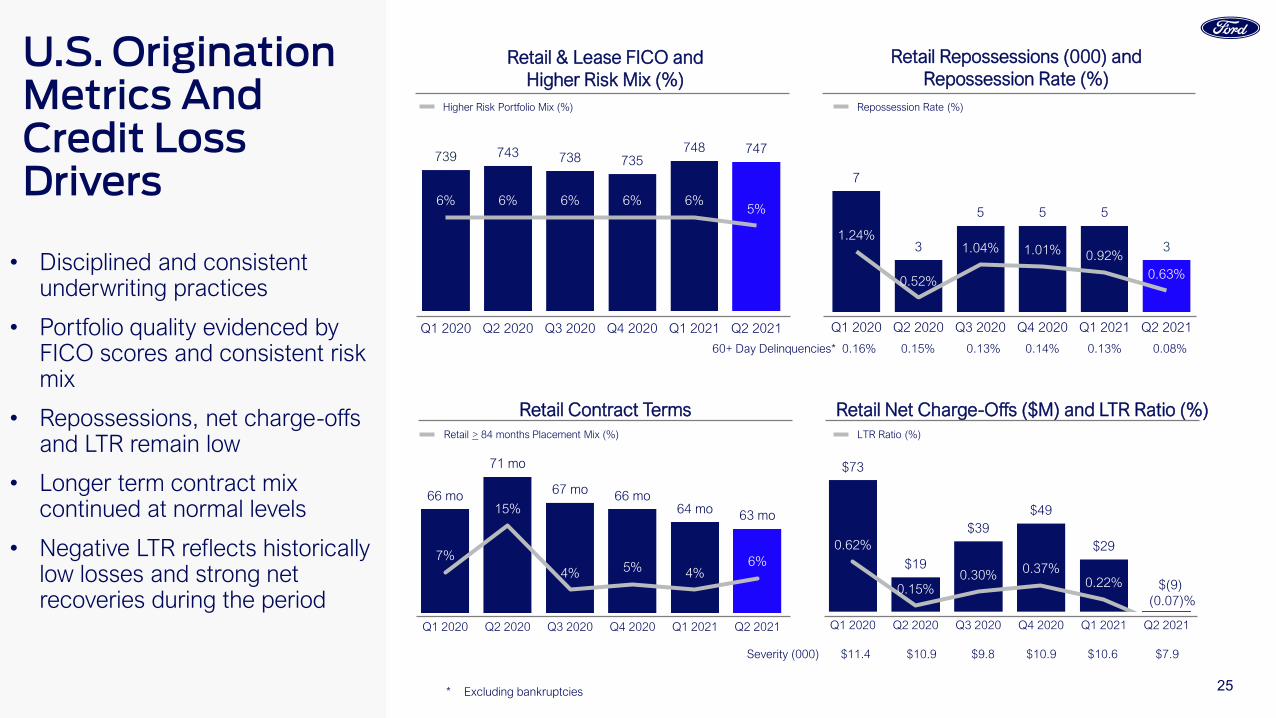
• Disciplined and consistent underwriting practices
• Portfolio quality evidenced by FICO scores and consistent risk mix
• Repossessions, net charge-offs and LTR remain low
• Longer term contract mix continued at normal levels
• Negative LTR reflects historically low losses and strong net recoveries during the period
U.S. Origination Metrics And Credit Loss Drivers
Severity (000) $11.4 $10.9 $9.8 $10.9 $10.6 $7.9
60+ Day Delinquencies* 0.16% 0.15% 0.13% 0.14% 0.13% 0.08%
66 mo
71 mo
67 mo 66 mo64 mo 63 mo
7%
15%
4% 5% 4%6%
Q1 2020 Q2 2020 Q3 2020 Q4 2020 Q1 2021 Q2 2021
739 743 738 735748 747
6% 6% 6% 6% 6%5%
Q1 2020 Q2 2020 Q3 2020 Q4 2020 Q1 2021 Q2 2021
Retail & Lease FICO andHigher Risk Mix (%)
Retail Contract Terms
$73
$19
$39$49
$290.62%
0.15%0.30% 0.37%
0.22%
Q1 2020 Q2 2020 Q3 2020 Q4 2020 Q1 2021 Q2 2021
Retail Net Charge-Offs ($M) and LTR Ratio (%)
7
3
5 5 5
31.24%
0.52%
1.04% 1.01% 0.92%0.63%
Q1 2020 Q2 2020 Q3 2020 Q4 2020 Q1 2021 Q2 2021
Retail Repossessions (000) andRepossession Rate (%)
Higher Risk Portfolio Mix (%) Repossession Rate (%)
Retail > 84 months Placement Mix (%) LTR Ratio (%)
* Excluding bankruptcies
$(9)(0.07)%
26
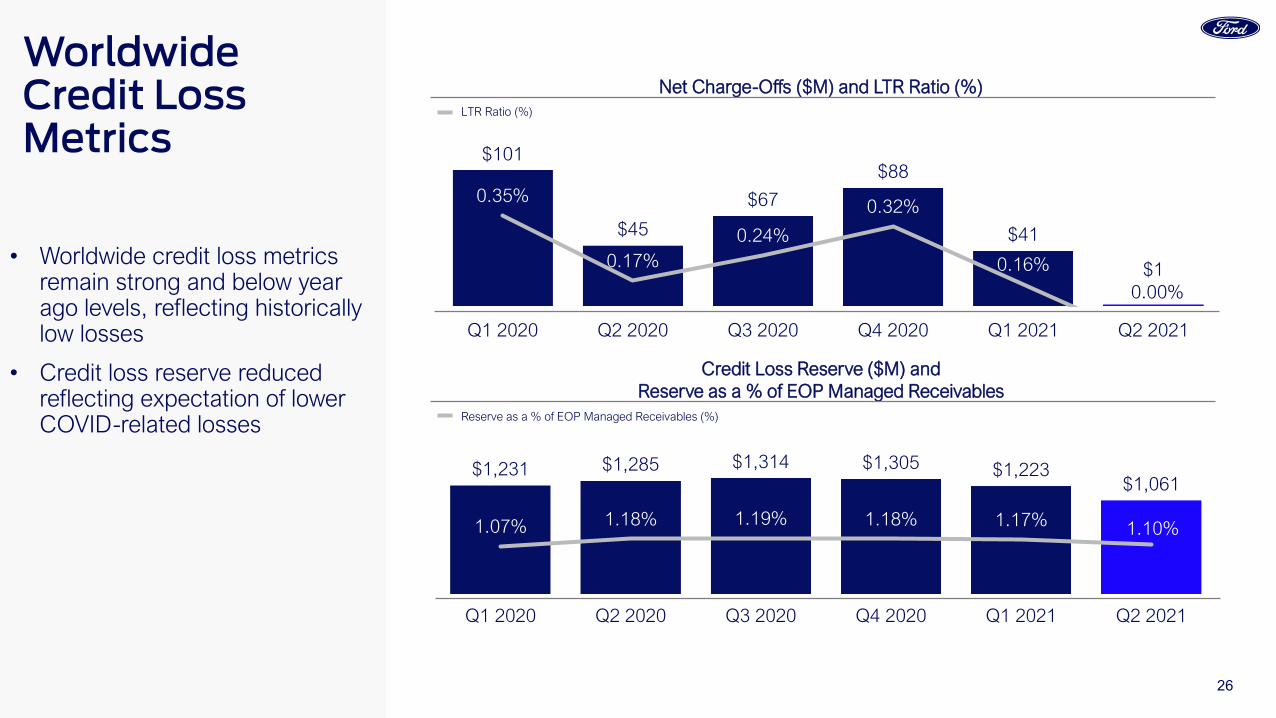
• Worldwide credit loss metrics remain strong and below year ago levels, reflecting historically low losses
• Credit loss reserve reduced reflecting expectation of lower COVID-related losses
Worldwide Credit Loss Metrics
$1,231 $1,285 $1,314 $1,305 $1,223$1,061
1.07% 1.18% 1.19% 1.18% 1.17% 1.10%
Q1 2020 Q2 2020 Q3 2020 Q4 2020 Q1 2021 Q2 2021
$101
$45
$67
$88
$41
$1
0.35%
0.17%0.24%
0.32%
0.16%
Q1 2020 Q2 2020 Q3 2020 Q4 2020 Q1 2021 Q2 2021
Net Charge-Offs ($M) and LTR Ratio (%)
Credit Loss Reserve ($M) and Reserve as a % of EOP Managed Receivables
LTR Ratio (%)
Reserve as a % of EOP Managed Receivables (%)
0.00%
27
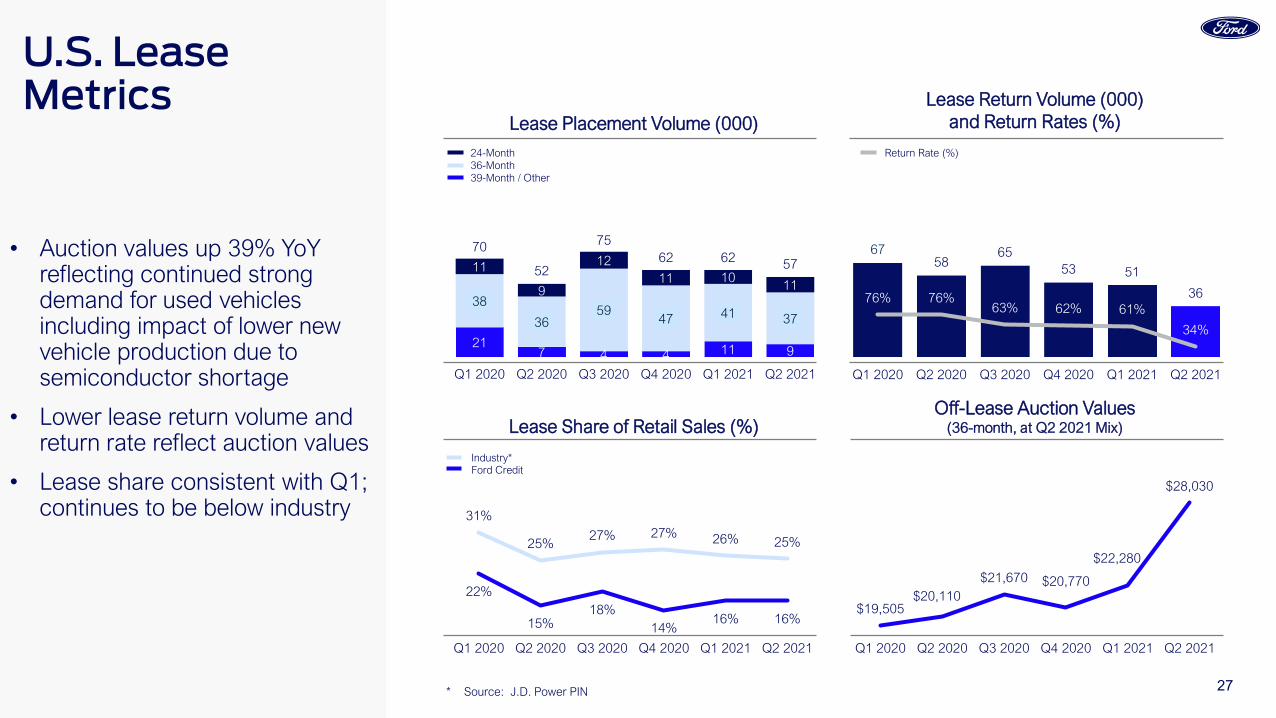
• Auction values up 39% YoY reflecting continued strong demand for used vehicles including impact of lower new vehicle production due to semiconductor shortage
• Lower lease return volume and return rate reflect auction values
• Lease share consistent with Q1; continues to be below industry
Lease Placement Volume (000)
Lease Share of Retail Sales (%)
Lease Return Volume (000) and Return Rates (%)
Return Rate (%)
31%
25%27% 27% 26% 25%
22%
15%18%
14%16% 16%
Q1 2020 Q2 2020 Q3 2020 Q4 2020 Q1 2021 Q2 2021
24-Month36-Month39-Month / Other
Industry*Ford Credit
$19,505$20,110
$21,670 $20,770
$22,280
$28,030
Q1 2020 Q2 2020 Q3 2020 Q4 2020 Q1 2021 Q2 2021
6758
6553 51
3676% 76%63% 62% 61%
34%
Q1 2020 Q2 2020 Q3 2020 Q4 2020 Q1 2021 Q2 2021
Off-Lease Auction Values(36-month, at Q2 2021 Mix)
* Source: J.D. Power PIN
217 4 4 11 9
38
3659
47 41 37
11
9
1211 10
11
70
52
7562 62 57
Q1 2020 Q2 2020 Q3 2020 Q4 2020 Q1 2021 Q2 2021
U.S. LeaseMetrics
28
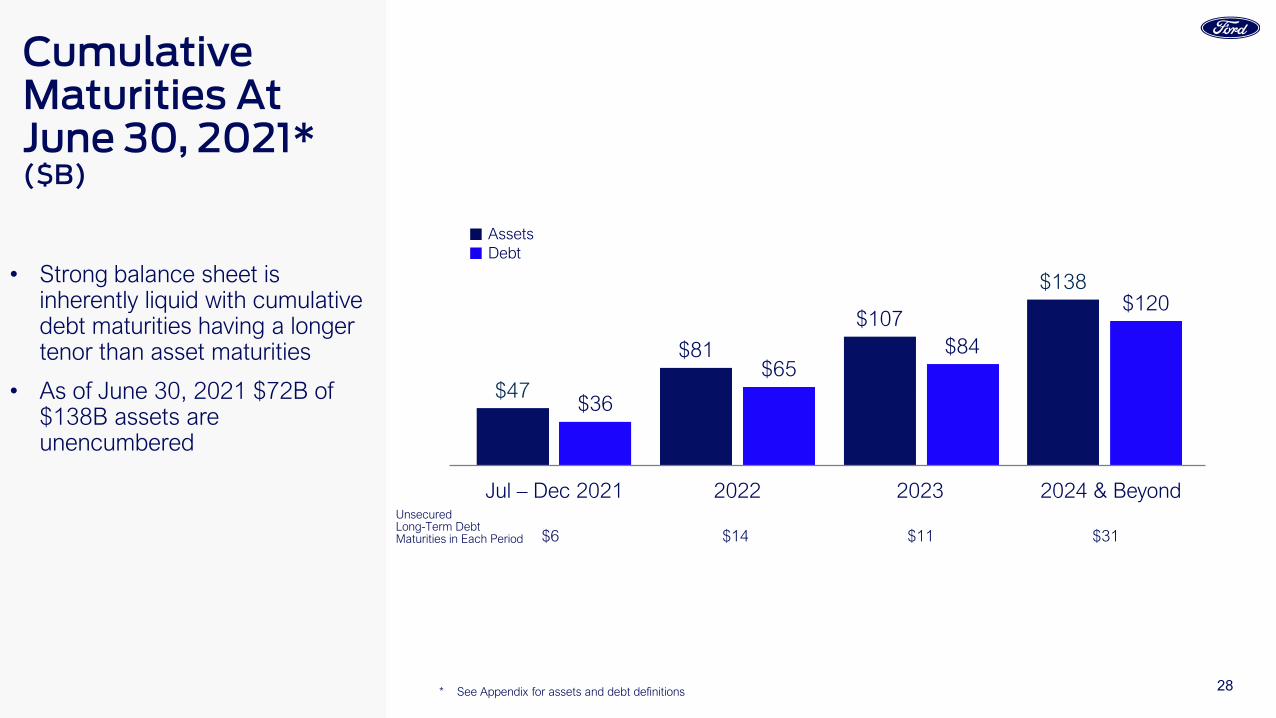
• Strong balance sheet is inherently liquid with cumulative debt maturities having a longer tenor than asset maturities
• As of June 30, 2021 $72B of $138B assets are unencumbered
Cumulative Maturities At June 30, 2021* ($B)
$47
$81
$107
$138
$36
$65$84
$120
Jul – Dec 2021 2022 2023 2024 & Beyond
$6 $14 $11 $31
Unsecured Long-Term Debt Maturities in Each Period
AssetsDebt
* See Appendix for assets and debt definitions
29
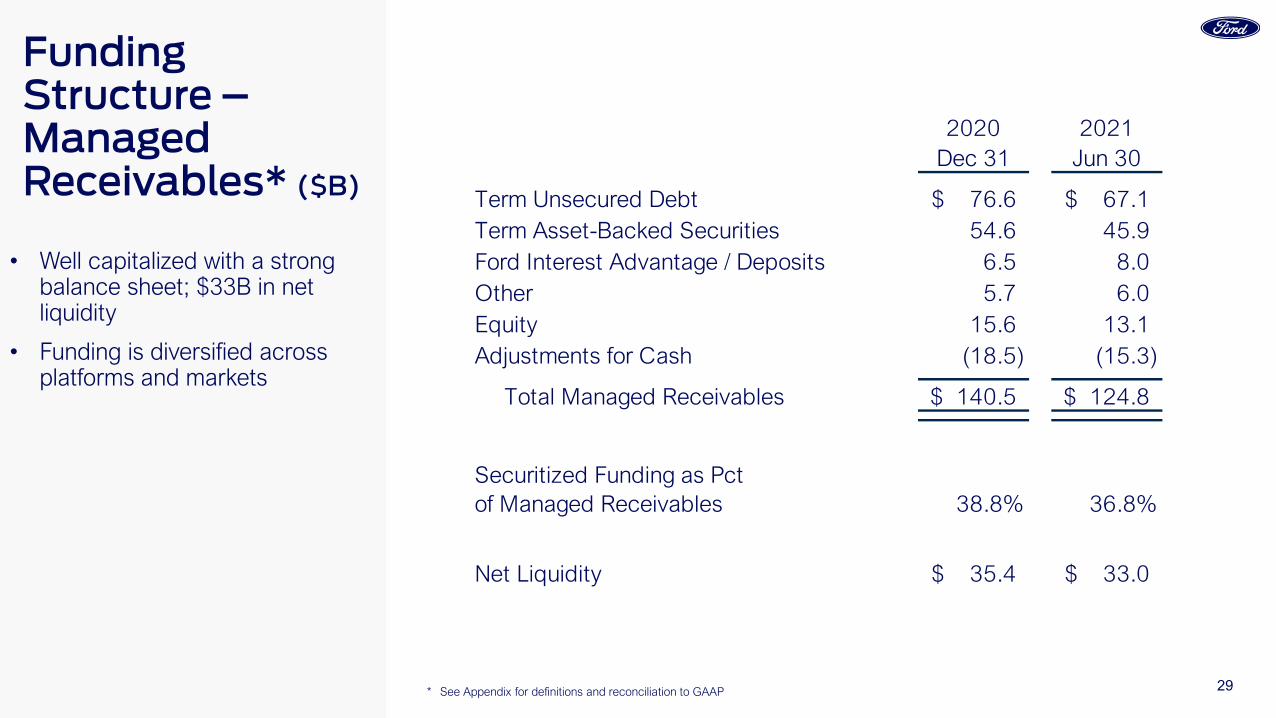
2020 2021Dec 31 Jun 30
Term Unsecured Debt 76.6$ 67.1$ Term Asset-Backed Securities 54.6 45.9 Ford Interest Advantage / Deposits 6.5 8.0 Other 5.7 6.0 Equity 15.6 13.1 Adjustments for Cash (18.5) (15.3)
Total Managed Receivables 140.5$ 124.8$
Securitized Funding as Pct of Managed Receivables 38.8% 36.8%
Net Liquidity 35.4$ 33.0$
• Well capitalized with a strong balance sheet; $33B in net liquidity
• Funding is diversified across platforms and markets
Funding Structure –Managed Receivables* ($B)
** See Appendix for definitions and reconciliation to GAAP
30
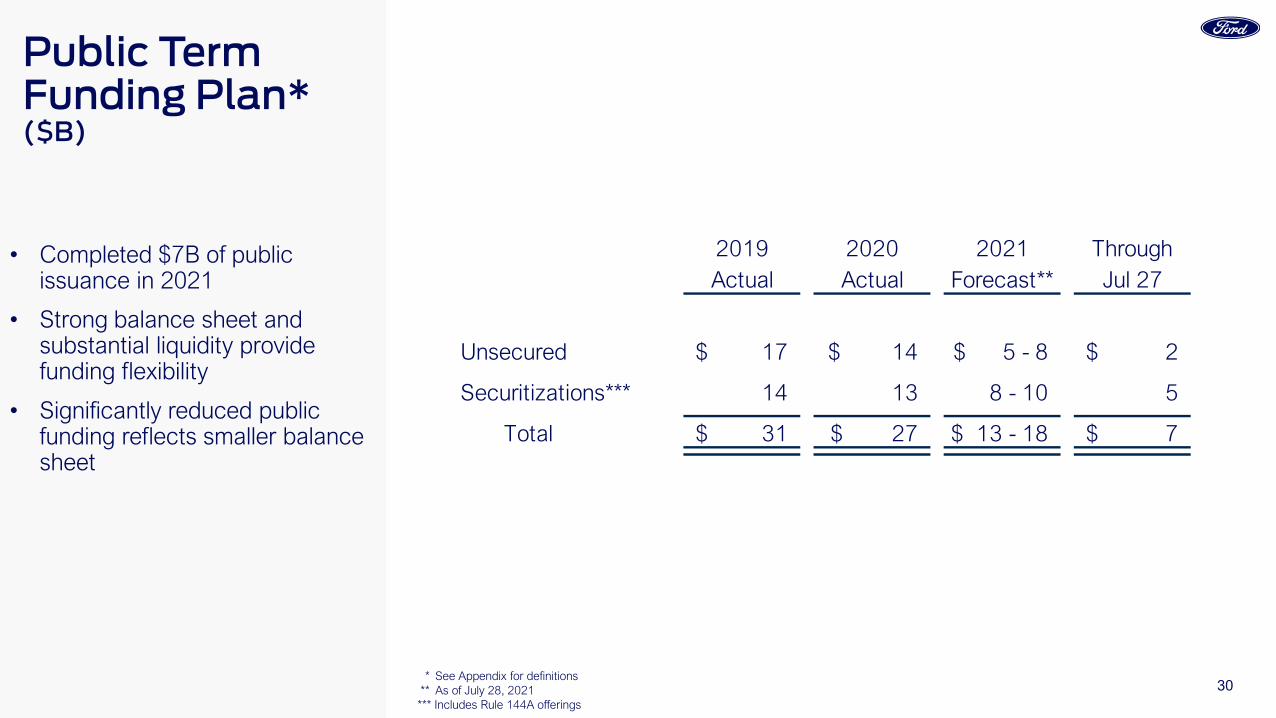
• Completed $7B of public issuance in 2021
• Strong balance sheet and substantial liquidity provide funding flexibility
• Significantly reduced public funding reflects smaller balance sheet
Public Term Funding Plan* ($B)
2019 2020 2021 ThroughActual Actual Forecast** Jul 27
Unsecured 17$ 14$ $ 5 - 8 2$
Securitizations*** 14 13 8 - 10 5
Total 31$ 27$ $ 13 - 18 7$
* See Appendix for definitions ** As of July 28, 2021*** Includes Rule 144A offerings
31
Statements included or incorporated by reference herein may constitute “forward-looking statements” within the meaning of the Private Securities Litigation Reform Act of 1995. Forward-looking statements are based on expectations, forecasts, and assumptions by our management and involve a number of risks, uncertainties, and other factors that could cause actual results to differ materially from those stated, including, without limitation:
• Ford and Ford Credit’s financial condition and results of operations have been and may continue to be adversely affected by public health issues, including epidemics or pandemics such as COVID-19;• Ford is highly dependent on its suppliers to deliver components in accordance with Ford’s production schedule, and a shortage of key components, such as semiconductors, can disrupt Ford’s production of
vehicles;• Ford’s long-term competitiveness depends on the successful execution of its Plan;• Ford’s vehicles could be affected by defects that result in delays in new model launches, recall campaigns, or increased warranty costs;• Ford may not realize the anticipated benefits of existing or pending strategic alliances, joint ventures, acquisitions, divestitures, or new business strategies;• Operational systems, security systems, and vehicles could be affected by cyber incidents and other disruptions;• Ford’s production, as well as Ford’s suppliers’ production, could be disrupted by labor issues, natural or man-made disasters, financial distress, production difficulties, or other factors;• Ford’s ability to maintain a competitive cost structure could be affected by labor or other constraints;• Ford’s ability to attract and retain talented, diverse, and highly skilled employees is critical to its success and competitiveness;• Ford’s new and existing products and mobility services are subject to market acceptance and face significant competition from existing and new entrants in the automotive and mobility industries;• Ford’s results are dependent on sales of larger, more profitable vehicles, particularly in the United States;• With a global footprint, Ford’s results could be adversely affected by economic, geopolitical, protectionist trade policies, or other events, including tariffs;• Industry sales volume in any of Ford’s key markets can be volatile and could decline if there is a financial crisis, recession, or significant geopolitical event;• Ford may face increased price competition or a reduction in demand for its products resulting from industry excess capacity, currency fluctuations, competitive actions, or other factors;• Fluctuations in commodity prices, foreign currency exchange rates, interest rates, and market value of Ford or Ford Credit’s investments can have a significant effect on results;• Ford and Ford Credit’s access to debt, securitization, or derivative markets around the world at competitive rates or in sufficient amounts could be affected by credit rating downgrades, market volatility, market
disruption, regulatory requirements, or other factors;• Ford’s receipt of government incentives could be subject to reduction, termination, or clawback;• Ford Credit could experience higher-than-expected credit losses, lower-than-anticipated residual values, or higher-than-expected return volumes for leased vehicles;• Economic and demographic experience for pension and other postretirement benefit plans (e.g., discount rates or investment returns) could be worse than Ford has assumed;• Pension and other postretirement liabilities could adversely affect Ford’s liquidity and financial condition;• Ford could experience unusual or significant litigation, governmental investigations, or adverse publicity arising out of alleged defects in products, perceived environmental impacts, or otherwise;• Ford may need to substantially modify its product plans to comply with safety, emissions, fuel economy, autonomous vehicle, and other regulations;• Ford and Ford Credit could be affected by the continued development of more stringent privacy, data use, and data protection laws and regulations as well as consumers’ heightened expectations to safeguard their
personal information; and• Ford Credit could be subject to new or increased credit regulations, consumer protection regulations, or other regulations.
We cannot be certain that any expectation, forecast, or assumption made in preparing forward-looking statements will prove accurate, or that any projection will be realized. It is to be expected that there may be differences between projected and actual results. Our forward-looking statements speak only as of the date of their initial issuance, and we do not undertake any obligation to update or revise publicly any forward-looking statement, whether as a result of new information, future events, or otherwise. For additional discussion, see “Item 1A. Risk Factors” in our Annual Report on Form 10-K for the year ended December 31, 2020, as updated by subsequent Quarterly Reports on Form 10-Q and Current Reports on Form 8-K.
Cautionary Note On Forward-Looking Statements

32
FCE Bank PLC
33
FCE Company and Branches
Markets Served By:
FCE Subsidiaries
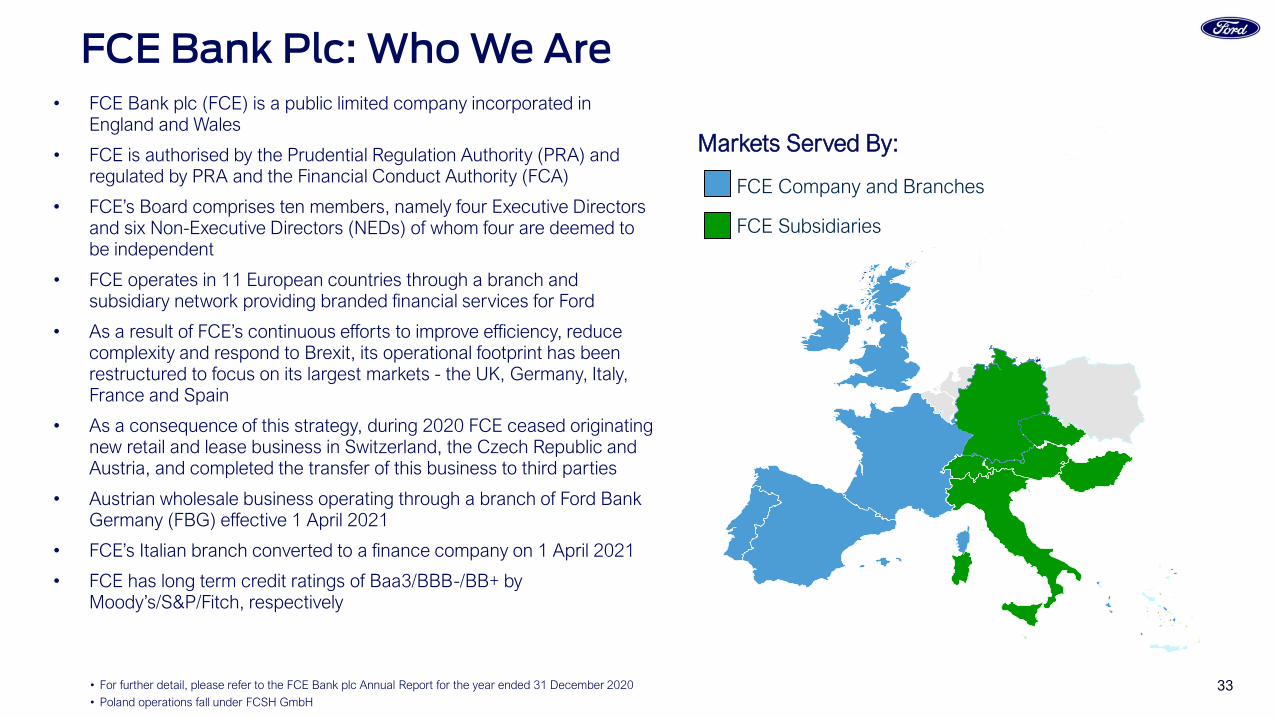
• FCE Bank plc (FCE) is a public limited company incorporated in England and Wales
• FCE is authorised by the Prudential Regulation Authority (PRA) and regulated by PRA and the Financial Conduct Authority (FCA)
• FCE’s Board comprises ten members, namely four Executive Directors and six Non-Executive Directors (NEDs) of whom four are deemed to be independent
• FCE operates in 11 European countries through a branch and subsidiary network providing branded financial services for Ford
• As a result of FCE’s continuous efforts to improve efficiency, reduce complexity and respond to Brexit, its operational footprint has been restructured to focus on its largest markets - the UK, Germany, Italy, France and Spain
• As a consequence of this strategy, during 2020 FCE ceased originating new retail and lease business in Switzerland, the Czech Republic and Austria, and completed the transfer of this business to third parties
• Austrian wholesale business operating through a branch of Ford Bank Germany (FBG) effective 1 April 2021
• FCE’s Italian branch converted to a finance company on 1 April 2021
• FCE has long term credit ratings of Baa3/BBB-/BB+ by Moody’s/S&P/Fitch, respectively
• For further detail, please refer to the FCE Bank plc Annual Report for the year ended 31 December 2020
• Poland operations fall under FCSH GmbH
FCE Bank Plc: Who We Are
34
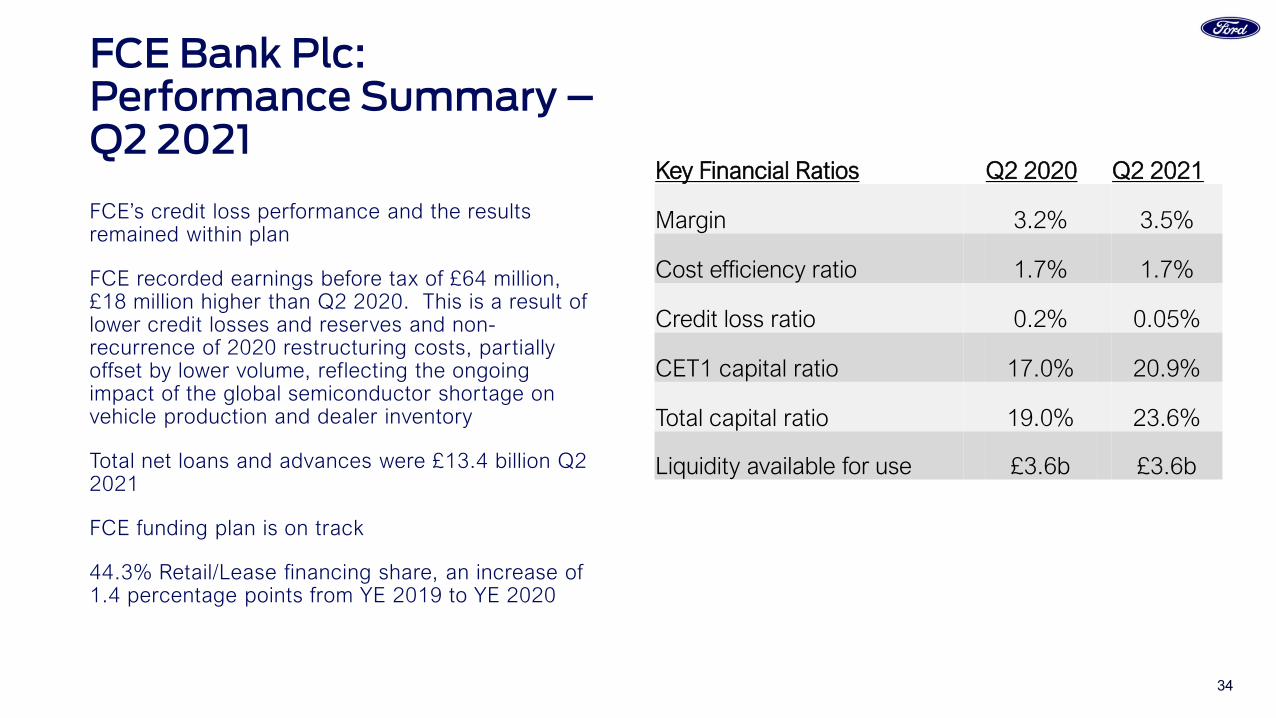
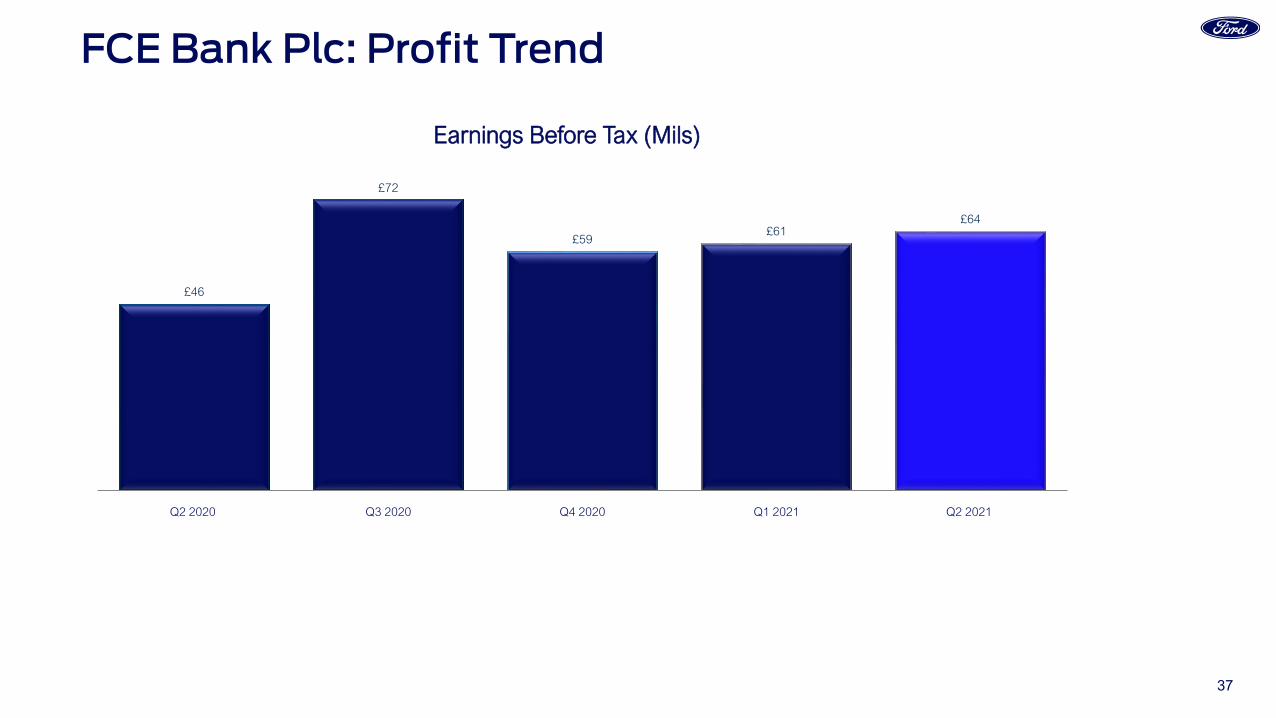
FCE Bank Plc: Performance Summary –Q2 2021FCE’s credit loss performance and the results remained within plan
FCE recorded earnings before tax of £64 million, £18 million higher than Q2 2020. This is a result of lower credit losses and reserves and non-recurrence of 2020 restructuring costs, partially offset by lower volume, reflecting the ongoing impact of the global semiconductor shortage on vehicle production and dealer inventory
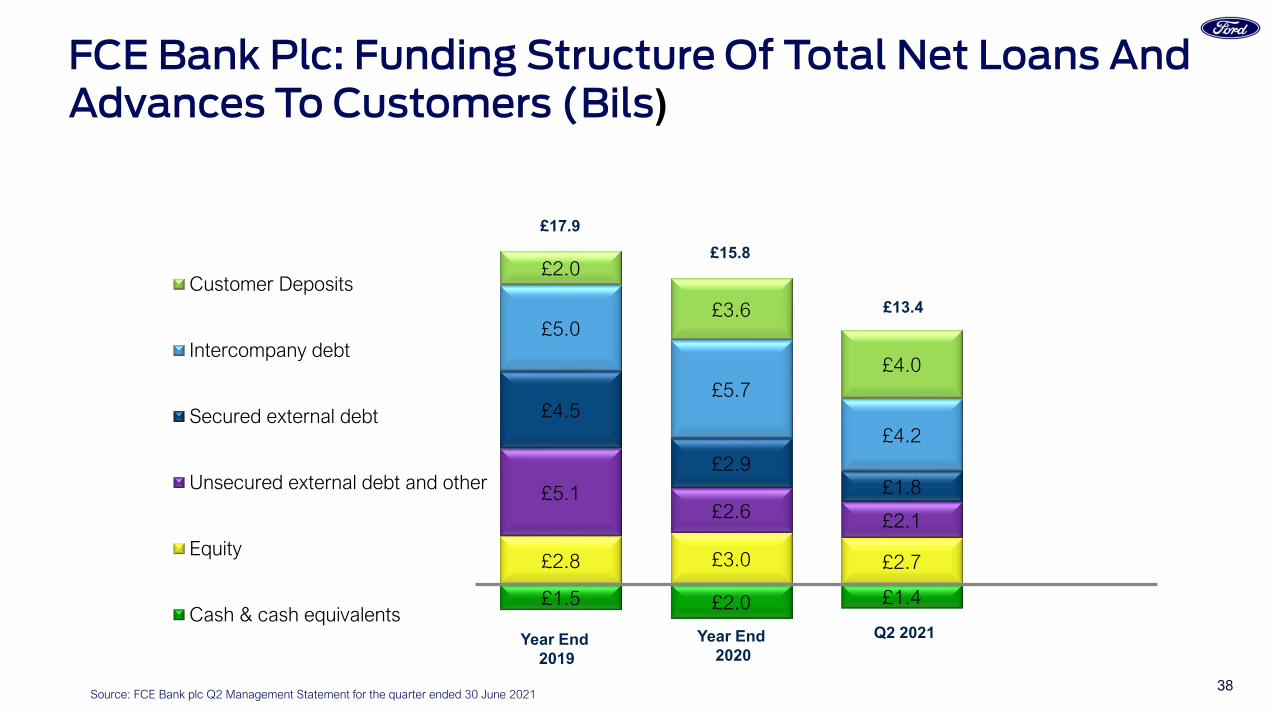
Total net loans and advances were £13.4 billion Q2 2021
FCE funding plan is on track
44.3% Retail/Lease financing share, an increase of 1.4 percentage points from YE 2019 to YE 2020
Key Financial Ratios Q2 2020 Q2 2021
Margin 3.2% 3.5%
Cost efficiency ratio 1.7% 1.7%
Credit loss ratio 0.2% 0.05%
CET1 capital ratio 17.0% 20.9%
Total capital ratio 19.0% 23.6%
Liquidity available for use £3.6b £3.6b
Po r t f o l i o C o n t i n u e s To Pe r fo r m We l l
Source: FCE Bank plc Q2 Management Statement for the quarter ended 30 June 2021
35
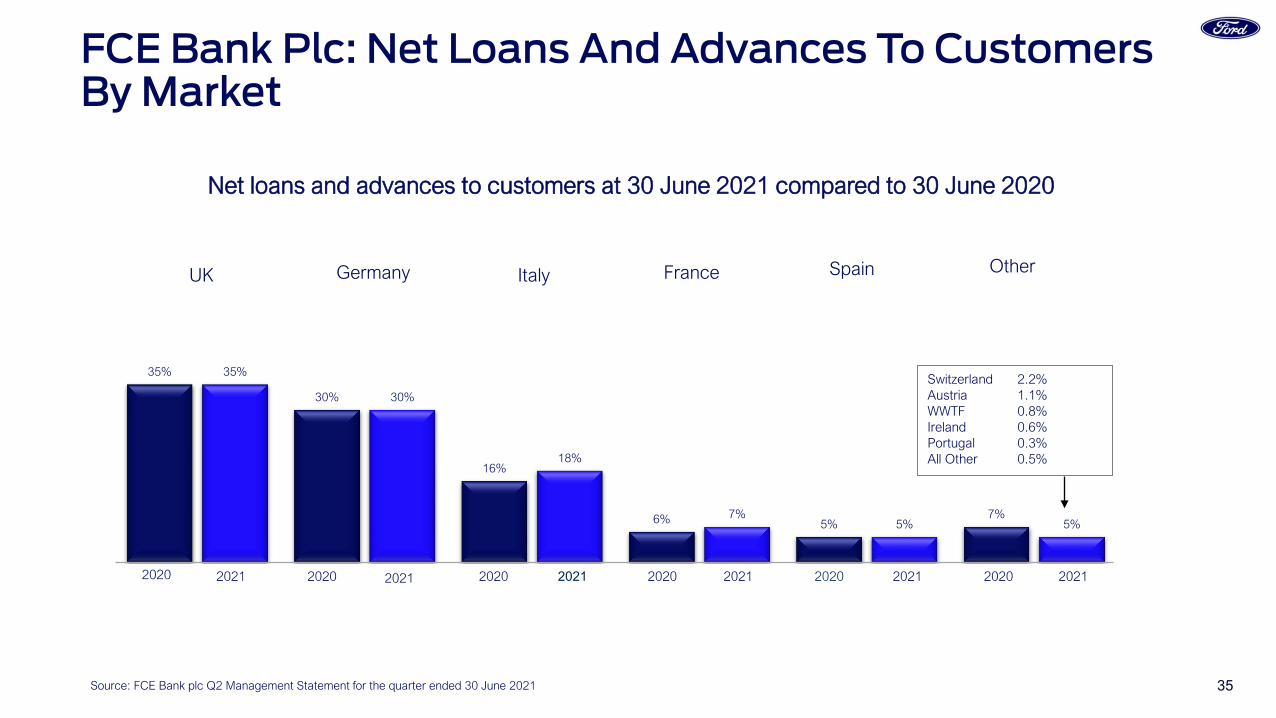
FCE Bank Plc: Net Loans And Advances To Customers By Market
Source: FCE Bank plc Q2 Management Statement for the quarter ended 30 June 2021
35%
30%
16%
6% 5%7%
35%
30%
18%
7%5% 5%
GermanyUK Italy France Spain Other
Switzerland 2.2%Austria 1.1%WWTF 0.8%Ireland 0.6%Portugal 0.3%All Other 0.5%
20202020 2020 2020 2020 2020202120212021 2021 2021 2021
Net loans and advances to customers at 30 June 2021 compared to 30 June 2020

36
FCE Bank Plc: Credit Loss Ratio
£10,893
0.13%
(0.02%)
0.13%
0.05%
0.49%
0.09% 0.07%
0.10%
0.45%
0.31%
0.09%
(0.02%)
0.20%
0.05%
UK Germany Italy France Spain Other Total
2020 2021 2020 2021 2020 2021 2020 2021 2020 2021 2020 2021 2020 2021
Annualised Q2 net credit losses / Average net loans and advances to customers
L o w e r L o s s R a t e s I n M o s t M a r ke t s R e f l e c t i n g G o v e r n m e n t a l C O V I D S u p p o r t
Source: FCE Bank plc Q2 Management Statement for the quarter ended 30 June 2021
37
FCE Bank Plc: Profit Trend
£10,893
Source: FCE Bank plc Q2 Management Statement for the quarter ended 30 June 2021
£46
£72
£59 £61
£64
Q2 2020 Q3 2020 Q4 2020 Q1 2021 Q2 2021
Earnings Before Tax (Mils)
2 0 2 1 E a r n i n g s B e fo re Ta x H i g h e r D u e To N o n Re p e a t O f H i g h e r L o s s Re s e r v e s
38Source: FCE Bank plc Q2 Management Statement for the quarter ended 30 June 2021
FCE Bank Plc: Funding Structure Of Total Net Loans And Advances To Customers (Bils)
£1.5 £2.0 £1.4
£2.8 £3.0 £2.7
£5.1£2.6 £2.1
£4.5
£2.9£1.8
£5.0
£5.7
£4.2
£2.0
£3.6
£4.0
Customer Deposits
Intercompany debt
Secured external debt
Unsecured external debt and other
Equity
Cash & cash equivalentsQ2 2021
£13.4
Year End2020
£15.8£17.9
Year End 2019

Appendix
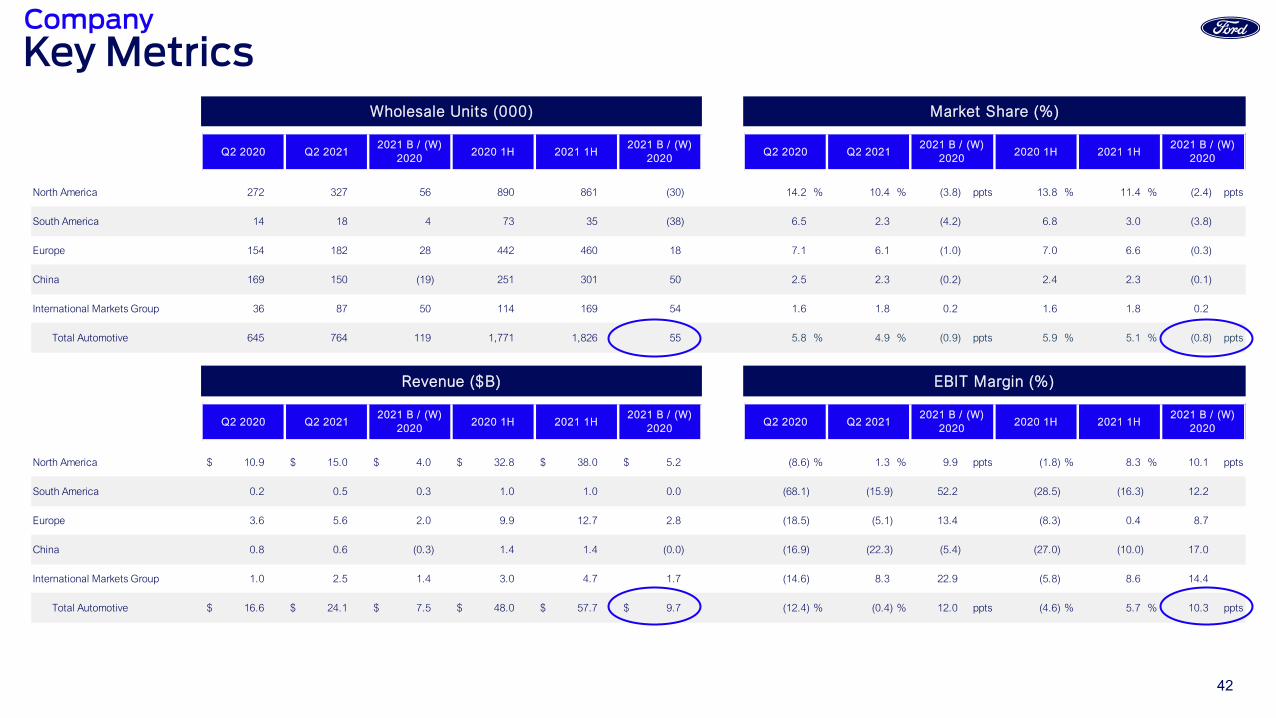
Note: See slide 60 for related notes
40
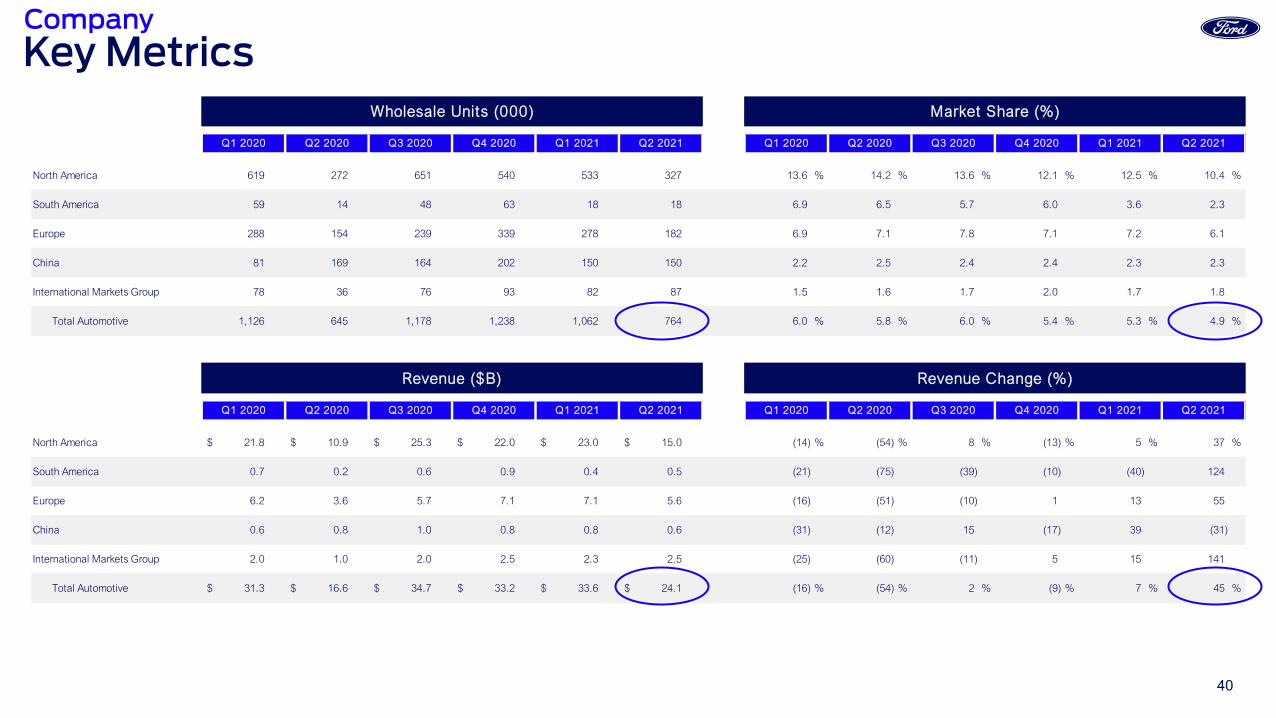
North America 619 272 651 540 533 327 13.6 % 14.2 % 13.6 % 12.1 % 12.5 % 10.4 %
South America 59 14 48 63 18 18 6.9 6.5 5.7 6.0 3.6 2.3
Europe 288 154 239 339 278 182 6.9 7.1 7.8 7.1 7.2 6.1
China 81 169 164 202 150 150 2.2 2.5 2.4 2.4 2.3 2.3
International Markets Group 78 36 76 93 82 87 1.5 1.6 1.7 2.0 1.7 1.8
Total Automotive 1,126 645 1,178 1,238 1,062 764 6.0 % 5.8 % 6.0 % 5.4 % 5.3 % 4.9 %
North America 21.8$ 10.9$ 25.3$ 22.0$ 23.0$ 15.0$ (14) % (54) % 8 % (13) % 5 % 37 %
South America 0.7 0.2 0.6 0.9 0.4 0.5 (21) (75) (39) (10) (40) 124
Europe 6.2 3.6 5.7 7.1 7.1 5.6 (16) (51) (10) 1 13 55
China 0.6 0.8 1.0 0.8 0.8 0.6 (31) (12) 15 (17) 39 (31)
International Markets Group 2.0 1.0 2.0 2.5 2.3 2.5 (25) (60) (11) 5 15 141
Total Automotive 31.3$ 16.6$ 34.7$ 33.2$ 33.6$ 24.1$ (16) % (54) % 2 % (9) % 7 % 45 %
Revenue Change (%)
Market Share (%)Wholesale Units (000)
Revenue ($B)
Q1 2021 Q2 2021Q2 2021 Q1 2020 Q2 2020 Q3 2020 Q4 2020Q1 2020 Q2 2020 Q3 2020 Q4 2020 Q1 2021
Q1 2020 Q2 2020 Q3 2020 Q4 2020 Q1 2021 Q1 2021 Q2 2021Q2 2021 Q1 2020 Q2 2020 Q3 2020 Q4 2020
Key MetricsCompany

41
North America 0.4$ (0.9)$ 3.2$ 1.1$ 2.9$ 0.2$ (83) % (156) % 59 % 53 % N / M 120 %
South America (0.1) (0.2) (0.1) (0.1) (0.1) (0.1) 28 19 34 40 35 48
Europe (0.1) (0.7) (0.4) 0.4 0.3 (0.3) N / M N / M N / M N / M N / M 57
China (0.2) (0.1) (0.1) (0.1) (0.0) (0.1) (91) 11 79 68 94 9
International Markets Group (0.0) (0.1) 0.1 (0.1) 0.2 0.2 N / M (115) 181 64 N / M N / M
Total Automotive (0.2)$ (2.1)$ 2.7$ 1.3$ 3.4$ (0.1)$ (108) % N / M 98 % N / M N / M 95 %
North America 1.7 % (8.6) % 12.6 % 4.9 % 12.8 % 1.3 % (7.0) (15.7) 4.0 2.1 11.1 9.9
South America (15.4) (68.1) (17.0) (12.2) (16.7) (15.9) 1.4 (47.3) (1.3) 6.0 (1.3) 52.2
Europe (2.4) (18.5) (7.8) 5.8 4.8 (5.1) (3.5) (20.0) (5.5) 4.8 7.2 13.4
China (40.6) (16.9) (5.7) (8.2) (1.8) (22.3) (26.0) (0.2) 26.1 13.0 38.8 (5.4)
International Markets Group (1.3) (14.6) 3.6 (2.4) 8.9 8.3 (1.6) (11.9) 7.5 4.7 10.2 22.9
Total Automotive (0.5) % (12.4) % 7.7 % 3.8 % 10.1 % (0.4) % (5.9) (16.3) 3.7 3.2 10.6 12.0
Q1 2021 Q2 2021
Q1 2020 Q2 2020 Q3 2020 Q4 2020 Q1 2021 Q2 2021
Q2 2021 Q1 2020 Q2 2020 Q3 2020 Q4 2020Q1 2020 Q2 2020 Q3 2020 Q4 2020 Q1 2021
Q2 2021
EBIT ($B) EBIT Change (%)
EBIT Margin Change (ppts)EBIT Margin (%)
Q1 2020 Q2 2020 Q3 2020 Q4 2020 Q1 2021
Key Metrics
ppts ppts ppts ppts ppts ppts
ppts ppts ppts ppts ppts ppts
Company
42
North America 272 327 56 890 861 (30) 14.2 % 10.4 % (3.8) ppts 13.8 % 11.4 % (2.4) ppts
South America 14 18 4 73 35 (38) 6.5 2.3 (4.2) 6.8 3.0 (3.8)
Europe 154 182 28 442 460 18 7.1 6.1 (1.0) 7.0 6.6 (0.3)
China 169 150 (19) 251 301 50 2.5 2.3 (0.2) 2.4 2.3 (0.1)
International Markets Group 36 87 50 114 169 54 1.6 1.8 0.2 1.6 1.8 0.2
Total Automotive 645 764 119 1,771 1,826 55 5.8 % 4.9 % (0.9) ppts 5.9 % 5.1 % (0.8) ppts
North America 10.9$ 15.0$ 4.0$ 32.8$ 38.0$ 5.2$ (8.6) % 1.3 % 9.9 ppts (1.8) % 8.3 % 10.1 ppts
South America 0.2 0.5 0.3 1.0 1.0 0.0 (68.1) (15.9) 52.2 (28.5) (16.3) 12.2
Europe 3.6 5.6 2.0 9.9 12.7 2.8 (18.5) (5.1) 13.4 (8.3) 0.4 8.7
China 0.8 0.6 (0.3) 1.4 1.4 (0.0) (16.9) (22.3) (5.4) (27.0) (10.0) 17.0
International Markets Group 1.0 2.5 1.4 3.0 4.7 1.7 (14.6) 8.3 22.9 (5.8) 8.6 14.4
Total Automotive 16.6$ 24.1$ 7.5$ 48.0$ 57.7$ 9.7$ (12.4) % (0.4) % 12.0 ppts (4.6) % 5.7 % 10.3 ppts
Market Share (%)
EBIT Margin (%)
Q2 2020 Q2 20212021 B / (W)
20202020 1H 2021 1H
2021 B / (W)2020
Q2 2020 Q2 2021 2020 1H 2021 1H2021 B / (W)
20202021 B / (W)
2020
Wholesale Units (000)
2021 B / (W)2020
2020 1H 2021 1H
Revenue ($B)
2021 B / (W)2020
Q2 2020 Q2 2021
2021 B / (W)2020
Q2 2020 Q2 20212021 B / (W)
20202020 1H 2021 1H
Key MetricsCompany
43
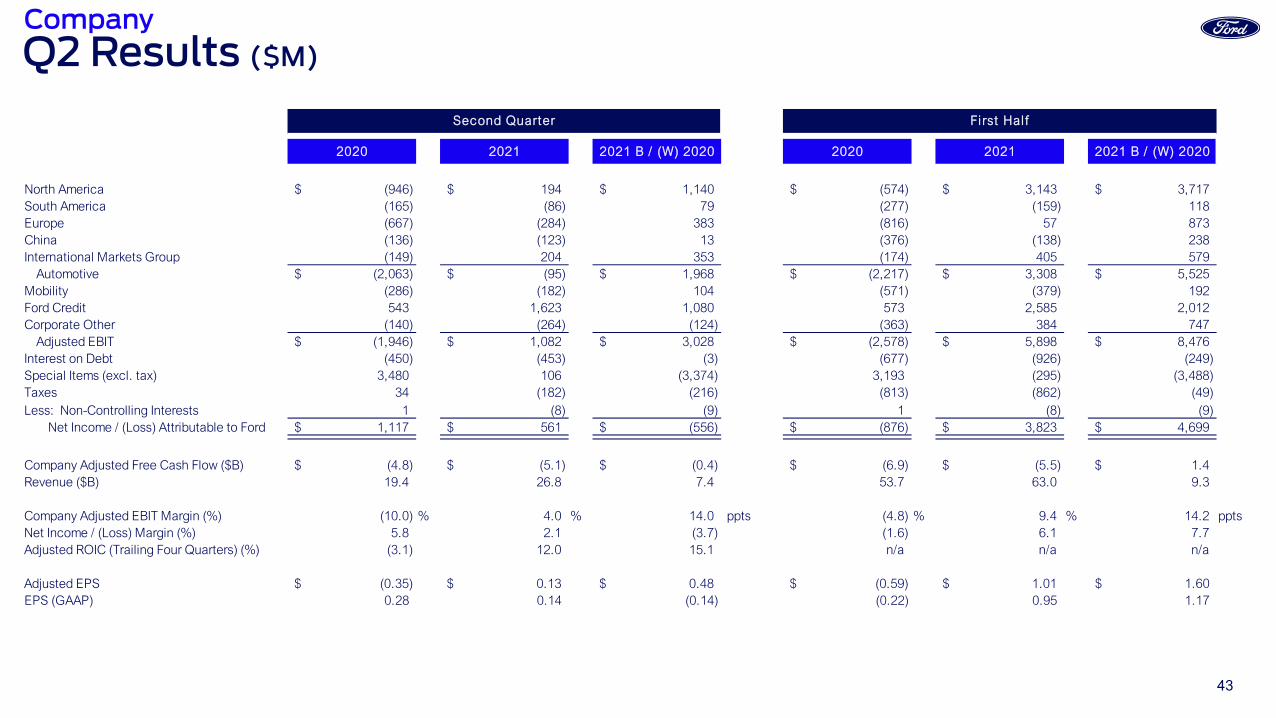
Q2 Results ($M)
2020 2021 2021 B / (W) 2020 2020 2021 2021 B / (W) 2020
North America (946)$ 194$ 1,140$ (574)$ 3,143$ 3,717$ South America (165) (86) 79 (277) (159) 118 Europe (667) (284) 383 (816) 57 873 China (136) (123) 13 (376) (138) 238 International Markets Group (149) 204 353 (174) 405 579
Automotive (2,063)$ (95)$ 1,968$ (2,217)$ 3,308$ 5,525$ Mobility (286) (182) 104 (571) (379) 192 Ford Credit 543 1,623 1,080 573 2,585 2,012 Corporate Other (140) (264) (124) (363) 384 747
Adjusted EBIT (1,946)$ 1,082$ 3,028$ (2,578)$ 5,898$ 8,476$ Interest on Debt (450) (453) (3) (677) (926) (249) Special Items (excl. tax) 3,480 106 (3,374) 3,193 (295) (3,488) Taxes 34 (182) (216) (813) (862) (49) Less: Non-Controlling Interests 1 (8) (9) 1 (8) (9)
Net Income / (Loss) Attributable to Ford 1,117$ 561$ (556)$ (876)$ 3,823$ 4,699$
Company Adjusted Free Cash Flow ($B) (4.8)$ (5.1)$ (0.4)$ (6.9)$ (5.5)$ 1.4$ Revenue ($B) 19.4 26.8 7.4 53.7 63.0 9.3
Company Adjusted EBIT Margin (%) (10.0) % 4.0 % 14.0 ppts (4.8) % 9.4 % 14.2 pptsNet Income / (Loss) Margin (%) 5.8 2.1 (3.7) (1.6) 6.1 7.7 Adjusted ROIC (Trailing Four Quarters) (%) (3.1) 12.0 15.1 n/a n/a n/a
Adjusted EPS (0.35)$ 0.13$ 0.48$ (0.59)$ 1.01$ 1.60$ EPS (GAAP) 0.28 0.14 (0.14) (0.22) 0.95 1.17
Second Quarter Fi rst Hal f
Company
44
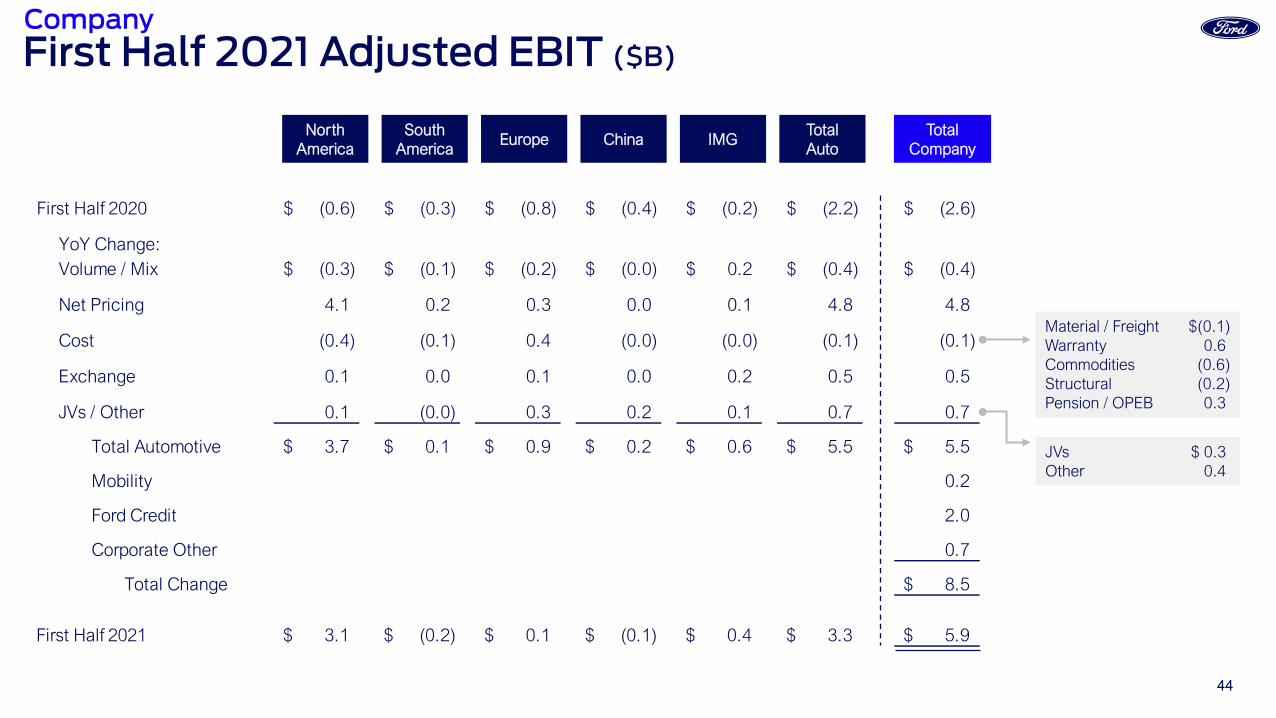
First Half 2020 (0.6)$ (0.3)$ (0.8)$ (0.4)$ (0.2)$ (2.2)$ (2.6)$
YoY Change:Volume / Mix (0.3)$ (0.1)$ (0.2)$ (0.0)$ 0.2$ (0.4)$ (0.4)$
Net Pricing 4.1 0.2 0.3 0.0 0.1 4.8 4.8
Cost (0.4) (0.1) 0.4 (0.0) (0.0) (0.1) (0.1)
Exchange 0.1 0.0 0.1 0.0 0.2 0.5 0.5
JVs / Other 0.1 (0.0) 0.3 0.2 0.1 0.7 0.7
Total Automotive 3.7$ 0.1$ 0.9$ 0.2$ 0.6$ 5.5$ 5.5$
Mobility 0.2
Ford Credit 2.0
Corporate Other 0.7
Total Change 8.5$
First Half 2021 3.1$ (0.2)$ 0.1$ (0.1)$ 0.4$ 3.3$ 5.9$
NorthAmerica
SouthAmerica
Europe China IMGTotalAuto
TotalCompany
JVs $ 0.3Other 0.4
Material / Freight $(0.1)Warranty 0.6Commodities (0.6)Structural (0.2)Pension / OPEB 0.3
First Half 2021 Adjusted EBIT ($B)Company
45
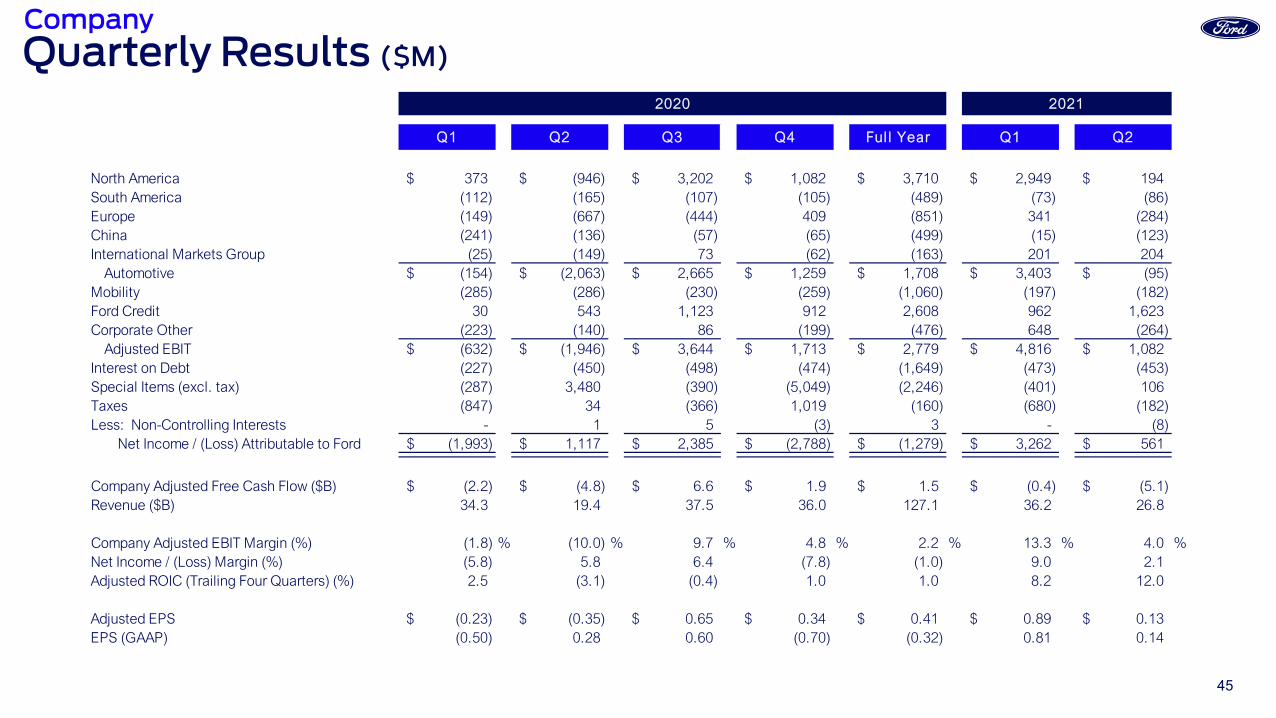
Quarterly Results ($M)
Q1 Q2 Q3 Q4 Ful l Year Q1 Q2
North America 373$ (946)$ 3,202$ 1,082$ 3,710$ 2,949$ 194$ South America (112) (165) (107) (105) (489) (73) (86) Europe (149) (667) (444) 409 (851) 341 (284) China (241) (136) (57) (65) (499) (15) (123) International Markets Group (25) (149) 73 (62) (163) 201 204
Automotive (154)$ (2,063)$ 2,665$ 1,259$ 1,708$ 3,403$ (95)$ Mobility (285) (286) (230) (259) (1,060) (197) (182) Ford Credit 30 543 1,123 912 2,608 962 1,623 Corporate Other (223) (140) 86 (199) (476) 648 (264)
Adjusted EBIT (632)$ (1,946)$ 3,644$ 1,713$ 2,779$ 4,816$ 1,082$ Interest on Debt (227) (450) (498) (474) (1,649) (473) (453) Special Items (excl. tax) (287) 3,480 (390) (5,049) (2,246) (401) 106 Taxes (847) 34 (366) 1,019 (160) (680) (182) Less: Non-Controlling Interests - 1 5 (3) 3 - (8)
Net Income / (Loss) Attributable to Ford (1,993)$ 1,117$ 2,385$ (2,788)$ (1,279)$ 3,262$ 561$
Company Adjusted Free Cash Flow ($B) (2.2)$ (4.8)$ 6.6$ 1.9$ 1.5$ (0.4)$ (5.1)$ Revenue ($B) 34.3 19.4 37.5 36.0 127.1 36.2 26.8
Company Adjusted EBIT Margin (%) (1.8) % (10.0) % 9.7 % 4.8 % 2.2 % 13.3 % 4.0 %Net Income / (Loss) Margin (%) (5.8) 5.8 6.4 (7.8) (1.0) 9.0 2.1 Adjusted ROIC (Trailing Four Quarters) (%) 2.5 (3.1) (0.4) 1.0 1.0 8.2 12.0
Adjusted EPS (0.23)$ (0.35)$ 0.65$ 0.34$ 0.41$ 0.89$ 0.13$ EPS (GAAP) (0.50) 0.28 0.60 (0.70) (0.32) 0.81 0.14
20212020
Company
46
EBT By Segment* ($M)
2021H / (L)
2020 ** 2021H / (L)
2020 **
ResultsUnited States and Canada segment 1,466$ 1,021$ 2,462$ 1,995$ Europe segment 81 16 147 65 All Other segment 22 5 7 (17)
Total segments 1,569$ 1,042$ 2,616$ 2,043$ Unallocated other 54 38 (31) (31)
Earnings before taxes 1,623$ 1,080$ 2,585$ 2,012$ Taxes 28 95 (89) 14
Net income 1,651$ 1,175$ 2,496$ 2,026$
Distributions 4,000$ 3,174$ 5,000$ 3,831$
YTDQ2
* See Appendix for definitions** Prior period amounts have been updated as a result of our adoption of ASU 2019-12, Simplifying the Accounting for Income Taxes
Ford Credit
47
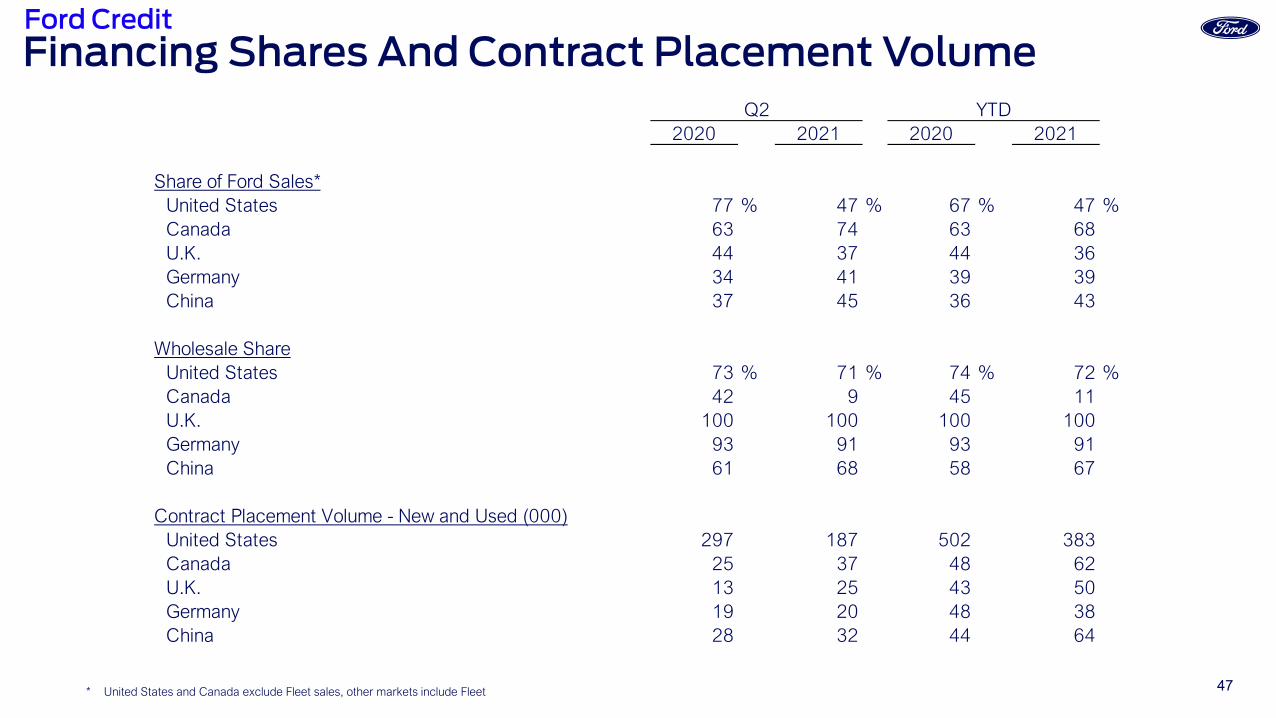
Financing Shares And Contract Placement Volume
2020 2021 2020 2021
Share of Ford Sales*United States 77 % 47 % 67 % 47 %Canada 63 74 63 68U.K. 44 37 44 36Germany 34 41 39 39China 37 45 36 43
Wholesale ShareUnited States 73 % 71 % 74 % 72 %Canada 42 9 45 11U.K. 100 100 100 100Germany 93 91 93 91China 61 68 58 67
Contract Placement Volume - New and Used (000)United States 297 187 502 383Canada 25 37 48 62U.K. 13 25 43 50Germany 19 20 48 38China 28 32 44 64
YTDQ2
* United States and Canada exclude Fleet sales, other markets include Fleet
Ford Credit
48
Liquidity Sources* ($B)
2020 2020 2021
Jun 30 Dec 31 Jun 30
Liquidity Sources
Cash 17.1$ 18.5$ 15.3$
Committed asset-backed facilities 37.1 38.1 38.4
Other unsecured credit facilities 2.5 2.5 2.6
Total liquidity sources 56.7$ 59.1$ 56.3$
Utilization of Liquidity
Securitization & restricted cash (3.7)$ (3.9)$ (8.1)$
Committed asset-backed facilities (17.7) (16.7) (11.3)
Other unsecured credit facilities (0.6) (0.5) (0.5)
Total utilization of liquidity (22.0)$ (21.1)$ (19.9)$
Gross liquidity 34.7$ 38.0$ 36.4$
ABS capacity in excess of eligible receivables and other adjustments (2.4) (2.6) (3.4)
Net liquidity available for use 32.3$ 35.4$ 33.0$
* See Appendix for definitions
Ford Credit
49
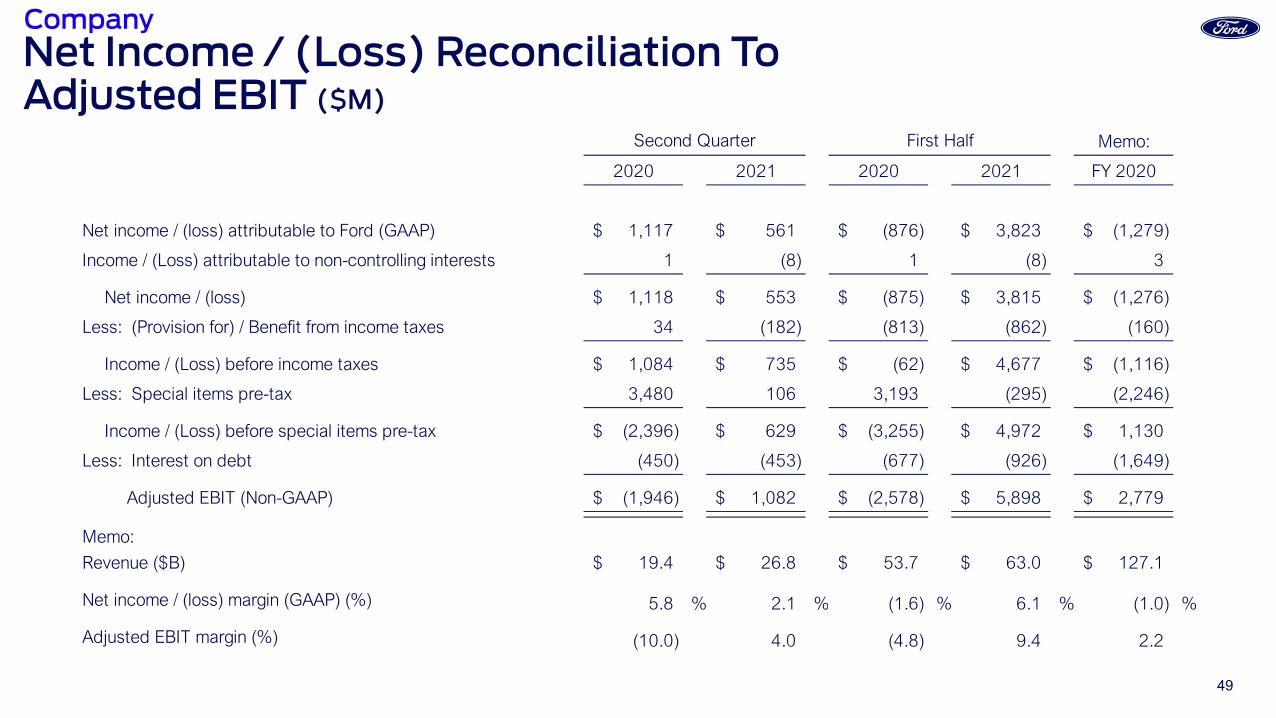
Net Income / (Loss) Reconciliation ToAdjusted EBIT ($M)
Memo:
2020 2021 2020 2021 FY 2020
Net income / (loss) attributable to Ford (GAAP) 1,117$ 561$ (876)$ 3,823$ (1,279)$
Income / (Loss) attributable to non-controlling interests 1 (8) 1 (8) 3
Net income / (loss) 1,118$ 553$ (875)$ 3,815$ (1,276)$
Less: (Provision for) / Benefit from income taxes 34 (182) (813) (862) (160)
Income / (Loss) before income taxes 1,084$ 735$ (62)$ 4,677$ (1,116)$
Less: Special items pre-tax 3,480 106 3,193 (295) (2,246)
Income / (Loss) before special items pre-tax (2,396)$ 629$ (3,255)$ 4,972$ 1,130$
Less: Interest on debt (450) (453) (677) (926) (1,649)
Adjusted EBIT (Non-GAAP) (1,946)$ 1,082$ (2,578)$ 5,898$ 2,779$
Memo:
Revenue ($B) 19.4$ 26.8$ 53.7$ 63.0$ 127.1$
Net income / (loss) margin (GAAP) (%) 5.8 % 2.1 % (1.6) % 6.1 % (1.0) %
Adjusted EBIT margin (%) (10.0) 4.0 (4.8) 9.4 2.2
Second Quarter First Half
Company
50
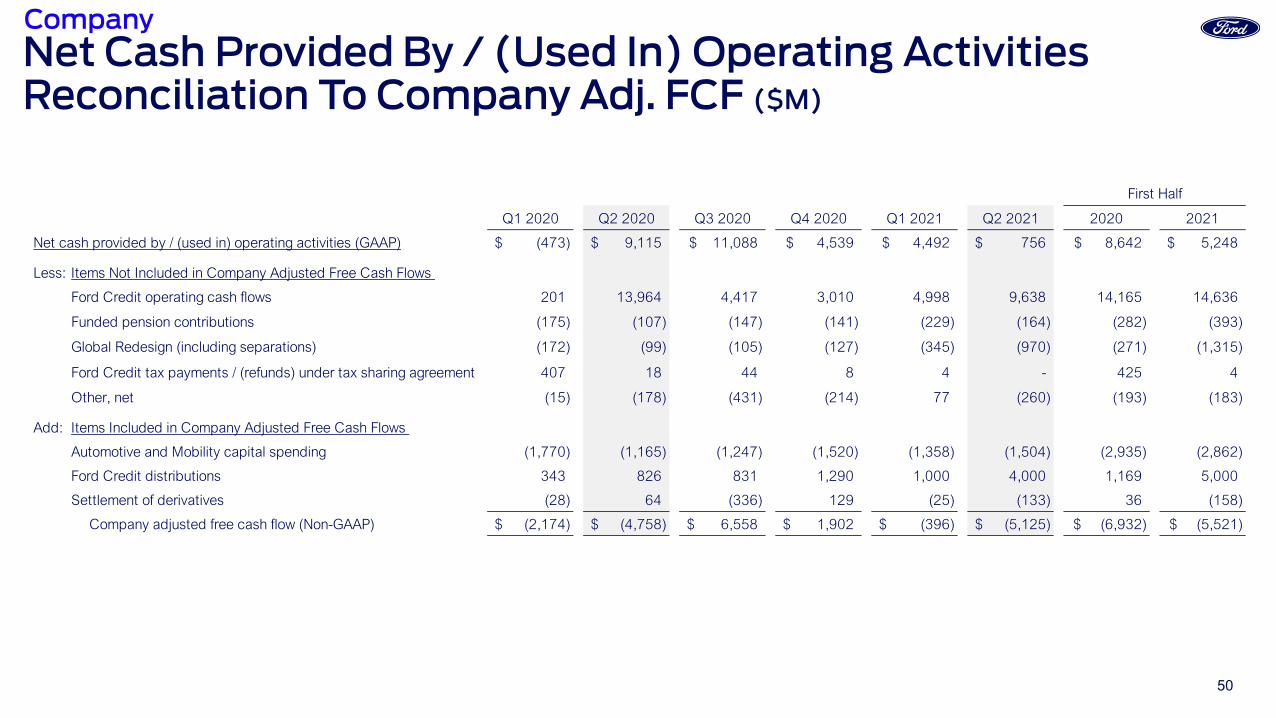
Net Cash Provided By / (Used In) Operating Activities Reconciliation To Company Adj. FCF ($M)
Q1 2020 Q2 2020 Q3 2020 Q4 2020 Q1 2021 Q2 2021 2020 2021
Net cash provided by / (used in) operating activities (GAAP) (473)$ 9,115$ 11,088$ 4,539$ 4,492$ 756$ 8,642$ 5,248$
Less: Items Not Included in Company Adjusted Free Cash Flows
Ford Credit operating cash flows 201 13,964 4,417 3,010 4,998 9,638 14,165 14,636
Funded pension contributions (175) (107) (147) (141) (229) (164) (282) (393)
Global Redesign (including separations) (172) (99) (105) (127) (345) (970) (271) (1,315)
Ford Credit tax payments / (refunds) under tax sharing agreement 407 18 44 8 4 - 425 4
Other, net (15) (178) (431) (214) 77 (260) (193) (183)
Add: Items Included in Company Adjusted Free Cash Flows
Automotive and Mobility capital spending (1,770) (1,165) (1,247) (1,520) (1,358) (1,504) (2,935) (2,862)
Ford Credit distributions 343 826 831 1,290 1,000 4,000 1,169 5,000
Settlement of derivatives (28) 64 (336) 129 (25) (133) 36 (158)
Company adjusted free cash flow (Non-GAAP) (2,174)$ (4,758)$ 6,558$ 1,902$ (396)$ (5,125)$ (6,932)$ (5,521)$
First Half
Company
51
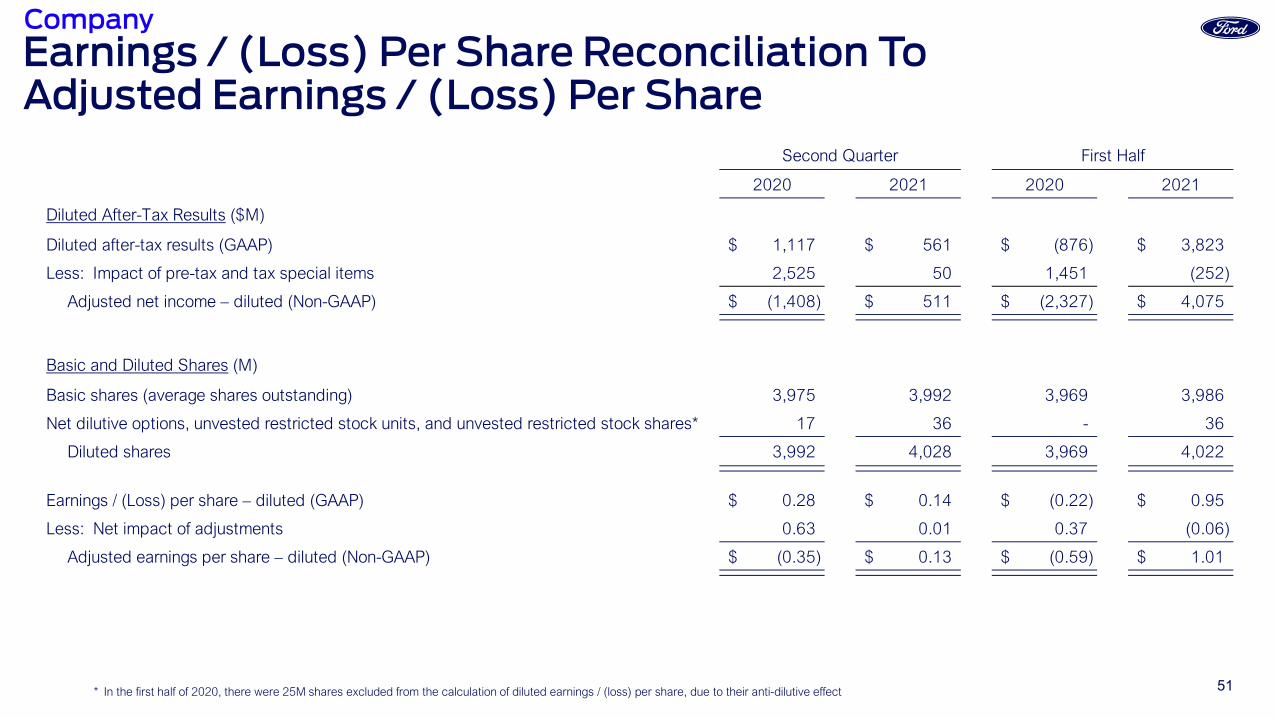
Earnings / (Loss) Per Share Reconciliation ToAdjusted Earnings / (Loss) Per Share
* In the first half of 2020, there were 25M shares excluded from the calculation of diluted earnings / (loss) per share, due to their anti-dilutive effect
2020 2021 2020 2021
Diluted After-Tax Results ($M)
Diluted after-tax results (GAAP) 1,117$ 561$ (876)$ 3,823$
Less: Impact of pre-tax and tax special items 2,525 50 1,451 (252)
Adjusted net income – diluted (Non-GAAP) (1,408)$ 511$ (2,327)$ 4,075$
Basic and Diluted Shares (M)
Basic shares (average shares outstanding) 3,975 3,992 3,969 3,986
Net dilutive options, unvested restricted stock units, and unvested restricted stock shares* 17 36 - 36
Diluted shares 3,992 4,028 3,969 4,022
Earnings / (Loss) per share – diluted (GAAP) 0.28$ 0.14$ (0.22)$ 0.95$
Less: Net impact of adjustments 0.63 0.01 0.37 (0.06)
Adjusted earnings per share – diluted (Non-GAAP) (0.35)$ 0.13$ (0.59)$ 1.01$
Second Quarter First Half
Company
52
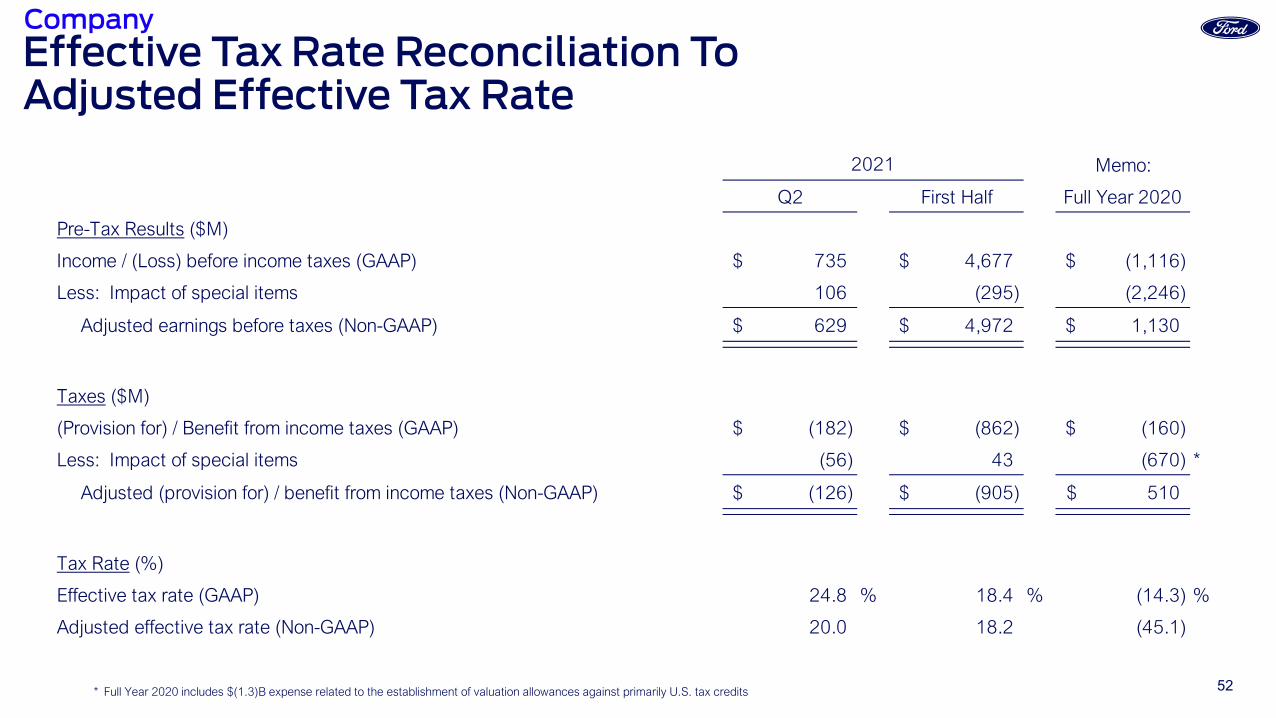
Effective Tax Rate Reconciliation ToAdjusted Effective Tax Rate
* Full Year 2020 includes $(1.3)B expense related to the establishment of valuation allowances against primarily U.S. tax credits
Memo:
Q2 First Half Full Year 2020
Pre-Tax Results ($M)
Income / (Loss) before income taxes (GAAP) 735$ 4,677$ (1,116)$
Less: Impact of special items 106 (295) (2,246)
Adjusted earnings before taxes (Non-GAAP) 629$ 4,972$ 1,130$
Taxes ($M)
(Provision for) / Benefit from income taxes (GAAP) (182)$ (862)$ (160)$
Less: Impact of special items (56) 43 (670) *
Adjusted (provision for) / benefit from income taxes (Non-GAAP) (126)$ (905)$ 510$
Tax Rate (%)
Effective tax rate (GAAP) 24.8 % 18.4 % (14.3) %
Adjusted effective tax rate (Non-GAAP) 20.0 18.2 (45.1)
2021
Company
53* Calculated as the sum of net operating profit / (loss) after cash tax from the last four quarters, divided by the average invested capital over the last four quarters** Calculated as the sum of adjusted net operating profit / (loss) after cash tax from the last four quarters, divided by the average invested capital over the last four quarters
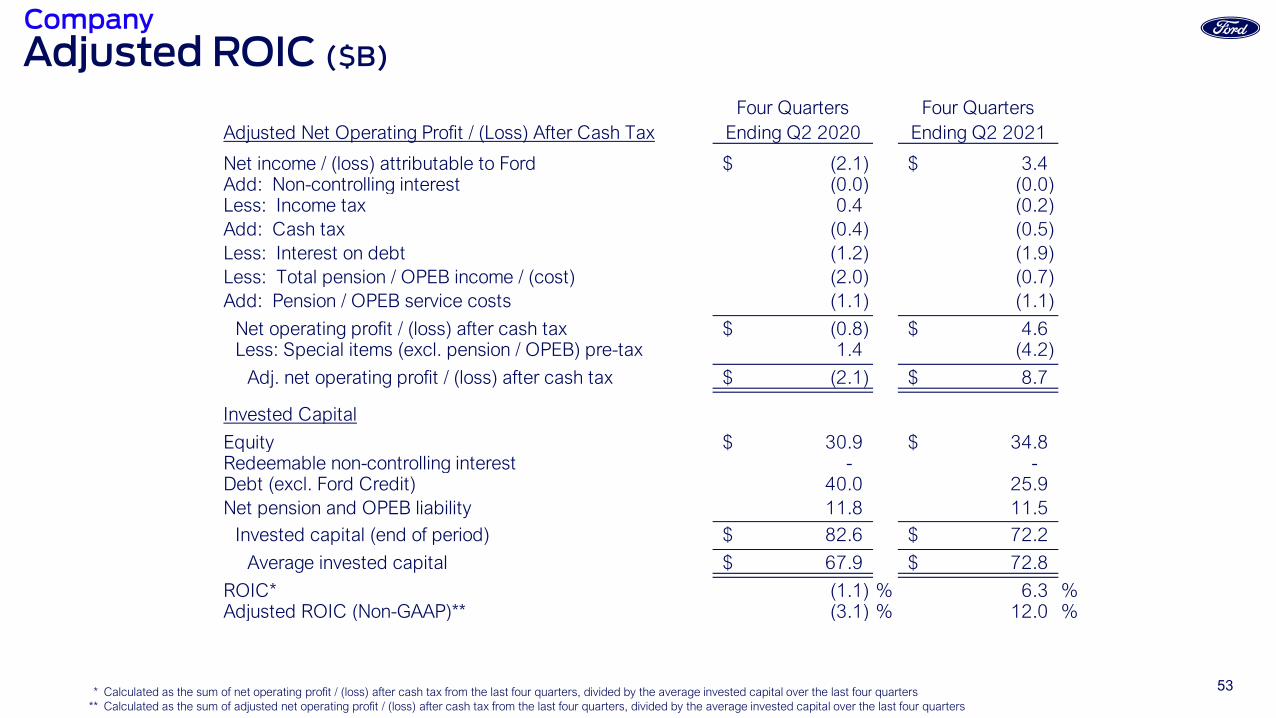
Adjusted ROIC ($B)Four Quarters Four Quarters
Adjusted Net Operating Profit / (Loss) After Cash Tax Ending Q2 2020 Ending Q2 2021
Net income / (loss) attributable to Ford (2.1)$ 3.4$ Add: Non-controlling interest (0.0) (0.0) Less: Income tax 0.4 (0.2) Add: Cash tax (0.4) (0.5) Less: Interest on debt (1.2) (1.9) Less: Total pension / OPEB income / (cost) (2.0) (0.7) Add: Pension / OPEB service costs (1.1) (1.1)
Net operating profit / (loss) after cash tax (0.8)$ 4.6$ Less: Special items (excl. pension / OPEB) pre-tax 1.4 (4.2)
Adj. net operating profit / (loss) after cash tax (2.1)$ 8.7$
Invested Capital
Equity 30.9$ 34.8$ Redeemable non-controlling interest - - Debt (excl. Ford Credit) 40.0 25.9 Net pension and OPEB liability 11.8 11.5
Invested capital (end of period) 82.6$ 72.2$ Average invested capital 67.9$ 72.8$
ROIC* (1.1) % 6.3 %Adjusted ROIC (Non-GAAP)** (3.1) % 12.0 %
Company
54
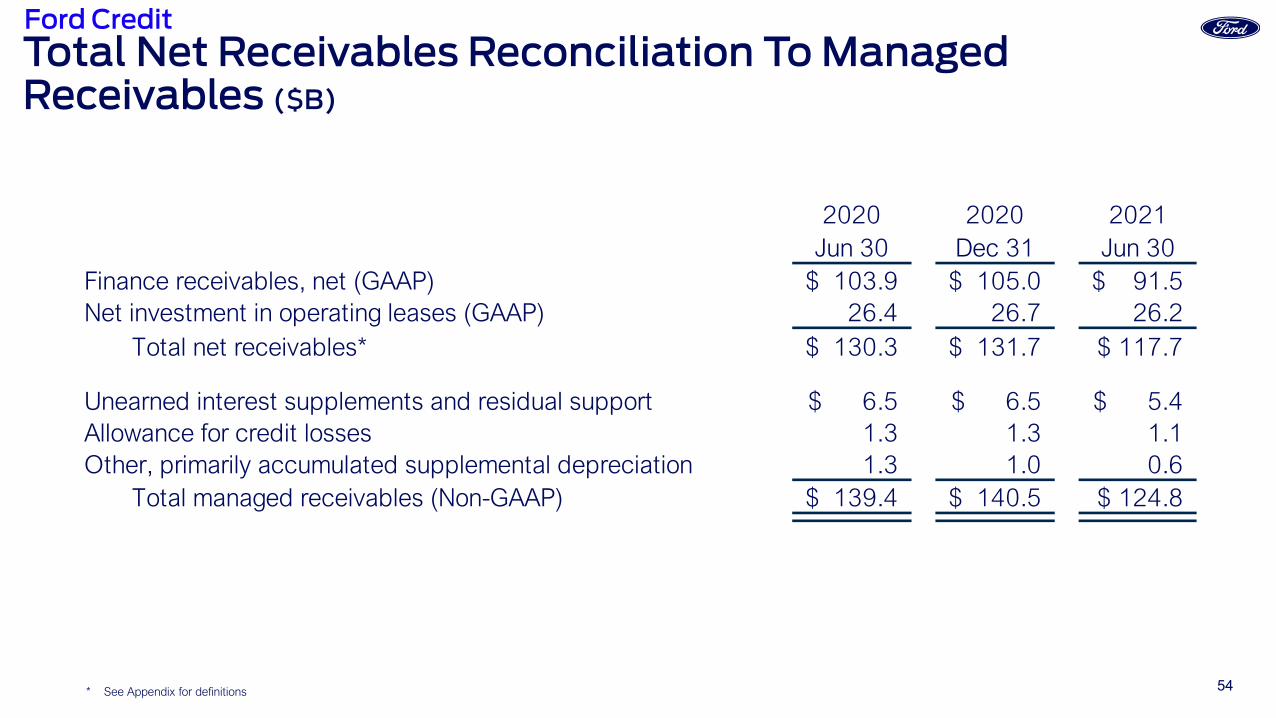
Total Net Receivables Reconciliation To Managed Receivables ($B)
2020 2020 2021Jun 30 Dec 31 Jun 30
Finance receivables, net (GAAP) 103.9$ 105.0$ 91.5$ Net investment in operating leases (GAAP) 26.4 26.7 26.2
Total net receivables* 130.3$ 131.7$ 117.7$
Unearned interest supplements and residual support 6.5$ 6.5$ 5.4$ Allowance for credit losses 1.3 1.3 1.1 Other, primarily accumulated supplemental depreciation 1.3 1.0 0.6
Total managed receivables (Non-GAAP) 139.4$ 140.5$ 124.8$
* See Appendix for definitions
Ford Credit
55
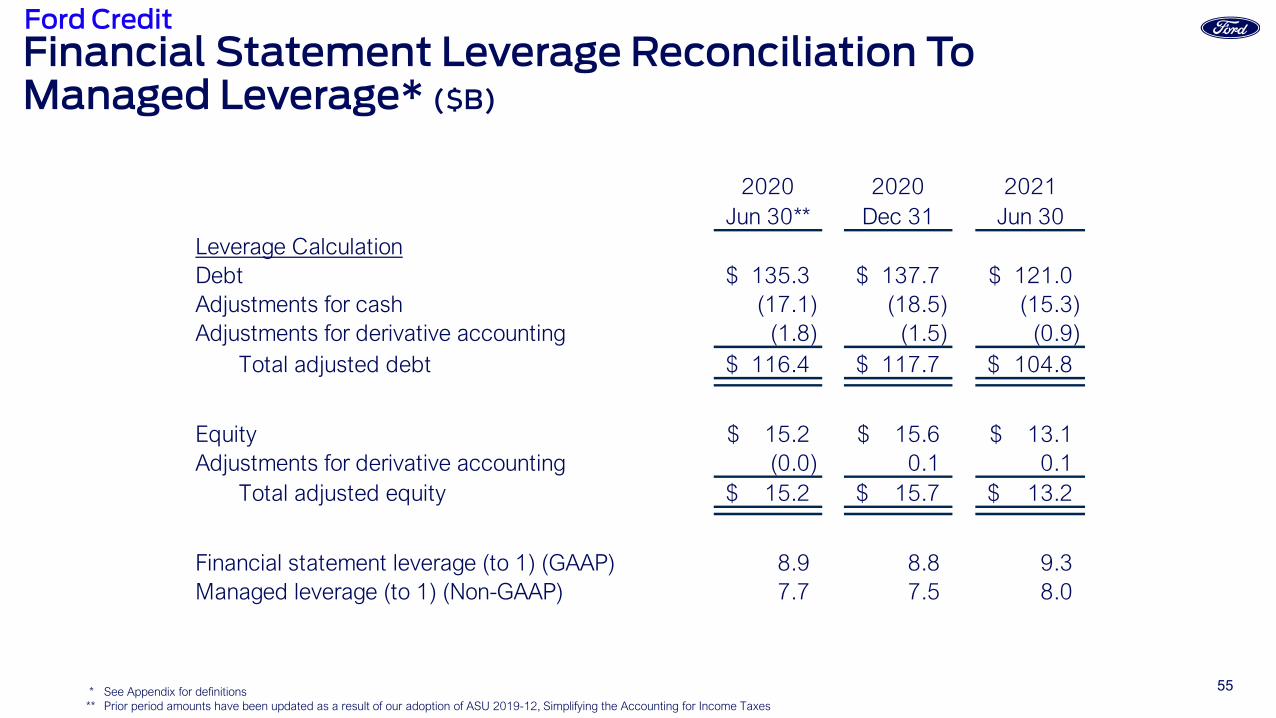
Financial Statement Leverage Reconciliation To Managed Leverage* ($B)
2020 2020 2021Jun 30** Dec 31 Jun 30
Leverage CalculationDebt 135.3$ 137.7$ 121.0$ Adjustments for cash (17.1) (18.5) (15.3) Adjustments for derivative accounting (1.8) (1.5) (0.9)
Total adjusted debt 116.4$ 117.7$ 104.8$
Equity 15.2$ 15.6$ 13.1$ Adjustments for derivative accounting (0.0) 0.1 0.1
Total adjusted equity 15.2$ 15.7$ 13.2$
Financial statement leverage (to 1) (GAAP) 8.9 8.8 9.3 Managed leverage (to 1) (Non-GAAP) 7.7 7.5 8.0
* See Appendix for definitions** Prior period amounts have been updated as a result of our adoption of ASU 2019-12, Simplifying the Accounting for Income Taxes
Ford Credit
56
Non-GAAP Financial Measures That SupplementGAAP Measures
We use both GAAP and non-GAAP financial measures for operational and financial decision making, and to assess Company and segment business performance. The non-GAAP measures listed below are intended to be considered by users as supplemental information to their equivalent GAAP measures, to aid investors in better understanding our financial results. We believe that these non-GAAP measures provide useful perspective on underlying business results and trends, and a means to assess our period-over-period results. These non-GAAP measures should not be considered as a substitute for, or superior to, measures of financial performance prepared in accordance with GAAP. These non-GAAP measures may not be the same as similarly titled measures used by other companies due to possible differences in method and in items or events being adjusted.
• Company Adjusted EBIT (Most Comparable GAAP Measure: Net income / (Loss) attributable to Ford) – Earnings Before Interest and Taxes (EBIT) excludes interest on debt (excl. Ford Credit Debt), taxes and pre-tax special items. This non-GAAP measure is useful to management and investors because it allows users to evaluate our operating results aligned with industry reporting. Our management ordinarily excludes special items from its review of the results of the operating segments for purposes of measuring segment profitability and allocating resources. Pre-tax special items consist of (i) pension and OPEB remeasurement gains and losses, (ii) significant personnel expenses, dealer-related costs, and facility-related charges stemming from our efforts to match production capacity and cost structure to market demand and changing model mix, and (iii) other items that we do not necessarily consider to be indicative of earnings from ongoing operating activities. When we provide guidance for adjusted EBIT, we do not provide guidance on a net income basis because the GAAP measure will include potentially significant special items that have not yet occurred and are difficult to predict with reasonable certainty prior to year-end, including pension and OPEB remeasurement gains and losses.
• Company Adjusted EBIT Margin (Most Comparable GAAP Measure: Company Net Income / (Loss) Margin) – Company Adjusted EBIT Margin is Company Adjusted EBIT divided by Company revenue. This non-GAAP measure is useful to management and investors because it allows users to evaluate our operating results aligned with industry reporting.
• Adjusted Earnings / (Loss) Per Share (Most Comparable GAAP Measure: Earnings / (Loss) Per Share) – Measure of Company’s diluted net earnings / (loss) per share adjusted for impact of pre-tax special items (described above), tax special items and restructuring impacts in noncontrolling interests. The measure provides investors with useful information to evaluate performance of our business excluding items not indicative of the underlying run rate of our business. When we provide guidance for adjusted earnings / (loss) per share, we do not provide guidance on an earnings / (loss) per share basis because the GAAP measure will include potentially significant special items that have not yet occurred and are difficult to predict with reasonable certainty prior to year-end, including pension and OPEB remeasurement gains and losses.
• Adjusted Effective Tax Rate (Most Comparable GAAP Measure: Effective Tax Rate) – Measure of Company’s tax rate excluding pre-tax special items (described above) and tax special items. The measure provides an ongoing effective rate which investors find useful for historical comparisons and for forecasting. When we provide guidance for adjusted effective tax rate, we do not provide guidance on an effective tax rate basis because the GAAP measure will include potentially significant special items that have not yet occurred and are difficult to predict with reasonable certainty prior to year-end, including pension and OPEB remeasurement gains and losses.
57
Non-GAAP Financial Measures That SupplementGAAP Measures
• Company Adjusted Free Cash Flow (FCF) (Most Comparable GAAP Measure: Net Cash Provided By / (Used In) Operating Activities) – Measure of Company’s operating cash flow excluding Ford Credit’s operating cash flows. The measure contains elements management considers operating activities, including Automotive and Mobility capital spending, Ford Credit distributions to its parent, and settlement of derivatives. The measure excludes cash outflows for funded pension contributions, global redesign (including separations), and other items that are considered operating cash flows under GAAP. This measure is useful to management and investors because it is consistent with management’s assessment of the Company’s operating cash flow performance. When we provide guidance for Company Adjusted FCF, we do not provide guidance for net cash provided by / (used in) operating activities because the GAAP measure will include items that are difficult to quantify or predict with reasonable certainty, including cash flows related to the Company's exposures to foreign currency exchange rates and certain commodity prices (separate from any related hedges), Ford Credit's operating cash flows, and cash flows related to special items, including separation payments, each of which individually or in the aggregate could have a significant impact to our net cash provided by / (used in) our operating activities.
• Adjusted ROIC – Calculated as the sum of adjusted net operating profit / (loss) after-cash tax from the last four quarters, divided by the average invested capital over the last four quarters. This calculation provides management and investors with useful information to evaluate the Company’s after-cash tax operating return on its invested capital for the period presented. Adjusted net operating profit / (loss) after-cash tax measures operating results less special items, interest on debt (excl. Ford Credit Debt), and certain pension / OPEB costs. Average invested capital is the sum of average balance sheet equity, debt (excl. Ford Credit Debt), and net pension / OPEB liability.
• Ford Credit Managed Receivables – (Most Comparable GAAP Measure: Net Finance Receivables plus Net Investment in Operating Leases) – Measure of Ford Credit’s total net receivables and held-for-sale receivables, excluding unearned interest supplements and residual support, allowance for credit losses, and other (primarily accumulated supplemental depreciation).The measure is useful to management and investors as it closely approximates the customer’s outstanding balance on the receivables, which is the basis for earning revenue.
• Ford Credit Managed Leverage (Most Comparable GAAP Measure: Financial Statement Leverage) – Ford Credit’s debt-to-equity ratio adjusted (i) to exclude cash, cash equivalents, and marketable securities (other than amounts related to insurance activities), and (ii) for derivative accounting. The measure is useful to investors because it reflects the way Ford Credit manages its business. Cash, cash equivalents, and marketable securities are deducted because they generally correspond to excess debt beyond the amount required to support operations and on-balance sheet securitization transactions. Derivative accounting adjustments are made to asset, debt, and equity positions to reflect the impact of interest rate instruments used with Ford Credit’s term-debt issuances and securitization transactions. Ford Credit generally repays its debt obligations as they mature, so the interim effects of changes in market interest rates are excluded in the calculation of managed leverage.
58
Definitions And CalculationsWholesale Units and Revenue
• Wholesale unit volumes include all Ford and Lincoln badged units (whether produced by Ford or by an unconsolidated affiliate) that are sold to dealerships, units manufactured by Ford that are sold to other manufacturers, units distributed by Ford for other manufacturers, and local brand units produced by our China joint venture, Jiangling Motors Corporation, Ltd. (“JMC”), that are sold to dealerships. Vehicles sold to daily rental car companies that are subject to a guaranteed repurchase option (i.e., rental repurchase), as well as other sales of finished vehicles for which the recognition of revenue is deferred (e.g., consignments), also are included in wholesale unit volumes. Revenue from certain vehicles in wholesale unit volumes (specifically, Ford badged vehicles produced and distributed by our unconsolidated affiliates, as well as JMC brand vehicles) are not included in our revenue
Industry Volume and Market Share
• Industry volume and market share are based, in part, on estimated vehicle registrations; includes medium and heavy-duty trucks
SAAR
• SAAR means seasonally adjusted annual rate
Company Cash
• Company cash includes cash, cash equivalents, marketable securities and restricted cash; excludes Ford Credit’s cash, cash equivalents, marketable securities and restricted cash
Market Factors
• Volume and Mix – primarily measures EBIT variance from changes in wholesale unit volumes (at prior-year average contribution margin per unit) driven by changes in industry volume, market share, and dealer stocks, as well as the EBIT variance resulting from changes in product mix, including mix among vehicle lines and mix of trim levels and options within a vehicle line
• Net Pricing – primarily measures EBIT variance driven by changes in wholesale unit prices to dealers and marketing incentive programs such as rebate programs, low-rate financing offers, special lease offers and stock accrual adjustments on dealer inventory
• Market Factors exclude the impact of unconsolidated affiliate wholesale units
Earnings Before Taxes (EBT)
• Reflects Income before income taxes
Pension Funded Status
• Current period balances reflect net underfunded status at December 31, 2020, updated for service and interest cost, expected return on assets, curtailment and settlement gains and associated interim remeasurement (where applicable), separation expense, actual benefit payments, and cash contributions. For plans without interim remeasurement, the discount rate and rate of expected return assumptions are unchanged from year-end 2020
Records
• References to Company, Automotive segment and business unit records are since at least 2009
Company
59
Definitions And CalculationsABS capacity in excess of eligible receivables and other adjustments (as shown on the Liquidity Sources chart)
Includes asset-backed capacity in excess of eligible receivables; cash related to the Ford Credit Revolving Extended Variable-util ization program (“FordREV”), which can be accessed through future sales of receivables
Assets (as shown on the Cumulative Maturities chart)
Includes gross finance receivables less the allowance for credit losses, investment in operating leases net of accumulated depreciation, cash and cash equivalents, and marketable securities (excluding amounts related to insurance activities). Amounts shown include the impact of expected prepayments
Cash (as shown on the Funding Structure, Liquidity Sources and Leverage charts)
Cash and cash equivalents and Marketable securities reported on Ford Credit’s balance sheet, excluding amounts related to insurance activities
Debt (as shown on the Cumulative Maturities chart)
All wholesale securitization transactions are shown maturing in the next 12 months, even if the maturities extend beyond Q1 2022. Also, the chart reflects adjustments to debt maturities to match the asset-backed debt maturities with the underlying asset maturities
Debt (as shown on the Leverage chart)
Debt on Ford Credit’s balance sheet. Includes debt issued in securitizations and payable only out of collections on the underlying securitized assets and related enhancements. Ford Credit holds the right to receive the excess cash flows not needed to pay the debt issued by, and other obligations of, the securitization entities that are parties to those securitization transactions
Committed Asset-Backed Security (“ABS”) Facilities (as shown on the Liquidity Sources chart)
Committed ABS facilities are subject to availability of sufficient assets, ability to obtain derivatives to manage interest rate risk, and exclude FCE Bank plc (“FCE”) access to the Bank of England’s Discount Window Facility
Earnings Before Taxes (“EBT”)
Reflects Income before income taxes as reported on Ford Credit’s income statement
Net Charge-Offs
Net charge-off changes are primarily driven by the number of repossessions, severity per repossession, and recoveries.
Securitization & restricted cash (as shown on the Liquidity Sources chart)
Securitization cash is cash held for the benefit of the securitization investors (for example, a reserve fund). Restricted cash is primarily held to meet certain local government and regulatory reserve requirements and cash held under the terms of certain contractual agreements
Securitizations (as shown on the Public Term Funding Plan chart)
Public securitization transactions, Rule 144A offerings sponsored by Ford Credit, and widely distributed offerings by Ford Credit Canada
Term Asset-Backed Securities (as shown on the Funding Structure chart)
Obligations issued in securitization transactions that are payable only out of collections on the underlying securitized assets and related enhancements
Total net receivables (as shown on the Total Net Receivables Reconciliation To Managed Receivables chart)
Includes finance receivables (retail financing and wholesale) sold for legal purposes and net investment in operating leases included in securitization transactions that do not satisfy the requirements for accounting sale treatment. These receivables and operating leases are reported on Ford Credit’s balance sheet and are available only for payment of the debt issued by, and other obligations of, the securitization entities that are parties to those securitization transactions; they are not available to pay the other obligations of Ford Credit or the claims of Ford Credit’s other creditors
Unallocated other (as shown on the EBT By Segment chart)
Items excluded in assessing segment performance because they are managed at the corporate level, including market valuation adjustments to derivatives and exchange-rate fluctuations on foreign currency-denominated transactions
Ford Credit
60
Product Notes2022 Ford Lightning (shown on slide 5)
• Preproduction computer-generated image shown; available starting Spring 2022
2022 Ford E-Transit (shown on slide 5)
• Preproduction computer-generated image shown; available late 2021
2022 Ford Lightning (shown on Appendix Cover)
• Preproduction computer-generated image shown; available Spring 2022
2022 Ford Maverick (shown on Appendix Cover)
• Preproduction image; available Fall 2021
Company