Embed Size (px)
Citation preview

EFFECT OF CAPITAL STRUCTURE ON
FINANCIAL DISTRESS OF NON-FINANCIAL
COMPANIES LISTED IN NAIROBI
SECURITIES EXCHANGE
ROBERT GITAU MUIGAI
DOCTOR OF PHILOSOPHY
(Finance)
JOMO KENYATTA UNIVERSITY OF
AGRICULTURE AND TECHNOLOGY
2016


Effect of Capital Structure on Financial Distress of Non-Financial
Companies Listed in Nairobi Securities Exchange
Robert Gitau Muigai
A Thesis submitted in partial fulfillment for the degree of Doctor of
Philosophy in Finance in the Jomo Kenyatta University of Agriculture
and Technology
2016


ii
DECLARATION
This thesis is my original work and has not been presented for a degree in any other
university.
Signature ……………………………. Date ……………………………. ………….
Robert Gitau Muigai
This thesis has been submitted for examination with our approval as university
supervisors
Signature ……………………………. Date ……………………………………
Dr. Tabitha Nasieku
JKUAT, Kenya
Signature ……………………………. Date ……………………………………
Dr. Stella Muhanji
Kabarak University, Kenya

iii
DEDICATION
This thesis is dedicated to my family that comprises my lovely wife, Sarah, beautiful
daughters: Precious Wanjiru and Angel Nyambura and my son Silver Muigai to whom I
remain indebted for their incessant support and prayers.

iv
ACKNOWLEDGEMENT
I acknowledge the Almighty God for giving me the grace to write this thesis.
Specifically, I thank Him for giving me the scholarly ideas and according me good
health throughout my studies. Secondly, I thank my family that comprise my lovely wife
Sarah, daughters Precious and Angel and my son Silver for giving me support and
encouragement to pursue this level of study.
I sincerely thank my supervisors for their scholarly guidance in the course of this study.
I particularly thank Dr. Tabitha Nasieku for creating time to review the drafts
meticulously and providing quick response and guidance. I also thank Dr. Stella
Muhanji for her commitment and dedication to work with me during various stages of
writing this thesis and for giving it an analytical and professional look. The two
supervisors guided me so well that without their stewardship, the outcome of this work
would have been different.
Special thanks also goes to JKUAT Management and members of staff for providing a
conducive learning environment that has enabled me access useful scholarly materials
and resources. I particularly applaud the Library staff for their dedication in ensuring
adequate connectivity to internet and comfort whenever I visited the facility.

v
TABLE OF CONTENTS
DECLARATION ............................................................................................................ ii
DEDICATION ............................................................................................................... iii
ACKNOWLEDGEMENT ............................................................................................. iv
TABLE OF CONTENTS .................................................................................................v
LIST OF TABLES ......................................................................................................... xi
LIST OF FIGURES ...................................................................................................... xii
LIST OF APPENDICES .............................................................................................. xiii
ABBREVIATIONS ...................................................................................................... xiii
DEFINITION OF KEY TERMS ................................................................................... xv
ABSTRACT ................................................................................................................ xvii
CHAPTER ONE ..............................................................................................................1
INTRODUCTION ...........................................................................................................1
1.1 Background of the Study ......................................................................................1
1.1.1 Capital Structure and Corporate Financial Distress .......................................2
1.1.2 Capital Structure of Non-financial Firms Listed in Kenya .............................3
1.2 Statement of the Problem .....................................................................................5

vi
1.3 Objectives of the Study........................................................................................ 7
1.3.1 General Objective ................................................................................................ 7
1.3.2 Specific Objectives .............................................................................................. 7
1.4 Research Hypotheses ........................................................................................... 8
1.5 Significance of the Study ..................................................................................... 9
1.6 Scope of the Study ............................................................................................... 9
1.7 Limitations of the Study .................................................................................... 10
CHAPTER TWO ........................................................................................................... 11
LITERATURE REVIEW ............................................................................................. 11
2.1 Introduction ....................................................................................................... 11
2.2 Theoretical Framework...................................................................................... 11
2.2.1 Capital Structure Irrelevance Hypothesis .................................................... 12
2.2.2 Trade-off Theory of Capital Structure ......................................................... 13
2.2.3 Pecking Order Theory ................................................................................ 16
2.3 Conceptual Framework...................................................................................... 18
2.4 Review of Literature on Variables ..................................................................... 20
2.4.1 Financial Leverage and Financial Distress .................................................. 20

vii
2.4.2 Debt Maturity and Financial Distress .......................................................... 26
2.4.3 Equity Structure and Financial Distress ....................................................... 29
2.4.4 Asset Structure and Financial Distress ........................................................ 32
2.4.5 Firm Size and Financial Distress ................................................................. 33
2.4.6 Listing Sector and Financial Distress .......................................................... 38
2.4.7 Financial Distress ....................................................................................... 41
2.5 Critique of Existing Literature ........................................................................... 46
2.6 Research Gaps ................................................................................................... 47
2.7 Summary ........................................................................................................... 48
CHAPTER THREE ....................................................................................................... 49
RESEARCH METHODOLOGY .................................................................................. 49
3.1 Introduction ....................................................................................................... 49
3.2 Research Design ................................................................................................ 49
3.3 Target Population .............................................................................................. 49
3.4 Sampling Frame ................................................................................................. 51
3.5 Census ............................................................................................................... 51
3.6 Data Collection Instrument ................................................................................ 51

viii
3.7 Data Collection Procedure ................................................................................. 51
3.8 Pilot Study......................................................................................................... 52
3.9 Data Analysis and Presentation .......................................................................... 52
3.9.1 Measurement of Study Variables ................................................................ 53
3.9.2 Panel Regression Model Estimation ........................................................... 59
3.9.3 Statistical Model......................................................................................... 63
CHAPTER FOUR ......................................................................................................... 65
RESULTS AND DISCUSSIONS .................................................................................. 65
4.1 Introduction ....................................................................................................... 65
4.2 Findings of Descriptive Statistics ....................................................................... 65
4.3 Panel Data Specification Tests ........................................................................... 77
4.3.1 Panel Data Normality Test .......................................................................... 78
4.3.2 Panel Unit Root Test .................................................................................. 84
4.3.3 Panel Multicollinearity Test........................................................................ 86
4.3.4 Panel-level Heterescedasticity Test ............................................................. 90
4.3.5 Serial Correlation Test ................................................................................ 92
4.3.6 Panel Cointegration Test ............................................................................ 93

ix
4.3.7 The Hausman Test for Model Effects Estimation ........................................ 95
4.4 Panel Regression Analysis ................................................................................. 98
4.4.1 Effect of Capital Structure on Financial Distress ......................................... 99
4.4.2 Effect of Financial Leverage on Financial Distress.................................... 103
4.4.3 Effect of Debt Maturity on Financial Distress ........................................... 104
4.3.4 Effect of Equity Structure on Financial Distress ........................................ 105
4.3.5 Effect of Asset Structure on Financial Distress.......................................... 106
4.3.6 Effect of Firm Size on Financial Distress .................................................. 107
4.3.7 Effect of Listing Sector on Financial Distress ........................................... 113
4.3.8 Effect of Sales Growth on Financial Distress ............................................ 119
4.3.9 Hypothesis Testing Results ....................................................................... 120
CHAPTER FIVE ......................................................................................................... 124
SUMMARY, CONCLUSION AND RECOMMENDATIONS .................................. 124
5.1 Introduction ..................................................................................................... 124
5.2 Summary of Findings ....................................................................................... 124
5.3 Conclusions ..................................................................................................... 126
5.4 Recommendations............................................................................................ 128

x
5.5 Areas for Further Research .............................................................................. 130
REFERENCES ............................................................................................................ 131
APPENDICES ............................................................................................................. 149

xi
LIST OF TABLES
Table 3.1: Non-Financial Firms Listed In Nse By Sectors ................................50
Table 3.2: Summary Measurement Of Research Variables ................................58
Table 4.1 Panel Variables Summary Statistics (Overall) ...................................66
Table 4.3 Sector-Wise Summary Statistics For Financial Leverage ..................71
Table 4.4: Sector-Wise Summary Statistics For Debt Maturity ..........................72
Table 4.5: Sector-Wise Summary Statistics For Equity Structure .......................74
Table 4.6: Sector-Wise Summary Statistics For Asset Structure ........................75
Table 4.7: Sector-Wise Summary Statistics For Other Variables .......................76
Table 4.8: Panel Variables Skewedness/Kurtosis Tests For Normality ...............78
Table 4.9 Summary Statistics For The Variables Without Outliers ...................83
Table 4.10: Panel Unit Root Test Results ...........................................................85
Table 4.12: Post-Estimation Variance Inflation Factor Results ............................90
Table 4.13: Modified Wald Test Results For Panel-Level Heteroscedasticity ......91
Table 4.14: Wooldridge Test Results For Serial Correlation ................................92
Table 4.15: Johansen Test For Cointegration Results ...........................................94
Table 4.16: Hausman Test Results .......................................................................96
Table 4.17: Sector-Wise Hausman Specification Test Results .............................97
Table 4.18: Sector-Wise Panel Regression Estimation Effects .............................98
Table 4.19 FGLS Random- Effects Panel Regression Results ........................... 100
Table 4.20: FGLS Step-Wise Panel Regression Results For Random Effects ..... 102
Table 4.21: FGLS Panel Regression Results of The Un-Moderated Model ....... 108
Table 4.22: FGLS Panel Regression Results Moderated By Firm Size ........... …109
Table 4.23: Sector-wise Panel Regression results (with robust std. errors) ....... .117

xii
LIST OF FIGURES
Figure 2.1: Conceptual Framework ................................................................... 19
Figure 4.1: debt box plots .................................................................................. 79
Figure 4.2: Total Equity box plots ..................................................................... 80
Figure 4.3: Internal Equity box plots .................................................................. 80
Figure 4.4: External Equity box plots ................................................................. 81
Figure 4.5: Sales growth Box Plots ..................................................................... 81
Figure 4.6: Financial Distress box plots .............................................................. 82

xiii
LIST OF APPENDICES
Appendix I: Study Population .................................................................................... 149
Appendix II: Secondary Data Collection Instrument .................................................. 151
Appendix III: Panel Data ........................................................................................... 152
Appendix IV4: Altman‟s Z-Score Model For The Emerging Markets......................... 167
Appendix V (A): Variables Data Plots By Firm ......................................................... 168
Appendix V (C): Variables Data Plots By Firm .......................................................... 170
Appendix V (D): Variables Data Plots By Firm ......................................................... 171

xiv
ABBREVIATIONS
CBK Central Bank of Kenya
CMA Capital Markets Authority
EBIT Earnings before Interest and Taxes
EPS Earnings per Share
EVA Economic Value Added
FGLS Feasible Generalized Least Squares
IPO Initial Public Offer
IRA Insurance Regulatory Authority
JKUAT Jomo Kenyatta University of Agriculture and Technology
JSE Johannesburg Stocks Exchange
KPCU Kenya Planters Cooperative Union
MDA Multivariate Discriminant Analysis
NSE Nairobi Securities Exchange
OLS Ordinary Least Squares
P/E Price Earning
ROA Return on Assets
ROE Return on Equity
VAR Vector Autoregressive
VIF Variance Inflation Factor

xv
DEFINITION OF KEY TERMS
Arbitrage: Refers to a trade that profits by exploiting price differences of
identical or similar financial instruments, on different markets or
in different forms (Barclay, Heitzman, & Smith, 2013).
Asset Structure: is the extent to which corporations retain their asset investment
in one form or another (Cuong, 2014).
Capital Structure: Refers to the mix of the different forms of financing employed
by firms to finance their business operations (Aggarwal & Kyaw,
2006; Harris & Raviv, 1991)
Debt financing: is a form of financing procured externally by the business with a
requirement to be repaid at some future date (Salawu & Ile-Ife,
2007)
Debt Maturity: The period between procurement to repayment of debt capital
(Diamond, 1993).
Default: Is the situation in which a firm violates the debt
covenant with regard to repayment (Berger & Di Patti, 2006).
Equity financing: The form of business financing supplied by the owners of the
business (Pandey, 2009).
Equity Structure: The combination of internally generated funds and externally
issued equity used in financing business operations of the firm
(Bender, 2013).
Failure: A situation where the realized rate of return on invested capital is
significantly lower than the prevailing rates of similar
investments (Berger & Di Patti, 2006).
Financial Distress is a situation where a firm is unable to meet the financial
obligations as they mature or does so with difficulties. Usually,
the phenomenon may be heralded by insufficient cash flows,
decline in market value, profit breaches and low growth
(Andrade & Kaplan, 1998).

xvi
Financial Leverage: Use of fixed charge source of capital in relation to the owners‟
capital within the capital structure (Muritala, 2012)
Financial Risk: The exposure occasioned to the firm through use of fixed charge
source of capital such as debt as opposed to use of equity
(Gwatidzo & Ojah, 2014).
Firm Size: Represents how big or small a firm is; usually in terms of
investment in assets, turn-over or employment capacity
(Babalola, 2013)
Long-term debt: The portion of debt capital that is payable after twelve months of
the balance sheet date. Also called non-current debt (Ebaid,
2009)
Optimal Capital Structure: The level of equity and debt financing at which the value
of a firm is maximized (Peura & Keppo, 2006).
Sales growth: the change in year-on-year turnover realized by the firm (Cuong,
2014).
Short term debt: The portion of debt capital that becomes payable within twelve
months of the reporting date (Ebaid, 2009).
Tangibility: The extent to which corporations retain their asset investment in
fixed form (Cuong, 2014)

xvii
ABSTRACT
Since independence, Kenya has witnessed numerous cases of financial distress among
non-financial firms. This has been evidenced by some firms undertaking financial
restructuring and others been placed under receivership and subsequently delisted. This
situation does not only lead to loss of investors‟ wealth but also erode confidence in the
capital market. This study sought to investigate the effect of capital structure on
financial distress of non-financial companies listed in NSE. Different from the previous
studies that have mainly determined the effect of capital structure based on financial
performance measures such as profitability, liquidity and firm value, this study focused
directly on financial distress. In accomplishing this overall objective, the study sought to
establish the effect of financial leverage, debt maturity, equity structure and asset
structure on financial distress of non-financial firms. In addition, the study investigated
the moderating effect of firm size and the listing sector on the relationship between
capital structure and financial distress of the firms. The study employed secondary data
extracted from audited financial statements and annual reports of individual companies
for the ten - year period covering 2004 – 2013 (both years inclusive). The study was
undertaken using quantitative research design. A census of all the 41 non-financial
companies listed in NSE as at December 2013 constituted target population. Descriptive
statistics and panel regression analysis techniques were used to analyze the data. F-test
was used to determine the significance of the overall model; while significance of
individual variables was determined by t-test. The study concluded that financial
leverage, asset tangibility and external equity have a significant negative effect on
financial distress of non-financial firms. Nevertheless, internal equity and long term debt
play a significant role in mitigating financial distress in non-financial firms. The study
further concluded that the firm size and the listing sector have significant moderating
effect on the relationship between capital structure and financial distress. Based on these
findings, the study recommends that in financing their firms, corporate managers should
adopt appropriate mix of different capital sources necessary to mitigate financial distress
of the firms. Particularly, long term debt and internal equity should be employed while

xviii
debt should be applied sparingly. In addition, corporations should avoid maintaining
large proportions of their asset investment in illiquid (fixed) form as this ties up
significant portion of productive capital. At policy level, the study recommends that
policy makers should initiate policies aimed at lowering the cost of debt financing and at
the same time encourage non-financial firms to plough back much of their profits to
finance the operations.

1
CHAPTER ONE
INTRODUCTION
1.1 Background of the Study
Capital structure constitutes the mix of the different forms of financing employed by the
firm to fund operations (Fabozzi & Drake, 2009). According to Pandey (2009), equity
and debt comprise the principal components of capital structure and represents the major
claims on the corporations‟ assets. Financial distress on the other hand has been defined
as the situation where the firm is unable to meet its financial obligations as they fall due
or does so with difficulties (Andrade & Kaplan, 1998). According to Whitaker (1999),
financially distressed firms are generally associated with insufficient cash flows, volatile
profitability and decline in assets-liability ratio. According to Rajan and Zingales
(1995), the financing factor plays a critical role in determining not only the interim
financial performance of the firm but also its long run survival.
In studying the effect of capital structure on corporations, trade-off theory and pecking
order hypotheses have been postulated as the two main schools of thought. The tradeoff
theory, propounded by Myers (1977) argue that employment of debt financing is
generally beneficial as a result of the associated tax-savings cash flows. Proponents of
this hypothesis opine that the present value of the resultant cash flows increases the
overall firm value and improves corporate financial stability. However, theorist note that
persistent employment of debt also increases their probability of financial distress. The
theory therefore advocates for existence of optimal capital structure which encompasses
the equilibrium mix of debt and equity financing.
The Pecking order theory, on the other hand provide for hierarchical order of preference
for different sources of capital available to the firm. According to Myers and Majluf
(1984), companies prefer internal capital ahead of external financing. The theorists
argued that internal capital is beneficial to the firm since it portends less costs of

2
information asymmetry between insiders and potential investors. The theory assert that
only when internal sources are depleted that firms exploit the less risky form of external
financing such as low-cost debt and subsequently external equity. The theory is
therefore instrumental in advancing the argument that different components of capital
structure affect corporate financial distress differently. It is however notable that
although the theory does not explicitly uphold existence of optimal capital structure, it
advocates for the need of managers to balance between different sources of capital
necessary to preserve financial stability.
1.1.1 Capital Structure and Corporate Financial Distress
Over the past decades, the world has with devastating effects witnessed numerous cases
of financial distress and subsequent failure among globally reputed corporations. These
entities that include: General Motors (2009), Swissair (2001), The CIT Group (2009),
Conseco (2002), Pacific Gas & Electric Ltd (2001), Delta Air lines (2005), Parmalat
(2003), Enron (2001) and WorldCom (2002) represented the icons of corporate financial
stability prior to filing for bankruptcy. Their collapse therefore came with tremendous
amazement to researchers, analysts and industry practitioners alike. This undesirable
phenomenon motivated finance scholars to commence research aimed at examining the
underlying causes of firm failure.
According to Outecheva (2007), corporate financial distress is mainly attributed to poor
governance, severe competition, adverse economic factors and the capital structure.
Parker, Peters, and Turetsky (2002) found that poor corporate governance that
encapsulate mismanagement precipitates fraud and corruption and ultimately drive firms
into financial failure. In their study, Kapopoulos and Lazaretou (2007) found that severe
industry competition leads to decline in sales turnover and hence reduced profitability
for the affected firms. The authors argued that if the situation is sustained, the firm
suffers from liquidity shortages that culminate in financial distress. In addition,
Whitaker (1999) found that prolonged period of adverse economic conditions such as

3
high market interest rates provide an uncomfortable environment for businesses to
operate. The author opined that this situation is a recipe for firm failure as it makes it
difficult for firms to achieve the budgeted profitability levels.
However, review of literature show that while subsequent studies have consistently
concluded that poor governance, severe competition and adverse economic factors are
significant contributors of financial distress, the effect of capital structure has been
debatable. Studies undertaken by Andrade and Kaplan (1998), Gupta, Srivastava, and
Sharma (2014) and Chen (2004) have provided evidence that use of debt financing
increases corporate financial distress. However, the findings of these studies are at
variance with the findings of studies carried out by Shehla Akhtar, Javed, Maryam, and
Sadia (2012), Ogbulu and Emeni (2012) and Ogundipe, Idowu, and Ogundipe (2012)
that found use of leverage to mitigate corporate financial distress. On the other hand,
studies taken by Ebaid (2009) and Modigliani and Miller (1958) concluded that the way
firms are financed does not affect the failure process.
These conflicting empirical results could be explained by the fact that the studies have
been based on specific financial distress indicators such as profitability, liquidity, firm
value and investment growth. A major limitation of these studies is that by using single
indicators of financial distress, the findings only provide short run information which
may change with time. This is in contrast with Sundararajan et al. (2002) who opined
that financial distress provides information concerning the overall financial health of the
firm and is therefore a good indicator of firm quality. Given this situation, it is necessary
to undertake an incisive study aimed at investigating the effect of capital structure on
financial distress directly.
1.1.2 Capital Structure of Non-financial Firms Listed in Kenya
Nairobi Securities Exchange (NSE) is the sole body mandated to list corporations in
Kenya. Incorporated in 1954, NSE is a body corporate established under the Companies

4
act (CAP 486) of the laws of Kenya and comprise of the licensed stock brokers as the
shareholders. While NSE is also publicly listed, it is mandated to facilitate and supervise
transactions carried out by investors of the listed companies. Another player in the
Kenyan capital market is the Capital Markets Authority (CMA). Formed in 1989, CMA
is charged with the role of regulating and licensing capital market players such as stock
brokers, the securities exchange (NSE) and the listed entities. As at 31st December 2013,
64 firms were listed in NSE across 10 sectors that included: Agriculture, Automobiles &
accessories, Commercial & services, Energy & Petroleum, Banking, Insurance,
Investments, Manufacturing & Allied, Construction and allied and Telecommunication
& Technology (CMA annual report, 2014). Among the listed firms, 22 were within the
banking and insurance sectors (financial firms) while 42 were listed within the non-
financial sectors.
The decision to base this study on non-financial firms derives from the fact that unlike
financial firms whose capital holding is strictly regulated by the CBK, capital holding
regulations do not apply among non-financial firms in spite of all listed firms falling
under the purview of CMA. This means that non-financial firms are technically at
liberty to adopt any capital structure configuration favorable to them in financing their
operations. This laissez-faire approach predisposes non-financial firms to possibilities of
over-gearing and subsequent distress (Bitok, Masulis, Graham, & Harvey, 2011).
Further, unlike in developed economies where capital market systems are relatively
elaborate, effective and quite efficient, the Kenyan capital market is still immature on
most fronts (Ongore, 2011). The corporate bond market is particularly at the infancy
stage and heralds relatively low participation level on the corporate bond segment
(Mwangi, Anyango, & Amenya, 2012). The implication is that whenever non-financial
firms are in need of additional debt capital, they naturally subscribe to commercial bank
loans as their main source of debt finance. Bank loans in Kenya are however
characterized with significantly high interest rate regime which further strains the
financial performance of non-financial firms (Magara, 2012).

5
The devastating effects of financial distress among non-financial firms listed in Kenya
has been highlighted over the past few decades. This is evidenced by the many firms
that have been placed under receivership, undertaking financial restructuring or being
delisted from NSE altogether. Such firms include: Uchumi Super Markets (2006),
KPCU (2009), East African Packaging (2003), Dunlop Kenya, Regent Undervalued
Assets Ltd (2001), Lonhro EA Ltd (2001), Theta Group (2001) among others (CMA
statistical bulletins, 2003 – 2009). Although subsequent investigative reports conducted
by government agencies have attributed this phenomenon to aggressive financing,
analysts and members of the public alike have discredited these explanation on grounds
of political expediency and lack of scholarly underpinning to support this assertion.
Among finance scholars, the debate is further complicated by the fact that the empirical
relationship between financial structure and financial distress indicators of corporations
is not clear. It is against this background that an investigation of the effect of capital
structure on financial distress of non-financial firms listed in Kenya is necessary.
1.2 Statement of the Problem
Financial distress has characterized the corporate sector for many years. In recent times,
the world has witnessed numerous cases of failure among globally reputed firms. These
corporations were regarded as icons of corporate financial stability and their collapse
came with tremendous surprise to researchers and analysts alike. In the local front, a
total of 21 listed corporations have either been placed under receivership, undertaken
financial restructuring or delisted from NSE altogether since independence (CMA
annual bulletin, 2014).
According to Altman and Hotchkiss (2010) this situation presents a grave concern to
stakeholders who include managers, stockholders, lenders, employees and the
government at large. To the managers, their job security and personal reputation are in
jeopardy should the firm fail (Altman, 2000). According to Center (2007), the
employees‟ basic livelihood is threatened when the firm struggles financially. To the

6
stockholders and lenders, their equity position and claims are not guaranteed when the
firm is unable to meet financial obligations (Bender, 2013). The government also suffers
declining tax revenues as well as adverse economic growth as a result of firm failure
(Fabozzi & Drake, 2009).
According to Memba and Nyanumba (2013), the financing factor is the main cause of
financial distress in the corporate sector. Further, Ohlson (1980), included capital
structure among the nine determinants of corporate financial distress. In his MDA
model, Altman (1968) also concluded that increasing the level of financial leverage
enhances financial distress in the firms. Going by these empirical results, it is logically
expected that capital structure would also have an adverse effect on the key indicators of
financial distress that have been identified as corporate profitability, liquidity, firm value
and investment growth (Outecheva, 2007). However, a review of literature reveal that
different studies have provided conflicting results.
In studies carried out by Gupta et al. (2014), Mwangi, Muathe, and Kosimbei
(2014),Perinpanathan (2014) and Umar, Tanveer, Aslam, and Sajid (2012), capital
structure has been shown to be negatively and significantly related to individual
indicators of financial distress. On the other hand, studies by Shehla Akhtar et al.
(2012), Ogundipe et al. (2012) and Velnampy (2013) postulate a positive effect of
capital structure on these indicators. However, studies undertaken by Ebaid (2009),
Pratheepkanth (2011) and Kodongo, Mokoaleli-Mokoteli, and Maina (2014) concluded
that capital structure has no effect on indicators of financial distress. Such
contradictions in empirical observation is puzzling and provides a need to carry out an
incisive investigation of capital structure affects corporate financial distress.
This study is therefore designed to address this scholarly gap. In contrast with the
previous studies that limited their scope to specific indicators of financial distress, this
study investigates the effect of capital structure on financial distress directly by using
the Altman‟s Z-score of financial distress. This methodology derives from the

7
observation by Sundararajan et al. (2002) that financial distress provide information on
the overall financial health of the firm and is a good indicator of firm quality. In
addition, Moorhouse (2004) opined that contrary to corporate financial performance
which considers a limited aspects of the firm‟s operation such as turnover, profitability
and liquidity, financial distress evaluates the long run solvency of the firm.
1.3 Objectives of the Study
In carrying out the study, the objectives were categorized into general objective and the
specific objectives.
1.3.1 General Objective
The study sought to establish the effect of capital structure on financial distress of non-
financial firms listed in NSE.
1.3.2 Specific Objectives
In fulfilling this objective, the study was guided by the following specific objectives:
1. To establish the effect of financial leverage on financial distress of non-financial
firms listed in NSE.
2. To examine the effect of debt maturity on financial distress of non-financial
firms listed in NSE.
3. To determine the effect of equity structure on financial distress of non-financial
firms listed in NSE.
4. To investigate the effect of asset structure on financial distress of non-financial
firms listed in NSE.

8
5. To establish the moderating effect of firm size on the relationship between
capital structure and financial distress of non-financial firms listed in NSE.
6. To determine the moderating effect of the listing sector on the relationship
between capital structure and financial distress of non-financial firms listed in
NSE.
1.4 Research Hypotheses
Based on the specific objectives, the study sought to test the following null hypotheses:
H01: Financial leverage has no significant effect on financial distress of non-
financial firms listed in NSE.
H02: Debt maturity has no significant effect on financial distress of non-financial
firms listed in NSE, in Kenya.
H03: Equity structure has no significant effect on financial distress of non-financial
firms listed in NSE, in Kenya.
H04: Asset structure has no significant effect on financial distress of non-financial
firms listed in NSE, in Kenya.
H05: Firm size has no significant moderating effect on the relationship between
capital structure and financial distress of non-financial firms listed in NSE, in
Kenya.
H06: The listing sector has no significant moderating effect on the relationship
between capital structure and financial distress of non-financial firms listed in
NSE, in Kenya.

9
1.5 Significance of the Study
The findings of the study provide a crucial insight concerning the role of capital
structure in determining corporate financial distress. This knowledge will be of
significant scholarly contribution as it sets pace for future research in this field. The
findings of the study will also sensitize industry practitioners involved in making
financing decisions by affording them a vital reference point on the need by
corporations to determine and maintain optimal financing framework necessary to
cushion firms against instances of financial distress. This will not only maximize the
shareholders‟ wealth but will also boost investor confidence in the Kenyan capital
market. The study findings are also of assistance to the capital market regulator (CMA)
and other policy makers in formulating appropriate mechanisms necessary to
continuously monitor and evaluate the financing aspect of corporations. This could be
achieved by identifying specific industry-based debt thresholds that would ensure that
firms are not unnecessarily exposed to risk of financial failure that results to erosion of
investors‟ wealth.
1.6 Scope of the Study
The population of the study comprised the non-financial firms quoted in NSE. The
decision to exclude firms listed in financial sector (banks and insurance companies) was
based on the fact that financial firms are subject to tight regulatory controls with regard
to capital holding and liquidity requirements; which may distort the conclusions of the
study. Further, financial institutions have a tendency to apply off–balance sheet policy in
disclosing their financial assets and liabilities; with the effect that not all the reported
assets and liabilities actually belong to the firm (Altman, 2000).
Secondary data for the study was collected over the ten-year period from 2004 – 2013.
This period was considered appropriate for the study as it was marked by a momentous
shift in the country‟s political and economic regime. During this period, Kenya realized

10
significant economic growth and a sizeable increase in the number of listings at the
NSE. This favorable situation was therefore expected to be reflected in the financial
statements of the listed firms.
1.7 Limitations of the Study
The ten-year period covered by the study might be considered inadequate sufficiently
provide in-depth and exhaustive understanding of the relationship between capital
structure and financial distress of non-financial firms listed in Kenya. Further, in the
process of collecting the secondary data, the researcher experienced instances whereby
some firms had data for some years missing; resulting to situations of unbalanced
panels. Furthermore, the study acknowledges that secondary data; which was gathered
from audited financial statements and annual reports of listed non-financial firms could
also have contained errors. Considering the cited limitations, the possibility of arriving
at a biased conclusion on the study was real. However, steps to mitigate these limitations
were taken as described in chapter three.

11
CHAPTER TWO
LITERATURE REVIEW
2.1 Introduction
This chapter provides a review of the main capital structure theories that informs the
study and offers an understanding of how financing decisions affects the financial status
firms. The chapter also provides a framework of financial distress prediction models and
shows the relevance of financing factor in the failure process. Further, the chapter
presents a conceptual relationship between financial structure and financial distress. The
chapter also examines the empirical literature that that investigate the relationship
between the study variables and concludes by critiquing the existing literature and
identifying the gap (s) relevant for the study.
2.2 Theoretical Framework
Generally, capital structure refers to the mix of the different forms of financing adopted
by the firm in financing its operations (Abor, 2005). Though corporate financial distress
has been attributed to a myriad of factors, theorists have over the years considered
financial structure as a key determinant of corporate financial stability. However,
existing theories postulate conflicting relationship between capital structure and
financial distress of the firm. While some models provide for positive interrelation,
others suggest a negative relationship yet others find no relationship between the two
variables. It is noteworthy that to date, there is no universally accepted theory of capital
structure and there is no reason to expect one (Myers, 2001). This section describes the
main theoretical orientations that provide insight on the relationship between capital
structure and corporate financial distress.

12
2.2.1 Capital Structure Irrelevance Hypothesis
In their seminal work, Modigliani and Miller (1958) hypothesized that in conditions of
perfect capital market; where taxes and transaction costs are non-existent, firms operate
in homogenous risk environment, firms have 100% dividend pay-out and investors can
borrow and lend in the same interest rates as the corporates, capital structure does not
affect corporate financial distress. They argued that it is the combination of business risk
(cost of capital) and earnings capacity (return on assets) but not how firms are financed
that determine their financial distress. The implication is that companies that operate
within the same business environment ordinarily possess similar risk structure and
therefore have identical earning potential.
The theorists argued that such firms command equal market values notwithstanding how
they are financed. The theorists further demonstrated that should such firms exhibit
dissimilar market values, investors (who can borrow and led at the same interest rates as
corporates) will continuously engage in arbitrage activities by selling their securities in
the overvalued firm and buying securities in undervalued firm (investment switching).
This will effectively increase demand for the securities in the undervalued firm and
reduce demand of securities in the overvalued firm hence restoring the market valuation
equilibrium.
This theory has however faced a lot of criticisms that mainly hinge on its perfect market
assumptions. As can be seen, the authors have assumed that each company belongs to a
specific “risk class,” with same or similar income within states across the world.
However, Stiglitz (1969) proved that this assumption is not realistic based on the fact
that firms do not operate in homogenous business environment. In his review, the author
also criticized the assumption that individuals can borrow at the same rate as
corporations. He argued that the practice has shown that there are limitations toward the
market rates for individuals when borrowing, compared to firm borrowing. In this
respect, he held that the assumption of home-made leverage is not sustainable.

13
Regarding the methodology, Frank and Goyal (2003) stated that the theory is based on
an abstract mathematical model which did not include the collection and analysis of data
to arrive at this conclusion. This is in contrast with the recent approaches in the capital
structure literature that mainly use quantitative approach or less commonly qualitative
research methods to empirically test the modern theories (Graham & Harvey, 2001).
It is however notable that despite these imperfections and the fact that it fails to provide
normative statements of practical relevance, Modigliani and Miller‟s contribution to the
theory of capital structure was considered “path breaking”(Jensen & Meckling, 1976).
According to Frank and Goyal (2003), although the Modigliani-Miller theorem does not
provide a realistic description of how firms finance their operations, it provides a means
of finding reasons why financing may matter. Further, Miller (1988) noted that today,
the overall theoretical concept is widely accepted and has become a substantial part of
economic theory and the very foundation for the modern finance theories.
This theory is relevant to the study because it provides for a non-biased perspective on
the relationship between capital structure and financial distress variables employed by
the study. By providing that financing decisions are irrelevant to the firm, the theory
offers a neutral platform to undertake an incisive empirical analysis of this relationship
within the targeted population.
2.2.2 Trade-off Theory of Capital Structure
The trade-off theory which clearly dominates the literature on capital structure claims
that a firm‟s optimal financing mix is determined by balancing the losses and gains of
debt financing. This theory that pioneered from the work of Modigliani and Miller
(1963) followed the heavy criticism levelled against their irrelevance theory on account
of their perfect market assumptions. By accepting that taxes exists in the real world
arbitrage activities are not always sustainable, the authors showed that capital structure
indeed affected the corporate market value.

14
By incorporating the effects of corporate taxes and relaxing the assumption on existence
of arbitrage, they argued that interest on debt; being tax deductible provides extra cash
flows to the levered firm in form of interest tax savings; that increases the market value
of the firm. The theory therefore contended that in situations of permanent debt,
constant cost of debt and static marginal tax rate, leveraged firms have more market
value than unlevered firms. This is attributed to the present value of interest tax shield
associated with debt financing.
Jensen and Meckling (1976) introduced the agency costs dimension to this hypothesis
by suggesting that although debt brings forth specific advantages to the firm, it also
increases the associated agency costs. The author opined that agency costs emanate from
the principal-agent conflicts that exist between the debt-holders, shareholders and
managers. They argued that on one hand, the managers may not be fully dedicated to
maximizing shareholders wealth but rather may serve their own interests; resulting to
wastage of the free cash flow through perquisites and sub-optimal investments. On the
other hand, shareholders may engage in unprofitable investment on account of their
limited liability status to the firm. To mitigate upon the potential losses that may result
from these activities, debt-holders constantly engage the services of professional
analysts and introduce debt covenants and restrictions. These mechanisms constitute
additional agency costs to the firm that offsets the benefits occasioned by debt financing
and reduces the firm value.
Myers (1977) introduced the costs of bankruptcy dimension by suggesting that although
debt financing benefits the firm through tax-shield cash flows, the benefits from use of
debt are not infinite. The author argued that other than the agency costs, debt introduces
the risk of bankruptcy which is associated with the possibility of defaulting on debt
repayment. He theorized that as a firm uses more debt, the financial risk increases and
equity-holders become less motivated to provide more capital to the firm. Further,
stockholders demand higher rate of return in terms of dividends pay-out ratios as a
compensation for bearing more risk. Similar to equity-holders, debt holders become are

15
less enthusiastic to provide additional capital or demand high rates of interest on debt;
which further increases the rate of cash outflow on the firm. By combining the
theoretical effects of agency costs and bankruptcy risk, the theorist concluded that the
tax-shield benefits afforded by debt to the firm are offset by the present values of
bankruptcy and agency costs. Effectively, the theory postulates that as debt levels
increases, the firm value also increases proportionately until a certain point where
further increase in debt use increases both agency costs and bankruptcy costs and
reduces the firm value.
In contrast to the irrelevance theory, the trade-off theory proposes moderate gearing
levels. Furthermore, it plausibly substantiates the existence of an optimal or target
capital structure that firms gradually try to achieve and maintain in order to increase
shareholder wealth (Brounen, De Jong, & Koedijk, 2006). According to Hovakimian,
Hovakimian, and Tehranian (2004), a value-maximizing firm facing a low probability of
financial distress should use debt to full capacity.
Different variations of trade-off models have been provided in literature taking even
more factors into account. For example, Auerbach (1985) created and tested an adjusted
trade-off model and arrived at the conclusion that risky and fast-growing firms should
borrow less. Furthermore, Fischer, Heinkel, and Zechner (1989) conducted a study with
a variety of rich specifications arguing that capital structure also depends on restrictions
in the debt-contracts, takeover possibilities and the reputation of management. However,
none of these theoretical and empirical further developments have managed to fully
replace the traditional version. So most researchers still refer to the original assumptions
described above when testing the trade-off theory.
The implication of the trade-off theory is that Modigliani and Miller (1963) showed that
the benefit of debt is primarily the tax-shield effect that arises due to the deductibility of
interest payments. Myers (1977) combined this model with the bankruptcy cost
framework of Kraus and Litzenberger (1973) and Scott (1976) to come up with the

16
classic static trade-off theory where the costs of debt are mainly associated with direct
and indirect costs of bankruptcy. These include legal and administrative costs and more
subtle costs resulting from the loss of reputation among customers and the loss of trust
among staff and suppliers due to uncertainties. However, the consensus view is that
bankruptcy costs alone are too small to offset the value of tax shields and additional
factors must be included in a more general cost-benefit analysis of debt (Ju, Parrino,
Poteshman, & Weisbach, 2005). For that reason, the agency costs framework of Jensen
and Meckling (1976) that is also considered in the trade-off model.
The relevance of this theory to the study is that it provides for explicit understanding of
how debt financing increases the firm value through the tax-deductibility feature
associated with borrowing. In addition, the theory introduces the of agency costs as well
as costs of financial distress the capital structure concept and shows how capital
structure may negatively influence the firm by increasing the agency costs associated
with borrowing.
2.2.3 Pecking Order Theory
Myers and Majluf (1984) introduced the information asymmetry dimension to the
pecking order hypothesis proposed earlier by Donaldson (1961). They argued that
existence of information asymmetries between the firm and providers of capital causes
the relative costs of financing to vary between the different sources. For instance, an
internal source of finance where the funds provider is the firm will have more
information about the firm than external financiers such as debt holders and equity
holders thus, these outsiders will expect a higher rate of return on their investments. This
means that it costs the firm more to obtain external capital than using internal funds.
Another dimension of presenting the information asymmetry effect on financing is that
in normal circumstances, the insiders who constitutes the managers and directors have
more knowledge about the firm than outsiders with regard to the firm‟s earning

17
potential. This inadequate information among the outsiders makes them to undervalue
the firm. Based on the assumption that managers act in favor of the interest of existing
shareholders, they refuse to issue undervalued shares unless the value transfer from
existing to new shareholders is more than offset by the net present value of the growth
opportunity. This leads to the conclusion that new shares will only be issued at a higher
price than that imposed by the real market value of the firm.
Therefore, investors interpret the issuance of equity by a firm as signal of overpricing. If
external financing is unavoidable, the firm will opt for secured debt as opposed to risky
debt and firms will only issue common stocks as a last resort. Myers and Majluf (1984),
maintain that firms would prefer internal sources to costly external finance. Thus,
according to the pecking order hypothesis, firms that are profitable and therefore
generate high earnings are expected to use less debt capital than those that do not
generate high earnings. If internal funds are not sufficient, the managers will issue debt
first so as to safeguard the existing shareholders against the diluting effect. They will
only issue external equity when they are convinced that the market has fully appreciated
the firm‟s potential in which case the external equity would be overvalued.
In contrast with the trade-off theory, this theory considers interest tax shields and the
potential threat of bankruptcy to be only of secondary importance. The theory contend
that gearing ratios are adjusted when there is a need for external funds which results
from the imbalance between internal cash flow, net of dividends, and real investment
opportunities (Shyam-Sunder & Myers, 1999). This means that only firms whose
investment needs exceeded internally generated funds would borrow more debt.
According to Myers (2001), under the pecking order proposition, each firm's debt ratio
is therefore a reflection of its cumulative requirement for external financing and
profitable companies with limited growth opportunities would always use their cash
surplus to reduce debt rather than repurchasing shares.
18
The theoretical implication of pecking order theory is that there exists a clear financing
hierarchy and there is no well-defined target debt ratio as suggested under the trade-off
theory. This theory provides for preference to use of internal funds in place of external
funds that encapsulate debt and equity in an effort to preserve value and firm stability.
The implication is that increased use of external capital such as debt and equity
influences the firm value negatively and increases the chances of financial distress.
2.3 Conceptual Framework
A conceptual framework is a graphical or diagrammatical representation of the
relationships between the variables being investigated by the study (Myers, 2013).
Based on the theoretical literature reviewed by the study a conceptualization of the
interrelation between individual constructs of capital structure and financial distress of
non-financial firms listed in NSE is undertaken. In addition, the study model captures
the moderating effect of firm size and listing sector.

19
Independent Variables Moderating Variables Dependent Variable
Figure 2.1: Conceptual Framework
Financial Leverage
Total debt to
total capital
Total Equity to
total capital
Equity Structure
Internal
equity to total
equity
External
Equity to total
Equity
Asset Structure
Fixed assets to
total assets
Financial
Distress
Altman‟s
Z-score for
emerging
markets
Firm Size
Natural
Log of
total assets
Listing Sector
Dummy sector
variable = 1 if
the firm belongs
to the sector of
interest and 0
otherwise
Debt Maturity
Long term debt
to total debt
Short term debt
to total debt

20
Figure 2.1 show the conceptual framework of the study and depicts the interrelationship
between the study variables. The dependent variable in the study is the financial distress.
The independent variable is the capital structure. Capital structure is represented by four
constructs which include: Tangibility, financial leverage, debt maturity and equity
structure. The moderating variables for the study are firm size and the listing sector.
In the study, the dependent variable (financial distress) is operationalized through the
Altman‟s Z-score index of financial distress as modified for the emerging markets. On
the other hand, the asset structure is measured by the level of tangibility which is the
ratio of fixed assets to total assets. Financial leverage is measured by the proportion of
debt and equity in the capital structure. Debt maturity is measured using the duration
taken between procurement and repayment of debt and encapsulates long term debt and
short term debt. Equity structure is determined by the proportion of internal and external
equity in the capital structure. The firm size is measured as the natural logarithm of total
asset value while listing sector is operationalized using the dummy variable that takes a
value of 1 if the firm belongs to the sector of interest or 0 otherwise. The sectors of
interest that encompass the seven sectors within which non-financial firms are listed
include: Agriculture, Automobiles and accessories, Commercial and services,
Construction, Energy and petroleum, Manufacturing as well as Investments.
2.4 Review of Literature on Variables
2.4.1 Financial Leverage and Financial Distress
In a study aimed at investigating the impact of debt financing on financial distress of
firms listed in Palestine stocks exchange, Abu-Rub (2012) used a sample of 28 firms
over the five years period (2006 – 2010). In the study, total debt to total assets and total
debt to total equity were used as proxies of financial leverage while return on equity
represented corporate financial distress. The results showed that debt financing had a
positive and significant effect on ROE. The author argued that companies that employed

21
debt to finance their operations benefited from interest-tax savings that helped in
building up more reserves for shareholders. This finding agreed with those by Nerlove
(1968) and Baker (1973) who found a positive and significant relationship between use
of debt and return on assets of industries in Bangladesh and Turkey respectively. The
effect of the finding was that increasing use of debt in the companies resulted in
significant increase in productivity of the firms‟ assets.
In another study, Pratheepkanth (2011) studied the 210 Sri-Lankan firms listed in the
Colombo stock exchange with a view of establishing how leverage affected financial
distress of the firms. The study spanned over the five years period 2005 – 2009. In
undertaking the study, leverage was measured by debt-equity ratio and total debt-total
capital ratio while gross profit and net profit margins were adopted as measures of
financial distress. The study found a negative but weak (insignificant) relationship
between the key study parameters. The implication of the finding was that increasing
debt use reduced the firms‟ level of productivity but to a lesser extent. The research
result was in consonance with that by Perinpanathan (2014) whose study of John Keells
Holdings plc. (Sri Lanka‟s largest listed firm) during the seven year period 2006-2012
concluded that debt financing had a negative but insignificant impact on the firm‟s
profitability as represented by EBIT to Total assets ratio. These findings were however
at variance with those by Yat Hung, Ping Chuen Albert, and Chi Man Eddie (2002) who
observed that financial leverage had a positive effect on financial distress of firms in the
property and construction sectors in Hong Kong as measured by ROE.
In another study, Gupta et al. (2014) investigated the effect of financial leverage on
financial distress of the 100 firms listed in the Indian National Stocks Exchange over the
5 years period (2006 – 2010). Both the market and book value of debt and equity were
adopted as proxies of leverage, while financial distress was measured by ROA. The
author observed that financial distress was negatively and significantly correlated with
debt financing but positively and significantly related with equity capital. The
implication of the result was that the highly geared companies exhibited declining

22
financial distress while firms with high levels of equity were more financially sound.
This finding mirrored the result by Krishnan and Moyer (1997) whose study showed a
negative and significant impact of total debt on return equity (ROE) among the 81 Asian
corporations studied. However, the findings differed with that by Shehla Akhtar et al.
(2012) whose similar study on firms in the energy and fuel sectors listed in Karachi
Stocks Exchange, Pakistan showed that there was a positive relationship between
financial leverage and financial performance, corporate growth and firm size.
Ebaid (2009) carried out an empirical study to investigate the impact of borrowed
capital on financial distress of firms listed in Egypt. Financial distress was
operationalized using profitability measures that included ROE, ROA, and gross profit
margin while borrowing level was represented by total debt to total assets ratio. The
study indicated that debt use had insignificant to no impact on the financial distress of
the firms. This result was however inconsistent with similar empirical studies carried out
by Hadlock and James (2002) and Ghosh, Nag, and Sirmans (2000) both of which
postulated a positive relationship between financial leverage and financial distress of the
firm.
Umar et al. (2012) on the other hand undertook a similar study on 100 firms
consecutively listed in the Karachi Securities exchange during the period 2006 – 2009.
The study used total debt to total equity as well as total liabilities to total assets ratios as
proxies of leverage while EBIT, Net profit margin and EPS represented financial
distress. The study found that all the proxies of leverage had a significant and negative
impact on profitability measure of financial distress. This findings mirror that by Xin
(2014) who found a significant negative relationship between financial leverage (debt-
equity ratio) and growth in earnings per share (EPS) among the Vietnamese firms. This
conclusion however differs from the finding by Abor (2005) whose study showed a
significant positive relationship between total debt to total assets ratio and return on
equity (ROE) among the 22 firms listed in the Ghana stocks exchange during 1998 to
2002.

23
In a study of firms in the U.S banking industry, Berger and Di Patti (2006) examined the
dualistic relationship between leverage and firm distress. They used a parametric
measure of profit efficiency as an indicator of the agency costs. The study found that
higher debt levels were associated with better firm distress. Margaritis and Psillaki
(2007) considered a similar relationship for a sample of New Zealand small and medium
sized enterprises (SMEs) using distance functions as a measure of firm performance.
The study also found that highly leveraged firms have higher financial performance.
However, Chhibber and Majumdar (1999) showed that in India leverage was negatively
related to firm distress measured through profitability. This was however at variance
with Pushner (1995) who found negative effect of leverage on financial distress of
Japanese firms as measured by the total factor productivity (TFP).
Closer home, Mwangi et al. (2014) undertook a study to identify the relationship
between financial leverage and profitability of the 42 non-financial firms quoted at the
NSE over the period 2006 – 2012. Financial leverage was measured by current assets to
total assets ratio and total debt to total capital ratio while profitability was observed
through both ROA and ROE. The study found a statistically significant negative
association between the two study variables with the implication that increased debt use
lowered the firm‟s profitability as measured by ROA and ROE. This finding is in
agreement with those by Zeitun and Tian (2014) and Maina and Ishmail (2014) who
showed a negative and significant relationship between debt and profitability among the
Jordanian and Kenyan listed firms. The findings however differ with that by Kiogora
(2000) whose study showed a positive relationship between financial leverage and
financial distress as represented by ROE among the Kenyan listed firms. Hoque,
Hossain, and Hossain (2014) conducted a study of 20 manufacturing firms listed in
Dhaka Stocks Exchange over the period 2008-2012. The study whose primary aim was
to determine the effect of capital structure on firm value adopted the sum of debt and
equity values as the proxy for the firm value. The debt-equity ratio, debt to asset, fixed
assets to total assets (tangibility), earnings before interest and taxes to interest charges,

24
and the financial leverage multiplier represented the independent variable. The study
found a negative association between the two debt ratios and firm value measures. These
findings agrees with that by De Jong (2002) who found a significant negative
relationship between leverage and Tobin‟s Q measure of firm value for the Dutch listed
non-financial firms over the period 1992-1997. This finding is nonetheless at variance
with that by Hoque et al. (2014) whose study of 48 firms quoted at the Bucharest Stocks
Exchange, Romania for the period 2003-2012 showed a positive and significant
influence of leverage on the firm value as measured by Tobin‟s Q.
Rayan (2010) conducted a 10-year longitudinal study of 113 firms listed in the
Johannesburg Stocks Exchange, South Africa with a view to determine the relationship
between financial leverage and firm value. The debt-equity ratio was used as a construct
for financial leverage while ROE, ROA, EPS, P/E ratio and EVA were used to proxy
firm value. The study found a negative correlation between use of debt in relation to
equity and all measures of firm value; with the result that increased leverage decreased
the firm value among the Southern African firms. He attributed this negative
relationship to excessive use of debt financing by firms in a bid to benefit from tax-
shields. The study results concurred with the findings by Rajan and Zingales (1995) but
conflicted with pioneering research studies by Modigliani and Miller (1963), Fama and
French (2002) and Lins (2003) all of which postulated that increase in debt use boosted
the performance of the firm with regard to value.
Kodongo et al. (2014) undertook a study that sought to find out the effect of financial
leverage on firm value of firms listed in Nairobi securities exchange, Kenya. The study
that covered the period 2002 – 2011 adopted debt equity ratio, total debt to total assets
ratio and long-term debt to equity ratio as proxies of leverage while Tobin‟s Q ratio was
used to measure the firm value. Upon controlling for the GDP growth, firm size,
tangibility and growth in sales, the study found that financial leverage had no effect on
the Tobin‟s Q. This finding was in agreement with the pioneering capital structure
irrelevance hypothesis postulated by Modigliani and Miller (1958) but differed with that

25
by (Zeitun and Tian (2014)) whose similar study of 167 Jordanian companies during the
period 1989 – 2003 showed a significant negative relationship between debt ratios
(leverage) and Tobin‟s Q.
Studies seeking to explain the effect of leverage on firms‟ liquidity have provided mixed
results. Kim, Mauer, and Sherman (1998) undertook a study aimed at establishing the
effect of financial leverage on cash holding levels among the Korean listed firms.
Leverage was operationalized by debt-total assets as well as equity-total assets ratios
while liquidity was measured by networking capital ratio. The study found that firms
with high debt ratios depicted low cash holding levels in contrast to the firms that were
mainly funded through equity. This is in line with the pecking order hypothesis of
capital structure that argued that the basic motivation for holding liquid assets is creation
of financial slack which will allow the firm insiders to pursue future attractive
investment opportunities when they present themselves so as to maintain control of the
entity (Myers & Majluf, 1984).
Dennis et al (2001) conducted a study that sought to determine how leverage influenced
liquidity levels of firms listed in Toronto stocks exchange, Canada. He sought to test the
validity of the agency hypothesis of capital structure as propounded by Jensen and
Meckling (1976) on the Canadian capital markets. Leverage was represented by total
debt to total capital ratio, while the current ratio was used as proxy for liquidity. The
study found a significant and negative relationship between the study variables. He
attributed the low liquidity levels to increased cash outflows in form of debt repayments.
The findings were in support of the agency conflict hypothesis that provide for increased
financial risk as a result of debt financing. This results to increase in the financial burden
(through loan interest payments) to the firm and hence low levels of free cash flow. This
findings concurred with that by Frieder and Subrahmanyam (2005) who found a
negative relationship between debt financing and working capital among the Ghanaian
listed firms. The researcher attributed low liquidity increased dividend payouts as

26
shareholders demanded more dividends in a bid to take away free cash flows from
managers.
2.4.2 Debt Maturity and Financial Distress
In the words of Baum, Schafer, and Talavera (2006), debt maturity encapsulates the
duration between procurement and repayment of borrowed capital. Depending on the
period that debt remains outstanding, borrowed capital can be categorized as either short
term and long term (Pandey, 2009). Antoniou, Guney, and Paudyal (2006) stated that
while short term debt becomes due within one year of the balance sheet date, long term
debt has a maturity period exceeding 12 months from the reporting date. Short term
debt is also synonymous to current liabilities and include: bank overdrafts, current
portion of term loans, accounts payable and accrued expenses as well as current taxes
due (Baum et al., 2006). On the other hand, long term debt; which essentially constitute
the non-current liabilities include: non-current portion of term loans, bonds payable,
deferred taxation as well as retirement benefits obligations (Vermoesen, Deloof, &
Laveren, 2013).
Over the years, empirical studies have demonstrated that the combination of short term
and long term debt influences the corporate financial distress differently. In a seminal
paper, Myers (1977) argued that firms that employed shorter-maturity debt are likely to
have more growth options in their investment opportunities. They opined that debt that
matured before execution of investment options cannot lead to suboptimal investment
decisions. By exploring the contract-cost hypothesis, they reasoned that the conflict
between stockholders and bondholders might lead to an underinvestment problem if
long-term debt is issued. Given that underinvestment deteriorates profits in the long run,
such behavior implies a negative relationship between long term debt and firm
performance. The finding is in concurrence with that by Aivazian, Ge, and Qiu (2005)
whose study showed a significant negative relationship between debt maturity
(percentage of long term debt to total debt) and investments (the ration of capital

27
expenditure minus depreciation to lagged fixed assets value) of non-financial firms in
the US over the period 1982 – 2002. This position was nevertheless at variance with the
empirical finding by Brick and Ravid (1985) who showed a positive relationship
between long term borrowing and profitability. He argued that long term debt enabled
the firms to avoid taxes and hence boost their profitability.
Schiantarelli and Sembenelli (1997) investigated the relationship between debt maturity
structure and performance of firms in UK and Italian firms as measured by the ratio of
cash flow to capital. By use of panel data, they found that firms that used more long
term debt as compared to short term debt tended to perform better than their
counterparts with higher proportions of short term debt. The finding was consistent with
the dominant role played by firms‟ fear of liquidation as well as loss of control
associated with short term debt financing. It also reflects the willingness of the lenders
to provide long term finance only to highly liquid and stable firms. However, this
finding is diametrically opposite with that by Baum et al. (2006) whose study that
sought to compare the effect of short term debt (current liabilities to total liabilities) on
profitability (ROA) of German and US firms found that use of short-term borrowing
leads to increased profitability among the Germany firms whereas it had no effect on US
firms.
Velnampy (2013) carried out a study aimed at determining the impact of debt structure
on the value of ten firms listed in Colombo Stocks Exchange, Sri Lanka, over the period
2006 – 2010. The long-term debt-assets ratio as well as short term debt to equity were
used as proxies of debt structure while firm value was represented by EPS and P/E
ratios. The study used correlation and regression analysis to test for the significance of
debt structure on the firm value. The study found that while an inverse relationship
exists between the short term debt-equity ratio and the dependent variables, the long
term debt/asset ratio exhibited a positive influence on both the EPS and P/E measures.
The implication of the finding was that the Sri Lankan firms preferred long term
borrowing to initial maturity debt. The result resonated with that by Ogbulu and Emeni

28
(2012) whose study of 225 firms listed in the Nigerian Stocks exchange as at 31st
December 2007 revealed a positive and statistically significant association between
long-term debt and firm value.
Cuong (2014) undertook a study aimed at assessing how debt maturity terms influenced
profitability of the Seafoods manufacturing enterprises listed in the Vietnamese Stocks
Exchange. The study used 552 observations from the sampled 92 firms during the
period 2005-2010. In the study, non-current liabilities to total assets ratio was used to
proxy long term borrowing and ROE represented the profitability measure. Upon
controlling for firm size (Ln total assets) and firm growth (total revenue t -total revenue t-
1/ total revenue t-1), they used the panel threshold regression model to test for
relationship between the variables. The study revealed that a multiple-threshold effect
existed between long term debt ratio and profitability. Specifically, the study found that
firms with more than 59.27% debt exhibited a significant positive relationship between
the two variables while firms with less than 59.27% of long term debt demonstrated a
significant inverse relationship. The implication of the study was that debt maturity had
a nonlinear relationship with profitability represented by a convex Parabola. This
finding mirrors that by Aggarwal and Kyaw (2006) who posited that, debt maturity can
have both positive and negative effects on performance of the firm so that the optimal
debt structure is determined by balancing the agency costs and other costs of debts as a
means of alleviating the under and over-investment problems.
Ogundipe et al. (2012) undertook a study to assess the effect of debt structure on
liquidity levels of the Nigerian listed firms over the period 2002-2010. Both short-term
and long-term debt ratios were used to proxy debt structure while liquidity was
measured by the ration of cash flow from operations to total assets and the working
capital ratio. The results showed a significant positive relationship between long term
debt and liquidity. On the other hand, a significant inverse relationship between short
term debt and liquidity ratios was observed. This finding was in consonance with the
signaling effect theory of debt structure postulated by Ross (1977) which opined that

29
higher levels of long term debt signify higher quality to the investors who responds by
investing in the firm; effectively raising the cash flow levels.
2.4.3 Equity Structure and Financial Distress
In corporate finance theory, firms have two principal sources of equity financing:
internal and external (Brealey & Myers, 1999). Internal sources constitutes the internally
generate funds not distributed to owners in form of dividends such as retained earnings
and reserves. On the other hand, external equity comprises all funds acquired externally
with exception of debt (Smith Jr, 1988). Empirical studies on the manner in which the
different sources of equity financing influences the firm‟s distress are underpinned on
the pecking order theory of capital structure. Particularly, finance literature documents
that firm‟s exhibit a clear preference for internally generated funds over external sources
of capital (Brealey & Myers, 1999; James & Wier, 1988; Pinegar & Wilbricht, 1989).
Various explanations have been postulated for this preference for internal funding. First,
using internal funds provides managers with greater flexibility. For example, managers
can quickly finance and thus implement investment plans, and they retain the option of
raising funds externally in the future. Second, firms avoid costs such as legal,
accounting, and underwriting fees when using internal funds, but they must incur such
flotation costs when raising funds externally (Pandey, 2009). Third, because there is
asymmetric information between managers and investors about a firm's investment
opportunities, the market may undervalue a firm's new shares relative to the value that
would be assessed if managers' information about their firm's investment plans were
publicly available (Myers and Majluf 1984). Consistent with this argument, the stock
market generally responds negatively to announcements of the issuance of common
shares and influences the performance of the firm.

30
Forsaith and McMahon (2002) Conducted a study of 871 Australian manufacturing
SMEs aimed at identifying the manner in which different sources of equity finance
influenced their growth levels over the five year period 1994 - 1998. Internal equity was
proxied by the ratio of retained earnings to total assets while issued share capital to total
capital represented external equity. Growth level was measured by year-on year growth
in turn-over. After controlling for firm size and GDP growth, the regression results
showed significant positive coefficient on internal equity variable while the coefficient
for external equity was significant and negative at 10% significance level. The findings
showed that while internal equity increased the growth rate, external equity was not
favorable to the firms. The results were consistent with those by Cosh and Hughes
(1994) whose study of 217 UK firms over the period 1982 – 1988 depicted use of
internal equity as profitable to the firms. Further, the findings supports the pecking order
hypothesis of capital structure.
In a study of 195 US firms, Park and Pincus (2001) used the ARIMA models to
determine the manner in which equity structure affected the firms‟ earnings response
coefficient (ERC). The cumulative abnormal returns was used as the dependent variable
while the interaction between internal equity-external equity ratio and unexpected
earnings (UX) as well as leverage were used as explanatory variables. Upon controlling
for firm size and growth opportunities variables, the study results indicated that internal
equity-external equity ratio significantly and positively influenced earnings response
coefficient. The implication was that firms with higher proportions of internal equity
capital registered higher returns per share as opposed to those with minimal internal
capital. The findings however contrasted those by Margaritis and Psillaki (2007) whose
study of 113 Greek firms concluded that the sources of equity financing had no
significant effect on the firm value as measured by Tobin‟s Q.
Elsas, Flannery, and Garfinkel (2004) Conducted a study of 977 German-based firms
that undertook major investments during the period 1989 – 1999. The study‟s objective
was to identify how internal and external modes of financing affected the firm‟s

31
performance with regard to long-run abnormal stock returns. This was done by
identifying the predominant source of financing each investment and then separating the
valuation effects of that investment from the effects related to financing decisions. Debt
(long term and short term) and externally issued equity (both common and preferred
stock) constituted external sources of financing while cash flow from operations
constituted internal equity. The dependent variable for the study (long run stock
performance) was determined by Fama and French (1993) three factor model. The study
found that the returns from internally financed investments outperformed the returns of
investments that were predominantly funded from external sources. The findings were
however at variance with those by Richardson and Sloan (2003) whose study led him to
observe that cash from newly issued securities simply replaces another source of
funding just as when a maturing bond is replaced by another. He further concluded that
newly issued securities enabled the firm to grow faster than internal funds alone would
permit.
Brown (2005) Used the Cox proportional hazard model to examine the differences in
survival durations between venture- and non-venture-backed firms in the US high-tech
sector over the one decade (1980 – 1989) following their IPO. The study also appraised
the performance of the firms with regard to assets and sales growth, Tobin‟s Q and
operating performance during the period. After controlling for size and age of the firms,
the results showed that venture-backed firms exhibited longer survival durations than
non-venture-backed firms. They also reported higher growth rates as well as superior
operating performances. The study therefore concluded that overreliance on internal
sources of funds denied firms in the high-tech sector opportunities to experience growth
and resulted to higher levels of cumulative exit rates. The finding concurs with that by
Sciascia and Mazzola (2008) whose study of 317 Italian firms revealed that firms with
high proportions of external equity performed better in terms of profitability and hence
stock returns as compared to internally funded firms. He attributed this trend to
improvement in governance and discipline among managers.

32
2.4.4 Asset Structure and Financial Distress
According to Pouraghajan, Malekian, Emamgholipour, Lotfollahpour, and Bagheri
(2012), asset structure represents the manner in which the firm chooses to retain its
assets investments. Normally, assets can either be tangible or intangible. Tangible assets
are the physical assets such as the property, plant and equipment. Intangible assets on
the other hand are non-physical assets and include assets in the class of intellectual
property, patents and copyrights (Babalola, 2013). In the study, asset tangibility; which
represents the proportion of fixed assets in the asset investments was used to measure
the asset structure. According to Maina and Ishmail (2014), the level of asset tangibility
provides information on the capital structure of the firm since it dictates the capacity to
sustain debt by the firm. The author argued that firms with low tangibility have low
collateral capacity and therefore are expected to maintain low borrowing levels.
Empirical evidence has shown that assets tangibility influences financial distress of
firms in different manner. Akintoye (2009) argued that firms that retain large proportion
of their asset investments in form of tangible assets are less susceptible to experience
financial distress. The author reasoned that a highly tangible corporation has a greater
ability to produce large volume of products and hence generate more sales revenue.
Accordingly, such firms are able to remain profitable in the long run.
According to Ebel Ezeoha (2008), by following the trade-off theory, the tangibility of
asset has a positive sign towards debt ratios in the cross-sectional test. The author
argued that firms with high tangibility usually borrow more due to increased debt
capacity. As a result, these firms are more likely to pay taxes less in form of taxes. The
implication is that firms with more tangible assets are less likely to be damaged in
financial distress. Similar reasoning has been advanced through empirical studies by
Frank and Goyal (2003) Titman and Wessels (1988) who opined that more capital-

33
intensive firms are expected to be more efficient in production and hence perform better
as they use superior technology.
However, in their study, Maina and Ishmail (2014) disapproved these findings by
showing that the asset tangibility is negatively related to financial distress of the firm.
By using ROA as a measure of corporate profitability, the authors argued that highly
tangible firms naturally have more collateral at their disposal. The high collateral makes
the firms attractive to the financial institutions and subsequently increases their appetite
for debt. The authors stated that this tendency to over-borrow exposes the firm to higher
risks of financial distress and subsequent failure.
In another study, Campello and Giambona (2010) showed that firms with higher levels
of tangibility are more distressed than their counterparts that keep their assets in liquid
form. The authors argued that contrary to the common belief that tangibility implies
more ability to service debt, creditors normally perceive tangible assets to be more
illiquid and therefore hard to repossess in case of default. In such circumstances, it
would be difficult for highly tangible corporations to access debt financing from lenders;
which consequently stifles their productivity.
2.4.5 Firm Size and Financial Distress
In finance literature, firm size has been described as the amount and variety of
production capacity and ability a firm possesses or the amount and variety of services a
firm can provide concurrently to the customers (Mule, Mukras, & Nzioka, 2015). It
refers to how big or small the firm is and constitutes a primary factor in determining
financial robustness of a firm (Surajit & Saxena, 2009). In empirical research, different
measures have been adopted to operationalize firm size. Measures such as natural
logarithm of total assets, natural logarithm of total sales, as well as natural logarithm of
total employees have been extensively employed with success to depict the size of the
firm in empirical research (Kodongo et al., 2014; Mwangi et al., 2014).

34
Ebel Ezeoha (2008) Stated that the size of a firm plays a crucial role in determining the
kind of relationship the firm enjoys within and outside its operating environment. He
opined that usually, the larger a firm is, the greater the influence it has on its
stakeholders. Again, the growing influences of conglomerates and multinational
corporations in today‟s global economy and in local economies where they operate are
indicative of what role size plays within the corporate environment. Pointing out the
importance of size in corporate discourse, Rajan, Zingales, and Kumar (2001) observed
that much of the economic growth takes place through expansion in the size of existing
corporate organizations. They cited Rajan and Zingales (1995) whose study of 43
countries showed that two-thirds of the growth in industries over the 1980s, came from
the growth in the size of existing corporate establishments, while only one-third trickled
in from the creation of new ones. From the foregoing, it is evident that the importance of
size of the firm in determining corporate financial distress cannot be underestimated.
The underlying theoretical basis for arguing that firm size is related to corporate
financial distress can be found in the traditional neoclassical view of the firm and the
concept of economies of scale. Economies of scale may occur for reasons such as
financial (a large firm can get better interest rate and also better discount rate due to a
large quantity that it buys); organizational reason (specialization and division of labor)
as well as technical reasons (division of high fixed costs across large number of units)
(Papadogonas, 2006). In line with this concept, a positive relationship between firm size
and profitability is postulated. On the contrary, a conceptual framework that advocates a
negative relationship between firm size and performance is noted in the alternative
theories of the firm, which suggest that large firms come under the control of managers
pursuing self-interested goals and therefore profit maximization as the firm‟s objective
function may be replaced by managerial utility maximization function (Marsh, 1982).
Also, finance scholars such as Gonenc (2005) and Dittmar (2004) have argued that due
to increased debt capacity, large firms have may have a tendency to issue more debt and
hence suffer from effects of overleveraging leading to decline in profitability. This

35
position was also supported by Khan (2012) and Maina and Ishmail (2014) whose
studies found negative relationship between firm size and firm value (Tobin‟s Q). They
attributed the negative relationship to the tendency of large firms to be inefficient
resulting to low performance. Yet, some authors have argued that the size of the firm
does not influence its financial distress. In their opinion, it is factors such as earning
capacity, risk environment (cost of capital) as well as managerial competence that are
key in determining corporate performance.
In line with these schools of thought, empirical studies have yielded mixed results on the
effect of firm size on corporate financial performance. Some of the studies have
attributed this relationship to differences in capital structure decisions among firms of
varying sizes. Considering that the specific objective of the study was to investigate the
manner in which the relationship between capital structure and financial distress of non-
financial firms listed in Kenya is altered with respect to firms of different sizes, a review
of these empirical findings is deemed necessary under this section.
Amato and Burson (2007) Studied the relationship between firm size and profitability of
the firms operating in the UK financial services sector. In their study that tested for both
linear and cubic form of the relationship, they found that a negative relationship existed
between firm size and profitability under both linear and cubic models. They argued that
as firms expanded, they had the tendency to increase the debt component in the capital
structure as opposed to small-sized firms. This inevitably resulted to reduction in
efficiency and profitability. In a related study, Serrasqueiro and Nunes (2008) studied
the effects of firm size on profitability among the SME firms operating in manufacturing
sector in Portugal using the data for years 2002 to 2007. The results of the study showed
that a negative and statistically significant relationships existed between the natural
logarithms of total assets, total sales and number of employees of the firms (size) and
their profitability measures. They attributed the negative relationship to a system of
capital structuring where large-sized firms used more debt capital to finance their assets
as a result of increased collateralization; which resulted to decline in performance levels.

36
Lee (2009) Examined the role that firm size played in determining the profitability of
the US publicly –held firms. By using the fixed effect dynamic panel data model and a
sample of more than 7000 entities, the study showed that absolute firm size (total assets)
had a significant nonlinear relationship with profitability measures; meaning that gains
in profitability reduced for larger firms. The study attributed the negative coefficient
between the variables to the tendency by larger firms to finance their assets by large
amount of debt capital due to increased borrowing capacity. Similar findings were
echoed by the study carried out by Artikis, Eriotis, Vasiliou, and Ventoura-Neokosmidi
(2007) on 129 Greek companies listed on the Athens Stock Exchange during 1997-
2001. The study showed a negative and statistically significant relationship between
firm size and value of the firm as measured by Tobin‟s Q. The adverse empirical
relationship was attributed to the observation that big firms gravitated towards use of
more indebtedness than smaller firms and hence were vulnerable to risks of financial
distress.
Central to the above general positions is the fact that as a firm grows in size, its ability
to borrow increases, and so, its debt-equity ratio increases concurrently. This exposes
the larger firms to risk of bankruptcy leading to increase in overall cost of capital.
Within the circuit of small firms, need for funds may be limited by the fact that their
scales of operations are also limited. Consequently, not only would banks and investors
alike be afraid of committing funds in the projects of small businesses, the small firms
themselves may be indisposed to exposing themselves to risks associated with distress
and bankruptcy, as well as loss of ownership.
Ozgulbas, Koyuncugil, and Yilmaz (2006) On the other hand studied the effect of firm
size on performance over the firms operating in Istanbul Stock Exchange between the
years of 2000 to 2005. The study revealed that big scale firms had a higher performance
as compared to small scale firms. The researcher attributed this dichotomy in
performance of the firms to the fact that banks were more willing to lend their funds to
larger firms partly because they are more diversified and partly because larger firms

37
usually request larger amounts of debt capital than smaller firms. Consequently, larger
firms were able to reduce transaction costs associated with debt issuance and could
arrange a lower interest rate. The findings were in consonance with those by Mule et al.
(2015) whose study of listed firms in Kenya during the period 2010 – 2014 showed a
positive and significant relationship between firm size (logarithm of total sales) and
profitability (ROE). The authors observed that higher profitability for larger firms as
compared to smaller firms could be attributed to differential in debt structure of the two
categories of the firms and the ability of larger firms to harness the advantages
associated with financial leverage.
In a study that sampled 15 companies operating in South India, Vijayakumar and
Tamizhselvan (2010) used a simple semi-logarithmic specification of the model to
determine the relationship between firm size and profitability. The authors used natural
logarithm of sales and total assets as measures of size and profit margin as well as profit
to total assets as measures of profitability. The study found a positive and significant
relationship between the two variables. In conclusion, the authors attributed the positive
relationship to the fact that large firms had the ability to arrange for debt at discounted
interest rates as well as refinance long term debt hence enjoy sustained liquidity to
finance the capital projects. The findings mirrored those by Velnampy and Nimalathasan
(2010) who conducted a study on the relationship between firm size and probability of
financial distress of all the commercial banks in Sri Lanka over the period of 10 years
from 1997 to 2006. The authors observed a negative relationship between bank size and
the probability of bank failure; implying that big banks showed no signs of bankruptcy
as was the case on small-sized banks. This result was attributed to the fact that larger
banks were more diversified and thus bore lower probability of default.
In a similar fashion, Jónsson (2008) studied the relationship between financial distress
and size of the firms operating in Iceland. The logarithm of total sales was used to
measure firm size while return on equity represented financial distress level. After
controlling for firm age, the results of the analysis showed that bigger firms have higher

38
profitability as compared to smaller firms. The author observed that though large firms
had higher levels of debt financing as compared to smaller firms, they were able to
negotiate lower interest rates on debts; which resulted to improved financial distress.
These results were in agreement with those by Babalola (2013) whose study of 80
Nigerian manufacturing firms listed in the Nigerian stocks exchange showed a positive
and significant relationship between firm size and profitability (ROA).
Several studies have however shown that firm size is not a significant determinant of
corporate performance; with the implication that it does not alter the manner in which
capital structure influences financial distress variable. Such studies include: (Mwangi et
al., 2014)
2.4.6 Listing Sector and Financial Distress
Alkhatib (2012) noted that analyzing corporate financial distress would not be complete
without considering the environment within the firm operates. In qualifying this
statement, the authors stated that firms normally face varying economic, cultural and
sectorial dynamics all of which are crucial in determining their long run financial
stability. The importance of sector variable in assessing firm performance was
emphasized by Sabido and Mulato (2006) that analyzed growth in profit margins of
listed firms in Eastern Africa showed that movements in profit margins of firms
operating within similar sectors were almost level. Further, Schoubben and Van Hulle
(2004) observed that sector-specific factors play a crucial role in determining their
leverage behavior.
Although finance and economics scholars have agreed that industry-specific factors are
critical in determining the performance of firms, studies have provided conflicting
results on how these dynamics alter the effect of capital structure on corporate financial
distress. In their study of 101 Australian firms selected from manufacturing and
investments sectors, Shumi Akhtar (2005) sought to determine whether the effect of

39
financial leverage on firm performance is similar across the sectors. Debt to total assets
ratio was used as a proxy for financial leverage while EBIT represented profitability.
Upon controlling for firm size variable, the study found a negative and statistically
significant relationship between borrowing and profitability among firms selected form
both sectors. The study therefore concluded that industry dynamics did not influence the
leverage-profitability relationship. The findings of the study were in concurrence with
those of Amjed (2007) whose study compared the effect of debt on corporate financial
distress among firms listed in textile and energy sectors in Pakistan. In the study, the
ratio of total debt to total equity represented the level of borrowing while performance
was measured by use of EPS. The results of the study indicated a negative and
significant relationship between the two variables in both sectors.
However, in a similar study carried out among firms listed in different sectors in JSE,
South Africa, Rayan (2010) found that the effect of leverage (debt) on financial distress
of firms differed across the sectors. In the study that used both random and fixed effects,
debt-equity ratio was used as a measure of leverage while EPS proxied corporate
financial distress. He attributed this variance to the behavior of firms listed in capital-
intensive sectors such as construction and manufacturing to use more debt than equity to
finance their assets; hence exposing themselves to risks of financial distress. The
findings from this study reflected those by Phung and Le (2013) who undertook a study
aimed at comparing the effect of leverage (debt use) on financial distress of 33 and 42
firms listed in Vietnam‟s manufacturing and services sectors respectively. The study
results revealed that despite the effect of debt financing being adverse in both cases, the
effect was significant among firms listed in manufacturing industry while it was
insignificant in services sector. The authors attributed this difference to the preference
for debt capital by manufacturing-oriented firms as compared to those in services sector.

40
With regard to debt maturity, authors have presented mixed findings on how the effect
of long term and short term debt on financial distress of firms varies across the sectors.
In a study of how debt structure affected financial distress of 20184 Ukrainian firms
listed in seven sectors over 2001-2010, Salim and Yadav (2012) found that use of long
term debt positively affected the financial distress of firms listed in construction,
petroleum and manufacturing sectors. However, firms listed in commercial and services
sectors showed a negative relationship between the two variables. The findings of this
study agrees with those of Onaolapo and Kajola (2010) whose study of the firms listed
across 26 sectors in Nigeria stocks Exchange showed that the effect of long term and
short term debt on financial distress of firms varied from one sector to the other. The
authors attributed the variations to the suitability of different sources of debt capital to
finance specific aspects of firm operations.
The results of the cited studies however conflicts with those by Chowdhury and
Chowdhury (2010) whose study of 171 firms listed across 9 sectors in Bangladesh
showed that the relationship and significance between debt maturity and financial
distress of firms remained the same across the sectors. The findings mirrors those by
Huang (2006) who examined the relationship between debt maturity and the growth rate
of 1216 firms listed in six different sectors in China over the 10 year period 1994-2003.
The study used both the book long term debt ratio, and market long term debt ratio to
proxy debt maturity while earnings-price ratio was used to represent growth. The
empirical results showed that in all sectors, long term debt had a positive and significant
influence on growth of firms.
Empirical studies have also derived varying results on how sector-specific factors
influence the manner in which different sources of equity structure affects the financial
distress of corporations. While some studies have shown that this relationship remains
unchanged from sector to sector (sector-specific dynamics are not important), other
authors have provided evidence that the manner in which different sources of equity
financing affects financial distress of firms differs from one sector to another.

41
In a study that sought to evaluate how sector-dynamics influences the effect of leverage
on corporate growth among the Malaysian firms, Salim and Yadav (2012) tested how
use of both internal and external equity financing affected stock prices of the firms listed
in manufacturing, investments and energy sectors. The study found that use of internal
equity had a positive and significant effect on stock price movements of firms listed
across the three sectors. However, the study found that the effect of external equity
differed from sector to sector; with the effect being negative among firms operating
within manufacturing and energy sectors and positive among firms in investments
sector. The findings of the study concurred with those by Wuxiang and Yong (2001)
whose similar study of Korean firms listed in different sectors found that the effect of
equity structure on corporate financial distress was different across the sectors.
The findings of these studies however differed from those by Kapopoulos and Lazaretou
(2007) whose study analyzed the effect of IPO financing on liquidity situation of firms
listed across 4 sectors in Athens Securities Exchange (Greece). The study revealed that
over the study period of five years, the relationship between IPO financing and distress
of the firms as measured by cash flow for operations and net working capital ratio was
negative and significant across all the sectors. The authors therefore concluded that the
pecking order theory of capital structure was applicable in all sectors. These findings
were in agreement with those by Frank and Goyal (2003) that sought to test the validity
of pecking order hypothesis of capital structure on American firms listed across different
sectors found that the theory applied uniformly across the sectors.
2.4.7 Financial Distress
The question of assessing financial distress has a long history in finance literature. Over
the decades researchers and theoreticians have investigated this subject by developing
new approaches to predict financial distress and bankruptcy. According to Outecheva
(2007), financial distress prediction techniques are either accounting or market based
depending on the nature of information employed. The author noted that while

42
accounting-based models adopt information contained in the financial statements to
determine financial distress, market-based models consider the information contained in
the securities traded by the entity in the capital market.
Each of the approach used to measure financial distress has advantages and limitations.
First, the efficient market hypothesis underlying the market-based models is a very
strong assumption which can lead to potential biases in estimated probabilities of default
(Outecheva, 2007). Further, the models rely on the future market value of assets and the
volatility of asset returns which are not directly observable in the market but requires to
be estimated. Nonetheless, Hillegeist, Keating, Cram, and Lundstedt (2004) noted that
despite the shortcomings of market-based models, the default information used in these
models is directly extractable from market prices and provides more updated asset
values dependent on the chosen frequency: daily, monthly, quarterly.
According to Muller, Steyn-Bruwer, and Hamman (2009), accounting-based models
have been criticized on the basis that financial information, such as profitability,
liquidity, and solvency ratios is past-oriented and may therefore not provide the current
status of the firm. Also, accounting information is prepared based on conservative
accounting principles which may result in misstatement of critical factors (Bellovary,
Giacomino, & Akers, 2007). However, according to Gharghori, Lee, and Veeraraghavan
(2009) in spite of these perceived limitations, accounting information is observable and
readily available and hence suitable for distress prediction. Further, Hillegeist et al.
(2004) stated that the relative simplicity and inherent accuracy of accounting-based
models have made these techniques the most popular analytical tool for financial
distress assessment in empirical research.
Beaver (1966), pioneered the studies on financial distress prediction using a univariate
analysis model by applying different financial ratios one at a time. In his study of 79
failed and 79 non– failed firms in the US over the period 1954 – 1964, he performed a
dichotomous classification test of the predictive ability of the 30 selected financial

43
ratios. Based on the results of the study, the author derived six ratios which were
considered the most powerful predictors of corporate failure. The parameters included:
cash flow to total debt, net income to total assets, total debt to total assets, working
capital to total assets, current ratios and the no-credit interval. He showed that the
chosen financial ratios were considerably depressed among the failed firms in
comparison to non-failed firms up to five years prior to bankruptcy.
The significance of this model to the study is that it identifies capital structure
(leverage), profitability and liquidity measures as key predictors of financial distress.
The implication of this finding is that highly indebted firms that are generally financially
distressed. However, despite the simplicity of the univariate model, it was criticized on
various fronts. First, use of an individual financial ratio to predict failure was considered
a limited approach that may give inconsistent and confusing classification results for
different ratios in the same firm (Altman, 1968). Further, the model failed to appreciate
that there are various factors that encompass the financial health of the firm; hence a
single financial ratio cannot include all information (Edmister, 1972).
In response to these criticisms, Altman (1968) employed the multivariate discriminant
approach to financial distress prediction. In a study that sampled 33 bankrupt and 33
non–bankrupt firms in the US‟s manufacturing sector during the period 1946–1965, he
derived a combination of five financial ratios which were considered to be the best
discriminants among distressed and non-distressed firms; and therefore the most
significant indicators of financial distress. These ratios that comprised liquidity, retained
earnings, profitability, leverage and sales turnover were used to estimate a regression
model that derived the Z-score index to measure financial distress. The author found that
firms whose Z-score exceeding 2.67 were generally safe zone. On the contrary,
companies whose Z-score fell below 1.81 were financially distressed, while firms whose
Z-score fell between the two measures were classified under the grey zone.

44
However, the initial model was criticized on the basis that its application was only
restricted to large manufacturing firms that were listed in the exchange market
(Outecheva, 2007). Further, the model was criticized on the basis of its scope of
application that was limited to developed economies (Platt & Platt, 2002). In response,
Altman (1993) re-estimated the model to include firms of all sizes and modified it for
the emerging markets as specified in appendix iv
It is notable that the model was applied to test both the Enron and WorldCom cases and
the scores showed there were warning signs before the bad news was exposed.
Particularly, Enron‟s Z-score was below the safe zone in June 2001 before filing for
bankruptcy under Chapter 11 of the United States Bankruptcy Code on December 2001.
In addition, WorldCom‟s Z-score was below the safe zone at the end of the first quarter
of 2002 a few months prior to filing for bankruptcy in mid–July 2002. In addition, it is
evident that the model‟s application in emerging markets e.g. Mexico, Brazil and
Argentina yields successful results in predicting corporate collapse (Altman &
Hotchkiss, 2010). According to Sitati and Odipo (2011), the model has demonstrated an
impressive result for the model when applied to non–manufacturing firms. However,
despite the MDA models exhibiting relatively superior accuracy, the validity of the
model has been questioned on the basis of its statistical assumptions that include normal
distribution of ratios, linearity of variables and equality of variance–covariance matrices
of ratios for both groups. According to Platt and Platt (2002) these restrictive
assumptions led researchers to develop other multivariate statistical tools to overcome
these limitations.
In an effort to alleviate the limitations of MDA models, Ohlson (1980) derived the O-
score model that predicted financial distress by using the probabilistic approach. In
contrast to the MDA model, the O-score model adopted the logistic regression technique
based on a cumulative probability function and produced the probability of a firm being
classified as belonging to an a priori group according to the financial characteristics of
the firm (Ohlson, 1980). This was done by producing a non-linear probability model in

45
which the dependent variable is not continuous, but performs a discrete characteristics
such as distressed or non-distressed firms.
By analyzing 105 bankrupt and 2058 non-bankrupt US firms during the period 1970–
1976, Ohlson (1980) applied a probabilistic estimation of insolvency and developed a
logit model that comprised of nine explanatory variables. Particularly, he broadly
categorized the identified variables into firm size, leverage, liquidity, profitability and
growth and observed that they formed the most powerful predictors of financial distress
in the analyzed firms. Similar to the discriminant analysis, this technique weighted the
identified variables in deriving the O-Score that estimated the probabilities of default for
each firm in the sample. Different from the MDA that derived the Z-score index through
linear combination of the variables, logit approach incorporated the non-linear effects
and used the logistic cumulative distribution function to maximize the joint probability
of default for the distressed firms and the probability of non-failure for the healthy
companies.
However, a comparison of the predictive accuracy of the logistic regression models with
the Altman‟s multivariate discriminant analysis by means of the same set of variables
and the same sample resulted to similar results or very modest improvement. In
reference to his model, Ohlson wrote that “a logit analysis is not an econometric method
designed to find an “optimal” frontier, trading off one type of error against another. This
is in contrast to multivariate discriminant models which satisfy optimality conditions
under appropriate assumptions”(Outecheva, 2007). Ohlson therefore introduced a new
econometric technique to forecast the probability of default. However, according to
Keasey and Watson (1991), the logistic regression analysis offers as much as any other
technique to the user.
Just like the MDA models, the importance of this financial distress model for the study
is that it identifies specific determinants of financial distress. Specifically, it isolates the
firm size, leverage, liquidity, profitability and growth as key predictors of the O-score

46
index that is directly related to probability of financial distress. The implication of the
model is that firms that have high debt ratios are more likely to experience financial
distress; as are firms with low profitability, liquidity and growth parameters.
2.5 Critique of Existing Literature
Review of literature indicate that majority of past empirical studies have analyzed the
effect of capital structure on the firm based on different indicators of financial distress.
The most popular measures have been based on profitability, liquidity, firm value, EPS
and stock returns. These parameters however only provide a restricted scope of the
overall corporate financial health and quality. This conclusion derives from Moorhouse
(2004) who stated that while corporate financial performance considers the short term
situation of the firm‟s overall operation such as profitability. However, financial distress
provide a holistic and comprehensive approach in assessing corporate financial viability.
Further, Outecheva (2007) stated that evaluating financial distress prediction involves
more than just the analysis of corporate profitability.
Secondly, it is evident from review of literature that even in situations where similar
indicators of corporate distress have been employed, conflicting empirical results have
been provided. Specifically, while some studies have provided for a negative effect,
others have shown positive relationship; while others have postulated null relationship.
This lack of convergence implies that the manner in which capital structure influences
corporate financial distress is still inconclusive.
Thirdly, it can be deduced from literature that the effect of capital structure has largely
been analyzed from the standpoint of debt financing. To this end, many researchers have
commonly adopted debt ratios as proxies of capital structure. While this tendency may
be attributed to the need to evaluate the leverage effect, it gives an inadequate scholarly
perspective of the effect of capital structure as it excludes the effects of debt maturity
and equity structure on financial distress of corporations. The implication is that the

47
findings provided by past studies are not exhaustive. This study sought to address this
gap by separately analyzing the effects of debt maturity and equity structure on
corporate financial distress alongside the leverage effect of capital structure.
2.6 Research Gaps
The review of literature indicate that majority of past empirical studies have investigated
the effect of capital structure based on individual indicators of financial distress. These
indicators include profitability, liquidity, firm value and stock returns. According to
Huang (2006), profitability of a firm may not provide a holistic assessment on the
overall firm quality. This is because firms may be profitable but underfunded at the
same time. Further, Hoque et al. (2014) opined that financial performance parameters
provide a limited assessment of the overall financial health of corporations. The
addresses this gap by adopting the Altman‟s Z-score of financial distress as modified for
emerging markets; which is a direct measure of corporate financial viability.
Secondly, studies provide evidence that there is generally lack of scholarly convergence
in empirical findings even in situations where similar indicators of financial distress
have been adopted. Specifically, while a study by Mwangi et al. (2014) revealed that
capital structure affects profitability negatively, a similar study carried out by Velnampy
(2013) showed that capital structure mitigates corporate financial distress. Further, a
study by Ebaid (2009) showed that capital structure has no effect on financial distress.
This divergence in empirical findings imply that the effect of capital structure on
corporate financial distress is still unclear. This study seek to address this gap in the
perspective of the Kenyan non-financial firms.
Thirdly, it can be deduced from literature that researchers have commonly adopted debt
ratios as proxies of capital structure. This approach provides a selective perspective of
the effect of capital structure considering that capital structure has got other components
such as debt maturity, asset structure and equity structure (Chen, 2004). This study

48
sought to address this gap by separately analyzing the effects of debt maturity, asset
structure and equity structure on corporate financial distress alongside the leverage
effect of capital structure.
2.7 Summary
Review of literature has shown that for the past five decades, the subject of capital
structure has attracted significant interest among the finance scholars. This has given
birth to many capital structure theories that seek to explain how financing decisions
affects the firm. As pointed out earlier, this reflects the level of importance placed at the
financing factor at firm level. However, no universal theory has been adopted to date.
It can also be deduced that majority of empirical studies have generally investigated the
effect of capital structure based on performance variables such as profitability, firm
value, liquidity and stock returns. However, these studies have provided conflicting
results; with the implication that the effect of capital structure on corporate performance
is unclear. By using corporate performance to study the effect of capital structure on the
firm, the studies offers a narrow view in their methodological approach. This study
addressed this gap by adopting financial distress; which has been applauded as a
comprehensive method of analyzing overall financial distress of the firm.
The literature also show that there exists numerous approaches to predicting corporate
financial distress. Depending on the nature of data used to estimate the models, they can
be broadly categorized into accounting-based and market-based models. The most
popular accounting-based models; which rely on data from financial statements include
the Beaver‟s (1966) univariate model, Altman‟s (1968, 1993 and 2000) multi-variate
discriminant models as well as the Olhson‟s (1980) logistic probability model. It is
however notable that in spite of the perceived limitations attributed to accounting-based
models, they are the most popular models since their results are insulated from the
inherent distortions in market information.

49
CHAPTER THREE
RESEARCH METHODOLOGY
3.1 Introduction
This chapter provides a description of the methods and approaches adopted in carrying
out this study. It covers the research design, target population, sampling frame, census,
data collection and analysis techniques as well as methods of testing the suitability of
the data used by the study. The chapter also specifies the empirical models estimated by
the study and provides the techniques of estimating and analyzing the model.
3.2 Research Design
Kothari (2004) defined research design as a master plan that specifies the methods and
procedures for collecting and analyzing the needed information. A research design is the
structure, or the blueprint of research that guides the process of research from the
formulation of the research questions and hypotheses to reporting the research findings
(Wanjiru, 2015). The study used quantitative research design. This research design was
selected for the study since the data collected on the study variables was in financial
ratios and hence of quantitative nature. The financial ratios computed for each firm
during the period of study were then transformed into panels. This approach is useful for
this kind of study where both the cross-sectional and longitudinal characteristics of the
units being analyzed constitute an important ingredient of the study (Gujarati, 2003).
3.3 Target Population
Population refers to an entire group of individuals, events or objects having common
characteristics that conform to a given specification (Mugenda & Mugenda, 2003). The
population of the study comprise the non-financial companies listed in the NSE as at
December 2013. In total, there were 41 non-financial firms listed in the NSE as at that

50
date and participated in the study. The companies are listed across 7 sectors as shown on
Table 3.1:
Table 3.1: Non-financial firms listed in NSE by sectors
Source: NSE, (2013)
The study did not consider firms listed under the banking and insurance sectors since
they are associated with tight regulations with regard to capital holding and liquidity
operations. This heterogeneity makes it difficult to perform hypothesis testing for the
study variables (Mwangi et al., 2012). The unit of analysis for the study was individual
non-financial firms listed in NSE.
Sector Number of firms Proportion
Agriculture 7 17%
Automobiles & accessories 4 10%
Commercial & Allied 9 22%
Construction & Allied 5 12%
Energy & Petroleum 4 10%
Investments 4 10%
Manufacturing & Allied 8 20%
Total 41 100%

51
3.4 Sampling Frame
Kothari (2004) defined a sampling frame as a list of all the items where a representative
sample is drawn for the purpose of a study. The sampling frame for this study comprised
all the 41 non-financial companies listed in NSE as at 31st December 2013 (NSE, 2013).
3.5 Census
Census method involves an exhaustive enumeration of the units constituting the target
population (Kothari, 2004). Since the target population comprised 41 non-financial
firms listed in NSE, a census of all the firms study was conducted for the study.
According to Mugenda and Mugenda (2003), a census is preferred where the population
is small and manageable. Further, census method enhances validity of the collected data
by eliminating errors associated with sampling (Saunders, Lewis, & Thornhill, 2009).
3.6 Data Collection Instrument
The study employed secondary data that was extracted from audited financial statements
and annual reports of individual non-financial firms over the 10-year period, 2004 to
2013. Collection of data was accomplished by means of the secondary data collection
instrument specified in Appendix II. The instrument aided in collection of accounting
data necessary to compute the Altman‟s Z-score of financial distress. In addition, data
relating to financial leverage, debt maturity, equity structure, assets tangibility and sales
growth was collected.
3.7 Data Collection Procedure
Collection of data involved visiting the websites of the listed non-financial companies
and downloading the published financial statements for the 10 years period studied.
Using the data collection instrument, the information on specific components was keyed
in for each firm for every year. In order to verify the authenticity of the collected data,
the same was cross-checked by using the hand book summaries obtained from NSE

52
website for the period of study. Where differences were noted, the data obtained from
the published financial statements was given preference considering that the same had
been published for public consumption. The data was then uploaded in Excel program
and converted into ratios. The rations were then converted into panels ready for analysis.
3.8 Pilot Study
The study employed secondary data that was collected by means of pre-designed
instrument specified under appendix II. The instrument was designed by the help of
experts in finance who includes Lecturers in the Finance field and Finance Managers.
To ensure that the instrument captured all the necessary information to determine the
required financial ratios, the instrument was discussed with the experts prior to data
collection and the necessary review done. Having agreed on the adequacy of the
instrument, no further piloting was conducted on the instrument prior to data collection
3.9 Data Analysis and Presentation
The study collected secondary data from all the 41 non-financial firms listed in NSE
during the period 2004 – 2013. This approach was guided by econometric theory that
advocated for panel data analysis to achieve better regression results (Baltagi, Bratberg,
& Holmås, 2005). One of the main advantages of panel data is that it enables the
researcher to control against unobserved heterogeneity and provides the researcher with
both cross-sectional and time-series dimensions; which reduces the likelihood of bias in
the parameter estimators.
Upon extracting data from the financial statements and NSE hand books, Excel program
was used to compute the ratios relevant for the study variables in each firm across time.
Descriptive statistics that include measures of central tendency, dispersion and
skewedness were used to summarize and profile the status of financial distress, financial
leverage, debt maturity, equity structure, asset structure, sales growth as well as firm
size of non-financial firms. Panel regression analysis using Stata Version 11 was

53
employed to establish how capital structure variables affected financial distress of non-
financial firms. Finally, inferential statistics that included F-test (Wald test) and t-test
were used to determine the significance of the overall model and individual explanatory
variables respectively. Presentation of study results was done by use of tables and
graphs.
3.9.1 Measurement of Study Variables
The study adopted financial distress and the dependent variable. Financial leverage, debt
maturity, equity structure and asset structure constituted the explanatory variables for
the study. The moderating variables comprised the firm size and listing sector. In
addition, the study controlled for firm growth. This section provide details of how each
of the study variables were measured and operationalized.
a) Financial Distress
Corporate financial distress refers to situation where a firm is unable to meet the
financial obligations as they fall due (Andrade & Kaplan, 1998). From this definition, it
is clear that contrary to the individual indicators of financial distress such as
profitability, firm value, investment growth or liquidity, financial distress depicts a more
comprehensive appraisal of the entity‟s financial status. In that regard, the study
employed the Altman‟s Z-score for emerging markets to determine the financial distress
among the studied firms. The researcher considers the financial distress predictor
models to be relevant for the study. This is because the target population consists of
entities that are still in operation and are therefore considered to be in one level of
financial distress or another as encapsulated under the multi-staged hypothesis of firm
failure.
This choice is based on the finding that the model is able to provide superior accuracy in
predicting financial distress (Zouari & Abid, 2000). Further, it has been empirically
found to be effective in predicting financial distress among listed firms in Kenya (Sitati

54
& Odipo, 2011). The model is further grounded on the MDA statistical technique that
provides a suitable mechanism of discriminating between financially sound and unsound
firms.
b) Financial Leverage
Financial leverage basically represents the extent to which a firm employs either of the
two principal forms of corporate financing; debt and equity. Total equity comprise the
sum of paid-up share capital, share-premium, reserves, minority interest and retained
earnings (Fabozzi & Drake, 2009). On the other hand, total debt variable represents the
combination of current and non-current liabilities. A review of prior empirical literature
indicates that debt ratios have been popularly adopted to measure leverage. This could
be attributed to the fact that debt presents significant levels of financial risks to the firm
in terms of fixed charge payments in form of interest on capital (Bender, 2013).
However, in order to capture the leverage effect on both equity and debt financing, the
study measured each component of financial leverage as a ratio of total capital in line
with recommendation by Pandey (2009).

55
c) Debt Maturity
In view of Diamond (1993), while financial leverage provides a measure of overall
gearing, the mix of short term and long term debt provides the debt maturity effect of
the firm. To effectively evaluate the individual effect of each category of debt financing
on the firm, Aivazian et al. (2005) recommended long term and short term debt to be
analyzed separately. In the study, current liabilities represent short term component of
total debt while non-current liabilities represent long term debt. To measure the debt
maturity effect, the study expressed each category of debt as a proportion of total debt
(Khan, 2012; Owolabi & Inyang, 2013).
d) Equity Structure
Equity financing falls into two principal categories: internal and external. Internal equity
comprises of internally generated funds that are not distributed to shareholders in form
of dividends. The implication is that the funds are ploughed back into the firm to finance
assets. Key sources of internal equity include retained earnings and reserves (Bender,
2013). On the other hand, external equity comprises of externally acquired funds except
debt (Xiaoyue & Xiaodong, 2001). Key items of external equity include paid-up share
capital, share premium and minority interest (Pandey, 2009). In order to capture the
equity structure effect, the study measured the each component of equity capital as a
ratio of total equity financing in line with studies carried out by (Park & Pincus, 2001;
Wuxiang & Yong, 2001).

56
e) Asset Structure
Asset structure defines the extent to which corporations retain their asset investment in
one form or another (Cuong, 2014). The study adopted asset tangibility; which is the
proportion of fixed assets in the total assets to measure asset structure. This is informed
by prior empirical literature that showed that the two variables have the potential to
influence financial distress of the firms as presented under section 2.4.6.
f) Firm Size
The study used size of non-financial firms and the sector within which firms are listed as
moderating variables. This was informed by evidence from past empirical studies that
the two factors have the potential to alter the relationship between capital structure and
corporate financial distress indicators as presented under sections 2.4.5 and 2.4.6. Firm
size represents how large or small the studied firm is (Babalola, 2013). Firm size was
measured by taking the natural logarithm of total assets (Jónsson, 2008; Mwangi et al.,
2014; Surajit & Saxena, 2009).
g) Listing Sector
Non-financial firms in NSE are listed in 7 sectors that consist of: Agriculture,
Automobiles and accessories, Energy and Petroleum, Manufacturing and allied,
Commercial and Services, Construction and Allied as well as Investments. The study
operationalized the listing sector by means of a dummy variable that took a value of 1 if
the firm was listed within the sector of interest and 0 otherwise.

57
h) Sales Growth
The study adopted sales growth to control for differences in sales turnover among the
studied firms. This decision is informed by prior empirical literature that showed that the
sales growth has the potential to influence financial distress. Sales growth represents the
year–on-year changes in turnover. In this study, this metric was measured as the ratio of
difference in sales over two subsequent years to previous year‟s turnover (Cuong, 2014;
Kodongo et al., 2014; Maina & Ishmail, 2014).
Babalola (2013) Suggested that enterprises of higher growth opportunities generally
perform better than those with lower sales growth. In addition, studies by Abor (2005)
and Kodongo et al. (2014) found that enterprises with higher sales growth rate have
higher market value. This points to a positive relationship between sales growth and
financial distress. However, studies by Cuong (2014), Gupta et al. (2014) and Hoque et
al. (2014) showed that sales growth variable is negatively related to financial
performance of the firm. Authors have attributed the negative association to the fact that
higher sales growth normally require huge capital to finance turnover. Considering the
empirical findings from studies conducted on non-financial firms listed in Kenya, the
study postulates a positive relationship between sales growth variable and financial
distress. A summary of the constructs for each variable used in the study together with
their measurements are summarized on Table 3.3

58
Table 3.2: Summary Measurement of Research Variables
Variables Measurement Notation Expected
Sign
Independent Variables
Financial Leverage Total debt/Total capital
Total equity/Total capital
TD
TE
- ve
+ ve
Debt Maturity Non-current liabilities/Total Debt
Total current liabilities/Total Debt
LTD
STD
+ ve
- ve
Equity Structure
Total internal equity/Total equity
Total external equity/Total equity
IE
EE
+ ve
- ve
Asset Structure Total Fixed assets/Total assets TANG - ve
Moderating variables
Firm size
Sector
Natural logarithm of total assets
Dummy, taking value of 1 if firm
is listed within the sector and 0
otherwise
SZ
D
+ ve
+ ve
Control variable
Sales growth SG
Dependent
Variable
Financial Distress Altman‟s Z-score index of financial
distress (Appendix IV)
FD

59
3.9.2 Panel Regression Model Estimation
Generally, three techniques may be adopted by researchers to specify and estimate panel
regression models: Pooled Regression Model, Fixed Effect Model, and the Random
Effects Model. Pooled regression model is also known as the constant coefficients
model with reference to both the intercept and slope. It is the simplest among the three
models in panel data analysis. It is however the most restrictive as it disregards the space
and time dimensions of pooled data. It is best suited in situations where there is neither
significant cross-sectional or temporal effects and involves pooling all the data and
running an ordinary least square (OLS) regression model. The major problem with this
model is that it does not distinguish between the various cross sections involved in the
study; i.e. by pooling all the firms, we deny the heterogeneity or individuality that may
exist among them(Gujarati, 2003). The general presentation for pooled regression model
may be made as follows:
………………………………………………. (1)
Where;
it is the regressand,
Xit is the vector of regressor variables,
βi is the coefficient of the regressor variable,
i refers to the firm and t is the time.
Fixed effect model estimation on the other hand involves designing the regression model
that allows for the intercept to vary across space (individual firms) with the slope
coefficients remaining constant; hence the term “fixed effects”. By so doing, the model

60
captures the differences in individual characteristics of the entities being studied such as
management style or philosophy hence improving the reliability of the regression results
(Gujarati, 2003). This is achieved by employing the mean differencing or differential
intercept dummies technique; hence the term least-squares dummy variable (LSDV)
model. Under this study, the fixed effect model with time invariant intercept term may
be designed as follows:
………………………………………………..... (2)
Where;
it is the regressand,
Xit is the vector of regressor variables,
βi is the coefficient of the regressor variable,
i refers to the firm and t is the time.
The LSDV model form could be expressed as follows:
Yit = α1+α2D2i+α3D3i+αnDni+β1X1it+β2X2it+μit ……………………………. (3)
Where;
Di = is the dummy variable that equals to 1 if the observation X belongs to firm I
and 0 otherwise and ranges from 1 to n-1.
Another way of specifying the fixed effect model involves designing the regression
model that allows for the intercept to vary across both space (individual firms) and time
with the slope coefficients remaining constant. By so doing, the model captures not only

61
the cross-sectional characteristics such as differences in management style or philosophy
but also time-induced differences such as technological changes, regulatory and/or tax
policy changes, and external effects such as wars or other conflicts. Under this study, the
fixed effect model with time variant intercept term may be designed as follows:
Yit = α1+α2D2i+α3D3i+αnDni+λ0+λ1Dum1t+……+λtDumt+β1X1it+β2X2it+μit……..
(4)
Where:
Di = is the dummy variable that equals to 1 if the observation
X belongs to firm i,
0 otherwise and ranges from 1 to n-1.
Dumt = is the time dummy variable that equals to 1 if the observation belongs to year t,
0 otherwise and ranges from years 2004 to 2013.
Nonetheless, it is notable that despite the advantages of the fixed effect model,
introducing too many dummy variables, usually results in reduction of degrees of
freedom hence problems of further statistical analysis. Secondly, numerous variables in
a regression model normally leads to the possibility of multicollinearity, which might
make precise estimation of one or more parameters difficult.
Unlike the fixed effect model that assumes a unique intercept for individual firms with
respect to space, time or both, random effects models assume that all the 41 firms
involved in the study have an intercept that has a universal mean value equivalent to .
Effectively, the differences in their individual features is captured by the intercept term
which is reflected as deviations from the mean term . Starting with Equation (2)
above, the intercept value for an individual company is expressed as:

62
……………………………. (5)
Where being the random error term of mean equal to zero and variance of σ2ε.
Substituting Equation (5) into (2), we obtain:
Yit = α1+β1X1it+β2X2it+εi+μit ………………………………………………. (6)
But taking;
………………………………………………………………… (7)
Equation 10 is estimated as follows:
Yit = α1+β1X1it+β2X2it+πit ………………………………………………….... (8)
From the above, it can be deduced that the composite error term consists of two
components, which is the firm-specific, error component, and the which is the
combined time series and cross-section error component. For this reason, this model is
also called error components model (ECM). In contrast to FEM, REM is parsimonious
in that it does not result in loss of degrees of freedom. This is because one does not have
to estimate n cross-sectional intercepts but just only the mean value of the intercept and
its variance.
To determine which model provides superior results between the random effects and
fixed effects models, Hausman test was undertaken. This involves sequentially
estimating both models (starting with FEM) against the alternative hypothesis that the
random effect model is appropriate at 5% confidence level. The Hausman test provided
a chi-square value and a corresponding p-value which formed the basis of accepting or
rejecting the null as appropriate.

63
3.9.3 Statistical Model
Model specification involves coming up with a combination of study variables that
represents the empirical relationship between the dependent, explanatory and
moderating variables. This was done in line with the conceptual framework illustrated
under section 2.3.
The study employed panel regression models to analyze secondary data as the secondary
data collected exhibited both time series and cross-sectional dimensions. Since the study
sought to determine both the primary (main) effects of capital structure on financial
distress as well as the moderating effects of firm size and sector on this relationship,
three panel regression equations were specified as follows:
……………………………………… ……… (9)
………………………………......... (10)
……………. (11)
…………………… (12)

64
Where: is Financial distress as measured by the Altman‟s Z-score index of financial
distress as modified for the emerging markets, is the intercept term, are the
positive or negative coefficients of the explanatory variables, are the coefficients of
the moderating variables, are the coefficients of controlling variables, is a vector
of explanatory variables, is a vector of controlling variables, is the sector dummy
variable, taking a value of 1 if the firm is listed in that sector, and 0 otherwise, is the
error term (the time-varying disturbance term is serially uncorrelated with mean zero
and constant variance).
i = 1,……., 41
t = time in years from 2004 – 2013.
Equation 9 was used to estimate the main effects without control variable while
Equation 10 controlled for sales growth to determine whether sales growth improved the
predictive strength of the equation. Equation 11 estimated the moderating effects of firm
size while equation 12 estimated the moderating effect of sector within which firms
were listed.

65
CHAPTER FOUR
RESULTS AND DISCUSSIONS
4.1 Introduction
This chapter presents the results of analysis of the data collected in line with the
research design described in chapter 3. Analysis of data commenced by undertaking a
descriptive analysis of the study variables aimed at obtaining the general profile of the
data. In addition, appropriate regression diagnostic checks was undertaken on the data so
as to determine its suitability for further statistical analysis. Further, an estimation of the
panel regression models specified in section 3.9.3 was undertaken and interpretation of
the results performed using the inferential statistics; F-test (Wald-test) and t-test.
Finally, a discussion of the results is offered in relation to theoretical and empirical
literature.
4.2 Findings of Descriptive Statistics
This section presents the descriptive statistical analysis of the collected data based on
the results of the entire sample as well as for individual sectors. Summary statistics that
encapsulate the measures of central tendency such as the mean, the measures of
dispersion such as standard deviation, minimum and maximum observations as well as
measures of distribution (Skewedness and Kurtosis) were used.

66
Table 4.1 Panel Variables Summary Statistics (overall)
Variables Mean Std. Dev. Maximum Minimum Skewedness Kurtosis
Financial
distress 8.421 9.494 130.928 -9.848 10.486 132.312
Total debt 0.461 0.215 1.694 0.008 1.520 9.789
Long term
debt 0.390 0.285 0.964 0.000 0.239 1.716
Short term
debt 0.610 0.285 1.000 0.036 -0.239 1.716
Total equity 0.539 0.215 0.992 -0.694 -1.520 9.789
Internal equity 0.787 0.384 5.986 -1.728 5.622 93.942
External
equity 0.219 0.392 2.728 -4.986 -5.258 86.919
Tangibility 0.566 0.227 0.983 0.038 -0.284 2.020
Size(Kshs
mil) 4.448 0.005 188.762 57.297 0.001 0.000
Sales growth 0.159 0.353 2.494 -0.633 2.334 13.436
Unbalanced panel of 41 non-financial firms observed for 10 years, Size is in million
Kshs, Z-score is the index of financial distress derived from Altman‟s model for
emerging markets, all other variables are in ratios
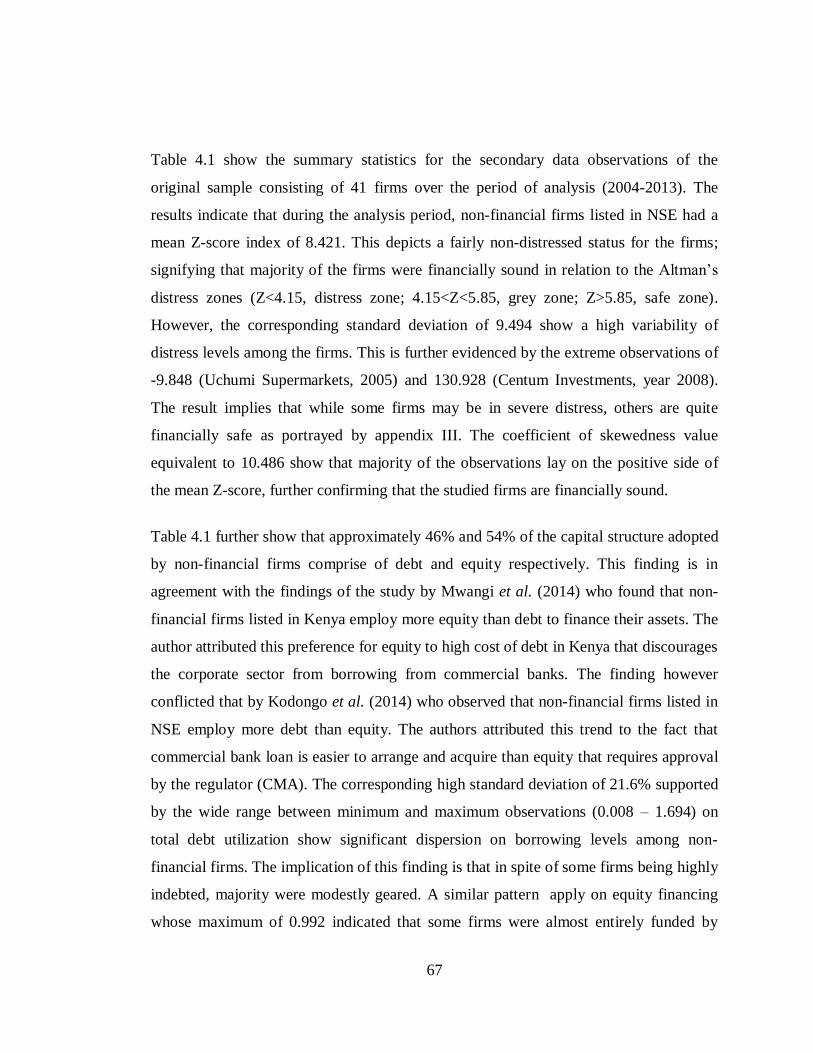
67
Table 4.1 show the summary statistics for the secondary data observations of the
original sample consisting of 41 firms over the period of analysis (2004-2013). The
results indicate that during the analysis period, non-financial firms listed in NSE had a
mean Z-score index of 8.421. This depicts a fairly non-distressed status for the firms;
signifying that majority of the firms were financially sound in relation to the Altman‟s
distress zones (Z<4.15, distress zone; 4.15<Z<5.85, grey zone; Z>5.85, safe zone).
However, the corresponding standard deviation of 9.494 show a high variability of
distress levels among the firms. This is further evidenced by the extreme observations of
-9.848 (Uchumi Supermarkets, 2005) and 130.928 (Centum Investments, year 2008).
The result implies that while some firms may be in severe distress, others are quite
financially safe as portrayed by appendix III. The coefficient of skewedness value
equivalent to 10.486 show that majority of the observations lay on the positive side of
the mean Z-score, further confirming that the studied firms are financially sound.
Table 4.1 further show that approximately 46% and 54% of the capital structure adopted
by non-financial firms comprise of debt and equity respectively. This finding is in
agreement with the findings of the study by Mwangi et al. (2014) who found that non-
financial firms listed in Kenya employ more equity than debt to finance their assets. The
author attributed this preference for equity to high cost of debt in Kenya that discourages
the corporate sector from borrowing from commercial banks. The finding however
conflicted that by Kodongo et al. (2014) who observed that non-financial firms listed in
NSE employ more debt than equity. The authors attributed this trend to the fact that
commercial bank loan is easier to arrange and acquire than equity that requires approval
by the regulator (CMA). The corresponding high standard deviation of 21.6% supported
by the wide range between minimum and maximum observations (0.008 – 1.694) on
total debt utilization show significant dispersion on borrowing levels among non-
financial firms. The implication of this finding is that in spite of some firms being highly
indebted, majority were modestly geared. A similar pattern apply on equity financing
whose maximum of 0.992 indicated that some firms were almost entirely funded by

68
equity and a minimum of -0.694 signifying that some companies were technically
drifting towards insolvency.
It can also be deduced from the results that approximately 61% of total debt comprises
of short term borrowing (repayable within 12 months of balance sheet date) as opposed
to long term debt that constitute 39%. This empirical observation signifies preference
for short-term debt over long term debt by firms to finance their assets. This disparity
could be attributed to the perceived high cost of long-term borrowing as well as
inaccessibility for long-term credit from financial institutions due to high collateral
requirements in terms of security (Bitok et al., 2011). Another reason could be due to
the fact that the Kenyan long-term debt market is still under-developed and hence not
readily accessible by non-financial firms (Maina & Ishmail, 2014). The high variability
in borrowing levels as evidenced by the high standard deviation show the non-
uniformity in the borrowing levels among non-financial firms during the analysis period.
The results output displayed in Table 4.1 denote that the greatest proportion of the
firms‟ equity capital was derived from internal sources (retained earnings and reserves)
at approximately 79% as opposed to external equity that approximated 21% of the total
equity component. The observation signifies that during the period of analysis, non-
financial firms employed the pecking order hypothesis of capital structure; which opine
that firms normally prefer to utilize internally generated funds as opposed to externally
acquired capital to finance their assets. The results further show a high dispersion on
usage levels of each component of equity capital as signified by the standard deviation.
Of interest are the negative minimum values which were attributed to high accumulated
losses by some firms resulting to depleted equity capital.
The results further showed that the average assets-holding by non-financial firms during
the period of study was Kshs 4.448 billion with a standard deviation of Kshs 5,000. The
maximum observation was Kshs 188.76 billion while the minimum value was Kshs 57.3
million. The results also demonstrated that 56.6% of the total firms‟ assets were tangible

69
(non-current); with a high of 98.3% and a low of 4%. This implied a high assets
tangibility among the entities under consideration; indicating that non-financial firms
preferred to keep a large proportion of their investment in assets in fixed form. During
the period of study, the average growth in sales revenue was 15.9%. The standard
deviation of 35.9% signifies significant variation in sales growth as evidenced by the
maximum observed sales growth rate was 249.4% and a minimum of -63.3% (decline)
Table 4.2: Sector-wise Financial Distress Summary Statistics
Sector Mean Std. Dev. Max Min Skewedness Kurtosis
Agriculture 9.09 2.08 15.9 4.21 0.78 4.17
Automobiles & accessories 6.69 2.90 11.67 -1.51 -0.88 4.27
Commercial & services 5.78 4.02 12.34 -9.85 -1.52 6.93
Construction & allied 7.20 1.89 11.99 3.95 0.56 2.56
Energy & petroleum 5.55 1.13 8.54 2.07 -0.01 4.87
Investments 18.34 28.37 130.93 4.02 3.43 13.64
Manufacturing & allied 9.41 2.81 17.08 4.07 0.6 2.89
Unbalanced panel of 41 non-financial firms listed in NSE observed for 10 years, Z-score
represents the index of financial distress derived from Altman‟s model for emerging
markets.
Table 4.2 show the Altman‟s Z-score summary statistics for each of the 7 sectors
analyzed by the study. The results indicate that commercial and services as well as
energy and petroleum sectors recorded the lowest mean Z-score values of 5.78 and 5.55

70
respectively. Further, the investments sector has the highest mean Z-score value of
18.34. This result signify that whereas firms operating within energy and petroleum and
commercial sectors were relatively financially distressed, those listed in the investments
sector were largely financially sound. This disparity could be attributed to the fact that
firms in the Energy and commercial sectors are more susceptible to negative effects of
external economic performance such as foreign exchange rate fluctuations and
inflationary pressures as opposed to firms in the investment sector. The results further
shows a high variability in Z-scores values within investments sector as depicted by
standard deviation value of 28.37. This is supported by the maximum observed value of
130.93 (Centum, year 2008) and minimum value of 4.02 (Olympia capital Ltd, year
2006). In contrast, firms listed in energy sector have less variability in Z-score values as
shown by relatively low standard deviation of 1.13. The negative Z-scores exhibited by
firms in automobiles and commercial sectors (Marshalls E.A Ltd, years 2010 and 2011;
Uchumi Supermarkets, years 2004 to 2009) indicate that the firms were nearly
financially impoverished as shown on appendix III. This disparity could be attributed to
differences in risk characteristics of individual firms operating in these sectors.
Particularly, the energy sector is regarded as severely exposed to negative effects of
economic downturn attributable to inflation, foreign exchange fluctuations and rise in
interest rates as compared to those in investment sector.

71
Table 4.3 Sector-wise Summary Statistics for Financial Leverage
Total debt Mean Std. Dev. Max Min Skewedness Kurtosis
Agriculture 0.32 0.09 0.56 0.16 0.57 3.13
Automobiles &
accessories 0.53 0.16 0.88 0.24 -0.21 2.35
Commercial & services 0.57 0.28 1.69 0.27 2.38 9.31
Construction & allied 0.52 0.14 0.76 0.26 -0.41 2.32
Energy & petroleum 0.59 0.11 0.8 0.36 -0.31 2.57
Investments 0.31 0.22 0.75 0.01 0.3 2.04
Manufacturing & allied 0.39 0.17 0.86 0.13 0.57 2.91
Total Equity Mean Std. Dev. Max Min Skewedness Kurtosis
Agriculture 0.68 0.09 0.84 0.44 -0.57 3.13
Automobiles &
accessories 0.47 0.16 0.76 0.12 0.21 2.35
Commercial & services 0.43 0.28 0.73 -0.69 -2.38 9.31
Construction & allied 0.48 0.14 0.74 0.24 0.41 2.32
Energy & petroleum 0.41 0.11 0.64 0.2 0.31 2.57
Investments 0.69 0.22 0.99 0.25 -0.3 2.04
Manufacturing & allied 0.61 0.17 0.87 0.14 -0.57 2.91
Unbalanced panel of 41 non-financial firms listed in NSE observed for 10 years, Total
debt and total equity variables are in ratios.
The results in Table 4.3 show that firms listed in Energy and Petroleum, Commercial
and Services, Automobiles and Accessories as well as Construction and allied sectors
preferred debt to equity capital in finance their assets. This is opposed to firms in
Investments, Agriculture and Manufacturing sectors that exhibited low mean gearing
levels. The results also indicate high debt utilization levels among non-financial firms in
the highly geared sectors. This is evidenced by observed maximum debt ratios
equivalent to 1.69 (commercial sector), 0.88 (Automobiles and Accessories), 0.80
(Energy and Petroleum). Considering that the three sectors posted the lowest mean Z-
score values, this empirical observation signifies that highly geared firms are more
prone to experience financial distress.

72
Table 4.4: Sector-wise Summary Statistics for Debt Maturity
Long-term debt Mean Std. Dev. Max Min Skewedness Kurtosis
Agriculture 0.67 0.16 0.95 0.27 -0.32 2.51
Automobiles & accessories 0.14 0.10 0.46 0.00 1.35 4.97
Commercial & services 0.31 0.24 0.76 0.00 0.26 1.68
Construction & allied 0.44 0.25 0.84 0.01 -0.16 1.67
Energy & petroleum 0.37 0.35 0.91 0.00 0.36 1.44
Investments 0.30 0.29 0.94 0.00 0.58 1.96
Manufacturing & allied 0.38 0.27 0.96 0.02 0.80 2.33
Short-term debt Mean Std. Dev. Max Min Skewedness Kurtosis
Agriculture 0.33 0.16 0.73 0.05 0.32 2.51
Automobiles & accessories 0.86 0.10 1.00 0.54 -1.35 4.97
Commercial & services 0.69 0.24 1.00 0.24 -0.26 1.68
Construction & allied 0.56 0.25 0.99 0.16 0.16 1.67
Energy & petroleum 0.63 0.35 1.00 0.09 -0.36 1.44
Investments 0.70 0.29 1.00 0.06 -0.58 1.96
Manufacturing & allied 0.62 0.27 0.98 0.04 -0.80 2.33
Unbalanced panel of 41 non-financial firms listed in NSE observed for 10 years, long
term debt and short term debt variables are in ratios.
The results displayed in Table 4.4 shows how different sectors utilized debt maturity
during the study period as reflected by long-term and short-term debt levels. The results

73
indicate that on average, all sectors except agriculture preferred short-term to long term
debt. The strong preference for short term debt was evidenced by the observation where
some firms‟ entire debt structure constituted of current liabilities (Longhorn Kenya,
years 2009, 2012 and 2013; Nation Media group, year 2010, Scan group, year 2006;
Total Kenya, years 2004 to 2008; Centum Ltd, years 2007 to 2010 and Nairobi
Securities Exchange, years 2010 and 2011). The marked preference for short term debt
by firms could be attributed to the fact that the market for long term debt is not
developed in Kenya as compared to developed countries. Preference for long-term debt
by firms in agriculture sector could be attributed to the long term nature of agricultural
operations.

74
Table 4.5: Sector-wise Summary Statistics for Equity Structure
Internal equity Mean Std. Dev. Max Min Skewedness Kurtosis
Agriculture 0.87 0.13 0.99 0.48 -1.57 4.41
Automobiles &
accessories 0.72 0.24 0.95 0.25 -0.83 2.08
Commercial & services 0.80 0.75 5.99 -1.73 3.60 30.45
Construction & allied 0.82 0.10 0.94 0.50 -1.24 4.45
Energy & petroleum 0.74 0.25 0.99 0.30 -0.52 1.58
Investments 0.75 0.22 0.98 0.40 -0.35 1.43
Manufacturing & allied 0.74 0.18 0.95 0.24 -0.85 2.82
External equity Mean Std. Dev. Max Min Skewedness Kurtosis
Agriculture 0.13 0.13 0.52 0.02 1.57 4.41
Automobiles &
accessories 0.46 0.29 0.85 0.08 0.00 1.30
Commercial & services 0.20 0.75 2.73 -4.99 -3.60 30.45
Construction & allied 0.19 0.10 0.50 0.06 1.24 4.45
Energy & petroleum 0.13 0.18 0.70 0.01 2.02 5.87
Investments 0.25 0.22 0.60 0.02 0.35 1.43
Manufacturing & allied 0.26 0.18 0.76 0.05 0.85 2.82
Unbalanced panel of 41 non-financial firms listed in NSE observed for 10 years, internal
and external equity variables are in ratios.

75
Table 4.5 shows how different sectors utilized different sources of equity capital to
finance their assets during the period of study. The results demonstrate a clear
preference for internal equity over external equity across all the seven sectors within
which non-financial firms are listed. This finding concurs with the results by Ongore
(2011) whose study that sought to test whether firms listed in NSE adopted pecking
order hypothesis in their capital structure found a marked preference for internal sources
of finance over external sources. The author attributed this behavior to the high cost of
obtaining external financing from the Kenya‟s financial markets. Disparity in utilization
of different sources of equity finance is further reinforced by the observation concerning
firms whose equity structure constituted 99% internal equity. The strong preference for
internal equity by non-financial firms could be attributed to the fact that it is cheaper in
that it does not involve issue costs. Besides, internal equity preserves the ownership
structure of firms and does not expose the firm to external obligations in terms of
payment of dividends.
Table 4.6: Sector-wise Summary Statistics for Asset Structure
Tangibility Mean Std. Dev. Max Min Skewedness Kurtosis
Agriculture 0.71 0.15 0.91 0.23 -0.99 3.52
Automobiles &
accessories 0.36 0.16 0.83 0.16 1.25 4.12
Commercial & services 0.58 0.24 0.88 0.04 -0.75 2.41
Construction & allied 0.56 0.19 0.82 0.17 -0.51 1.80
Energy & petroleum 0.51 0.28 0.91 0.13 0.11 1.32
Investments 0.67 0.22 0.98 0.28 -0.04 1.88
Manufacturing & allied 0.50 0.16 0.77 0.16 -0.43 2.45
Unbalanced panel of 41 non-financial firms listed in NSE observed for 10 years,
Tangibility is in ratio

76
The results presented in Table 4.6 show that firms in agriculture sector had the highest
mean assets tangibility ratio (71.3%) while those in automobiles sector had the least
(35.8%). It is also evident that majority of sector firms had most of their assets in fixed
form over the period of study with firms in investment sector posting tangibility ratio of
up to a maximum of 98%. Large tangibility ratio points towards increased borrowing
capacity resulting from high collateral availability.
Table 4.7: Sector-wise Summary Statistics for other Variables
Size Mean Std. Dev. Max Min Skewedness Kurtosis
Agriculture 1,167 4.00 9,436 57.53 -0.59 2.52
Automobiles &
accessories 3,048 3.00 14,650 514.00 0.01 2.03
Commercial &
services 5,723 5.00 128,315 433.65 0.42 2.14
Construction &
allied 6,583 3.00 43,142 493.86 -0.15 2.04
Energy &
petroleum 42,287 3.00 189,519 6,261.94 -0.14 2.11
Investments 1,886 5.00 23,915 91.13 0.01 1.73
Manufacturing &
allied 5,025 4.00 58,820 822.41 0.21 1.75
Sales Growth Mean Std. Dev. Max Min Skewedness Kurtosis
Agriculture 0.14 0.33 1.59 -0.57 1.35 7.75
Automobiles &
accessories 0.08 0.25 0.69 -0.63 0.06 4.61
Commercial &
services 0.16 0.39 2.49 -0.49 3.11 19.24
Construction &
allied 0.19 0.19 0.76 -0.28 0.49 4.56
Energy &
petroleum 0.17 0.39 1.61 -0.43 1.92 7.36
Investments 0.35 0.66 2.07 -0.63 0.96 3.43
Manufacturing &
allied 0.10 0.16 0.60 -0.23 0.57 3.78
Unbalanced panel of 41 non-financial firms listed in NSE observed for 10 years, size is
in millions Kshs, and sales growth variables is in ratios

77
Table 4.7 show that the energy sector had the highest mean firm size as proxied by total
assets at Kshs 42.287 billion while agriculture sector was least at Kshs 1.167 billion.
During the period, the energy sector had the firm with the maximum value of total assets
at Kshs 188.7 billion (Kengen, year 2013) while agriculture had the firm with the
minimum assets value at Kshs 57.3 million (REA Vipingo, year 2006). Further, the
standard deviation results across the sector shows less variability in asset values during
the period. Total assets value depicts the ability of the firm to remain solvent over a
considerable period of adverse performance. In general, the results indicates that
although there were disparities in firm sizes in different sectors, firms within the same
sector had no significant variation in their asset values.
Finally, Table 4.7 show that the investments sector experienced the highest average
annual growth in sales over the period of study (35.3%) while automobiles and
manufacturing sectors had the least (7.7% and 9.6%). The growth in investment sector
sales however had the greatest variability as evidenced by the associated standard
deviation. Growth in sales points to the stability of the firm‟s (sectors) cash flow streams
and hence ability to cope with instances of financial distress.
4.3 Panel Data Specification Tests
To determine the suitability of the panel data for statistical analysis, various tests were
conducted. The tests that aimed at establishing if the panel data fulfilled the cardinal
requirements of classical linear regression analysis included: normality test, panel unit
root test, multicollinearity test, panel-level heteroscedasticity test as well as serial
correlation test. Where violation to these assumptions were detected, appropriate
remedies were applied. In addition, panel cointegration test was conducted to determine
if the variables used in the study had a long run association. This section therefore
presents the results of various diagnostic tests carried out on the data together with the
relevant remedial treatment undertaken to ensure suitability of the data

78
4.3.1 Panel Data Normality Test
Table 4.8: Panel Variables Skewedness/Kurtosis tests for Normality
Joint
Variable Obs Pr (Skewedness) Pr(Kurtosis) adj chi2(2) Prob>chi2
otal debt 386 0.0535 0.0000 0.0000
Long term debt 386 0.0535 0.0000
Short term debt 386 0.0228 56.19 0.0000
Tangibility 386 0.9727 0.2552 0.5213
Size 386 1.30
Sales growth 347 0.0000 0.0000 0.0000
Total equity 386 0.0000 0.0000 0.0000
Internal equity 386 0.0000 . 0.0000
External equity 386 0.0000 . 0.0000
Financial distress 386 0.0000 0.0000 0.0000
H0: Panel data is normally distributed; Significance level: 5%

79
Table 4.8 illustrate the results of Skewedness/Kurtosis test on the panel data. The
objective of the test is to find out whether or not the data is normally distributed. The
test statistic is a chi-square distribution for both individual and joint measures of
skewedness and kurtosis. The test was carried out against the null hypothesis of normal
distribution.
The results indicate that the chi-square statistic for both individual and joint tests for all
variables except size had corresponding p-values equal to 0.0000. This means that the
alternative hypothesis of normality is rejected at 5% significance level; implying that the
data was not normally distributed. Particularly, the large standard deviation and
coefficients of skewedness and kurtosis revealed by total debt, total equity, internal
equity, external equity, sales growth and Z-score index variables as shown on Table 4.1
signified presence of outliers. To establish the presence of outliers, box plots technique
was employed for individual variables as presented by figures 4.1 to 4.6.
0
.2
.4
.6
.8
1
1.2
1.4
1.6
1.8
Debt
-cap
ital r
atio
Figure 4.1: Total debt box plots

80
-.8
-.6
-.4
-.2
0
.2
.4
.6
.8
1
Equ
ity-C
apita
l ra
tio
Figure 4.2: Total Equity box plots
-2
-1
0
1
2
3
4
5
6
Inte
rnal
equ
ity-T
otal
equ
ity r
atio
Figure 4.3: Internal Equity box plots

81
-5
-4
-3
-2
-1
0
1
2
3
Exte
rnal
equ
ity-T
otal
equ
ity ra
tio
Figure 4.4: External Equity box plots
-1
-.5
0
.5
1
1.5
2
2.5
Sale
s gr
owth
/dec
line
ratio
Figure 4.5: Sales growth Box Plots

82
-10
0
10
20
30
40
50
60
70
80
90
100
110
120
130
Z-sc
ore
index
Figure 4.6: Financial Distress box plots
The line in the box represents the median observation while the whiskers shows the
largest and least non-outlier observations (1.5 times on either side of first and third
quartiles respectively). The observations near the whisker were the near outliers, while
those at the extreme are the far outliers. In order to obtain a relatively normally
distributed data-set, all the potential far outliers were eliminated. This was achieved by
eliminating the firm-year observations that were outside the range: 0<Total debt>1.0,
0<Total equity>1.0, 0<Internal equity>1.30, 0<external equity>1.0, -0.6<Sales
growth>1.20, 0<Z-score index>20 for the variables.
This screening process resulted in a loss of 19 firm-year observations on individual
variables. The summary statistics for the new data set after eliminating the potential far
outliers is shown on the Table 4.9.

83
Table 4.9 Summary Statistics for the Variables without Outliers
Variables Mean Std. Dev. Max Min Skewedness Kurtosis
Financial distress 7.85 3.01 19.42 -1.51 0.83 4.80
Total debt 0.45 0.17 0.88 0.07 0.09 2.21
Total equity 0.55 0.17 0.93 0.12 -0.09 2.21
Internal equity 0.78 0.20 1.00 0.11 -1.14 3.38
External equity 0.23 0.22 0.89 0.00 1.25 3.65
Sales growth 0.13 0.26 1.19 -0.63 0.76 5.75
Table 4.9 indicate that by eliminating the far outliers, data on the specified variables has
been re-distributed. This is illustrated by the coefficient of skewedness and kurtosis
values that have reduced to near normal distribution levels of 0 and 3 respectively for all
variables except sales growth variable. However, the data was considered good for
further analysis considering that sales growth played a controlling role in the model.

84
4.3.2 Panel Unit Root Test
Panel unit root test was applied on all variables used in the analysis in order to
determine whether or not the panel data was stationary. This involved solving for the
value of ρ in the general equation:
…………………………………………………… (13)
Where:
t = 1….10 years and i = 41 firms
If ρ = 1, it implied that the observation Yit was dependent on its lag value Yit-1 and hence
the data was non-stationary. The converse would be true if ρ<1. The necessity of this
procedure was to avoid a situation where the obtained regression results were spurious;
hence jeopardizing testing of hypothesis concerning the significance or otherwise of the
explanatory variables (Granger & Newbold, 1974). The result of the panel unit root test
for all variables has been laid out on Table 4.10.

85
Table 4.10: Panel Unit Root Test Results
Variable Test Statistic p-value Statistic p-value
Without trend
With trend
Financial distress Levin-Lin-Chu -32.3596 0.0000 -29.6883 0.0000
Fisher-type -PP 150.2357 0.0000 244.1080 0.0000
Fisher-type -ADF 150.2357 0.0000 244.1080 0.0000
Total debt Levin-Lin-Chu -18.1644 0.0000 -31.7803 0.0000
Fisher-type -PP 246.6892 0.0000 221.2437 0.0000
Fisher-type -ADF 246.6892 0.0000 221.2437 0.0000
Long-term debt Levin-Lin-Chu -9.7800 0.0000 -13.9031 0.0000
Fisher-type -PP 179.6664 0.0000 147.3211 0.0000
Fisher-type -ADF 179.6664 0.0000 147.3211 0.0000
Short-term debt Levin-Lin-Chu -9.0145 0.0000 -13.5584 0.0000
Fisher-type -PP 242.8564 0.0000 219.8822 0.0000
Fisher-type -ADF 242.8564 0.0000 219.8822 0.0000
Total equity Levin-Lin-Chu -22.3505 0.0000 -34.6432 0.0000
Fisher-type -PP 140.4003 0.0010 124.8215 0.0000
Fisher-type -ADF 140.4003 0.0010 124.8215 0.0000
Internal equity Levin-Lin-Chu -49.3305 0.0000 -17.2045 0.0000
Fisher-type -PP 206.6005 0.0000 93.8153 0.1385
Fisher-type -ADF 206.6005 0.0000 93.8153 0.1385
External equity Levin-Lin-Chu -4.7246 0.0000 -26.4000 0.0000
Fisher-type -PP 183.8243 0.0000 186.8552 0.0000
Fisher-type -ADF 280.5745 0.0000 183.8243 0.0000
Tangibility Levin-Lin-Chu -45.7073 0.0000 -36.8190 0.0000
Fisher-type -PP 134.4934 0.0001 171.9637 0.0000
Fisher-type -ADF 141.5475 0.0000 134.4934 0.0001
Size Levin-Lin-Chu -65.1811 0.0000 -26.6006 0.0000
Fisher-type -PP 188.8175 0.0000 193.0272 0.0000
Fisher-type -ADF 159.0377 0.0000 188.8175 0.0000
Sales growth Levin-Lin-Chu -8.2530 0.0000 -8.7806 0.0000
Fisher-type -PP 253.8599 0.0000 271.9946 0.0000
Fisher-type -ADF 352.5298 0.0000 253.8599 0.0000
The p-values for the Fisher tests were based on asymptotic Chi-square distribution. The
LLC test is based on asymptotic normality.
The results presented on Table 4.10 are based on Levin-Lin-Chu, the Fisher-type
Augmented Dickey and Fuller (ADF) and the Fisher-type Phillips and Perron (PP) tests
with and without time trend. The null hypothesis was that panel data was non-stationary

86
i.e. [(H0): ρ = 1] against the alternative hypothesis that the data was stationary i.e. [(H0):
ρ <1]. Both LLC and Fisher-type tests were employed because of their effectiveness in
handling unbalanced panel data such as the one used in the study (Mahadeva &
Robinson, 2004). Particularly, the LLC provides for heterogeneity of individual effects
by generalizing the specified model. In addition, it provides for heterogeneous serial
correlation structure of the error-terms, by assuming homogenous first-order regressive
parameters. Both the result of ADF and Phillips Perron (PP) are presented for
comparison purposes. This is based on the observation by Maddala and Wu (1999) that
unlike the ADF test which is parametric, the PP test is non-parametric and hence robust
in presence of serial correlation in the error terms without adding lagged difference
terms. In addition, the tests played a confirmatory and complementary role to the
findings of LLC test.
The results based on the LLC, Fisher-type ADF and Fisher-type PP panel unit root test
procedures corresponded to the 10 variables that were used in the study. The null
hypothesis of “non-stationarity” was rejected if the associated p-value was less than the
conventional 5% statistical level of significance based on consistency of the test statistic
results of the 3 methods. However, LLC test results were considered with much weight
since they were more accurate. Test results indicated that all the variables used in the
study were stationary since the ρ-values associated with the respective test statistics
were less than 0.05. Rejection of the null hypothesis implied that the 10 variables were
used in levels instead of their first difference.
4.3.3 Panel Multicollinearity Test
Pair-wise correlation was used to examine the level of collinearity present between
explanatory variables used in the study. Table 4.11 shows the correlation coefficient
matrix of both the primary and moderated variables.

87
Table 4.11: Pairwise Correlation matrix of the Regression Variables
Variables TD LTD STD TE IE EE TANG SZ SG TE*SZ IE*SZ EE*SZ TD*SZ LTD*SZ STD*SZ FD
TD 1.000
LTD -0.1759* 1.000
STD 0.1759* -1.0000* 1.000
TE -1.0000* 0.1759* -0.1759* 1.000
IE -0.2645* 0.1179* -0.1179* 0.2645* 1.000
EE 0.2942* -0.3191* 0.3191* -0.2942* -0.7484* 1.000
TANG -0.1977* 0.7203* -0.7203* 0.1977* 0.1606* -0.3865* 1.000
SZ 0.3234* 0.085 -0.085 -0.3234* 0.1370* -0.1999* 0.1805* 1.000
SG 0.043 -0.003 0.003 -0.043 0.075 -0.079 -0.072 0.040 1.000
TE*SZ 0.012 -0.2442* 0.2442* -0.012 -0.2116* 0.2163* -0.096 -0.045 -0.056 1.000
IESZ 0.2078* -0.2682* 0.2682* -0.2078* -0.1421* 0.3647* -0.1550* -0.101 -0.070 0.3075* 1.000
EE*SZ -0.2486* 0.002 -0.002 0.2486* 0.4261* -0.1263* -0.1138* -0.1621* 0.079 -0.2737* -0.6056* 1.000
TD*SZ -0.012 0.2442* -0.2442* 0.012 0.2116* -0.2163* 0.096 0.045 0.056 -1.000 -0.3075* 0.2737* 1.000
LTD*SZ 0.2280* -0.086 0.086 -0.2280* -0.2533* 0.001 0.088 0.2541* 0.000 0.1163* -0.062 -0.3705* -0.1163* 1.000
STD*SZ -0.2280* 0.086 -0.086 0.2280* 0.2533* -0.001 -0.088 -0.2541* 0.000 -0.1163* 0.062 0.3705* 0.1163* -1.000 1.000
FD -0.8095* 0.022 -0.022 0.8095* 0.2809* -0.2326* -0.1524* -0.3133* 0.093 -0.1698* -0.2090* 0.3299* 0.1698* -0.1948* 0.1948* 1.000
The asterisk * indicate significance at the 5% level; included observations: 367

88
Table 4.11 show significant correlation between financial distress (Z-score index) and
total debt, total equity, internal equity, external equity, tangibility and firm size all at
0.05 significance level. The significant inverse correlation between Z-score and total
debt implies that highly indebted firms are more likely to be financially distressed in
comparison with the less geared firms. The situation would be contrary where a firm is
mainly financed through equity. The positive significant correlation between Z-score
and internal equity and the negative strong correlation between Z-score and external
equity respectively signifies that internally generated sources of capital; which comprise
retained earnings and reserves is less likely to drive a firm into financial distress as
opposed to utilization of external equity.
On the other hand, the strong negative correlation between Z-score, tangibility and size
indicate that large firms are more susceptible to financial distress than small firms. This
could be attributed to the fact that large firms are prone to heavy borrowing due to the
assumed higher debt capacity and hence sink into financial quagmire (Gupta et al.,
2014). The results also show that large firms generally prefer to borrow more and issue
less equity. This is evidenced by the significant positive correlation between size and
total debt variables. It can also be deduced that whenever large firms utilize equity
capital, preference is given to internal equity as opposed to external equity. The results
also illustrate that although highly tangible firms generally borrow less (strong negative
correlation with total debt), whenever they borrow, they utilize more long term debt than
short term debt. This is attributed to their assumed high collateralization in terms of
fixed assets used to secure long term borrowing.
The results show perfect negative correlations between total debt and total equity as well
as between long-term debt and short-term debt. This was not a surprise considering that
equity and debt are the two major components of the capital structure. A similar result
was revealed by correlation between long term and short term debt; which are
technically substitute sources of corporate debt financing. The negative correlation
between internal equity and external equity (-0.7484), though not perfect was

89
significantly high. The correlation coefficients for the rest of the variables, being well
below 0.8 did not signify severe multicollinearity as recommended by Gujarati (2003)
and Cooper and Schindler (2008).
To address the severe multicollinearity problem exhibited by the variables with
significantly high correlation coefficients, the study adopted variable elimination
technique where variables were dropped based on post estimation VIF values in such a
manner that they did not enter the model at the same time (Kodongo, Natto, & Biekpe,
2015). For the pair of variables exhibiting perfect negative correlation, the study
dropped one of the two variables that exhibited a higher VIF value.
Ordinarily, severe multicollinearity would be exhibited between the primary and their
corresponding moderated variables; e.g. between total debt (TD) variable and total debt
moderated by size (TD*SZ). This undesirable phenomenon makes it very difficult to
distinguish the unique contributions of individual predictors on the variance of the
dependent variable. High correlations among predictors also makes the standard errors
of the estimated coefficients large hence compromising inferential estimation. To deal
with this multicollinearity problem between primary and moderated variables, the study
adopted variable centering approach in line with recommendations of Fairchild and
MacKinnon (2009). The procedure involves transforming the variable by subtracting the
sample mean prior to computing the product terms. As shown by pair-wise correlation
results displayed in Table 4.11, variable centering technique helped to mitigate severe
multicollinearity problem between the primary variables and moderated variables.
However, perfect negative correlation coefficients (-1.000) was still present between
Total debt*SZ and Total equity*SZ variables as was the case between long-term
debt*SZ and short-term debt*SZ variables. The study dealt with this problem by
dropping Total equity*SZ and Short term debt*SZ variables from further analysis as
they exhibited higher VIF values as shown in Table 4.12 and in line with
recommendations of Maddala and Wu (1999).

90
Table 4.12: Post-estimation Variance Inflation Factor Results
Regression model 2 Model (2a) Model (2
b) Model (2
c)
Variable VIF VIF VIF
Short term debt*SZ 5.45E+07
Long-term debt*SZ 5.21E+07 2.40 2.31
Total equity*SZ 2.47E+07 5.15
Total debt*SZ 1.70E+07 5.01 1.18
Internal equity*SZ 2.55 2.53 1.83
Tangibility*SZ 2.43 2.42 2.41
External equity*SZ 2.32 2.29 2.16
Sales growth 1.03 1.03 1.03
Mean VIF 1.85E+07 2.98 1.82
4.3.4 Panel-level Heterescedasticity Test
Heteroscedasticity refers to a situation where the variance of the residual-term is not
constant but varies with changes in explanatory variables (Gujarati, 2003). Although use
of heteroscedastic data still provide unbiased OLS estimators, they are not efficient i.e.
they do not have minimum variance in the class of all unbiased estimators. This results
to smaller t-statistic value leading to inaccurate test of hypothesis. The assumption of

91
classical linear regression model is therefore that the error-term variance should be
constant.
To test for panel level heteroscedasticity, the study adopted the Modified Wald test
method. This involved first estimating the specified empirical models for fixed effects
with robust-standard errors and then running the Modified Wald test against the null
hypothesis of homoscedastic (constant) error variance (Torres-Reyna, 2007). The results
are presented in Table 4.13.
Table 4.13: Modified Wald Test Results for Panel-level Heteroscedasticity
Fixed effects Chi-square statistic (41) p-value
Panel Model 10 24458.12 0.0000
Panel Model 11 19186.40 0.0000
Panel Model 12 7794.54 0.0000
H0: Constant error variance (homoscedasticity)
The test results for the three models provide chi-square distribution values of 24458.12,
19186.40 and 7794.54 with corresponding p-values of 0.0000 in each case. The results
show that the chi-square statistics were all significant at 5 percent level and hence the
null hypothesis of constant variance was rejected. This signified existence of panel-level
heteroscedasticity in the panel data as recommended by (Wiggins & Poi, 2001). To
correct this violation of classical linear regression assumptions, the study employed
either the feasible generalized least squares (FGLS) estimation technique or estimated
the model using robust standard errors as appropriate instead of the ordinary least
squares method.

92
4.3.5 Serial Correlation Test
Serial correlation refers to a situation where the error terms are correlated with each
other, i.e. the disturbance term of one observation is influenced by the disturbance term
relating to another observation (Gujarati, 2003). The result is that the OLS estimators
determined in presence of autocorrelation normally provide smaller standard errors than
what is appropriate leading to misleading results of hypothesis testing. Also, the R-
squared (coefficient of determination) value is deceptively large (Torres-Reyna, 2007).
To detect presence of autocorrelation in panel data, the study employed the Wooldridge
test for autocorrelation against the null hypothesis that there was no first order
autocorrelation.
Table 4.14: Wooldridge Test Results for Serial Correlation
Model F-test statistic (1, 38) p-value
Panel Model 10 22.630 0.0000
Panel Model 11 10.899 0.0021
Panel Model 12 17.915 0.0001
H0: No first order autocorrelation; Tests carried out at 5% significance level
As illustrated on Table 4.14, the results provided an F-test statistic with one and thirty
eight degrees of freedom. The F-test statistics for models 10, 11 and 12 were 22.630,
10.899 and 17.915, respectively with corresponding p-values equivalent to 0.0000,
0.0021 and 0.0001 respectively. The results indicate that the F-test were statistically
significant at 5 percent significance level. The finding therefore signifies a problem of
first order autocorrelation in the panel data. The study dealt with this violation of

93
classical linear regression model assumption by either employing FGLS estimation or
used robust standard errors approach depending on the nature of the estimated effects.
4.3.6 Panel Cointegration Test
According to Baltagi et al. (2005), panel cointegration test in empirical research
provides the researcher with a mechanism to determine the long run relationship among
the study variables. The test assumes that the variables are not cointegrated; meaning
that all linear combinations of the dependent and explanatory variables, including the
residuals from OLS, are unit root non-stationary. This was alluded to by Granger (1986)
when he observed that “a test for cointegration can be thought of as a pre-test to avoid
„spurious regression‟ situations”.
The study performed Johansen test for cointegration with a constant trend and 1 lag as
chosen through lag-order selection (pre-estimation) test for VAR models. The test was
carried out for both primary and moderated variables against the null hypothesis of no
cointegration of variables and alternative hypothesis that the variables were
cointegrated. The test results rejected the null if both trace and max statistics exceeded
their corresponding critical values at 5% significance level; otherwise the null was
accepted. The results of panel cointegration tests on the primary variables are presented
on Table 4.15.

94
Table 4.15: Johansen Test for Cointegration Results
Trend: Constant
Observations 399
Sample: 2-400 Lags 1
Maximum
Rank Parms LL Eigenvalue
Trace
statistic
5%
Critical
value
Max statistic
5%
Critical
value
0 7 195.4845
669.58 124.24 332.452 45.28
1 20 361.7105 0.5654 337.13 94.15 117.8006 39.37
2 31 420.6109 0.2557 219.33 68.52 63.3914 33.46
3 40 452.3065 0.1469 155.94 47.21 45.8487 27.07
4 47 475.2309 0.1086 110.09 29.68 41.3762 20.97
5 52 495.919 0.0985 68.71 15.41 40.4952 14.07
6 55 516.1666 0.0965 28.22 3.76 28.2174 3.76
7 56 530.2753 0.0683
Variables: Z-score, Total debt, Total equity, Long-term debt, Short term debt, internal
equity, external equity, Tangibility, Sales growth
Null Hypothesis: No cointegration among variables

95
The results of Johansen test for cointegration displayed in Table 4.15 show that trace
statistics exceeded the corresponding 5% critical values at all levels of variable
combination under both models. This suggested that the null hypothesis of no
cointegration could be rejected at all levels of variable combinations (maximum ranks)
for both models. The result implied that the primary variables were cointegrated and
therefore have a long-run association. Further, comparing the max statistic against the
corresponding 5% critical values show that max statistic exceeded the critical values at
5% significance level for all levels of variable combinations. The result therefore led to
rejection of the null hypothesis of no cointegration; effectively confirming cointegration
among variables used in the models.
4.3.7 The Hausman Test for Model Effects Estimation
In order to establish which estimation effects (between fixed and random) provided
superior results for the study, Hausman test was carried out for each of the specified
panel regression models. The test was conducted against the null hypothesis that random
effect model was the preferred model. The test results rejected the null if the chi-square
statistic was significant at 5% significance level; otherwise, the null was accepted.

96
Table 4.16: Hausman Test Results
Model Degrees of freedom Chi-square statistic p-value
10 6 15.30 0.1180
11 6 8.26 0.2199
H0: Random effects model is appropriate;
Significance level: 5%
Table 4.16 display the Hausman specification test results for panel regression equations
1 and 2. The test results show that the chi-square statistics for panel equation 1 and 2
were statistically insignificant at 5% level as supported by the p-values of 0.1180 and
0.2199 respectively. The study therefore failed to reject the alternative hypothesis that
the random effects estimation was appropriate for both equation 1 and 2 at 0.05
significance level. Effectively, the study estimated the panel equations for random
effects.
To determine the appropriate estimation effects (between fixed effects and random
effects) for the individual sectors panel regression equations, Hausman test as described
above was repeated after estimating panel regression model 3 for each of the 7 sectors.
The results are laid out in Table 4.17.

97
Table 4.17: Sector-wise Hausman Specification Test Results
Sector
Degrees of
freedom
Chi-square
statistic p-value
Agriculture 5 0.83 0.9341
Automobiles & accessories 6 14.10 0.0286
Commercial & Services 5 0.82 0.9359
Construction & Allied 5 5.74 0.1023
Energy & Petroleum 6 27.86 0.0001
Investments 5 4.54 0.4742
Manufacturing & Allied 5 2.46 0.7819
H0: Random effects model is appropriate; Significance level: 5%
The sector-wise Hausman test results illustrated in Table 4.17 show the chi-square
statistic and corresponding p-values for the panel regression models under the study
against the alternative hypothesis that random effects model is appropriate. Based on the
tests results, the choice of the model used to estimate sector regression results is
summarized in Table 4.18:

98
Table 4.18: Sector-wise Panel Regression Estimation Effects
Sector Appropriate model
Agriculture Random effects
Automobiles & accessories Fixed effects
Commercial & Services Random effects
Construction & Allied Random effects
Energy & Petroleum Fixed effects
Investments Random effects
Manufacturing & Allied Random effects
4.4 Panel Regression Analysis
The first stage involved regressing the panel Z-score index for financial distress against
the primary capital structure variables while controlling for firm-specific variables as
specified under panel model 9 and 10. To determine the moderating effect of firm size
on the relationship between capital structure and financial distress, an estimation of
panel model 11 was undertaken. This involved regressing Z-score index for financial
distress (dependent) variable against both the primary variables and the interactive
variables derived from the product terms of capital structure and firm size variables
while still controlling for the sales growth. A comparative analysis of the panel model
regression results was then conducted to determine the direction, magnitude and
significance of moderation. Finally, panel model 12 was estimated for individual sectors

99
in order to establish the capital structure-financial distress relationship within each
sector.
4.4.1 Effect of Capital Structure on Financial Distress
The overall objective of the study was to establish the effect of capital structure on
financial distress of non-financial firms listed in NSE. To achieve this objective, the
study estimated panel regression Equation 9 and 10 for random effects as supported by
the Hausman test. However, to deal with panel-level heteroscedasticity and serial
correlation detected in the panel data, Feasible Generalized Least Square (FGLS)
estimation technique instead of Ordinary Least Square (OLS) was employed as it
provided consistent estimators (Torres-Reyna, 2007). Also, in the light of perfect
negative collinearity established between total debt and total equity as well as between
long-term debt and short-term debt, both total equity and short-term debt variables were
dropped from analysis on the basis of their comparatively high post-estimation Variance
Inflation Factors (VIF). The results of panel regression analysis are laid out in Table
4.19.

100
Table 4.19: FGLS Random- effects Panel Regression Results
Dependent variable: Financial Distress
Variable Coefficient
Std.
Errors t-statistic Prob.
Model 1a
Constant 18.3581*** 1.3985 13.13
0.000
0
Total debt -13.2959*** 0.5543 -23.99
0.000
0
Long-term debt 3.0207*** 0.4148 7.28
0.000
0
Internal equity -0.5974 1.2834 -0.47
0.642
0
External equity -2.2024 1.2825 -1.72
0.086
0
Tangibility -8.3468*** 0.5793 -14.41
0.000
0
Model 1b
Constant 17.9999*** 1.3718 13.12
0.000
0
Total debt
-
13.4013*** 0.5783 -23.18
0.000
0
Long-term debt 3.1572*** 0.4255 7.42
0.000
0
Internal equity -0.3179 1.2525 -0.25
0.800
0
External equity -2.0024 1.2421 -1.61
0.107
0
Tangibility -8.3377** 0.5883 -14.17
0.000
0
Sales growth 0.4541** 0.2000 2.27
0.023
0
Statistics Model 1a
Model
1b
Chang
e
R-Squared 0.7753 0.7903 0.0150
Rho 0.6357 0.6266 0.0091
Wald-statistic (6) 834.20 787.92 46.28
Prob. (Wald-statistic) 0.0000 0.0000 0.0000
The asterisk ***, **, * represent significance at 1%, 5% and 10% levels respectively.

101
Table 4.19 indicate the panel regression results of panel model 9 estimated with the Null
hypothesis that; "There was no improvement in the relationship between the set of
explanatory variables and financial distress when the control variable (sales growth)
were added”. Panel model 1a show the regression results with only the capital structure
variables while panel model 1b show the results after controlling for sales growth. With
an R² of 0.7753 in model 1a and 0.7903 in model 1b, the analysis shows the change in R-
Square statistic associated with the added variable (sales growth) is 0.0150. This
reduction R², means that the information provided by the added control variable reduced
the error in predicting financial distress by 0.0091. This meant that including the control
improved in predicting financial distress and reduced the prediction error. The results
further show that the F-statistic associated with inclusion of sales growth reduced by
46.28 with a probability of 0.0000. Based on these results, the null hypothesis that there
was no improvement in the model by adding the control variable was rejected at 5%
level.
Table 4.19 show that both the capital structure and control variable jointly explain up to
79.03% of variations in financial distress of non-financial firms listed in NSE. This is
based on the resultant coefficient of determination (R2) value equivalent to 0.7903. This
indicate a relatively good measure of fit for the variables included in the model.
Further, the Wald-statistic value equivalent to 787.92 together with the corresponding p-
value of 0.0000 signify that the coefficients of the six variables are jointly statistically
different from zero at 99%, 95% and 90% confidence levels.
The results further show that the intercept term, as well as the coefficients of total debt,
long-term debt and tangibility are all statistically significant at 1 percent level as their
corresponding p-values were less than 0.01 whilst sales growth is significant at 5%
level. However, the coefficients of internal equity and external equity variables are
insignificant at 10% level with p-values of 0.8000 and 0.1070 respectively. This could
be attributed to the strong correlation present between the two variables as suggested by
significantly high negative correlation coefficient (-0.7484) depicted in Table 4.11

102
(Gujarati, 2003). To deal with this problem, each highly collinear variable was dropped
alternately and panel regression equation 1 estimated again. The results of the step-wise
model regression estimation are illustrated in Table 4.20.
Table 4.20: FGLS Step-wise Panel Regression Results for Random Effects
Dependent Variable: Financial Distress
Equation 1a Equation 1
b Equation 1
c Equation 1
d
Variable
Coefficient
(prob.)
Coefficient
(prob.)
Coefficient
(prob.)
Coefficient
(prob.)
Constant 16.0445***
(0.0000)
17.6699***
(0.0000)
19.2634***
(0.0000)
20.8331***
(0.0000)
Total debt -13.4632 ***
(0.0000)
-13.3907***
(0.0000)
-13.4632***
(0.0000)
-13.3907***
(0.0000)
Long-term debt 3.2189***
(0.0000)
3.1632***
(0.0000)
Short-term debt -3.2189***
(0.0000)
-3.1632***
(0.0000)
Internal equity 1.5019***
(0.0060)
1.5019***
(0.0060)
External equity -1.7197***
(0.0020)
-1.7197***
(0.0020)
Tangibility -8.1899***
(0.0000)
-8.3191***
(0.0000)
-8.1899***
(0.0000)
-8.3191***
(0.0000)
Sales growth 0.4631**
(0.0210)
0.4563**
(0.0220)
0.4631**
(0.0210)
0.4563**
(0.0220)
Statistics
R-Squared 0.7906 0.7917 0.7906 0.7917
Rho 0.6154 0.6252 0.6154 0.6252
Wald-statistic 784.52 790.54 784.52 790.54
Prob.(Wald-statistic) 0.0000 0.0000 0.0000 0.0000
Observations 367 367 367 367
The asterisk ***, **,* represent significance at 1%, 5% and 10% levels respectively
The results show that upon performing step-wise regression analysis, the coefficients of
all explanatory variables except sales growth are significant at 1% level. The coefficient
of sales growth is however significant at 5% level.

103
4.4.2 Effect of Financial Leverage on Financial Distress
The study sought to investigate the effect of financial leverage (utilization of debt and
equity in the capital structure) on financial distress of non-financial firms listed in NSE.
The regression results presented in Table 4.20 show that the coefficients of total debt
equivalent to -13.4632 and -13.3907 are negative and statistically significant at 1%
level. This finding indicate that during the period of analysis, increasing the level of debt
financing in the capital structure reduced their Z-score index; meaning the firms were
driven into financial distress.
The result could be attributed to the high cost of debt financing prevailing in Kenya in
terms of high fixed charges (interest) applied on borrowed capital. This is further
explained by the fact that majority of Kenyan firms utilize the relatively expensive
commercial bank loans as their main source of borrowed capital; usually due to lack of
alternative sources of debt capital (Bitok et al., 2011). In addition, the policy of the
government to borrow domestically alongside the corporate sector increases demand for
available capital and further raise the cost of leverage (Vermoesen et al., 2013).
The finding of the study was in agreement with that by Gupta et al. (2014) whose study
attributed the negative and significant association between use of debt capital and
financial distress of Indian listed firms to high cost of debt capital in the Indian
economy. The results further mirror the finding by Baimwera and Muriuki (2014) whose
study attributed the adverse relationship between use of financial leverage and financial
distress among the Kenyan listed firms to the general rise in cost of debt due to
inflationary pressures emanating from negative balance of trade. However, this result
were at variance from those of studies carried out by Kiogora (2000) and Abu-Rub
(2012) that found debt financing to improve the firms‟ financial performance and hence
reduce their distress level. The authors posited that the interest expense associated with
use of debt; being tax-deductible results in significant tax-savings that boosts future
productivity of the firm‟s assets.

104
4.4.3 Effect of Debt Maturity on Financial Distress
The study adopted long term and short term debt as proxies of debt maturity in the
capital structure of non-financial firms. The regression results presented in Table 4.20
show that long term debt has coefficients of 3.2189 and 3.1632 under equations 1a and
1b respectively. The coefficients are positive and statistically significant at 1 percent
level as signified by p-values of 0.0000. The results indicate that during the period of
study, use of non-current debt by non-financial firms listed in NSE boosted their
Altman‟s Z-score index of financial distress; implying a mitigation on their distress
levels.
The finding is in consonance with the finding by Ogundipe et al. (2012) whose study of
firms listed in Nigerian Stocks Exchange revealed that employment of longer-maturity
debt affords excess liquidity to the firms in terms of interest-tax savings which improves
their corporate financial performance. Further, the finding are in support of the study by
Schiantarelli and Sembenelli (1997) that attributed the positive relationship between
long-term debt funding and financial distress index among Italian and UK firms to the
fact that firms normally employ long-term debt to finance capital projects that are
associated with long run profitability of the firm. The finding however differed with that
by Baum et al. (2006) who associated long term debt with low productivity for the firm
consequent to the high repayment costs involved in terms of interest rates.
Table 4.20 on the other hand illustrate that short-term debt is negatively and
significantly related with financial distress at 1% level. This is evidenced by the
regression coefficients equivalent to -3.2189 and -3.1632 under equations 1c and 1
d
respectively. The results indicate that during the period of study, increasing the level of
short term debt utilization resulted in reduction of the Z-score that signified financial
distress of non-financial firms listed in NSE.

105
This empirical finding could be attributed to the fact that short term debt is associated
with low productivity level since it is mostly procured for working (Chowdhury &
Chowdhury, 2010). The working capital is normally not associated in long run
profitability of the firm but for meeting recurrent expenditure. Also, use of current
liabilities to finance the firm does not result in substantial interest-tax savings necessary
to boost the firm‟s productivity. Further, current debt is associated with incidents of
poor planning, misappropriation and misapplication due to its relative ease of access
(Cuong, 2014).
4.3.4 Effect of Equity Structure on Financial Distress
The study used internal equity and external equity as proxies of equity structure in the
capital structure of non-financial firms. The results indicate a positive and significant
relationship between internal equity and the Altman‟s Z-score of financial distress at 1%
significance level. This is evidenced by the beta coefficient of 1.5019 and a
corresponding p-value of 0.0060 under equations 1a and 1c. The results signify that
during the period of study, increasing the component of internal equity in the equity
structure also increased the Z-score index of non-financial firms listed in NSE; implying
an improvement in their financial status. However, the results depicted by panel
equations 1b and 1
d show an inverse and significant relationship between external equity
and financial distress at 1% level. The results imply that during the period of analysis,
increasing the employment level of external equity to finance non-financial firms
resulted in financial distress.
The finding of this study mimics the pecking order hypothesis of capital structure
propounded by Myers and Majluf (1984) that advocates for preference for internal
equity ahead of external sources of capital. The theorists argued that employment of
internal equity preserves the ownership structure and results in more profitability and
growth potential of the firm. On the other hand, external equity increases the risk

106
exposure to present shareholders and obligates the firm to meet payments of dividends;
hence affecting the firms negatively.
The results also correlate with the studies carried out by Forsaith and McMahon (2002)
and Cosh and Hughes (1994) that found internal equity to be useful in improving the
financial status of firms. The authors attributed this relationship to the fact that internal
equity is relatively easy to procure and maintain since no issuance costs are involved. In
addition, it does not oblige the firm to make dividend payments from time to time; thus
enhances the firms‟ growth potential. On the other hand, the studies found external
equity to be negatively related with corporate financial distress. The authors opined that
similar to debt, external equity introduces financial risk to the firm and essentially
increases the firm‟s beta. This causes the existing shareholders to raise their required
rate of return which lowers the firm value and long run financial distress.
4.3.5 Effect of Asset Structure on Financial Distress
The study used Tangibility to proxy the asset structure of non-financial firms. The
results indicate a negative and significant relationship between tangibility and the
Altman‟s Z-score of financial distress at 1% significance level. This is evidenced by the
beta coefficients of -8.1899 and -8.3191 and the corresponding p-values of 0.0000 under
equations 1a and 1b respectively. The results signify that during the period of study, firms
that had higher proportion of assets in fixed form (highly tangible) were characterized
with low Z-score signifying they were more financially distressed.
The results of the study were in agreement with the findings of the study conducted by
Campello and Giambona (2010) that found asset structure (tangibility) to be negatively
associated with financial distress. The authors attributed this empirical relationship to
the fact that highly tangible firms are perceived by lenders as generally illiquid; and
hence difficult to reposes assets in case of default. This results in starvation from debt
capital and hence low productivity. The findings also resonate with those by Maina and

107
Ishmail (2014) whose study attributed this observation to the fact that highly tangible
firms are likely to borrow excessively resulting to hardships in servicing debt
repayments. The author argued that this situation may lead to liquidity shortages that
result in financial distress.
4.3.6 Effect of Firm Size on Financial Distress
A Moderator variable is the variable that potentially influences the nature of the
relationship between dependent variable and independent variables in empirical
research. According to Saunders et al. (2009), moderation refers to interaction effect,
where introducing a moderating variable changes the direction or magnitude of the
relationship between the dependent and independent variables. Fairchild and
MacKinnon (2009) wrote that moderation could either be enhancing, buffering or
antagonistic. Enhancing moderation relates to a situation where increasing the
moderator also increases the primary effect of the predictor variable on the outcome
variable. Buffering moderation effect is where increasing the moderator decreases the
primary relationship between the explanatory variable and the explained variable.
Antagonistic moderation results where increasing the moderator reverses the primary
effect of the independent variable on the dependent variable.
The study tested for moderating effect of firm size on the established relationship
between capital structure variables and financial distress by first estimating panel
equation 1 for random effects as supported by the Hausman‟s test results and controlling
for size effect. The study then estimated Panel equation 2 for random effects and
compared the panel regression results of the two models to determine whether
moderation occurred. As recommended by Fairchild and MacKinnon (2009),
moderating effect is deemed significant if the coefficients of the moderated variables are
statistically significant and the predictive power (R2) of the moderated regression
Equation is higher than that of the initial model.

108
Table 4.21: FGLS Panel Regression Results of the un-moderated model
Panel regression Equation 1:
Dependent variable: Financial Distress
Panel Regression Equation:
1a 1
b 1
c 1
d
Variables
Coefficient
(p-value)
Coefficient
(p-value)
Coefficient
(p-value)
Coefficient
(p-value)
Constant 14.5246***
(0.0000)
16.0803***
(0.0000)
17.7337***
(0.0000)
19.2413***
(0.0000)
Total debt -13.7106***
(0.0000)
-13.6085***
(0.0000)
-13.7106***
(0.0000)
-13.6085***
(0.0000)
Long term debt 3.2091***
(0.0000)
3.1610***
(0.0000)
Short term debt
-3.2091***
(0.0000)
-3.1610***
(0.0000)
Internal equity 1.2520**
(0.0310)
1.2520**
(0.0310)
External equity
-1.4922**
(0.0100)
-1.4922**
(0.0100)
Tangibility -8.3446***
(0.0000)
-8.4402***
(0.0000)
-8.3446***
(0.0000)
-8.4402***
(0.0000)
Sales growth 0.4702**
(0.0190)
0.4636**
(0.0200)
0.4702**
(0.0190)
0.4636**
(0.0200)
Size 0.1244
(0.1690)
0.1107
(0.2250)
0.1244
(0.1690)
0.1107
(0.2250)
Statistics
Adjusted R2 0.7872 0.7887 0.7872 0.7887
Wald-statistic(6) 785.60 790.49 785.60 790.49
p-value (Wald) 0.0000 0.0000 0.0000 0.0000
Rho 0.6263 0.6349 0.6263 0.6349
The asterisk ***, **,* represent significance at 1%, 5% and 10% levels respectively

109
Table 4.22: FGLS Panel Regression Results Moderated by Firm Size
Panel regression Equation 2:
Dependent variable: Financial Distress
Panel Regression Equation: 2a 2
b 2
c 2
d
Variables
Coefficient
(p-value)
Coefficient
(p-value)
Coefficient
(p-value)
Coefficient
(p-value)
Constant 16.4402***
(0.0000)
17.3453***
(0.0000)
19.8576***
(0.0000)
20.8214***
(0.0000)
Total debt -13.9049***
(0.0000)
-13.8689***
(0.000)
-13.9049***
(0.0000)
-13.8689***
(0.000)
Long term debt 3.4174***
(0.0000)
3.4761***
(0.000)
Short term debt
-3.4174***
(0.0000)
-3.4761***
(0.0000)
Internal equity 1.2223**
(0.0220)
1.2223**
(0.0220)
External equity
-1.0234
(0.0560)
-1.0234
(0.0560)
Tangibility -8.9736***
(0.0000)
-9.0744***
(0.0000)
-8.9736***
(0.0000)
-9.0744***
(0.0000)
Total debt*SZ 1.4056***
(0.0000)
1.3832***
(0.0000)
1.4056***
(0.0000)
1.3832***
(0.0000)
Long term debt*SZ 0.8189***
(0.0000)
0.9019***
(0.0000)
Short-term debt*SZ
-0.8189***
(0.0000)
-0.9019***
(0.0000)
Internal equity*SZ -0.7295***
(0.0060)
-0.7295***
(0.0060)
External equity*SZ
0.9262**
(0.0010)
0.9262**
(0.0010)
Tangibility*SZ 1.0281***
(0.0000)
1.0021***
(0.0000)
1.0254***
(0.0000)
1.0039***
(0.0000)
Sales growth 0.4539
(0.0110)**
0.4412**
(0.0130)
0.4539**
(0.0110)
0.4412**
(0.0130)
Size 0.01690
(0.8440)
0.0384
(0.6580)
0.01690
(0.8440)
0.0384
(0.6580)
Statistics
Adjusted R2 0.8038 0.8067 0.8038 0.8067
Wald-statistic(9) 1030.32 1039.11 1030.32 1039.11
p-value (Wald) 0.0000 0.0000 0.0000 0.0000
Rho 0.6766 0.6960 0.6766 0.6960
The asterisk ***, **,* represent significance at 1%, 5% and 10% levels respectively

110
The results presented in show a comparative analysis of the regression results of both
the primary (un-moderated) model and the model upon moderation by firm size. The
objective of the study was to determine whether the effect of different proxies of capital
structure on financial distress changes with introduction of interaction between capital
structure and firm size variables.
A comparison of panel regression results of the moderated equation against those of the
model without moderation reveal that introduction of moderation result in improvement
of the model‟s predictive power as evidenced by increase in the adjusted R2
values. In
addition, the Wald statistic for both equations is statistically significant; indicating that
the variables used are jointly statistically significant. The results also indicate that firm
size has a positive but insignificant effect on financial distress of non-financial firms
listed in NSE during the period of study. This finding signify that although the size of
the firm has no effect on their financial distress, the effect would be positive where it
does. Further, the results show that the coefficients of interactive variables (product
terms) in the moderated equation are all statistically significant at 1% and 5% levels.
This statistical finding signify that the interaction between firm size and capital structure
has significant moderation effect on financial distress of non-financial firms listed in
NSE.
Specifically, the results show a positive and significant relationship between the
interaction of total debt and firm size and financial distress of non-financial firms. This
is a significant antagonizing moderation effect considering the main effect of financial
leverage on financial distress of non-financial firms is negative and significant. The
finding implies that among large-sized firms, increasing the use of leverage (total debt
use) increases their Altman‟s Z-score of financial distress; signifying lower levels of
financial distress. On the contrary, higher debt levels among smaller firms reduces their
Z-score index and signify financial distress.

111
These results are consistent with those by Lee (2009) who concluded that larger firms
enjoy economies of scale in utilization of debt capital. The author pointed that unlike
smaller-sized firms, large firms have more debt capacity (in terms of assets collateral)
which enable them to borrow more at lower lending rates since banks perceive them as
less risky. They are therefore capable of employing large quantities of debt more
productively than their smaller counterparts. Further, Amato and Burson (2007) noted
that larger firms have significant proportion of deferred tax assets which they utilize by
borrowing more to finance additional assets. This translate to more profitability and
generally lowers their probability of experiencing financial distress.
The results show that the long term debt variable has a positive and significant
coefficient at 1%, 5% and 10% levels. However, upon moderation, the magnitude of the
long term debt coefficient is smaller than that obtained under the primary regression
equation. The result signify a significant buffering (decreasing) effect of firm size on the
relationship between long term debt and financial distress of non-financial firms. The
finding signify that although use of long term debt generally lead to significant increase
in financial distress index of non-financial firms listed in NSE, the level of improvement
is greater among smaller firms than in large-sized firms. Concerning the effect of short-
term debt, the results also indicate a buffering negative effect on financial distress of
non-financial firms upon introduction of moderation between firm size and short term
debt. This is evidenced by the coefficients of short-term debt*size variables of -0.8189
and -0.9019 under equations 2c and 2
d respectively. The results imply that although
increasing utilization of short-term debt result in significant increase in the level of
financial distress among non-financial firms listed in NSE, the effect is less among
larger firms as compared to smaller-sized firms.
The finding mirror that by Dittmar (2004) who observed that use of non-current debt
among maturing firms helps them build tax-saving reserves that eventually improves
their market value. The finding is also in agreement with who Serrasqueiro and Nunes
(2008) noted that utilization of long term leverage is more favorable to smaller firms as

112
the repayment periods are more spread-out hence does not strain their liquidity
situations. On the other hand Ogundipe et al. (2012) found the negative effect of current
debt utilization to be less among the larger-sized firms since the firms are able to
adequately make use of the debt and at the same time meet the tight repayment
obligations tied to this leverage. By so doing, benefits of adequate working capital
maintenance would counter-balance the consequences of inflexible repayment terms.
The results further indicate a negative and significant relationship between internal
equity and financial distress index of non-financial firms after introducing the
moderation between firm size and internal equity at 1%, 5% and 10% levels. This result
signify that firm size has a significant antagonizing (reversing) moderating effect on the
established positive and significant relationship between internal equity and financial
distress. The finding implies that among the large-sized firms, increased use of internal
equity capital increases their level of financial distress. On the contrary, employment of
internal equity reduces the prevalence of financial distress among the smaller-sized
firms.
The results also show that the coefficient of external equity*size is positive and
statistically significant at 5% and 10% levels. The result indicate that upon introduction
of interaction between external equity and firm size, the previously observed negative
and statistically significant relationship is reversed. The results signify that use of
external equity is significantly beneficial to large-sized corporations but is detrimental
among smaller firms in as far as their financial distress level is concerned.
The finding resonate with the empirical study by Sciascia and Mazzola (2008) that
found utilization of different modes of equity financing to affect corporate financial
distress differently. Specifically, the authors showed that use of internal equity among
small and maturing firms improved their profitability more than their larger and
established counterparts. They opined that internal equity afford a cheaper and more
accessible form of financing among smaller-sized firms which are not able to sustain

113
external capital such as debt and external equity. On the other hand, large firms have the
capacity to access and maintain external capital and hence utilization of internal equity
may limit their growth potential. The results are consistent with the finding by other
studies such as Artikis et al. (2007) and Ozgulbas et al. (2006) who found external
equity to be favorable among larger firms as compared to smaller firms (SMEs).
The results further show that the coefficient of the product term between tangibility and
size is positive and significant at 1%. The result points to a significant antagonizing
moderation effect considering the main effect of tangibility on financial distress of non-
financial firms is negative and significant. The finding implies that among large-sized
firms, increasing the proportion of fixed assets in the asset base increases their Altman‟s
Z-score of financial distress; signifying lower levels of financial distress. On the
contrary, higher asset tangibility among smaller firms drives them into financial distress.
These empirical findings suggests that firms with large asset base and higher tangibility
can use excess assets as collateral to borrow and increase their productivity. The finding
resonate with the studies undertaken by Akintoye (2009) and Ebel Ezeoha (2008) that
concluded that high tangibility firms usually borrow more due to increased debt capacity
and employ the debt for more productivity. The authors also agreed that due to their
large asset base, highly tangible firms are capable of negotiating for favorable debt
repayment terms which improves their financial productivity. Further, such firms enjoy
a large pool of deferred tax asset base leading to lower tax expenses (Velnampy &
Nimalathasan, 2010).
4.3.7 Effect of Listing Sector on Financial Distress
The study sought to establish how the sector within which individual non-financial firms
are listed moderate the relationship between capital structure and financial distress. To
achieve this objective, the study estimated the specified panel regression equation 3 for
either random or fixed effects as supported by the Hausman specification test results

114
displayed in Table 4.18. Interaction variables comprised the product terms between
capital structure and sector dummy variables. Sector dummies took a value of 1 if a firm
is listed within the sector of interest or 0 otherwise. In accordance with the
recommendation by Fairchild and MacKinnon (2009), moderation was analyzed for
magnitude, direction and significance by examining the coefficients of the interactive
variables.
The analysis controlled for panel-level heteroscedasticity and serial correlation by
estimating the model with robust standard errors (Torres-Reyna, 2007). Further, the
study conducted step-wise regression analysis to mitigate against the effects of severe
multicollinearity observed between internal equity and external equity variables. This
involved dropping each of the collinear variables alternately during estimation. A
comparison between the regression results of the un-moderated model and sector-wise
models was then undertaken to establish the effect of moderation. The results of the
analysis are presented in Table 4.23.

115
Table 4.23: Sector-wise Panel Regression results (with robust std. errors)
Sector Agriculture
Automobile
& Accessories
Commercial & allied
Construction & allied
Energy & Petroleum Investments
Manufacturing & allied Overall model
Variable Coefficient
(p-value)
Coefficient
(p-value)
Coefficient
(p-value)
Coefficient
(p-value)
Coefficient
(p-value)
Coefficient
(p-value)
Coefficient
(p-value)
Coefficient
(p-value)
Constant 15.8827*** (0.000)
16.4829*** (0.000)
14.2753*** (0.000)
16.1638*** (0.000)
12.7588*** (0.000)
9.4450*** (0.002)
13.2111*** (0.000)
16.0445*** (0.000)
Total debt -16.3618***
(0.000)
-14.8052***
(0.000)
-10.2277***
(0.000)
-13.3909***
(0.000)
-11.7319***
(0.000)
-12.4237***
(0.000)
-9.5572***
(0.000)
-13.4632***
(0.000) Long-term debt 1.5463
(0.2310)
6.6903***
(0.000)
3.9461***
(0.000)
4.2173***
(0.000)
8.2773***
(0.000)
-2.4583
(0.289)
3.0051***
(0.000)
3.2189***
(0.000)
Internal equity 5.6727***
(0.000)
1.6192
(0.187)
1.7841***
(0.002)
-0.1501
(0.879)
0.8846
(0.329)
12.4888***
(0.000)
2.7089
(0.150)
1.5019***
(0.006) External equity -5.6727***
(0.001)
-1.2329
(0.289)
-1.7841***
(0.002)
0.1501
(0.879)
-1.9878**
(0.039)
-12.4888***
(0.000)
-2.7089
(0.150)
-1.7197***
(0.002)
Tangibility -10.9148*** (0.000)
-11.5102*** (0.000)
-8.7970*** (0.000)
-6.9172*** (0.000)
-7.8439*** (0.003)
-4.8518 (0.092)
-6.6279*** (0.000)
-8.1899*** (0.000)
Sales growth 1.2850***
(0.000)
0.6457*
(0.066)
0.6291***
(0.008)
0.994**
(0.029)
0.391
(0.256)
-1.4378
(0.134)
0.8565
(0.210)
0.4631**
(0.021)
Statistics
R-Squared 0.7516 0.9796 0.8289 0.7430 0.8089 0.9105 0.8350 0.7906
Rho 0.4899 0.7101 0.8646 0 0.8955 0 0.8143 0.6157
Wald/F-statistic 250.01 222.81 316.87 496.77 150.77 183.06 150.81 784.52
Prob. (Wald-
statistic) 0.0000 0.0000 0.0000 0.0000 0.0000 0.0000 0.0000 0.0000

116
The asterisk ***, **,* represent significance at 1%, 5% and 10% levels respectively
117
The sector-wise regression results show that total debt has an adverse and significant
relationship with financial distress in all the 7 sectors at 1%, 5% and 10% significance
levels. The finding is similar with that revealed by analysis of the general regression
model and implies that use of debt by non-financial firms increases their level of
financial distress. The result further means that sector-specific factors provide
significant moderating effect on the relationship between financial leverage and
financial distress of non-financial firms listed in NSE. This finding corresponds with
empirical studies by Shumi Akhtar (2005) and Amjed (2007) that showed use of debt to
be negatively and significantly related to financial distress of firms regardless of the
sectors of listing.
The results further show that long term debt has a positive and significant relationship
with financial distress across all sectors except investments and agriculture sectors. This
result is consistent with that derived from analysis of the overall model. Within the
agriculture sector, the coefficient of long term debt, though positive is insignificant at
1%, 5% and 10% levels. This finding signify that during the period of analysis, use of
long term debt (debt maturity) did not influence financial distress of firms listed in
Agriculture sector. Nonetheless, where it did, the effect was positive. This trend could
be attributed to the fact that although a significant portion of leverage among agro-based
firms constitute non-current debt, the corresponding interest rates charged by financial
institutions are relatively high considering the seasonal nature of their products
(Antoniou et al., 2006). The analysis results also show that the relationship between
long term debt and financial distress among firms listed in the Investment sector is
adverse but insignificant. This essentially signify that debt maturity has no effect on
financial distress of investment-based firms; and where it did, the effect was
unfavorable. This finding could be attributed to the finding that the capital markets in
the emerging markets such as Kenya are normally characterized with volatile returns;
which means that financing such trade by non-current debt that normally require lengthy
repayment period may affect the firm negatively (Bitok et al., 2011).

118
The results also show that the relationship between internal equity financing and
financial distress of firms listed within agriculture, commercial and services as well as
investments sectors was similar to that of the overall model (positive and significant at
1%, 5% and 10% levels). However, the coefficients of internal equity in the regression
model for Automobile and accessories, Construction and allied, Energy and petroleum
as well as manufacturing and allied sectors are different from that of the general model.
Specifically, the results indicate that the coefficients of internal equity in Automobile
and accessories, Energy and petroleum and Manufacturing sectors are positive but
statistically insignificant, at 1%, 5% and 10%. This means that during the period of
analysis, utilization of internal equity had no effect on financial distress of firms listed
within these three sectors. However, where it did, the effect was positive. In addition,
the results show that internal equity has a negative but insignificant coefficient at 1%,
5% and 10% levels for firms listed in construction sector. This implies that, use of
internal equity by firms listed in this sector does not affect their financial distress.
Nevertheless, the effect is negative where it does. The highlighted empirical
phenomenon could be attributed to the fact that firms listed within these four sectors are
ordinarily capital-intensive (Alkhatib, 2012). This means that due to the limited
availability and use of internal equity financing, much of their capitation comprise of
external sources such as debt and external equity.
The results show that the effect of external equity on financial distress of firms listed in
Agriculture, Commercial and services, Investments and Energy sectors is negative and
statistically significant at 5% and 10%. This means that sector-specific factors do not
have significant moderating effect on the relationship between external equity and
financial distress among firms listed in these sectors. However, it is evident that the
coefficients of external equity financing in the panel regression among firms listed in
Automobiles and accessories, Construction as well as Manufacturing and allied sectors
is different from that of the general model. In particular, the coefficients of external
equity are negative but insignificant for firms listed in Automobiles and accessories as

119
well as Manufacturing sectors. The results also show that external equity has a positive
but insignificant relationship with financial distress of firms listed in construction sector.
These empirical findings could be attributed to the fact that firms listed in these sectors
employ equity capital sparingly in comparison to leverage. This marked preference for
debt could be explained by ease of access for debt capital and the ability to refinance
debt usually at renegotiated interest rates to finance their long term projects.
4.3.8 Effect of Sales Growth on Financial Distress
Sales growth which represented the percentage change in sales turnover over two
consecutive reporting periods was used by the study to control for firm-specific
characteristics. Essentially, the variable measured the rate at which year-on year sales
revenue expanded/shrunk within individual firms during the period of study. The
importance of the study controlling for this variable is that expansion in sales volumes
does not necessarily mean that a corporation cannot experience financial distress. This
could be explained by the fact that large sales require significant financing costs which
may expose firms to financial distress. At the same time, a number of studies have found
that firms with expanding sales are generally financially strong as compared with those
experiencing dwindling sales revenue.
The results indicate that sales growth has a coefficient of 0.4631 and a corresponding p-
vale equivalent to 0.0210. This output implies that sales growth has a positive and
significant effect on financial distress of non-financial firms listed in NSE at 5%
significance level. This means that during the analysis period, non-financial firms with
increasing levels of sales revenue generally posted higher Z-score values and hence
were less financially distressed. The results of the study implies that sales volume is
indeed a significant determinant of financial distress among non-financial firms. The
findings were in support of those carried out by (Kodongo et al., 2014; Maina &
Ishmail, 2014) that found sales growth to be positively related with corporation‟s
profitability.

120
4.3.9 Hypothesis Testing Results
Hypothesis testing is a process by which the researcher infers the result of sample data
on the larger population based on a presupposition made prior to commencement of
research (Gujarati, 2003). The study performed hypothesis testing by determining
statistical significance of the coefficients of explanatory variables. Test-of-significance
method is meant to verify the truth or falsity of a null hypothesis by using sample
results, showing that the means of two normally distributed populations are equal. This
was done by using the two-tailed t-test statistic and the corresponding p-values at 1%,
5% and 10% levels. The decision to use a two-tailed test was based on the fact that the
alternative hypothesis of the study is composite rather than directional (Gujarati, 2003).
This procedure was carried out against the null hypotheses enumerated in section 1.4 of
chapter one. In all the tests, the decision rule was that: if the p-value observed is less
than the set alpha (significance level), then reject the null hypothesis and if the observed
p-value is greater than the set alpha, do not reject the null hypothesis.
a) H01: Financial leverage has no significant effect on financial distress of non-
financial firms listed in NSE
The analysis results show that financial leverage has significant negative effect on
financial distress of non-financial corporations at 1% level. This is evidenced by the p-
values corresponding to the coefficients of financial leverage variable equivalent to
0.0000. This finding led the study to reject the stated null hypothesis with 99%
confidence level. By rejecting the null hypothesis, the study concluded that that financial
leverage has significant effect on financial distress of non-financial companies listed in
NSE.

121
b) H02: Debt maturity has no significant effect on financial distress of non-
financial firms listed in NSE
The analysis results show that debt maturity has significant effect on financial distress of
non-financial corporations at 1% level. This is based on the p-values corresponding to
the coefficients of long term debt and short term debt variables equivalent to 0.0000.
This finding led the study to reject the stated null hypothesis with 99% confidence level.
By rejecting the null hypothesis, the study accepted the alternative hypothesis and
concluded that debt maturity has significant effect on financial distress of non-financial
companies listed in NSE.
c) H03: Equity structure has no significant effect on financial distress of non-
financial firms listed in NSE
The analysis results show that equity structure has significant effect on financial distress
of non-financial corporations at 1% significance level. This is evidenced by the p-values
corresponding to the coefficients of internal and external equity variables of 0.0060 and
0.0020 respectively. This finding led the study to reject the stated null hypothesis with
99% confidence level. By rejecting the null hypothesis, the study accepted the
alternative hypothesis and concluded that equity structure has significant effect on
financial distress of non-financial companies listed in NSE.
d) H04: Asset Structure has no significant effect on financial distress of non-
financial firms listed in NSE
The analysis results show that asset structure has significant negative effect on financial
distress of non-financial corporations at 1% level. This is evidenced by the p-value
corresponding to the coefficient of tangibility variable equivalent to 0.0000. This finding
led the study to reject the stated null hypothesis with 99% confidence level. By rejecting

122
the null hypothesis, the study accepted the alternative hypothesis and concluded that that
asset structure has significant effect on financial distress of non-financial companies
listed in NSE.
e) H05: Firm size has no significant moderating effect on the relationship
between capital structure and financial distress of non-financial firms listed
in NSE
The analysis results show that firm size has significant moderating effect on the
relationship between capital structure and financial distress of non-financial
corporations at 5% level. This is evidenced by the p-values corresponding to the
coefficients of the product terms between capital structure variables and size variable
that were all less than 0.05. This finding led the study to reject the stated null hypothesis
with 95% confidence level. By rejecting the null hypothesis, the study accepted the
alternative hypothesis and concluded that firm size has a significant moderating effect
on the relationship between capital structure and financial distress of non-financial
companies listed in NSE.
f) H06: Listing sector has no significant moderating effect on the relationship
between capital structure and financial distress of non-financial firms listed
in NSE
The analysis results show that the listing sector has significant moderating effect on the
relationship between capital structure and financial distress of non-financial
corporations at 5% level. This is evidenced by the p-values corresponding to the
coefficients of the capital structure variables moderated by the sector dummy variable
that were all less than 0.05. This finding led the study to reject the stated null hypothesis
with 95% confidence level. By rejecting the null hypothesis, the study accepted the
alternative hypothesis and concluded that the listing sector has a significant moderating

123
effect on the relationship between capital structure and financial distress of non-
financial companies listed in NSE.

124
CHAPTER FIVE
SUMMARY, CONCLUSION AND RECOMMENDATIONS
5.1 Introduction
This chapter presents the summary of the empirical findings derived from the study,
conclusions and the relevant policy recommendations. The overall objective of the study
was to establish the effect of capital structure on financial distress of non-financial firms
listed in NSE. Presentation of the chapter is organized around the specific objectives and
hypotheses enumerated in sections 1.4 and 1.5. The conclusions are also aligned with
the specific objectives with a particular focus on whether the research hypotheses were
accepted or rejected by the study. The recommendations encapsulate suggestions meant
to add value at both managerial and regulatory policy levels in accordance with the
study findings. Finally, the chapter proposes areas for further research to address the
gaps that could not be filled by the study due to time and cost constraints.
5.2 Summary of Findings
The study sought to establish the effect of capital structure on financial distress of non-
financial companies listed in NSE. This involved investigating the effect of financial
leverage, debt maturity, equity structure and asset structure on financial distress of the
firms. In addition, the study sought to determine how firm size and listing sector
moderated the relationship between capital structure and financial distress of non-
financial firms. The summary and discussion followed the study hypothesis formulated
in chapter one.
5.2.1 Effect of Financial Leverage on Financial Distress
The first specific objective of the study was to establish the effect of financial leverage
on financial distress of non-financial firms listed in NSE. This was achieved by

125
analyzing how employment of debt as opposed to equity capital affected the Altman‟s
Z-score index of financial distress. The study found that during the analysis period,
financial leverage had a negative and significant effect on financial distress of listed
non-financial corporations.
5.2.2 Effect of Debt Structure on Financial Distress
The study also sought to investigate the effect of debt maturity on financial distress of
non-financial firms listed in Kenya. Debt maturity was operationalized by the proportion
of long term and short term debt contained in the capital structure employed by non-
financial firms during the study period. The analysis results showed that during the
period of study, long term debt had a positive and significant effect on financial distress
of non-financial firms.
5.2.3 Effect of Equity Structure on Financial Distress
The third objective of the study was to determine the effect of equity structure on
financial distress of non-financial entities. The study used the proportion of internal and
external equity used by the firms as proxies of equity structure. Statistical analysis
results showed that internal equity had a positive and significant effect on financial
distress of non-financial firms. However, external equity had a negative and significant
effect of financial distress of non-financial corporations.
5.2.4 Effect of Asset Structure on Financial Distress
The fourth specific objective of the study was to establish the effect of asset structure on
financial distress of non-financial firms listed in NSE. This was achieved by analyzing
how tangibility of assets affected the Altman‟s Z-score index of financial distress. The
study found that during the analysis period, asset structure had a negative and significant
effect on financial distress of listed non-financial corporations.

126
5.2.5 Moderating Effect of Firm Size on Financial Distress
The study further sought to determine how firm size moderated the relationship
established between capital structure and financial distress of non-financial firms. The
effect of moderation was observed by testing the direction, magnitude and significance
of the product terms between individual capital structure variables and firm size variable
(natural log of total assets). The study found that the size of the firm had a significant
moderating effect on the relationship between capital structure and financial distress of
non-financial firms. Specifically, the study found that firm size had a significant
antagonizing effect on the relationship between both financial leverage as well as and
financial distress. The study also found that firm size exerted a significant buffering
effect on the primary effect of debt maturity and equity structure on financial distress.
5.2.6 Moderating Effect of Listing Sector on Financial Distress
The study set out to establish the effect of the listing sector on the relationship between
capital structure and financial distress of the non-financial firms. Just like in the case of
firm size, moderation effect was observed by testing the direction, magnitude and
significance of the product terms between individual capital structure variables and
sector dummies that took a value of 1 if the firm was listed in the sector of interest and 0
otherwise. The analysis results showed that the listing sector had significant moderating
effect on the relationship between all the four components of capital structure and
financial distress of non-financial firms listed in NSE.
5.3 Conclusion
5.3.1 Financial Leverage and Financial Distress
First, borrowed capital (debt) is not a conducive way of financing operations of non-
financial firms listed in NSE. This conclusion is based on the finding that debt financing
has a negative effect on the Z-score index used to measure financial distress. This means

127
that employment of debt in the capital structure invariably drives non-financial
companies into financial distress.
5.3.2 Debt Maturity and Financial Distress
The study further concludes that although debt financing is generally not an ideal way to
finance non-financial corporations, long term debt is comparatively more palatable than
short term debt. This is based on the finding that employment of long term debt reduces
the incidence of financial distress on non-financial firms listed in NSE while short term
debt has an opposite effect.
5.3.3 Equity Structure and Financial Distress
The study concludes that employment of internal equity that includes retained earnings
and reserves reduces the incidence of financial distress among non-financial firms listed
in NSE. However, use of external equity such as paid up share capital has an effect of
driving non-financial companies into financial distress.
5.3.4 Asset Structure and Financial Distress
The study concludes that non-financial firms listed in NSE whose asset structure
comprise of large proportion of fixed assets are comparatively more financially
distressed than their less tangible counterparts. This conclusion derives from the finding
that tangibility is negatively and significantly related to financial distress.
5.3.5 Moderating Effect of Firm Size on Financial Distress
The study concludes that the size of the firm plays a very important role in determining
the effect of capital structure on financial distress of non-financial firms listed in NSE.
Specifically, although debt financing generally results in financial distress among non-
financial firms listed in NSE, use of debt capital favorable to large-sized firms than
128
among smaller firms. The study also concludes that the favorable effect of employment
of long term debt generally reduces as the size of the firm increases.
The study concludes that while use of internal equity among large-sized firms increases
their level of financial distress, employment of external equity financing among large
firms generally improves lowers their financial distress levels. Concerning the effect of
tangibility, the study concludes that large firms that are highly tangible are generally less
distressed as compared to small but highly tangible corporations.
5.3.6 Moderating Effect of Listing Sector on Financial Distress
The study concludes that the sector within which non-financial firms are listed has a
significant moderating effect on the relationship between capital structure and financial
distress. This conclusion is derived for the study findings that except for the effect of
financial leverage and tangibility than remained negative across all sectors, the effects of
debt maturity equity structure on financial distress of non-financial firms was different
across the sectors. This pattern could be attributed to differences in sectoral dynamics
within which non-financial firms operate.
5.4 Recommendations
Following the findings and conclusions made by the study, several recommendations are
proposed. These recommendations are made both in managerial and policy
perspectives. At managerial level, the recommendations provide guidelines to managers
of non-financial firms on how corporations ought to configure their capital structures so
as to mitigate instances of financial distress and subsequent bankruptcy. At policy level,
the recommendations are aimed at bringing to light the need to institute appropriate
regulatory mechanisms meant to cushion investors from loss of their hard earned wealth
and hence restore confidence in the capital markets.

129
First, non-financial firms should endeavor to employ more equity and less debt capital to
finance their operations. This recommendation is based on the revelation that
employment of borrowed capital is a major recipe for corporate financial distress..
Secondly, the study recommends that where non-financial firms must consider using
debt in their capital structure, non-current debt should be prioritized ahead of short term
debt. This recommendation is based on the finding that long term debt reduces the
incidence of financial distress among non-financial firms. Thirdly, the study
recommends that in configuring their equity structure, financing managers of non-
financial firms should prioritize the use of internally generated capital such as retained
earnings and reserves ahead of externally issued equity. This recommendation derives
from the observation that internal equity reduces the financial distress among non-
financial companies. Fourthly, the study recommends that managers of non-financial
firms should maintain low proportions of fixed assets in their asset structure. This is
because according to the study, highly tangible firms are generally associated with
higher levels of financial distress. Fifthly, the study recommends that in choosing the
mode of financing to be employed by non-financial firms, corporate managers should
also consider other factors that are critical in determining the effect of capital structure
on financial distress. Particularly, the size of the firm as well as sector-specific factors
should be carefully considered.
At policy level, the study recommends that the government should introduce initiatives
that are aimed at lowering the high interest rates associated with borrowed capital. Such
initiatives that involves proper management of monetary and fiscal environment would
go a long way in alleviating the high cost of capital among non-financial firms and
hence mitigate the incidence of financial distress associated with debt financing.
Secondly, the regulator to the capital market (CMA) should introduce policies that are
aimed at encouraging non-financial firms to use internally generated capital in place of
externally issued capital. Such policies could involve offering preferential tax treatment
on retained capital as well as imposing higher stamp duties on externally issued capital.

130
By so doing, non-financial firms would be keen to employ internal capital and hence
reduce their probability of financial distress.
5.5 Areas for Further Research
This study sought to provide empirical understanding on the effect of capital structure
on financial distress of non-financial companies listed in Kenya. In accomplishing this,
the study focused only on the firms that were listed in NSE as at 31st December 2013.
However, the practice world over is to have only the best performing corporations
endorsed for listing in the bourse. This tendency may result in biased research findings
and conclusions concerning the topic of study. As a way of verifying the study results, a
similar study could be carried out among companies which are not listed in NSE such as
the SMEs.
Further, this study was undertaken within the Kenyan context and represents the
background of an emerging market with unique characteristics in economic, regulatory
and political fronts. In addition, the 41 non-financial firms listed in Kenya could be
considered few and hence less representative in wider jurisdictions. The choice of this
geographical scope was informed by time and budgetary constraints facing the
researcher. The applicability of the study results may therefore be restrictive. In that
regard, the study recommends a similar study be carried out within larger jurisdictions
that could present unique economic and regulatory dynamics.

131
REFERENCES
Abor, J. (2005). The effect of capital structure on profitability: An empirical analysis of
listed firms in Ghana. The Journal of Risk Finance, 6(5), 438-445.
Abu-Rub, N. (2012). Capital structure and firm performance: Evidence from Palestine
Stock Exchange. Journal of Money, Investment and Banking, 23(4), 109-117.
Aggarwal, R., & Kyaw, N. A. (2006). Leverage, investment opportunities, and firm
value: A global perspective. Financial Development, 1(2), 1-26.
Aivazian, V. A., Ge, Y., & Qiu, J. (2005). Debt maturity structure and firm
investment. Financial Management, 34(4), 107-119.
Akhtar, S. (2005). The determinants of capital structure for Australian multinational and
domestic corporations. Australian Journal of Management, 30(2), 321-341.
Akhtar, S., Javed, B., Maryam, A., & Sadia, H. (2012). Relationship between financial
leverage and financial performance: Evidence from fuel & energy sector of
Pakistan. European Journal of Business and Management, 4(11), 7-17.
Akintoye, I. R. (2009). Sensitivity of performance to capital structure. Banking and
Finance Letters, 1(1), 29.
Alkhatib, K. (2012). The determinants of leverage of listed companies. International
Journal of Business and Social Science, 3(24), 78-83.
Altman, E. I. (2000). Predicting financial distress of companies: revisiting the Z-score
and ZETA models. Stern School of Business, New York University, 9-12.

132
Altman, E. I., & Hotchkiss, E. (2010). Corporate financial distress and bankruptcy:
Predict and avoid bankruptcy, analyze and invest in distressed debt (Vol. 289).
John Wiley & Sons.
Altman, E. I. (1968). Financial ratios, discriminant analysis and the prediction of
corporate bankruptcy. The Journal of Finance, 23(4), 589-609.
Amato, L. H., & Burson, T. E. (2007). The effects of firm size on profit rates in the
financial services. Journal of Economics and Economic Education Research,
8(1), 67.
Amjed, S. (2007). The impact of financial structure on profitability: Study of Pakistan‟s
textile sector. Management of International Business and Economic Systems,
3(2), 440-450.
Andrade, G., & Kaplan, S. N. (1998). How costly is financial (not economic) distress?
Evidence from highly leveraged transactions that became distressed. The Journal
of Finance, 53(5), 1443-1493.
Antoniou, A., Guney, Y., & Paudyal, K. (2006). The determinants of debt maturity
structure: Evidence from France, Germany and the UK. European Financial
Management, 12(2), 161-194.
Artikis, G. P., Eriotis, N., Vasiliou, D., & Ventoura-Neokosmidi, Z. (2007). How firm
characteristics affect capital structure: An empirical study. Managerial Finance,
33(5), 321-331.
Auerbach, A. J. (1985). Real determinants of corporate leverage. Corporate Capital
Structures in the United States. University of Chicago Press.
Babalola, Y. A. (2013). The effect of firm size on firms profitability in Nigeria. Journal
of Economics and Sustainable Development, 4(5), 90-94.

133
Baimwera, B., & Muriuki, A. (2014). Analysis of corporate financial distress
determinants: A survey of non-financial firms listed in the NSE. International
Journal of Current Business and Social Sciences, 1(2), 58-80.
Baltagi, B. H., Bratberg, E., & Holmås, T. H. (2005). A panel data study of physicians'
labor supply: The case of Norway. Health Economics, 14(10), 1035-1045.
Barclay, M. J., Heitzman, S. M., & Smith, C. W. (2013). Debt and taxes: Evidence from
the real estate industry. Journal of Corporate Finance, 20, 74-93.
Baum, C. F., Schafer, D., & Talavera, O. (2006). The Effects of Short-Term Liabilities
on Profitability: A Comparison of German and US Firms (Vol. 636). Boston
College Working Papers in Economics.
Beaver, W. H. (1966). Financial ratios as predictors of failure. Journal of Accounting
Research, 6, 71-111.
Bellovary, J. L., Giacomino, D. E., & Akers, M. D. (2007). A review of bankruptcy
prediction studies: 1930 to present. Journal of Financial education, 1-42.
Bender, R. (2013). Corporate financial strategy (4th Edition). UK: Routledge.
Berger, A. N., & Di Patti, E. B. (2006). Capital structure and firm performance: A new
approach to testing agency theory and an application to the banking industry.
Journal of Banking & Finance, 30(4), 1065-1102.
Bitok, J., Masulis, R., Graham, J., & Harvey, C. (2011). The Determinants of leverage
at the Nairobi Stock Exchange, Kenya. Paper presented at the the Asian Business
and Management Conference, New Delhi.
Brealey, R. A., & Myers, S. C. (2006). Principles of Corporate Finance (Wall Street
Edition): New York: McGraw-Hill.

134
Brick, I. E., & Ravid, S. A. (1985). On the relevance of debt maturity structure. The
Journal of Finance, 40(5), 1423-1437.
Brounen, D., De Jong, A., & Koedijk, K. (2006). Capital structure policies in Europe:
Survey evidence. Journal of Banking & Finance, 30(5), 1409-1442.
Brown, J. R. (2005). Venture capital and firm performance over the long-run: Evidence
from high-tech IPOs in the United States. The Journal of Entrepreneurial
Finance, 10(3), 1-33.
Campello, M., & Giambona, E. (2010). Asset tangibility and capital structure: Working
paper, University of Illinois.
Chen, J. J. (2004). Determinants of capital structure of Chinese-listed companies.
Journal of Business Research, 57(12), 1341-1351.
Chhibber, P. K., & Majumdar, S. K. (1999). Foreign ownership and profitability:
Property rights, control, and the performance of firms in Indian industry. The
Journal of Law and Economics, 42(1), 209-238.
Chowdhury, A., & Chowdhury, S. P. (2010). Impact of capital structure on firm‟s value:
Evidence from Bangladesh. Business and Economic Horizons, 3(3), 111-122.
Cooper, D., & Schindler, P. (2008). Business research methods (2nd Ed.). New Delhi:
Vikas.
Cosh, A., & Hughes, A. (1994). Size, financial structure and profitability: UK
companies in the 1980s. Journal of Financial Services Research, 7(5), 18-63.
Cuong, N. T. (2014). Threshold effect of capital structure on firm value: Evidence from
seafood processing enterprises in the South Central region of Vietnam.
International Journal of Finance & Banking Studies, 3(3), 14-29.

135
De Jong, A. (2002). The disciplining role of leverage in Dutch firms. European Finance
Review, 6(1), 31-62.
Diamond, D. W. (1993). Seniority and maturity of debt contracts. Journal of Financial
Economics, 33(3), 341-368.
Dittmar, A. (2004). Capital structure in corporate spin‐offs. The Journal of Business,
77(1), 9-43.
Donaldson, G.(1961) Corporate debt capacity: A study of corporate debt policy and the
determination of corporate debt capacity. Boston: Harvard.
Ebel Ezeoha, A. (2008). Firm size and corporate financial-leverage choice in a
developing economy: Evidence from Nigeria. The Journal of Risk Finance, 9(4),
351-364.
Edmister, R. O. (1972). An empirical test of financial ratio analysis for small business
failure prediction. Journal of Financial and Quantitative Analysis, 7(2), 1477-
1493.
Elsas, R., Flannery, M. J., & Garfinkel, J. A. (2004). Major investments, firm financing
decisions, and long-run performance. Journal of Managerial Economics, 12(8)
231-253
Ebaid, I. (2009). The impact of capital-structure choice on firm performance: empirical
evidence from Egypt. The Journal of Risk Finance, 10(5), 477-487.
Fabozzi, F. J., & Drake, P. P. (2009). Capital markets, financial management, and
investment management (Vol. 178). London: John Wiley & Sons.
Fairchild, A. J., & MacKinnon, D. P. (2009). A general model for testing mediation and
moderation effects. Prevention Science, 10(2), 87-99.
136
Fama, E. F., & French, K. R. (2002). Testing trade‐off and pecking order predictions
about dividends and debt. Review of Financial Studies, 15(1), 1-33.
Fischer, E. O., Heinkel, R., & Zechner, J. (1989). Dynamic capital structure choice:
Theory and tests. The Journal of Finance, 44(1), 19-40.
Forsaith, D. M., & McMahon, R. (2002). Equity financing patterns amongst Australian
manufacturing SMEs: Flinders University of South Australia, School of
Commerce.
Frank, M. Z., & Goyal, V. K. (2003). Testing the pecking order theory of capital
structure. Journal of Financial Economics, 67(2), 217-248.
Frieder, L., & Subrahmanyam, A. (2005). Brand perceptions and the market for
common stock. Journal of Financial and Quantitative Analysis, 40(1), 57-85.
Gharghori, P., Lee, R., & Veeraraghavan, M. (2009). Anomalies and stock returns:
Australian evidence. Accounting & Finance, 49(3), 555-576.
Ghosh, C., Nag, R., & Sirmans, C. (2000). The pricing of seasoned equity offerings:
Evidence from REITs. Real Estate Economics, 28(3), 363.
Gonenc, H. (2005). Comparison of debt financing between international and domestic
firms: Evidence from Turkey, Germany and UK. International Journal of
Managerial Finance, 1(1), 49-68.
Graham, J. R., & Harvey, C. R. (2001). The theory and practice of corporate finance:
Evidence from the field. Journal of Financial Economics, 60(2), 187-243.
Granger, C. W., & Newbold, P. (1974). Spurious regressions in econometrics. Journal
of Econometrics, 2(2), 111-120.

137
Gujarati, D. (2003). Basic Econometrics (4 Edition). New Delhi, DN: McGraw Hill.
Gupta, P., Srivastava, A., & Sharma, D. (2014). Capital structure and financial
performance: Evidence from India. International Research Journal, 2(6), 112-
126.
Gwatidzo, T., & Ojah, K. (2014). Firms‟ debt choice in Africa: Are institutional
infrastructure and non-traditional determinants important? International Review
of Financial Analysis, 31, 152-166.
Hadlock, C. J., & James, C. M. (2002). Do banks provide financial slack? The Journal
of Finance, 57(3), 1383-1419.
Harris, M., & Raviv, A. (1991). The theory of capital structure. The Journal of Finance,
46(1), 297-355.
Hillegeist, S. A., Keating, E. K., Cram, D. P., & Lundstedt, K. G. (2004). Assessing the
probability of bankruptcy. Review of Accounting Studies, 9(1), 5-34.
Hoque, J., Hossain, A., & Hossain, K. (2014). Impact of capital structure policy on
value of the firm: A study on some selected corporate manufacturing firms under
Dhaka Stock Exchange. Ecoforum Journal, 3(2), 9.
Hovakimian, A., Hovakimian, G., & Tehranian, H. (2004). Determinants of target
capital structure: The case of dual debt and equity issues. Journal of Financial
Economics, 71(3), 517-540.
Huang, G. (2006). The determinants of capital structure: Evidence from China. China
Economic Review, 17(1), 14-36.
James, C., & Wier, P. (1988). Are bank loans different? Some evidence from the stock
market. Journal of Applied Corporate Finance, 1(2), 46-54.

138
Jensen, M. C., & Meckling, W. H. (1976). Theory of the firm: Managerial behavior,
agency costs and ownership structure. Journal of Financial Economics, 3(4),
305-360.
Jónsson, B. (2008). Does the size matter? The relationship between size and profitability
of Icelandic firms. Bifröst Journal of Social Science, 1(6), 113-124.
Ju, N., Parrino, R., Poteshman, A. M., & Weisbach, M. S. (2005). Horses and rabbits?
Trade-off theory and optimal capital structure. Journal of Financial and
Quantitative Analysis, 40(2), 259-281.
Kapopoulos, P., & Lazaretou, S. (2007). Corporate ownership structure and firm
performance: Evidence from Greek firms. An International Review, 15(2), 144-
158.
Keasey, K., & Watson, R. (1991). Financial distress prediction models: A review of
their usefulness. British Journal of Management, 2(2), 89-102.
Khan, A. G. (2012). The relationship of capital structure decisions with firm
performance: A study of the engineering sector of Pakistan. International
Journal of Accounting and Financial Reporting, 2(1), 245.
Kim, C.-S., Mauer, D. C., & Sherman, A. E. (1998). The determinants of corporate
liquidity: Theory and evidence. Journal of Financial and Quantitative Analysis,
33(03).
Kiogora, G. M. (2000). Testing for variations in the capital structure of companies
quoted at the Nairobi Stock Exchange. Unpublished Doctoral dissertation.
University of Nairobi, Kenya.

139
Kodongo, O., Mokoaleli-Mokoteli, T., & Maina, L. K. (2014). Capital structure,
profitability and firm value: Panel evidence of listed firms in Kenya. (April 1,
2014).
Kodongo, O., Natto, D., & Biekpe, N. (2015). Explaining cross-border bank expansion
in East Africa. Journal of International Financial Markets, Institutions and
Money, 36, 71-84.
Kothari, C. R. (2004). Research methodology: Methods and techniques (2nd
Edition):
New Delhi, India: New Age International (P) Limited.
Kraus, A., & Litzenberger, R. H. (1973). A state‐preference model of optimal financial
leverage. The Journal of Finance, 28(4), 911-922.
Krishnan, V. S., & Moyer, R. C. (1997). Performance, capital structure and home
country: An analysis of Asian corporations. Global Finance Journal, 8(1), 129-
143.
Lee, J. (2009). Does size matter in firm performance? Evidence from US public firms.
International Journal of the Economics of Business, 16(2), 189-203.
Lins, K. V. (2003). Equity ownership and firm value in emerging markets. Journal of
Financial and Quantitative Analysis, 38(1), 159-184.
Maddala, G. S., & Wu, S. (1999). A comparative study of unit root tests with panel data
and a new simple test. Oxford Bulletin of Economics and statistics, 61(1), 631-
652.
Magara, M. N. (2012). Capital structure and its determinants at the Nairobi Securities
Exchange. Doctoral dissertation, University of Nairobi, Kenya.

140
Mahadeva, L., & Robinson, P. (2004). Unit root testing to help model building: Centre
for Central Banking Studies, Bank of England.
Maina, L., & Ishmail, M. (2014). Capital structure and financial performance in Kenya:
Evidence from firms listed at the Nairobi Securities Exchange. International
Journal of Social Sciences and Entrepreneurship, 1(11), 209-223.
Margaritis, D., & Psillaki, M. (2007). Capital structure and firm efficiency. Journal of
Business Finance & Accounting, 34(9), 1447-1469.
Marsh, P. (1982). The choice between equity and debt: An empirical study. The Journal
of Finance, 37(1), 121-144.
Memba, F., & Nyanumba, J. (2013). Causes of financial distress: A survey of firms
funded by Industrial and Commercial Development Corporation in Kenya.
Interdisciplinary Journal of Contemporary Research in Business, 4(12), 1171-
1185.
Miller, M. H. (1988). The Modigliani-Miller propositions after thirty years. The Journal
of Economic Perspectives, 2(4), 99-120.
Modigliani, F., & Miller, M. H. (1958). The cost of capital, corporation finance and the
theory of investment. The American Economic Review, 48(3), 261-297.
Modigliani, F., & Miller, M. H. (1963). Corporate income taxes and the cost of capital: a
correction. The American Economic Review, 53(3), 433-443.
Moorhouse, A. (2004). An introduction to financial soundness indicators. Bank of
England (www. bankofengland. co. uk/statistics/ms/articles/art1feb04. pdf).
Mugenda, & Mugenda. (2003). Research methods quantitative and qualitative
approaches. Nairobi, Kenya: African Center for Technology Studies.

141
Mule, R. K., Mukras, M. S., & Nzioka, O. M. (2015). Corporate size, profitability and
market value: An econometric panel analysis of listed firms in Kenya. European
Scientific Journal, 11(13), 376 - 396.
Muller, G. H., Steyn-Bruwer, B. W., & Hamman, W. D. (2009). Predicting financial
distress of companies listed on the JSE: Comparison of techniques. South
African Journal of Business Management, 40(1), 21-32.
Muritala, T. A. (2012). An empirical analysis of capital structure on firms‟ performance
in Nigeria. International Journal of Advances in Management and Economics,
1(5), 116-124.
Mwangi, Muathe, S., & Kosimbei, G. (2014). Relationship between capital structure and
performance of non-financial companies listed in the Nairobi Securities
Exchange, Kenya. Global Journal of Contemporary Research in Accounting,
Auditing and Business Ethics, 1(2), 72-90.
Myers, S.C. (1977). Determinants of corporate borrowing. Journal of Financial
Economics, 5(2), 147-175.
Myers, S. C. (2001). Capital structure. The Journal of Economic Perspectives, 15(2), 81-
102.
Myers, M. D. (2013). Qualitative research in business and management. New Delhi,
ND: Sage Publications Ltd.
Myers, S.C. & Majluf, N. S. (1984). Corporate financing and investment decisions when
firms have information that investors do not have. Journal of Financial
Economics, 13(2), 187-221.

142
Nerlove, M. (1968). Factors affecting differences among rates of return on investments
in individual common stocks. The Review of Economics and Statistics, 1(1), 312-
331.
Ogbulu, O. M., & Emeni, F. K. A. (2012). Capital structure and firm value: Empirical
evidence from Nigeria. International Journal of Business and Social Science, 3
(19), 252 - 261.
Ogundipe, S. E., Idowu, A., & Ogundipe, L. O. (2012). Working capital management,
firms‟ performance and market valuation in Nigeria. World Academy of Science,
Engineering and Technology, 61(1), 1196-1200.
Ohlson, J. A. (1980). Financial ratios and the probabilistic prediction of bankruptcy.
Journal of Accounting Research, 1(1), 109-131.
Onaolapo, A., & Kajola, S. O. (2010). Capital structure and firm performance: Evidence
from Nigeria. European Journal of Economics, Finance and Administrative
Sciences, 25(5), 70-82.
Ongore, V. O. (2011). The relationship between ownership structure and firm
performance: An empirical analysis of listed companies in Kenya. African
Journal of Business Management, 5(6), 2120-2128.
Outecheva, N. (2007). Corporate financial distress: An empirical analysis of distress
risk. Doctoral dissertation, University of St. Gallen, Switzerland.
Owolabi, S. A., & Inyang, U. E. (2013). International pragmatic review and assessment
of capital structure determinants. Kuwait Chapter of the Arabian Journal of
Business and Management Review, 2(6), 82-95.

143
Ozgulbas, N., Koyuncugil, A., & Yilmaz, F. (2006). Identifying the effect of firm size
on financial performance of SMEs. The Business Review, Cambridge, 6(1), 162-
167.
Pandey, I. M. (2009). Essentials of Financial Management (1st Edition). New Delhi:
DN, Vikas Publishing House Ltd.
Papadogonas, T. A. (2006). The financial performance of large and small firms:
Evidence from Greece. International Journal of Financial Services
Management, 2(2), 14-20.
Park, C. W., & Pincus, M. (2001). Internal versus external equity funding sources and
earnings response coefficients. Review of Quantitative Finance and Accounting,
16(1), 33-52.
Parker, S., Peters, G. F., & Turetsky, H. F. (2002). Corporate governance and corporate
failure: a survival analysis. The international Journal of Business in Society,
2(2), 4-12.
Perinpanathan, R. (2014). Impact of financial leverage on financial performance:
Special reference to John Keels Holdings Plc, Sri Lanka. Scientific Research
Journal, 2(2), 15-20.
Peura, S., & Keppo, J. (2006). Optimal bank capital with costly recapitalization. The
Journal of Business, 79(4), 2163-2201.
Phung, D. N., & Le, T. P. V. (2013). Foreign ownership, capital structure and firm
performance: Empirical evidence from Vietnamese listed firms. Journal of
Corporate Governance, 12(2), 40-51.
Pinegar, J. M., & Wilbricht, L. (1989). What managers think of capital structure theory:
a survey. Financial Management, 1(1), 82-91.

144
Platt, H. D., & Platt, M. B. (2002). Predicting corporate financial distress: reflections on
choice-based sample bias. Journal of Economics and Finance, 26(2), 184-199.
Pouraghajan, A., Malekian, E., Emamgholipour, M., Lotfollahpour, V., & Bagheri, M.
M. (2012). The relationship between capital structure and firm performance
evaluation measures: Evidence from the Tehran Stock Exchange. International
Journal of Business and Commerce, 1(9), 166-181.
Pratheepkanth, P. (2011). Capital structure and financial performance: Evidence from
selected business companies in Colombo Stock Exchange, Sri Lanka. Journal of
Arts, Science & Commerce, 2(2), 171-183.
Pushner, G. M. (1995). Equity ownership structure, leverage, and productivity:
Empirical evidence from Japan. Pacific-Basin Finance Journal, 3(2), 241-255.
Rajan, R. G., & Zingales, L. (1995). What do we know about capital structure? Some
evidence from international data. The Journal of Finance, 50(5), 1421-1460.
Rayan, K. (2010). Financial leverage and firm value. Master‟s project, University of
Pretoria, South Africa.
Richardson, S. A., & Sloan, R. G. (2003). External financing and future stock returns.
Rodney L. White Center for Financial Research Working Paper, (03-03).
Ross, S. A. (1977). The determination of financial structure: the incentive-signaling
approach. The Bell Journal of Economics, 2(2), 23-40.
Sabido, A. C., & Mulato, D. (2006). Market structure: concentration and imports as
determinants of industry margins. Estudios Económicos, 177-202.

145
Salawu, R. O., & Ile-Ife, N. (2007). An empirical analysis of the capital structure of
selected quoted companies in Nigeria. The International Journal of Applied
Economic and Finance, 1, 16-28.
Salim, M., & Yadav, R. (2012). Capital structure and firm performance: Evidence from
Malaysian listed companies. Procedia-Social and Behavioral Sciences, 65, 156-
166.
Saunders, M. L., & Lewis, P. and Thornhill, A. (2009), Research Methods for Business
Students. London: UK, Financial Times Prentice Hall Inc.
Schiantarelli, F., & Sembenelli, A. (1997). The maturity structure of debt; determinants
and effects on firms' performance: Evidence from the United Kingdom and Italy
(January 1997). World Bank Policy Research Working Paper (1699).
Schoubben, F., & Van Hulle, C. (2004). The determinants of leverage; differences
between quoted and non-quoted firms. DTEW Research Report 0450, 1-32.
Sciascia, S., & Mazzola, P. (2008). Family involvement in ownership and management:
Exploring nonlinear effects on performance. Family Business Review, 21(4),
331-345.
Scott, J.H. (1976) A theory of optimal capital structure. Bell Journal of Economics. 7(1),
33-54.
Serrasqueiro, Z. S., & Nunes, P. M. (2008). Performance and size: empirical evidence
from Portuguese SMEs. Small Business Economics, 31(2), 195-217.
Shyam-Sunder, L., & Myers, S. C. (1999). Testing static tradeoff against pecking order
models of capital structure. Journal of Financial Economics, 51(2), 219-244.

146
Sitati, A., & Odipo, M. (2011). Evaluation of applicability of Altman's revised model in
prediction of financial distress. Journal of Accounting Literature, 5(2), 117-135.
Smith Jr, C. W. (1988). Raising capital: Theory and evidence. The Investment Banking
Handbook, 11(7), 71.
Stiglitz, J. E. (1969). A re-examination of the Modigliani-Miller theorem. The American
Economic Review, 59(5), 784-793.
Sundararajan, V., Enoch, C., San José, A., Hilbers, P., Krueger, R., Moretti, M., &
Slack, G. (2002). Financial soundness indicators: analytical aspects and country
practices (Vol. 212): International Monetary Fund.
Titman, S., & Wessels, R. (1988). The determinants of capital structure choice. The
Journal of Finance, 43(1), 1-19.
Torres-Reyna, O. (2007). Panel data analysis fixed and random effects using Stata (v.
4.2). Data & Statistical Services, Princeton University.
Umar, M., Tanveer, Z., Aslam, S., & Sajid, M. (2012). Impact of capital structure on
firms‟ financial performance: Evidence from Pakistan. Research Journal of
Finance and Accounting, 3(9), 1-12.
Velnampy, T. (2013). Corporate governance and firm performance: a study of Sri
Lankan manufacturing companies. Journal of Economics and Sustainable
Development, 4(3), 228-235.
Velnampy, T. (2010). Firm size on profitability: A comparative study of Bank of Ceylon
and Commercial Bank of Ceylon Ltd in Srilanka. Global Journal of
Management and Business Research, 10(2), 96-103.

147
Vermoesen, V., Deloof, M., & Laveren, E. (2013). Long-term debt maturity and
financing constraints of SMEs during the global financial crisis. Small Business
Economics, 41(2), 433-448.
Vijayakumar, A., & Tamizhselvan, P. (2010). Corporate size and profitability: An
empirical analysis. Journal for Bloomers of Research, 3(1), 44-53.
Wanjiru, M. M. (2015). Determinants of interest rate spread among commercial banks
of Kenya. Unpublished Doctoral thesis, Jomo Kenyatta University of Agriculture
and Technology, Kenya.
Whitaker, R. B. (1999). The early stages of financial distress. Journal of Economics and
Finance, 23(2), 123-132.
Wiggins, V., & Poi, B. (2001). How do I test for panel-level heteroskedasticity (5th Ed).
Italy: Prentice Hall.
Wuxiang, Z., & Yong, S. (2001). Equity structure and firm value: An empirical analysis
of listed companies of household electric appliances industry. Economic
Research Journal, 12(1), 66-72.
Xiaoyue, C., & Xiaodong, X. (2001). Equity structure, firm performance and the
protection for investors' interest. Economic Research Journal, 11(6), 3-11.
Xin, W. Z. (2014). The impact of ownership structure and capital structure on financial
performance of Vietnamese firms. International Business Research, 7(2), 64-79.
Yat Hung, C., Ping Chuen Albert, C., & Chi Man Eddie, H. (2002). Capital structure
and profitability of the property and construction sectors in Hong Kong. Journal
of Property Investment & Finance, 20(6), 434-453.

148
Zeitun, R., & Tian, G. G. (2014). Capital structure and corporate performance: evidence
from Jordan. Australasian Accounting Business & Finance Journal, 7(3), 287-
301.
Zouari, A., & Abid, F. (2000). Financial distress prediction using neural networks: The
Tunisian firms experience. Paper presented at the International Conference on
Modeling and Simulation, Tunis.

149
APPENDICES
Appendix I: Study Population
Firm
Code Firm Name Sector Name
Sector
code
1 Kakuzi Ltd Agriculture 1
2 Eaagads Ltd Agriculture 1
3 Kapchorua Tea Company Ltd Agriculture 1
4 The Limuru Tea Company Ltd Agriculture 1
5 Rea Vipingo Plantations Ltd Agriculture 1
6 Sasini Ltd Agriculture 1
7 Williamson Tea Kenya Ltd Agriculture 1
8 Car and General (K) Ltd Automobiles &
Accessories 2
9 CMC Holdings Ltd Automobiles &
Accessories 2
10 Marshals(E.A) Ltd Automobiles &
Accessories 2
11 Sameer Africa Ltd Automobiles &
Accessories 2
12 Express Kenya Ltd Commercial &
Services 3
13 Kenya airways Ltd Commercial &
Services 3
14 Longhorn Kenya Ltd Commercial &
Services 3
15 Nation Media Group Ltd Commercial &
Services 3
16 Scan group Ltd Commercial &
Services 3
17 Standard Group Ltd Commercial &
Services 3
18 TPS Eastern Africa Ltd Commercial &
Services 3
19 Uchumi Supermarket Ltd Commercial &
Services 3
20 Athi River Ltd Construction&allied 4
21 Bamburi Cement Ltd Construction&allied 4
22 Crown Paints Kenya Ltd Construction&allied 4
23 E.A Cables Ltd Construction&allied 4

150
24 E.A Portland Cement Company Ltd Construction&allied 4
25 KenGen Company Ltd Petroleum& Energy 5
26 KenolKobil Ltd Petroleum& Energy 5
27 Kenya Power and Lightning
Company Ltd Petroleum& Energy 5
28 Total Kenya Ltd Petroleum& Energy 5
29 Centum Investment Company Ltd Investments 6
30 Olympia Capital Holdings Ltd Investments 6
31 Trans-Century Ltd Investments 6
32 Nairobi Securities Exchange Investments 6
33 B.O.C Kenya Ltd Manufacturing&allied 7
34 British American Tobacco Kenya
Ltd Manufacturing&allied 7
35 Carbacids Investments Ltd Manufacturing&allied 7
36 East African Breweries Ltd Manufacturing&allied 7
37 Eveready East Africa Ltd Manufacturing&allied 7
38 Kenya Orchards Manufacturing&allied 7
39 Mumias Sugar Ltd Manufacturing&allied 7
40 Unga Group Ltd Manufacturing&allied 7
41 Safaricom Ltd Commercial &
Services 3
Source: (NSE, 2013)

151
Appendix II: Secondary Data Collection Instrument
Variable Description Years
2004 2005 2006 2007 2008 2009 2010 2011 2012 2013
Assets Noncurrent
assets
Current
assets
Total assets
Cash flow
from
operations
Debt Short term
debts
Long term
debts
Total debt
Equities Book value
of equity
Market
value of
equity
Revenues Total sales
Earnings EBIT
Net
earnings
Retained
earnings
Price
index
GNP Price
level index

152
Appendix III: Panel Data
YEAR
Total
debt
Long
term
debt
Short
term
debt Tangibility Size
Sales
growth
Total
equity
Internal
equity
External
equity Z-score Firm code Sector
2004 0.503 0.637 0.363 0.883 13.826
0.497 0.903 0.097 5.711 1 1
2005 0.559 0.468 0.532 0.847 13.721 -0.221 0.441 0.892 0.108 4.213 1 1
2006 0.546 0.527 0.473 0.829 13.858 0.260 0.454 0.906 0.094 5.641 1 1
2007 0.467 0.612 0.388 0.858 14.051 0.081 0.533 0.897 0.103 6.660 1 1
2008 0.411 0.627 0.373 0.835 14.265 0.067 0.589 0.886 0.114 7.620 1 1
2009 0.343 0.581 0.419 0.785 14.451 0.245 0.657 0.865 0.135 8.829 1 1
2010 0.313 0.619 0.381 0.753 14.609 0.053 0.687 0.858 0.142 9.400 1 1
2011 0.278 0.669 0.331 0.692 14.830 0.124 0.722 0.871 0.129 10.916 1 1
2012 0.216 0.810 0.190 0.654 14.846 -0.342 0.784 0.965 0.035 12.199 1 1
2013 0.219 0.819 0.181 0.685 14.882 -0.115 0.781 0.966 0.034 11.483 1 1
2004 0.173 0.877 0.123 0.736 11.909
0.827 0.918 0.082 10.861 2 1
2005 0.214 0.915 0.085 0.792 12.135 -0.285 0.786 0.931 0.069 9.732 2 1
2006 0.220 0.948 0.052 0.857 12.328 0.835 0.780 0.943 0.057 9.543 2 1
2007 0.250 0.815 0.185 0.889 12.289 -0.204 0.750 0.938 0.062 9.027 2 1
2008 0.304 0.696 0.304 0.783 12.531 0.396 0.696 0.948 0.052 9.665 2 1
2009 0.252 0.905 0.095 0.839 12.469 0.688 0.748 0.897 0.103 9.882 2 1
2010 0.304 0.696 0.304 0.783 12.531 -0.408 0.696 0.948 0.052 7.514 2 1
2011 0.250 0.835 0.165 0.755 12.780 1.591 0.750 0.925 0.075 9.658 2 1
2012 0.160 0.951 0.049 0.852 13.259 -0.149 0.840 0.958 0.042 11.124 2 1
2013 0.195 0.636 0.364 0.905 13.121 -0.567 0.805 0.900 0.100 7.158 2 1
2004 0.323 0.781 0.219 0.790 13.809
0.677 0.971 0.029 8.608 3 1
2005 0.339 0.704 0.296 0.783 13.850 0.306 0.661 0.971 0.029 8.159 3 1

153
2006 0.322 0.770 0.230 0.833 13.780 -0.191 0.678 0.970 0.030 7.989 3 1
2007 0.360 0.678 0.322 0.767 13.920 0.319 0.640 0.972 0.028 7.603 3 1
2008 0.367 0.674 0.326 0.788 13.797 -0.058 0.633 0.969 0.031 6.602 3 1
2009 0.410 0.568 0.432 0.702 13.971 0.292 0.590 0.972 0.028 7.723 3 1
2010 0.454 0.392 0.608 0.547 14.220 0.521 0.546 0.976 0.024 8.118 3 1
2011 0.378 0.538 0.462 0.633 14.267 0.103 0.622 0.980 0.020 9.199 3 1
2012 0.422 0.449 0.551 0.617 14.490 0.128 0.578 0.983 0.017 7.595 3 1
2013 0.382 0.510 0.490 0.604 14.547 -0.038 0.618 0.985 0.015 8.864 3 1
2004 0.331 0.716 0.284 0.414 11.137
0.669 0.739 0.261 10.857 4 1
2005 0.358 0.763 0.237 0.458 10.956 -0.339 0.642 0.674 0.326 8.222 4 1
2006 0.312 0.726 0.274 0.454 11.022 0.372 0.688 0.715 0.285 10.107 4 1
2007 0.347 0.724 0.276 0.465 10.958 0.065 0.653 0.680 0.320 9.425 4 1
2008 0.375 0.526 0.474 0.298 10.964 0.279 0.625 0.668 0.332 11.232 4 1
2009 0.340 0.406 0.594 0.225 11.348 0.311 0.660 0.571 0.429 13.001 4 1
2010 0.246 0.713 0.287 0.436 11.972 0.359 0.754 0.799 0.201 15.904 4 1
2011 0.217 0.868 0.132 0.475 12.161 -0.172 0.783 0.840 0.160 14.381 4 1
2012 0.243 0.865 0.135 0.591 12.676 0.132 0.757 0.901 0.099 14.194 4 1
2013 0.160 0.951 0.049 0.852 13.259 0.354 0.840 0.951 0.049 11.168 4 1
2004 0.440 0.446 0.554 0.615 13.844
0.560 0.479 0.521 7.361 5 1
2005 0.408 0.430 0.570 0.597 13.860 0.264 0.592 0.516 0.484 8.054 5 1
2006 0.388 0.406 0.594 0.644 13.880 0.070 0.612 0.540 0.460 7.978 5 1
2007 0.392 0.350 0.650 0.595 13.970 0.044 0.608 0.577 0.423 8.186 5 1
2008 0.464 0.267 0.733 0.508 14.305 0.100 0.536 0.657 0.343 7.568 5 1
2009 0.310 0.488 0.512 0.645 14.162 0.011 0.690 0.692 0.308 9.546 5 1
2010 0.421 0.392 0.608 0.656 14.350 0.051 0.579 0.697 0.303 7.131 5 1
2011 0.358 0.481 0.519 0.609 14.644 0.467 0.642 0.796 0.204 10.162 5 1
2012 0.275 0.606 0.394 0.630 14.681 0.216 0.725 0.826 0.174 11.368 5 1
2013 0.251 0.685 0.315 0.628 14.844 -0.001 0.749 0.857 0.143 12.017 5 1
2004 0.202 0.727 0.273 0.858 15.207
0.798 0.919 0.081 10.310 6 1

154
2005 0.190 0.648 0.352 0.867 15.052 -0.104 0.810 0.900 0.100 7.582 6 1
2006 0.209 0.630 0.370 0.848 15.158 0.362 0.791 0.906 0.094 8.795 6 1
2007 0.228 0.701 0.299 0.862 15.157 0.044 0.772 0.894 0.106 7.571 6 1
2008 0.306 0.826 0.174 0.857 15.732 0.098 0.694 0.926 0.074 7.764 6 1
2009 0.292 0.826 0.174 0.870 15.895 0.499 0.708 0.936 0.064 7.250 6 1
2010 0.284 0.798 0.202 0.864 16.019 0.053 0.716 0.944 0.056 7.839 6 1
2011 0.285 0.784 0.216 0.869 16.063 0.160 0.715 0.938 0.062 7.414 6 1
2012 0.280 0.765 0.235 0.876 16.004 0.043 0.720 0.944 0.056 6.699 6 1
2013 0.295 0.726 0.274 0.857 16.019 0.013 0.705 0.949 0.051 6.761 6 1
2004 0.271 0.795 0.205 0.827 14.991
0.729 0.947 0.053 9.019 7 1
2005 0.273 0.754 0.246 0.804 15.019 0.401 0.727 0.946 0.054 9.177 7 1
2006 0.265 0.749 0.251 0.834 14.965 -0.178 0.735 0.946 0.054 8.763 7 1
2007 0.290 0.701 0.299 0.794 15.139 0.225 0.710 0.949 0.051 8.892 7 1
2008 0.295 0.739 0.261 0.832 15.091 -0.017 0.705 0.951 0.049 7.991 7 1
2009 0.329 0.621 0.379 0.767 15.182 0.257 0.671 0.954 0.046 8.217 7 1
2010 0.349 0.490 0.510 0.638 15.489 0.828 0.651 0.956 0.044 9.845 7 1
2011 0.292 0.610 0.390 0.614 15.613 0.206 0.708 0.958 0.042 11.112 7 1
2012 0.317 0.557 0.443 0.662 15.796 0.098 0.683 0.958 0.042 9.349 7 1
2013 0.270 0.659 0.341 0.665 15.898 -0.032 0.730 0.960 0.040 10.430 7 1
2004 0.464 0.086 0.914 0.412 13.517
0.536 0.721 0.279 6.883 8 2
2005 0.480 0.214 0.786 0.501 13.965 0.688 0.520 0.816 0.184 7.758 8 2
2006 0.488 0.230 0.770 0.489 14.174 0.172 0.512 0.846 0.154 7.166 8 2
2007 0.566 0.164 0.836 0.377 14.530 0.484 0.434 0.869 0.131 6.956 8 2
2008 0.590 0.128 0.872 0.335 14.827 0.623 0.410 0.894 0.106 6.901 8 2
2009 0.593 0.116 0.884 0.318 14.982 0.451 0.407 0.900 0.100 6.944 8 2
2010 0.598 0.119 0.881 0.308 15.169 0.099 0.402 0.916 0.084 6.877 8 2
2011 0.655 0.147 0.853 0.373 15.532 0.274 0.345 0.883 0.117 5.836 8 2
2012 0.624 0.178 0.822 0.405 15.557 -0.062 0.376 0.897 0.103 6.099 8 2
2013 0.637 0.143 0.857 0.393 15.747 0.235 0.363 0.904 0.096 5.824 8 2

155
2004 0.566 0.126 0.874 0.243 15.657
0.434 0.911 0.767 7.163 9 2
2005 0.570 0.092 0.908 0.234 15.769 0.126 0.430 0.920 0.785 7.193 9 2
2006 0.547 0.096 0.904 0.225 15.871 0.081 0.453 0.931 0.798 7.618 9 2
2007 0.564 0.049 0.951 0.182 16.048 0.219 0.436 0.940 0.825 7.714 9 2
2008 0.598 0.034 0.966 0.159 16.302 0.279 0.402 0.940 0.853 7.606 9 2
2009 0.603 0.057 0.943 0.181 16.403 0.021 0.397 0.945 0.837 7.192 9 2
2010 0.628 0.046 0.954 0.167 16.501 0.085 0.372 0.947 0.849 6.858 9 2
2011 0.647 0.046 0.954 0.156 16.495 -0.072 0.353 0.943 0.846 6.314 9 2
2012 0.557 0.094 0.906 0.224 16.377 -0.006 0.443 0.949 0.780 7.509 9 2
2013 0.525 0.101 0.899 0.237 16.325 0.042 0.475 0.950 0.788 7.687 9 2
2004 0.749 0.001 0.999 0.387 13.795
0.251 0.707 0.293 3.171 10 2
2005 0.708 0.256 0.744 0.361 13.804 -0.010 0.292 0.751 0.249 4.849 10 2
2006 0.693 0.190 0.810 0.310 13.897 0.034 0.307 0.784 0.216 5.196 10 2
2007 0.726 0.321 0.679 0.418 14.032 -0.010 0.274 0.789 0.211 4.583 10 2
2008 0.801 0.464 0.536 0.445 14.006 -0.308 0.199 0.701 0.299 3.293 10 2
2009 0.667 0.345 0.655 0.613 14.176 -0.337 0.333 0.849 0.151 2.294 10 2
2010 0.882 0.426 0.574 0.748 13.934 0.182 0.118 0.457 0.543 -1.512 10 2
2011 0.626 0.001 0.999 0.830 13.890 -0.625 0.374 0.821 0.179 -1.272 10 2
2012 0.309 0.003 0.997 0.652 13.248 -0.109 0.691 0.816 0.184 5.561 10 2
2013 0.452 0.053 0.947 0.714 13.152 -0.016 0.548 0.745 0.255 2.661 10 2
2004 0.326 0.117 0.883 0.339 14.910
0.674 0.308 0.692 9.276 11 2
2005 0.367 0.124 0.876 0.303 14.980 0.027 0.633 0.314 0.686 8.736 11 2
2006 0.441 0.138 0.862 0.298 15.012 -0.056 0.559 0.248 0.752 7.334 11 2
2007 0.380 0.127 0.873 0.296 14.967 0.094 0.620 0.291 0.709 8.540 11 2
2008 0.306 0.137 0.863 0.328 14.939 -0.128 0.694 0.348 0.652 9.802 11 2
2009 0.241 0.162 0.838 0.310 14.916 0.083 0.759 0.390 0.610 11.234 11 2
2010 0.238 0.181 0.819 0.326 14.861 0.020 0.762 0.358 0.642 11.016 11 2
2011 0.280 0.138 0.862 0.271 14.955 0.099 0.720 0.381 0.619 10.665 11 2
2012 0.316 0.123 0.877 0.216 15.039 0.111 0.684 0.402 0.598 10.464 11 2

156
2013 0.270 0.154 0.846 0.231 15.115 -0.013 0.730 0.481 0.519 11.668 11 2
2004 0.674 0.046 0.954 0.635 13.321
0.326 0.192 0.808 2.730 12 3
2005 0.589 0.115 0.885 0.643 13.331 -0.401 0.411 0.364 0.636 3.791 12 3
2006 0.578 0.258 0.742 0.721 13.705 -0.221 0.422 0.531 0.469 4.066 12 3
2007 0.461 0.325 0.675 0.752 13.622 0.121 0.539 0.602 0.398 5.971 12 3
2008 0.673 0.427 0.573 0.860 14.094 -0.129 0.327 0.477 0.523 2.264 12 3
2009 0.684 0.437 0.563 0.882 14.081 0.112 0.316 0.545 0.455 2.666 12 3
2010 0.714 0.419 0.581 0.866 14.111 -0.076 0.286 0.571 0.429 2.536 12 3
2011 0.458 0.575 0.425 0.820 13.550 -0.454 0.542 -0.042 1.042 2.448 12 3
2012 0.600 0.457 0.543 0.871 13.114 -0.489 0.400 0.107 0.893 2.383 12 3
2013 0.587 0.428 0.572 0.785 13.083 0.685 0.413 0.108 0.892 2.783 12 3
2004 0.713 0.644 0.356 0.779 17.197
0.287 0.724 0.276 4.707 13 3
2005 0.725 0.569 0.431 0.742 17.618 0.359 0.275 0.812 0.188 4.941 13 3
2006 0.751 0.696 0.304 0.742 18.054 0.278 0.249 0.866 0.134 5.248 13 3
2007 0.720 0.738 0.262 0.737 18.163 0.113 0.280 0.893 0.107 5.541 13 3
2008 0.658 0.725 0.275 0.716 18.170 0.029 0.342 0.913 0.087 5.719 13 3
2009 0.771 0.642 0.358 0.751 18.132 0.188 0.229 0.866 0.134 4.448 13 3
2010 0.727 0.614 0.386 0.756 18.110 -0.015 0.273 0.882 0.118 4.408 13 3
2011 0.706 0.600 0.400 0.700 18.182 0.213 0.294 0.898 0.102 5.063 13 3
2012 0.703 0.563 0.437 0.718 18.165 0.257 0.297 0.897 0.103 4.541 13 3
2013 0.746 0.444 0.556 0.767 18.625 -0.084 0.254 0.759 0.241 2.283 13 3
2004
14 3
2005
14 3
2006
14 3
2007
14 3
2008
14 3
2009 0.342 0.000 1.000 0.303 12.975
0.658 0.794 0.206 9.768 14 3
2010 0.427 0.103 0.897 0.274 13.167 -0.177 0.573 0.805 0.195 8.736 14 3
2011 0.434 0.031 0.969 0.257 13.473 1.090 0.566 0.854 0.146 10.343 14 3

157
2012 0.600 0.000 1.000 0.329 13.403 -0.295 0.400 0.779 0.221 5.314 14 3
2013 0.437 0.000 1.000 0.293 13.437 0.332 0.563 0.848 0.152 9.432 14 3
2004 0.294 0.009 0.991 0.500 15.214
0.706 0.922 0.078 10.395 15 3
2005 0.270 0.031 0.969 0.463 15.303 0.150 0.730 0.908 0.092 11.231 15 3
2006 0.339 0.200 0.800 0.394 15.482 0.133 0.661 0.924 0.076 10.389 15 3
2007 0.367 0.124 0.876 0.387 15.590 0.212 0.633 0.928 0.072 10.276 15 3
2008 0.348 0.057 0.943 0.391 15.705 0.074 0.652 0.920 0.080 10.655 15 3
2009 0.283 0.048 0.952 0.427 15.698 -0.007 0.717 0.910 0.090 11.415 15 3
2010 0.320 0.000 1.000 0.363 15.892 0.172 0.680 0.916 0.084 10.967 15 3
2011 0.306 0.061 0.939 0.336 15.992 0.171 0.694 0.924 0.076 11.974 15 3
2012 0.314 0.041 0.959 0.321 16.184 0.098 0.686 0.936 0.064 11.644 15 3
2013 0.280 0.026 0.974 0.314 16.253 0.083 0.720 0.935 0.065 12.337 15 3
2004
16 3
2005 0.764 0.001 0.999 0.038 13.837
0.236 0.364 0.636 5.848 16 3
2006 0.620 0.000 1.000 0.038 14.029 2.494 0.380 0.637 0.363 8.310 16 3
2007 0.656 0.003 0.997 0.081 14.377 0.585 0.344 0.708 0.292 7.611 16 3
2008 0.447 0.002 0.998 0.048 15.140 0.213 0.553 0.885 0.115 9.128 16 3
2009 0.398 0.007 0.993 0.183 15.185 0.023 0.602 0.902 0.098 9.179 16 3
2010 0.553 0.043 0.957 0.111 15.896 0.920 0.447 0.845 0.155 7.671 16 3
2011 0.487 0.082 0.918 0.084 15.954 0.035 0.513 0.818 0.182 9.135 16 3
2012 0.426 0.084 0.916 0.120 15.938 0.110 0.574 0.805 0.195 9.587 16 3
2013 0.362 0.078 0.922 0.179 16.361 0.083 0.638 0.946 0.054 8.659 16 3
2004 0.703 0.194 0.806 0.446 13.791
0.297 -0.512 1.512 4.162 17 3
2005 0.631 0.139 0.861 0.430 13.797 0.127 0.369 -0.226 1.226 4.686 17 3
2006 0.560 0.240 0.760 0.391 14.071 0.492 0.440 0.126 0.874 7.040 17 3
2007 0.640 0.502 0.498 0.578 14.606 -0.120 0.360 0.235 0.765 6.160 17 3
2008 0.628 0.499 0.501 0.570 14.804 0.081 0.372 0.368 0.632 6.352 17 3
2009 0.580 0.512 0.488 0.640 14.915 -0.018 0.420 0.480 0.520 6.236 17 3
2010 0.535 0.415 0.585 0.586 15.011 0.122 0.465 0.550 0.450 6.548 17 3

158
2011 0.529 0.357 0.643 0.633 15.072 0.022 0.471 0.625 0.375 5.951 17 3
2012 0.475 0.327 0.673 0.644 15.069 0.140 0.525 0.657 0.343 6.554 17 3
2013 0.510 0.326 0.674 0.603 15.235 0.332 0.490 0.693 0.307 6.370 17 3
2004 0.469 0.341 0.659 0.660 14.536
0.531 0.823 0.177 6.040 18 3
2005 0.525 0.721 0.279 0.819 15.430 0.829 0.475 0.846 0.154 5.433 18 3
2006 0.445 0.760 0.240 0.839 15.630 0.067 0.555 0.962 0.038 6.041 18 3
2007 0.458 0.572 0.428 0.794 15.730 0.124 0.542 0.971 0.029 5.785 18 3
2008 0.422 0.631 0.369 0.809 15.692 -0.116 0.578 0.972 0.028 5.959 18 3
2009 0.418 0.663 0.337 0.783 15.764 0.199 0.582 0.974 0.026 6.470 18 3
2010 0.371 0.625 0.375 0.804 16.294 0.147 0.629 0.967 0.033 6.380 18 3
2011 0.387 0.682 0.318 0.816 16.391 0.225 0.613 0.970 0.030 6.393 18 3
2012 0.393 0.614 0.386 0.846 16.417 -0.022 0.607 0.975 0.025 5.979 18 3
2013 0.321 0.569 0.431 0.854 16.603 0.280 0.679 0.895 0.105 6.615 18 3
2004 0.966 0.132 0.868 0.568 14.999 -0.105 0.034 -1.728 2.728 -1.162 19 3
2005 1.601 0.261 0.739 0.702 14.433 -0.351 -0.601 1.269 -0.269 -9.848 19 3
2006 1.491 0.361 0.639 0.673 14.215 -0.313 -0.491 2.230 -1.230 -9.137 19 3
2007 1.694 0.596 0.404 0.518 14.275 0.268 -0.694 1.819 -0.819 -4.697 19 3
2008 1.616 0.448 0.552 0.448 14.304 0.508 -0.616 1.896 -0.896 -3.546 19 3
2009 1.074 0.313 0.687 0.573 14.708 0.212 -0.074 5.986 -4.986 -0.548 19 3
2010 0.512 0.198 0.802 0.622 14.964 0.161 0.488 0.415 0.585 4.073 19 3
2011 0.431 0.106 0.894 0.651 15.203 0.127 0.569 0.418 0.582 4.719 19 3
2012 0.462 0.035 0.965 0.677 15.413 0.281 0.538 0.501 0.499 3.986 19 3
2013 0.475 0.076 0.924 0.690 15.534 0.034 0.525 0.546 0.454 4.103 19 3
2004 0.487 0.337 0.663 0.663 14.522
0.513 0.502 0.498 5.450 20 4
2005 0.626 0.743 0.257 0.674 14.991 0.347 0.374 0.576 0.424 6.041 20 4
2006 0.677 0.624 0.376 0.752 15.263 0.179 0.323 0.626 0.374 4.845 20 4
2007 0.607 0.610 0.390 0.737 15.321 0.490 0.393 0.699 0.301 5.920 20 4
2008 0.665 0.564 0.436 0.703 15.664 0.190 0.335 0.767 0.233 5.547 20 4
2009 0.660 0.581 0.419 0.723 16.312 0.114 0.340 0.880 0.120 4.870 20 4
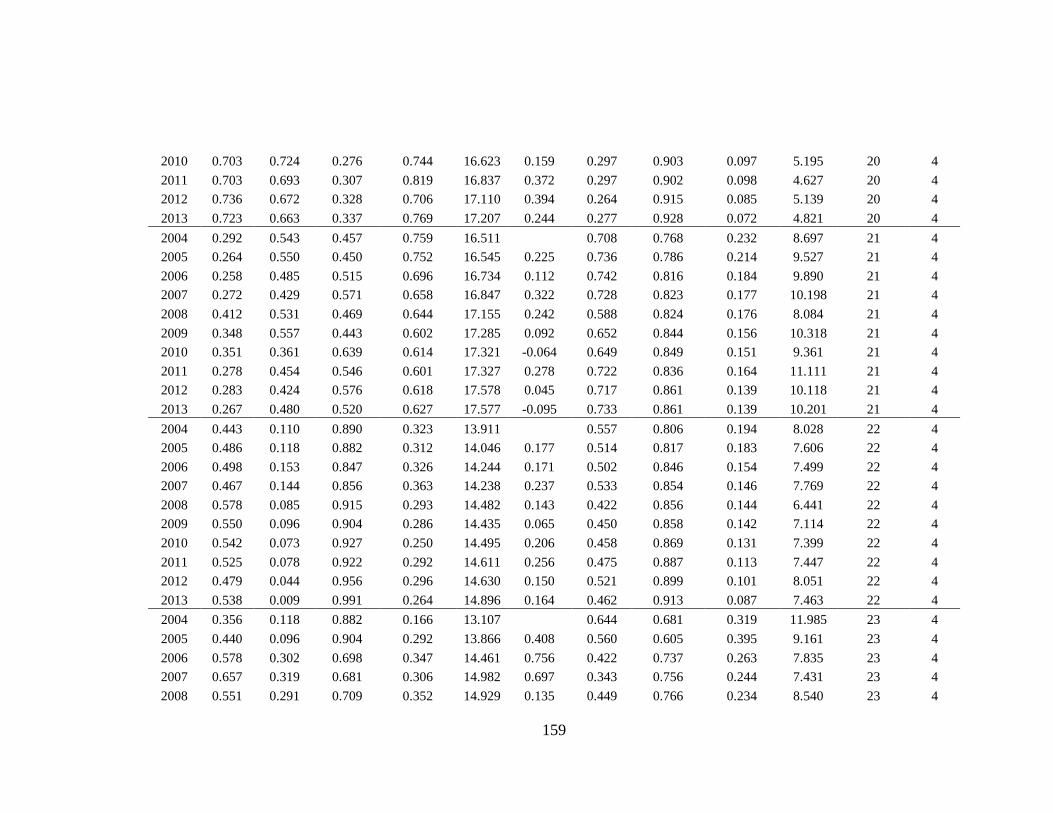
159
2010 0.703 0.724 0.276 0.744 16.623 0.159 0.297 0.903 0.097 5.195 20 4
2011 0.703 0.693 0.307 0.819 16.837 0.372 0.297 0.902 0.098 4.627 20 4
2012 0.736 0.672 0.328 0.706 17.110 0.394 0.264 0.915 0.085 5.139 20 4
2013 0.723 0.663 0.337 0.769 17.207 0.244 0.277 0.928 0.072 4.821 20 4
2004 0.292 0.543 0.457 0.759 16.511
0.708 0.768 0.232 8.697 21 4
2005 0.264 0.550 0.450 0.752 16.545 0.225 0.736 0.786 0.214 9.527 21 4
2006 0.258 0.485 0.515 0.696 16.734 0.112 0.742 0.816 0.184 9.890 21 4
2007 0.272 0.429 0.571 0.658 16.847 0.322 0.728 0.823 0.177 10.198 21 4
2008 0.412 0.531 0.469 0.644 17.155 0.242 0.588 0.824 0.176 8.084 21 4
2009 0.348 0.557 0.443 0.602 17.285 0.092 0.652 0.844 0.156 10.318 21 4
2010 0.351 0.361 0.639 0.614 17.321 -0.064 0.649 0.849 0.151 9.361 21 4
2011 0.278 0.454 0.546 0.601 17.327 0.278 0.722 0.836 0.164 11.111 21 4
2012 0.283 0.424 0.576 0.618 17.578 0.045 0.717 0.861 0.139 10.118 21 4
2013 0.267 0.480 0.520 0.627 17.577 -0.095 0.733 0.861 0.139 10.201 21 4
2004 0.443 0.110 0.890 0.323 13.911
0.557 0.806 0.194 8.028 22 4
2005 0.486 0.118 0.882 0.312 14.046 0.177 0.514 0.817 0.183 7.606 22 4
2006 0.498 0.153 0.847 0.326 14.244 0.171 0.502 0.846 0.154 7.499 22 4
2007 0.467 0.144 0.856 0.363 14.238 0.237 0.533 0.854 0.146 7.769 22 4
2008 0.578 0.085 0.915 0.293 14.482 0.143 0.422 0.856 0.144 6.441 22 4
2009 0.550 0.096 0.904 0.286 14.435 0.065 0.450 0.858 0.142 7.114 22 4
2010 0.542 0.073 0.927 0.250 14.495 0.206 0.458 0.869 0.131 7.399 22 4
2011 0.525 0.078 0.922 0.292 14.611 0.256 0.475 0.887 0.113 7.447 22 4
2012 0.479 0.044 0.956 0.296 14.630 0.150 0.521 0.899 0.101 8.051 22 4
2013 0.538 0.009 0.991 0.264 14.896 0.164 0.462 0.913 0.087 7.463 22 4
2004 0.356 0.118 0.882 0.166 13.107
0.644 0.681 0.319 11.985 23 4
2005 0.440 0.096 0.904 0.292 13.866 0.408 0.560 0.605 0.395 9.161 23 4
2006 0.578 0.302 0.698 0.347 14.461 0.756 0.422 0.737 0.263 7.835 23 4
2007 0.657 0.319 0.681 0.306 14.982 0.697 0.343 0.756 0.244 7.431 23 4
2008 0.551 0.291 0.709 0.352 14.929 0.135 0.449 0.766 0.234 8.540 23 4

160
2009 0.531 0.338 0.662 0.520 15.081 -0.284 0.469 0.836 0.164 6.933 23 4
2010 0.503 0.384 0.616 0.603 15.324 0.282 0.497 0.772 0.228 6.131 23 4
2011 0.545 0.237 0.763 0.518 15.424 0.379 0.455 0.757 0.243 6.045 23 4
2012 0.532 0.238 0.762 0.515 15.648 -0.135 0.468 0.751 0.249 6.204 23 4
2013 0.550 0.266 0.734 0.474 15.734 0.047 0.450 0.745 0.255 6.166 23 4
2004 0.759 0.810 0.190 0.676 15.826
0.241 0.750 0.250 5.180 24 4
2005 0.708 0.836 0.164 0.618 15.859 0.287 0.292 0.800 0.200 6.420 24 4
2006 0.660 0.766 0.234 0.615 16.019 0.152 0.340 0.854 0.146 6.016 24 4
2007 0.596 0.731 0.269 0.645 16.006 0.036 0.404 0.875 0.125 6.300 24 4
2008 0.556 0.767 0.233 0.707 16.021 0.125 0.444 0.888 0.112 6.601 24 4
2009 0.493 0.745 0.255 0.740 16.305 0.124 0.507 0.926 0.074 7.715 24 4
2010 0.526 0.710 0.290 0.758 16.304 0.161 0.474 0.921 0.079 5.736 24 4
2011 0.582 0.732 0.268 0.771 16.414 0.081 0.418 0.920 0.080 5.605 24 4
2012 0.671 0.744 0.256 0.824 16.453 -0.164 0.329 0.902 0.098 3.945 24 4
2013 0.561 0.633 0.367 0.777 16.596 0.083 0.439 0.937 0.063 5.156 24 4
2004 0.567 0.899 0.101 0.914 18.118
0.433 0.358 0.074 5.094 25 5
2005 0.571 0.880 0.120 0.869 18.171 0.229 0.429 0.359 0.071 5.268 25 5
2006 0.437 0.821 0.179 0.820 17.987 0.299 0.563 0.479 0.085 6.482 25 5
2007 0.378 0.811 0.189 0.903 18.434 0.018 0.622 0.574 0.054 6.037 25 5
2008 0.361 0.803 0.197 0.900 18.488 -0.206 0.639 0.588 0.051 6.216 25 5
2009 0.407 0.872 0.128 0.886 18.542 0.174 0.593 0.544 0.049 6.226 25 5
2010 0.532 0.913 0.087 0.782 18.830 -0.151 0.468 0.432 0.037 6.062 25 5
2011 0.569 0.877 0.123 0.879 18.897 0.322 0.431 0.397 0.034 5.237 25 5
2012 0.570 0.839 0.161 0.863 18.910 0.145 0.430 0.396 0.034 5.291 25 5
2013 0.607 0.846 0.154 0.867 19.056 0.016 0.393 0.364 0.029 5.096 25 5
2004 0.456 0.102 0.898 0.381 15.646
0.544 0.985 0.015 8.536 26 5
2005 0.520 0.062 0.938 0.290 15.941 0.211 0.480 0.987 0.013 8.275 26 5
2006 0.650 0.046 0.954 0.224 16.407 0.111 0.350 0.989 0.011 6.480 26 5
2007 0.624 0.071 0.929 0.248 16.401 0.113 0.376 0.990 0.010 6.713 26 5

161
2008 0.606 0.029 0.971 0.238 17.137 1.606 0.394 0.993 0.007 6.464 26 5
2009 0.666 0.017 0.983 0.146 17.198 -0.281 0.334 0.993 0.007 6.115 26 5
2010 0.631 0.015 0.985 0.144 17.229 0.051 0.369 0.993 0.007 6.726 26 5
2011 0.747 0.045 0.955 0.127 17.644 1.187 0.253 0.994 0.006 6.090 26 5
2012 0.803 0.034 0.966 0.249 17.302 -0.134 0.197 0.989 0.011 2.073 26 5
2013 0.763 0.033 0.967 0.311 17.152 -0.430 0.237 0.989 0.011 3.941 26 5
2004 0.458 0.423 0.577 0.700 17.290
0.542 0.910 0.090 4.530 27 5
2005 0.473 0.375 0.625 0.622 17.395 0.072 0.527 0.916 0.084 5.123 27 5
2006 0.469 0.333 0.667 0.588 17.472 0.034 0.531 0.923 0.077 5.461 27 5
2007 0.530 0.288 0.712 0.598 17.672 0.036 0.470 0.929 0.071 4.852 27 5
2008 0.601 0.485 0.515 0.653 17.907 0.026 0.399 0.934 0.066 4.706 27 5
2009 0.625 0.585 0.415 0.703 18.086 0.524 0.375 0.941 0.059 4.915 27 5
2010 0.642 0.636 0.364 0.756 18.200 0.096 0.358 0.945 0.055 4.727 27 5
2011 0.668 0.621 0.379 0.707 18.602 0.096 0.332 0.891 0.109 4.749 27 5
2012 0.676 0.654 0.346 0.790 18.714 0.027 0.324 0.888 0.112 4.395 27 5
2013 0.732 0.694 0.306 0.794 18.993 0.065 0.268 0.897 0.103 4.231 27 5
2004 0.571 0.000 1.000 0.221 16.172
0.429 0.806 0.194 6.462 28 5
2005 0.571 0.000 1.000 0.257 16.193 -0.109 0.429 0.810 0.190 6.371 28 5
2006 0.696 0.000 1.000 0.184 16.547 -0.086 0.304 0.812 0.188 5.346 28 5
2007 0.620 0.000 1.000 0.219 16.342 0.134 0.380 0.816 0.184 6.020 28 5
2008 0.655 0.000 1.000 0.190 16.492 0.282 0.345 0.826 0.174 5.956 28 5
2009 0.716 0.176 0.824 0.341 17.266 -0.267 0.284 0.467 0.533 4.626 28 5
2010 0.685 0.178 0.822 0.338 17.229 0.970 0.315 0.502 0.498 5.215 28 5
2011 0.739 0.116 0.884 0.280 17.377 0.438 0.261 0.481 0.519 4.603 28 5
2012 0.570 0.045 0.955 0.292 17.311 0.161 0.430 0.297 0.703 5.646 28 5
2013 0.615 0.045 0.955 0.249 17.504 0.319 0.385 0.351 0.649 5.658 28 5
2004 0.079 0.235 0.765 0.965 14.995
0.921 0.908 0.092 17.125 29 6
2005 0.068 0.534 0.466 0.965 15.432 -0.324 0.932 0.941 0.059 18.835 29 6
2006 0.037 0.202 0.798 0.945 15.676 0.684 0.963 0.956 0.044 31.714 29 6

162
2007 0.009 0.000 1.000 0.957 15.946 0.994 0.991 0.967 0.033 125.282 29 6
2008 0.008 0.000 1.000 0.962 15.913 -0.278 0.992 0.966 0.034 130.928 29 6
2009 0.039 0.000 1.000 0.983 15.698 -0.327 0.961 0.956 0.044 31.501 29 6
2010 0.048 0.000 1.000 0.939 15.926 1.651 0.952 0.965 0.035 26.532 29 6
2011 0.223 0.725 0.275 0.980 16.325 1.178 0.777 0.965 0.035 9.627 29 6
2012 0.132 0.741 0.259 0.969 16.264 -0.437 0.868 0.967 0.033 13.144 29 6
2013 0.281 0.936 0.064 0.907 16.758 2.070 0.719 0.976 0.024 9.429 29 6
2004 0.362 0.190 0.810 0.539 12.648
0.638 0.439 0.561 7.725 30 6
2005 0.368 0.142 0.858 0.589 12.577 -0.002 0.632 0.412 0.588 7.060 30 6
2006 0.750 0.179 0.821 0.408 13.588 0.362 0.250 0.403 0.597 4.018 30 6
2007 0.292 0.157 0.843 0.650 13.577 0.265 0.708 0.472 0.528 7.062 30 6
2008 0.380 0.185 0.815 0.460 13.901 1.724 0.620 0.514 0.486 6.981 30 6
2009 0.292 0.157 0.843 0.650 13.577 -0.633 0.708 0.472 0.528 7.070 30 6
2010 0.386 0.298 0.702 0.598 13.790 0.232 0.614 0.456 0.544 6.047 30 6
2011 0.397 0.237 0.763 0.647 13.887 0.078 0.603 0.453 0.547 5.595 30 6
2012 0.429 0.619 0.381 0.629 14.440 0.161 0.571 0.551 0.449 6.267 30 6
2013 0.434 0.683 0.317 0.615 14.456 0.065 0.566 0.551 0.449 6.416 30 6
2004
31 6
2005
31 6
2006
31 6
2007
31 6
2008
31 6
2009 0.597 0.608 0.392 0.577 15.983
0.403 0.712 0.288 6.599 31 6
2010 0.529 0.567 0.433 0.636 16.235 0.255 0.471 0.721 0.279 6.356 31 6
2011 0.704 0.511 0.489 0.578 16.926 0.575 0.296 0.649 0.351 5.084 31 6
2012 0.657 0.593 0.407 0.656 16.900 0.260 0.343 0.636 0.364 5.367 31 6
2013 0.661 0.625 0.375 0.632 16.987 -0.125 0.339 0.626 0.374 5.463 31 6
2004 0.547 0.000 1.000 0.340 11.424
0.453 0.527 0.473 7.843 32 6
2005 0.453 0.003 0.997 0.364 11.753 0.287 0.547 0.718 0.282 9.217 32 6

163
2006 0.328 0.055 0.945 0.373 12.354 1.014 0.672 0.874 0.126 13.102 32 6
2007 0.124 0.080 0.920 0.281 12.829 -0.015 0.876 0.932 0.068 18.476 32 6
2008 0.115 0.063 0.937 0.317 12.736 0.132 0.885 0.926 0.074 19.423 32 6
2009 0.126 0.019 0.981 0.345 12.621 -0.438 0.874 0.916 0.084 15.954 32 6
2010 0.146 0.000 1.000 0.680 12.907 0.729 0.854 0.935 0.065 15.030 32 6
2011 0.096 0.000 1.000 0.724 13.072 0.062 0.904 0.948 0.052 18.609 32 6
2012 0.442 0.733 0.267 0.838 13.691 0.134 0.558 0.950 0.050 7.576 32 6
2013 0.364 0.326 0.674 0.752 13.955 0.620 0.636 0.966 0.034 9.552 32 6
2004 0.213 0.147 0.853 0.458 14.198
0.787 0.915 0.085 12.257 33 7
2005 0.215 0.166 0.834 0.462 14.294 0.188 0.785 0.923 0.077 12.454 33 7
2006 0.254 0.160 0.840 0.469 14.349 0.124 0.746 0.923 0.077 11.455 33 7
2007 0.247 0.136 0.864 0.448 14.436 0.356 0.753 0.933 0.067 12.126 33 7
2008 0.293 0.093 0.907 0.447 14.537 -0.147 0.707 0.933 0.067 10.337 33 7
2009 0.243 0.192 0.808 0.532 14.443 0.001 0.757 0.931 0.069 10.937 33 7
2010 0.262 0.193 0.807 0.546 14.460 -0.101 0.738 0.931 0.069 9.763 33 7
2011 0.269 0.060 0.940 0.510 14.413 0.043 0.731 0.927 0.073 10.140 33 7
2012 0.268 0.022 0.978 0.455 14.506 0.074 0.732 0.933 0.067 10.616 33 7
2013 0.212 0.023 0.977 0.540 14.784 -0.040 0.788 0.953 0.047 10.953 33 7
2004 0.386 0.257 0.743 0.575 15.627
0.614 0.734 0.266 8.572 34 7
2005 0.377 0.281 0.719 0.592 15.648 0.188 0.623 0.743 0.257 8.981 34 7
2006 0.461 0.212 0.788 0.541 15.867 0.203 0.539 0.762 0.238 7.389 34 7
2007 0.494 0.226 0.774 0.569 16.042 0.205 0.506 0.787 0.213 6.672 34 7
2008 0.525 0.187 0.813 0.551 16.148 0.092 0.475 0.796 0.204 6.472 34 7
2009 0.557 0.211 0.789 0.597 16.171 0.079 0.443 0.786 0.214 6.038 34 7
2010 0.540 0.316 0.684 0.568 16.224 0.220 0.460 0.804 0.196 6.788 34 7
2011 0.534 0.272 0.728 0.492 16.437 0.487 0.466 0.844 0.156 7.619 34 7
2012 0.532 0.251 0.749 0.530 16.535 -0.036 0.468 0.859 0.141 7.880 34 7
2013 0.554 0.280 0.720 0.499 16.648 0.011 0.446 0.868 0.132 8.024 34 7
2004 0.199 0.812 0.188 0.723 13.754
0.801 0.925 0.075 11.069 35 7

164
2005 0.181 0.791 0.209 0.617 13.811 0.275 0.819 0.931 0.069 12.903 35 7
2006 0.162 0.811 0.189 0.552 13.842 0.174 0.838 0.934 0.066 14.193 35 7
2007 0.154 0.762 0.238 0.526 13.904 0.159 0.846 0.939 0.061 14.994 35 7
2008 0.153 0.793 0.207 0.549 14.006 0.047 0.847 0.945 0.055 13.883 35 7
2009 0.152 0.681 0.319 0.486 14.135 0.428 0.848 0.951 0.049 15.990 35 7
2010 0.144 0.695 0.305 0.745 14.229 0.122 0.856 0.869 0.131 14.729 35 7
2011 0.157 0.832 0.168 0.768 14.369 -0.071 0.843 0.884 0.116 13.650 35 7
2012 0.179 0.583 0.417 0.682 14.515 0.600 0.821 0.897 0.103 13.469 35 7
2013 0.127 0.684 0.316 0.595 14.606 0.034 0.873 0.912 0.088 17.079 35 7
2004 0.265 0.291 0.709 0.471 16.849
0.735 0.816 0.184 11.629 36 7
2005 0.252 0.295 0.705 0.442 16.940 0.156 0.748 0.825 0.175 12.519 36 7
2006 0.250 0.308 0.692 0.440 17.026 0.090 0.750 0.838 0.162 12.452 36 7
2007 0.330 0.200 0.800 0.418 17.253 0.307 0.670 0.839 0.161 10.744 36 7
2008 0.335 0.204 0.796 0.473 17.320 0.189 0.665 0.832 0.168 10.564 36 7
2009 0.348 0.243 0.757 0.471 17.394 0.059 0.652 0.815 0.185 10.239 36 7
2010 0.377 0.192 0.808 0.548 17.464 0.124 0.623 0.803 0.197 9.102 36 7
2011 0.459 0.320 0.680 0.721 17.722 0.161 0.541 0.733 0.267 6.696 36 7
2012 0.840 0.510 0.490 0.669 17.815 0.237 0.160 0.564 0.436 6.545 36 7
2013 0.856 0.469 0.531 0.682 17.885 0.064 0.144 0.678 0.322 5.427 36 7
2004
37 7
2005 0.661 0.185 0.815 0.171 13.615
0.339 0.242 0.758 8.257 37 7
2006 0.518 0.174 0.826 0.191 13.731 -0.096 0.482 0.526 0.474 8.945 37 7
2007 0.627 0.136 0.864 0.155 13.989 0.100 0.373 0.526 0.474 7.306 37 7
2008 0.562 0.184 0.816 0.238 13.638 -0.205 0.438 0.427 0.573 7.268 37 7
2009 0.604 0.124 0.876 0.203 13.813 -0.073 0.396 0.468 0.532 6.757 37 7
2010 0.655 0.127 0.873 0.193 13.972 -0.006 0.345 0.479 0.521 6.299 37 7
2011 0.725 0.107 0.893 0.278 13.832 -0.159 0.275 0.248 0.752 4.067 37 7
2012 0.696 0.132 0.868 0.239 13.956 0.000 0.304 0.399 0.601 5.529 37 7
2013 0.580 0.187 0.813 0.274 13.756 0.039 0.420 0.470 0.530 7.050 37 7

165
2004 0.409 0.513 0.487 0.606 16.029
0.591 0.811 0.189 7.834 39 7
2005 0.360 0.529 0.471 0.616 16.067 0.029 0.640 0.832 0.168 9.126 39 7
2006 0.351 0.518 0.482 0.626 16.290 0.156 0.649 0.868 0.132 8.958 39 7
2007 0.300 0.549 0.451 0.689 16.293 -0.109 0.700 0.878 0.122 9.344 39 7
2008 0.361 0.335 0.665 0.676 16.465 0.153 0.639 0.662 0.338 7.414 39 7
2009 0.426 0.494 0.506 0.707 16.676 -0.015 0.574 0.695 0.305 6.694 39 7
2010 0.406 0.557 0.443 0.641 16.710 0.324 0.594 0.722 0.278 8.104 39 7
2011 0.379 0.660 0.340 0.716 16.948 0.011 0.621 0.789 0.211 7.993 39 7
2012 0.431 0.515 0.485 0.738 17.126 -0.016 0.569 0.804 0.196 6.547 39 7
2013 0.509 0.395 0.605 0.742 17.122 -0.231 0.491 0.771 0.229 4.419 39 7
2004 0.530 0.939 0.061 0.501 15.263
0.470 0.509 0.491 7.567 40 7
2005 0.451 0.947 0.053 0.503 15.169 0.199 0.549 0.514 0.486 8.413 40 7
2006 0.388 0.936 0.064 0.488 15.094 -0.033 0.612 0.516 0.484 9.014 40 7
2007 0.376 0.964 0.036 0.432 15.129 0.051 0.624 0.524 0.476 9.591 40 7
2008 0.378 0.856 0.144 0.383 15.376 0.231 0.622 0.584 0.416 10.222 40 7
2009 0.435 0.138 0.862 0.311 15.532 0.232 0.565 0.568 0.432 7.604 40 7
2010 0.336 0.209 0.791 0.325 15.438 -0.010 0.664 0.571 0.429 9.208 40 7
2011 0.344 0.176 0.824 0.284 15.558 0.147 0.656 0.575 0.425 9.636 40 7
2012 0.380 0.191 0.809 0.274 15.672 0.209 0.620 0.575 0.425 9.043 40 7
2013 0.471 0.170 0.830 0.280 15.908 -0.052 0.529 0.569 0.431 7.561 40 7
2004
41 3
2005
41 3
2006 0.459 0.458 0.542 0.829 17.598
0.541 1.000 0.000 7.188 41 3
2007 0.419 0.442 0.558 0.820 17.848 0.357 0.581 1.000 0.000 7.915 41 3
2008 0.427 0.204 0.796 0.827 18.125 0.293 0.573 0.953 0.047 7.040 41 3
2009 0.442 0.118 0.882 0.809 18.334 0.148 0.558 0.963 0.037 6.008 41 3
2010 0.402 0.191 0.809 0.783 18.461 0.191 0.598 0.972 0.028 7.203 41 3
2011 0.408 0.265 0.735 0.809 18.550 0.129 0.592 0.976 0.024 6.861 41 3
2012 0.409 0.245 0.755 0.826 18.619 0.128 0.591 0.979 0.021 6.599 41 3

166
2013 0.377 0.247 0.753 0.803 18.674 0.162 0.623 0.975 0.025 7.445 41 3
Firm code and sector denotes the identity of non-financial firm and sector of listing as specified in Appendix 1

167
Appendix IV: Altman’s Z-Score Model For The Emerging Markets
Where:
Z-Score = Financial distress index (emerging market score),
X1 = Net working capital/Total assets,
X2= Retained earnings/Total assets,
X3 = Earnings before Interest and Taxes/Total Assets,
X4= Book value of equity/Book value of total liabilities
Zones of discrimination: Z > 5.85: Safe zone, 4.15 <Z <5.85: Grey zone, Z <4.15:
Distress zone.
Source: Begley, J. and Ming, J. (2007)

168
Appendix V (A): Variables Data Plots By Firm
0.5
10
.51
0.5
10
.51
0.5
10
.51
2005 2010 2015 2005 2010 2015
2005 2010 2015 2005 2010 2015 2005 2010 2015 2005 2010 2015 2005 2010 2015
1 2 3 4 5 6 7
8 9 10 11 12 13 14
15 16 17 18 19 20 21
22 23 24 25 26 27 28
29 30 31 32 33 34 35
36 37 39 40 41
Graphs by FIRM CODE
Total Equity Plot
0.5
10
.51
0.5
10
.51
0.5
10
.51
2005 2010 2015 2005 2010 2015
2005 2010 2015 2005 2010 2015 2005 2010 2015 2005 2010 2015 2005 2010 2015
1 2 3 4 5 6 7
8 9 10 11 12 13 14
15 16 17 18 19 20 21
22 23 24 25 26 27 28
29 30 31 32 33 34 35
36 37 39 40 41
Graphs by Firm Code
Total Debt Plot

169
Appendix V (B): Variables Data Plots By Firm
0.5
10
.51
0.5
10
.51
0.5
10
.51
2005 2010 2015 2005 2010 2015
2005 2010 2015 2005 2010 2015 2005 2010 2015 2005 2010 2015 2005 2010 2015
1 2 3 4 5 6 7
8 9 10 11 12 13 14
15 16 17 18 19 20 21
22 23 24 25 26 27 28
29 30 31 32 33 34 35
36 37 39 40 41
Graphs by FIRM CODE
Long term debt Plots
0.5
10
.51
0.5
10
.51
0.5
10
.51
2005 2010 2015 2005 2010 2015
2005 2010 2015 2005 2010 2015 2005 2010 2015 2005 2010 2015 2005 2010 2015
1 2 3 4 5 6 7
8 9 10 11 12 13 14
15 16 17 18 19 20 21
22 23 24 25 26 27 28
29 30 31 32 33 34 35
36 37 39 40 41
Graphs by FIRM CODE
Short term debt Plots

170
Appendix V (C): Variables Data Plots By Firm
10
15
20
10
15
20
10
15
20
10
15
20
10
15
20
10
15
20
2005 2010 2015 2005 2010 2015
2005 2010 2015 2005 2010 2015 2005 2010 2015 2005 2010 2015 2005 2010 2015
1 2 3 4 5 6 7
8 9 10 11 12 13 14
15 16 17 18 19 20 21
22 23 24 25 26 27 28
29 30 31 32 33 34 35
36 37 39 40 41
Graphs by FIRM CODE
Firm Size Plots
0.5
10
.51
0.5
10
.51
0.5
10
.51
2005 2010 2015 2005 2010 2015
2005 2010 2015 2005 2010 2015 2005 2010 2015 2005 2010 2015 2005 2010 2015
1 2 3 4 5 6 7
8 9 10 11 12 13 14
15 16 17 18 19 20 21
22 23 24 25 26 27 28
29 30 31 32 33 34 35
36 37 39 40 41
Graphs by FIRM CODE
External Equity Plots

171
Appendix V (D): Variables Data Plots By Firm
0.5
10
.51
0.5
10
.51
0.5
10
.51
2005 2010 2015 2005 2010 2015
2005 2010 2015 2005 2010 2015 2005 2010 2015 2005 2010 2015 2005 2010 2015
1 2 3 4 5 6 7
8 9 10 11 12 13 14
15 16 17 18 19 20 21
22 23 24 25 26 27 28
29 30 31 32 33 34 35
36 37 39 40 41
Graphs by FIRM CODE
Tangibility Plots

172
-.5
0.5
1-.
50
.51
-.5
0.5
1-.
50
.51
-.5
0.5
1-.
50
.51
2005 2010 2015 2005 2010 2015
2005 2010 2015 2005 2010 2015 2005 2010 2015 2005 2010 2015 2005 2010 2015
1 2 3 4 5 6 7
8 9 10 11 12 13 14
15 16 17 18 19 20 21
22 23 24 25 26 27 28
29 30 31 32 33 34 35
36 37 39 40 41
Graphs by FIRM CODE
Sales Growth Plots