Embed Size (px)
Citation preview
1 | P a g e International Journal of Management Sciences and Business Research, 2012, Vol. 1, No.4
(ISSN: 2226-8235)
Taxation and capital structure choice: Survey evidence
Hedia TERAOUI
High School of Business – University of Manouba. Tunisia.
(Corresponding author)1
Jameleddine CHICHTI
High School of Business – University of Manouba. Tunisia.
ECOFIGES ECSTRA
Abstract
The purpose of this paper is to examine the behavior of practitioners about the corporate investment and financing choices by treating empirically several issues that revolve around a central axis: the study of the impact of taxation on the financial structure through a qualitative analysis by questionnaire sent to Tunisian managers. The choice of this method of analysis is justified by the importance of investigation on the positioning of taxation as a tool of government policy in the choice of financing strategies. This investigation is in line with a range of American researches (Norton (1991) and Graham and Harvey (2003)). The trade-off theory is confirmed by the importance of a target debt ratio in general but also specifically by the tax effects and bankruptcy costs. The results reflect the importance of interest deductibility in which is an important advantage that encourages leaders to use debt as a major source of financing. This study has also shown the importance of the non-debt tax shields on the capital structure choice. The majority of respondents state that these tax-advantages are complementary.
Keywords: Taxation, capital structure, tax- advantages of debt, non-debt tax shields
Introduction
The study of capital structure has been the focus of the finance company. It is based on a body of opinion which developed with Modigliani and Miller 1958, of which they arose two theories diametrically opposed that have attempted to explain the determinants of capital structure. The Static Trade off theory (STT), in its first version, advocates the existence of an optimal debt ratio that results from a compromise between the tax benefits from debt and bankruptcy costs Croquet and al. (2009). While, in its second version, we are witnessing the emergence of agency theory following the work of Jensen and Meckling (1976). The debt becomes a means to ensure the reduction of risk of potentially deviant behaviors of managers by forcing them to act in the interests of shareholders. Nevertheless, the Pecking order theory challenges the existence of such a ratio and promotes the existence of a pecking order in financing preferences focusing on self-financing and debt financing and ultimately the issue shares. In this context of asymmetric information, Myers and Majluf (1984) shows that the determination of the debt ratio should take into account other factors such as the problems of asset
Taxation and capital structure choice: Survey evidence

2 | P a g e International Journal of Management Sciences and Business Research, 2012, Vol. 1, No.4
(ISSN: 2226-8235)
substitution and underinvestment. Some work has pitted the two theoretical frameworks (Frank and Goyal (2002)). Nevertheless, other searches have shown that, in order to properly explain the financial behavior of firms, we must integrate the predictions of both theories (Byoun and Rhim (2003)
Taxation and capital structure choice: Survey evidence
3 | P a g e International Journal of Management Sciences and Business Research, 2012, Vol. 1, No.4
(ISSN: 2226-8235)
Our purpose is to analyze the perceptions of managers about the effects of taxes on capital structure choice. This paper is organized as follows: the first section will include a review of the literature. In the second, we present the methodology adopted and the description of our sample. The third section focuses on results and their interpretation. The fourth section is devoted to the discussion and conclusion.
Section 1: Theoretical background
The relationship between taxation and capital structure has been the subject of several contributions in the history of finance from the canonical model of Modigliani Miller MM (1958) which showed that the choice of capital structure has no interest because it is neutral on the value of the firm. Following a challenge to their original model of 1958, Modigliani and Miller (1963) have considered the impact of the deductibility of interest charges on taxable income. They argue that firm value is proportional to its level of debt and the value of a leveraged firm is always higher than that of a non-firm debt. The trade-off theory, by relaxing the assumptions of MM (1958), it introduced market imperfections such as bankruptcy costs, agency costs but also the tax burden on the firm due to its importance on its results and value. The trade-off theory claims the existence of an optimal level of debt that results from a compromise between the benefits of debt (tax benefits and incentives) and its disadvantages (costs of bankruptcy and conflicts between shareholders and creditors). In order to treat burden of taxation in the choice of corporate finance, we must first distinguish between the tax benefits related to debt and the Non-debt Tax Shield. The debt tax benefit which consists in the savings resulting from deductibility of interest is a major criterion that favors debt as the best source of finance reports by other sources (Gropp (2002). Several studies have attempted to clarify the link between tax rates and leverage. Indeed, Gordon and Lee (1999) argue that there is a significant effect of the tax debt levels for small businesses. This positive relationship has been empirically validated by the work of Huang (2001) who found similar results. The Trade off theory states that the increase in tax rates has a positive impact on debt levels. This is due to the tax deductibility of financial costs attached to this additional debt. Graham and Tucker (2006) affirm that tax-exempt firms use less debt than those who do not enjoy the tax exemption. According to Graham and Harvey (2001), it appears that multinationals consider the tax advantages in the host countries are an important element in the decision of issue of debt by subsidiaries. However, others found a negative correlation between taxation and debt levels (Gill and Mathur (2011)). Other researches show that the level of debt increases with the non-tax debt shields (Michaelas and al. (1999) and Huang and Song (2006)). However, Sayılgan et al. (2006) found that the level of debt is negatively correlated with non-tax debt. These tax benefits represent a deductible expense of the tax base. This could discourage firms to use debt as they can be substitutes for the tax benefits associated with debt (De Angelo et Masulis (1980)).
Section 2: Methodology and Sampling Frame
The collection of information for this analysis was conducted through a questionnaire with 48 questions divided into two major parts. The questions were inspired by literature, both theoretical and empirical researches, essentially those of Simmons (2003), Graham and Harvey (2003) and Norton (1991). The first part can give a clear and brief appreciation of the impact of the tax on the investment choices. The second part identifies the impact of the tax on the capital structure of the firm. Referring to the work of Nunnally (1978), we tested the reliability of measurement scales through Cronbach's alpha parameter (equal to
Taxation and capital structure choice: Survey evidence

4 | P a g e International Journal of Management Sciences and Business Research, 2012, Vol. 1, No.4
(ISSN: 2226-8235)
0.73 in our case). Exceeding the threshold found by the author (70%), this test confirmed the internal consistency of questionnaire.
2.1- Assumptions
H1: Taxation has a strong effect on investment decisions of the companyH1: The choice of corporate financing is mainly guided by tax considerations.H2: The unrecognized tax benefits related to debt promote the use of debt
2.2-Description of the sample
The sample size is equal to 50 firms belonging to the industrial, technology and service sectors. Note that the survey was conducted among 50 firms belonging to three different sectors as follows: More than half the firms belong to the industrial sector. 42% of companies are service firms. The rest of
Taxation and capital structure choice: Survey evidence
5 | P a g e International Journal of Management Sciences and Business Research, 2012, Vol. 1, No.4
(ISSN: 2226-8235)
companies (6%) are part of the trade sector. The majority of companies interviewed are Limited Liability Companies (LLC) with 36 companies. The rest are either joint stock companies in number of 11, either are Limited Partnerships companies (03 companies). Moreover, the distribution of firms by capital shows that more than 60% of firms are domestic capital firms while 24% have a mixed capital companies and the remaining (10%) has a 100% capital abroad. This investigation revealed that all of Tunisian companies are in debt; they make more use of debt as other financing sources such as self- financing and the issue of shares. Indeed, the distribution of firms interviewed according to the debt ratio shows that the majority of companies have debt ratios above 30%. This debt varies from one company to another not only according to the legal form but also according to company size. This can be explained by the fact that the majority of Tunisian companies are family companies (LLCs) who prefer to use debt rather than issuing shares. To note that about 60% of firms are not publicly traded. Based on the criterion of number of employees, more than 60% of firms are large companies with more than 250 employees. The rest are smaller companies. These companies are divided according to the nature of the activity to companies belonging to the Ordinary Law (32 companies), totally exporting companies (soit13entreprises) and partially exporting companies (05entreprises).
Section 3-Results and analysis
3.1- Analysis of the effect of taxation on the investment decision and corporate performance
The analysis of the review of the literature both theoretical and empirical reveals the major importance of the theme of the impact of taxation on the investment decision. Thus the objective of the first section of the questionnaire is to test the perception of managers about the impact of taxation on investment behavior. 14% of respondents find that this is not a determining factor in their investment strategy. Taxation has no place in their decisions or in the management of the company, 16% of the population surveyed say that their use of tax consulting is low. Furthermore, regarding the level of understanding of the Tunisian tax system, respondents are divided between 30% who say that it is difficult to deal with non-professionals and 70% who stipulate that the Tunisian tax system is not even comprehensible to professionals. This result showing the irrelevance of tax on the investment decision, confirms the findings of Penning (2000), Panteghini (2005), Sarkar and Goukasian (2006) and Agliardi and Agliardi (2009) who have shown the neutrality of tax on the investment decision.
Nevertheless, 86% of respondents who have high frequencies for the use tax consulting (58%) stipulate that the tax is a crucial factor in the choice of countries invetissement. The incidence of the tax variable on the corporate performance was also evidenced in the responses of managers. Indeed, 70% stipulate that taxation influences greatly the performance of companies. Only 38% said they have taken into consideration tax incentives at the launch of their activities in order to improve their financial performance. This result confirms the results found by Teraoui and al. (2011) and Teraoui and Kaddour (2012) who argue that taxation affects respectively the financial corporate performance and the corporate profitability of the firms belonging to the Electrical and Mechanical Industries sector.
3.2-Analysis of the effect of the taxation on the corporate financing choice
Taxation and capital structure choice: Survey evidence
6 | P a g e International Journal of Management Sciences and Business Research, 2012, Vol. 1, No.4
(ISSN: 2226-8235)
The second section of the questionnaire was devoted to the impact of taxation on corporate financing choices. The empirical investigation shows that almost all Tunisian companies surveyed are using debt as a major source of financing. They have leverage ratios (total debt / total assets) that vary in the range [25% -75%]. The use of leverage differs according to legal form and is mainly observed in LLCs (60%) more than the remaining firms.
a-The impact of tax benefits of debt on the debt financing choice
Interests resulting from debt are deductible from the taxable income. The tax benefit related to debt can guide the financing choice of the firm. In this context, the empirical investigation conducted in this survey shows that the tax is perfectly considered in the corporate financing choice (54%). 60% of people say that the increase in tax rates certainly highlights the use of debt by the increase financial charges deductible from the taxable income. These results are in line with the work of Mackie-Mason
Taxation and capital structure choice: Survey evidence
7 | P a g e International Journal of Management Sciences and Business Research, 2012, Vol. 1, No.4
(ISSN: 2226-8235)
(1990a) and Graham (1996a) which focused on the importance of corporate taxation in the financial decisions, by focusing on the preference for debt compared to other sources of financing because of the tax advantage that it provides. Thus, drawing on the questionnaire survey conducted by Norton (1991), the answers to the question of testing the factors affecting the choice of corporate financing on a scale of measurement with three rankings, were diverse. Indeed, tax considerations occupy the first rank for54%, the second ranking for 24% and the third ranking for 22% of respondents.
Nevertheless, 68% of respondents indicate that the choice of financing is guided by market conditions thus occupying the third place. Finally, the willingness of leaders to maintain financial flexibility is a factor that also influences the choice of funding and that occupies, according to 52% of managers interviewed, the second ranking. These results are also verified in recent work. Indeed, Buettner et al. (2009), with a study on a sample of German multinational companies, have shown that taxation exerts a crucial effect on the choice of debt financing. They also found that higher tax rates stimulate the debt of the company in order to enjoy tax benefits resulting from debt. For 28% of respondents, taxation is not considered in the strategy of the financing choices. 32% affirm that for them the increase in the tax rate never favors the use of debt.
b-The incidence of non-debt tax shields on the choice of debt financing
We assumed when we began our analysis, that the depreciation and amortization are important factors that motivate managers to increase their leverage. Nevertheless, the results of our investigation have denied this hypothesis but partially when they found that 26% of respondents who claim that these benefits are not related to the debt can not be stimuli for debt. This result corroborates that found by DeAngelo and Masulis (1980) who found a negative relationship between the unrecognized tax benefits related to the debt you debt levels. While the majority of respondents (72%) say that these non-debt tax benefits may be important determinants that encourage companies to use the debt. A critical relationship can be developped between the tax benefits of debt and non-debt tax shields. Thus, 80% of managers state that these benefits are complementary in that their association may be a strong incentive to debt. This result confirms the results found by Hite (1977). Nevertheless, 16% of the surveyed population argues that the sources of tax savings are substitutable. This result is in line with the work of DeAngelo and Masulis (1980).
3.3-The burden of taxation in the vector of determinants of the capital structure
The choice of capital structure is one of crucial challenges that may confront a company since that the financing choice impacts its financial performance. The purpose of this section is to analyze the determinants of capital structure of the sample investigated on the basis of various financial theories. The identification of answers proves that the predictions of the Pecking order and the trade-off theory are empirically present.
Another finding of the results leads us to insist on the question of the adjustment towards target debt ratios. Overall, the results show that there is an adjustment process towards target debt ratios, in fact,32% of companies claim that they have a debt target ratio. This result shows that the percentage of
Taxation and capital structure choice: Survey evidence
8 | P a g e International Journal of Management Sciences and Business Research, 2012, Vol. 1, No.4
(ISSN: 2226-8235)
responses confirms the predictions of the trade off theory which presupposes the existence of an optimal debt level. Several authors corroborate to the existence of this ratio, such as Bradley et.al (1984), Fama and French (2002). These authors show that the optimal level of capital structure is simply a target ratio that orientates the financing choices of the firm. The results show that large firms are more likely to have target debt ratios. Thus, on 27 companies that have a target debt ratio, 74% are large and confirm the predictions of the trade off theory in the light of the results found by Graham and Harvey (2001) through their questionnaire survey.
Nevertheless, the majority of respondents (i.e. 54%) has no debt ratio target (77% are small firms) but which seeks to maintain debt ratio target (78%). In the presence of substitute’s debt (amortization, depreciation, investment tax credit ...), the company will have the option to increase or reduce its value by altering its debt level such that it approaches the industry average (DeAngelo and Masulis (1980)). Thus, even for companies with a debt ratio target, variability debt ratio is highly possible. It can generate high transaction costs thus constituting an important reason that led the company to restore its capital structure if it detects a deviation in the debt ratio target that may exceed the limits of high and low debt ((Fisher Henkel and Zechner (1989)). Several factors may influence the way that managers choose the appropriate amount of debt. The investigation revealed that the main factors are: the costs of bankruptcy (88%) followed by the tax benefit resulting from the deductibility of interest
Taxation and capital structure choice: Survey evidence

9 | P a g e International Journal of Management Sciences and Business Research, 2012, Vol. 1, No.4
(ISSN: 2226-8235)
(72%), then transaction costs and expenses of debt issues (70%). However, less low frequencies were attributed to other responses (earnings volatility (i.e. 28 %) and financial flexibility (14%)) thus showing their low level of importance in determining the amount of debt. The results clearly show that taxes, bankruptcy costs and agency costs that can be classified into one category depending on the degree of importance, are for managers interviewed crucial determinants of the Tunisian firms' financial structure. Nevertheless, Tunisian firms belonging to the sample of our study do not give much importance to the personal tax implications (60%). The operational risk and tangibility of assets are classified in the second category. Then, the size of the firm may be a determinant of capital structure but with small explanatory capacity. Thus, more than 60% of managers believe that the larger firms must resort to more debt. This result corroborates the work of Stoss and Kremp (2001) by the fact that access to equity markets is more costly for small firms versus large. These costs arise from the phenomenon of asymmetry of information; these costs are higher for small firms more than large which encourages the financing strategy oriented primarily toward debt. While only one third of the respondents state that the company size is not strongly correlated with the choice of debt financing to the extent that even small businesses can also resort to debt. Finally, we find that market conditions are classified according to the majority of respondents mainly in seventh place at a rate of 74%. Leaders, through the maintenance of financial structure, are to meet several critical objectives: they seek primarily to keep a better financial flexibility (92%), ensuring their long-term survival (88%), maintaining a predictable source of background (60%) and keeping debt ratios similar to those of the sector (54%). Managers of companies, at a rate of 72% state that they make their decisions based on a hierarchical order. They are financed by cash flow at 10% in the first rank followed by debt financing, occupying 74% of respondents who spend more time in managing the debt at a rate of 54% and in managing relationships with shareholders at a rate of 58% in the first classification and relationships with banks (50%) occupying the third ranking. The third source of financing for these companies is to use the issue of shares for only 4% of respondents and thus occupying the third source of financing at a rate of 74%. This is actually a confirmation of the predictions of the pecking order theory that has contributed to explain the behavior of financial firms based on a hierarchical financing. In this Pecking Order Model, initiated by Myers and Majluf (1984) and enriched by other contributions such as those of Bayless and Chaplinsky (1996), a financial descends from internal funds, to debt, to external equity descends from internal funds, to debt, to external equity.
However, it should be noted that this classification follows a financial reasoning which is based on the phenomenon of asymmetric information. Indeed, through this survey, more than 60% of respondents claim that they confront the problems of asymmetric information. They specify at a rate of 6% that firms which are vulnerable to the asymmetric information must necessarily resort to debt. Managers stipulate that they use the debt as a signal to the market. Thus, this use of debt is confirmed by the high frequency of responses that suggest that the notion of the signal very important in the decision process (48%) and 24% for those who see that this notion is just important. However, only 22% see that this concept has no role in the process of managerial decisions while 6% of executives say it has a role but it is unimportant. Our study led to important conclusions that enhance the debt as a real financing source that motivates managers to satisfy the interests of shareholders. Conflicts can arise between shareholders and creditors to the extent that managers sometimes choose very risky projects that generate the wealth transfer from creditors to shareholders. In this context, interviewed managers argue that they confront in their business conflicts mainly due to the enormous contradiction between management and ownership (86%), the problems of under-investment (46%) and problems of assessment of risk for 58% of respondents. Similarly
Taxation and capital structure choice: Survey evidence
10 | P a g e International Journal of Management Sciences and Business Research, 2012, Vol. 1, No.4
(ISSN: 2226-8235)
companies are facing other types of problems such as problems of effort that consists in the dissatisfaction of shareholders concerning the efforts made by managers who adopt an opportunistic attitude which is always contradicting with the interests of shareholders. The managers are looking to monopolize the biggest share of funds invested by shareholders. The opinion as to the existence of these stress problems, are mixed: is ((72% yes) (28%: no)). Furthermore, it suggests the existence of a problem of the time horizon for 32% of respondents while 68% of respondents disprove the existence of this problem which essentially lies in the divergence of the time axes in the company to the extent that managers have short horizon obligations. While shareholders are looking to update the value of future income streams, making their horizons long. It should be emphasized that these horizon differences can be removed by adopting a policy that encourages the practice of granting a percentage of profits to the managers similarly to what is made in the USA (Dechow and Sloan (1991))). The problem of risk aversion occupies an important place in the Tunisian surveyed firms (74% yes and only 26%: no). This is explained by the difference between degrees of risk taking among shareholders, who are lovers of risk (due to portfolio diversification) and risk-averse managers (who do not agree to undertake risky projects not to lose their jobs and benefits). These results are in line with the work of Jensen and Meckling (1976). These
Taxation and capital structure choice: Survey evidence
11 | P a g e International Journal of Management Sciences and Business Research, 2012, Vol. 1, No.4
(ISSN: 2226-8235)
conflicts are the cause of the birth of agency costs within the company. The majority of managers (90%) say that it takes into account in their choice of financing, the agency costs and signals. The increase in these costs can be based on the opinion of 84% of managers a crucial cause to use debt in order to reduce agency costs. Given its role in conflict resolution for 78% of respondents, the debt may be so, in this regard, an effective way, according to 74% of responses collected in order to compel the managers to not enjoy the excess of liquidity. Although, the debt may be a solution to resolve conflicts between managers and shareholders, it helps to create problems and conflicts between shareholders and creditors. Agency costs supported by creditors generate increased a premium required to remuneration the debt. This causes an increase in the cost of debt compared to other financing sources. To resolve these conflicts between shareholders and creditors, 54% of respondents intend to establish restrictive clauses; this result is consistent with the work of Smith and Warner (1979) who propose to establish restrictions in the contract of debt that set constraints necessary to not franking policy of investment, of production, of debt and of dividend. Thus, 48% say that it should establish oversight mechanisms such as mechanisms of governance and internal audit facilitating to the principal to control the behavior of the agent. Nevertheless, 56% favor the short-term debt to the extent short period of indebtedness is a form of political braking and to facilitate to shareholders at any time to ensure control and monitoring of money loaned (Myers (1977)).
3.4-Multivariate Analysis of profiles of Surveyed Firms
Our aim is to test the impact of taxation on the capital structure of firms. We use certain methods of analysis that respond to our purpose and that best fit the type of data collected.
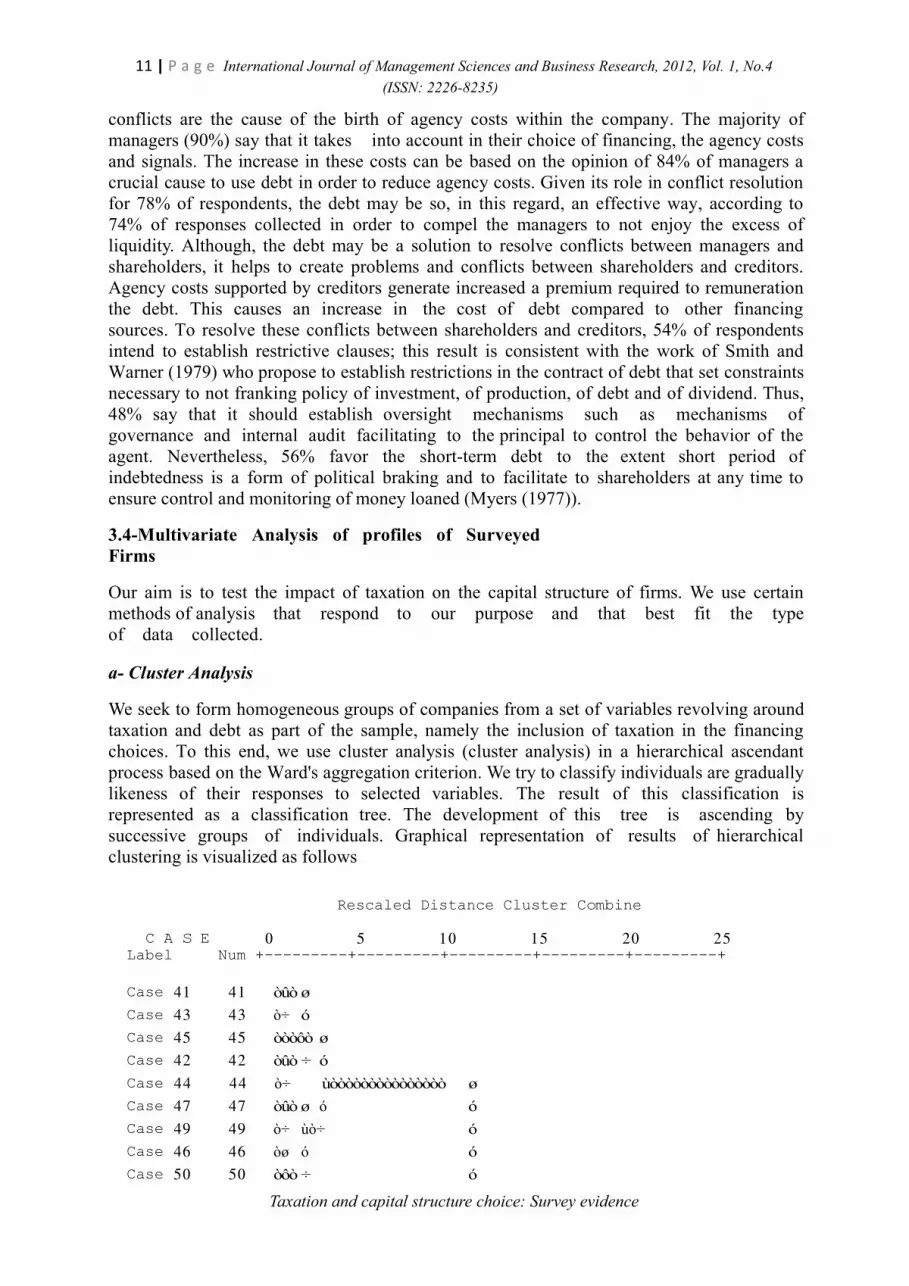
a- Cluster Analysis
We seek to form homogeneous groups of companies from a set of variables revolving around taxation and debt as part of the sample, namely the inclusion of taxation in the financing choices. To this end, we use cluster analysis (cluster analysis) in a hierarchical ascendant process based on the Ward's aggregation criterion. We try to classify individuals are gradually likeness of their responses to selected variables. The result of this classification is represented as a classification tree. The development of this tree is ascending by successive groups of individuals. Graphical representation of results of hierarchical clustering is visualized as follows
Rescaled Distance Cluster Combine
C A S E 0 5 10 15 20 25Label Num +---------+---------+---------+---------+---------+
Case 41 41 òûò ø
Case 43 43 ò÷ ó
Case 45 45 òòòôò ø
Case 42 42 òûò ÷ ó
Case 44 44 ò÷ ùòòòòòòòòòòòòòòò ø
Case 47 47 òûò ø ó ó
Case 49 49 ò÷ ùò÷ ó
Case 46 46 òø ó ó
Case 50 50 òôò ÷ ó
Taxation and capital structure choice: Survey evidence

12 | P a g e International Journal of Management Sciences and Business Research, 2012, Vol. 1, No.4
(ISSN: 2226-8235)
Case 48 48 ò÷ ó
Case 17 17 òòòòòûò ø ó
Case 19 19 òòòòò ÷ ùòòòòò ø ùòòòòòòòòòòòòòòòòòòòòòòòòòòò ø Case 18 18 òòòûòòò ú ó ó ó Case 29 29 òòò ÷ ó ó ó ó Case 25 25 òûòòò ø ó ó ó ó ò÷ ùò÷ ó ó
óòòòûò ÷ ó ó ó
Taxation and capital structure choice: Survey evidence
Case2727Case1414

13 | P a g e International Journal of Management Sciences and Business Research, 2012, Vol. 1, No.4
(ISSN: 2226-8235)
Case
Case
28
9
28
9
òòò ÷
òòòûò ø
ó ó
ùòòòòòòò ÷
ó
ó
Case 26 26 òòò ÷ ùòø ó ó
Case 13 13 òòòòò ÷ ùòø ó ó
Case
Case
16
35
16
35
òòòòòòò ÷ ó
òø ó
ó
ó
ó
ó
Case 39 39 òôò ø ó ó ó
Case 38 38 ò÷ ùòø ó ó óòòò ÷ ó ùòòò ÷ ó
òûò ø ùòòò ú ó Case 7 7 ò÷ ó ó ó ó Case 1 1 òûò ú ó ó ó Case 3 3 ò÷ ùò÷ ó ó Case 2 2 òòò ú ó ó Case 6 6 òòò ÷ ó ó Case 11 11 òûò ø ó ó Case 12 12 ò÷ ùòòò ø ó ó Case 23 23 òûò ÷ ó ó ó Case 33 33 ò÷ ùò÷ ó Case 24 24 òòò ø ó ó Case 36 36 òòòôòòò ÷ ó Case 32 32 òòò ÷ ó Case 8 8 òòò ø ó Case 30 30 òòòôòòò ø ó Case 37 37 òòò ÷ ùòòò ø ó
Case 4 4 òòòòòòò ÷ ó ó
Case
Case
15
34
15
34
òòò ø ùòòòòòòòòòòòòòòòòòòòòòòòòòòòòòòòòòòòòò ÷
òòòôò ø ó
Case 31 31 òòò ÷ ùòòò ø ó
Case
Case
20
10
20
10
òòòòò ÷ ùò÷
òòòòò ø ó
Case
Case
22
40
22
40
òòòòòôòòò ÷
òòòòò ÷
We note that this is between the last and penultimate node that the increase in the index level is the strongest. By making a cut between two nodes, we define a partition into two classes. To have a valid classification, we made a cut of the hierarchical tree at a level providing the lowest loss of inter-class inertia and corresponding to a limited number of homogeneous groups. We obtain the following two classes:Group 1 (No. of individuals assigned to this class): 41-44-45-42-44-47-49-46-50-48-17-19-18-29-25-27-14-28-9-26-13-16-35-39-38-21-5-7-1-3-2-6-11-12-23-33-24-36-32-8-30-37Group 2: 4-15-34-31-20-10-22-40
Taxation and capital structure choice: Survey evidence
Case2121Case55

14 | P a g e International Journal of Management Sciences and Business Research, 2012, Vol. 1, No.4
(ISSN: 2226-8235)
b- The ANOVA
Analysis of means of the variables for each group showed differences between the two classes of individuals. When the mean of a variable is high relative to the total average this means that the variable group is different and contributes to the explanation of his behavior. To validate these differences it is necessary to conduct the validation of their significance. The existence of significant differences between means of groups indicates that the variance is small in groups. The F statistic represents the ratio between the total of the medium squares inter and intra classes, it tests the significance of the difference between the averages and overall averages, each significant difference
0.05 is associated with a high value of F.
We proceeded by the test of significance of the difference between the two groups identified. First, the Levene statistic with two degrees of freedom proves the significance of test homogeneity of variances of the threshold, thus rejecting the null hypothesis of equal variances. Then we check if there are many differences between the two groups using an indicator which is the average. Indeed, the equality of means test allows us to detect the variables that differentiate the two groups of individuals. The total variance is now decomposed into variance inter and intra groups, according to the law ofFisher. These differences are significant at a level of 0.05
Variables differentiating the identified groups
Variable Fi s h e r Sig n i f ic a ti o n Have you thought about tax incentives at the launch of your activity? 4,308 ,019
The effect of taxation on the performance of Tunisian firms is very high. 3,520 ,038
The Tunisian tax system is understandable by non-professional 3,119 ,053
The choice of corporate financing are essentially guided by taxconsiderations
8,713 ,001
The choice of corporate financing are primarily guided by marketconditions
5,163 ,009
The increase of taxation favors the use of debt 5,824 ,006
The tax benefit related to the debt depends on the tax rate 4,634 ,015
The tax advantage of debt guides the decision of the use of debt 14,477 ,000
Costs of bankruptcy guides the financing decision of the company 6,483 ,003
Taxation is a determinant of optimal capital structure 9,029 ,000
The objective of the managers when they fix the capital structure is tomaintain financial independence
7,775 ,001
Managers of companies are spending more time in the debt management 5,923 ,005
Managers of companies are spending more time in managing therelationship with bankers
7,031 ,002
Managers of companies are spending more time in managing therelationship with shareholders
3,079 ,055
Taxation and capital structure choice: Survey evidence

15 | P a g e International Journal of Management Sciences and Business Research, 2012, Vol. 1, No.4
(ISSN: 2226-8235)
Managers of companies are spending more time in the capital managementThe most profitable firms are less debt
4,992 ,011
The most profitable firms are less indebted 5,836 ,005
Taxation and capital structure choice: Survey evidence
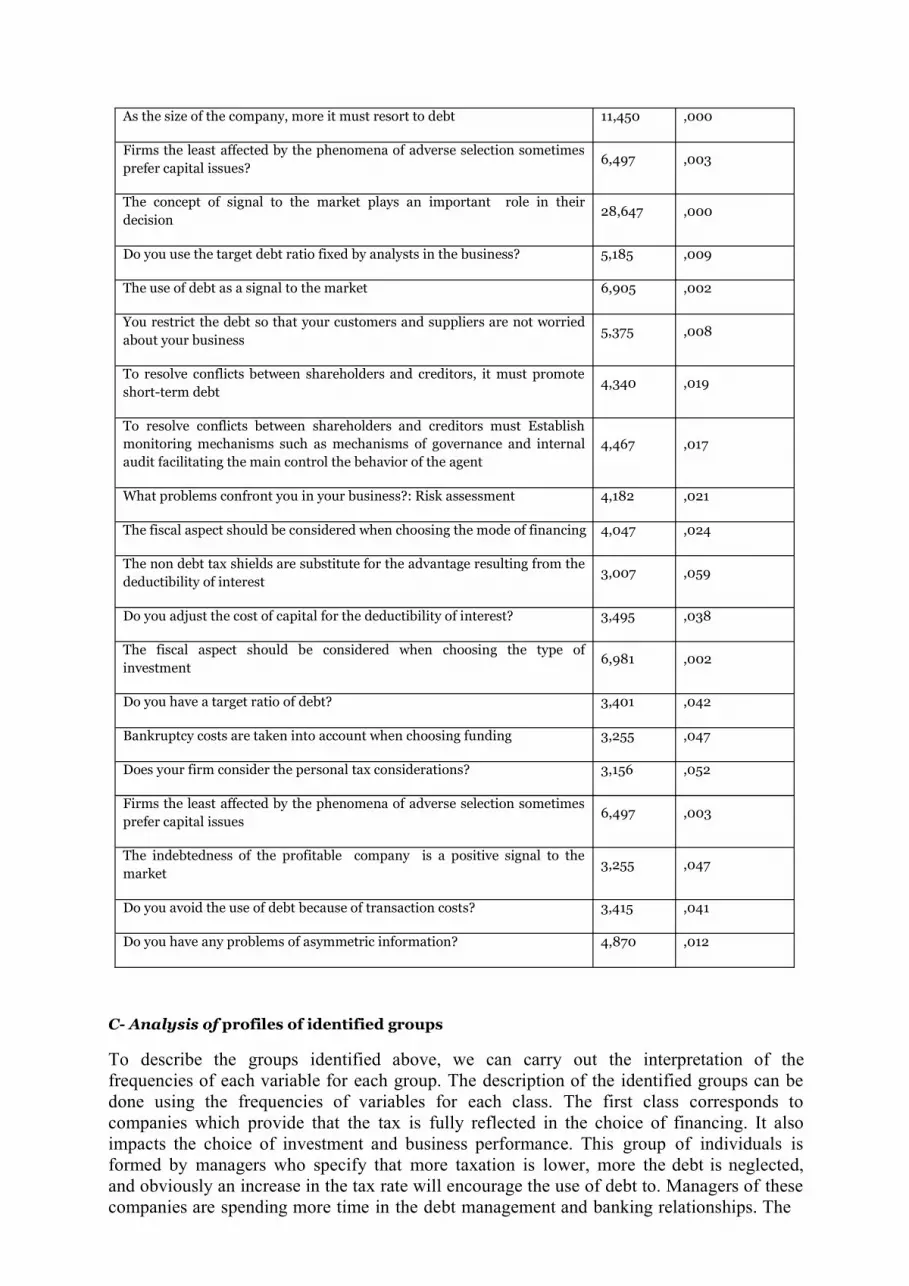
As the size of the company, more it must resort to debt 11,450 ,000
Firms the least affected by the phenomena of adverse selection sometimesprefer capital issues?
6,497 ,003
The concept of signal to the market plays an important role in theirdecision
28,647 ,000
Do you use the target debt ratio fixed by analysts in the business? 5,185 ,009
The use of debt as a signal to the market 6,905 ,002
You restrict the debt so that your customers and suppliers are not worriedabout your business
5,375 ,008
To resolve conflicts between shareholders and creditors, it must promoteshort-term debt
4,340 ,019
To resolve conflicts between shareholders and creditors must Establishmonitoring mechanisms such as mechanisms of governance and internal audit facilitating the main control the behavior of the agent
4,467 ,017
What problems confront you in your business?: Risk assessment 4,182 ,021
The fiscal aspect should be considered when choosing the mode of financing 4,047 ,024
The non debt tax shields are substitute for the advantage resulting from thedeductibility of interest
3,007 ,059
Do you adjust the cost of capital for the deductibility of interest? 3,495 ,038
The fiscal aspect should be considered when choosing the type ofinvestment
6,981 ,002
Do you have a target ratio of debt? 3,401 ,042
Bankruptcy costs are taken into account when choosing funding 3,255 ,047
Does your firm consider the personal tax considerations? 3,156 ,052
Firms the least affected by the phenomena of adverse selection sometimesprefer capital issues
6,497 ,003
The indebtedness of the profitable company is a positive signal to themarket
3,255 ,047
Do you avoid the use of debt because of transaction costs? 3,415 ,041
Do you have any problems of asymmetric information? 4,870 ,012
C- Analysis of profiles of identified groups
To describe the groups identified above, we can carry out the interpretation of the frequencies of each variable for each group. The description of the identified groups can be done using the frequencies of variables for each class. The first class corresponds to companies which provide that the tax is fully reflected in the choice of financing. It also impacts the choice of investment and business performance. This group of individuals is formed by managers who specify that more taxation is lower, more the debt is neglected, and obviously an increase in the tax rate will encourage the use of debt to. Managers of these companies are spending more time in the debt management and banking relationships. The

debt can be an important solution for them to resolve the agency conflicts that exist in the firm. To resolve conflicts between shareholders and creditors, it must either support the short-term debt or establish monitoring mechanisms such as governance and internal audit facilitating the main control of the behavior of the agent.
These companies have, in their majority, problems of asymmetric information; they prefer to issue debt as a signal to the market. The opinions of this group, about the importance of taxation on the financial structure of Tunisian companies, denote the crucial importance of this variable in the vector of the determinants of capital structure. Not only the interest deductibility from the tax base is an important advantage that stimulates managers to resort to the debt as a primary source of funding but also the non-debt tax shields that can play the same role, thus forming two complementary sources. Firms have target debt ratios, they incur debt to a point where the tax benefits counterbalance the potential costs of bankruptcy;
these costs are fully taken into account when choosing financing.
While the second class says that taxation is moderately included in the determination of financial structure. They specify that the tax element does not occupy an important place in their investment choices because they have not even taken into consideration tax incentives at the launch of their activities. They judge the Tax Tunisian system as complex even for professionals. Similarly, the financing choice is not led by tax considerations but by market considerations. For Interviewed of this group, the increase of taxation does not encourage the use of debt and the tax benefit does not guide the financing strategy. In addition, individuals in this group stipulated that they avoid the use of debt because of transaction costs of debt. Their main objective is to maintain some financial independence.
d- Discriminant analysis
The objective of the discriminant analysis is to determine the most discriminating variables with respect to specific classes. She is also interested to determine the membership of an individual to a group based on its characteristics. The explanation of the affiliation, for the previously identified group, is made using a set of explanatory variables inherent to the tax variable, and the appreciation of this variable by the managers of the companies surveyed. The purpose of this analysis is to determine the most discriminant variables of two classes, already defined by the cluster analysis. Our goal is to get the best discrimination possible with the minimum of variables, possibly for reasons of performance, robustness and reliability of results. Discriminant analysis involves four steps:
S tep 1 : Ch ecki ng th e exis te nc e o f di ff erenc es bet ween su bg rou ps
Statistic of Wilks' lambda can be a criterion for inclusion or elimination of explanatory variables. The higher the value of L, the greater is the variation between groups ( Appendix 1). Examination of the significance of the Wilks statistic confirms that these are the variables mentioned above, which are the most discriminating. Similarly, by observing the average score for each group, the opposite sign and the scale indicate that the two groups are well differentiated.
Functions of the centroid of groups
The tax advantage of debt is taken into account in the choice of financing Fonction
-Perfectly
-Moderately
-2,331
4,495
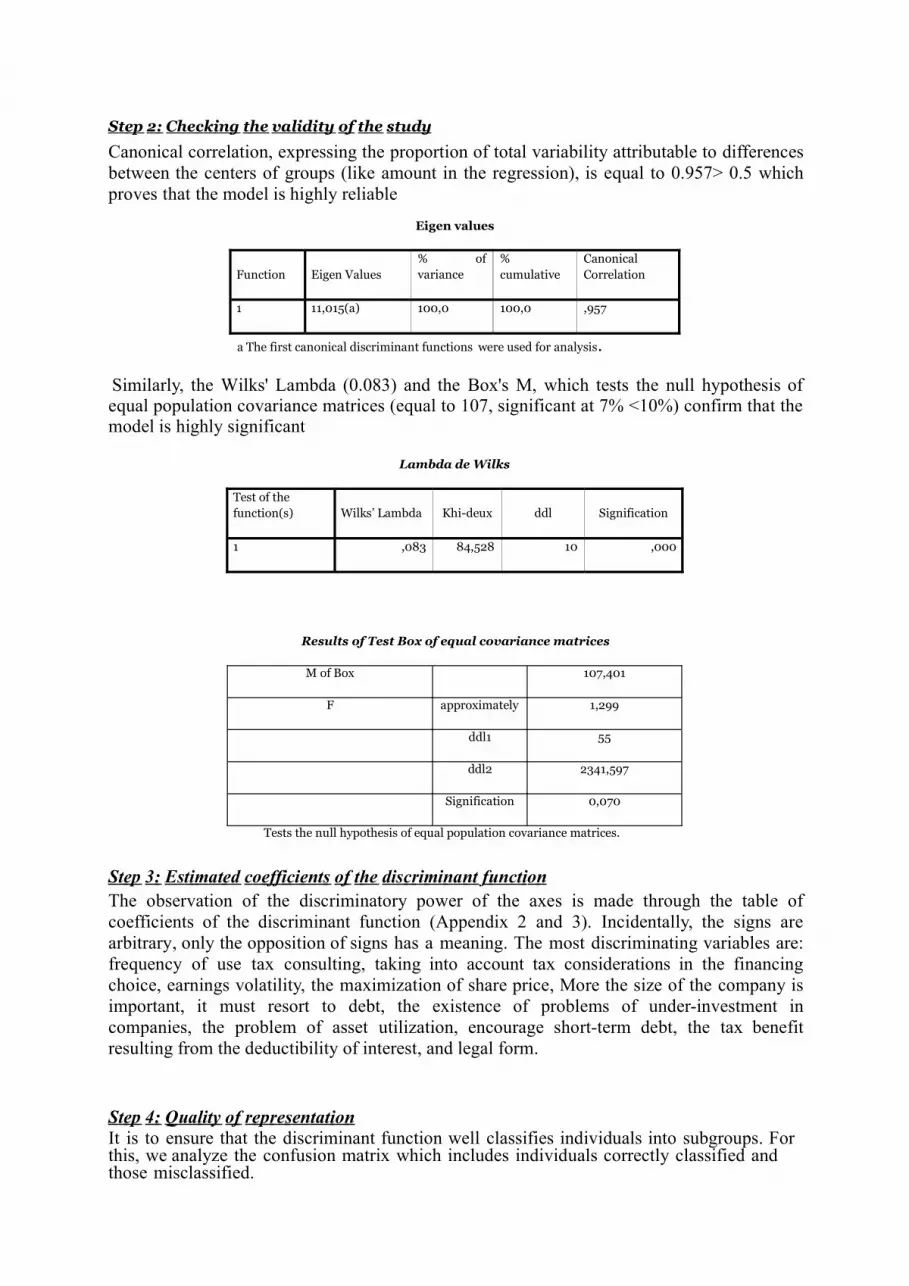
St ep 2 : Che ck ing t he va lid it y o f t he st udy
Canonical correlation, expressing the proportion of total variability attributable to differences between the centers of groups (like amount in the regression), is equal to 0.957> 0.5 which proves that the model is highly reliable
Eigen values
Function Eigen Values% of variance
%cumulative
CanonicalCorrelation
1 11,015(a) 100,0 100,0 ,957
a The first canonical discriminant functions were used for analysis.
Similarly, the Wilks' Lambda (0.083) and the Box's M, which tests the null hypothesis of equal population covariance matrices (equal to 107, significant at 7% <10%) confirm that the model is highly significant
Lambda de Wilks
Test of the function(s) Wilks’ Lambda Khi-deux ddl Signification
1 ,083 84,528 10 ,000
Results of Test Box of equal covariance matrices
M of Box 107,401
F approximately 1,299
ddl1 55
ddl2 2341,597
Signification 0,070
Tests the null hypothesis of equal population covariance matrices.
St ep 3 : Est i mat ed co eff i ci ent s o f t he dis c ri mi na nt f unct io nThe observation of the discriminatory power of the axes is made through the table of coefficients of the discriminant function (Appendix 2 and 3). Incidentally, the signs are arbitrary, only the opposition of signs has a meaning. The most discriminating variables are: frequency of use tax consulting, taking into account tax considerations in the financing choice, earnings volatility, the maximization of share price, More the size of the company is important, it must resort to debt, the existence of problems of under-investment in companies, the problem of asset utilization, encourage short-term debt, the tax benefit resulting from the deductibility of interest, and legal form.
St ep 4 : Qua lit y o f r ep re sentat io nIt is to ensure that the discriminant function well classifies individuals into subgroups. For this, we analyze the confusion matrix which includes individuals correctly classified and those misclassified.
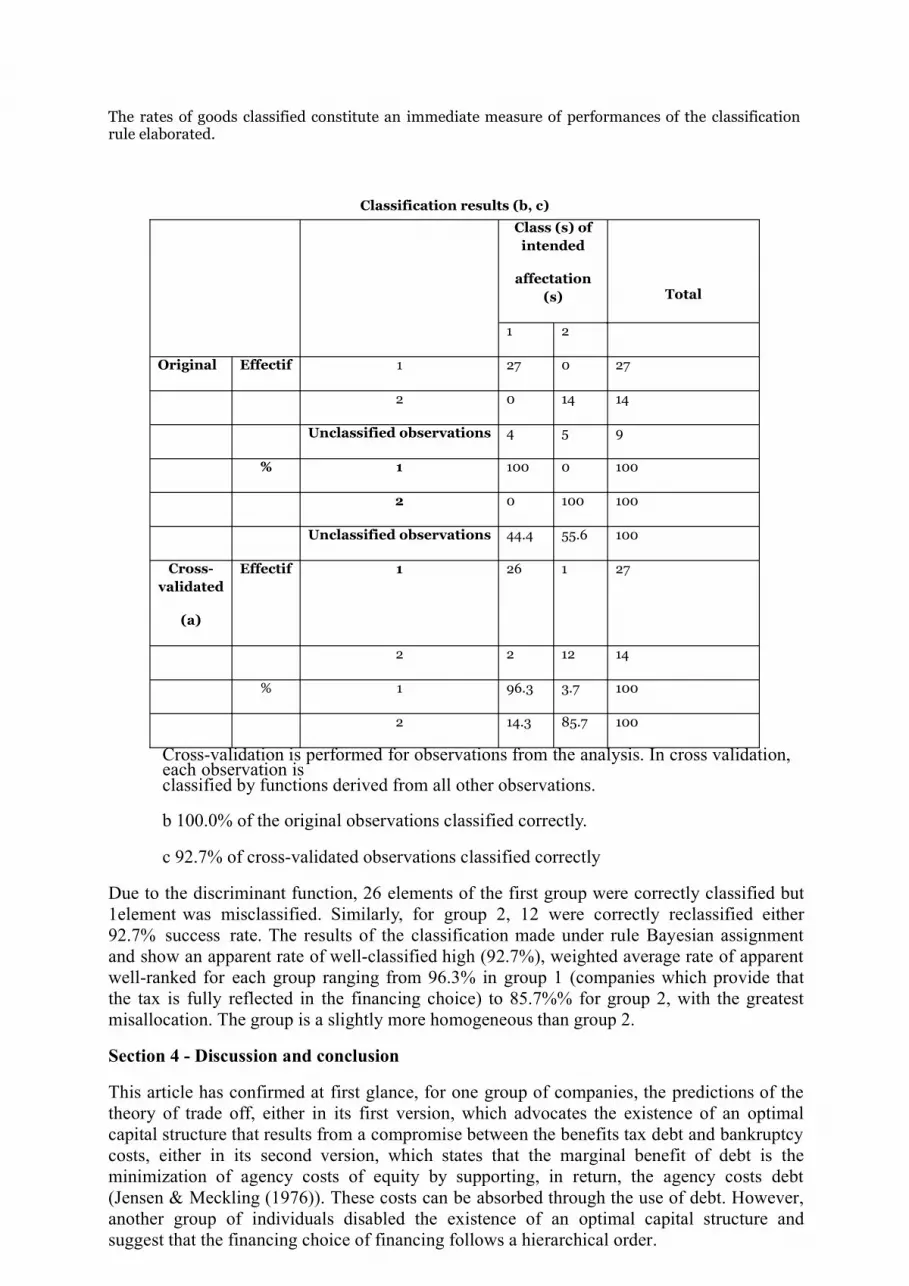
The rates of goods classified constitute an immediate measure of performances of the classification rule elaborated.
Classification results (b, c)
Class (s) ofintended
affectation(s) Total
1 2
Original Effectif 1 27 0 27
2 0 14 14
Unclassified observations 4 5 9
% 1 100 0 100
2 0 100 100
Unclassified observations 44.4 55.6 100
Cross-validated
(a)
Effectif 1 26 1 27
2 2 12 14
% 1 96.3 3.7 100
2 14.3 85.7 100
Cross-validation is performed for observations from the analysis. In cross validation, each observation isclassified by functions derived from all other observations.
b 100.0% of the original observations classified correctly.
c 92.7% of cross-validated observations classified correctly
Due to the discriminant function, 26 elements of the first group were correctly classified but 1element was misclassified. Similarly, for group 2, 12 were correctly reclassified either 92.7% success rate. The results of the classification made under rule Bayesian assignment and show an apparent rate of well-classified high (92.7%), weighted average rate of apparent well-ranked for each group ranging from 96.3% in group 1 (companies which provide that the tax is fully reflected in the financing choice) to 85.7%% for group 2, with the greatest misallocation. The group is a slightly more homogeneous than group 2.
Section 4 - Discussion and conclusion
This article has confirmed at first glance, for one group of companies, the predictions of the theory of trade off, either in its first version, which advocates the existence of an optimal capital structure that results from a compromise between the benefits tax debt and bankruptcy costs, either in its second version, which states that the marginal benefit of debt is the minimization of agency costs of equity by supporting, in return, the agency costs debt (Jensen & Meckling (1976)). These costs can be absorbed through the use of debt. However, another group of individuals disabled the existence of an optimal capital structure and suggest that the financing choice of financing follows a hierarchical order.
The empirical investigation of the determinants of financial structure of Tunisian companies carried out through the questionnaire sent to heads of companies, has highlighted several important aspects that can determine the choice of financing of the survey sample. The opinion, when the importance of taxation on the financial structure of Tunisian companies, denote that this is a crucial variable in the vector of determinants of capital structure of Tunisian firms, it impacts the choice of financing the company. Not only the interest deductibility, from the taxable income, is an important advantage that stimulates managers to resort to debt as a main source of funding but also non-debt tax shields can have the same role. The majority of respondents specify that these tax benefits are complementary confirming the work of Hite (1977).
Based mainly on the lure of profit of which always are showing the firms, financing decisions are guided by tax considerations in order to derive the maximum loads from the taxable income and subsequently minimize the tax paid. The tax savings resulting from the deductibility of interest have privileged the debt compared to the other financing sources. Tunisian companies are mainly indebted against there is a very small tendency to external equity. This can be explained by several reasons. Firstly, Tunisia (Country of Civil Law)), Tunisian firms are in their majority families firms, so they avoid to be financed by issuing shares. Then, the Tunisian financial market is not a developed market so it offers no protection to investors. Only country of the Common Law such as Anglo-Saxon countries that have developed markets with high governance providing investors with strong protection during their introduction to financial markets.
However, excessive leverage can increase managerial risk-taking in the company and may induce financial distress or even bankruptcy. Note here that the variable cost of bankruptcy is a determining factor in the financial structure. These costs are fully taken into account in the financial choice of for the majority of respondents (76%) as well as occupying, for 78% of respondents, the second rank. Similarly, all the interviewees in this survey reported that the debt policy can reflect the degree of the importance of managerial risk taking. Thus, based on 60% of responses, the debt constitutes a triggering mechanism of uncertainty. The excessive use of debt will prove highly costs for the company and may cause potential costs of agency (such as the substitution of assets and under-investment) and bankruptcy costs. This is a cornelian situation that can confront managers to reach an optimal level of debt in order to maximize the tax savings but at the same time minimize the costs of financial distress and agency costs.
In this paper we tested the effect of the tax variable (tax benefits of debt and non-debt tax benefits) on the financing choice of Tunisian companies. Our study aimed to better understand the various issues surrounding the choice of financing strategy adopted by business leaders and to analyze the impact of taxation on the financial structure. This study by questionnaire allowed us to draw several important findings that have validated all of our assumptions. Nevertheless, this study may be affected by the representativeness of the sample. Similarly, respondents may not reveal the true status of their debt ratio for example. But given that the survey is anonymous, we believe that this problem does not exist.
Appendix
Appendix 1: Statistics step by step
Variables introduced / eliminated (a, b, c, d)

Step Introduced Wilks’ Lambda
Statistic ddl1 ddl2 ddl3 F exact
Statistic ddl1 ddl2 Signification

1
2
3
4
5
6
7
8
9
10
As the size of the company, more it must resort to debt
maximize the share price
Fiscal consideration
Problems of underinvestme nt
The tax benefit resulting from the deductibility of interest
legal form
Promote short- term debt
Earnings volatility
The frequency of your use tax consulting
Problem ofpoor utilization of assets
,622
,446
,337
,255
,210
,177
,146
,110
,095
,083
1
2
3
4
5
6
7
8
9
10
1
1
1
1
1
1
1
1
1
1
39,000
39,000
39,000
39,000
39,000
39,000
39,000
39,000
39,000
39,000
23,682
23,609
24,214
26,246
26,313
26,421
27,577
32,349
32,710
33,044
1
2
3
4
5
6
7
8
9
10
39,000
38,000
37,000
36,000
35,000
34,000
33,000
32,000
31,000
30,000
,000
,000
,000
,000
,000
,000
,000
,000
,000
,000
At each step, the variable that minimizes the overall Wilks' lambda is introduced.
a The maximum number of steps is 208.
b The minimum partial F to enter is 3.84.
c The maximum partial F to remove is 2.71.
Threshold of F, tolerance or VIN insufficient for further computation

Appendix n°2:
Canonical discriminant function coefficients standardized
Function
1
The frequency of your use tax consulting
Fiscal consideration
Earnings volatility
maximize the share price
As the size of the company, more it must resort to debt
Problems of underinvestment
Problem of poor utilization of assets
Promote short-term debt
The tax benefit resulting from the deductibility of interest
Legal form
-,737
1,637
,882
-1,530
1,629
1,063
,466
,647
-1,297
1,490
Appendix n°3
Canonical discriminant function coefficients unstandardized
Function
1
The frequency of your use tax consulting
Fiscal consideration
Earnings volatility
maximize the share price
-1,093
2,557
1,378
-4,890

As the size of the company, more itmust resort to debt
4,330
Problems of underinvestment 2,391
Problem of poor utilization of assets ,929
Promote short-term debt 1,394
The tax benefit resulting from the
deductibility of interest -3,076
Legal form 2,369
(Constante) -9,015
References
[1] Agliardi E., and Agliardi R., 2009, «Progressive taxation and corporate liquidation: Analysis and policy implications», Journal of Policy Modeling, 31, pp.144-154.
h ttp://www. sciencedir ect .com /science /ar ticle/pii/S01 6189 3 8 08 000495
[2] Bayless, M., and S. Chaplinsky, « Is There a Window of Opportunity for Seasoned Equity Issuance? », Journal of Finance, 51 (1996), 253–278. D O I: 10 . 111 1 /j.1 5 4 0- 6 2 6 1 . 1 9 96 .tb0 5 20 9 .x
[3] Bradley M., Jarrell G., and Kim E., 1984, «On the existence of an optimal capital structure: Theory and evidence», Journal of Finance, 39, pp.857-880. h ttp : // we bu se r . b u s .umic h . e du/ e h k i m/ ar tic les / o ne xi s t e n c e - j of 1 9 8 3 .pdf
[4] Buettner T., Overesch M., Schreiber U., and Wamser G., 2009, « Taxation and capital structure choice: Evidence from a panelof German multinationals Economics Letters, 105, pp. 309 –31. h ttp : // www .i f o .d e /p o r t a l /p l s / p o r t a l /d o c s / 1/11 87 9 1 0 . P DF .
[5] Byoun S., and Rhim JC., 2003, « Tests of the Pecking Order Theory and the Static Trade o
ff Theory of Optimal
Capital Structure»,h ttp : // www . g oo g le .t n /u r l ? s a = t & r ct = j & q=t es t s% 2 0 o f % 20t h e% 20p e cki n g % 2 0 o r d e r % 20t h e o r y % 20 a n d % 20t h e% 2 0 s t a tic % 2C200 3% 2C % 20b y o u n&s o u r c e=we b & cd= 4 & v e d= 0 C Gs Q Fj A D & u r l = h ttp %3A% 2 F % 2Fcit esee r x.i s t .p s u. e d u % 2Fvi ew d o c % 2Fd o w n l o a d % 3 Fd o i % 3 D10. 1 .1.200 . 1 4 36% 2 6r e p %3 D r e p1 % 2 6 typ e % 3 Dpd f & e i=i P qv T 5 mt Gs mY 8 g O 6o Z G jC Q & u s g = A FQjC N FY l W M V M Bm R H 8 DW 5 mK R i H m 7a Ht r vg
[6]Croquet(2009), « La structure de financement des entreprises belges évoluant sur Euronext Bruxelles. Une étude exploratoire ». Working Paper : 2009/2 Centre de recherche. h ttp : //p o r t a i l .um o n s . a c.b e /F R /u n iv e r s it e / f a cu l t e s / w ar o cq ue / R e c h /D o cum en t s /200 9 - 2 .pdf
[7] DeAngelo H. and Masulis R.W., 1980, «Optimal capital structure under corporate and personal taxation», Journal of Financial Economics, 8, pp.3-29. h ttp s: / / ww w . o w en .v a n d e r bi l t . e du/v a n d e r bi l t/d a t a / r ese ar c h /2202 f u l l .pdf
[8] Dechow P., and Sloan R., 1991, « Executives incentives and the horizon problem», Journal of Accounting and
Economics Vol.14, pp.51-89. h ttp://dx.doi. or g/10. 1016 /67 -7 187 (91)90058 -S
[9] Fama E., and French K., 2002, «The Equity Premium», Journal of Finance, 57, pp. 637-659.
http ://p ap er s. ssr n. co m/ so l3 /p ap er s. cf m? ab str act_ id=236 59 0
[10] Fisher E.O., Heinkel R., and Zechner J., 1989, « Dynamic capital structure choice: theory and tests», Journal of Finance, 44, pp.19-40. f t p : / / f tp.cb a .u r i. e du/ c l a s s es / To n g / f i s c h e r _ h e i n k e l _ z e c h ne r _j f 89 .pdf
[11] Frank M., and Goyal V., 2002, « Testing the pecking order theory of capital structure», Journal of Financial
Economics. h ttp://jf e.r och este r .edu/015 12.pdf
[12] Gill, A., and Mathur N., 2011, «Factors that influence financial leverage of Canadian firms», Journal of
Applied Finance and Banking, 1(2), pp.19-37. h ttp://ww w.s cienpr ess.c om/U pl oa d/JAFB/ Vol%201 _2_2.pdf
[13] Gordon R.H., and Lee, Y., 1999, « Do taxes affect corporate debt policy? Evidence from U.S. corporate tax return data », Journal of Public Economics, 82(2), pp. 195-224. h ttp : // e c o n .u c s d. e du / ~ r o g o r d on / le e 6 a .pdf
[14] Graham J. R., 1996a, «Debt and the marginal tax rate», Journal of Financial Economics, 41, pp.41-73.
h ttp://pa per s.ssr n.c om/s ol 3/ pa per s.cfm?abstra ct_id=5 934
[15] Graham J.R., and Harvey C.R., 2001,« The theory and practice of corporate finance: evidence from the field», Journal of Financial Economics 60,pp.187-243.
h ttp://fa culty.fuq ua .duke. edu /~jgraha m/website/Sur veyP a per .P DF
[16] Graham JR., and Harvey CR., 2003,”The theory and practice of corporate finance: The data”, Working Paper, Duke University.h ttp : // f a cu l ty. f u q u a .duk e . e d u /~c har v e y/ R ese ar c h /W o r ki n g _ Pa p e r s /W 7 2_ T h e _t h eo r y_ a n d.pdf
[17] Graham J.R., and Tucker A.L., 2006, « Tax shelters and corporate debt policy »,Journal of Financial
Economics 81, pp.563-594. h t tp://pa per s.ssr n.com/ so l3/pa per s.cfm?abstra ct_id=6 330 42
[18] Gropp R.E., 2002, «Local taxes and capital structure choice», International Tax and Public Finance, 9, pp.51-
71. h ttp://pa per s.s sr n.c om/s ol 3/pa per s.cfm?abstra ct_id= 31 278 8
[19] Hite G.L., 1977, « Leverage, output Effects and the M-M theorems», Journal of Financial Economics, pp.177-202. h ttp : //dx.d o i . o r g/10 . 101 6 / 3 0 4 - 4 0 5 X ( 77 ) 9 0010-1
[20] Huang S.G., and Song F.M., 2001, «The determinants of capital structure: Evidence from China», School of Economics and Finance and Center for China Financial Research, The University of Hong Kong Press for SSRN h ttp : //p a p e r s . ss r n . c o m/ s o l 3 / p a p e r s .c f m ?ab s t ra ct_id =3 20 0 8 8
[21] Huang S-G.H., and Song F.M., 2006, “The Determinants of Capital Structure: Evidence from China”,
Economic Review, 17, pp. 14-35. h ttp://www.h iebs .h ku.h k/w or king_pa per _upda tes/pdf /w p1042.pdf
[22] Jensen M.C., and Meckling W.H., 1976, « Theory of the firm: Managerial behavior, agency costs and ownership structure», Journal of Financial Economics 3, pp.305-360. h ttp : // www . sf u.c a / ~w a i nw r i g /Ec on4 0 0 /j en s en -m e c k l i n g. p df
[23] Kremp E., and Stoss E., 2001, « L’endettement des entreprises industrielles françaises et allemandes : des évolutions distinctes malgré des déterminants proches », Economie et Statistique N°341-342, pp.157-171. h ttp : // www .i n se e . f r / f r / ff c/ d o c s _ ff c / e s 34 1 h .pdf
[24] Mackie-Mason J. K., 1990a, «Do taxes affect corporate financing decisions?», Journal of Finance, vol 45, n°5, pp.1471-1493.
h ttp://www.r otma n .utoro nto. ca /~CDoidge /File s&Do cumen ts/303 3/M cKieMa son(J F1 990 ).pdf
[25] Michaelas, N., Chittenden, F., and Poutziouris, P., 1999, «Financial policy and capital structure choice in U.K. SMEs: Empirical evidence from company panel data», Small Business Economics, 12(2), pp. 113-130. h ttp : // www . s p r i n g e r l i n k.c o m /c on t en t/ t 1u12 6 2 36 j2 w 2 3 22/
[26] Modigliani F., et Miller M., 1958, «The cost of capital, corporation finance and the theory of investment”, The
American Economic Review, 48(3), 261-97. h ttp://ww w.h is. se/Pa geFile s/176 48 /modig lia nia ndmill er 1958 .pdf
[27] Modigliani F., and Miller M.H., 1963, « Corporate income taxes and the cost of capital: a correction », American Economic Review, vol 53. pp 433-443. h ttp s: // www 2. b c. e du / ~c h e m m a n u/p h d f i n c o r p/ M F 8 9 1 % 2 0 p a p e r s / MM 1 963 .pdf
[28] Myers S. C., 1977, «Determinants of corporate borrowing», Journal of Financial Economics, Vol.5, pp.
147-175. h ttps ://ww w2.bc.edu /~ch emma nu/ph dfinc or p/M F8 91%20pa per s/MM 1963 .pdf
[29] Myers, S.C., and Majluf, N.S., 1984, «Corporate financing and investment decisions when firms have information that investors do not have», Journal of Financial Economics 13, pp. 187-221 h ttp : //d s p a c e .mit. e du/bi t s t r e a m/ ha n d le /1 7 21 . 1/ 6 8 / SW P - 1 5 2 3 -1 5 3 7 64 12.p d f
[30] Norton, E., 1991, «Capital structure and small growth firms», Journal of Business Venturing, Vol6,4,pp.287-
303. h ttp://dx.d oi. or g/10.1 016 /88 3-9026( 91)90020 -E[31] Nunnally. 1979, «Psychometric theory. New York: McGraw Hill, 1967, 640 p», University of Chicago, Chicago, IL. h ttp : //g ar f i el d . l i b rar y.up enn . e du/ c l a ss i c s 1 9 79 / A 1 9 7 9 H Z 3 1 3 00001.p d f .
[32] Panteghini, P.M., 2005, «Asymmetric taxation under incremental and sequential investment», Journal ofPublic Economic Theory, 7, pp.761—779. h ttp : // onl i n el ib rar y. w i le y .c o m/d o i /10. 1 111/ j .1 4 6 7 -
977 9.2005 .00243.x/ab stra ct
[33] Pennings, E., 2000, «Taxes and stimuli of investment under uncertainty», European Economic Review 44,383–391. h ttp : // www . s ci en c e di r e c t .c o m / s ci en c e / ar tic le /B 6 V 64 - 3 Y 9 V 4 7 K
8 /2/e030ef f5 1a 168 b621 190 91 a f4f62b56 6
[34] Sarkar, S., and Goukasian L., 2006, « The effect of tax convexity on corporate investment decisions and tax burdens», Journal of Public Economic Theory, 8, pp. 293-320. Available online on h ttp : //id e a s . r e p e c . o r g/ a /b l a / j pb e ct/v 8 y200 6 i2p2 93 - 3 2 0 . h tml
[35] Sayılgan G., Karabacak K., and Küçükkocao G., 2006, «The firm-specific determinants of corporate capital structure: Evidence from Turkish panel data”, Investment Management and Financial Innovations, 3(3), pp. 125-
139. h ttp:// www .ba ske nt.edu.t r /~gur ayk/kisise lca pstr pa per .pdf
[36] Simmons R.S., 2003, « An empirical study of the impact of corporate taxation on the global allocation of foreign direct investment: a broad tax attractiveness index approach», Journal of International Accounting, Auditing & Taxation 12 (2003) 105–120. h ttp : //c m s o l d.c as s .c n / s h ow _ N e w s _ e . a s p ?id=1 67 4 4
[37] Smith C-W., et Warner J-B., 1979, « On financial contracting: An analysis of bond covenants», Journal of Financial Economies, Vol. 7, pp. 117-116. f tp : / / 12 8 .1 5 1.2 3 8 . 6 5 / f a c / W A RN E R / J e rr y % 20 Pa p e r s / J FE- J u ne% 20 7 9 .pdf
[38] Teraoui H., and Kaddour A., Chichti J., et BenRejeb J., 2011, «Impacts of Tax Incentives on Corporate Financial Performance: The Case of the Mechanical and Electrical Industries Sector in Tunisia», International Journal of Economics and Finance, Vol. 3, No. 6,pp117-127. D o i : 1 0 . 55 39 /ij e f .v 3 n6 p117
[39] Teraoui.H., and Kaddour.A., 2012, «Taxation and Corporate Finance: What Effects of Fiscal measures on Financial and Economic Return?The case of the Tunisian firms after the finance law of 2007», Journal of Business Studies Quarterly , Vol. 3, No.3, pp. 87-94. h ttp : / /jb s q. o r g / w p-c on t e n t/up l o a d s /2012/0 4 / Mar c h - 2012- F.pdf
Publication reference:
International Journal of Management Sciences and Business Research Journal’s profile at:
http://www.ijmsbr.com/
and submit your manuscripts online.
Dr. Johnkeets, USA
Chief Editor
International Journal of Management Sciences and Business Research
Head Office
61 Smedley Lane Cheetamhill Road
Manchester M8 8XG, England
Email: [email protected] or [email protected]


