Embed Size (px)
Citation preview

Cardiff Economics
Working Papers
Ernesto Longobardi and Vito Polito
Capital income taxation incentives during economic
downturns: re-thinking theory and evidence
E2011/15
CARDIFF BUSINESS SCHOOL
WORKING PAPER SERIES
This working paper is produced for discussion purpose only. These working papers are expected to be published in
due course, in revised form, and should not be quoted or cited without the author’s written permission.
Cardiff Economics Working Papers are available online from: http://www.cardiff.ac.uk/carbs/econ/workingpapers
Enquiries: [email protected]
ISSN 1749-6101
June 2011
Cardiff Business School
Cardiff University
Colum Drive
Cardiff CF10 3EU
United Kingdom
t: +44 (0)29 2087 4000
f: +44 (0)29 2087 4419
www.cardiff.ac.uk/carbs
Capital income taxation incentives duringeconomic downturns: re-thinking theory and
evidenceErnesto Longobardi
Dipartimento di Scienze Economiche e Metodi Matematici, Universita�di Bari
and
Vito PolitoCardi¤ Business School
September 2010
Abstract
This paper studies the e¤ectiveness of corporate tax incentives in reducing thee¤ective tax rate (ETR) on income from capital to stimulate business investment dur-ing economic downturns. We focus on tax rate incentives (TRIs), such as corporatetax rate cuts, and tax base incentives (TBIs), such as increased capital allowances.The standard economic theory states that TRIs reduce the ETR by decreasing taxpayments on corporate pro�ts. TBIs instead reduce the ETR as they defer �rms�taxpayments, in turn increasing the present value of dividend distribution. However, thistheory does not consider that, in reality, �rms face accounting constraints preventingany distribution of cash �ows arising from TBIs. For this reason, the standard eco-nomic analysis overstates the bene�t of any TBI relative to that of TRIs. The paperincorporates accounting constraints on dividend policy into the model for the compu-tation of the ETR and employs the new model to recalculate ETRs in the US and inthe UK during 1980-2010. The empirical results con�rm that the bene�t of TBIs issigni�cantly overstated by the standard theory, and tax rate cuts are more e¤ective inreducing the ETR. We show that this result holds regardless of the form of investment�nance (retained earning, new equity and debt), the type capital asset (building andplant and machinery), the level of capital income taxation (corporate and sharehold-ers), and the value of accounting depreciation relative to economic depreciation.
Keywords: Capital income taxation; dividend policy; e¤ective marginaltax rates; �nancial constraints.
JEL classi�cation: H3.
1
1 Introduction
Over the last thirty years, both the United States and United Kingdom haverelied on a number of tax incentives to stimulate business investment, capitalaccumulation and faster growth during periods of economic downturn or re-covery. The principle underpinning a policy based on the provision of a taxincentive is a well established one in the economic theory: tax incentives reducethe e¤ective tax burden on income from capital in turn increasing the after taxrate of return from investment. This increase in return should then raise de-mand for capital goods. The focus of this paper is to evaluate which type of taxincentive is more e¤ective in reducing the tax burden on income from capital.1
A very di¤erent range of tax incentives has been employed in the United Statesand in the United Kingdom over the last 30 years. We narrow the scope of ouranalysis to generic and economy-wide tax incentives granted to domestic cor-porate investors regardless of any speci�c characteristic of the business, such asits location, size, or type. Within these margins, a lower e¤ective tax burden onincome from capital can be achieved either through a reduction of the statutorytax rate levied on capital income at both corporate or personal level (tax rateincentive, hereafter TRI) or, given the headline tax rate, through a reductionof the corporate tax base (tax base incentive, hereafter TBI). The key issue weinvestigate in the paper is which of the two types of incentives, TRI or TBI, ismore e¤ective in reducing the tax burden on income from capital.Following the standard economic literature started by King and Fullerton
(1984), and then further developed by Devereux and Gri¢ th (1998b, 2003), wemeasure the tax burden on business investment through the e¤ective tax rate(ETR) on income from capital. There are two main reasons for choosing theETR proposed in this literature as the indicator of the e¤ective tax burden onincome from capital against which to compare the impact of TRIs and TBI.First, ETRs are widely employed by policy makers for cross-country compar-isons of the corporate tax burden and assessment of capital income taxationsystems.2 Second, ETRs are particularly useful to evaluate and compare thee¤ectiveness of TRIs relative to TBIs, since they represent simple indicatorswhich take into account simultaneously how tax rates and tax base rules deter-mine the overall tax burden on income from capital. Of course, tax codes seta large number of rules for the determination of the tax base, which cannot betaken simultaneously into account by a single indicator. We follow the standardcorporate tax literature and therefore focus only on tax depreciation allowancesfor capital spending: as a result, we consider as TBI an increase in the rate oftax depreciation allowances.
1Whether a lower tax burden on income from capital translates in a higher demand forinvestment goods is an empirical question which has been extensively investigated in the eco-nomic literature, and it is out of the scope of this paper. See, for example, Backus, Henriksenand Storesletten (2008); Burnham and Ozanne (2006); De Mooij and Ederveen (2003); Dev-ereux and Gri¢ th (1998a); Devereux, Gri¢ th and Klemm (2002); Devereux, Lockwood andRedoano (2008); and Slemrod (1990).
2See, for example, Congressional Budget O¢ ce (2005, 2006); European Commission (1992,2001); Institute for Fiscal Studies (2009); and OECD (1991, 2007).
2
The empirical evidence suggests that lower corporate tax rates and/or tem-porary increase of tax depreciation allowances have been a recurrent feature ofcorporate tax policy in the United States and in the United Kingdom duringeconomic downturns over the last 30 years. However, as tax rates have continu-ously declined over this period of time, TBIs have become the more predominantform of tax incentive.To evaluate their impact on the ETR, we compare and contrast the rela-
tive e¤ects of TRIs and TBIs within two investment frameworks. The �rst isconsistent with the standard neoclassical theory, and assumes that shareholderswealth increases following either a TRI or a TBI, as both types of incentivesincrease the present value of dividend income. In particular, the standard eco-nomic theory advocates that TBIs, such as higher tax depreciation allowancesfor capital expenditure, increase the rate of investment because they defer taxpayments to the future, in turn raising the present value of dividend income.This theory, however, neglects that accounting standards in OECD countriesimpose �nancial constraints on dividend policy preventing �rms from distrib-uting to shareholders any cash �ows arising from deferred taxation. This isbecause TBIs are normally temporary tax incentives designed to provide �rmswith extra cash �ow to undertake new investment, rather than distribute higherdividend income. As a result, a second investment model is designed to fully in-corporate the e¤ect of dividend policy constraints imposed on �rms bene�ttingfrom a TBI. We show that within this second model, the bene�t from a TBI issigni�cantly lower than that predicted by the standard theory, hence TRIs aremore likely to reduce the ETR than TBIs. In turn, this implies that as tax ratescontinue to decline in both the United States and the United Kingdom, therewill be less and less scope to exploit the most e¤ective tax tool (the tax cut) tostimulate business investment during recessions.3
Constraints on dividend policy linked with TBIs, as de�ned by the Gener-ally Accepted Accounting Principles in the United States and the InternationalFinancial Reporting Standards in the United Kingdom, require �rms to set fullprovision for any deferred tax asset or liability arising from temporary di¤er-ences between the accounting value of assets and liabilities and their value fortax purposes. The importance of incorporating accounting constraints in invest-ment models for tax policy analysis has already been pointed out by a relevantbranch of the economic literature.4 Although the actual constraint depends onthe gap between the accounting and the tax evaluation of assets and liabilities,most of this literature assumes that the accounting value of assets and liabilitiesfully re�ects their economic value. This corresponds to assume that accountingdepreciation equals economic depreciation in our analysis, which is a plausibleassumption not least because over the past 10-15 years accounting standards
3 Indeed, even if the corporate tax rate reached zero, a government can still engineer a taxrate cut by granting a tax credit, which in this case would result in a direct income transferfrom the government to the corporate sector. It is doubtful, however, that such policy will bepolitically and �nancially feasible.
4See, for example, Boadway and Bruce (1979), Kanniainen and Södersten (1994 and 1995),King (1974), Sørensen (1995), and Mills (2006).
3
followed by United States and United Kingdom companies have increased their�exibility in order to align accounting depreciation to economic depreciation.5
Nevertheless, we departure from the conventional literature and generalise ourconstrained version of the neoclassical investment model allowing the size ofprovision for deferred taxes to depend on the gap between accounting and taxdepreciation, as prescribed in the accounting standards, the former being di¤er-ent from economic depreciation. Our analysis also di¤ers in four instances fromPolito (2009), who incorporates accounting constraints on dividend policy intothe Jorgenson (1963) investment model and uses this new framework to computeETRs in the special case of domestic investment �nanced by retained earnings.First, this paper adopts a discrete time approach, while Polito (2009) employsthe alternative, though mathematically equivalent, continuous time version ofJorgenson (1963) model. Second, since the focus here is on the impact of TRIsand TBIs on the ETR, this paper shows analytically how changes in tax ratesand tax depreciation impact di¤erently on the ETR in the unconstrained andconstrained version of the model, while this type of analysis is not carried outin Polito (2009) which focuses on the e¤ect of changes in investment pro�tabil-ity under the two models. Third, this paper shows that the negative e¤ect ofdividend policy constraints holds for every form of investment �nance (retainedearnings, new equity and debt), while Polito (2009) considers retained earningsalone. Fourth, the empirical application of this paper focuses on the time seriesanalysis of ETRs in the United States and in the United Kingdom for the wholeperiod 1979-2010, while Polito (2009) considers 5 EU countries in 2008 alone.Our empirical �ndings show that the unconstrained model signi�cantly over-
states the bene�t of temporary increase in tax allowances for capital spending,especially when investment is �nanced by retained earnings and yields a low rateof return: in other words, TBIs are far less e¤ective than TRIs. Tax rate cutsare e¤ective in reducing the ETR, unless investment is �nanced by debt andyields a low rate of return. These results are shown to hold when consideringtaxation at corporate level alone, taxation at personal level, for investment inboth plant and machinery and industrial buildings, and regardless of the valueof accounting depreciation relative to the rate of economic depreciation.The paper is organised as follow. In Section 2 the approach developed by De-
vereux and Gri¢ th to calculate ETR is brie�y described. We consider the ETRfor a domestic investment �nanced by either retained earnings or new equityor debt and use the framework to evaluate how TRIs and TBIs impact on theETR. Section 3 clari�es how accounting constraints limit dividend policy when�rms can defer tax payments following a TBI, and illustrates the implicationsof these constraints for the cost of capital. Section 4 introduces dividend pol-icy constraints into the neoclassical framework and revisits the e¤ects of TRIsand TBIs within this constrained model. Section 5 brie�y presents data on thetaxation of income from capital the United States and in the United Kingdom
5 Indeed, the IAS 16 (International GAAP 2010) does not prescribe any speci�c methodand/or rate of depreciation for accounting purposes, as it requires the depreciation charge tore�ect the pattern of consumption of the bene�ts the assets brings over its useful life, whichis essentially consistent with economic depreciation.
4
from 1979 to 2010. Section 6 summarises the results obtained by using thesedata to compute ETRs in both countries under the two models over the lastthirty years. Section 7 states our conclusions. Appendix A at the end of thepaper describes in detail all tax data used in this paper.
2 The ETR on income from capital
The Devereux and Gri¢ th model (Devereux and Gri¢ th, 1998a and 1998b; Eu-ropean Commission, 2001; Devereux, 2004) considers a competitive �rm seekingto maximise its shareholders wealth, while facing a perfectly elastic supply ofcapital and a frictionless capital market, where it can borrow and lend at theconstant nominal interest rate i. The nominal interest rate is related to thereal rate r through the Fisher equation (1 + i) = (1 + r) (1 + �), where � is theconstant in�ation rate from t to t+1. Investment choices are riskless and takenin the absence of bankruptcy costs.The model considers a simple one period investment: it is supposed that
in a period t the �rm increases its capital stock by making an investment ofone unit, while decreasing its capital stock by the same amount in the followingperiod t+1.The increase in the shareholders wealth induced by the investment is equal
to the net present value of the economic rent generated:
�Wt =1Xs=0
�Dt+s ��Nt+s(1 + �)
s ; (1)
where �D and �N denote the change in dividend income and new equityissues, from period t onward; is the after-tax income received by shareholdersfor any unit increase in dividend income; � is the shareholders�discount rate.In particular, =
�1�md
�= (1� z) (1� c), where md, z and c measure the
personal tax rates on dividend income, accrued capital gains and the imputationrate, respectively;6 and � = i
�1� � i
�= (1� z), with � i denoting the personal
tax rate on interest income.Dividend income is computed in any period t from the identity between
sources and uses of funds
�Bt +Nt +Qt (Kt�1)� iBt�1 = Dt + It + Tt; (2)
where �Bt denotes the change in the stock of debt in period t; Qt (Kt�1) is out-put in period t depending on the stock of capital in the previous period, Kt�1,having normalised prices of output and capital goods to unity; iBt�1 measuresinterest payments on the outstanding stock of debt; It is the investment under-taken in period t, and Tt measures the period t corporate tax liability.7 The
6The de�nition of implies that, R 1, when the net tax on dividend income is lower,equal or higher than the capital gain tax rate.
7Qt (:) is a standard neoclassical investment function, which is continuos and twice di¤er-entiable, with positive �rst derivative and negative second derivative.
5

capital stock evolves according to the capital accumulation equation
Kt = (1� �)Kt�1 + It; (3)
where � is the rate of economic depreciation of the capital stock.The tax liability is formulated as
T ct = ��Qt (Kt�1)� iBt�1 � �
�It +K
Tt�1��; (4)
where � is the statutory tax rate, � is the tax allowance on capital spending,and KT
t�1 is the tax-written-down value of the capital stock at the end of periodt, which evolves according to
KTt = (1� �)KT
t�1 + It: (5)
Assuming that the tax code grants tax depreciation allowances on a decliningbalance basis, the present value of the tax saving generated by the allowancesper unit of investment in physical capital, A�, is measured as
A� = ��+ �
1Xs=1
�1� �1 + �
�s= ��
(1 + �)
�+ �; (6)
where �� denotes the tax saving generated by the initial period (t) capital
allowance and �1Ps=1
�1��1+�
�smeasures the present discounted value of the tax
saving from any capital allowance received from t = 1 onward. Equation (6)immediately shows that an increase in either the corporate tax rate or the capitalallowance rate raises the present discounted value of the tax saving from capitalallowances since
@A�@�
= �(1 + �)
�+ �> 0;
@A�@�
= �� (1 + �)
(�+ �)2 > 0:
Following Jorgenson (1963) and Hall and Jorgenson (1967), the traditionalmethod of measuring the impact of capital income taxation on investmentchoices is based on the maximisation of the net return from capital investmentin equation (1) with respect to Kt, subject to the constraints in equations (2)to (5). Assuming that the investment is �nanced by retained earnings, the �rstorder condition for t = 0; 1; 2; ::: is:
� (1�A�) +
1 + �[(1� �) (p+ �) (1 + �) + (1� �) (1�A�) (1 + �)] � 0:
(7)The �rst term on the left hand side of (7) is the net present value of the
cost of the investment for the shareholders and the second one is the after taxpresent value of the return from the investment, which includes after tax gross
6
nominal return (1� �) (p+ �) (1 + �) and the residual nominal value of capital(1� �) (1�A�) (1 + �), with p denoting the net �nancial return generated byinvestment in physical capital 8 .For marginal investment projects equation (7) holds with equality and it can
be solved for the user cost of capital p = ~p. It holds with inequality wheneverinvestment projects yield an expected rate of return in excess of the marginalrate.9 In this second case, physical capital generates an economic rent R, namelya rate of return which exceeds the marginal rate. Hence, the investment condi-tion in equation (7) can be formulated as
RU;RE =
1 + �f(1� �) (p+ �) (1 + �)� [�+ � (1 + �)� �] (1�A�)g � 0;
(8)where RU;RE denotes the after tax economic rent, the subscript U indicating theabsence of any constraint on dividend policy ("unconstrained" dividend policy)and RE specifying that the investment is �nanced by retained earnings.Note that in the absence of taxes, the above reduces to
R� =p� r1 + r
� 0; (9)
which holds with equality for marginal investment projects.The applied version of the model extends the relation in equation (8) to the
case of investment �nanced by either new equity or debt. When investment is�nanced by new equity issues, in the current period the �rms need to raise newequity for the net investment cost 1� ��. Consequently, compared to the caseof retained earnings, in the current period shareholders contribute by 1 � ��but their dividend payout increases by (1� ��). In the subsequent periodthe amount (1� ) (1� ��) is distributed to shareholders as a repurchase ofequity. Combining these e¤ects, the economic rent for investment �nanced bynew equity, RU;NE , can be formulated as
RU;NE = RU;RE �� (1� ) (1� ��)
1 + �: (10)
Hence, under the standard formulation of the model, the impact of new equity�nance on the economic rent depends upon the taxation of dividend incomerelative to capital gains, as summarised by the parameter . When the taxsystem does not discriminate between dividend income and capital gains, = 1,then the value of the after tax economic rent under new equity �nance is thesame as under retained earnings. When dividend income is taxed more thancapital gains, < 1, then the economic rent under new equity �nance is lowerthan under retained earnings, since it is more e¢ cient to �nance investment
8 In other words p represents the return measured in terms of EBIT (earnings before income
and taxes): it is given by p =@Qt+1(Kt)
@Kt� �
9See Devereux and Gri¢ th (1998b, 2003), for a justi�cation of this condition in partialequilibrium investment models.
7
using the source of income subject to the smaller tax burden (retained earnings).Viceversa, when dividend income is taxed less than capital gains, > 1, then theeconomic rent under new equity �nance is higher than under retained earnings,because investment is �nanced with the less expensive form of �nance.Under debt �nance, shareholders borrow the amount 1 � �� to �nance in-
vestment. Hence, compared to the case of retained earnings, in the currentperiod shareholders receive an amount (1� ��), which is repaid with interestin the following period. After taking into account that interest payments aredeductible for corporate tax purposes, the net cost of repaying debt reducesthe size of the dividend payment in period t + 1, relative to the retained earn-ings case, by the amount (1� ��) [1 + i (1� �)]. Combining these e¤ects, theeconomic rent for investment �nanced by debt, RU;B , is described as
RU;B = RU;RE + (1� ��) [�� i (1� �)]
1 + �; (11)
where the second term on the right-hand side of equation (11) measures thebene�t from debt �nancing.E¤ectively, under debt �nance the �rm postpones the payment of the cost of
capital by one period. If the interest rate is not taxed at personal level, � = i,and the cost of borrowing is undeductible from the corporate tax base, thenRU;B = RU;RE and there is no bene�t from debt �nance. If the interest rate isnot taxed at personal level, � = i, and the cost of borrowing is deductible fromthe corporate tax base, then
RU;B = RU;RE + (1� ��) i�
1 + i;
which shows that debt �nancing increases the economic rent. If the cost ofborrowing is undeductible from the corporate tax base and interest income istaxed at personal level, then
RU;B = RU;RE + (1� ��) (�� i)
1 + �;
which shows that the bene�t of debt �nancing depends on the value of � relativeto i, as RU;B R RU;RE for � R i.Equations (8) - (11) provide formulations of the economic rent under alter-
native forms of �nance which are fairly standard in the corporate tax literature,and can be used to measure the ETR on income from capital, de�ned as thedi¤erence between the economic rent before and after taxes, measured as aproportion of the discounted value of p:
ETRU;j =R� �RU;jp= (1 + r)
; (12)
where the subscript j = RE;NE;B distinguishesbetween three forms of investment �nance. Equation (12) shows that any tax
8

measure that increases (reduces) the after economic rent RU;j has the e¤ect ofreducing (increasing) the ETR on income from capital.We can now employ these measures to evaluate how TRIs and TBIs impact
on the ETR according to the traditional neoclassical investment theory.
2.1 Retained earnings
We �rst study how the ETRU;RE varies with investment pro�tability. This isimportant because it reveals how the e¤ective tax burden on income from capitalis likely to change over the business cycle. After incorporating the economic rentin equation (8) into the formula for the ETR in (12) and rearranging, the ETRis formulated as
ETRU;RE = 1�r
p� (1 + r) (1 + �) p
[(1� �) (pU;RE + �) (1 + �)� [�+ � (1 + �)� �] (1�A�)] :
Assuming that interest income and capital gains are not taxed at personal level,i = �, the above simpli�es to
ETRU;RE = 1� (1� �)�r (1� )� [�� � (r + �)A�]
p:
If de�ning the present value of the tax saving which would be generated byeconomic depreciation as
A� = �
1Xs=1
�1� �1 + r
�s=
��
r + �(13)
the above becomes
ETRU;RE = 1� (1� �)�r (1� )� (r + �) (A� �A�)
p: (14)
Equation (14) shows that the ETRU;RE includes two components: the �rstterm, 1 � (1� �), is the permanent component of the ETR, entirely depen-dent on the government design of the capital income taxation system at bothcorporate and personal level. The second term is the temporary component ofthe e¤ective tax burden, which is related to investment pro�tability. Note thatusing the de�nitions in equations (6) and (13) and in the absence of taxation atshareholders level, = 1, the ETR in equation (14) becomes
ETRU;RE = � +� [� � (1 + r)�]
p
which shows that the ETR R � if � R (1 + r)�. We now consider two specialcases. First we assume that the tax code does not grant the �rst year taxdepreciation allowance. Hence, A� =
��r+� and the ETR becomes
ETRU;RE = � +� (� � �)
p
9
which shows that the ETR R � if � R �. Therefore, if the tax system allowsjust the deduction of economic depreciation, it follows that
ETR = � :
The sensitiveness of the ETRU;RE to investment pro�tability is measuredfrom (14) as
@ETRU;RE@p
=r (1� )� (r + �) (A� �A�)
p2:
The above shows that the sensitiveness of the ETR to investment pro�tabilitydepends on the taxation of dividend income relative to capital gains and thedi¤erence between tax and economic depreciation. In general, the above expres-sion is always negative whenever dividend income is taxed more than capitalgains and tax depreciation exceeds economic depreciation. In particular, wenote the following results:
1. @ETRU;RE
@p = 0, when dividend income is taxed as capital gains ( = 1)and tax depreciation equals economic depreciation (A� = A�);
2. @ETRU;RE
@p = r(1� )p2 ; when dividend income is taxed di¤erently from capital
gains ( 6= 1), but tax depreciation equals economic depreciation(A� =A�);
3. @ETRU;RE
@p =�(r+�)(A��A�)
p2 ; when dividend income is taxed as capitalgains ( = 1) but tax depreciation exceeds economic depreciation (A� <A�).
Investment pro�tability is pro-cyclical, hence when there is no discrimina-tion between dividend income and capital gains in the tax system, the e¤ectivetax burden on income from capital is anti-cyclical as long as tax depreciationallowances exceed economic depreciation. In this case the ETR increases duringphases of expansions, while falling during contractions.The e¤ect of a TBI on the ETR for investment �nanced by retained earnings
can be measured by evaluating the impact of an increase in the tax allowanceon capital spending:
@ETRU;RE@�
= � (r + �)p
@A�@�
; (15)
which shows that an increase in the tax depreciation allowance rate reduces theETR. This result has a straightforwardeconomic interpretation: a higher tax allowance on capital spending shrinksthe tax base in the current period relative to the future, in turn increasing thepresent value of dividend income distributable toshareholders. The increase in the economic rent resulting form the higher cap-ital allowance results then in the reduction of the ETR. Conversely, the ETRincreases following a reduction in the capital allowance.
10
We can also study how the ETR responds to a TRI. After di¤erentiatingequation (14) with respect to the corporate income tax rate we obtain:
@ETRU;RE@�
=
�1 +
�
p� (1 + r)(r + �)
p (r + �)�
�(16)
Hence, in principle, an increase of the corporate tax rate has an ambiguous e¤ecton the economic rent and the ETR. The �rst two terms in the square bracketsmeasure the impact of the higher tax rate on the gross return on investment,which clearly increases the ETR. The last term measures the impact of a changein the corporate tax rate on the ETR through the tax base. This is negativelyrelated to the ETR since the higher corporate tax rate increases the presentvalue of the tax saving from capital allowances, in turn reducing the tax base.Notice that when dividend income is taxed as capital gains, = 1, if � = �,the right hand side of the above reduces to 1, which shows that a TRI reducesthe ETR one for one when tax depreciation equals economic depreciation. Moregenerally, if � 6= �, then @ETRU;RE
@� R 0 when (p+ �) (r + �) R � (1 + r)(r + �) :
2.2 New equity
Combining the de�nitions in equations (12) and (10), the ETR is formulated as
ETRU;NE = ETRU;RE + �(1� ) (1� ��) (1 + r)
(1 + �) p: (17)
The above shows that the ETR under new equity �nance includes two terms.The �rst measures the e¤ective tax burden on the present value of dividendincome generated by the investment, as in the case of retained earnings. Thesecond term measures the impact on the e¤ective tax burden of new equity�nance relative to retained earnings, which in turn depends on the taxation ofdividend income relative to capital gains, as measured by . When dividendincome is taxed as capital gains, = 1, then the ETRU;NE equals that underretained earnings. If dividend income is taxed more (less) than capital gains, < (>)1, then new equity �nance is less (more) e¢ cient than retained earnings�nance and the ETRU;NE is higher (lower) than ETRU;RE .From equation (17) it follows that the sensitiveness of the ETR to changes
in investment pro�tability is measured by
@ETRU;NE@p
=@ETRU;RE
@p� � (1� ) (1� ��) (1 + r)
(1 + �) p2;
which shows that the cost ( < 1) or the bene�t ( > 1) of new equity �nancerelative to retained earnings fades away as investment pro�tability raises.Equation (17) also shows that the impact of new equity �nance relative to
retained earnings depends on tax saving generated by the �rst year allowancerate, ��. The �rst year tax depreciation allowance has the e¤ect of reducing thecost of capital in the �rst period, in turn implying that the �rm needs to relyless on any other form of �nance.
11
The e¤ect of a TBI under new equity �nance is measured by di¤erentiatingwith respect to � the ETR in equation (17), which yields
@ETRU;NE@�
=@ETRU;RE
@�� �� (1� ) (1 + r)
(1 + �) p: (18)
The two terms on the right-hand side of equation (18) show that a TBI hastwo e¤ects on the ETR under new equity �nance. First, the increase of the taxdepreciation allowance reduces the ETRU;RE since it raises the present value ofdividend income distributable to shareholders. The second e¤ect refers to theimpact on the �nancial bene�t from new equity �nance relative to retained earn-ings. Consider the case of new new equity �nance being the most tax e¢ cientform of �nance, > 1. In this case, the ETR on investment �nanced by newequity issue increases relative to that under retained earnings taxation becauseby reducing the proportion of investment �nanced with the most e¢ cient formof �nance the higher capital allowance reduces the bene�t of new equity �nancerelative to retained earnings. The opposite occurs when < 1.Note that since the tax saving from tax depreciation allowance is propor-
tional to the statutory corporate tax rate, it follows immediately that increasesof the corporate tax rate will have an e¤ect on the new equity component of theETR similar to that of an increase of the capital allowance. In fact, the impactof a change in the corporate tax rate on the economic rent generated is givenby
@ETRU;NE@�
=@ETRU;RE
@�� � (1� ) (1 + r)�
(1 + �) p:
Consequently, a TRI increases (reduces) the �nancial bene�t of new equity�nance relative to retained earnings when < 1 ( > 1).
2.3 Debt
Combining (12) with (11), the e¤ective tax burden on debt �nanced investmentis formulated as
ETRU;B = ETRU;RE � (1� ��) [�� i (1� �)] (1 + r)
(1 + �) p: (19)
Hence, the overall impact of debt �nancing on the e¤ective tax burden, asmeasured by the second term on the right hand side depends on � � i (1� �).This term is positive whenever the personal tax rate on interest income is lowerthan the corporate income tax rate (� i < �), in turn implying that ETRU;B <ETRU;RE , which is a condition generally holding for most of OECD countries.Several special cases may be noted here. If the interest rate is not taxed
at personal level, � = i, and the cost of borrowing is undeductible from thecorporate tax base, then ETRU;B = ETRU;RE and there is no bene�t fromdebt �nance. If the interest rate is not taxed at personal level, � = i, and thecost of borrowing is deductible from the corporate tax base, then
ETRU;B = ETRU;RE � i� (1� ��) (1 + r)
(1 + i) p;
12
which shows that debt �nancing increases reduces the ETR. If the cost of bor-rowing is undeductible from the corporate tax base and interest income is taxedat personal level, then
ETRU;B = ETRU;RE � (1� ��) [�� i] (1 + r)
(1 + �) p:
and the bene�t of debt �nancing depends on the value of � relative to i, asETRU;B S ETRU;RE when � R i.Equation (19) shows that the bene�t of debt �nance on the ETR increases
as investment pro�tability raises since
@ETRU;B@p
=@ETRU;RE
@p+
(1� ��) [�� i (1� �)] (1 + r)(1 + �) p2
:
The impact of a TBI on the ETRU;B is measured by
@ETRU;B@�
=@ETRU;RE
@�+
� [�� i (1� �)] (1 + r)(1 + �) p
; (20)
which shows that an increase in the tax depreciation allowance has two oppositee¤ects on the ETR. On the one hand, it reduces the ETR as it increases thepresent value of dividend income distributable to shareholders. On the otherhand, it reduces the bene�t of debt �nancing relative to retained earnings asthe higher capital allowance decreases the amount of interest income deductibleform the tax base.As previously pointed out, several special cases can occur depending on the
taxation of interest income at personal and corporate level. If interest incomeis not deductible from the corporate tax base and is not taxed at personal level,then the above becomes
@ETRU;B@�
=@ETRU;RE
@�:
If the interest rate is not taxed at personal level, � = i but the cost ofborrowing is deductible from the corporate tax base, then
@ETRU;B@�
=@ETRU;RE
@�+
i�2 (1 + r)
(1 + �) p:
This result has the following economic interpretation. A TBI has the e¤ect ofreducing the proportion of investment �nanced by borrowing, in turn reducingthe bene�t of debt �nancing relative to retained earnings.If the cost of borrowing is undeductible from the corporate tax base and
interest income is taxed at personal level, then
@ETRU;B@�
=@ETRU;RE
@�+
� [�� i] (1 + r)(1 + �) p
13
which shows that an increase in the tax depreciation allowance reduces therelative bene�t of debt �nancing.Finally, the impact of an increase in the corporate tax rate is measured by
@ETRU;B@�
=@ETRU;RE
@�+ f� [�� i (1� �)]� (1� ��) ig (1 + r)
(1 + �) p:
The term in the curly brackets on the right hand side shows that an in-crease in the corporate tax rate has two e¤ects on the debt component of theETR. The �rst is captured by the term � [�� i (1� �)]. As pointed out earlier,since interest income is generally taxed less at personal level than at corporatelevel, � > i (1� �). This implies that, as for the case of a TBI, an increase inthe corporate tax rate has the e¤ect of reducing the proportion of investmentcost �nanced by retained earnings, hence reducing the bene�t of debt �nanc-ing relative to retained earnings, in turn increasing the ETR. The second term,captured by (1� ��) i, measures the bene�t arising from the higher proportionof interest income deductible from the corporate tax base, which clearly reducesthe ETR as the corporate tax rate raises. Consequently, a TRI has two e¤ectson the debt component of the ETR: on the one hand, it reduces the ETR byincreasing the proportion of the cost of capital �nanced by borrowing; on theother hand it increases the ETR by reducing the value of interest paymentsdeductible from the tax base.
3 Deferred taxation and the cost of capital
As anticipated in the introduction �rms investing in the United States and inthe United Kingdom have to comply with accounting rules which prevent thedistribution to shareholders of any spare cash �ow generated by deferred taxa-tion. In particular, in any period t a �rm has to set a provision equal to the taxrate multiplied by the di¤erence between the capital allowance deductible fortax purposes and the corresponding value deductible for accounting purposes.This implies that dividend income in any period t cannot exceed the after-taxpro�t reduced by the provision. The literature on accounting constraints andcorporate tax policy assumes accounting depreciation to be equal to economicdepreciation, which would imply a period t constraint on dividend policy writ-ten as �
��KT
t � �Kt
�. We departure from this assumption and consider the
more general case in which accounting depreciation may di¤er from economicdepreciation. If we denote by � the accounting rate of depreciation and by K�
t
the outstanding value of the capital stock for accounting purposes, the deferredtax set in a generic period t, T dt ;can be written as
T dt = ���KT
t � �K�t
�; (21)
As stated by Kanniainen and Södersten (1995), the positive temporary dif-ference between the capital allowance and accounting depreciation give rise toa deferred tax liability which must be retained by the �rm rather than be dis-tributed to shareholders. In principle, the constrained liquidity should be used
14
to carry out new investment. However, this would be in con�ict with the modelassumption of a one-unit increase in capital in period t and an equal decreasestarting from t + 1. As a result, following Polito (2009), �nancial resourcesconstrained in provisions for deferred taxes represent an excess of liquidity that�rms can only invest in the capital markets. In turn, this implies that deferredtaxation generates to shareholders a cash-�ow equal to the after-tax rate ofreturn on the resources constrained in provisions for deferred taxes.There are several equivalent ways of incorporating �nancial constraints on
dividend policy into the neoclassical investment model. King (1974) andKanniainen and Södersten (1995) treat the dividend policy constraint just as anextra constraint in the maximisation problem of the �rm. Polito (2009) showsthat the �nancial constraint can also be incorporated into the neoclassical modelby opportunely modifying the identity between sources and uses of funds. Thispaper instead introduces �nancial constraints into the model by specifying thetotal tax liability of the �rm in any period t, Tt, as the sum of current anddeferred taxes. In particular, the corporate tax function can be formulated as
Tt = Tct + T
dt ; (22)
where current taxes T ct are de�ned as in equation (4), and Tdt is de�ned in (21).
This shows that a new source tax liability arises to shareholders in the form ofundistributable tax savings. The formulation of the tax function in equations(22) and (21) is essentially consistent with how �rms report their tax liability intheir accounts, hence providing a very transparent way of disclosing the impactof the constraint on dividend policy.10
We can now appraise how accounting constraints on dividend policy a¤ectthe cost of capital. In the �rst period, under the standard theory, the capitalallowance reduces the cost of capital by �� . Since accounting depreciation canbe deducted from period t = 1 onward, it follows that the entire value of the taxsaving generated by the �rst year allowance cannot be distributed to shareholderas it represents a deferred tax which has to be retained by the �rm into aprovision for deferred taxes. This implies that the cost of capital increases in tby �� , which entirely neutralises the bene�t of the initial capital allowance.In order to allow the possibility of interest income being taxed at a di¤erent
rate with respect to pro�ts, we denote with � c the rate on interests at corporatelevel. Thus resources accumulated in provisions for deferred taxes and investedby the �rm in the �nancial market earn the after tax rate of return i (1� � c).This �nancial return can be distributed to shareholders in turn contributingto the reduction of the cost of capital by i (1� � c)�� . Hence the net cost ofcapital in the presence of accounting constraints on dividend policy is given by1� i (1� � c)�� . This shows that omission of the constraint, as in the standardanalysis, has the e¤ect of understating the net cost of investment faced byshareholders. Equivalently, this shows that the bene�t of a TBI consisting ina higher �rst year capital allowance is considerably overstated by the standard
10For a detailed description of the rules for recording timing di¤erences in a company�s�nancial statement, see Alexander and Archer (2009).
15
analysis. Conversely, the negative e¤ect of a TRI through the �rst year capitalallowance is much smaller than that predicted by the standard theory.The �rm also bene�ts from the deduction of tax depreciation allowances
for t � 1. If we denote by A� = �1Ps=1
�1��1+�
�s= ��
�+� the present discounted
value of the tax saving due to accounting depreciation, then the overall presentdiscounted value of provisions for deferred taxes, �, is measured as
� = A� �A�
= ��+�� (�� �)
(�+ �) (�+ �); (23)
which shows that with � = � we still have � > 0 because of the e¤ect of the�rst year allowance.As we have seen the present discounted value of the corresponding �nancial
return distributable to shareholders generated by the investment in the �nancialmarket of these resources is given by
i (1� � c)�; (24)
Hence, equations (23) and (24) measure the impact of accounting constrainton the cost of capital: on the one hand, accounting constraints on dividendpolicy increase the cost of capital by preventing the distribution to shareholdersof any tax saving generated by capital allowances for depreciation, as measuredby � in equation (23). Since resources accumulated in provisions for deferredtaxes are invested in the �nancial market, accounting constraints on dividendpolicy generate a return in present value equal to i (1� � c)�.
4 The ETR under constrained dividend policy
4.1 Retained earnings
After incorporating the de�nitions in equations (23) and (24) into equation (8),the rent on investment �nanced by retained earnings is written as
RC;RE = � f1�A� + [1� i (1� � c)]�g+ (1� �) (p+ �) (1 + �)
1 + �+ (25)
+ (1� �) (1 + �)
1 + �f1�A� + [1� i (1� � c)]�g ;
where the subscript C denotes that dividend policy is "constrained" by theaccounting rules on deferred taxation. The above can be rearranged, using thede�nition in (8), as
RC;RE = RU;RE + [1� i (1� � c)]�
1 + �[(1� �) (1 + �)� (1 + �)]
16
The second term on the right hand side shows the overall e¤ect of the accountingconstraint on the after tax economic rent under retained earnings �nance.Assuming that interest income and capital gains are taxed with the same
rate at personal level, so that � = i, the above becomes
RC;RE = RNC;RE � [1� i (1� � c)]�
(1 + r)(r + �) ;
which shows that the accounting constraint decreases the standard measure ofthe economic rent whenever � > 0, i.e. tax depreciation exceeds accountingdepreciation.Using the de�nition in (13), the above can be written as
RC;RE = RU;RE � [1� i (1� � c)] ��
(1 + r)
A� �A�A�
;
which shows how the interplay between tax, accounting and economic deprecia-tion a¤ects the impact of accounting constraint on dividend policy on the returnfrom capital investment. We notice that in general the sign of the constraintis independent from economic depreciation as it is entirely determined by thedi¤erence between tax and accounting depreciation. It therefore follows thatRC;RE Q RU;RE if A� R A�. This results holds unless accounting depreciationequals economic depreciation, as assumed in Kanniainen and Södersten (1994,1995), in which case the above resolves to
RC;RE = RU;RE � [1� i (1� � c)] ��
(1 + r)
�A�A�
� 1�;
which implies that RC;RE Q RU;RE if A� R A�.After combining the de�nition in (25) with (12), the ETR on investment
�nanced by retained earnings in the presence of accounting constraints on divi-dend policy can be written as
ETRC;RE =R� �RC;REp= (1 + r)
= ETRU;RE + [1� i (1� � c)]� (1 + r)
(1 + �) p[(1� �) (1 + �)� (1 + �)]
(26)
which, in the special case of � = i, gives the solution
ETRC;RE = ETRU;RE + [1� i (1� � c)]�
p(r + �) ;
which shows that the ETR is higher then in the absence of constraint whenevertax depreciation exceeds accounting depreciation, � > 0.We can di¤erentiate the above with respect to p to obtain
@ETRC;RE@p
=@ETRU;RE
@p� [1� i (1� �
c)]� (r + �)
p2;
17
which shows that the sensitiveness of the ETR to investment pro�tability isoverstated by the standard literature.We can now study the impact of tax policy changes on the ETR in the
presence of accounting constraints on dividend policy. A TBI results in
@ETRC;RE@�
=@ETRU;RE
@�+ [1� i (1� � c)] (r + �)
p
@A�@�
:
Using the result in (15), the above can be written as
@ETRC;RE@�
= i (1� � c) @ETRU;RE@�
;
which shows that once accounting constraints are incorporated into the ETRthe bene�t of TBIs is signi�cantly lower than under the unconstrained model.To evaluate the e¤ect of a TRI in the presence of accounting constraints, we
di¤erentiate (26) with respect to the corporate tax rate to obtain
@ETRC;RE@�
=@ETRU;RE
@�+@
@�
�1� i
�1� � i
���(r + �)
p:
Using the result in equation (16), the above becomes
@ETRC;RE@�
=
�1 +
�
p� i
�1� � i
� (r + �)
p (r + �)�
�� [1� i (1� �
c)] (r + �) �
p (r + �);
which can be compared with the corresponding expression from the uncon-strained model in equation (16). Hence, the higher tax rate has the e¤ect of re-ducing the tax base bene�t observed in the unconstrained model by 1�i (1� � c).In addition, the term � (r+�)�
p(r+�) measures the reduction of the ETR as a resultof the fall in the value of provisions for deferred taxes generated by the highertax rate levied on accounting depreciation.The term i(1��c)(r+�)�
p(r+�) measures the increase in the ETR due to the lowervalue of �nancial resources to be invested in the �nancial market.Notice that the above can be written as
@ETRC;RE@�
=@ETRU;RE
@�+ [1� i (1� � c)] (r + �) r (�� �)
p (r + �) (r + �)
which shows that@ETRC;RE
@�R @ETRU;RE
@�
whenever � R �. In other words, omission of the accounting constraint bringsmisleading policy assessment of the impact of TRIs on the e¤ective tax burdenon income from capital.Two special cases are worth considering. First, if accounting depreciation
equals economic depreciation, � = � the above reduces to
@ETRC;RE@�
=
�1 +
�
p� i (1� � c) (r + �)
p (r + �)�
�� [1� i (1� �
c)] �
p
=
�1 + i (1� � c) �
p� i (1� � c) (r + �)
p (r + �)�
�;
18
which shows that the higher corporate tax rate has also a lower impact on thegross return of the investment.Second, if � = � and the after tax return from �nancial investment is negli-
gible, i.e. i (1� � c) ' 0, it follows that the above derivative equals : in otherwords, there is no tax base e¤ect from a TRI.
4.2 New equity
When investment is �nanced by new equity, in the �rst period, the �rm sets aprovision for deferred taxes of ��. Recall that accounting depreciation can onlybe deducted from period t = 1 onward. Hence, in the �rst period the �rm has toset a provision for deferred taxes equal to the tax rate multiplied by the entire�rst period capital allowance. This will earn a �nancial return of i (1� � c) ��.Hence, the economic rent on investment �nanced by new equity becomes underaccounting constraints
RC;NE = RC;RE �� (1� )
�1� i
�1� � i
����
1 + �:
Using the de�nition in equation (25), the above can be written as
RC;NE = RU;NE� [1� i (1� � c)]�
1 + �[(1� �) (1 + �)� (1 + �)]�� (1� ) [1� i (1� �
c)] ��
1 + �;
which shows that accounting constraints on dividend policy add two e¤ects onthe return from investment �nanced by new equity in (10), measured by the lasttwo terns on the right hand side of the above. The former term measures thereduction of the overall return due to the impact of the accounting constraint onthe retained earning component of RC;NE . The last term measures the e¤ectof the accounting constraint on the new equity component of the return: inparticular, this term is negative (positive) whenever dividend income is taxedmore (less), < 1 ( > 1), than capital gains. Consequently, the ETR forinvestment �nanced with new equity becomes
ETRC;NE =R� �RC;NEp= (1 + r)
= ETRC;RE + �(1� )
�1� i
�1� � i
����(1 + r)
(1 + �) p; (27)
where the last term on the right hand side discloses the e¤ect of the accountingconstraint on the ETR when investment is �nanced by new equity relative tothe case of retained earnings. It follows that
ETRC;NE R ETRU;NE
if � > �, which shows that after considering accounting constraints on dividendpolicy the ETR is higher than predicted by the standard theory.
19

We can study how the ETR for investment �nanced by new equity changesfollowing an increase in investment pro�tability by di¤erentiating (27) withrespect to p to obtain
@ETRC;NE@p
=@ETRC;RE
@p� �
(1� )�1� i
�1� � i
����(1 + r)
(1 + �) p2:
Notice that@ETRC;NE
@pQ @ETRU;RE
@pwhen� R �;
which shows that the sensitiveness of the ETR to a change in corporate pro�tsis overstated by the omission of the accounting constraint.To appraise the e¤ect of a TBI, we di¤erentiate equation (27) with respect
to the rate of tax depreciation to obtain
@ETRC;NE@�
=@ETRC;RE
@�� � (1� ) (1 + r) [i (1� �
c) � ]
(1 + �) p:
Using the result in (18), the above becomes
@ETRC;NE@�
= i (1� � c) @ETRU;RE@�
;
which shows that TBIs have a signi�cantly smaller impact on the ETR even inthe case of new equity �nance.The e¤ect of a TRI is studied by evaluating the derivative of (27) with
respect to the tax rate, given by
@ETRC;NE@�
=@ETRC;RE
@�� � (1� ) (1 + r) [i (1� �
c)�]
(1 + �) p:
The above can also be written as
@ETRC;NE@�
=@ETRU;NE
@�+ [1� i (1� � c)] (r + �) r (�� �)
p (r + �) (r + �)+
+ �(1� ) (1 + r) [1� i (1� � c)]�
(1 + �) p:
Note that if dividend income is not taxed less of capital gains, � 1, then@ETRC;NE
@� R @ETRU;NE
@� as long as � R �, which imply that a TRI is moree¤ective than under the unconstrained model. The e¤ect is however ambiguouswhen dividend income is taxed less than capital gains, > 1.
4.3 Debt �nance
Under debt �nance the �rm borrows in the �rst period all resources necessaryto purchase the capital stock net of the �rst period capital allowance. However,the saving generated by tax allowance cannot be distributed to shareholders, asthe �rm sets a provision for deferred taxes of ��. The provision will therefore
20

generate an after tax �nancial return of i (1� � c) ��. This implies that thenet amount borrowed under the accounting constraint to purchase one unit ofcapital is given by
1� i�1� � i
���;
and, consequently, the ETR on investment �nanced by debt can be formulatedas
ETRC;B = ETRC;RE � [1� i (1� � c) ��] [�� i (1� �)] (1 + r)
(1 + �) p; (28)
which is generally lower than under retained earnings. We can now measure thesensitiveness of the ETRC;B to an increase in pro�tability by
@ETRC;B@p
=@ETRC;RE
@p+ [1� i (1� � c) ��] [�� i (1� �)] (1 + r)
(1 + �) p2
or equivalently by
@ETRC;B@p
=@ETRU;B
@p� [1� i (1� �
c)]� (1 + r)
(1 + �) p2[(1� �) (1 + �)� (1 + �)]
+ �� [1� i (1� � c)] [�� i (1� �)] (1 + r)
(1 + �) p2:
Hence an increase in investment pro�tability under accounting constraints ondividend policy adds two e¤ects to the ETR measured for debt �nance in theunconstrained model. First, the higher pro�tability reduces the net burdenof the undistributed dividend income due to the presence of the accountingconstraint, which in turn reduces the ETR. Second, the higher pro�tabilityreduces the bene�t from debt �nance under the accounting constraint, in turnincreasing the ETR.The impact of a TBI on the ETR in equation (28) is measured by
@ETRC;B@�
=@ETRC;RE
@�+@
@�
[i (1� � c) � ] [�� i (1� �)] (1 + r)(1 + �) p
:
Using (20), the above becomes
@ETRC;B@�
= i (1� � c) @ETRU;B@�
which shows that - as for retained earnings and new equity �nance - the omissionof the accounting constraint signi�cantly overstates the e¤ect of TBIs on theETR when investment is �nanced by debt. Finally, a change in the corporateincome tax rate gives
@ETRC;B@�
=@ETRC;RE
@�+ (1 + r) [i (1� � c)�] [�� i (1� �)]
(1 + �) p
� [1� i (1� �c) ��] i (1 + r)
(1 + �) p;
21
which shows that the higher tax rate has two further e¤ects on the ETR underdebt �nance relative to the retained earnings case. First, the higher tax rateincreases the tax burden on the �nancial investment of resources accumulated inprovisions for deferred taxes, in turn increasing the ETR. On the other hand, thehigher tax rate increases the tax saving from the deduction of interest paymentsfrom the tax base, hence reducing the ETR.
5 Data
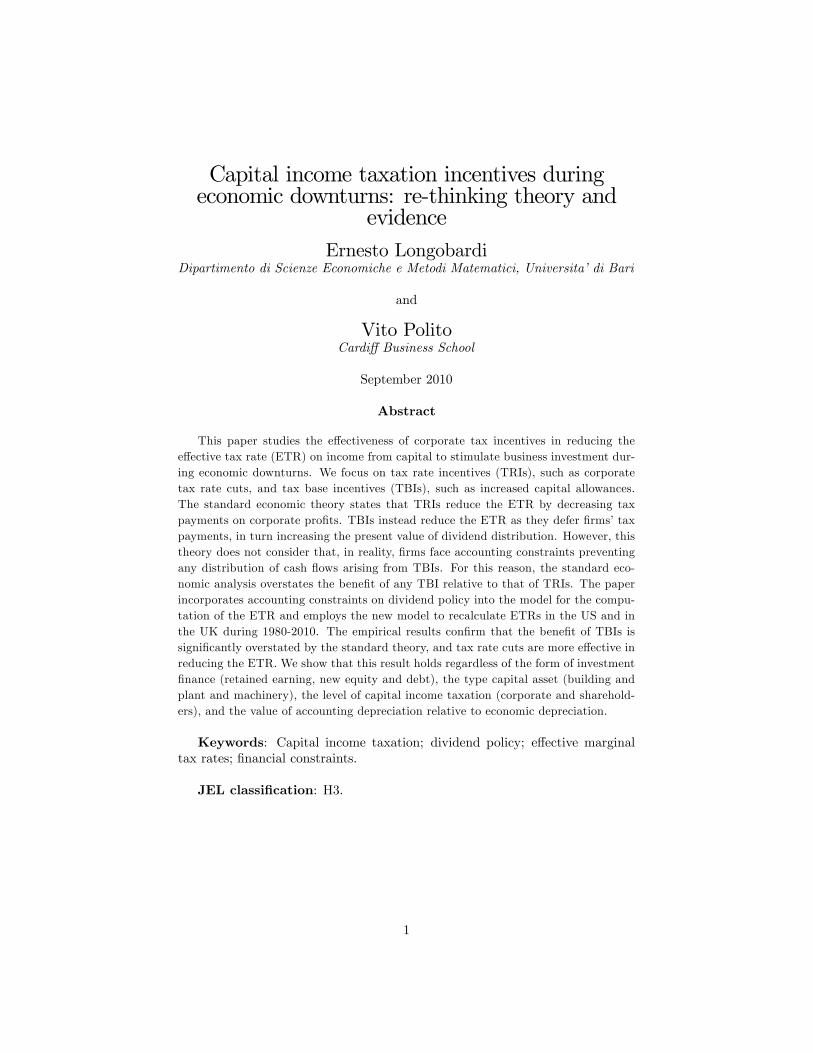
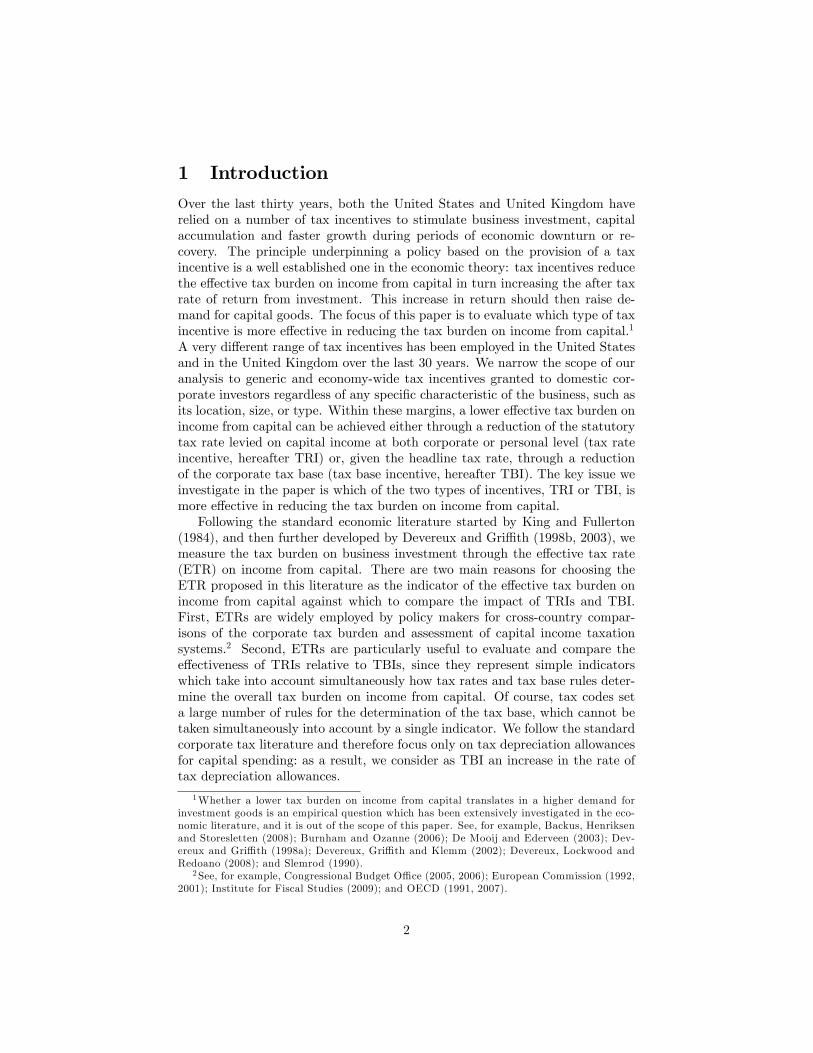
Figures 1 and 2 provide a picture of how taxation of income from capital haschanged in the United States and in the United Kingdom respectively dur-ing periods of economic recession, or immediately after, over the last thirtyyears.11 Each �gure reports the headline corporate tax rate (CIT); top mar-ginal individual tax rates levied on dividend income (PIT+CIT) and capitalgains (CGT+CIT); and the net present value of tax depreciation allowancesgranted on one unit of investment in either plant and machinery or industrialbuildings, denoted with NPV(PM) and NPV(IB) respectively.12 Shaded areasdenote years of economic recession, which occurred in both countries in theearly 1980s, the early 1990 and during the period 2007-2009, and in the UnitedStates alone following the collapse of the speculative dot-com bubble in the early2000s.13
To understand changes in taxation of income from capital occurred during,or following, years of economic recession in the United States and the UnitedKingdom, it is essential to bear in mind that tax reforms in both countries havebeen characterised by two well known trends, which are clearly visible in Figures1 and 2: the steady reduction of tax rates at both corporate and personal level,and the broadening of the corporate tax base brought about by the decline oftax depreciation allowances for capital spending.If we now focus on speci�c tax changes during recessions in the United States,
we observe that the early 1980s and 2000s periods are characterised by high taxdepreciation allowances for investment in plant and machinery, increasing taxdepreciation allowances for investment in industrial buildings, and declining taxrates on dividend income and capital gains. No signi�cant changes in the corpo-rate tax system occurred in response to the early 1990s period, since tax rateson corporate and dividend income had been already considerably reduced by
11Full details of all tax data employed in this paper are provided in the Annex at the endof the paper.12PIT+CIT and CGT+CIT are measured taking into account tax rates levied on dividend
and capital gains at both corporate and personal level, and any form of relief granted to reducethe e¤ect of double taxation.13Recessions are measured by considering time periods elapsing between the start of a
peak and the end of a trough in the 1979-2010 time series of the output gap (measured asthe percentage deviation of actual real GDP from HP trend GDP) taken from Datastreamfor both countries. As a result, recessions are identi�ed over the periods 1978Q4-1980Q3,1981Q1-1982Q4, 1990Q1-1991Q4, 2000Q2-2001Q4 and 2007Q3-2009Q2 for the United States;and over the periods 1979Q2-1981Q2, 1988Q4-1992Q2, and 2008Q1-2009Q3 for the UnitedKingdom.
22
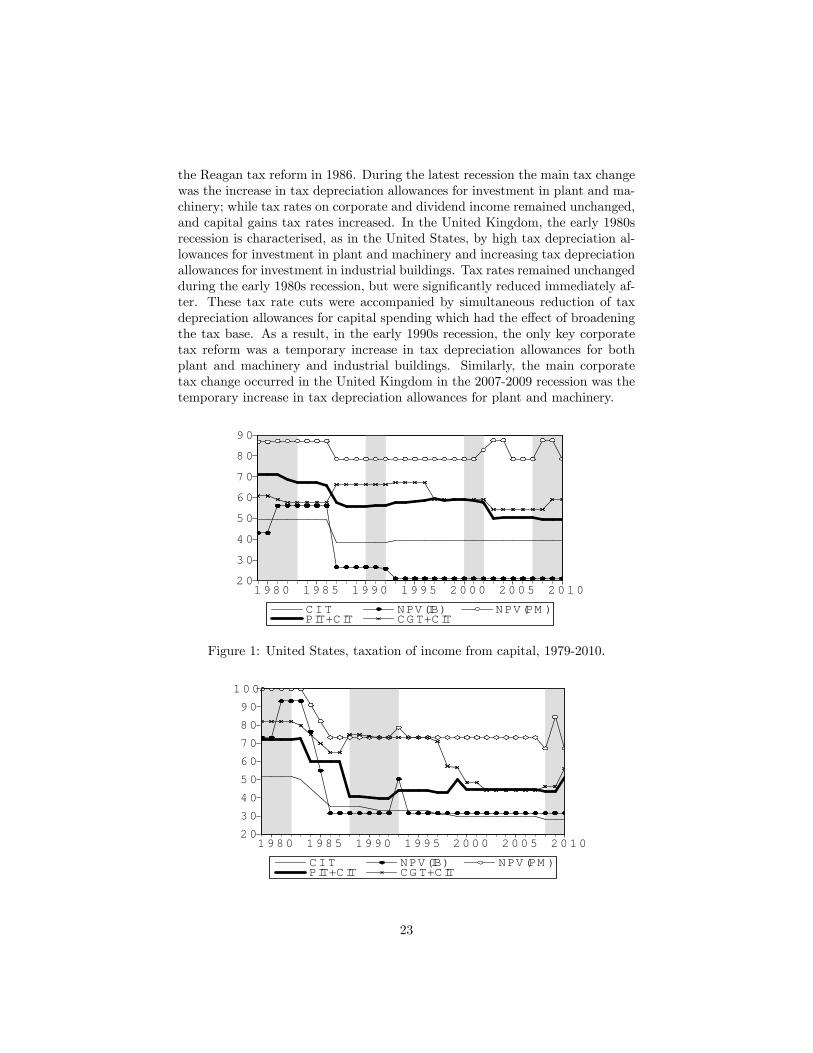
the Reagan tax reform in 1986. During the latest recession the main tax changewas the increase in tax depreciation allowances for investment in plant and ma-chinery; while tax rates on corporate and dividend income remained unchanged,and capital gains tax rates increased. In the United Kingdom, the early 1980srecession is characterised, as in the United States, by high tax depreciation al-lowances for investment in plant and machinery and increasing tax depreciationallowances for investment in industrial buildings. Tax rates remained unchangedduring the early 1980s recession, but were signi�cantly reduced immediately af-ter. These tax rate cuts were accompanied by simultaneous reduction of taxdepreciation allowances for capital spending which had the e¤ect of broadeningthe tax base. As a result, in the early 1990s recession, the only key corporatetax reform was a temporary increase in tax depreciation allowances for bothplant and machinery and industrial buildings. Similarly, the main corporatetax change occurred in the United Kingdom in the 2007-2009 recession was thetemporary increase in tax depreciation allowances for plant and machinery.
2 0
3 0
4 0
5 0
6 0
7 0
8 0
9 0
1 9 8 0 1 9 8 5 1 9 9 0 1 9 9 5 2 0 0 0 2 0 0 5 2 0 1 0
C I T NPV(IB) NPV(PM )PIT+CIT CG T+CIT
Figure 1: United States, taxation of income from capital, 1979-2010.
2 0
3 0
4 0
5 0
6 0
7 0
8 0
9 0
1 0 0
1 9 8 0 1 9 8 5 1 9 9 0 1 9 9 5 2 0 0 0 2 0 0 5 2 0 1 0
C I T NPV(IB) NPV(PM )PIT+CIT CG T+CIT
23
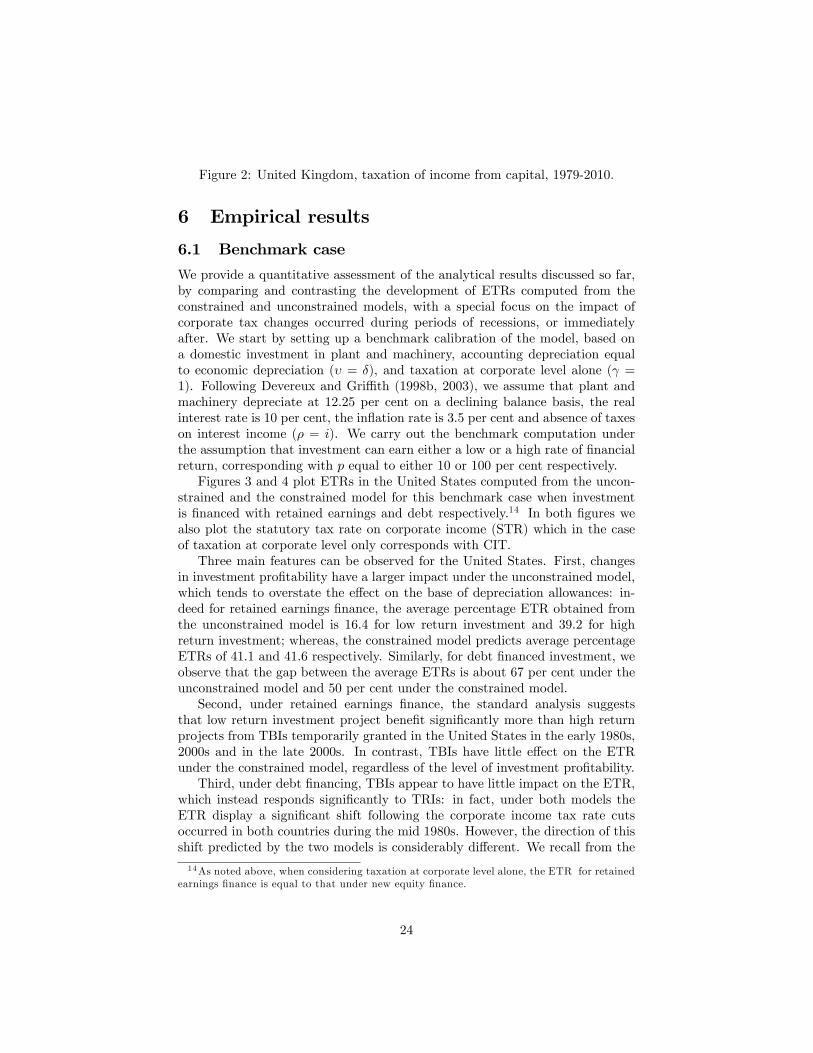
Figure 2: United Kingdom, taxation of income from capital, 1979-2010.
6 Empirical results
6.1 Benchmark case
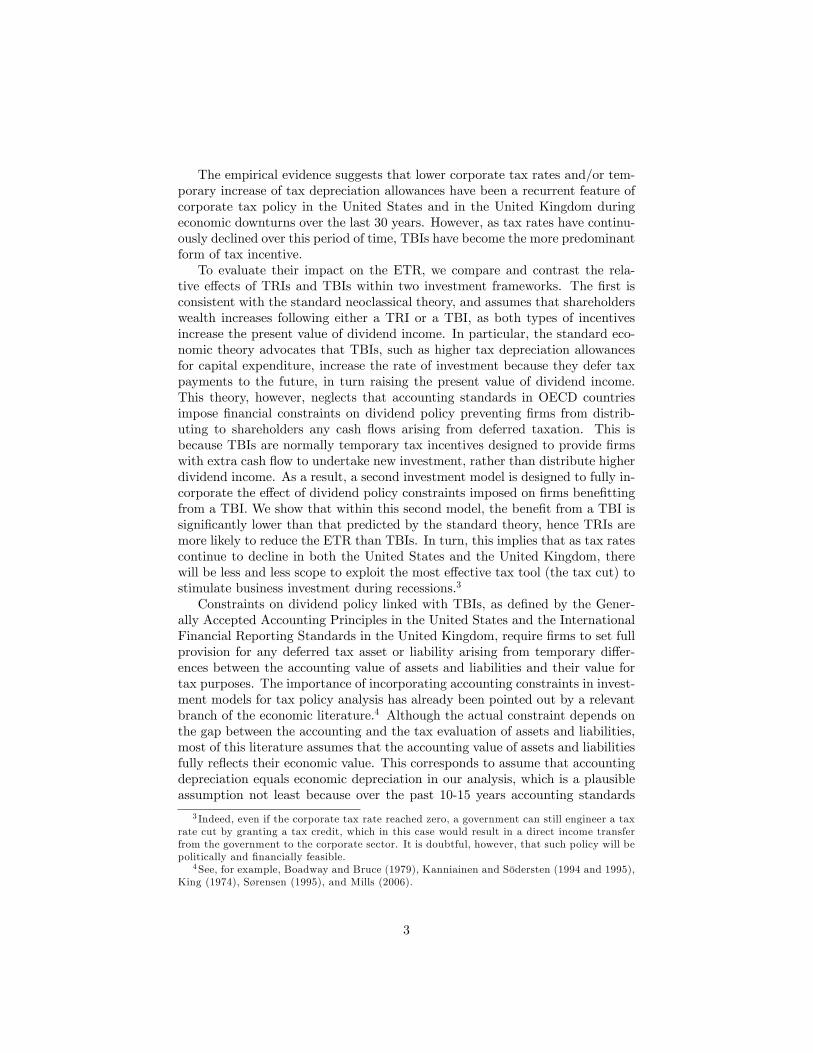
We provide a quantitative assessment of the analytical results discussed so far,by comparing and contrasting the development of ETRs computed from theconstrained and unconstrained models, with a special focus on the impact ofcorporate tax changes occurred during periods of recessions, or immediatelyafter. We start by setting up a benchmark calibration of the model, based ona domestic investment in plant and machinery, accounting depreciation equalto economic depreciation (� = �), and taxation at corporate level alone ( =1). Following Devereux and Gri¢ th (1998b, 2003), we assume that plant andmachinery depreciate at 12.25 per cent on a declining balance basis, the realinterest rate is 10 per cent, the in�ation rate is 3.5 per cent and absence of taxeson interest income (� = i). We carry out the benchmark computation underthe assumption that investment can earn either a low or a high rate of �nancialreturn, corresponding with p equal to either 10 or 100 per cent respectively.Figures 3 and 4 plot ETRs in the United States computed from the uncon-
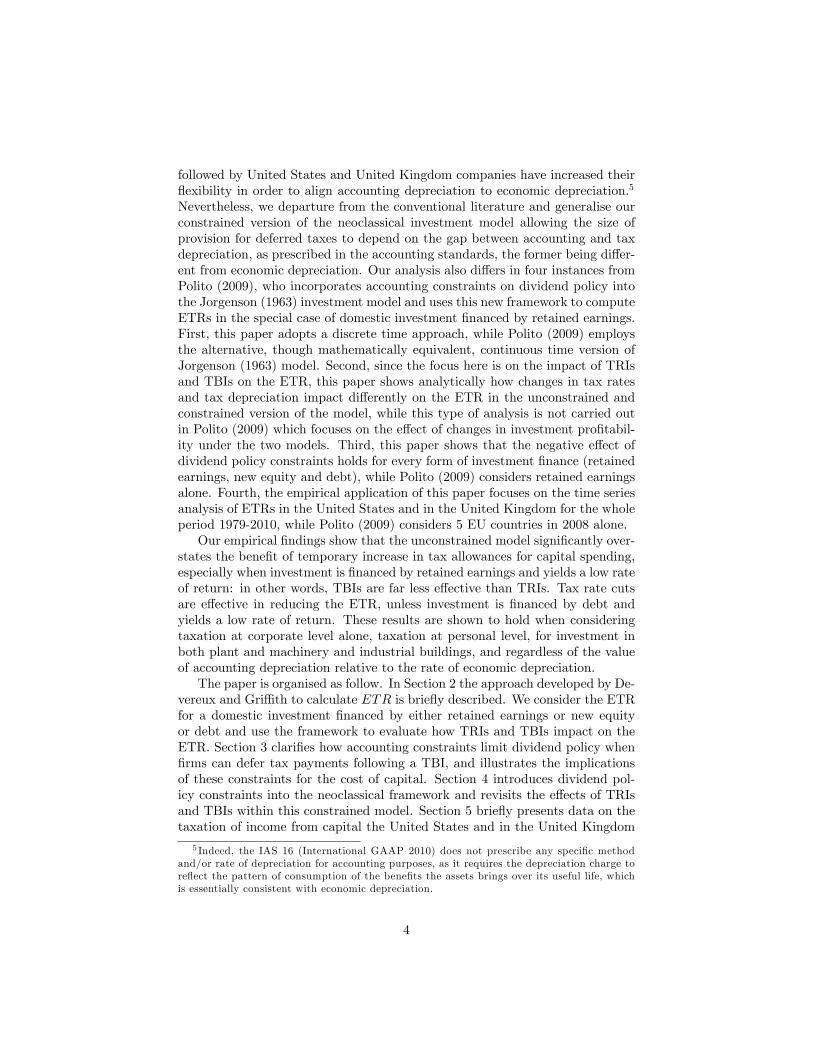
strained and the constrained model for this benchmark case when investmentis �nanced with retained earnings and debt respectively.14 In both �gures wealso plot the statutory tax rate on corporate income (STR) which in the caseof taxation at corporate level only corresponds with CIT.Three main features can be observed for the United States. First, changes
in investment pro�tability have a larger impact under the unconstrained model,which tends to overstate the e¤ect on the base of depreciation allowances: in-deed for retained earnings �nance, the average percentage ETR obtained fromthe unconstrained model is 16.4 for low return investment and 39.2 for highreturn investment; whereas, the constrained model predicts average percentageETRs of 41.1 and 41.6 respectively. Similarly, for debt �nanced investment, weobserve that the gap between the average ETRs is about 67 per cent under theunconstrained model and 50 per cent under the constrained model.Second, under retained earnings �nance, the standard analysis suggests
that low return investment project bene�t signi�cantly more than high returnprojects from TBIs temporarily granted in the United States in the early 1980s,2000s and in the late 2000s. In contrast, TBIs have little e¤ect on the ETRunder the constrained model, regardless of the level of investment pro�tability.Third, under debt �nancing, TBIs appear to have little impact on the ETR,
which instead responds signi�cantly to TRIs: in fact, under both models theETR display a signi�cant shift following the corporate income tax rate cutsoccurred in both countries during the mid 1980s. However, the direction of thisshift predicted by the two models is considerably di¤erent. We recall from the
14As noted above, when considering taxation at corporate level alone, the ETR for retainedearnings �nance is equal to that under new equity �nance.
24
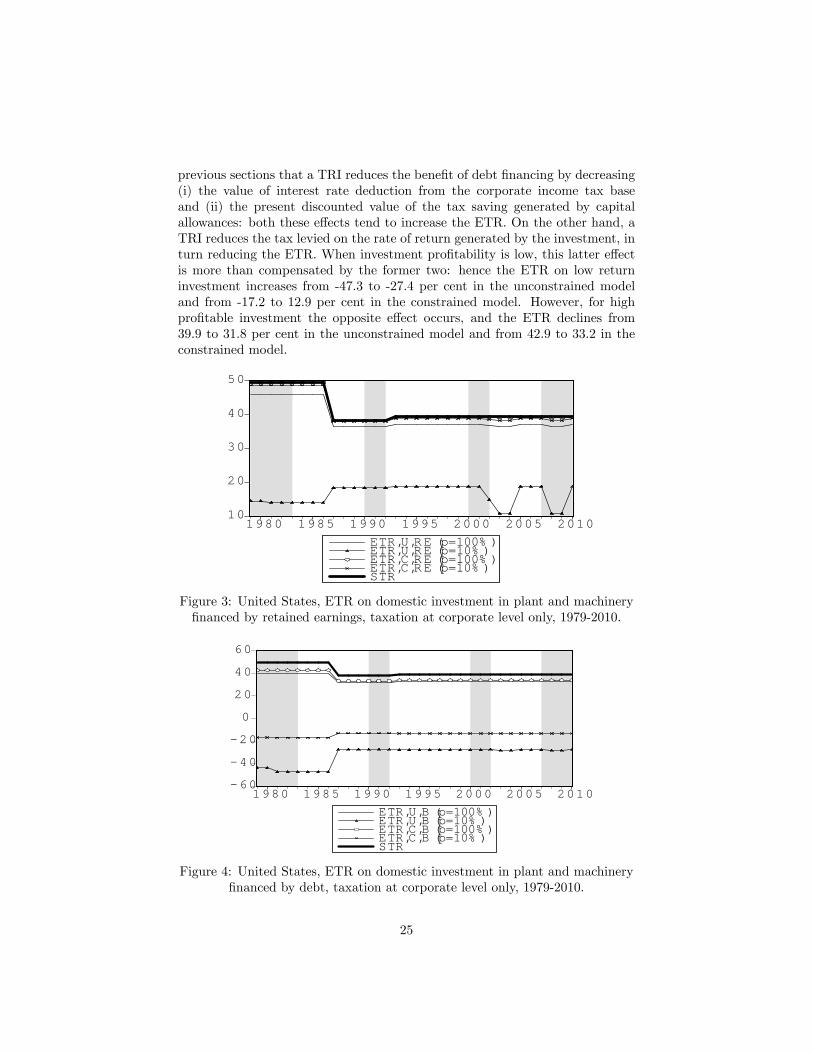
previous sections that a TRI reduces the bene�t of debt �nancing by decreasing(i) the value of interest rate deduction from the corporate income tax baseand (ii) the present discounted value of the tax saving generated by capitalallowances: both these e¤ects tend to increase the ETR. On the other hand, aTRI reduces the tax levied on the rate of return generated by the investment, inturn reducing the ETR. When investment pro�tability is low, this latter e¤ectis more than compensated by the former two: hence the ETR on low returninvestment increases from -47.3 to -27.4 per cent in the unconstrained modeland from -17.2 to 12.9 per cent in the constrained model. However, for highpro�table investment the opposite e¤ect occurs, and the ETR declines from39.9 to 31.8 per cent in the unconstrained model and from 42.9 to 33.2 in theconstrained model.
10
20
30
40
50
1980 1985 1990 1995 2000 2005 2010ETR,U,RE (p=100% )ETR,U,RE (p=10% )ETR,C,RE (p=100% )ETR,C,RE (p=10% )STR
Figure 3: United States, ETR on domestic investment in plant and machinery�nanced by retained earnings, taxation at corporate level only, 1979-2010.
60
40
20
0
20
40
60
1980 1985 1990 1995 2000 2005 2010ETR,U,B (p=100% )ETR,U,B (p=10% )ETR,C,B (p=100% )ETR,C,B (p=10% )STR
Figure 4: United States, ETR on domestic investment in plant and machinery�nanced by debt, taxation at corporate level only, 1979-2010.
25
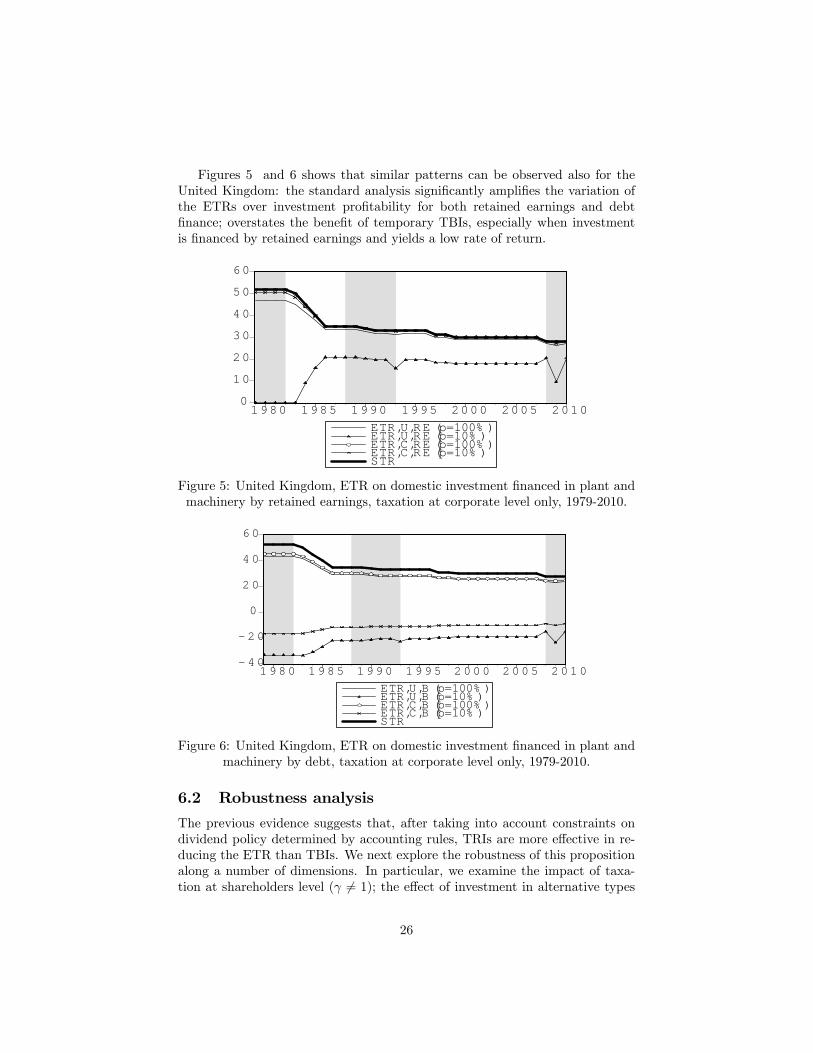
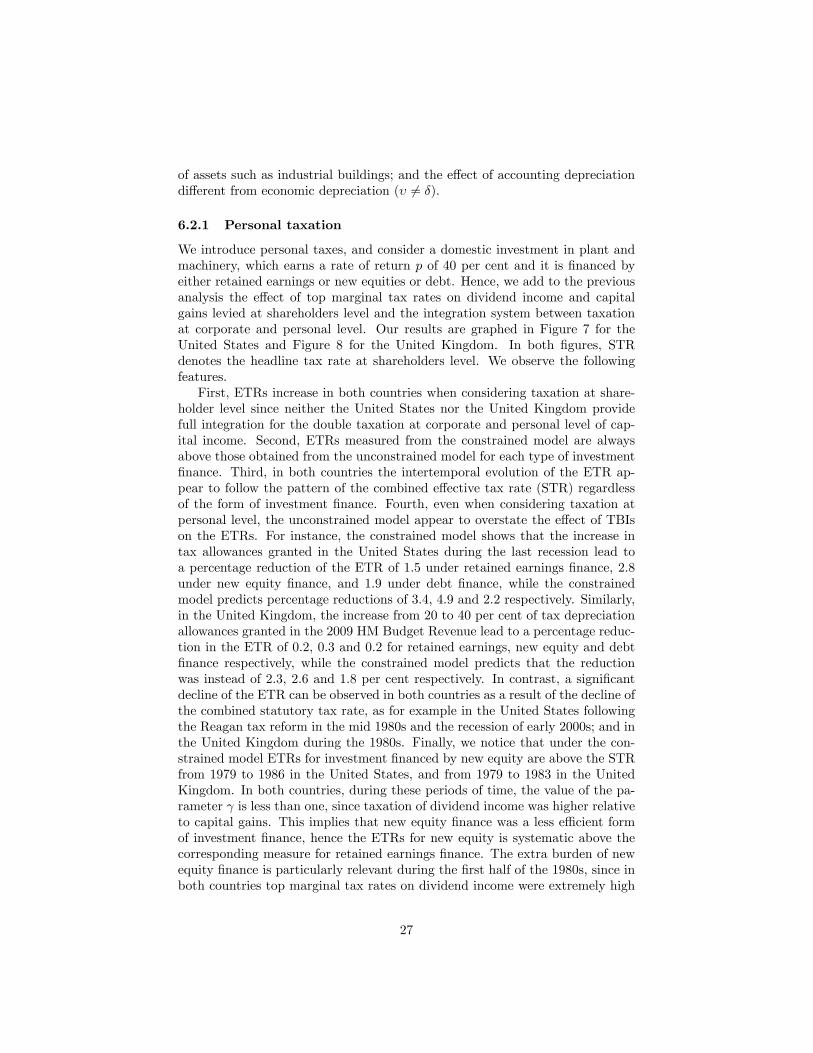
Figures 5 and 6 shows that similar patterns can be observed also for theUnited Kingdom: the standard analysis signi�cantly ampli�es the variation ofthe ETRs over investment pro�tability for both retained earnings and debt�nance; overstates the bene�t of temporary TBIs, especially when investmentis �nanced by retained earnings and yields a low rate of return.
0
10
20
30
40
50
60
1980 1985 1990 1995 2000 2005 2010ETR,U,RE (p=100% )ETR,U,RE (p=10% )ETR,C,RE (p=100% )ETR,C,RE (p=10% )STR
Figure 5: United Kingdom, ETR on domestic investment �nanced in plant andmachinery by retained earnings, taxation at corporate level only, 1979-2010.
4 0
2 0
0
2 0
4 0
6 0
1 9 8 0 1 9 8 5 1 9 9 0 1 9 9 5 2 0 0 0 2 0 0 5 2 0 1 0ETR,U,B (p=100% )ETR,U,B (p=10% )ETR,C,B (p=100% )ETR,C,B (p=10% )STR
Figure 6: United Kingdom, ETR on domestic investment �nanced in plant andmachinery by debt, taxation at corporate level only, 1979-2010.
6.2 Robustness analysis
The previous evidence suggests that, after taking into account constraints ondividend policy determined by accounting rules, TRIs are more e¤ective in re-ducing the ETR than TBIs. We next explore the robustness of this propositionalong a number of dimensions. In particular, we examine the impact of taxa-tion at shareholders level ( 6= 1); the e¤ect of investment in alternative types
26
of assets such as industrial buildings; and the e¤ect of accounting depreciationdi¤erent from economic depreciation (� 6= �).
6.2.1 Personal taxation
We introduce personal taxes, and consider a domestic investment in plant andmachinery, which earns a rate of return p of 40 per cent and it is �nanced byeither retained earnings or new equities or debt. Hence, we add to the previousanalysis the e¤ect of top marginal tax rates on dividend income and capitalgains levied at shareholders level and the integration system between taxationat corporate and personal level. Our results are graphed in Figure 7 for theUnited States and Figure 8 for the United Kingdom. In both �gures, STRdenotes the headline tax rate at shareholders level. We observe the followingfeatures.First, ETRs increase in both countries when considering taxation at share-
holder level since neither the United States nor the United Kingdom providefull integration for the double taxation at corporate and personal level of cap-ital income. Second, ETRs measured from the constrained model are alwaysabove those obtained from the unconstrained model for each type of investment�nance. Third, in both countries the intertemporal evolution of the ETR ap-pear to follow the pattern of the combined e¤ective tax rate (STR) regardlessof the form of investment �nance. Fourth, even when considering taxation atpersonal level, the unconstrained model appear to overstate the e¤ect of TBIson the ETRs. For instance, the constrained model shows that the increase intax allowances granted in the United States during the last recession lead toa percentage reduction of the ETR of 1.5 under retained earnings �nance, 2.8under new equity �nance, and 1.9 under debt �nance, while the constrainedmodel predicts percentage reductions of 3.4, 4.9 and 2.2 respectively. Similarly,in the United Kingdom, the increase from 20 to 40 per cent of tax depreciationallowances granted in the 2009 HM Budget Revenue lead to a percentage reduc-tion in the ETR of 0.2, 0.3 and 0.2 for retained earnings, new equity and debt�nance respectively, while the constrained model predicts that the reductionwas instead of 2.3, 2.6 and 1.8 per cent respectively. In contrast, a signi�cantdecline of the ETR can be observed in both countries as a result of the decline ofthe combined statutory tax rate, as for example in the United States followingthe Reagan tax reform in the mid 1980s and the recession of early 2000s; and inthe United Kingdom during the 1980s. Finally, we notice that under the con-strained model ETRs for investment �nanced by new equity are above the STRfrom 1979 to 1986 in the United States, and from 1979 to 1983 in the UnitedKingdom. In both countries, during these periods of time, the value of the pa-rameter is less than one, since taxation of dividend income was higher relativeto capital gains. This implies that new equity �nance was a less e¢ cient formof investment �nance, hence the ETRs for new equity is systematic above thecorresponding measure for retained earnings �nance. The extra burden of newequity �nance is particularly relevant during the �rst half of the 1980s, since inboth countries top marginal tax rates on dividend income were extremely high
27
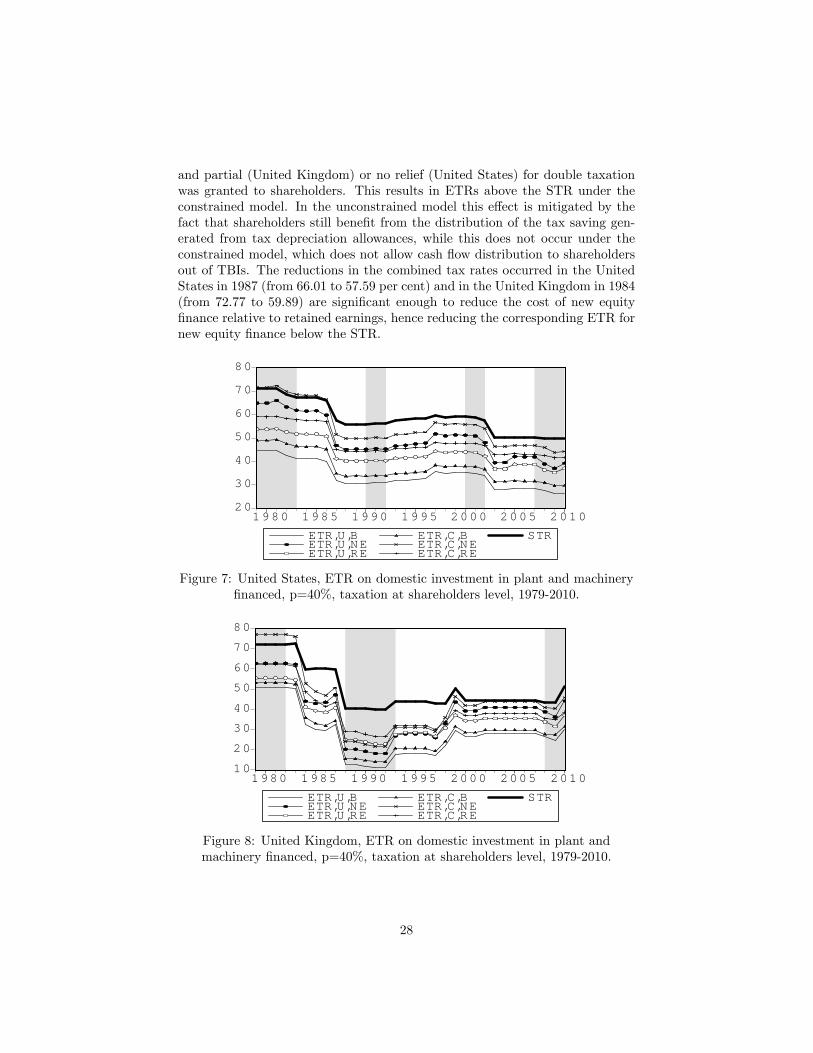
and partial (United Kingdom) or no relief (United States) for double taxationwas granted to shareholders. This results in ETRs above the STR under theconstrained model. In the unconstrained model this e¤ect is mitigated by thefact that shareholders still bene�t from the distribution of the tax saving gen-erated from tax depreciation allowances, while this does not occur under theconstrained model, which does not allow cash �ow distribution to shareholdersout of TBIs. The reductions in the combined tax rates occurred in the UnitedStates in 1987 (from 66.01 to 57.59 per cent) and in the United Kingdom in 1984(from 72.77 to 59.89) are signi�cant enough to reduce the cost of new equity�nance relative to retained earnings, hence reducing the corresponding ETR fornew equity �nance below the STR.
20
30
40
50
60
70
80
1980 1985 1990 1995 2000 2005 2010
ETR,U,BETR,U,NEETR,U,RE
ETR,C,BETR,C,NEETR,C,RE
STR
Figure 7: United States, ETR on domestic investment in plant and machinery�nanced, p=40%, taxation at shareholders level, 1979-2010.
10
20
30
40
50
60
70
80
1980 1985 1990 1995 2000 2005 2010
ETR,U,BETR,U,NEETR,U,RE
ETR,C,BETR,C,NEETR,C,RE
STR
Figure 8: United Kingdom, ETR on domestic investment in plant andmachinery �nanced, p=40%, taxation at shareholders level, 1979-2010.
28
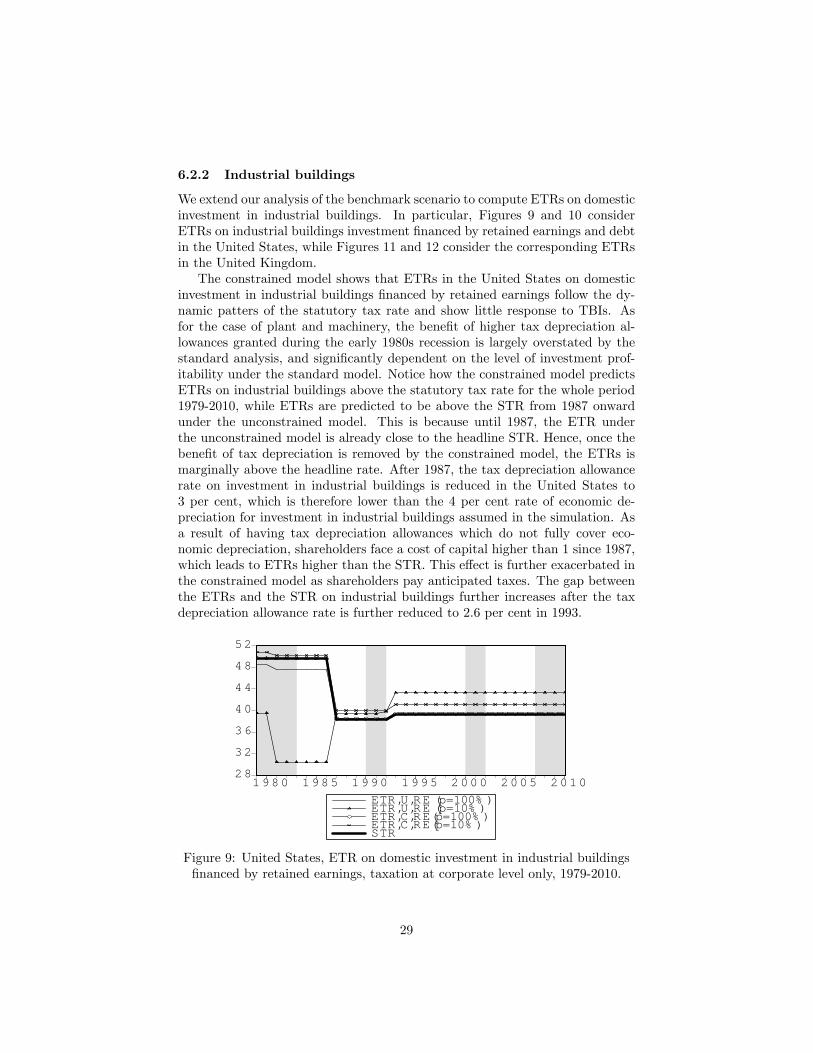
6.2.2 Industrial buildings
We extend our analysis of the benchmark scenario to compute ETRs on domesticinvestment in industrial buildings. In particular, Figures 9 and 10 considerETRs on industrial buildings investment �nanced by retained earnings and debtin the United States, while Figures 11 and 12 consider the corresponding ETRsin the United Kingdom.The constrained model shows that ETRs in the United States on domestic
investment in industrial buildings �nanced by retained earnings follow the dy-namic patters of the statutory tax rate and show little response to TBIs. Asfor the case of plant and machinery, the bene�t of higher tax depreciation al-lowances granted during the early 1980s recession is largely overstated by thestandard analysis, and signi�cantly dependent on the level of investment prof-itability under the standard model. Notice how the constrained model predictsETRs on industrial buildings above the statutory tax rate for the whole period1979-2010, while ETRs are predicted to be above the STR from 1987 onwardunder the unconstrained model. This is because until 1987, the ETR underthe unconstrained model is already close to the headline STR. Hence, once thebene�t of tax depreciation is removed by the constrained model, the ETRs ismarginally above the headline rate. After 1987, the tax depreciation allowancerate on investment in industrial buildings is reduced in the United States to3 per cent, which is therefore lower than the 4 per cent rate of economic de-preciation for investment in industrial buildings assumed in the simulation. Asa result of having tax depreciation allowances which do not fully cover eco-nomic depreciation, shareholders face a cost of capital higher than 1 since 1987,which leads to ETRs higher than the STR. This e¤ect is further exacerbated inthe constrained model as shareholders pay anticipated taxes. The gap betweenthe ETRs and the STR on industrial buildings further increases after the taxdepreciation allowance rate is further reduced to 2.6 per cent in 1993.
28
32
36
40
44
48
52
1980 1985 1990 1995 2000 2005 2010ETR,U,RE (p=100% )ETR,U,RE (p=10% )ETR,C,RE(p=100% )ETR,C,RE(p=10% )STR
Figure 9: United States, ETR on domestic investment in industrial buildings�nanced by retained earnings, taxation at corporate level only, 1979-2010.
29
4 0
2 0
0
2 0
4 0
6 0
1 9 8 0 1 9 8 5 1 9 9 0 1 9 9 5 2 0 0 0 2 0 0 5 2 0 1 0ETR,U,B (p=100% )ETR,U,B (p=10% )ETR,C,B (p=100% )ETR,C,B (p=10% )STR
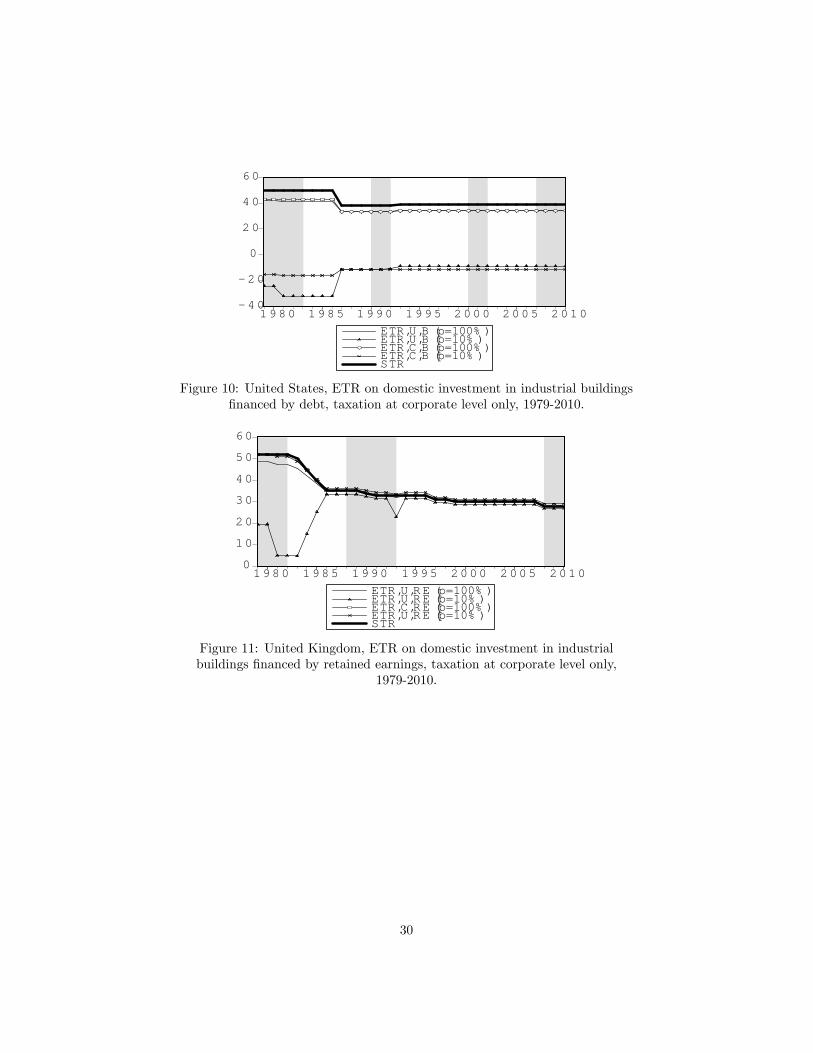
Figure 10: United States, ETR on domestic investment in industrial buildings�nanced by debt, taxation at corporate level only, 1979-2010.
0
10
20
30
40
50
60
1980 1985 1990 1995 2000 2005 2010ETR,U,RE (p=100% )ETR,U,RE (p=10% )ETR,C,RE (p=100% )ETR,U,RE (p=10% )STR
Figure 11: United Kingdom, ETR on domestic investment in industrialbuildings �nanced by retained earnings, taxation at corporate level only,
1979-2010.
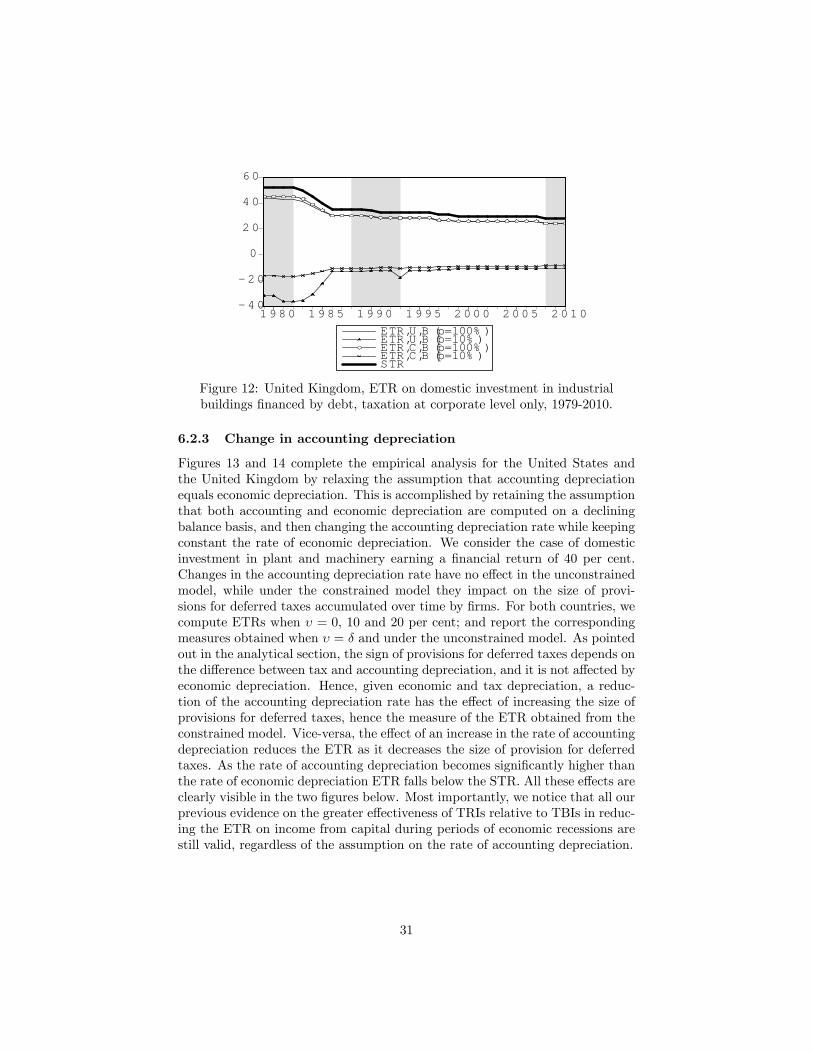
30
4 0
2 0
0
2 0
4 0
6 0
1 9 8 0 1 9 8 5 1 9 9 0 1 9 9 5 2 0 0 0 2 0 0 5 2 0 1 0ETR,U,B (p=100% )ETR,U,B (p=10% )ETR,C,B (p=100% )ETR,C,B (p=10% )STR
Figure 12: United Kingdom, ETR on domestic investment in industrialbuildings �nanced by debt, taxation at corporate level only, 1979-2010.
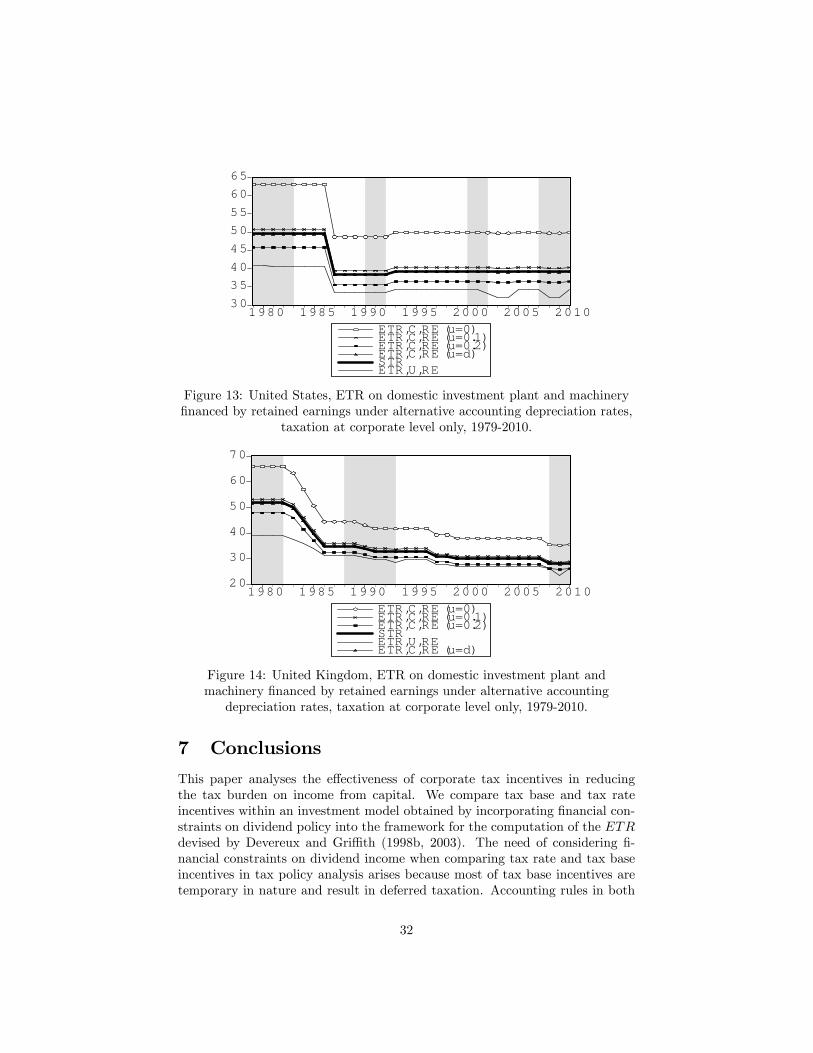
6.2.3 Change in accounting depreciation
Figures 13 and 14 complete the empirical analysis for the United States andthe United Kingdom by relaxing the assumption that accounting depreciationequals economic depreciation. This is accomplished by retaining the assumptionthat both accounting and economic depreciation are computed on a decliningbalance basis, and then changing the accounting depreciation rate while keepingconstant the rate of economic depreciation. We consider the case of domesticinvestment in plant and machinery earning a �nancial return of 40 per cent.Changes in the accounting depreciation rate have no e¤ect in the unconstrainedmodel, while under the constrained model they impact on the size of provi-sions for deferred taxes accumulated over time by �rms. For both countries, wecompute ETRs when � = 0, 10 and 20 per cent; and report the correspondingmeasures obtained when � = � and under the unconstrained model. As pointedout in the analytical section, the sign of provisions for deferred taxes depends onthe di¤erence between tax and accounting depreciation, and it is not a¤ected byeconomic depreciation. Hence, given economic and tax depreciation, a reduc-tion of the accounting depreciation rate has the e¤ect of increasing the size ofprovisions for deferred taxes, hence the measure of the ETR obtained from theconstrained model. Vice-versa, the e¤ect of an increase in the rate of accountingdepreciation reduces the ETR as it decreases the size of provision for deferredtaxes. As the rate of accounting depreciation becomes signi�cantly higher thanthe rate of economic depreciation ETR falls below the STR. All these e¤ects areclearly visible in the two �gures below. Most importantly, we notice that all ourprevious evidence on the greater e¤ectiveness of TRIs relative to TBIs in reduc-ing the ETR on income from capital during periods of economic recessions arestill valid, regardless of the assumption on the rate of accounting depreciation.
31
30
3540
45
5055
6065
1980 1985 1990 1995 2000 2005 2010ETR,C,RE (u=0)ETR,C,RE (u=0.1)ETR,C,RE (u=0.2)ETR,C,RE (u=d)STRETR,U,RE
Figure 13: United States, ETR on domestic investment plant and machinery�nanced by retained earnings under alternative accounting depreciation rates,
taxation at corporate level only, 1979-2010.
20
30
40
50
60
70
1980 1985 1990 1995 2000 2005 2010ETR,C,RE (u=0)ETR,C,RE (u=0.1)ETR,C,RE (u=0.2)STRETR,U,REETR,C,RE (u=d)
Figure 14: United Kingdom, ETR on domestic investment plant andmachinery �nanced by retained earnings under alternative accounting
depreciation rates, taxation at corporate level only, 1979-2010.
7 Conclusions
This paper analyses the e¤ectiveness of corporate tax incentives in reducingthe tax burden on income from capital. We compare tax base and tax rateincentives within an investment model obtained by incorporating �nancial con-straints on dividend policy into the framework for the computation of the ETRdevised by Devereux and Gri¢ th (1998b, 2003). The need of considering �-nancial constraints on dividend income when comparing tax rate and tax baseincentives in tax policy analysis arises because most of tax base incentives aretemporary in nature and result in deferred taxation. Accounting rules in both
32
the United States and the United Kingdom prevent cash �ows resulting fromdeferred taxes to be distributed to shareholders. Hence, omission of the con-straints would result in an incorrect assessment of the e¤ect of tax incentivesand their implications for the measurement of the tax burden on investment.We re-compute time series of the ETR under the new constrained model in
both the United States and the United Kingdom over the period 1980-2010. Thenew empirical results show - in sharp contrast with the existing evidence - thattax rate incentives are far more e¤ective in reducing the ETR than tax baseincentives. This result holds regards to the form of investment �nance, the typeof capital spending and the value of economic depreciation relative to accountingdepreciation. Also, our analysis warns policy makers about a potential negativeimplication of current trends in corporate tax rates: as corporate tax ratescontinue to decline over time, there will be less and less scope to employ themost e¤ective tax instrument, the corporate tax rate, to reduce the e¤ectivetax burden on income from capital during periods of economic recessions ordownturns. In turn, this suggests that corporate tax rate cuts should also betemporary.
References
Alexander, D. and S. Archer (2009). 2009 International Accounting/FinancialReporting Standard Guide. CCH Incorporated.
Backus, D., HeUiksen, E. and K. Storesletten (2008). �Taxes and the globalallocation of capital�, Journal of Monetary Economics, 55, 48�61.
Boadway, R. W. and N. Bruce (1979). �Depreciation and InterestDeductions and the E¤ect of the Corporation Income Tax on Investment�,Journal of Public Economics, 11, 1, 93�105.
Burnham, P. and L. Ozanne (2006). �Distortions from Partial Tax ReformRevealed through E¤ective Tax Rates�, National Tax Journal, 59, 3, 611-630.
Congressional Budget O¢ ce (2005). Taxing Capital Income: E¤ective Ratesand Approaches to Reform. Congressional Budget O¢ ce, Washington.
Congressional Budget O¢ ce (2006). Computing E¤ective Tax Rates onCapital Income. Congressional Budget O¢ ce, Washington.
De Mooij, R., A. and S. Ederveen (2003). �Taxation and Foreign DirectInvestment: A Synthesis of Empirical Research�, International Tax and PublicFinance, 10, 6, 673-693.
Devereux, M. P. (2004). Measuring Taxes on Income from Capital, WorkingPaper Series No. W03/04. Institute for Fiscal Studies: London.
33
Devereux, M. P. and R. Gri¢ th (1998a) �Taxes and the Location ofProduction: Evidence from a Panel of US Multinationals� Journal of PublicEconomics, 68, 3, 335-367.
Devereux, M. P. and R. Gri¢ th (1998b). The Taxation of DiscreteInvestment Choices, Working Paper Series No. W98/16. Institute for FiscalStudies: London.
Devereux, M. P. and R. Gri¢ th (2003). �Evaluating Tax Policy for LocationDecisions�, International Tax and Public Finance, 10, 2, 107�126.
Devereux, M. P., R. Gri¢ th and A. Klemm (2002). �Corporate IncomeTax Reforms and International Tax Competition�, Economic Policy, 17, 35,451�495.
Devereux, M. P., Lockwood, B. and M. Redoano (2008). �Do CountriesCompete over Corporate Tax Rates?�, Journal of Public Economics, 92, 1210-1235.
European Commission (1992). Ruding Report, Sec (92) 1118, Brussels:European Commission.
European Commission (2001). �Company Taxation in the InternalMarket�, Commission Sta¤ Working Paper, COM (2001) 582 �nal, Brussels:European Commission.
Hall, R. E. and D. W. Jorgenson (1967). �Tax Policy and InvestmentBehavior�, American Economic Review, 57, 3, 391�414.
Institute for Fiscal Studies (2009). Mirrlees Review: Reforming the TaxSystem for the 21st Century. London: Institute for Fiscal Studies.
Jorgenson, D. W. (1963). �Capital Theory and Investment Behavior�,American Economic Review, 53, 2, 247�259.
Kanniainen, V. and J. Södersten (1994). �Costs of Monitoring andCorporate Taxation�, Journal of Public Economics, 55, 2, 307�321.
Kanniainen, V. and J. Södersten (1995). �The Importance of ReportingConventions for the Theory of Corporate Taxation�, Journal of PublicEconomics, 57, 3, 417�430.
King, M. A. (1974). �Taxation and the Cost of Capital�, Review of EconomicStudies, 41, 1, 21�35.
34
King, M. A. and D. Fullerton (eds) (1984). The Taxation of Income fromCapital: A Comparative Study of the United States, the United Kingdom,Sweden and West Germany. University of Chicago Press.
Mills, L. F. (2006). "Five Things Economists and Lawyers Can Learn fromAccountants: An Illustration Using the Domestic Production Activities Deduc-tion", National Tax Journal, 59, 3, 585-597.
OECD (1991). Taxing Pro�ts in a Global Economy: Domestic andInternational Issues. Paris: OECD.
OECD (2007). Fundamental Reform of Corporate Income Tax. OECD TaxPolicy Studies, 16. Paris: OECD.
Polito, V. (2009). �Measuring the E¤ective Tax Burden in the Real World�,Fiscal Studies, 30, 2, 247-278.
Slemrod, J. (1990). �Tax E¤ects on Foreign Direct Investment in the US:Evidence from a Cross-Country Comparison.�In A. Razin and J. Slemrod (eds.),Taxation in the Global Economy. University of Chicago Press.
Sørensen, P. B. (1995). �Changing Views of the Corporate Income Tax�,National Tax Journal, 48, 2, 279�294.
A Tax data
Tables 1 and 2 report all tax data used in the empirical section of this paper.CIT denotes the statutory corporate income tax rate, inclusive of surchargesand local tax rates, where they exist. NPV(PM) and NPV(IB) denotes thediscounted present value of tax depreciation allowances on one unit of capitalspending in plant and machinery and industrial buildings respectively. PIT isthe top marginal individual tax rate on dividend income and c denotes the reliefgranted to reduce the e¤ects of double taxation. In particular, we notice that aclassical system (no relief for double taxation) is employed in the United Statesthroughout the whole sample period, whereas a credit system is used in theUnited Kingdom, with imputation rate declinging from 42.9 per cent in 1979to 11.1 per cent in 2010. CGT is the top marginal tax rate on capital gains, whileg measures the percentage of the gain chargable after taking into account anyform of double taxation relief. A 60 per cent exemption was granted on capitalgains in the United States from 1979 to 1986, and no relief for double taxationwas available afterwards. Relief for double taxation of capital gains on quali�edparticipations is granted in the United Kingdom from 1998 to 2007. In table 2,the percentage of chargable capital gain is computed after measuring the averagevalue tapering relief each year. Finally, the rate Z is the the accruals-equivalent
35

capital gains tax rate, measured by making the assumption that, following anincrease in the value of an asset, the investor sells 10 per cent of his remainingholding in each period.
36
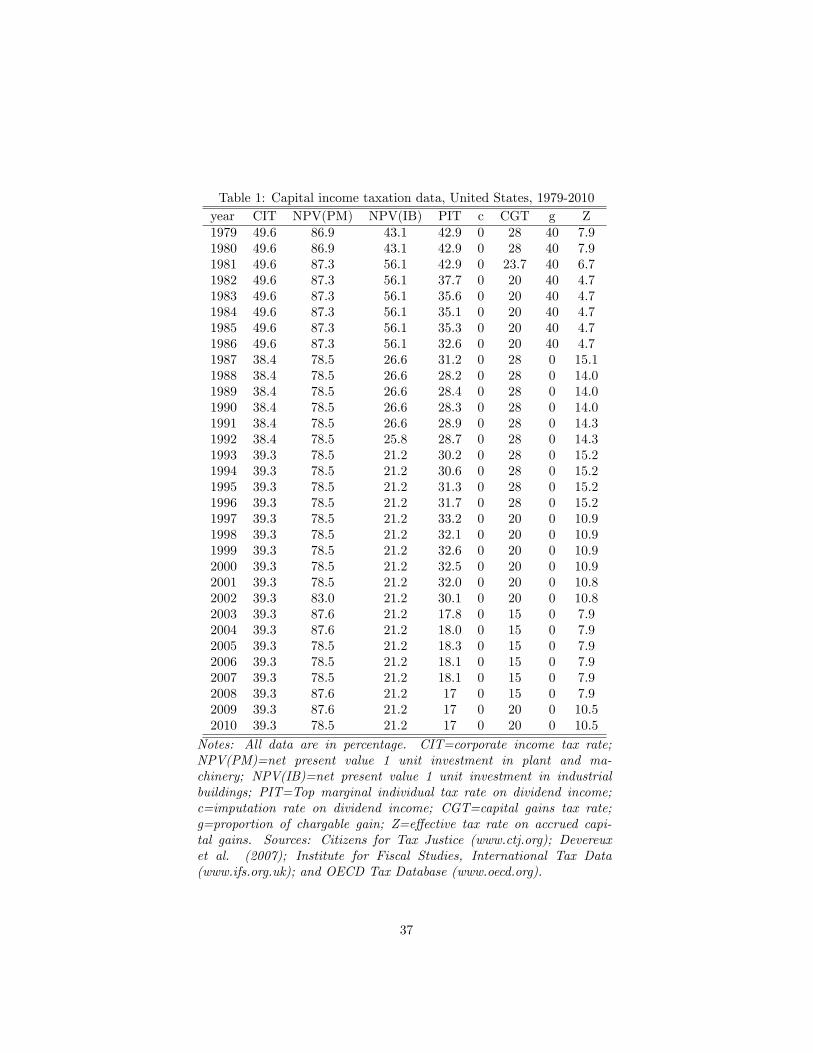
Table 1: Capital income taxation data, United States, 1979-2010year CIT NPV(PM) NPV(IB) PIT c CGT g Z1979 49.6 86.9 43.1 42.9 0 28 40 7.91980 49.6 86.9 43.1 42.9 0 28 40 7.91981 49.6 87.3 56.1 42.9 0 23.7 40 6.71982 49.6 87.3 56.1 37.7 0 20 40 4.71983 49.6 87.3 56.1 35.6 0 20 40 4.71984 49.6 87.3 56.1 35.1 0 20 40 4.71985 49.6 87.3 56.1 35.3 0 20 40 4.71986 49.6 87.3 56.1 32.6 0 20 40 4.71987 38.4 78.5 26.6 31.2 0 28 0 15.11988 38.4 78.5 26.6 28.2 0 28 0 14.01989 38.4 78.5 26.6 28.4 0 28 0 14.01990 38.4 78.5 26.6 28.3 0 28 0 14.01991 38.4 78.5 26.6 28.9 0 28 0 14.31992 38.4 78.5 25.8 28.7 0 28 0 14.31993 39.3 78.5 21.2 30.2 0 28 0 15.21994 39.3 78.5 21.2 30.6 0 28 0 15.21995 39.3 78.5 21.2 31.3 0 28 0 15.21996 39.3 78.5 21.2 31.7 0 28 0 15.21997 39.3 78.5 21.2 33.2 0 20 0 10.91998 39.3 78.5 21.2 32.1 0 20 0 10.91999 39.3 78.5 21.2 32.6 0 20 0 10.92000 39.3 78.5 21.2 32.5 0 20 0 10.92001 39.3 78.5 21.2 32.0 0 20 0 10.82002 39.3 83.0 21.2 30.1 0 20 0 10.82003 39.3 87.6 21.2 17.8 0 15 0 7.92004 39.3 87.6 21.2 18.0 0 15 0 7.92005 39.3 78.5 21.2 18.3 0 15 0 7.92006 39.3 78.5 21.2 18.1 0 15 0 7.92007 39.3 78.5 21.2 18.1 0 15 0 7.92008 39.3 87.6 21.2 17 0 15 0 7.92009 39.3 87.6 21.2 17 0 20 0 10.52010 39.3 78.5 21.2 17 0 20 0 10.5
Notes: All data are in percentage. CIT=corporate income tax rate;NPV(PM)=net present value 1 unit investment in plant and ma-chinery; NPV(IB)=net present value 1 unit investment in industrialbuildings; PIT=Top marginal individual tax rate on dividend income;c=imputation rate on dividend income; CGT=capital gains tax rate;g=proportion of chargable gain; Z=e¤ective tax rate on accrued capi-tal gains. Sources: Citizens for Tax Justice (www.ctj.org); Devereuxet al. (2007); Institute for Fiscal Studies, International Tax Data(www.ifs.org.uk); and OECD Tax Database (www.oecd.org).
37
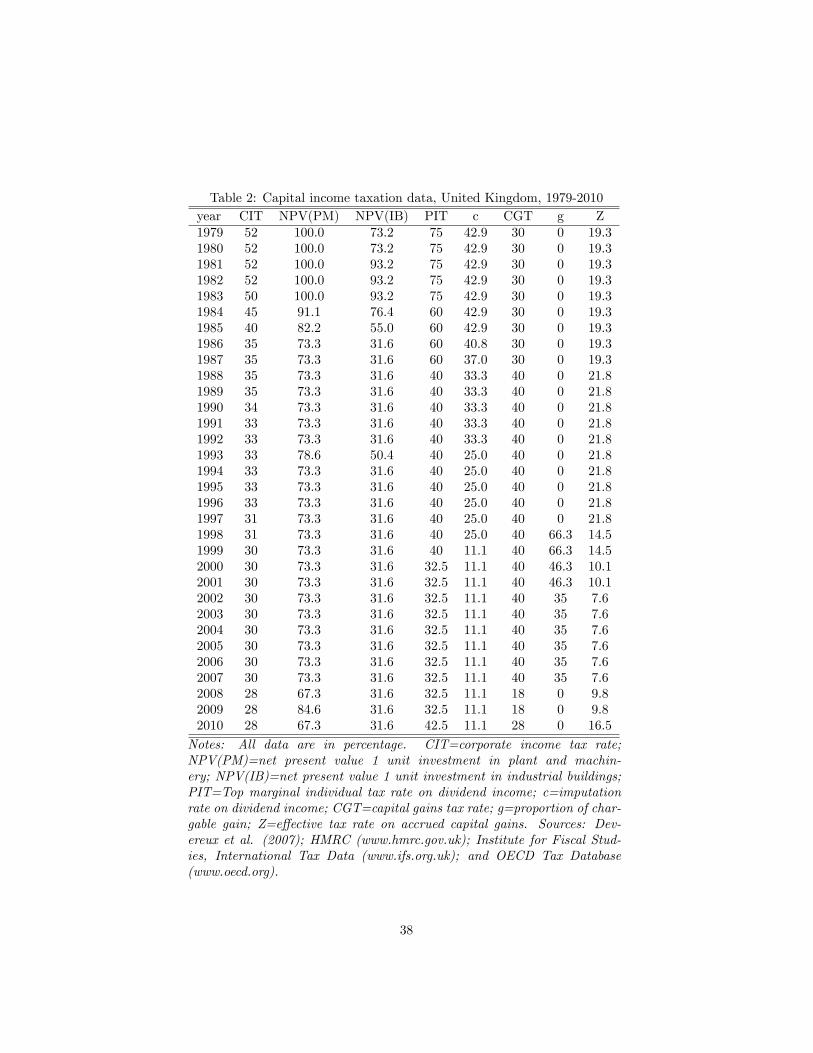
Table 2: Capital income taxation data, United Kingdom, 1979-2010year CIT NPV(PM) NPV(IB) PIT c CGT g Z1979 52 100.0 73.2 75 42.9 30 0 19.31980 52 100.0 73.2 75 42.9 30 0 19.31981 52 100.0 93.2 75 42.9 30 0 19.31982 52 100.0 93.2 75 42.9 30 0 19.31983 50 100.0 93.2 75 42.9 30 0 19.31984 45 91.1 76.4 60 42.9 30 0 19.31985 40 82.2 55.0 60 42.9 30 0 19.31986 35 73.3 31.6 60 40.8 30 0 19.31987 35 73.3 31.6 60 37.0 30 0 19.31988 35 73.3 31.6 40 33.3 40 0 21.81989 35 73.3 31.6 40 33.3 40 0 21.81990 34 73.3 31.6 40 33.3 40 0 21.81991 33 73.3 31.6 40 33.3 40 0 21.81992 33 73.3 31.6 40 33.3 40 0 21.81993 33 78.6 50.4 40 25.0 40 0 21.81994 33 73.3 31.6 40 25.0 40 0 21.81995 33 73.3 31.6 40 25.0 40 0 21.81996 33 73.3 31.6 40 25.0 40 0 21.81997 31 73.3 31.6 40 25.0 40 0 21.81998 31 73.3 31.6 40 25.0 40 66.3 14.51999 30 73.3 31.6 40 11.1 40 66.3 14.52000 30 73.3 31.6 32.5 11.1 40 46.3 10.12001 30 73.3 31.6 32.5 11.1 40 46.3 10.12002 30 73.3 31.6 32.5 11.1 40 35 7.62003 30 73.3 31.6 32.5 11.1 40 35 7.62004 30 73.3 31.6 32.5 11.1 40 35 7.62005 30 73.3 31.6 32.5 11.1 40 35 7.62006 30 73.3 31.6 32.5 11.1 40 35 7.62007 30 73.3 31.6 32.5 11.1 40 35 7.62008 28 67.3 31.6 32.5 11.1 18 0 9.82009 28 84.6 31.6 32.5 11.1 18 0 9.82010 28 67.3 31.6 42.5 11.1 28 0 16.5
Notes: All data are in percentage. CIT=corporate income tax rate;NPV(PM)=net present value 1 unit investment in plant and machin-ery; NPV(IB)=net present value 1 unit investment in industrial buildings;PIT=Top marginal individual tax rate on dividend income; c=imputationrate on dividend income; CGT=capital gains tax rate; g=proportion of char-gable gain; Z=e¤ective tax rate on accrued capital gains. Sources: Dev-ereux et al. (2007); HMRC (www.hmrc.gov.uk); Institute for Fiscal Stud-ies, International Tax Data (www.ifs.org.uk); and OECD Tax Database(www.oecd.org).
38


