Embed Size (px)
Citation preview
www.ijird.com September, 2017 Vol 6 Issue 9
INTERNATIONAL JOURNAL OF INNOVATIVE RESEARCH & DEVELOPMENT DOI No. : 10.24940/ijird/2017/v6/i9/SEP17065 Page 226
Determinants of Capital Structure in the Automobile Industry: Case Study Nakuru Town
1. Introduction 1.1. Background to the Study Capital structure refers to the combination of equity and debt used by a firm to finance its asset. It also refers to the fraction of money owing, preferred and common stock on a company’s balance sheet. This therefore means that its role in a business organization cannot be underestimated. Capital structure contributes a lot in determining the overall market value of the firm. Capital structure decision of a firm is one of the key financial decisions reflecting how a firm raises capital for its operations (Muema, 2013). Selection of an optimal capital structure is always a crucial issue for each firm. The reason for this is that, financial risk and tax advantage are directly inclined by a company’s selection of capital structure. Capital structure is an important management decision as it greatly influences the owners’ equity return, the owners’ peril as well as the market worth of the shares. It contributes a lot in determining the overall market value of the firm. Firms use different blend of financing options to finance their property and mostly, it is based on the nature of the industry and its operations. Whenever finances have to be raised to fund an investment, a capital structure decision is formulated (Salawu, 2007). It is therefore important for management of a company to develop a suitable capital structure. With this, all factors that are important to the company’s capital structure decisions should be properly analyzed and balanced. An understanding of the determinants of capital structure is therefore necessary. Profitability, size of the firm, liquidity, and tangibility of assets have been cited in various studies as important determinants of capital structure in the Automobile Industry. For instance, in Pakistan (Afza & Hussain, 2011 suggested that the firms which are big in size and having superior assets structure should go for debt financing to finance new projects.; Masnoon & Saeed, 2014) conducted a study on determinants of capital structure of automobile companies in Pakistan and found out that capital structure has pessimistic relationship with profitability, liquidity, size and tangibility, while it is positively associated with earning unpredictability. The linkage with profitability as well as liquidity is reputable to be statistically important whereas that with size, tangibility and earning unpredictability is reported as statistically insignificant., in Indian Automobile (Sathyanarayana & Malavalli, 2000), in automobile firms of Japan, Malaysia and Pakistan, (Mahmood, 2003); in Japan (Ritsumeikan, 2012); and in Iran (Ahmadimousaabad, 2013)
ISSN 2278 – 0211 (Online)
Gladys Jeruto Kirwok Accountant, Kisii University, Kisii, Kenya
Dr. Caroline Okello Ayuma Lecturer, University of Eldoret, Kenya
Abstract: The role of capital structure in an organization cannot be underestimated. Profitability, size of the firm, leverage and tangibility of assets has been cited in various studies as important determinants of capital structure in the Automobile Industry. These determinants however have been cited to have varying types of relationships with capital structure in different studies. This paradox makes firms in the automobile industry an interesting area for study. The purpose of this study was to examine the determinants of capital structure in the Automobile Industry in Nakuru Town. The specific objectives of the study included: establishing how profitability affects the capital structure decisions in the Automobile Industry; finding out how size of the firm affects the capital structure decisions in the Automobile Industry; determining how liquidity affects the capital structure decisions in the Automobile Industry and determining how tangibility of assets affect the capital structure decisions in the Automobile Industry in Nakuru Town. The study adopted the descriptive survey design and targeting a population of 40 automobile firms. A census technique was employed in sample determination, whereby all the 40 automobile companies were studied. The study collected primary data using a questionnaire. Prior to use of data collected, it was subjected to validity checks and reliability tests. Data collected was analyzed with the help of the Statistical Package for Social Sciences version 21.0 computer software for descriptive statistics and inferential statistics (correlations). The findings show that profitability and size of the firm has no significant effect on capital structure. However, liquidity and tangibility of assets was found to be significant determinants of capital structure in Automobile industries in Nakuru Town. The study recommends that, automobile firms in Nakuru Town should seek on measurers which will minimize the overall cost of capital by postponing seeking fresh capital issue by seeking use of internal sources and borrow from cheaper sources of debt.
www.ijird.com September, 2017 Vol 6 Issue 9
INTERNATIONAL JOURNAL OF INNOVATIVE RESEARCH & DEVELOPMENT DOI No. : 10.24940/ijird/2017/v6/i9/SEP17065 Page 227
conducted a study which aimed at examining the determinants of capital structure of Iranian firms scheduled on Tehran Stock Exchange for the period between 2001 and 2010.The results indicated that the size and peril are absolutely related to capital structure. In addition, profitability, expansion and tangibility are pessimistically related to capital structure. The result of firm size is consistent with the trade-off theory and end result of profitability is reliable with the pecking order theory. This therefore is an important global business aspect. Studies in Africa include that of Udomisirikul and Jumreornvong (2011) in South Africa conducted a linkage between liquidity and capital structure among the public listed companies. Outcome of this research showed that there is a momentous affiliation involving two of three proposed liquidity ratios and leverage. This connection is dependable with the findings of previous researches in growing and developed countries like the United States and Thailand. According to the outcome firms with more liquid stocks prefer equity to enjoy lower cost of capital. Githira & Nasieku (2015) performed a study on capital structure determinants among companies quoted in securities exchange in east Africa. The study evidenced a positive not worth mentioning relationship between profitability, growth, firm size and capital structure and major optimistic association with asset structure. Further, there was a negative insignificant relationship involving cost of capital and capital structure. There are many studies that reveal an optimistic association between profitability and leverage. Larger firms are well diversified, having unwavering cash flows and their likelihood of bankruptcy is less as compared to small firms (Turere, 2012). The more liquid firm would use external finances due to their capability of paying back liabilities and to gain from tax shields, resultant in positive relationship between liquidity and leverage (Ahmad et. al., 2011). In the automobile industry just like other businesses, a capital structure decision plays a significant part in the maximization of shareholders’ wealth (Mujahid, 2014). The automobile industry consisting of cars, trucks, buses, three-wheelers and two-wheelers, is imperative to the development of the Kenyan economy. Major dealers in Kenya include Toyota East Africa/Toyota Kenya, General Motors East Africa(GMEA), Cooper Motor Corporation, Simba Colt, RMA Motors (Kenya) Limited, DT Dobie and Beiben Trucks - Nelion Trading Ltd. Economic progress is indicated by the amount of goods and services created which give the drive for transportation and boost the sale of vehicles. The established dealers face severe antagonism from imported second-hand vehicles, primarily from Japan and United Arab Emirates. Another issue which arose was that there was additional claim for second-hand vehicles rather than new ones because Kenya is generally a low-income country. A poor capital structure decision in organizations in this sector may result in a high cost of capital making less investment suitable and reducing the net present value of accepted investments and also increasing the worth of the firm. Although authentic levels of debt and equity may vary over time, most firms try to keep their financing combination close to a target capital structure. 1.2. Statement of the Problem The most fundamental decision that a company makes is that of capital structure. The proportions of debt and equity used to fund the firm’s assets, has repercussion for stakeholders’ value (Mwangi et al., 2012). Nakuru town is one the fastest growing towns south of Sub Saharan Africa. The automobile industry in the area is also fast growing (Chebet & Okeyo, 2016). Companies in this industry engage in retail sales of new and used passenger cars, SUVs, light trucks and traveler and cargo vans. The big challenge that is facing automobile industries is financing the capital structure of its firms since they deal in buying and selling of used and new vehicles. Considering customers’ interests that they are interested in new vehicles while the second-hand ones are not of interest hence they remain as lying capital therefore it becomes a challenge to obtain finances to buy new vehicles. Therefore, understanding ways of financing the Automobile industries in Nakuru Town will be of great importance. 1.3. Objectives of the Study 1.3.1. Main Objective The purpose of this study was to examine the determinants of capital structure in the Automobile Industry in Nakuru Town. 1.3.2. Specific Objectives
i. To establish how profitability affects the capital structure decisions in the Automobile Industry in Nakuru Town. ii. To find out how size of the firm affects the capital structure decisions in the Automobile Industry in Nakuru Town.
iii. To determine how liquidity affects the capital structure decisions in the Automobile Industry in Nakuru Town. iv. To establish how tangibility of assets affects the capital structure decisions in the Automobile Industry in Nakuru Town.
1.4. Research Questions
i. How does profitability affect the capital structure decisions in the Automobile Industry in Nakuru Town? ii. How does size of the firm affect the capital structure decisions in the Automobile Industry in Nakuru Town?
iii. How does liquidity affect the capital structure decisions in the Automobile Industry in Nakuru Town? iv. How does tangibility of assets affect the capital structure decisions in the Automobile Industry in Nakuru Town?
1.5. Research Hypothesis
Ho1: Profitability does not have a statistical significance on capital structure decisions in the automobile industry in Kenya. Ho2: Size of a firm does not have a statistical significance on capital structure decisions in the automobile industry in Kenya. Ho3: Liquidity does not have a statistical significance on capital structure decisions in automobile industry in Kenya. Ho4: Tangibility does not have a statistical significance on capital structure decisions in automobile industry in Kenya.
www.ijird.com September, 2017 Vol 6 Issue 9
INTERNATIONAL JOURNAL OF INNOVATIVE RESEARCH & DEVELOPMENT DOI No. : 10.24940/ijird/2017/v6/i9/SEP17065 Page 228
1.6. Significance of the Study This study was significant in that through the findings stakeholders such as management and accounting officers understood the impact of strategies employed in their respective organizations. Stakeholders such as the Government found this information significant in that, they were able to develop or review existing organizational polices related to the determinants of capital structure in the Automobile Industry. Other players in the Automobile industry in other regions used the research findings in their search of arriving at an optimal mix of financing which maximizes the worth of the firm and minimizes the cost of capital. Researchers and Academicians found such information useful in that, the findings may also be used as reference materials guiding future studies related to the determinants of capital structure. The methodology and the findings can be referred to adopted or copied. 1.7. Scope of the Study The study was carried out in the Automobile industry among finance officers in Nakuru town. Considering the nature of the study collection of primary data was done. The approach was considered ideal for this study, since it is strategically advantaged to provide information sought. The confinement of the study is on how profitability, size of the firm, liquidity and tangibility affect the capital structure decisions in the Automobile Industry in Nakuru Town. The study lasted for six months. 1.8. Limitations of the Study The study was carried out in the automobile industry in Nakuru town, an area with distinct geographical and economic advantages therefore, it may not be easy to generalize the findings to the rest of the country. Another limitation to this study is that some of the respondents were unwilling to provide information sought owing to its sensitivity, being financial information. This could have led to a situation where respondents give dishonest responses. To overcome this limitation, the researcher informed the respondents, the purpose of the study and assured them of confidentiality for information provided. The study was limited by difficulty in obtaining information from some of financial officers who were most likely to provide inaccurate answers. Using a questionnaire, the researcher may not be able to tell if the respondents are lying or not. The researcher plans to address this challenge of inadequate information from the respondents through a well-designed open and closed ended questionnaire. 1.9. Definition of Terms
Capital Structure: This refers to the mix of debt and equity used by a firm to finance its assets. Leverage: Refers to the use of a variety of borrowed capital, such as margin, to increase the potential return of an investment. Liquidity: Refers to a measure of the extent to which a person or organization has cash to meet immediate and short-term
debt, or assets that can be quickly converted to cash. Profitability: Refers to the ability of a business to make a profit. A profit is what is left of the income a company obtains
subsequent to paying all operating cost directly associated with the generation of revenue, such as producing a product, and other expenses linked to the conduct of the business activities.
Tangibility: Refers to the ability of a business to include both fixed assets, such as machinery, buildings and land, and current assets, such as inventory in its operations.
2. Literature Review 2.1. Theoretical Framework This study was supported by the Pecking Order Theory, Agency Theory and Modigliani-Miller theorem (M&M). 2.1.1. Pecking Order Theory This theory argues that, there is no optimal capital in an organization (Vasiliou, Eriotis & Daskalakis, 2009). The theory makes an assumption that firms prefer internal financing (Income, amortization) and they seek for external sources of finances if they have entirely exhausted their internal sources such as debt capital and their last remedy is issuance of shares to the public. The pecking order theory is based on the affirmation that managers have extra information about their firms than shareholders. This difference of information is referred to as information asymmetry. According to Myers and Majluf (1984), they argue that equity is a not as much of preferred means to increase capital because when executives (who are assumed to be familiar with better regarding true condition of the firm than shareholders) issue original equity. Shareholders believe that executives think that the firm is overrated and managers are taking a gain of this over-valuation. As a consequence, investors will place a lower worth to the original equity issuance. If investors are less informed than the firm insiders about the value of the firm, subsequently equity may be mispriced by the marketplace. Jurkowksi (2005) argued that it is hard to establish companies leverage since an organization cannot differentiate between internal and external sources and which source to be given priority. An organization financing order is solely determined by requirements. Internal capital is more favored particularly if any organization is unwilling to renounce control to external parties. There may be quite valiant theses found that obtaining debt capital by the company does not have control on its importance, a positive effect of financial leverage is eradicated by negative information relating to company’s debt and its financial position (Jensen & Meckling, 1976) explained that managers do not always run the firm to maximize returns to the shareholders. Therefore, organizations with high likelihood of profitability have high chances of maintaining more earning consequently having low chances of raising new finances externally.
www.ijird.com September, 2017 Vol 6 Issue 9
INTERNATIONAL JOURNAL OF INNOVATIVE RESEARCH & DEVELOPMENT DOI No. : 10.24940/ijird/2017/v6/i9/SEP17065 Page 229
However, this theory was found not to hold in some areas, for instance, Tse and Rodgers (2014) found that the two presumptions do not make clear the capital structure in China. Tse and Rodgers (2014), found that leverage levels vary across industries because of industry-based differences in financial distinctiveness. Across all sectors borrowing-power-related variables were recognized as being important determinants of leverage and, contrary to the expectations, factors relating to profitability were largely insignificant. Additionally, renowned those cultural and business surroundings of China may not give support to the pecking order and trade-off theories. This theory was relevant to this study in that, the cost of capital dictates the rank of the pecking order under asymmetric information in addition to market defect. If pecking order is appropriate, then, higher profitability will correspond to a lower debt ratio holding other things equal. As a result, pecking order theory assumes negative association involving leverage and profitability. The pecking order theory suggests that the companies generally prefer internal funds first as the main source of finance. So, firms with enough liquid assets use these funds to finance their activities and are expected to have lower leverage. 2.1.2. Agency Theory An agency relationship is an agreement during which one or more persons (the principal) engages with another person (the agent) to carry out some service on their behalf, which entails entrusting some decision-making power to an agent (Jensen and Meckling, 1976). Agents are concerned with their benefit as compared to the principal’s interest. They defined agency cost as out of pocket cost (bonding and monitoring cost) and opportunity cost (residual loss). Hall et al., (2004) established that the higher the allocation of current assets the higher the long-term debts and the higher the fraction of current assets the lower the short-term debts. Jensen and Meckling (1976) confirms that a company with a huge share of tangible assets serves as collateral for debt, it minimizes the possibility of incurring agency costs by lenders, which leads to a rise in leverage. Cornelli et al., (1996) indicated that agency costs of managers who neglect prerequisite are higher for firms with low levels of collateral due to the higher cost of examining capital expenditures by shareholders who prefer companies with low levels of assets pledged as security to have higher levels of debt. (Baker & Wurgler, 2002) postulated that the market value of the firm is dependent of the firm’s debt ratio, because of the reality of taxes, financial distress costs, agency costs, and information irregularity as well as market imperfections on the financial market. 2.1.3. Modigliani-Miller theorem (M&M) This theory was postulated by Modigliani and Miller in 1958. The Modigliani-Miller theorem (M&M) was a financial theory affirming that the market worth of a firm is strong-minded by its earning power and the peril of its fundamental assets, and is independent of the way it prefers to fund its investments or allocate dividends (Modigliani and Miller, 1958). The theory recommended that the valuation of a firm is not relevant to the capital structure of a company. Whether a firm is extremely leveraged or has inferior debt component, it has no approval bearing on its market value. Relatively, the market worth of a firm is reliant on the in-commission profits of the company. M-M (Modigliani and miller) argued that for firms in the similar hazard class the whole market worth is independent of the debt-equity blend and is known by capitalizing the probable net operating income by the fee suitable to that peril class. Differing to Modigliani and Miller (1958, MM hereafter), Capital Structure is not irrelevant while we assumed that a firm with a dividend payout policy. On the basis of the arbitrage process, M-M accomplished that the market worth of firms is not exaggerated by leverage but due to the survival of imperfections in the capital market, arbitrage might fail to work and may give rise to disparity involving the market principles of levered and unlevered firms. The arbitrage procedure may fail to bring stability in the capital market because of: lend and borrowing rates differentiation, non-substitutability of individual and corporate leverages, business costs, business taxation and personal taxation, and retained earnings. Similarly, Engel, Braun and Achleitner (2015) established positive relationship connecting debts level and equity return nevertheless as the debts level increased greatly equivalent to 90%, debts level appeared to establish no affiliation with risk-adjusted equity return. This connoted that as debt level is small, it absolutely affects returns, when it is medium and growing, and it negatively affects returns and obviously established no relationship with returns when its level is large. As renowned by Bevan and Danbolt (2002), under market imperfections such as limitations to access external financing and differentiations in the costs of substitute forms of external finance, firms will dare to select levels of debt and equity in order headed for arriving at an optimal capital structure. Alternatively, Groth and Anderson (1997) recommended that aside from deciding on a target capital structure, a firm must administer its individual capital structure. Limitation in capital markets, taxes, and further practical factors influence the management of capital structure. 20 years later, Miller (1977) integrated personal taxes furthermore to corporate taxes interested in the MM model (the blend of individual and corporate tax effect), while he still presumes that all firms have equal effective tax rates. This theory remained relevant to this study because as it holds, the capital structure of a company is the way a company finances its assets. A company can fund its operations by whichever debt or equity or diverse combinations of these two sources. Capital structure of a company can have a majority of debt constituent or majority of equity, only one of the 2 mechanisms or an equal mix of both debt and equity. Every approach has its own set of return. The theory became actual and significant to this study in that the study supported the view that tangibility of assets and liquidity, are considered important determinants to a firm’s capital structure. 2.2. Empirical Review This section presents the empirical review of the study.
www.ijird.com September, 2017 Vol 6 Issue 9
INTERNATIONAL JOURNAL OF INNOVATIVE RESEARCH & DEVELOPMENT DOI No. : 10.24940/ijird/2017/v6/i9/SEP17065 Page 230
2.2.1. Overview of Capital Structure According to Pathak (2011) Capital structure represented the totality of long-term investment in a business firm. It includes funds raised from beginning to end by ordinary and preference shares, bonds, short term loans and debentures from financial institutions. Any earned revenue and capital surpluses are included. Capital structure should be designed very carefully. The management of the company ought to set a target capital structure and the succeeding financing decisions should be made with a view to achieve the target capital structure. Gowri (2006) posits that capital structure is one of the most complex areas of financial decision-making owing to inter relationship with other financial variables. Capital structure is the most arguable topic in finance and continues keeping researchers contemplating. A good capital structure helps to achieve attractive profit, and the lack of a proper capital structure influence the debt position as well as the leverage which leads to immense financial risk. A reorganization of capital will be suggested for poor profit generating and loss-making industries. Gaud, et al. (2003) studied on the determinants of capital structure of Swiss companies using sample of 106 companies listed on Swiss stock exchange and data across nine years (1991-2000). The variables used in the research included size, tangibility, growth, risk and profitability and the result reported were that business threat, tangibility and size are positively connected to leverage while expansion and productivity are negatively allied. A study by Gharaibeh (2015) revealed that firm’s age, development opportunities, liquidity, productivity, size, tangibility and kind of industry are determinants of capital structure of Kuwaiti companies. 2.2.2. Profitability and Capital Structure in Organizations According to Huang and Song (2006) Profitability can be defined as the relative amount of earnings before interest, tax (EBIT) and depreciation to total assets (TA). This section presents a review on Profitability as a determinant of Capital Structure in organizations. According to Abu-Mouamer (2011) the association involving profitability (PROF) and leverage is established to be negative, but statistically insignificant for all countries with the exception of Malaysia. The negative and momentous result for Malaysia is consistent with the forecast of the pecking order theory indicating that firms favor to use internal sources of funding when profits are high. Chisti, Ali and Sangmi, (2013) conducted a study on impact of capital structure on profitability of listed automobile companies. The study theorized that there is no significant correlation between profitability and capital structure. Secondary data was collected from five-year financial records (2007 to 2012). Capital structure was measured using three ratios: debt to equity ratio, debt to assets ratio and interest coverage ratio. Profitability was calculated using operation profit ratio, return on capital employed, gross profit ratio and net profit ratio. Descriptive and correlation study were applied to analyze the data. Conclusion of the study pointed out insignificant relationship between general profitability and debt to equity ratio as well as profitability and interest coverage. More so, the study depicted a positive unimportant relationship between profitability and debt to asset ratio. Velnampy and Niresh (2012) conducted a study on the correlation linking capital structure and profitability amongst ten listed Srilankan banks between the years 2002 to 2009. The study used correlation design and profitability was measured through accounting procedures such as net profit ratio, net interest margin, return on capital employed and return on equity while capital structure was measured using debt to total funds and debt to equity ratio. Return on equity (ROE) is the amount of net income returned as a percentage of shareholders’ equity. It reveals how a good deal profit a company is paid in contrast to the sum amount of shareholder equity found on the balance sheet. The outcome of the study showed that commercial banks are extremely geared since 89% of commercial assets were financed using debts. Additionally, the study indicated a negative significant relationship involving debt to equity and net profit margin ratio, debt to full amount of funds and net interest margin, debt to total funds and net profit margin. Although a negative relationship existed between debt to equity and net profit ratio, debt to equity and return on capital employed debt to equity and return on equity and debt to overall funds and return on capital employed. According Masnoon and Anwar (2012), there exist negative relation of profitability with leverage. However, this was dissimilar to Shah and Khan (2007) who in their study focused on the factors affecting capital structure decisions of firms, established that there was high leverage ratio and average profitability of textile industry. This shows that the determinants of capital structure diverge in their behavioral uniqueness dictated by distinct operational environments. In Britain, the relationship between liquidity and capital structure is well established in a study by Lipson and Mortal (2009). The study aimed at testing the connection between capital structure and market liquidity. Their findings, the debt to asset ratio is 38% along with 55% for highly and less liquid firms correspondingly. This confirms that liquid firms utilize a smaller amount of debt hence pessimistic connection existing between leverage and liquidity. Linkage between cost of equity and capital structure has been defined by the trade-off theory and the target capital structure idea. Starting that trade-off theories was based on Modigliani and Miller’s (1958, 1963) theories about capital structure. According to these theories most favorable capital structure is determined by net cost of equity and net cost of debt considering the tax-shield effect (lispon, 2009). Mwangi, Anyango and Amenya, (2012) undertook a study on capital structure adjustment, optimal target leverage and speed of adjustment amongst firms quoted in Nairobi stock exchange (NSE) and the outcome showed a significant negative correlation between profitability and capital structure amongst all firms listed in NSE. A study by Munene (2006) on the impact of profitability on capital structure from 1999 to 2004 for all companies listed at the Nairobi Stock Exchange by extending the pecking order theory concluded that profitable firms use less debt than interior retained earnings hence little leverage proportion. Profitability alone cannot conclude the optimal capital structure and others comprise the intensity of tax, risks with managers’ decisions (aggressiveness or conservative).
www.ijird.com September, 2017 Vol 6 Issue 9
INTERNATIONAL JOURNAL OF INNOVATIVE RESEARCH & DEVELOPMENT DOI No. : 10.24940/ijird/2017/v6/i9/SEP17065 Page 231
Weiner (2006) recognized that internally produced funds are utilized than external funds since it’s cheaper. Superior working capital management put into practice and accomplishment of employee share ownership plans strategy ensure that there is adequate liquidity for the firm since managers commence activities that boost firm’s value. This reduces the bankruptcy, financial distress costs and protection of takeover. 2.2.3. Size of the Firm and the Capital Structure Decisions Empirical review shows that size of a firm is measured by its sales volumes. The proxy used for calculating size is the log of net sales. Gaud, et al. (2003), Masnoon& Anwar (2012), Zingales & Rajan (1995) in their research studies recognized a negative relationship involving size of firm and its leverage since additional transparency about huge firms reduced the undervaluation of original equity issue and affirmed firms to finance through their equity. A study by Martina (2015) on the relationship involving tangible assets and capital structure of small as well as medium-sized companies in Croatia, recognized that small and medium-sized companies use their guarantee to attract long-term debt, which means that small as well as medium-sized companies use inferior costs and the interest rate of long-term debt in relative to short-term debt. These findings corresponded with the maturity harmonizing principle, according to which long-term assets are funded with long-term financing and short-term property are funded with short-term funds. A study by Ramadan and Ramadan (2015) on Jordanian industrial firms critically analyzed that firms’ size applied an undeviating relationship on capital structure. With the use of data set of 2000-2014 from the Jordanian industrial firms, his findings established support to the trade-off presumption. Ramadan (2015) renowned that large size firms favor to finance firms using sum unpaid even as small-sized firms will have to enlarge their financing to external equity. According to Tesfaye and Minga, (2013) indicated an optimistic correlation involving firm size and capital structure. An inverse significant relationship was evident between firm size and the ratio of total debts to total assets. A rise in asset base is linked with an increase in collateral securities. Given that there is a positive relationship between firm size and capital structure, debt and equity finances should therefore be made available through minimized associated floatation’s cost. Jani and Bhatt (2015) noted that large firms choose long-term debt more often whereas small firms prefer short term debt. Issue of debt cost and equity is negatively related to the firm’s size. In addition, larger firms are often diversified and have more secure cash flows, and so the likelihood of bankruptcy for larger firms is minimal relative to smaller firms. This implies that size of a firm could be positively related with leverage. A study by Frielinghaus et al. (2005) maintained that South African companies favor more debt in early stages when they are still small, while they opt for internal sources as the life stages advance. At this time, the firms are big and thus able to seek for external sources as well as acquire high percentage of debts. They conclude that this finding favor pecking order theory. Their study revealed a statistically significant relationship between firm size and using incentives in financing setup investments. (Marsh, 1982), Huge companies tend to choose long-term debt and small companies are likely to rely on short-term debt size of a firm plays a very important role in the negotiation for debt. Large firms can confer for long-term debt because they can have manipulation on the creditors. Also, large firms are additionally diversified than small firms and have a steadier cash flow. However, previous studies into size in relation to capital structure have given mixed outcome. Rajan and Zingales (1995) argue that the effect of size on equilibrium leverage is more unclear. Large firms tend to be further diversified and fail less often, so size may be an inverse alternative for the likelihood of bankruptcy.” Barclay and Smith (1995) recommend that a firm with high intangible asset will have access to debt at high cost and a firm with high tangible assets may use the assets as security hence borrow debt at cheaper cost. The level of information exposure is very high in larger firms in contrast to smaller firms. Abor (2008) compares the capital structures of diverse firms’ sizes in Ghana showing that quoted and large unquoted firms reveal considerably higher debt ratios than do SMEs. His results indicated that age, profitability, risk, size, asset structure and managerial ownership of the firm are imperative in influencing the capital structure decisions. The study findings revealed that firm size is a vital determinant of capital structure in organizations. 2.2.4. Liquidity and the Capital Structure Decisions According to Sarlija and Harc (2012) on the impact of liquidity on capital structure: A Case study of Croatian firms recognized that liquidity of the company, reflected in the continuing capacity to pay financial obligations, affects the capital structure of the firm. Increase in liquidity of firms leads to decline of the leverage and a decrease in liquidity of firms leads to a rise on the leverage. It is significant to highlight the importance and function of money in liquidity. Money or its cash equivalent used for paying obligation, seem to be the best pointer of liquidity for Croatian firms. In contrast to other current assets (receivables, short-term financial assets and stock), money is an inadequate resource. To maintain liquidity thereby, influence on the capital, entrepreneurs must be sensitive to the importance of running liquid assets. A study by Kramer (2015) in Europe found positive correlation involving corporate tax rate and debt to assets ratio using fixed effect estimation lying on European data. Drawback of some of these studies is also the incapability to test for suitable model, that is, OLS regression model, fixed effect model panel, data model and random effect model) to be capable to appraise whether distinctive time-invariant characteristics of firms might affect the resultant variable (capital structure) or not. On the same note, Tse and Rodgers (2014) examined borrowing capability as determinant of capital structure. Using a collective regression analysis on data from industrialized and non-manufacturing firms in China exposed that regardless of that capital structure is different across industries; borrowing ability is a determinant of industries’ capital structure.
www.ijird.com September, 2017 Vol 6 Issue 9
INTERNATIONAL JOURNAL OF INNOVATIVE RESEARCH & DEVELOPMENT DOI No. : 10.24940/ijird/2017/v6/i9/SEP17065 Page 232
Ahmad et. al., (2011) considered liquidity as the ratio of current assets to current liabilities. In the study, liquidity is considered while the relative amount of current assets to current liabilities. According to Sarlija and Harc, the correlation between liquidity ratios and short-term leverage is stronger than between liquidity ratios and long-term leverage. The summary of the study pointed out that the more liquid assets firms have, the lesser they are leveraged. Long-term leveraged firms are extra liquid. Increase in inventory levels leads to a boost in leverage. Moreover, increasing cash in current assets leads to a drop in the short-term and the long-term leverage. A study by Mathuva (2012) established that firms with more capacity to generate internal resources, increased capital expenditure was guaranteed of high profits and exhibited strong growth opportunities. At the same time Mathuva found that large firms and firms with longer cash conversion cycles tend to invest more in inventories. Firms with positive sales blow, superior net profit margins grasp smaller amount of inventories than firms with negative sales surprises and lower net profit margins. The decision making on the capital structure greatly relies on liquidity management of Sri Lanka Telecom Plc. In supportive way, Olayinka (2011) affirmed that, leverage and liquidity positively correlate in Nigerian perspective. In the event a firm uses the debt fund to solve the short-term solvency crisis, interest expenses are paid to the investors, which will create the drawback in the financial expenses of the firm. Lipson and Mortal (2009) indicated that more liquid firms are financed by its internal resources hence less leveraged. The sample of the research consisted of the U.S. companies scheduled on stock exchanges with the value of assets over $ 1 million. Li and Cui (2003) observed that the optimal debt-to-equity ratio is the point at which firm value is maximized, the position where the marginal costs of debt just offset the marginal benefits. This was found to be an important determinant of capital structure. The over low level of debt to asset ratio replicated the deprived management of corporate financial gear of Chinese listed companies. Refinancing from beginning to end using equity is not the optimal strategy to diminish their capital cost. It’s not a familiar phenomenon for a modern corporate to rely almost totally on its own capital, using none or merely little debt. According to Anderson (2002) firms with high liquid assets have a preference to high degree of long-term leverage without altering the structure of liquid assets. Liquid assets are an assurance that in times of lesser earnings, or when it is intricate for a company to get financed on the capital market, or when the cost of capital is tremendously high, can endure such situation. Such firms will shun risky projects that might bring them superior profit and for that reason expansion of the company will be slower. Fan, Titman and Twite (2006), compare the capital structure between developed and developing countries. They observed that companies in developing countries obtain more debt in their capital structure in contrast to companies in developed countries. According to this study, Malaysia with median leverage ratio of 0.23 is positioned bottom of ranking table close to countries like South Africa and Turkey. Researchers have found liquidity acting similar role in the companies working in developing countries. A study by Saurabh and Sharma (2015) on determinants of capital structure in India, found out liquidity to be empirically insignificant in establishing the capital structure of Indian manufacturing sector. Nevertheless, it is contradictory with the outcome of Gathogo and Ragui (2014) who verified existence of negative effect of the “liquidity” of firms in Kenya on leverage ratio. 2.2.5. Tangibility of Assets and the Capital Structure Decisions Parsons and Titman (2009) established that firms with more tangible assets tend to have more debt. They argued that this relation was not surprising because many tangible assets comprise appropriate collateral. They can be redistributed at reasonably low transaction costs when the borrower happens to be distressed or defaults. Consequently, borrowing costs should be realistically low as firms’ tangible assets hold their debt, resulting in a positive relation between financial leverage and asset tangibility. Grechaniuk (2009) noted that firms with higher intangible assets and growth chance as well as with inferior profitability borrow less as they experience moreover higher probability of bankruptcy or possibility of losing worth of assets. Giambona and Campello (2013) take the relative involving tangibility of an asset and capital structure one step more and argued that it is not only the tangibility of assets that amplify debt capacity, also the relieve with which significant assets can be traded. For example, it ought to be much easier to sell ordinary equipment contrasted to specialized equipment. Hijazi and Tariq (2006) renowned that tangibility of assets is considered in this study as the quantity of fixed assets to total assets. They obtained total gross amount of fixed assets as the numerator. By means of total gross fixed assets relatively than net depreciated worth of assets make sense as (i) different firms may perhaps use dissimilar depreciation methods that may create inequality in the data (ii) a firm can guarantee an asset having a market value even if it has been totally depreciated. Computing tangibility this way, the ratio was above one in some cases signifying that total gross fixed assets were additional than total assets (Shah & Hijazi, 2005). According to Masnoon & Anwar (2012), Gaud, et al. (2003) and there is an optimistic relation involving tangibility and leverage which implies that if tangibility of firm is high the firm can have additional debt to its capital structure. The firms which have enough property can generate external finance without difficulty and on less rate of interest because they can protect these loans as guarantee Rajan and Zingales (1995). According to the still tradeoff approach, firms with superior ratio of fixed assets serve as security for new loans, favoring money owing. However, the Pecking Order Theory is of the view, as disputed by Harris and Raviv (1991) that firms by means of little levels of fixed assets would have extra troubles of asymmetric information, making them subject more debt, since equity issues would only be probable by underpricing them. On the other hand, firms with superior levels of asset tangibility are generally bigger firms that can issue equity at reasonable prices, so they do not need to subject debt to finance new investment. According to them, the predictable association involving asset tangibility and debt should be negative. I denote tangibility as (TG) and quantify the tangibility as a ratio of fixed assets to total assets. A firm having a great quantity of fixed assets can without difficulty raise debt at cheaper rates for the reason of the collateral value of those fixed assets. Companies with advanced ratio of tangible assets have a reason to borrow additional because loans are available to them at a comparatively cheaper rate. Therefore, we anticipate a positive relationship linking tangibility of assets and leverage.
www.ijird.com September, 2017 Vol 6 Issue 9
INTERNATIONAL JOURNAL OF INNOVATIVE RESEARCH & DEVELOPMENT DOI No. : 10.24940/ijird/2017/v6/i9/SEP17065 Page 233
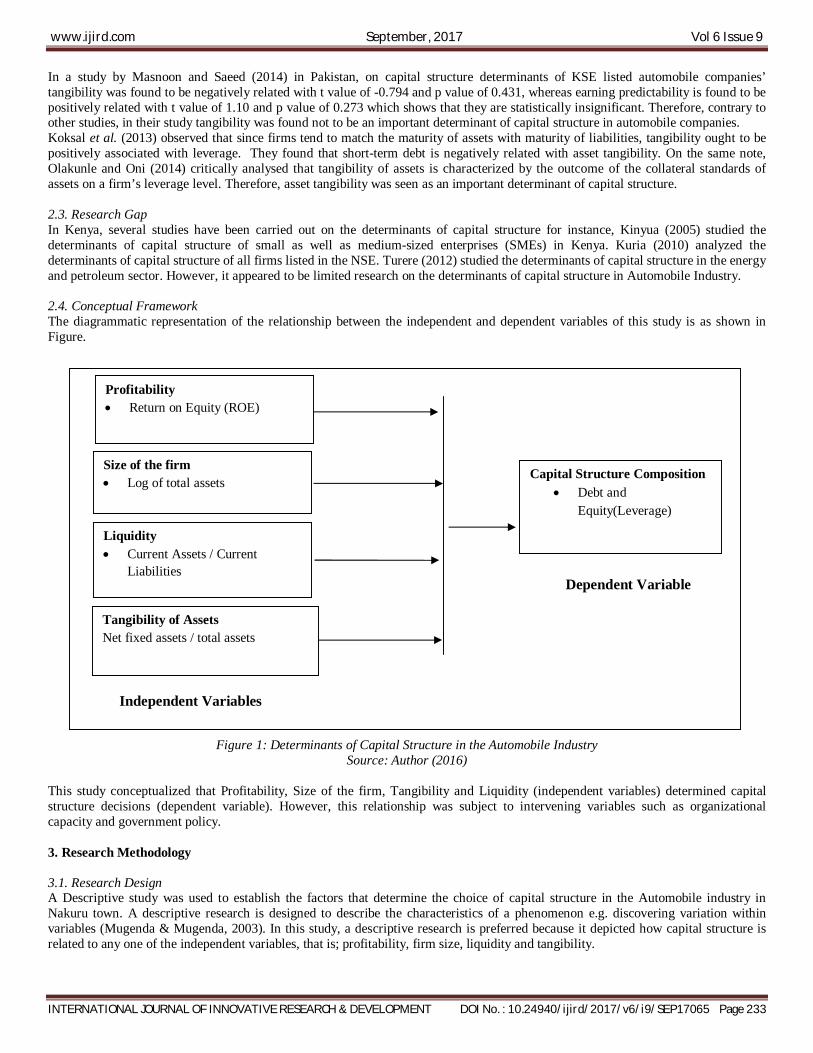
In a study by Masnoon and Saeed (2014) in Pakistan, on capital structure determinants of KSE listed automobile companies’ tangibility was found to be negatively related with t value of -0.794 and p value of 0.431, whereas earning predictability is found to be positively related with t value of 1.10 and p value of 0.273 which shows that they are statistically insignificant. Therefore, contrary to other studies, in their study tangibility was found not to be an important determinant of capital structure in automobile companies. Koksal et al. (2013) observed that since firms tend to match the maturity of assets with maturity of liabilities, tangibility ought to be positively associated with leverage. They found that short-term debt is negatively related with asset tangibility. On the same note, Olakunle and Oni (2014) critically analysed that tangibility of assets is characterized by the outcome of the collateral standards of assets on a firm’s leverage level. Therefore, asset tangibility was seen as an important determinant of capital structure. 2.3. Research Gap In Kenya, several studies have been carried out on the determinants of capital structure for instance, Kinyua (2005) studied the determinants of capital structure of small as well as medium-sized enterprises (SMEs) in Kenya. Kuria (2010) analyzed the determinants of capital structure of all firms listed in the NSE. Turere (2012) studied the determinants of capital structure in the energy and petroleum sector. However, it appeared to be limited research on the determinants of capital structure in Automobile Industry. 2.4. Conceptual Framework The diagrammatic representation of the relationship between the independent and dependent variables of this study is as shown in Figure.
Figure 1: Determinants of Capital Structure in the Automobile Industry
Source: Author (2016) This study conceptualized that Profitability, Size of the firm, Tangibility and Liquidity (independent variables) determined capital structure decisions (dependent variable). However, this relationship was subject to intervening variables such as organizational capacity and government policy. 3. Research Methodology 3.1. Research Design A Descriptive study was used to establish the factors that determine the choice of capital structure in the Automobile industry in Nakuru town. A descriptive research is designed to describe the characteristics of a phenomenon e.g. discovering variation within variables (Mugenda & Mugenda, 2003). In this study, a descriptive research is preferred because it depicted how capital structure is related to any one of the independent variables, that is; profitability, firm size, liquidity and tangibility.
Profitability Return on Equity (ROE)
Size of the firm Log of total assets
Liquidity Current Assets / Current
Liabilities
Capital Structure Composition Debt and
Equity(Leverage)
Tangibility of Assets Net fixed assets / total assets
Independent Variables
Dependent Variable
www.ijird.com September, 2017 Vol 6 Issue 9
INTERNATIONAL JOURNAL OF INNOVATIVE RESEARCH & DEVELOPMENT DOI No. : 10.24940/ijird/2017/v6/i9/SEP17065 Page 234
3.2. Target Population The target population was made up of 40 Automobile firms in Nakuru town. This comprised of automobile firms of different sizes, motor dealers and Autospares. These firms have been in operation in Nakuru town for the last 10 years. The accessible population was made up the 40 finance officers in the organizations. 3.3. Sampling Procedures and Sample Size The study adopted a census technique in sample determination, whereby all the 40 automobile companies were studied. This was because the population is small. According to Farooq (2013), a census was a complete enumeration of the universe. It is considered ideal where the population is not vast and where there was time to collect data. In this case the researcher was able to collect enough data. 3.4. Research Instruments The study collected primary data. Primary data was collected by use of questionnaires. The instruments were distributed to the 40 key informants that is, accounting officers in the selected firms. A questionnaire had the following advantages according to Kombo & Tromp (2006): Information can be collected from a large sample, confidentiality is upheld, saves on time and no opportunity for interview bias. It was suitable for data collection because it allowed the researcher to reach a large sample within limited time and ensure confidentiality of the information given by the respondents. The researcher made an initial visit to the automobile firms for familiarization. The questionnaires contained both open ended and closed ended questions. Qualitative aspects of the study variables such as beliefs and attitudes will be captured through open ended questions. Quantitative questions were captured using closed ended and Likert scale type of questions. The questionnaire contained structured questions. The questionnaires were divided into two distinct parts; Part A and Part B through to Part E. Part A solicited personal information of the respondents on themes such as gender, age, and work experience. Part B through E solicited information addressing the research objectives of the study in order of number. Closed forms of questions are easy to administer and fill out, assist the respondents’ mind to be focused on the subject and facilitate the process of tabulation and analysis. 3.5. Piloting Piloting was conducted using 4 automobile firms (10% of the sample) in Nakuru Town. Care was taken to ensure that piloted firms do not form part of the sample in the actual data collection. The purpose of pilot test was to identify weak spots in design and execution and to provide proxy for data collection of a probability sample (Cooper & Schindler, 2006). These processes enhanced the quality of information collected from the respondents for purposes of achieving the research objectives. Their comments were used to improve questionnaires. The piloting results were used to establish validity and reliability of Instruments. 3.6. Validity of Instruments The validity of the research instruments established preceding the actual data collection (Drost, 2011). Establishing validity of research instruments implied that the study conveys the intended results (Mugenda and Mugenda, 2003). This ensured that the instruments can be trusted and results referred to when forming opinions and conclusions. Content validity was recognized by judgement of specialists who comprise supervisors. The experts provided guidance on the content of the instruments by ensuring that all the research objectives have been addressed in the instruments. The approach of construction of the questionnaires was checked to ensure there is no ambiguity during pilot study. The findings from the pilot study were used to improve on the questionnaire, thus enhancing its validity. 3.7. Reliability of Instruments Reliability is the stability or internal consistency of a questionnaire. Cronbach’s alpha was used to test the reliability of the measures in the questionnaire. According to Sekaran (2006), a score attained is linked with scores acquired from other items in the instrument. The Cronbach’s Coefficient Alpha was then computed to determine how items correlate. Cronbach’s Alpha is a general form of the Kunder-Richardson (K-R) 20. A value above 0.7 was accepted. The questionnaire responses entered into statistical package for social sciences (SPSS) and Cronbach’s alpha coefficient computed to give assess reliability. The closer Cronbach’s alpha coefficient is to 1, hence the higher the internal consistency reliability (Sekaran, 2006), hence reliable for collecting data.
3.8. Data Collection Procedures Introductory letter to conduct research was obtained from the University. A Research permit was sought from the National Council for Science, Technology and Innovation (NACOSTI). The introductory letter and the permit were presented to the selected organization’s management to inform them about the intended study. This enabled the researcher to have access to the respondents. The researcher discussed with the respondents the purpose of the study so as to solicit their informed consent. The researcher collected the questionnaires after administering them. 3.9. Data Analysis Procedures Study gathered qualitative data. The collected data were categorized, edited, coded, and analyzed. Reactions in the Likert scale were assigned numerical values to make quantitative analysis possible. Qualitative data obtained from the open-ended items were analyzed
www.ijird.com September, 2017 Vol 6 Issue 9
INTERNATIONAL JOURNAL OF INNOVATIVE RESEARCH & DEVELOPMENT DOI No. : 10.24940/ijird/2017/v6/i9/SEP17065 Page 235
with similar answers grouped together according to the responses from themes for analysis. The main themes and patterns in the responses were identified and analyzed to determine the adequacy and consistency of the information. Qualitative data were computed for descriptive statistics that is, frequencies, means and percentages with the aid of SPSS Version 21 and Microsoft Excel 2010, and thereafter the result was then presented in the form of tables and charts; cross tabulations were used to present the association between two variables. Regression analysis was used to establish the relationship between the independent variables. These techniques showed the direction and magnitude of the relationship between given variables (Mugenda, 2008). Equation for our regression model was: LG = β0 + β1 (PF) + β2 (FL) + β3 (SZ) + β4 (TG) + ε Where β0 = gradient or slope of the regression measured the unit of change in y associated with a unit change in X β1 to β4 =the regression coefficients LG = Leverage PF = Profitability FL = Liquidity SZ = Firm Size measured by Log of sales TG = Tangibility of assets ε = the error term
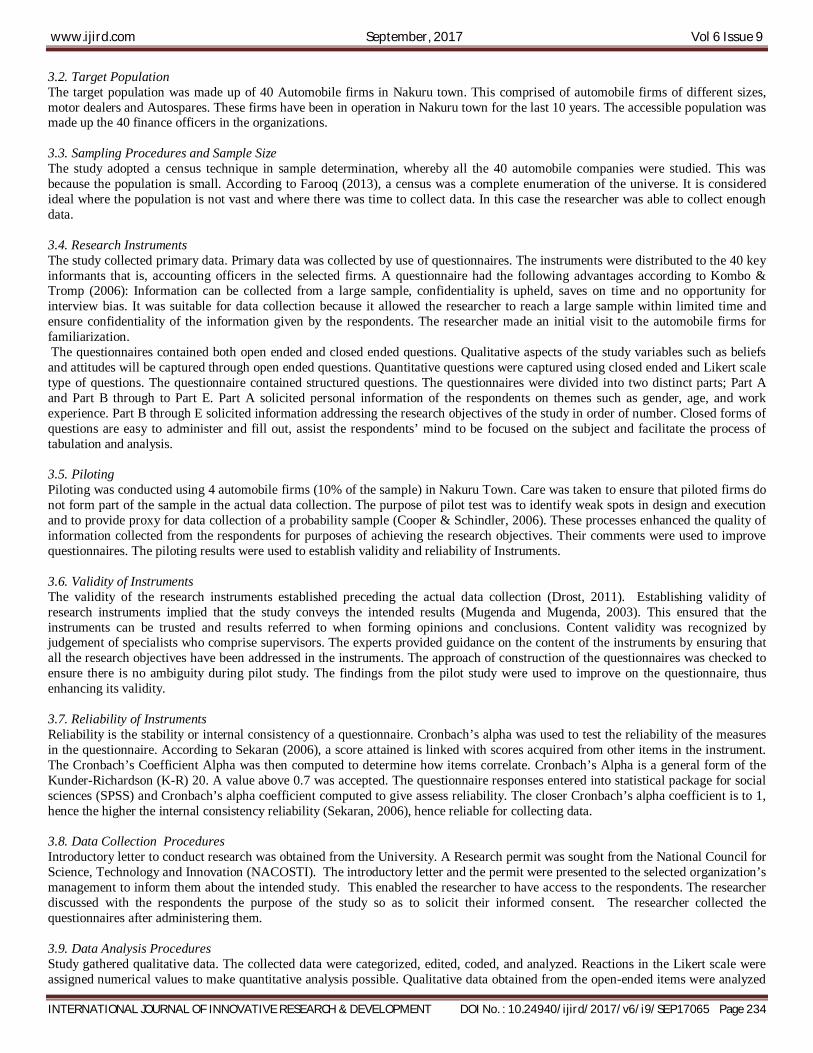
3.10. Ethical Consideration Institutional approval and research authorization was sought from the National Council of Science Technology and Innovation. The respondents were also informed on the purpose of the study and they were assured of confidentiality in respect to information provided. The researcher kept the respondents’ answers confidential and/or anonymous. Anonymity requires that the names of the participants and their actual locations are not disclosed to unauthorized persons. This helped allay fears and possible psychological harm. 4. Data Analysis, Interpretation and Discussions 4.1. General Characteristics of the Respondents This section presents the general characteristics from the findings. 4.1.1. Age of the Respondents The findings in respect to gender of the respondents were as provided in Figure 4.
Figure 2: Age of the Respondents
Source: Author (2016) The findings in Figure 2 show that 44.7% of the respondents were aged between 36 years and 40 years, 26.3% were aged between 41 years and 45 years, 15.8% were aged between 26 years and 30 years, while 13.2% were aged 45 years or above. This implied that almost all the respondents were aged above 35 years. This shows that less youth served as accounting or finance officers in these companies. Considering the fact age is closely related to work experience that is why most persons employed were of an advanced aged and thus experienced. However, it is important to note that the researcher was able to obtain data from respondents across the ages. 4.1.2. Gender of the Respondents The response in respect to the gender of the respondents that provided information was as provided in Figure 3.
05
1015202530354045
26 - 30 years 36 - 40 years 41 - 45 years Above 45 years
15.8
44.7
26.3
13.2
www.ijird.com September, 2017 Vol 6 Issue 9
INTERNATIONAL JOURNAL OF INNOVATIVE RESEARCH & DEVELOPMENT DOI No. : 10.24940/ijird/2017/v6/i9/SEP17065 Page 236
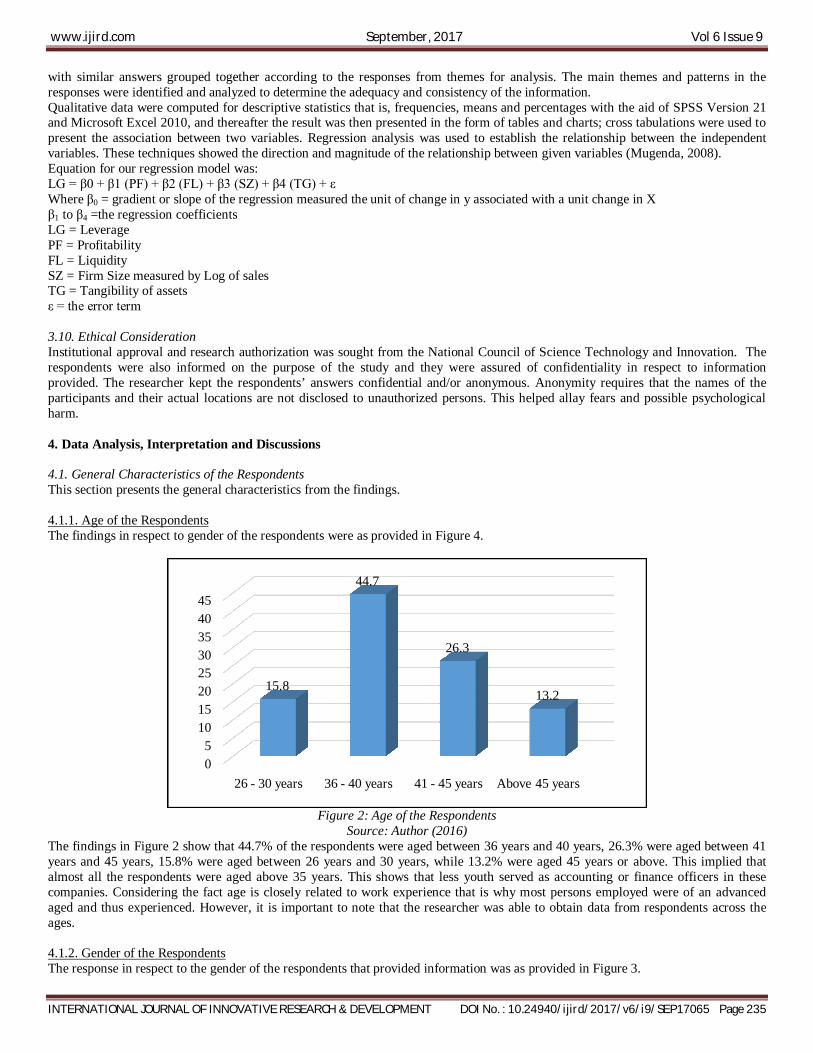
Figure 3: Gender of the Respondents
Source: Author (2016)
As provided in figure 3, the study was able to reach 73.7% male and 26.3% female. This was due to the availability and willingness to participate in the study by males compared to females. In some companies, the deputies were represented the accounting / finance officers. However, it is also an indication that more males than female were engaged as accounting officers and finance officers. Still, the study is able to capture useful information from both gender represented in the study. 4.1.3. Highest Level of Education Attained The response in respect to the respondents’ highest level of education attained was as provided in Table 1.
Response Frequency Percentage College Certificate 3 7.9 College Diploma 17 44.7
Degree level 18 47.4 Total 38 100
Table 1: Highest Level of Education Attained Source: Author (2016)
The findings in Table 1 shows that 47.4% of the respondents indicated that their highest level of education was the degree level, 44.7%had attained college diploma level, while 7.9% had college certificate. This implied that majority of the respondents had either college diploma or above. They were therefore better place to understand capital structure dynamics thus an advantage to the study. 4.1.4. Respondents’ Current Position The response to the current position of the respondents was as provided in Table 2.
Response Frequency Percentage Accountant 35 92.1
Accounts Assistant 1 2.6 Finance Manager 2 5.3
Total 38 100 Table 2: Respondents’ Current Position
Source: Author (2016)
According to Table 2, majority of the respondents (92.1%) were Accountants, 5.3% were finance managers, while 2.6% were Accounts Assistants. This implied that all the respondents, collectively referred to as accounting officers were in a strategic position to provide information sought.
4.1.5. Length of Service in the Current Company The respondents were asked to indicate How long have they had been working in their current company and in the current position and the response was as provided in Table 3
Female26%
Male74%
Female Male
www.ijird.com September, 2017 Vol 6 Issue 9
INTERNATIONAL JOURNAL OF INNOVATIVE RESEARCH & DEVELOPMENT DOI No. : 10.24940/ijird/2017/v6/i9/SEP17065 Page 237
Response Frequency Percentage Below 1 year 15 39.5
Between 1 and 3 years 5 13.2 Above 3 years 18 47.4
Total 38 100 Table 3: Length of Service in the Current Company
Source: Author (2016) The findings in Table 3 show that 47.4% of the accounting officers had been working in their current company and in the current position for a period above 3 years, 13.2% had been working there for a period between 1 and 3 years, while 39.5% worked for a period below 1 year. This implied that most respondents had served for a period more than 1 year in their current company. They were thus familiar with the financial structure of their company, and capital structure mix. 4.2. How Profitability affects the Capital Structure Decisions This section presents the findings in respect to objective one, which sought to establish how profitability affects the capital structure decisions in the Automobile Industry in Nakuru Town. Means were computed for select statements that tested whether or not profitability determined capital structure and the results were as provided in Table 4.
N Minimum Maximum Mean Std. Deviation
Amount of revenue gained from insurance companies exceeds the expenditure costs and taxes
38 2.00 5.00 3.6316 .67468
The profit gained usually goes to the owners of the business 38 2.00 4.00 3.6842 .52532 The firm maintains lower debt ratio as more funds are generated from internal sources
38 1.00 4.00 3.3947 .63839
Both long-term and short-term debt ratios affect profitability in our firm 38 2.00 4.00 3.5263 .55687 Profitability increases with control variables such as size and sales growth
38 2.00 4.00 3.4211 .64228
Capital structure decisions and profitability lead to good leverage 38 2.00 5.00 3.6053 .78978 Valid N (listwise) 38
Table 4: Descriptive Statistics (Profitability) X = Mean
The findings in Table shows that the statements recorded the following mean scores. Amount of revenue gained from insurance companies exceeds the expenditure costs and taxes (X = 3.6316); The profit gained usually goes to the owners of the business (X = 3.6842); The firm maintains lower debt ratio as more funds are generated from internal sources (X = 3.3947); Both long-term and short-term debt ratios affect profitability in our firm (X = 3.5263); Profitability increases with control variables such as size and sales growth (3.4211); and Capital structure decisions and profitability lead to good leverage (X = 3.6053). All the mean scores were above the 3.0 mid mean mark thus implying the profitability was viewed by most respondents as critical in making capital structure decisions. 4.2.1. Profits from Revenue Gained from Insurance Companies The respondents were asked to indicate to what extent they agreed that the amount of revenue gained from insurance companies exceeded the expenditure costs and taxes, and the response was as provided in Table 5.
Response Frequency Percentage Disagree 3 7.9 Moderate 9 23.7
Agree 25 65.8 Strongly Agree 1 2.6
Total 38 100 Table 5: Profits from Revenue Gained from insurance companies
Source: Author (2016) The finding in Table 5 show that 68.4% of the respondents agreed that in their organization, the amount of revenue gained from insurance companies exceeded the expenditure costs and taxes, 23.7% moderately agreed, while 7.9% disagreed. The interpretation was that in many of the automobile companies, profits were realized on revenue gained from insurance companies. This influenced capital investment decisions in these companies.
www.ijird.com September, 2017 Vol 6 Issue 9
INTERNATIONAL JOURNAL OF INNOVATIVE RESEARCH & DEVELOPMENT DOI No. : 10.24940/ijird/2017/v6/i9/SEP17065 Page 238
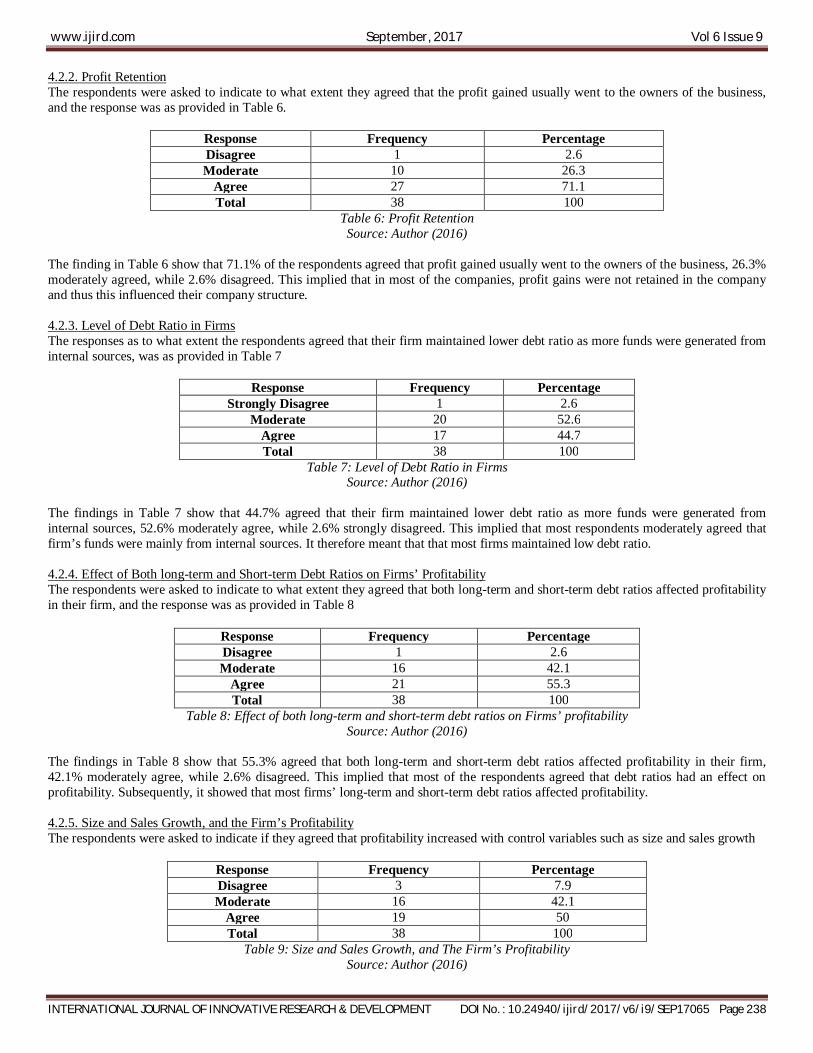
4.2.2. Profit Retention The respondents were asked to indicate to what extent they agreed that the profit gained usually went to the owners of the business, and the response was as provided in Table 6.
Response Frequency Percentage Disagree 1 2.6 Moderate 10 26.3
Agree 27 71.1 Total 38 100
Table 6: Profit Retention Source: Author (2016)
The finding in Table 6 show that 71.1% of the respondents agreed that profit gained usually went to the owners of the business, 26.3% moderately agreed, while 2.6% disagreed. This implied that in most of the companies, profit gains were not retained in the company and thus this influenced their company structure. 4.2.3. Level of Debt Ratio in Firms The responses as to what extent the respondents agreed that their firm maintained lower debt ratio as more funds were generated from internal sources, was as provided in Table 7
Response Frequency Percentage Strongly Disagree 1 2.6
Moderate 20 52.6 Agree 17 44.7 Total 38 100
Table 7: Level of Debt Ratio in Firms Source: Author (2016)
The findings in Table 7 show that 44.7% agreed that their firm maintained lower debt ratio as more funds were generated from internal sources, 52.6% moderately agree, while 2.6% strongly disagreed. This implied that most respondents moderately agreed that firm’s funds were mainly from internal sources. It therefore meant that that most firms maintained low debt ratio. 4.2.4. Effect of Both long-term and Short-term Debt Ratios on Firms’ Profitability The respondents were asked to indicate to what extent they agreed that both long-term and short-term debt ratios affected profitability in their firm, and the response was as provided in Table 8
Response Frequency Percentage Disagree 1 2.6 Moderate 16 42.1
Agree 21 55.3 Total 38 100
Table 8: Effect of both long-term and short-term debt ratios on Firms’ profitability Source: Author (2016)
The findings in Table 8 show that 55.3% agreed that both long-term and short-term debt ratios affected profitability in their firm, 42.1% moderately agree, while 2.6% disagreed. This implied that most of the respondents agreed that debt ratios had an effect on profitability. Subsequently, it showed that most firms’ long-term and short-term debt ratios affected profitability. 4.2.5. Size and Sales Growth, and the Firm’s Profitability The respondents were asked to indicate if they agreed that profitability increased with control variables such as size and sales growth
Response Frequency Percentage Disagree 3 7.9 Moderate 16 42.1
Agree 19 50 Total 38 100
Table 9: Size and Sales Growth, and The Firm’s Profitability Source: Author (2016)
www.ijird.com September, 2017 Vol 6 Issue 9
INTERNATIONAL JOURNAL OF INNOVATIVE RESEARCH & DEVELOPMENT DOI No. : 10.24940/ijird/2017/v6/i9/SEP17065 Page 239
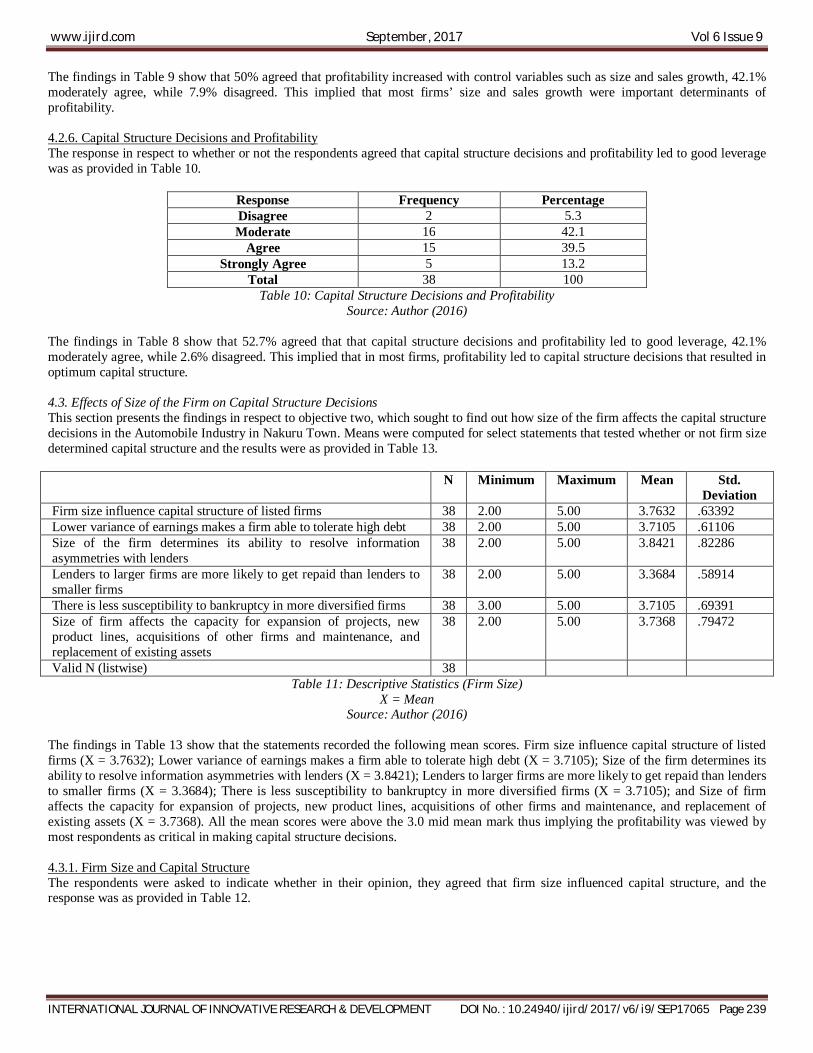
The findings in Table 9 show that 50% agreed that profitability increased with control variables such as size and sales growth, 42.1% moderately agree, while 7.9% disagreed. This implied that most firms’ size and sales growth were important determinants of profitability. 4.2.6. Capital Structure Decisions and Profitability The response in respect to whether or not the respondents agreed that capital structure decisions and profitability led to good leverage was as provided in Table 10.
Response Frequency Percentage Disagree 2 5.3 Moderate 16 42.1
Agree 15 39.5 Strongly Agree 5 13.2
Total 38 100 Table 10: Capital Structure Decisions and Profitability
Source: Author (2016) The findings in Table 8 show that 52.7% agreed that that capital structure decisions and profitability led to good leverage, 42.1% moderately agree, while 2.6% disagreed. This implied that in most firms, profitability led to capital structure decisions that resulted in optimum capital structure. 4.3. Effects of Size of the Firm on Capital Structure Decisions This section presents the findings in respect to objective two, which sought to find out how size of the firm affects the capital structure decisions in the Automobile Industry in Nakuru Town. Means were computed for select statements that tested whether or not firm size determined capital structure and the results were as provided in Table 13.
N Minimum Maximum Mean Std. Deviation
Firm size influence capital structure of listed firms 38 2.00 5.00 3.7632 .63392 Lower variance of earnings makes a firm able to tolerate high debt 38 2.00 5.00 3.7105 .61106 Size of the firm determines its ability to resolve information asymmetries with lenders
38 2.00 5.00 3.8421 .82286
Lenders to larger firms are more likely to get repaid than lenders to smaller firms
38 2.00 5.00 3.3684 .58914
There is less susceptibility to bankruptcy in more diversified firms 38 3.00 5.00 3.7105 .69391 Size of firm affects the capacity for expansion of projects, new product lines, acquisitions of other firms and maintenance, and replacement of existing assets
38 2.00 5.00 3.7368 .79472
Valid N (listwise) 38 Table 11: Descriptive Statistics (Firm Size)
X = Mean Source: Author (2016)
The findings in Table 13 show that the statements recorded the following mean scores. Firm size influence capital structure of listed firms (X = 3.7632); Lower variance of earnings makes a firm able to tolerate high debt (X = 3.7105); Size of the firm determines its ability to resolve information asymmetries with lenders (X = 3.8421); Lenders to larger firms are more likely to get repaid than lenders to smaller firms (X = 3.3684); There is less susceptibility to bankruptcy in more diversified firms (X = 3.7105); and Size of firm affects the capacity for expansion of projects, new product lines, acquisitions of other firms and maintenance, and replacement of existing assets (X = 3.7368). All the mean scores were above the 3.0 mid mean mark thus implying the profitability was viewed by most respondents as critical in making capital structure decisions. 4.3.1. Firm Size and Capital Structure The respondents were asked to indicate whether in their opinion, they agreed that firm size influenced capital structure, and the response was as provided in Table 12.
www.ijird.com September, 2017 Vol 6 Issue 9
INTERNATIONAL JOURNAL OF INNOVATIVE RESEARCH & DEVELOPMENT DOI No. : 10.24940/ijird/2017/v6/i9/SEP17065 Page 240
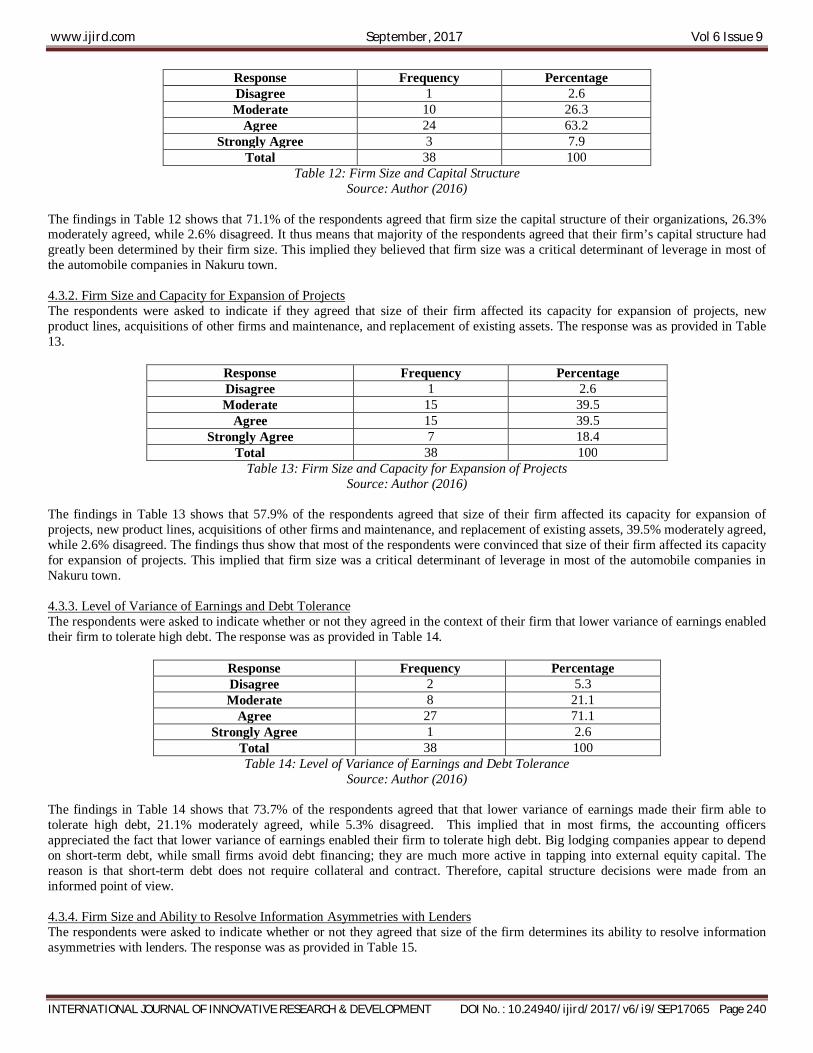
Response Frequency Percentage Disagree 1 2.6 Moderate 10 26.3
Agree 24 63.2 Strongly Agree 3 7.9
Total 38 100 Table 12: Firm Size and Capital Structure
Source: Author (2016) The findings in Table 12 shows that 71.1% of the respondents agreed that firm size the capital structure of their organizations, 26.3% moderately agreed, while 2.6% disagreed. It thus means that majority of the respondents agreed that their firm’s capital structure had greatly been determined by their firm size. This implied they believed that firm size was a critical determinant of leverage in most of the automobile companies in Nakuru town. 4.3.2. Firm Size and Capacity for Expansion of Projects The respondents were asked to indicate if they agreed that size of their firm affected its capacity for expansion of projects, new product lines, acquisitions of other firms and maintenance, and replacement of existing assets. The response was as provided in Table 13.
Response Frequency Percentage Disagree 1 2.6 Moderate 15 39.5
Agree 15 39.5 Strongly Agree 7 18.4
Total 38 100 Table 13: Firm Size and Capacity for Expansion of Projects
Source: Author (2016) The findings in Table 13 shows that 57.9% of the respondents agreed that size of their firm affected its capacity for expansion of projects, new product lines, acquisitions of other firms and maintenance, and replacement of existing assets, 39.5% moderately agreed, while 2.6% disagreed. The findings thus show that most of the respondents were convinced that size of their firm affected its capacity for expansion of projects. This implied that firm size was a critical determinant of leverage in most of the automobile companies in Nakuru town. 4.3.3. Level of Variance of Earnings and Debt Tolerance The respondents were asked to indicate whether or not they agreed in the context of their firm that lower variance of earnings enabled their firm to tolerate high debt. The response was as provided in Table 14.
Response Frequency Percentage Disagree 2 5.3 Moderate 8 21.1
Agree 27 71.1 Strongly Agree 1 2.6
Total 38 100 Table 14: Level of Variance of Earnings and Debt Tolerance
Source: Author (2016) The findings in Table 14 shows that 73.7% of the respondents agreed that that lower variance of earnings made their firm able to tolerate high debt, 21.1% moderately agreed, while 5.3% disagreed. This implied that in most firms, the accounting officers appreciated the fact that lower variance of earnings enabled their firm to tolerate high debt. Big lodging companies appear to depend on short-term debt, while small firms avoid debt financing; they are much more active in tapping into external equity capital. The reason is that short-term debt does not require collateral and contract. Therefore, capital structure decisions were made from an informed point of view. 4.3.4. Firm Size and Ability to Resolve Information Asymmetries with Lenders The respondents were asked to indicate whether or not they agreed that size of the firm determines its ability to resolve information asymmetries with lenders. The response was as provided in Table 15.
www.ijird.com September, 2017 Vol 6 Issue 9
INTERNATIONAL JOURNAL OF INNOVATIVE RESEARCH & DEVELOPMENT DOI No. : 10.24940/ijird/2017/v6/i9/SEP17065 Page 241
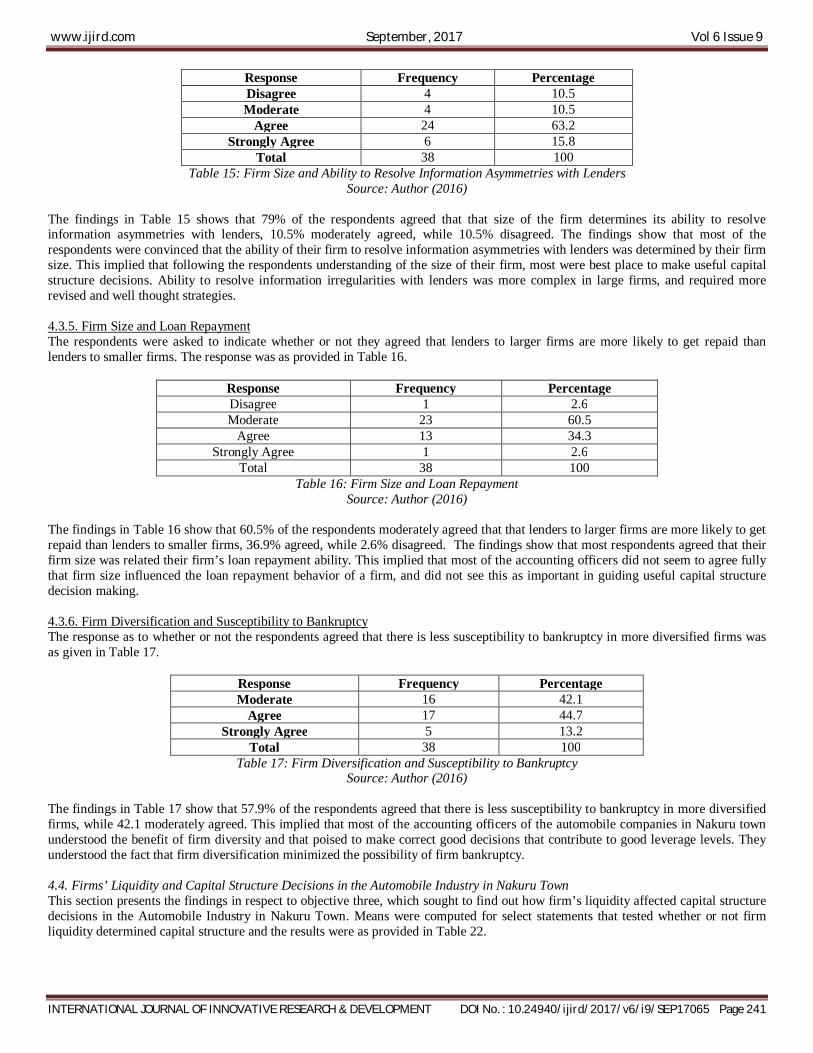
Response Frequency Percentage Disagree 4 10.5 Moderate 4 10.5
Agree 24 63.2 Strongly Agree 6 15.8
Total 38 100 Table 15: Firm Size and Ability to Resolve Information Asymmetries with Lenders
Source: Author (2016) The findings in Table 15 shows that 79% of the respondents agreed that that size of the firm determines its ability to resolve information asymmetries with lenders, 10.5% moderately agreed, while 10.5% disagreed. The findings show that most of the respondents were convinced that the ability of their firm to resolve information asymmetries with lenders was determined by their firm size. This implied that following the respondents understanding of the size of their firm, most were best place to make useful capital structure decisions. Ability to resolve information irregularities with lenders was more complex in large firms, and required more revised and well thought strategies. 4.3.5. Firm Size and Loan Repayment The respondents were asked to indicate whether or not they agreed that lenders to larger firms are more likely to get repaid than lenders to smaller firms. The response was as provided in Table 16.
Response Frequency Percentage Disagree 1 2.6 Moderate 23 60.5
Agree 13 34.3 Strongly Agree 1 2.6
Total 38 100 Table 16: Firm Size and Loan Repayment
Source: Author (2016) The findings in Table 16 show that 60.5% of the respondents moderately agreed that that lenders to larger firms are more likely to get repaid than lenders to smaller firms, 36.9% agreed, while 2.6% disagreed. The findings show that most respondents agreed that their firm size was related their firm’s loan repayment ability. This implied that most of the accounting officers did not seem to agree fully that firm size influenced the loan repayment behavior of a firm, and did not see this as important in guiding useful capital structure decision making. 4.3.6. Firm Diversification and Susceptibility to Bankruptcy The response as to whether or not the respondents agreed that there is less susceptibility to bankruptcy in more diversified firms was as given in Table 17.
Response Frequency Percentage Moderate 16 42.1
Agree 17 44.7 Strongly Agree 5 13.2
Total 38 100 Table 17: Firm Diversification and Susceptibility to Bankruptcy
Source: Author (2016) The findings in Table 17 show that 57.9% of the respondents agreed that there is less susceptibility to bankruptcy in more diversified firms, while 42.1 moderately agreed. This implied that most of the accounting officers of the automobile companies in Nakuru town understood the benefit of firm diversity and that poised to make correct good decisions that contribute to good leverage levels. They understood the fact that firm diversification minimized the possibility of firm bankruptcy. 4.4. Firms’ Liquidity and Capital Structure Decisions in the Automobile Industry in Nakuru Town This section presents the findings in respect to objective three, which sought to find out how firm’s liquidity affected capital structure decisions in the Automobile Industry in Nakuru Town. Means were computed for select statements that tested whether or not firm liquidity determined capital structure and the results were as provided in Table 22.
www.ijird.com September, 2017 Vol 6 Issue 9
INTERNATIONAL JOURNAL OF INNOVATIVE RESEARCH & DEVELOPMENT DOI No. : 10.24940/ijird/2017/v6/i9/SEP17065 Page 242
N Minimum Maximum Mean Std. Deviation
Our firm always has a high capacity to pay financial obligations 38 3.00 5.00 3.7105 .86705 Money or its cash equivalent used for paying obligation are available
38 3.00 5.00 3.8421 .59395
Our firm is sensitive to the importance of running liquid assets 38 3.00 5.00 3.7368 .55431 We have more liquid assets firms this year 38 3.00 5.00 3.6316 .67468 Our firm have high inventory levels 38 3.00 5.00 3.7368 .72351 Firm uses the debt fund to solve the short-term solvency crisis 38 3.00 5.00 3.5263 .60345 The cost of capital at our firm is tremendously high 38 3.00 5.00 3.5263 .60345 Valid N (listwise) 38
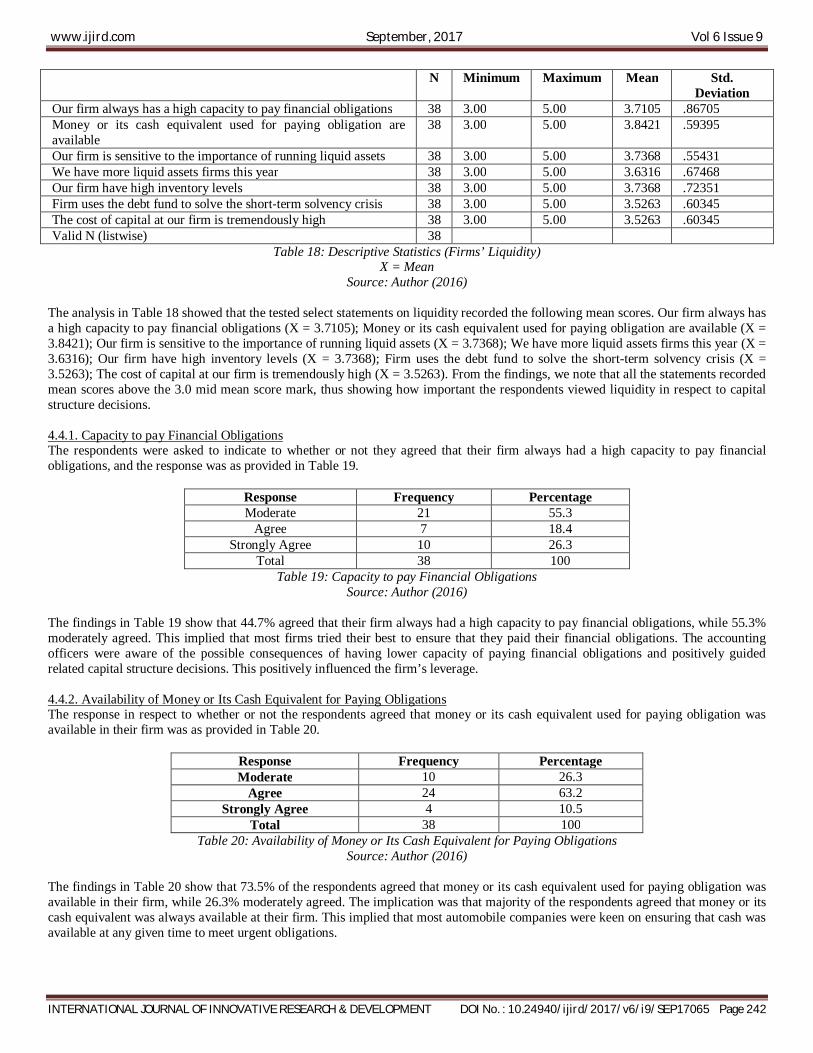
Table 18: Descriptive Statistics (Firms’ Liquidity) X = Mean
Source: Author (2016) The analysis in Table 18 showed that the tested select statements on liquidity recorded the following mean scores. Our firm always has a high capacity to pay financial obligations (X = 3.7105); Money or its cash equivalent used for paying obligation are available (X = 3.8421); Our firm is sensitive to the importance of running liquid assets (X = 3.7368); We have more liquid assets firms this year (X = 3.6316); Our firm have high inventory levels (X = 3.7368); Firm uses the debt fund to solve the short-term solvency crisis (X = 3.5263); The cost of capital at our firm is tremendously high (X = 3.5263). From the findings, we note that all the statements recorded mean scores above the 3.0 mid mean score mark, thus showing how important the respondents viewed liquidity in respect to capital structure decisions. 4.4.1. Capacity to pay Financial Obligations The respondents were asked to indicate to whether or not they agreed that their firm always had a high capacity to pay financial obligations, and the response was as provided in Table 19.
Response Frequency Percentage Moderate 21 55.3
Agree 7 18.4 Strongly Agree 10 26.3
Total 38 100 Table 19: Capacity to pay Financial Obligations
Source: Author (2016) The findings in Table 19 show that 44.7% agreed that their firm always had a high capacity to pay financial obligations, while 55.3% moderately agreed. This implied that most firms tried their best to ensure that they paid their financial obligations. The accounting officers were aware of the possible consequences of having lower capacity of paying financial obligations and positively guided related capital structure decisions. This positively influenced the firm’s leverage. 4.4.2. Availability of Money or Its Cash Equivalent for Paying Obligations The response in respect to whether or not the respondents agreed that money or its cash equivalent used for paying obligation was available in their firm was as provided in Table 20.
Response Frequency Percentage Moderate 10 26.3
Agree 24 63.2 Strongly Agree 4 10.5
Total 38 100 Table 20: Availability of Money or Its Cash Equivalent for Paying Obligations
Source: Author (2016) The findings in Table 20 show that 73.5% of the respondents agreed that money or its cash equivalent used for paying obligation was available in their firm, while 26.3% moderately agreed. The implication was that majority of the respondents agreed that money or its cash equivalent was always available at their firm. This implied that most automobile companies were keen on ensuring that cash was available at any given time to meet urgent obligations.
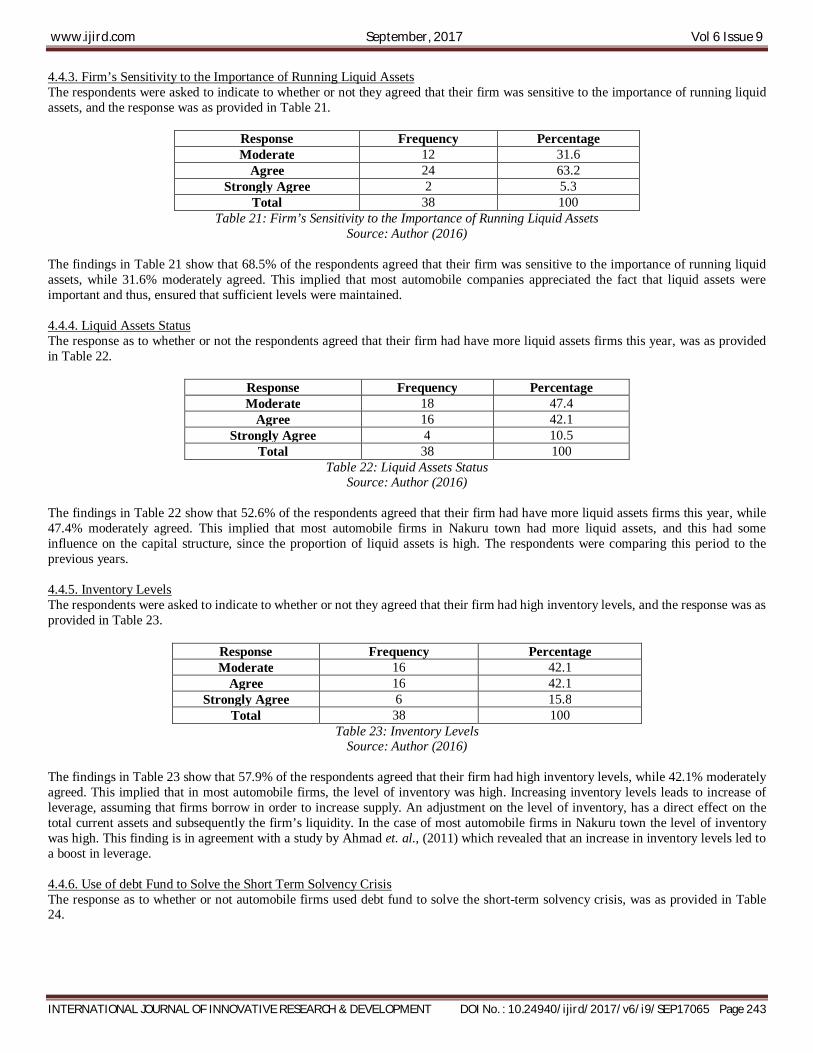
www.ijird.com September, 2017 Vol 6 Issue 9
INTERNATIONAL JOURNAL OF INNOVATIVE RESEARCH & DEVELOPMENT DOI No. : 10.24940/ijird/2017/v6/i9/SEP17065 Page 243
4.4.3. Firm’s Sensitivity to the Importance of Running Liquid Assets The respondents were asked to indicate to whether or not they agreed that their firm was sensitive to the importance of running liquid assets, and the response was as provided in Table 21.
Response Frequency Percentage Moderate 12 31.6
Agree 24 63.2 Strongly Agree 2 5.3
Total 38 100 Table 21: Firm’s Sensitivity to the Importance of Running Liquid Assets
Source: Author (2016) The findings in Table 21 show that 68.5% of the respondents agreed that their firm was sensitive to the importance of running liquid assets, while 31.6% moderately agreed. This implied that most automobile companies appreciated the fact that liquid assets were important and thus, ensured that sufficient levels were maintained. 4.4.4. Liquid Assets Status The response as to whether or not the respondents agreed that their firm had have more liquid assets firms this year, was as provided in Table 22.
Response Frequency Percentage Moderate 18 47.4
Agree 16 42.1 Strongly Agree 4 10.5
Total 38 100 Table 22: Liquid Assets Status
Source: Author (2016) The findings in Table 22 show that 52.6% of the respondents agreed that their firm had have more liquid assets firms this year, while 47.4% moderately agreed. This implied that most automobile firms in Nakuru town had more liquid assets, and this had some influence on the capital structure, since the proportion of liquid assets is high. The respondents were comparing this period to the previous years. 4.4.5. Inventory Levels The respondents were asked to indicate to whether or not they agreed that their firm had high inventory levels, and the response was as provided in Table 23.
Response Frequency Percentage Moderate 16 42.1
Agree 16 42.1 Strongly Agree 6 15.8
Total 38 100 Table 23: Inventory Levels
Source: Author (2016) The findings in Table 23 show that 57.9% of the respondents agreed that their firm had high inventory levels, while 42.1% moderately agreed. This implied that in most automobile firms, the level of inventory was high. Increasing inventory levels leads to increase of leverage, assuming that firms borrow in order to increase supply. An adjustment on the level of inventory, has a direct effect on the total current assets and subsequently the firm’s liquidity. In the case of most automobile firms in Nakuru town the level of inventory was high. This finding is in agreement with a study by Ahmad et. al., (2011) which revealed that an increase in inventory levels led to a boost in leverage. 4.4.6. Use of debt Fund to Solve the Short Term Solvency Crisis The response as to whether or not automobile firms used debt fund to solve the short-term solvency crisis, was as provided in Table 24.
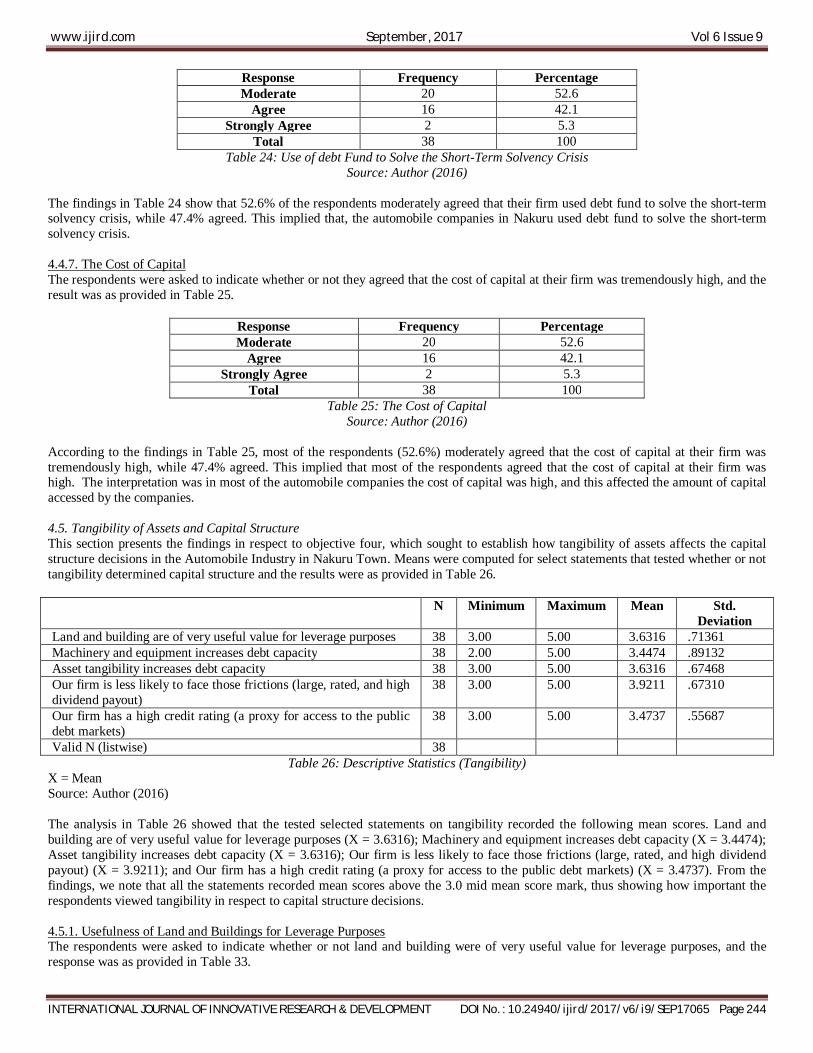
www.ijird.com September, 2017 Vol 6 Issue 9
INTERNATIONAL JOURNAL OF INNOVATIVE RESEARCH & DEVELOPMENT DOI No. : 10.24940/ijird/2017/v6/i9/SEP17065 Page 244
Response Frequency Percentage Moderate 20 52.6
Agree 16 42.1 Strongly Agree 2 5.3
Total 38 100 Table 24: Use of debt Fund to Solve the Short-Term Solvency Crisis
Source: Author (2016) The findings in Table 24 show that 52.6% of the respondents moderately agreed that their firm used debt fund to solve the short-term solvency crisis, while 47.4% agreed. This implied that, the automobile companies in Nakuru used debt fund to solve the short-term solvency crisis. 4.4.7. The Cost of Capital The respondents were asked to indicate whether or not they agreed that the cost of capital at their firm was tremendously high, and the result was as provided in Table 25.
Response Frequency Percentage Moderate 20 52.6
Agree 16 42.1 Strongly Agree 2 5.3
Total 38 100 Table 25: The Cost of Capital
Source: Author (2016) According to the findings in Table 25, most of the respondents (52.6%) moderately agreed that the cost of capital at their firm was tremendously high, while 47.4% agreed. This implied that most of the respondents agreed that the cost of capital at their firm was high. The interpretation was in most of the automobile companies the cost of capital was high, and this affected the amount of capital accessed by the companies. 4.5. Tangibility of Assets and Capital Structure This section presents the findings in respect to objective four, which sought to establish how tangibility of assets affects the capital structure decisions in the Automobile Industry in Nakuru Town. Means were computed for select statements that tested whether or not tangibility determined capital structure and the results were as provided in Table 26.
N Minimum Maximum Mean Std. Deviation
Land and building are of very useful value for leverage purposes 38 3.00 5.00 3.6316 .71361 Machinery and equipment increases debt capacity 38 2.00 5.00 3.4474 .89132 Asset tangibility increases debt capacity 38 3.00 5.00 3.6316 .67468 Our firm is less likely to face those frictions (large, rated, and high dividend payout)
38 3.00 5.00 3.9211 .67310
Our firm has a high credit rating (a proxy for access to the public debt markets)
38 3.00 5.00 3.4737 .55687
Valid N (listwise) 38 Table 26: Descriptive Statistics (Tangibility)
X = Mean Source: Author (2016) The analysis in Table 26 showed that the tested selected statements on tangibility recorded the following mean scores. Land and building are of very useful value for leverage purposes (X = 3.6316); Machinery and equipment increases debt capacity (X = 3.4474); Asset tangibility increases debt capacity (X = 3.6316); Our firm is less likely to face those frictions (large, rated, and high dividend payout) (X = 3.9211); and Our firm has a high credit rating (a proxy for access to the public debt markets) (X = 3.4737). From the findings, we note that all the statements recorded mean scores above the 3.0 mid mean score mark, thus showing how important the respondents viewed tangibility in respect to capital structure decisions. 4.5.1. Usefulness of Land and Buildings for Leverage Purposes The respondents were asked to indicate whether or not land and building were of very useful value for leverage purposes, and the response was as provided in Table 33.
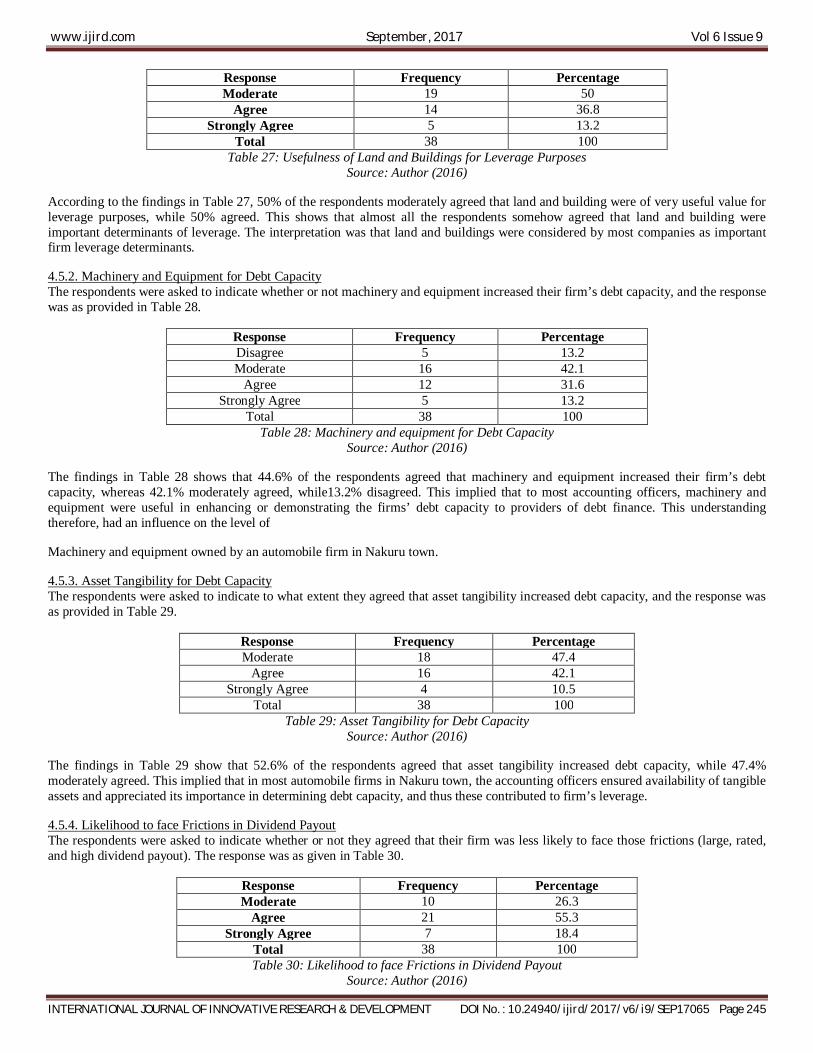
www.ijird.com September, 2017 Vol 6 Issue 9
INTERNATIONAL JOURNAL OF INNOVATIVE RESEARCH & DEVELOPMENT DOI No. : 10.24940/ijird/2017/v6/i9/SEP17065 Page 245
Response Frequency Percentage Moderate 19 50
Agree 14 36.8 Strongly Agree 5 13.2
Total 38 100 Table 27: Usefulness of Land and Buildings for Leverage Purposes
Source: Author (2016) According to the findings in Table 27, 50% of the respondents moderately agreed that land and building were of very useful value for leverage purposes, while 50% agreed. This shows that almost all the respondents somehow agreed that land and building were important determinants of leverage. The interpretation was that land and buildings were considered by most companies as important firm leverage determinants. 4.5.2. Machinery and Equipment for Debt Capacity The respondents were asked to indicate whether or not machinery and equipment increased their firm’s debt capacity, and the response was as provided in Table 28.
Response Frequency Percentage Disagree 5 13.2 Moderate 16 42.1
Agree 12 31.6 Strongly Agree 5 13.2
Total 38 100 Table 28: Machinery and equipment for Debt Capacity
Source: Author (2016) The findings in Table 28 shows that 44.6% of the respondents agreed that machinery and equipment increased their firm’s debt capacity, whereas 42.1% moderately agreed, while13.2% disagreed. This implied that to most accounting officers, machinery and equipment were useful in enhancing or demonstrating the firms’ debt capacity to providers of debt finance. This understanding therefore, had an influence on the level of Machinery and equipment owned by an automobile firm in Nakuru town. 4.5.3. Asset Tangibility for Debt Capacity The respondents were asked to indicate to what extent they agreed that asset tangibility increased debt capacity, and the response was as provided in Table 29.
Response Frequency Percentage Moderate 18 47.4
Agree 16 42.1 Strongly Agree 4 10.5
Total 38 100 Table 29: Asset Tangibility for Debt Capacity
Source: Author (2016) The findings in Table 29 show that 52.6% of the respondents agreed that asset tangibility increased debt capacity, while 47.4% moderately agreed. This implied that in most automobile firms in Nakuru town, the accounting officers ensured availability of tangible assets and appreciated its importance in determining debt capacity, and thus these contributed to firm’s leverage. 4.5.4. Likelihood to face Frictions in Dividend Payout The respondents were asked to indicate whether or not they agreed that their firm was less likely to face those frictions (large, rated, and high dividend payout). The response was as given in Table 30.
Response Frequency Percentage Moderate 10 26.3
Agree 21 55.3 Strongly Agree 7 18.4
Total 38 100 Table 30: Likelihood to face Frictions in Dividend Payout
Source: Author (2016)
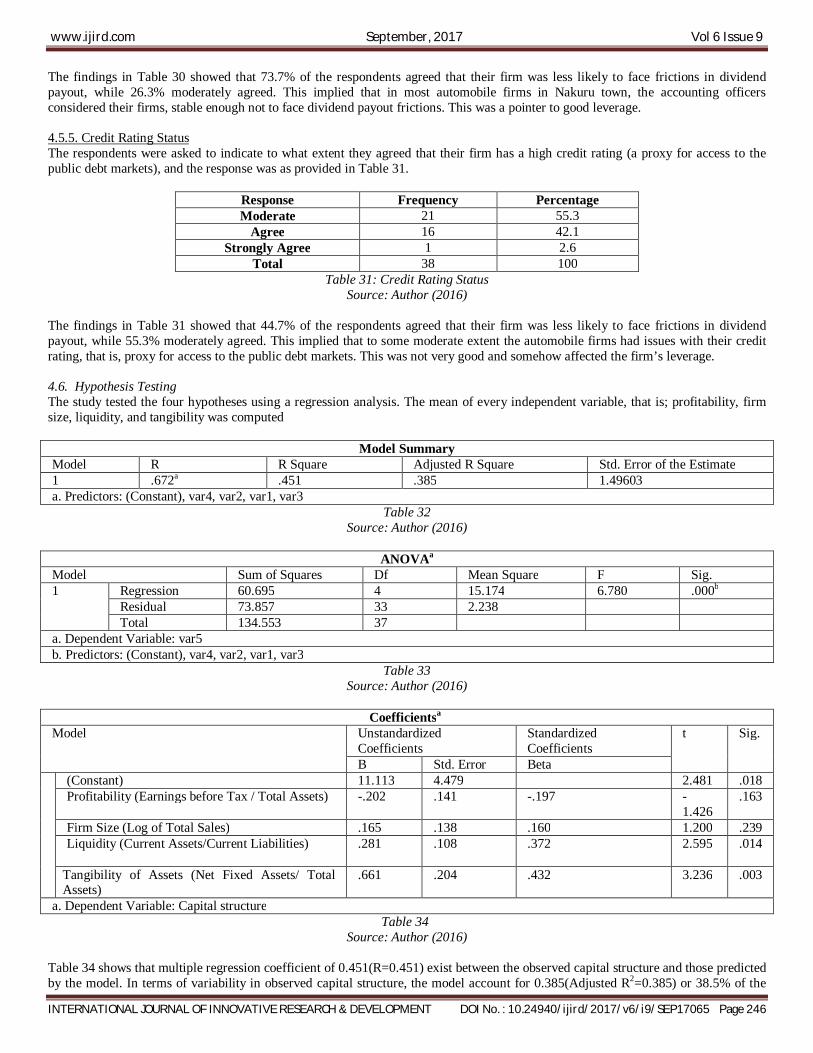
www.ijird.com September, 2017 Vol 6 Issue 9
INTERNATIONAL JOURNAL OF INNOVATIVE RESEARCH & DEVELOPMENT DOI No. : 10.24940/ijird/2017/v6/i9/SEP17065 Page 246
The findings in Table 30 showed that 73.7% of the respondents agreed that their firm was less likely to face frictions in dividend payout, while 26.3% moderately agreed. This implied that in most automobile firms in Nakuru town, the accounting officers considered their firms, stable enough not to face dividend payout frictions. This was a pointer to good leverage. 4.5.5. Credit Rating Status The respondents were asked to indicate to what extent they agreed that their firm has a high credit rating (a proxy for access to the public debt markets), and the response was as provided in Table 31.
Response Frequency Percentage Moderate 21 55.3
Agree 16 42.1 Strongly Agree 1 2.6
Total 38 100 Table 31: Credit Rating Status
Source: Author (2016) The findings in Table 31 showed that 44.7% of the respondents agreed that their firm was less likely to face frictions in dividend payout, while 55.3% moderately agreed. This implied that to some moderate extent the automobile firms had issues with their credit rating, that is, proxy for access to the public debt markets. This was not very good and somehow affected the firm’s leverage. 4.6. Hypothesis Testing The study tested the four hypotheses using a regression analysis. The mean of every independent variable, that is; profitability, firm size, liquidity, and tangibility was computed
Model Summary Model R R Square Adjusted R Square Std. Error of the Estimate 1 .672a .451 .385 1.49603 a. Predictors: (Constant), var4, var2, var1, var3
Table 32 Source: Author (2016)
ANOVAa
Model Sum of Squares Df Mean Square F Sig. 1 Regression 60.695 4 15.174 6.780 .000b
Residual 73.857 33 2.238 Total 134.553 37
a. Dependent Variable: var5 b. Predictors: (Constant), var4, var2, var1, var3
Table 33 Source: Author (2016)
Coefficientsa
Model Unstandardized Coefficients
Standardized Coefficients
t Sig.
B Std. Error Beta (Constant) 11.113 4.479 2.481 .018
Profitability (Earnings before Tax / Total Assets) -.202 .141 -.197 -1.426
.163
Firm Size (Log of Total Sales) .165 .138 .160 1.200 .239 Liquidity (Current Assets/Current Liabilities)
.281 .108 .372 2.595 .014
Tangibility of Assets (Net Fixed Assets/ Total Assets)
.661 .204 .432 3.236 .003
a. Dependent Variable: Capital structure Table 34
Source: Author (2016) Table 34 shows that multiple regression coefficient of 0.451(R=0.451) exist between the observed capital structure and those predicted by the model. In terms of variability in observed capital structure, the model account for 0.385(Adjusted R2=0.385) or 38.5% of the
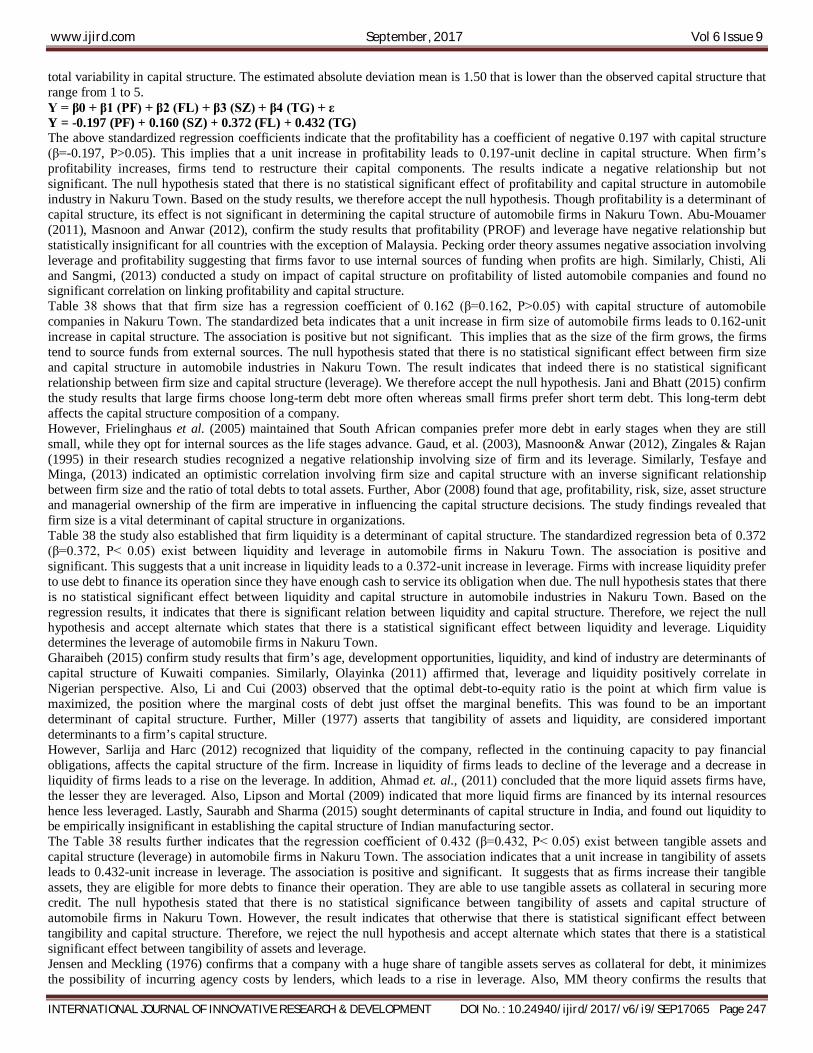
www.ijird.com September, 2017 Vol 6 Issue 9
INTERNATIONAL JOURNAL OF INNOVATIVE RESEARCH & DEVELOPMENT DOI No. : 10.24940/ijird/2017/v6/i9/SEP17065 Page 247
total variability in capital structure. The estimated absolute deviation mean is 1.50 that is lower than the observed capital structure that range from 1 to 5. Y = β0 + β1 (PF) + β2 (FL) + β3 (SZ) + β4 (TG) + ε Y = -0.197 (PF) + 0.160 (SZ) + 0.372 (FL) + 0.432 (TG) The above standardized regression coefficients indicate that the profitability has a coefficient of negative 0.197 with capital structure (β=-0.197, P>0.05). This implies that a unit increase in profitability leads to 0.197-unit decline in capital structure. When firm’s profitability increases, firms tend to restructure their capital components. The results indicate a negative relationship but not significant. The null hypothesis stated that there is no statistical significant effect of profitability and capital structure in automobile industry in Nakuru Town. Based on the study results, we therefore accept the null hypothesis. Though profitability is a determinant of capital structure, its effect is not significant in determining the capital structure of automobile firms in Nakuru Town. Abu-Mouamer (2011), Masnoon and Anwar (2012), confirm the study results that profitability (PROF) and leverage have negative relationship but statistically insignificant for all countries with the exception of Malaysia. Pecking order theory assumes negative association involving leverage and profitability suggesting that firms favor to use internal sources of funding when profits are high. Similarly, Chisti, Ali and Sangmi, (2013) conducted a study on impact of capital structure on profitability of listed automobile companies and found no significant correlation on linking profitability and capital structure. Table 38 shows that that firm size has a regression coefficient of 0.162 (β=0.162, P>0.05) with capital structure of automobile companies in Nakuru Town. The standardized beta indicates that a unit increase in firm size of automobile firms leads to 0.162-unit increase in capital structure. The association is positive but not significant. This implies that as the size of the firm grows, the firms tend to source funds from external sources. The null hypothesis stated that there is no statistical significant effect between firm size and capital structure in automobile industries in Nakuru Town. The result indicates that indeed there is no statistical significant relationship between firm size and capital structure (leverage). We therefore accept the null hypothesis. Jani and Bhatt (2015) confirm the study results that large firms choose long-term debt more often whereas small firms prefer short term debt. This long-term debt affects the capital structure composition of a company. However, Frielinghaus et al. (2005) maintained that South African companies prefer more debt in early stages when they are still small, while they opt for internal sources as the life stages advance. Gaud, et al. (2003), Masnoon& Anwar (2012), Zingales & Rajan (1995) in their research studies recognized a negative relationship involving size of firm and its leverage. Similarly, Tesfaye and Minga, (2013) indicated an optimistic correlation involving firm size and capital structure with an inverse significant relationship between firm size and the ratio of total debts to total assets. Further, Abor (2008) found that age, profitability, risk, size, asset structure and managerial ownership of the firm are imperative in influencing the capital structure decisions. The study findings revealed that firm size is a vital determinant of capital structure in organizations. Table 38 the study also established that firm liquidity is a determinant of capital structure. The standardized regression beta of 0.372 (β=0.372, P< 0.05) exist between liquidity and leverage in automobile firms in Nakuru Town. The association is positive and significant. This suggests that a unit increase in liquidity leads to a 0.372-unit increase in leverage. Firms with increase liquidity prefer to use debt to finance its operation since they have enough cash to service its obligation when due. The null hypothesis states that there is no statistical significant effect between liquidity and capital structure in automobile industries in Nakuru Town. Based on the regression results, it indicates that there is significant relation between liquidity and capital structure. Therefore, we reject the null hypothesis and accept alternate which states that there is a statistical significant effect between liquidity and leverage. Liquidity determines the leverage of automobile firms in Nakuru Town. Gharaibeh (2015) confirm study results that firm’s age, development opportunities, liquidity, and kind of industry are determinants of capital structure of Kuwaiti companies. Similarly, Olayinka (2011) affirmed that, leverage and liquidity positively correlate in Nigerian perspective. Also, Li and Cui (2003) observed that the optimal debt-to-equity ratio is the point at which firm value is maximized, the position where the marginal costs of debt just offset the marginal benefits. This was found to be an important determinant of capital structure. Further, Miller (1977) asserts that tangibility of assets and liquidity, are considered important determinants to a firm’s capital structure. However, Sarlija and Harc (2012) recognized that liquidity of the company, reflected in the continuing capacity to pay financial obligations, affects the capital structure of the firm. Increase in liquidity of firms leads to decline of the leverage and a decrease in liquidity of firms leads to a rise on the leverage. In addition, Ahmad et. al., (2011) concluded that the more liquid assets firms have, the lesser they are leveraged. Also, Lipson and Mortal (2009) indicated that more liquid firms are financed by its internal resources hence less leveraged. Lastly, Saurabh and Sharma (2015) sought determinants of capital structure in India, and found out liquidity to be empirically insignificant in establishing the capital structure of Indian manufacturing sector. The Table 38 results further indicates that the regression coefficient of 0.432 (β=0.432, P< 0.05) exist between tangible assets and capital structure (leverage) in automobile firms in Nakuru Town. The association indicates that a unit increase in tangibility of assets leads to 0.432-unit increase in leverage. The association is positive and significant. It suggests that as firms increase their tangible assets, they are eligible for more debts to finance their operation. They are able to use tangible assets as collateral in securing more credit. The null hypothesis stated that there is no statistical significance between tangibility of assets and capital structure of automobile firms in Nakuru Town. However, the result indicates that otherwise that there is statistical significant effect between tangibility and capital structure. Therefore, we reject the null hypothesis and accept alternate which states that there is a statistical significant effect between tangibility of assets and leverage. Jensen and Meckling (1976) confirms that a company with a huge share of tangible assets serves as collateral for debt, it minimizes the possibility of incurring agency costs by lenders, which leads to a rise in leverage. Also, MM theory confirms the results that
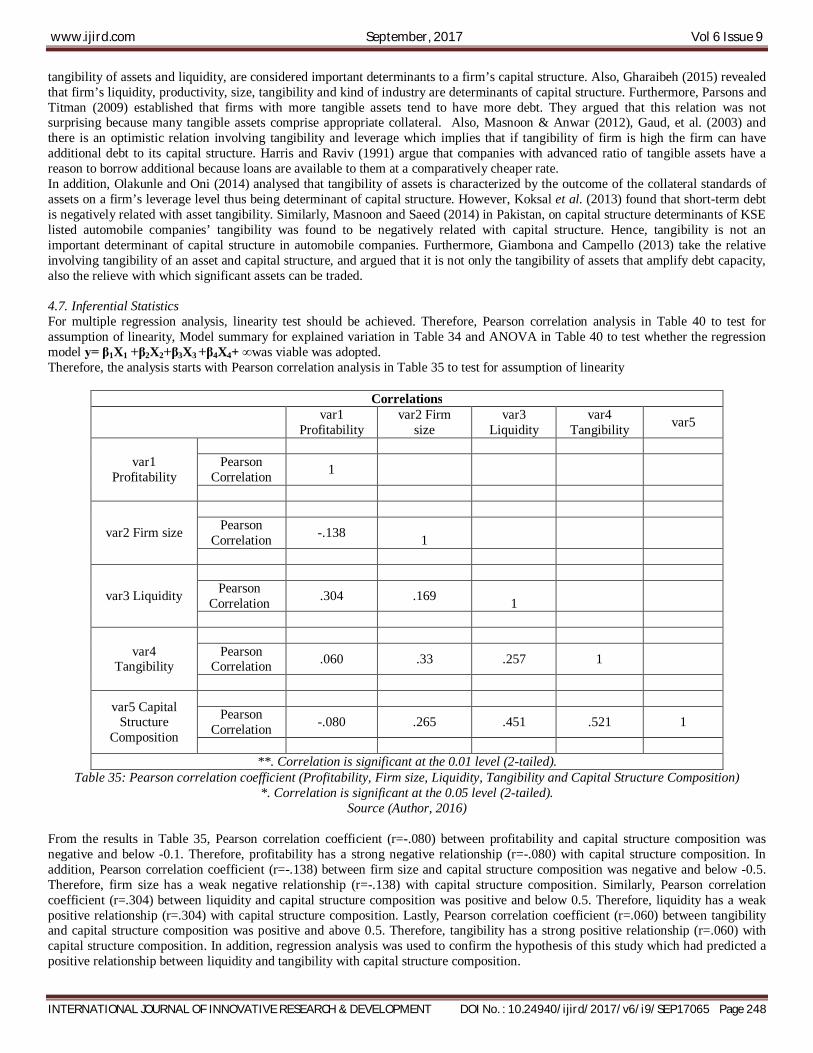
www.ijird.com September, 2017 Vol 6 Issue 9
INTERNATIONAL JOURNAL OF INNOVATIVE RESEARCH & DEVELOPMENT DOI No. : 10.24940/ijird/2017/v6/i9/SEP17065 Page 248
tangibility of assets and liquidity, are considered important determinants to a firm’s capital structure. Also, Gharaibeh (2015) revealed that firm’s liquidity, productivity, size, tangibility and kind of industry are determinants of capital structure. Furthermore, Parsons and Titman (2009) established that firms with more tangible assets tend to have more debt. They argued that this relation was not surprising because many tangible assets comprise appropriate collateral. Also, Masnoon & Anwar (2012), Gaud, et al. (2003) and there is an optimistic relation involving tangibility and leverage which implies that if tangibility of firm is high the firm can have additional debt to its capital structure. Harris and Raviv (1991) argue that companies with advanced ratio of tangible assets have a reason to borrow additional because loans are available to them at a comparatively cheaper rate. In addition, Olakunle and Oni (2014) analysed that tangibility of assets is characterized by the outcome of the collateral standards of assets on a firm’s leverage level thus being determinant of capital structure. However, Koksal et al. (2013) found that short-term debt is negatively related with asset tangibility. Similarly, Masnoon and Saeed (2014) in Pakistan, on capital structure determinants of KSE listed automobile companies’ tangibility was found to be negatively related with capital structure. Hence, tangibility is not an important determinant of capital structure in automobile companies. Furthermore, Giambona and Campello (2013) take the relative involving tangibility of an asset and capital structure, and argued that it is not only the tangibility of assets that amplify debt capacity, also the relieve with which significant assets can be traded. 4.7. Inferential Statistics For multiple regression analysis, linearity test should be achieved. Therefore, Pearson correlation analysis in Table 40 to test for assumption of linearity, Model summary for explained variation in Table 34 and ANOVA in Table 40 to test whether the regression model y= β1X1 +β2X2+β3X3 +β4X4+ ∞was viable was adopted. Therefore, the analysis starts with Pearson correlation analysis in Table 35 to test for assumption of linearity
Correlations
var1 Profitability
var2 Firm size
var3 Liquidity
var4 Tangibility var5
var1 Profitability
Pearson
Correlation 1
var2 Firm size
Pearson
Correlation -.138 1
var3 Liquidity
Pearson
Correlation .304 .169 1
var4 Tangibility
Pearson
Correlation .060 .33 .257 1
var5 Capital Structure
Composition
Pearson
Correlation -.080 .265 .451 .521 1
**. Correlation is significant at the 0.01 level (2-tailed).
Table 35: Pearson correlation coefficient (Profitability, Firm size, Liquidity, Tangibility and Capital Structure Composition) *. Correlation is significant at the 0.05 level (2-tailed).
Source (Author, 2016) From the results in Table 35, Pearson correlation coefficient (r=-.080) between profitability and capital structure composition was negative and below -0.1. Therefore, profitability has a strong negative relationship (r=-.080) with capital structure composition. In addition, Pearson correlation coefficient (r=-.138) between firm size and capital structure composition was negative and below -0.5. Therefore, firm size has a weak negative relationship (r=-.138) with capital structure composition. Similarly, Pearson correlation coefficient (r=.304) between liquidity and capital structure composition was positive and below 0.5. Therefore, liquidity has a weak positive relationship (r=.304) with capital structure composition. Lastly, Pearson correlation coefficient (r=.060) between tangibility and capital structure composition was positive and above 0.5. Therefore, tangibility has a strong positive relationship (r=.060) with capital structure composition. In addition, regression analysis was used to confirm the hypothesis of this study which had predicted a positive relationship between liquidity and tangibility with capital structure composition.
www.ijird.com September, 2017 Vol 6 Issue 9
INTERNATIONAL JOURNAL OF INNOVATIVE RESEARCH & DEVELOPMENT DOI No. : 10.24940/ijird/2017/v6/i9/SEP17065 Page 249
5. Summary of Findings, Conclusions and Recommendations 5.1. Summary of the Findings The summary of study findings was as provided in this section. The first objective sought to establish how profitability affects the capital structure decisions in the Automobile Industry in Nakuru Town. From the findings, it emerged that in many of the automobile companies, profits were realized on revenue gained from insurance companies the study also showed that most firms maintained lower debt ratio, since more funds were generated from within the organization. It was also established that in most firms long-term and short-term debt ratios affected profitability. Firms’ size and sales growth were found to be important determinants of profitability in most automobile firms. Most firms’ capital structure decisions and profitability led to good leverage, however not a significant capital structure determinant. The second objective of the study was to find out how size of the firm affects the capital structure decisions in the Automobile Industry in Nakuru Town. Most of the accounting officers agreed that firm size was a critical determinant of leverage. According to most of them, the size of their firm affected its capacity for expansion of projects, new product lines, attainment of other firms and maintenance, and replacement of existing assets. The accounting officers appreciated the fact that lower variance of earnings enabled their firm to tolerate high debt. The respondents agreed that the size of the firm determined its ability to resolve information asymmetries with lenders. It was also found that majority of the accounting officers, in reference to their respective firms, moderately agreed that lenders to larger firms are more likely to get repaid than lenders to smaller firms. They indicated that large firms were in most cases diversified, and were less susceptible to bankruptcy. According to regression analysis firm size is not a significant predictor to capital structure in automobile firms in Nakuru town. The third objective of the study was to find out how firm’s liquidity affected capital structure decisions in the Automobile Industry in Nakuru Town. It was established that most of the respondents moderately agreed that their firm always had a high capacity to pay financial obligations. The study also found out that majority of the respondents agreed that money or its cash equivalent used for paying obligation was available in their firm. According to the accounting officers, their firm had more liquid assets firms this year in comparison to the previous year. The study also established that most of the respondents agreed that their firm had high inventory levels; and that most of them moderately agreed that their firm used debt fund to solve the short-term solvency crisis. It was noted that according to most of the respondents, the cost of capital at their firm was tremendously high. According to regression analysis computed liquidity was found to be a significant determinant of capital structure. The null hypothesis was rejected and alternate accepted. Finally, the study sought to establish how tangibility of assets affects the capital structure decisions in the Automobile Industry in Nakuru Town. Almost all the respondents moderately agreed that land and building were of very useful value for leverage purposes. The study established that most of the accounting officers moderately agreed that machinery and equipment increased their firm’s debt capacity. They agreed that asset tangibility increased debt capacity. It was also established that majority of the respondents agreed that their firm was less likely to face frictions in dividend payout, while most moderately agreed that their firm was less likely to face frictions in dividend payout. It emerged from the regression analysis that tangibility of assets was a significant determinant of capital structure in automobile firms in Nakuru town. The null hypothesis was rejected and alternate accepted. 5.2. Conclusions From the findings, the study concluded the following. The study concluded that profitability affected the capital structure decisions in the Automobile Industry in Nakuru Town. This was evidenced by the fact that there were profits realized from insurance activities and this helped contribute a better level of leverage. The fact that most firms strive towards maintaining a lower debt ratio also boosted the firms leverage. This was made possible because most firms generated internal funds. The accounting officers indicated that long term debt ratios and short-term debt ratios affected profitability. This affected the level of profitability because some profits were used up to balance the debts, thus affecting the level of firm’s leverage. However, it is important to note that in most firms, good capital structure decisions and profitability led to a better mix of debt and equity. The findings show that size of the firm affected the capital structure decisions in the Automobile Industry in Nakuru Town. This is demonstrated by the fact that in most of the firms, firm size determined the capacity for extension of projects, additional product lines, acquisitions of other firms and maintenance, and replacement of existing assets. This was what was happening in most firms in Nakuru, additional projects, products and assets contributed to high leverage in the organizations. Large firms were able to resolve information irregularities with lenders, because the lenders in most cases were few, following large scale economy of sale. They could easily negotiate with lenders, given that they are large and have convenient collateral. Lenders to larger firms easily repaid than lenders to smaller firms. Large firms were able to adopt product diversification and were less susceptible to bankruptcy. All these attributes contributed to higher leverage. Therefore, the study concludes that large firms yielded good leverage compared to small firms in the automobile industry in Nakuru town. It was established that firm’s liquidity significantly affects capital structure decisions in the Automobile Industry in Nakuru Town. This is because in this industry, the players always had a high capacity to pay financial obligations. The firms were keen on ensuring that cash was available at any given time to meet urgent obligations. Money or its cash equivalent used for paying obligation was available in their firm. Availability of liquid assets in most firms meant that they could easily be converted into cash or its equivalent, and this could easily affect the level of leverage. Another advantage was that most automobile firms in Nakuru town had high inventory levels. Short term solvency crisis was easily managed in most firms using debt fund.
www.ijird.com September, 2017 Vol 6 Issue 9
INTERNATIONAL JOURNAL OF INNOVATIVE RESEARCH & DEVELOPMENT DOI No. : 10.24940/ijird/2017/v6/i9/SEP17065 Page 250
The findings show that tangibility of assets though an important factor of capital structure; significantly affect the capital structure decisions in the Automobile Industry in Nakuru Town. Land and building were of very useful value for leverage purposes in some firms, some appeared to be operating on leased property. To a lesser extent machinery and equipment increased their firm’s debt capacity. This was most likely due to the fact that machinery and equipment were rarely used by these firms for debt or loan acquisition. Another important aspect is the fact that less friction was experienced in the payment of dividends. This is because most of these firms were privately owned, some were family companies. Therefore, the study concluded that tangibility of assets and liquidity has a significant predictor of capital structure in automobile firms in Nakuru town. 5.3. Recommendations The study recommendations were as follows: The firms in the automobile industry seem to rely heavily on internal funds, however, this limits the level of profits made, and thus lower leverage. There is need for good financial planning and forecasting which will be associated with the company profitability from which the firm can position it on most economical external financing sources to finances quoted firm’s financial needs. There is a significant relationship between tangibility of assets and leverage in most automobile firms in Nakuru town. The firms should increase their asset structure as such to lower their leverage and consequently minimize the chances of bankruptcy and lower future borrowing cost. Considering the high cost of capital reported in this study, automobile firms in Nakuru Town should seek on measurers which will minimize the overall cost of capital by postponing seeking fresh capital issue by seeking use of internal sources and borrow from cheaper sources of debt. The large firms of Automobile Sector having superior asset structure should finance their growth and current operations by debt financing and the firms with increasing cost of debt should use retained earnings and then equity financing if further funds are required. This study helped to analyze the determinants of capital structure in Automobile firms. However, there is need for a comparative study to be carried out among different industry sectors as well as different countries since they are not operating within the same legal frame work. 5.4. Areas of Further Research As this study was undertaken in Nakuru Town a further research can be undertaken in other towns to observe whether the findings will be replicated or not. As this study was undertaken within automobile firms and so a study can be undertaken in other sectors of the economy on determinants of capital structure. 6. Acknowledgment I thank the Almighty God for the gift of life and for giving me the skills, knowledge and energy to be able to complete this paper and in postgraduate degree of Master of Business Administration. Similarly, I give special thanks to my supervisor, Dr Caroline Ayuma and Dr Edmond Were for providing unlimited, invaluable and active guidance throughout the study. Their immense command and knowledge of the subject matter enabled me to shape this research project to the product it is now. Your support and professionalism has come a long way in making this work presentable. I also wish to acknowledge the management of automobile firms in Nakuru town for their support and participation in the study. Finally, I owe my gratitude to a great pool of people who in one way or another contributed towards the completion of this project. To all of you, I say a big Thank you. I would like to express my sincere gratitude to all my classmates at Kisii University for their contribution towards the success of this dissertation. 7. List of Abbreviations
GMEA General Motors East Africa NSE Nairobi Stock Exchange SMEs Small and Medium Enterprises SPSS Statistical Package for Social Sciences
8. References
i. Abu Mouamer, F. M. (2011) "The determinants of capital structure of Palestine-listed companies", The Journal of Risk Finance, Vol. 12 Issue: 3, pp.226–241
ii. Ahmad, F., Nasir, R., Ali, M., & Ullah, W. (2011). Extension of determinants of capital structure: Evidence from Pakistani non-financial firms. African Journal of Business Management, 5(28), 11375-11385.
iii. Anderson, R. W. (2002). Capital Structure, Firm Liquidity and Growth, available at: http://www.nbb.be/doc/ts/publications/wp/WP27en.pdf retrieved on 1st May 2016).
iv. Baker, M., Wurgler, J., 2002. Market timing and capital structure. Journal of Finance 57, 1-32. v. Bevan A.A. & Danbolt J. (2002). “Capital structure and its determinants in the UK: A decompositional analysis. Applied
Financial Economics, 12, 159-170. vi. Campello, M., Giambona, E., 2013. Real assets and capital structure. Journal of Financial and Quantitative Analysis 48, 1-37.
www.ijird.com September, 2017 Vol 6 Issue 9
INTERNATIONAL JOURNAL OF INNOVATIVE RESEARCH & DEVELOPMENT DOI No. : 10.24940/ijird/2017/v6/i9/SEP17065 Page 251
vii. Chebet, C. & Okeyo, V. (2016). High Demand for Housing alters Nakuru’s Skyline. Available at http://www.businessdailyafrica.com/Corporate-News/High-demand-for-housing-alters-Nakuru-skyline/-/539550/1884888/-/fscdtwz/-/index.html
viii. Chisti, A. Ali, A. and Sangmi, A. (2013). Impact of Capital Structure on Profitability of Listed Companies (Evidence from India). The USV annals of Economics and public administration.
ix. Engel, N., Braun, R., & Achleitner, A. (2015). Leverage and the performance of buyouts (How) does the use of debt Impact equity returns? Z Betriebswirtsch, 82, 451–490.
x. Farooq, U. (2013). What Is Census Method of Data Collection? Advantages and Disadvantages. Available at http://www.studylecturenotes.com/social-research-methodology/what-is-census-method-of-data-collection-advantages-disadvantages
xi. Gaud, P., Jani, E., Hoesli, M. and Bender, Andre. (2003). The capital structure of Swiss companies: An empirical analysis using dynamic panel data; FAME, Research Paper 68.
xii. Gharaibeh, A. (2015). The Determinants of Capital Structure: Empirical Evidence from Kuwait. European Journal of Business, Economics and Accountancy, 3 (6), 1-25
xiii. Gowri, S. (2006). Capital Structure of Select Companies in Indian Automobile Industry: A SEM Approach. Research Journal of Social Science and Management. ISSN: 2251-1571
xiv. Grechaniuk, B. (2009). Corporate Capital Structure Choice: Does Managers’ Gender Matter. Kyiv School of Economics. xv. Groth J.C. & Anderson R.C. (1997). Capital structure: perspectives for managers. Management Decision, 35(7), 552-561.
xvi. Hall G.C., Hutchinson P.J., & Michaelas N., (2004). Determinants of the Capital Structures of European SMEs, Journal of Business Finance and Accounting, Vol.31, No.5-6, 711-728,
xvii. Investment, American Economic Review, 48, 261-297. xviii. Jani, R and Bhatt, S. (2015). Capital Structure Determinants: A Case Study of Automobile Industry. IJRAR- International
Journal of Research and Analytical Reviews, 2, (1), 67-71. xix. Jensen & Meckling, W. (1976). Theory of the firm: Managerial behavior, agency costs, and capital structure. Journal of
Financial Economics 3, 305-360. xx. Jensen M.C. & Meckling W.H. (1976). Theory of the firm: managerial behaviour, agency costs and the ownership structure.
Journal of Financial Economics, 3, 305 – 360. xxi. Kramer, R. (2015). Taxation and capital structure choice: The role of ownership. Scandinavian Journal of Economics, 117(3),
957–982. xxii. Li, H . , & Cui, L. (2003). Empirical Study of Capital Structure on Agency Costs in Chinese Listed Firms. Nature and
Science. 1 (1). 12-20. xxiii. Lipson, M. L. Mortal, S. (2009). Liquidity and capital structure. Journal of Financial Markets, 12, (4), pp. 611-644. xxiv. Mahmood, M. (2003), “The Relationship between Economic Growth and Capital Structure of Listed Companies: Evidence of
Japan, Malaysia, and Pakistan”, The Pakistan Development Review, PP. 727-750. xxv. Martina, H. (2015). The Relationship Between Tangible Assets and Capital Structure of Small and Medium-Sized Companies
in Croatia. God. XXVIII, BR. 1/2015. str. 213-224 xxvi. Masnoon, M. & Anwar, F. (2012). “Capital structure Determinants of KSE listed Pharmaceutical companies”, GMJACS,
Volume 2, No. 1 xxvii. Mathuva, D.M. (2013). Determinants of Corporate Inventory Holdings: Evidence from a Developing Country. The
International Journal of Applied Economics and Finance, 7: 1-22. xxviii. Miller M. (1977). Debt and Taxes. Journal of Finance, 32(2), 261-275.
xxix. Modigliani, F., Miller, M.H. (1958), The Cost of Capital Corporation Finance and the Theory of Investment. The American Economic Review,48(3),261-297
xxx. Muema, A. (2013). The Determinants of Capital Structures of Firms Listed Under the Various Market Segments in the Nairobi Securities Exchange. Published Thesis, University of Nairobi.
xxxi. Muema, A. (2013). The Determinants of Capital Structures of Firms Listed Under the Various Market Segments in the Nairobi Securities Exchange. Published Thesis, University of Nairobi.
xxxii. Mugenda, A. and Mugenda, O. (2003). Research methods; quantitative and qualitative approaches. Africa Center for Technology (ACTS), Nairobi Kenya.
xxxiii. Munene, K. (2006). Impact of Profitability on Capital Structure of Companies Listed at the NSE. (Unpublished MBA research paper). University of Nairobi, Nairobi, Kenya.
xxxiv. Nadeem, A. S. & Wang, Z (2011). Determinants of capital structure", Managerial Finance. Vol 37 xxxv. Rajan, R. G., & Zingales, L. (1995). What do we know about capital structure? Some evidence from international data. The
journal of Finance, 50(5), 1421-1460. xxxvi. Ramadan, Z. S., and Ramadan, I. Z. (2015). Capital structure and firm’s performance of Jordanian manufacturing sector.
International Journal of Economics and Finance, 7(6), 279-284. xxxvii. Salawu, R. and Agboola, A. (2008). The Determinants of Capital Structure of Large Non-Financial Listed Firms in Nigeria.
The International Journal of Business and Finance Research. 2: 75-84. xxxviii. Salawu, R. O. (2007). An empirical Analysis of the Capital Structures of selected quoted companies in Nigeria. The
International Journal of Business and Finance Research. 1(13), 375-384.
www.ijird.com September, 2017 Vol 6 Issue 9
INTERNATIONAL JOURNAL OF INNOVATIVE RESEARCH & DEVELOPMENT DOI No. : 10.24940/ijird/2017/v6/i9/SEP17065 Page 252
xxxix. Sarlija, N. and Harc, M. (2012), “The impact of liquidity on the capital structure: A Case study of Croatian firms, Business Systems Research, 3, (1), pp. 30-36.
xl. Saurabh Chadha and Anil K. Sharma (2015) "Determinants of Capital Structure: An Empirical Evaluation from India", Journal of Advances in Management Research, 12 (1), 3-14.
xli. Shah, A. and Khan, S. (2007). Determinants of Capital Structure- Evidence from Pakisatni Panel Data, International Review of Business Research Papers, Vol. 3, No.4, October 2007, Pp.265-282, available at: http://ssrn.com/abstract=1027180.
xlii. Tesfaye T.L., Minga, N. (2013). “Institutional, Macroeconomic and firm specific determinants of capital structure”, Management Research Review, Vol (36)
xliii. Tse, C., & Rodgers, T. (2014). The capital structure of Chinese listed firms: is manufacturing industry special? Managerial Finance, 40(5), 469-486.
xliv. Udomsirikul, P., S. Jumreornvong, and P. Jiraporn, Liquidity and capital structure: The case of Thailand. Journal of Multinational Financial Management, 2010.
xlv. Velnampy T & Niresh A.J. (2012). The relationship between capital structure and profitability. Global Journal of Management and Business Research. Volume 12 (13)
xlvi. Weiner, E. (2006). The New Liquidity Paradigm: Focus on Working Capital. Journal of Financial Economics, 32, 145 – 160. xlvii. Zingales, L., Rajan, R. G. (1995), „What Do We Know about Capital Structure? Some Evidence from International Data,
Journal of Finance, 50, (5), pp. 1421-1460.
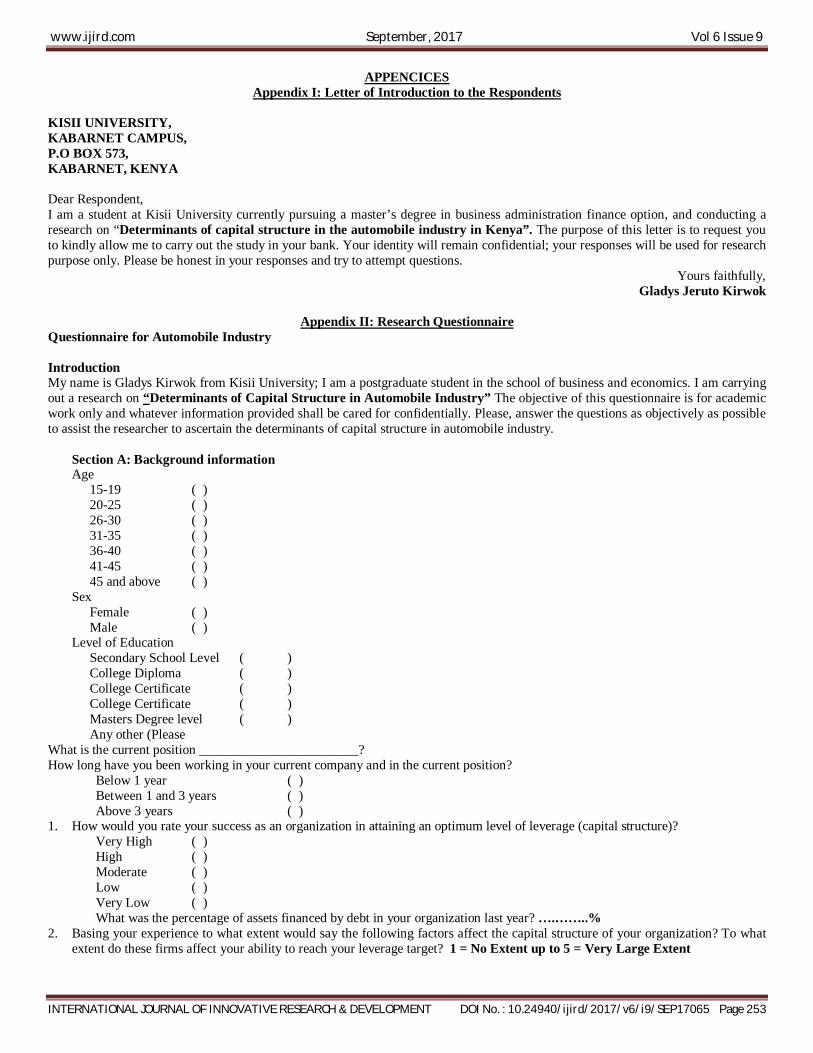
www.ijird.com September, 2017 Vol 6 Issue 9
INTERNATIONAL JOURNAL OF INNOVATIVE RESEARCH & DEVELOPMENT DOI No. : 10.24940/ijird/2017/v6/i9/SEP17065 Page 253
APPENCICES Appendix I: Letter of Introduction to the Respondents
KISII UNIVERSITY, KABARNET CAMPUS, P.O BOX 573, KABARNET, KENYA Dear Respondent, I am a student at Kisii University currently pursuing a master’s degree in business administration finance option, and conducting a research on “Determinants of capital structure in the automobile industry in Kenya”. The purpose of this letter is to request you to kindly allow me to carry out the study in your bank. Your identity will remain confidential; your responses will be used for research purpose only. Please be honest in your responses and try to attempt questions.
Yours faithfully, Gladys Jeruto Kirwok
Appendix II: Research Questionnaire
Questionnaire for Automobile Industry Introduction My name is Gladys Kirwok from Kisii University; I am a postgraduate student in the school of business and economics. I am carrying out a research on “Determinants of Capital Structure in Automobile Industry” The objective of this questionnaire is for academic work only and whatever information provided shall be cared for confidentially. Please, answer the questions as objectively as possible to assist the researcher to ascertain the determinants of capital structure in automobile industry.
Section A: Background information Age
15-19 ( ) 20-25 ( ) 26-30 ( ) 31-35 ( ) 36-40 ( ) 41-45 ( ) 45 and above ( )
Sex Female ( ) Male ( )
Level of Education Secondary School Level ( ) College Diploma ( ) College Certificate ( ) College Certificate ( ) Masters Degree level ( ) Any other (Please
What is the current position ________________________? How long have you been working in your current company and in the current position?
Below 1 year ( ) Between 1 and 3 years ( ) Above 3 years ( )
1. How would you rate your success as an organization in attaining an optimum level of leverage (capital structure)? Very High ( ) High ( ) Moderate ( ) Low ( ) Very Low ( ) What was the percentage of assets financed by debt in your organization last year? ….……..%
2. Basing your experience to what extent would say the following factors affect the capital structure of your organization? To what extent do these firms affect your ability to reach your leverage target? 1 = No Extent up to 5 = Very Large Extent
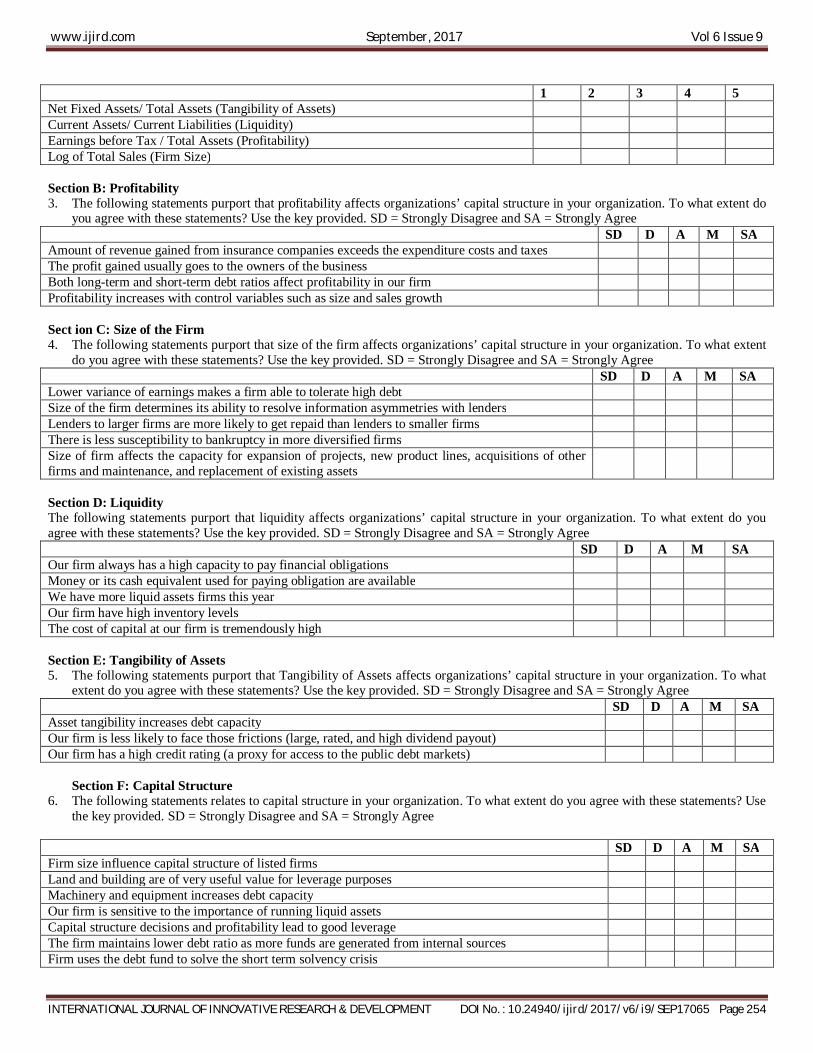
www.ijird.com September, 2017 Vol 6 Issue 9
INTERNATIONAL JOURNAL OF INNOVATIVE RESEARCH & DEVELOPMENT DOI No. : 10.24940/ijird/2017/v6/i9/SEP17065 Page 254
1 2 3 4 5 Net Fixed Assets/ Total Assets (Tangibility of Assets) Current Assets/ Current Liabilities (Liquidity) Earnings before Tax / Total Assets (Profitability) Log of Total Sales (Firm Size) Section B: Profitability 3. The following statements purport that profitability affects organizations’ capital structure in your organization. To what extent do
you agree with these statements? Use the key provided. SD = Strongly Disagree and SA = Strongly Agree SD D A M SA Amount of revenue gained from insurance companies exceeds the expenditure costs and taxes The profit gained usually goes to the owners of the business Both long-term and short-term debt ratios affect profitability in our firm Profitability increases with control variables such as size and sales growth Sect ion C: Size of the Firm 4. The following statements purport that size of the firm affects organizations’ capital structure in your organization. To what extent
do you agree with these statements? Use the key provided. SD = Strongly Disagree and SA = Strongly Agree SD D A M SA Lower variance of earnings makes a firm able to tolerate high debt Size of the firm determines its ability to resolve information asymmetries with lenders Lenders to larger firms are more likely to get repaid than lenders to smaller firms There is less susceptibility to bankruptcy in more diversified firms Size of firm affects the capacity for expansion of projects, new product lines, acquisitions of other firms and maintenance, and replacement of existing assets
Section D: Liquidity The following statements purport that liquidity affects organizations’ capital structure in your organization. To what extent do you agree with these statements? Use the key provided. SD = Strongly Disagree and SA = Strongly Agree SD D A M SA Our firm always has a high capacity to pay financial obligations Money or its cash equivalent used for paying obligation are available We have more liquid assets firms this year Our firm have high inventory levels The cost of capital at our firm is tremendously high Section E: Tangibility of Assets 5. The following statements purport that Tangibility of Assets affects organizations’ capital structure in your organization. To what
extent do you agree with these statements? Use the key provided. SD = Strongly Disagree and SA = Strongly Agree SD D A M SA Asset tangibility increases debt capacity Our firm is less likely to face those frictions (large, rated, and high dividend payout) Our firm has a high credit rating (a proxy for access to the public debt markets)
Section F: Capital Structure
6. The following statements relates to capital structure in your organization. To what extent do you agree with these statements? Use the key provided. SD = Strongly Disagree and SA = Strongly Agree
SD D A M SA Firm size influence capital structure of listed firms Land and building are of very useful value for leverage purposes Machinery and equipment increases debt capacity Our firm is sensitive to the importance of running liquid assets Capital structure decisions and profitability lead to good leverage The firm maintains lower debt ratio as more funds are generated from internal sources Firm uses the debt fund to solve the short term solvency crisis
www.ijird.com September, 2017 Vol 6 Issue 9
INTERNATIONAL JOURNAL OF INNOVATIVE RESEARCH & DEVELOPMENT DOI No. : 10.24940/ijird/2017/v6/i9/SEP17065 Page 255
Appendix III: List of Automobile Companies in Nakuru 1. Eramace Car Importers Ltd. 2. Meridian Motors 3. DT Dobie & Co (K) Ltd 4. Bhola Auto Spares & Services Ltd 5. Intra Africa Motors Ltd 6. Nakuru Auto Tech Motors 7. Resma Commercial Agencies Ltd 8. Crater Automobiles (Nairobi) Ltd 9. Kenjap Motors Nakuru 10. Rift Cars Motor Bazaar 11. Nakuru Autotech Motors Nakuru, Kenya 12. Austin Motors Nakuru 13. Bhogals Autoworld 14. Primechoice Motors Ltd 15. AutoXpress Ltd – Nakuru 16. Toyota Kenya Car Dealer 17. Eurojap Auto Spares 18. Jurasic Motors Limited 19. Trans Afric Motor Bazaar 20. Marshalls (EA) Ltd 21. Nakuken Motors Ltd 22. Sam Con Ltd 23. Truckworld Ltd 24. Uni-Truck World Ltd 25. Golden Motors Ltd 26. Al Malik Bros Motors Ltd 27. Aulto Mobile Warehouse 28. Automobile Warehouse Ltd 29. Avenue Motors 30. Gakira Auto Spares 31. Car & General (K) Ltd 32. C M C Motors Group Ltd 33. Ombimahs Motor Dealers 34. Auto Prestige Motors 35. Kenya Grange Vehicles 36. Kings Motors Ltd 37. Lon & Lin Affiliated Motors 38. Nathu Khan & Co Ltd 39. Seas Motors & Spares Co Ltd 40. Sian Motors LtdSS

www.ijird.com September, 2017 Vol 6 Issue 9
INTERNATIONAL JOURNAL OF INNOVATIVE RESEARCH & DEVELOPMENT DOI No. : 10.24940/ijird/2017/v6/i9/SEP17065 Page 256

www.ijird.com September, 2017 Vol 6 Issue 9
INTERNATIONAL JOURNAL OF INNOVATIVE RESEARCH & DEVELOPMENT DOI No. : 10.24940/ijird/2017/v6/i9/SEP17065 Page 257
Appendix IV: Authorization letter from NACOSTI
www.ijird.com September, 2017 Vol 6 Issue 9
INTERNATIONAL JOURNAL OF INNOVATIVE RESEARCH & DEVELOPMENT DOI No. : 10.24940/ijird/2017/v6/i9/SEP17065 Page 258
Appendix V: Research Permit from NACOSTI

www.ijird.com September, 2017 Vol 6 Issue 9
INTERNATIONAL JOURNAL OF INNOVATIVE RESEARCH & DEVELOPMENT DOI No. : 10.24940/ijird/2017/v6/i9/SEP17065 Page 259
PLAGIARISM DECLARATION
DECLARATION OF NUMBER OF WORDS
Copyright
Copyright © Gladys Kirwok 2016. All rights reserved. This research report is secured on behalf of the intellectual property. No part of this thesis may be reproduced nor distributed in printed or electronic form without consent from the author.
Dedication I wish to dedicate this project to my dear parents Mr. Jackson Koech and Mrs. Rosebella Kulei for their continued encouragement and financial support during the study.