Embed Size (px)
Citation preview
Research Project
Determinants of capital structure:a study of cement sector in
Pakistan
Lahore school of accountancy and finance
To be submitted to Sir Amir Iqbal
( Head of department )
By:
Muhammad Khurram MS (A&F)
Sher Mutamir MS (A&F)
Abstract
The decisions relating to the capital structure have been one of
the most important decisions that have to be taken by the
financial managers in any organization. The cement sector of
Pakistan plays a vital role in economic development. Hence the
importance of decisions pertaining to its capital structure
can’t be denied.
This study investigates the effect of profitability,
tangibility, size and liquidity on capital structure decisions
of the listed companies in Karachi stock exchange of cement
sector in Pakistan. This research study provides the information
that would help the management of cement industry to make better
decisions related to the capital structure. Its provides a deep
insight of an optimal capital structure for the cement industry.
Which will then support in maximization of the share value of
firms on the one side and the minimization of cost of capital on
the other side, and overall it would have a significant effect
on the firm’s profitability which is the main objective of any
organization. The variables include leverage, profitability,
liquidity, Size, and tangibility.
Introduction
The main purpose of this research study is to examine the
determinants of the capital structure of the five selected
cement companies listed in Karachi stock exchange (K.S.E),
For the period of 10 years, from 2004 to 2013.
The capital structure is one of the most important part of any
organization. It’s the financial engine of the company. It has a
direct impact on the company as a whole
Capital structure is basically a combination of a company’s long
term debt, specific short-term debt, and equity. The capital
structure in other words is how well a firm finances its overall
operations and growth by using different sources of funds.
According to most of the theories the capital structure is
affected by many external and internal factors, such as tax,
political, social, management, and macro economical indicators.
The study carried on, will help the cement sector of Pakistan,
to better utilize its capital structure by making better
decisions, hence directly have a positive effect on the
profitability. Although many theories have been written on
capital structure, but there is no theory specific update theory
on cement sector of Pakistan. Hence our study work carries on a
further research.
The variables in this study are leverage, profitability,
liquidity, size, tangibility and liquidity.
Problem statement
When it comes to effective decision making, the capital
structure has to be considered. In present, lot of financial
representative’s in the cement industry are lacking in some of
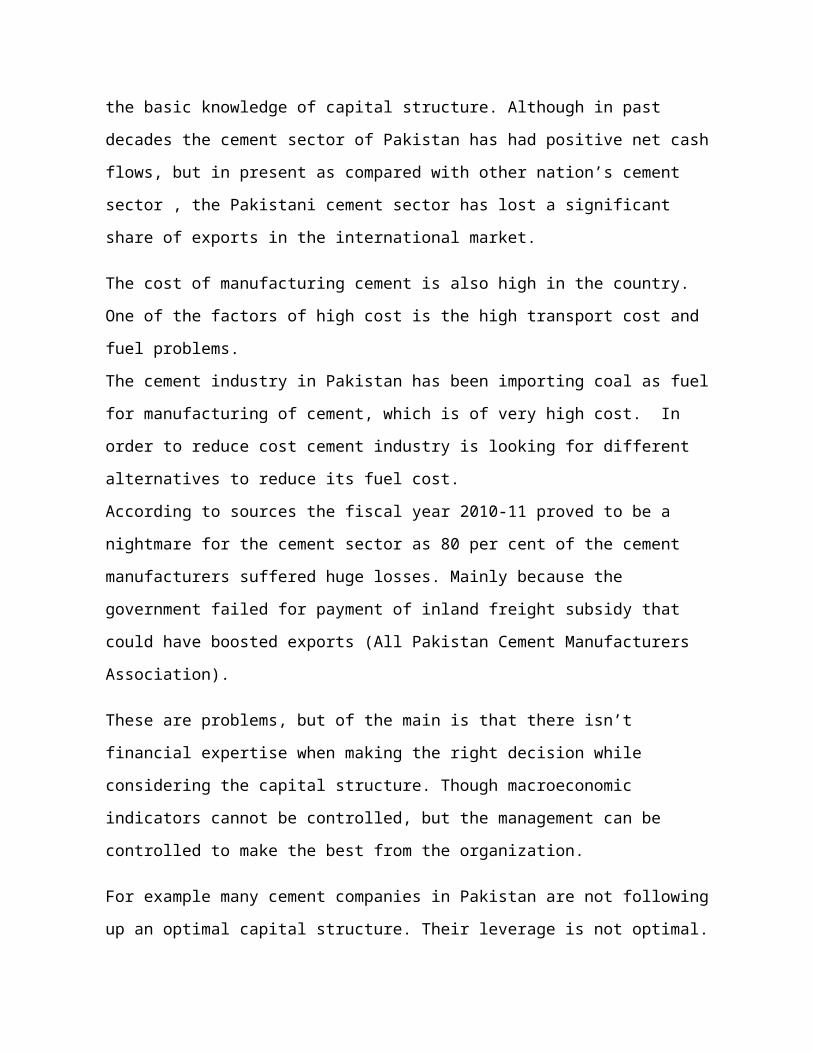
the basic knowledge of capital structure. Although in past
decades the cement sector of Pakistan has had positive net cash
flows, but in present as compared with other nation’s cement
sector , the Pakistani cement sector has lost a significant
share of exports in the international market.
The cost of manufacturing cement is also high in the country.
One of the factors of high cost is the high transport cost and
fuel problems.
The cement industry in Pakistan has been importing coal as fuel
for manufacturing of cement, which is of very high cost. In
order to reduce cost cement industry is looking for different
alternatives to reduce its fuel cost.
According to sources the fiscal year 2010-11 proved to be a
nightmare for the cement sector as 80 per cent of the cement
manufacturers suffered huge losses. Mainly because the
government failed for payment of inland freight subsidy that
could have boosted exports (All Pakistan Cement Manufacturers
Association).
These are problems, but of the main is that there isn’t
financial expertise when making the right decision while
considering the capital structure. Though macroeconomic
indicators cannot be controlled, but the management can be
controlled to make the best from the organization.
For example many cement companies in Pakistan are not following
up an optimal capital structure. Their leverage is not optimal.
So is the tangibility and size of the firm. The leverage of any
firm has a direct impact on its profitability. Many cement
companies listed in KSE are having net loss, the reason is
simple, they are not using their capital structure effectively.
Research question
To what extent Leverage, profitability, tangibility, size and
liquidity affect the capital structure decisions of the listed
companies in cement sector of Pakistan?
Research Objective
The study analyzes the effect of profitability, tangibility,
size and liquidity on capital structure decisions of the listed
companies in Karachi stock exchange (K.S.E) of cement sector of
Pakistan.
Significance of the study
The study has its significant for the financial experts mainly related to the cement sector. By studying this research study, they can make better decisions related to the capital structure.Furthermore the study is also important for investors, who can get deep understanding of the financial engineering of the organization. The students will find this study helpful for carrying on this study in their own studies.
Literature review
There have been many theories related to the capital structure
decisions, depending upon the sector and time scale. Most of the
studies find that the capital structure does have a significant
effect on the organization as a whole.
One of the most famous study has been of Modigliani and Miller,
according to their study Tax benefits on debt financing has been
the most important determinant of capital structure, while
ignoring the dividend. (Modigliani and Miller, 1963).
More leverage means where the debt financing is in excess.
The liquidity of a company and its effect on optimal capital
structure has
been showing various trends. It has been found that liquidity of
assets has both positive and negative effect on the leverage.
(Williamson 1988),
In other study capital structure of a firm is usually achieved
when the financial benefits of debt financing exceed the
financial costs of debt charged by debt providers such as banks
etc (Myers & Majluf, 1984).
There are strong evidences of sizeable and costs of distress in
relation to changes in leverage and the associated cost and the
benefits of the leverage of the firm (Sibilkov2009).
There are results that debt financing has been changing as per
the market trends of debt issues (Doukas, Guo & Zhou 2011).
The differences of capital structure also varies from country to
country basis, every country has its own macro economical
indicators. (Muzir, 2011).
Krauseova (1995) described the capital structure of Czech
firms in the period from 1990 to 1993. Bauer and Bubak (2003)
also test for the existence of optimal capital structure and for
relevance of signaling theory in the case of Czech listed firms.
Myers and Majluf (1984) discussed that firms prefer to finance
with internal funds rather than debt if internal equity is
sufficient due to the asymmetric information. Hence,
profitability is expected to have negative
relation with leverage.
Delimitation
We delimit this study to cement sector of Pakistan.
Hypothesis
The relationship between the Leverage of cement industry and its independent variables have been explained, this study make’s a set of hypothesis.
H1: There is a significant positive relation between leverage and
firm size of cement industry of Pakistan.
H2: There is a significant negative relationship between leverage
and firm size of cement industry of Pakistan.
H3: There is a significant positive relationship between leverage
and profitability of cement industry of Pakistan.
H4: There is a significant negative relationship between leverage
and profitability of cement industry of Pakistan.
H5: There is a significant positive relation relationship between
leverage and tangibility of cement industry of Pakistan.
H6: There is a significant negative relationship between leverage
and tangibility of cement industry of Pakistan.
H7: There is a significant positive relationship between leverage
and liquidity of cement industry of Pakistan.
H8: There is a significant negative relationship between leverage
and liquidity of cement industry of Pakistan.
Research Methodology
The purpose of this research is to contribute towards the very
important aspects of the financial management, known as the
Capital structure and its effect on firm’s performance. Here the
investigation of relationship between the different variables of
capital structure, such as profitability, tangibility, size and
liquidity are studied of the cement sector made for a period of
10 years, from 2004 to 2013, of 5 cement companies listed in
KSE.
The variables and firms included in this research study will
also be discussed; the distribution patterns of data and the
other statistical techniques in investigating the relationship
between these variables will be studied.
PopulationIn Karachi stock exchange there are total 17 cement companies
listed. Our population size is 17.
SampleOut of 17 listed companies of cement sector, we selected a
sample of 5 companies due to date availability. In the study our
sample size is 5.
Instrumentation
The research will carry the SPSS software to conduct research.
The statistical tools which will be used are Pearson correlation
and linear regression.
Data Collection
The data collected for this research was taken from annual
reports of the selected cement companies. The data has been
taken from year 2005 to 2013.
Data Analysis
Regression is used to estimate the association between the
studied variables. The following model is thus developed for
testing.
Descriptive statistics
The quantitative data is taken from the different financial
statements of the listed cement companies.
Inferential statistics
The financial ratios are used to make the predications of the
data.
Theoretical Framework
In this research study we will see relationship between Leverage
and firm size, tangibility, liquidity and profitability.
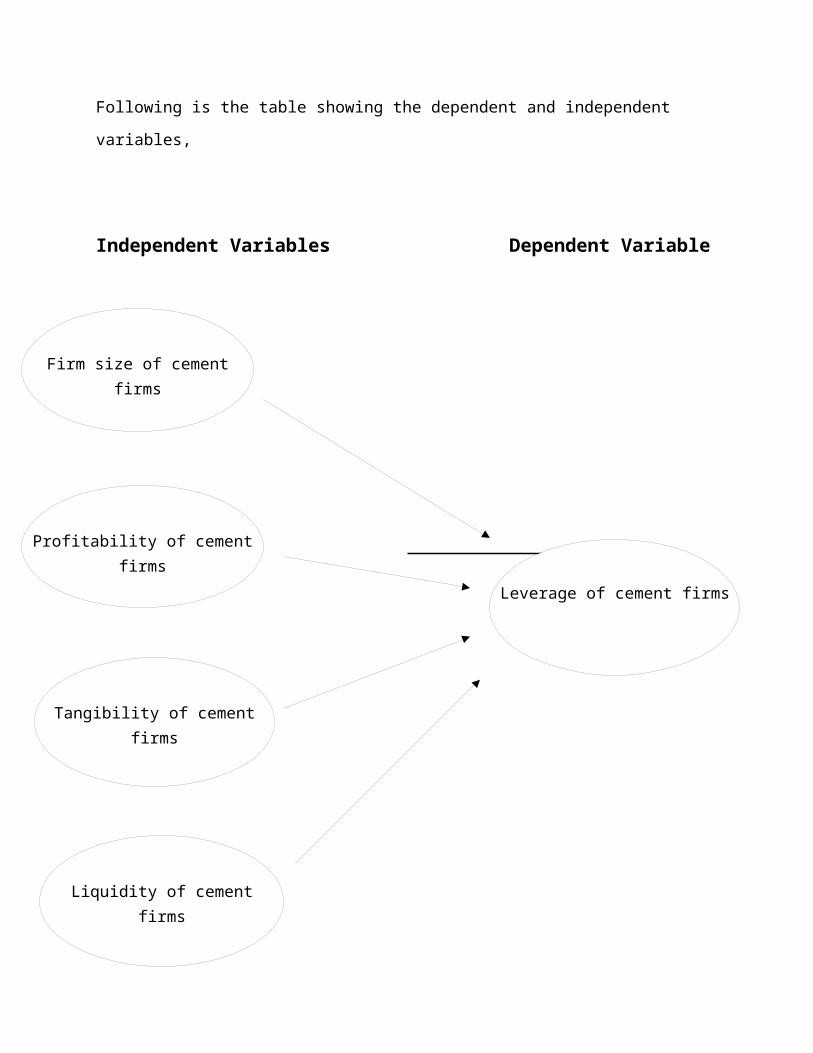
Following is the table showing the dependent and independent
variables,
Independent Variables Dependent Variable
Firm size of cementfirms
Profitability of cementfirms
Tangibility of cementfirms
Liquidity of cementfirms
Leverage of cement firms
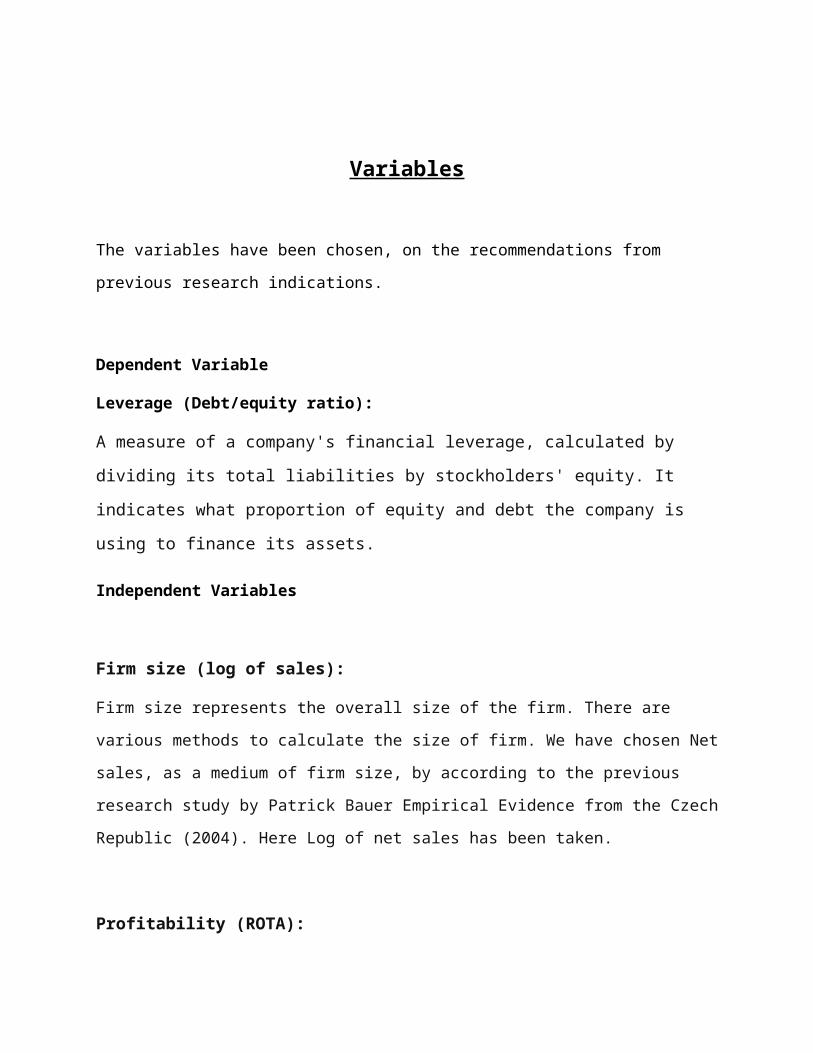
Variables
The variables have been chosen, on the recommendations from
previous research indications.
Dependent Variable
Leverage (Debt/equity ratio):
A measure of a company's financial leverage, calculated by
dividing its total liabilities by stockholders' equity. It
indicates what proportion of equity and debt the company is
using to finance its assets.
Independent Variables
Firm size (log of sales):
Firm size represents the overall size of the firm. There are
various methods to calculate the size of firm. We have chosen Net
sales, as a medium of firm size, by according to the previous
research study by Patrick Bauer Empirical Evidence from the Czech
Republic (2004). Here Log of net sales has been taken.
Profitability (ROTA):
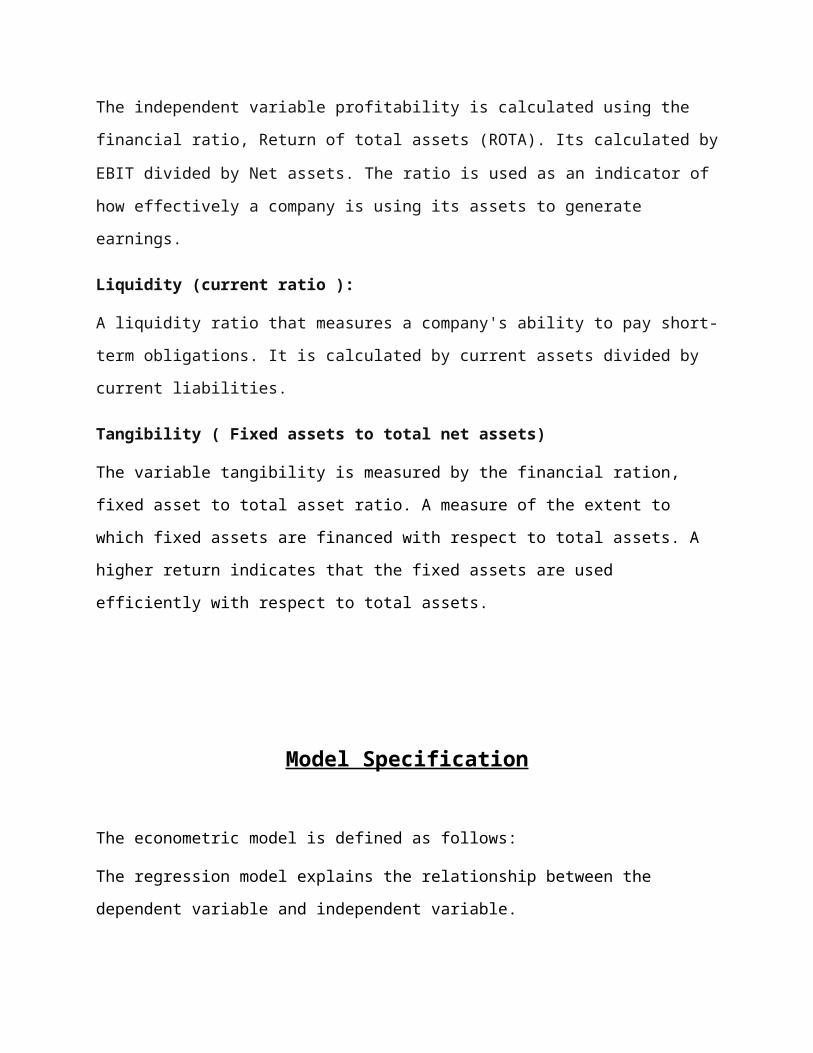
The independent variable profitability is calculated using the
financial ratio, Return of total assets (ROTA). Its calculated by
EBIT divided by Net assets. The ratio is used as an indicator ofhow effectively a company is using its assets to generate
earnings.
Liquidity (current ratio ):
A liquidity ratio that measures a company's ability to pay short-
term obligations. It is calculated by current assets divided by
current liabilities.
Tangibility ( Fixed assets to total net assets)
The variable tangibility is measured by the financial ration,
fixed asset to total asset ratio. A measure of the extent to
which fixed assets are financed with respect to total assets. A
higher return indicates that the fixed assets are used
efficiently with respect to total assets.
Model Specification
The econometric model is defined as follows:
The regression model explains the relationship between the
dependent variable and independent variable.
LVRG it= β0 + β1 (Fms it) + β2 ( PBT it) + β3 (TNG it) + β4 (LQTY it) + e
LGi,t = the leverage of the firm i at time tPBTi,t = profitability of the firm i at time tCRi,t = current ratio of firm I at time tFMSi,t = the size of the firm i at time tTNGi,t = tangibility of the firm i at time t
Data Analysis and DiscussionDescriptive Analysis
Descriptive Statistics
N Range Minimum Maximum Sum MeanStd.
Deviation
StatisticStatisti
cStatisti
c StatisticStatisti
cStatisti
cStd.Error Statistic
LVRGE 50 7.19 .00 7.19 86.12 1.7224 .26493 1.87336
FSIZE 50 3.76 6.29 10.05 369.79 7.3957 .15786 1.11626
PB 50 10.93 -.83 10.10 67.92 1.3584 .38992 2.75712
TANG 50 6.45 .08 6.53 46.53 .9307 .12727 .89995
LQDTY 50 3.12 .26 3.38 50.95 1.0190 .09221 .65200
Valid N (listwise)
50
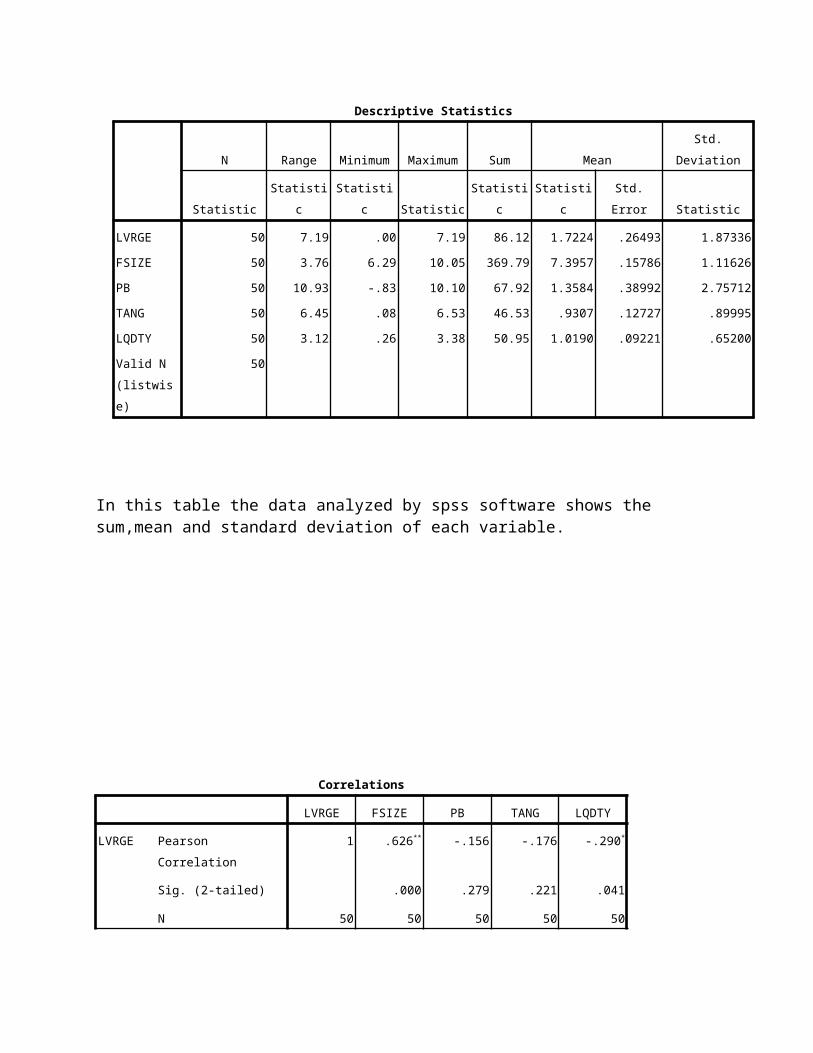
In this table the data analyzed by spss software shows the sum,mean and standard deviation of each variable.
Correlations
LVRGE FSIZE PB TANG LQDTY
LVRGE Pearson Correlation
1 .626** -.156 -.176 -.290*
Sig. (2-tailed) .000 .279 .221 .041
N 50 50 50 50 50
FSIZE Pearson Correlation
.626** 1 -.238 -.212 .121
Sig. (2-tailed) .000 .096 .140 .401
N 50 50 50 50 50
PB Pearson Correlation
-.156 -.238 1 .522** .107
Sig. (2-tailed) .279 .096 .000 .460
N 50 50 50 50 50
TANG Pearson Correlation
-.176 -.212 .522** 1 .134
Sig. (2-tailed) .221 .140 .000 .354
N 50 50 50 50 50
LQDTY Pearson Correlation
-.290* .121 .107 .134 1
Sig. (2-tailed) .041 .401 .460 .354
N 50 50 50 50 50
**. Correlation is significant at the 0.01 level (2-tailed).
*. Correlation is significant at the 0.05 level (2-tailed).
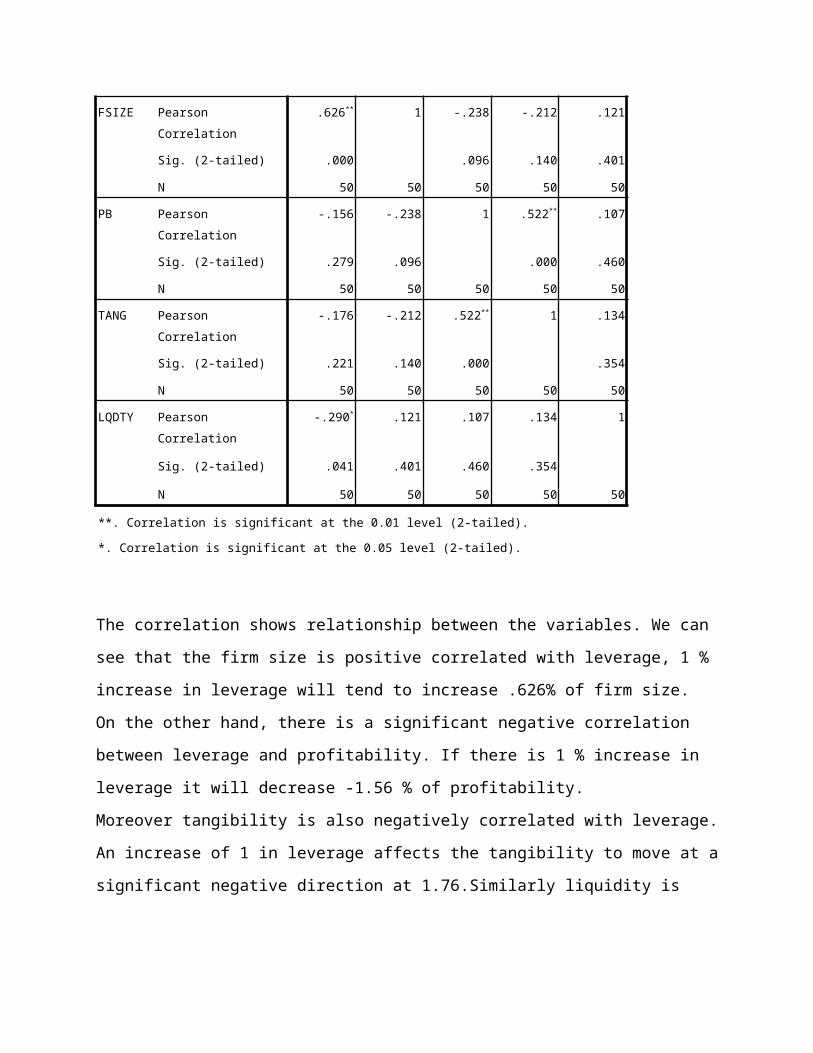
The correlation shows relationship between the variables. We can
see that the firm size is positive correlated with leverage, 1 %
increase in leverage will tend to increase .626% of firm size.
On the other hand, there is a significant negative correlation
between leverage and profitability. If there is 1 % increase in
leverage it will decrease -1.56 % of profitability.
Moreover tangibility is also negatively correlated with leverage.
An increase of 1 in leverage affects the tangibility to move at a
significant negative direction at 1.76.Similarly liquidity is
also negative correlated with leverage, as an increase of 1 % in
leverage will tend to decline liquidity negatively at .290.
It’s clear that only firm size is positively correlated with
leverage.
As for the previous research studies on capital structure
decision, this phenomenon of capital structure is the same for
mainly the countries belonging to the developing world.
Model Summaryb
Model RR
SquareAdjusted R
Square
Std. Errorof the
Estimate
Change Statistics
Durbin-Watson
R SquareChange
FChange df1 df2
Sig. FChange
1 .728a .531 .489 1.33935 .531 12.716 4 45 .000 .722
a. Predictors: (Constant), LQDTY, PB, FSIZE, TANG
b. Dependent Variable: LVRGE
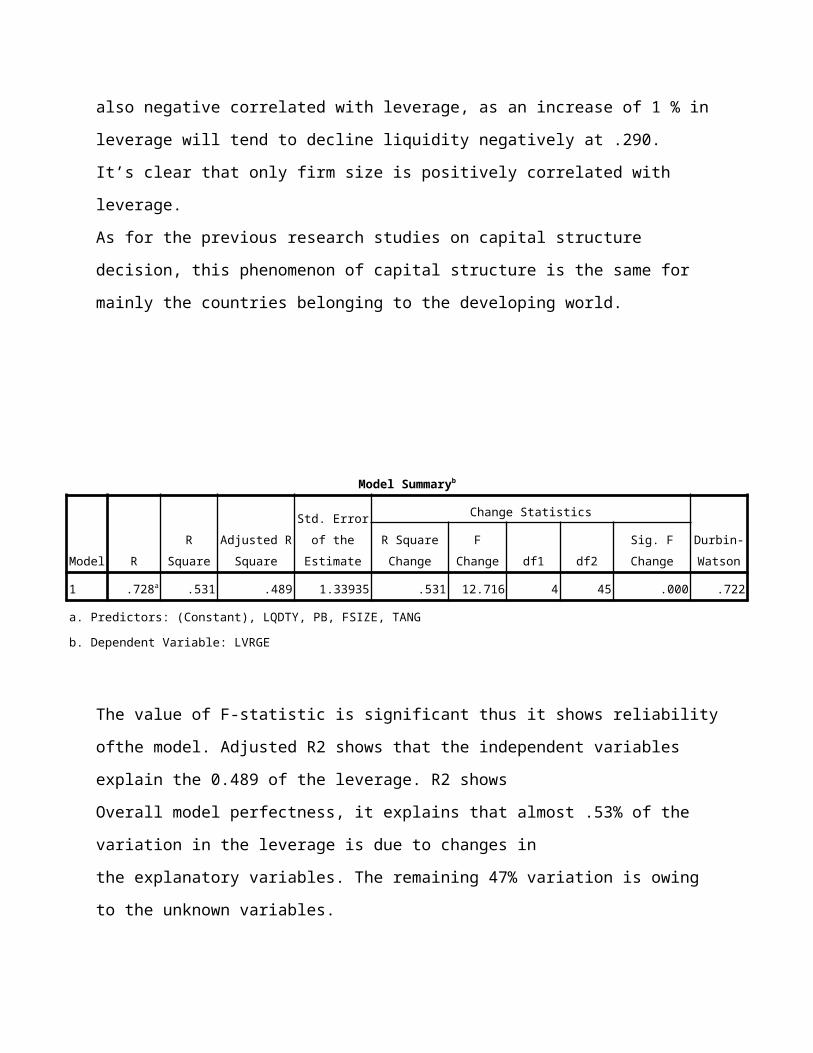
The value of F-statistic is significant thus it shows reliability
ofthe model. Adjusted R2 shows that the independent variables
explain the 0.489 of the leverage. R2 shows
Overall model perfectness, it explains that almost .53% of the
variation in the leverage is due to changes in
the explanatory variables. The remaining 47% variation is owing
to the unknown variables.
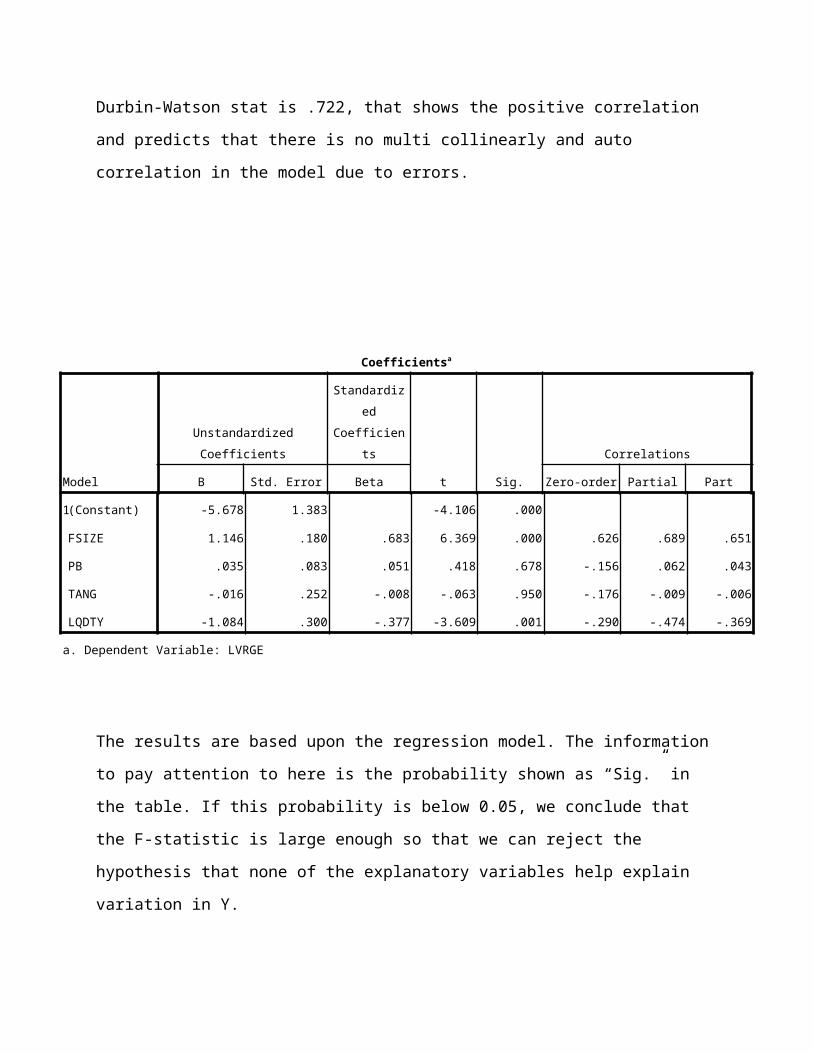
Durbin-Watson stat is .722, that shows the positive correlation
and predicts that there is no multi collinearly and auto
correlation in the model due to errors.
Coefficientsa
Model
UnstandardizedCoefficients
Standardized
Coefficients
t Sig.
Correlations
B Std. Error Beta Zero-order Partial Part
1(Constant) -5.678 1.383 -4.106 .000
FSIZE 1.146 .180 .683 6.369 .000 .626 .689 .651
PB .035 .083 .051 .418 .678 -.156 .062 .043
TANG -.016 .252 -.008 -.063 .950 -.176 -.009 -.006
LQDTY -1.084 .300 -.377 -3.609 .001 -.290 -.474 -.369
a. Dependent Variable: LVRGE
The results are based upon the regression model. The information
to pay attention to here is the probability shown as “Sig.” in
the table. If this probability is below 0.05, we conclude that
the F-statistic is large enough so that we can reject the
hypothesis that none of the explanatory variables help explain
variation in Y.
As for the firm size, its unstandardized co efficient B is 1.46,
which indicates that if there is an increase of 1 unit of
dependent variable the firm size will move to the positive
direction at 1.146.
Moroever its level of significance is less than 0.05 alpha level,
so its significant to the dependent variable.
Similarly the liquidity’s coeffient is negative -1.084, this
means that 1 unit increase in dependent variable will cause
liquidity to decline by -1.084. While its level of significance
is less than the alpha level .001 < 0.05, it indicates its
significant.
On the other hand, Profitability is positive at 0.35 while
tangibility is negative at -0.16, but both of these variables
have significance level greater than alpha level , .678 > 0.05
and .950 > .05. This shows that both of the variables are not
significane.
Conclusion
The research study taken had significant results, and it is
thereby concluded that the way in which capital structure is
managed it has significant impact on the overall organization,
specifically the cement sector.
There is a significant positive relation between leverage and
firm size, we accept H1. On the other hand, liquidity has a
significant negative relation with the leverage. Moreover
tangibility and profitability are insigficant.
Bibliography
Amarjit Gill, Nahum Bigger, Neil Mathur (2011), The Effect of Capital Structure on Profitability: Evidence
from the United States, International Journal of Management Vol.28 No. 4 Part 1Approach, Journal of Finance, 47, 1343-1366
Mahvish Sabir, Qaisar Ali (2012) Determinants of capital structure: A study of oil and gas sector of Pakistan
Modigliani, Merton H. Miller (1963), Corporate Income Taxes and the Cost of Capital: ACorrection, The American Economic Review, Vol. 53, No. 3, pp. 433-443
Myers & majluf (1984) Corporate Financing and investment decision when firms have information that investorsdo not have
Williamson (1988), Asset liquidity and capital structure
Douksas, Gua, Zhou (2010)Hot Debt Markets and Capital Structure,European Financial Management, Vol. 17, No. 1, pp. 46-99, 2010.
Czech Journal of Economics and Finance, 54, 2004, ã. 1-2Determinants of Capital Structure Empirical Evidence from the Czech Republic Patrik BAUER (2004).


