Embed Size (px)
Citation preview
University of WollongongResearch Online
Faculty of Commerce - Papers Faculty of Commerce
2009
The Effect of Diversification on Capital StructureMaurizio La RoccaUniversity of Calabria, Italy
Tiziana La RoccaUniversity of Calabria, Italy
Dionigi GeraceUniversity of Wollongong
Ciorstan J. SmarkUniversity of Wollongong, [email protected]
Research Online is the open access institutional repository for theUniversity of Wollongong. For further information contact ManagerRepository Services: [email protected].
Recommended CitationLa Rocca, Maurizio; La Rocca, Tiziana; Gerace, Dionigi; and Smark, Ciorstan J.: The Effect of Diversification on Capital Structure,Accounting & Finance: 94(4) 2009, 799-826.http://ro.uow.edu.au/commpapers/729
The Effect of Diversification on Capital Structure
AbstractPreviously, empirical financial studies paid little attention to the role of diversification strategy on financialchoices. The aim of the present study is to analyze the financing strategies of multibusiness firms, suggestingthe relevance of sorting the diversification phenomena into its related and unrelated components. Theimplications of our findings are very relevant in that they explain earlier contradictory results on capital-structure determinants. The degree of product specialization/diversification and the direction ofdiversification (related or unrelated) translate into different corporate financial behaviours. In particular, thetwo types of diversification- related or unrelated, had opposite effects on debt. Specifically, a related-diversification strategy, which is associated with lower debt ratios, has a negative influence on leverage. Bycontrast, unrelated diversity, which is associated with higher debt usage, has a positive effect on debt.According to the coinsurance effect and the transaction-cost hypothesis, unrelated-diversified firms have ahigher debt capacity and can assume more debt as a source of finance. Moreover, the capital-structuredecisions of unrelated-diversified firms seem to be strictly aimed at reaching their target optimal debt level—abehaviour that is consistent with the trade-off hypothesis. On the other hand, related-diversified firms adjustmore slowly towards their target capital structure
This journal article is available at Research Online: http://ro.uow.edu.au/commpapers/729
1
The Effect of Diversification on Capital Structure.
Maurizio La Rocca1
University of Calabria -
Italy
Tiziana La Rocca University of Calabria -
Italy
Dionigi Gerace University of Wollongong
Australia
Ciorstan Smark University of Wollongong
Australia
Abstract
Previously, empirical financial studies paid little attention to the role of diversification
strategy on financial choices. The aim of the present study is to analyze the financing strategies of
multibusiness firms, suggesting the relevance of sorting the diversification phenomena into its
related and unrelated components.
The implications of our findings are very relevant in that they explain earlier contradictory
results on capital-structure determinants. The degree of product specialization/diversification and
the direction of diversification (related or unrelated) translate into different corporate financial
behaviours.
In particular, the two types of diversification- related or unrelated, had opposite effects on
debt. Specifically, a related-diversification strategy, which is associated with lower debt ratios, has
a negative influence on leverage. By contrast, unrelated diversity, which is associated with higher
debt usage, has a positive effect on debt. According to the coinsurance effect and the transaction-
cost hypothesis, unrelated-diversified firms have a higher debt capacity and can assume more debt
as a source of finance. Moreover, the capital-structure decisions of unrelated-diversified firms seem
to be strictly aimed at reaching their target optimal debt level—a behaviour that is consistent with
the trade-off hypothesis. On the other hand, related-diversified firms adjust more slowly towards
their target capital structure
Keywords: Capital structure, product diversification, relatedness, financing decisions, source of
finance.
JEL Code: G30, G32
1 Corresponding author: Maurizio La Rocca, Assistant Professor in Business Economics and Finance, University of
Calabria, Faculty of Economics, Dep. of Scienze Aziendali, cubo 3C, Campus of Arcavacata - 87036 Rende (CS) -
Italy. Tel +390984 492261, cell +39333 3452372 Fax +390984 32633, email: [email protected]
2
1. Introduction
Diversification and capital structure are two concepts that have long been controversial,
since they impact on many other aspects of business and financial management. Diversification has
been a central topic in strategic management studies since the work of Ansoff (1958). The costs and
benefits derived from the various diversification strategies have been examined mainly for their
impact on a firm’s value (Rumelt 1974). Studies on the interaction between diversification and
capital structure became of interest because of their associated strategic implications regarding
corporate governance. Indeed, starting with the study of Jensen and Meckling (1976), financial
choices have been evaluated because of the close interaction between capital structure and
management choices2. In the 1980s, other researchers, motivated by the connection between
investment and financial choices, highlighted the link between capital structure and diversification
(Oviatt 1984, Titman 1984, Jensen 1986, Barton and Gordon 1987, Williamson 1988, Titman and
Wessels 1988, Gertner et al. 1988, Barton and Gordon 1988).
Many authors suggested that diversified firms need to carry greater leverage to maximize
firm value (Kaplan and Weisbach 1992, Li and Li 1996, Singh et al. 2003); in particular, “a
combination of diversification with low leverage leads to overinvestment” (Li and Li 1996). To
reduce this kind of agency problem, it has been observed empirically that relatively more debt is
carried by diversified firms than by non-diversified firms (Riahi-Belkaoui and Bannister 1994, Li
and Li 1996). However, based on the findings of Comment and Jarrell (1995), this observation
seems not to be robust with respect to the kinds of variables used to operationalize the concept of
diversification3. Research carried out on the relation between diversification and capital structure
has led to several interesting contributions (Markides and Williamson 1996, Kochhar 1996,
Kochhar and Hitt 1998) aimed at improving the theoretical approach by formalizing clear-cut
2 Barton and Gordon (1987) pointed out that corporate strategies complement traditional finance paradigms and enrich
the understanding of a firm’s capital-structure decisions. 3 The results of Comment and Jarrell (1995) can be interpreted to mean either that diversification does not increase debt
capacity or that managers of diversified firms do not choose to exploit their greater debt capacity.
3
research proposals (Lowe et al. 1994, Taylor and Lowe 1995, Markides and Williamson 1996,
Kochhar 1996, Kochhar and Hitt 1998).
In this paper, the role of diversification, related and unrelated, in the capital-structure
choices is analyzed. The study was carried out in the context of research on capital-structure
determinants (how does diversification influence capital structure?), which has attempted to explain
the effects of diversification strategy on financial choices. In particular, we want to verify if the
coinsurance effect, the agency cost argument or the transaction cost argument are able to support
the effect of diversification on capital structure choices.
The present research extends prior analyses of financial policy and diversification by
examining the relation between capital structure and diversification over a long period (27 years). It
highlights how related diversification, compared to unrelated diversification, differently affects
financing decisions. This research analyses the different intensity in the capital structure
determinants for clusters of firms. The sample was sorted into three groups according to the cluster
analysis approach (specialized firms, related-diversified firms and unrelated-diversified firms).
Furthermore, relating to the ongoing debate on the firm’s optimal capital structure, we provide a
contribution in the relatively limited literature on the dynamics of the capital structure decision by
examining the dynamics of the relation between leverage and a set of explanatory variables. We
investigate the adjustment process to the target capital structure for our sample of Italian firms,
focusing on the different speed of adjustment for specialized, related-diversified and unrelated-
diversified firms. The model is estimated by using panel data methodology in order to eliminate the
unobservable heterogeneity. Specifically, we use the GMM technique to control for the endogeneity
problem, the importance of which has been demonstrated by extensive literature. Some robustness
checks were applied.
Our study is structured as follows: the second section points out the theoretical perspectives
applied to the analysis. The third section describes the specificity of the empirical model and the
applied variables. In the fourth section, the sample and the descriptive statistics are presented. The
4
fifth section details the empirical results. Section six shows our robustness analysis. Finally, section
seven highlights the main findings of the study and offers several suggestions for management and
for future research.
2. Theoretical Perspectives
Many researchers have attempted to determine which theory, trade-off or pecking order, is
better able to approximate and explain firms’ financing behaviours. The goal of several studies has
been to understand capital-structure decisions in the light of firm-specific features, industry
affiliation, and institutional environments. Recent reviews on capital structure by Myers (2003),
Frank and Goyal (2008), and Parson and Titman (2007) summarize much of the recent literature.
However, only a few studies have related corporate diversification features to different capital-
structure decisions (Taylor and Lowe 1995, Markides and Williamson 1996, Kochhar and Hitt
1998, Chkir and Cosset 2001, Singh et al. 2003, Alonso 2003).
A literature review suggests that sorting diversification phenomena into related and
unrelated4 ones can enhance our understanding of their link to capital structure, with a better
understanding of the capital structure determinants. Thus, previous studies (Singh et al. 2003, Low
and Chen 2004) that did not take into account these two components are potentially biased.
The effect of diversification on capital-structure choices has been explained mostly through
the coinsurance effect (Lewellen 1971, Kim and McConnell 1977, Bromiley 1990, Bergh 1997),
the transaction cost theory (Williamson 1988, Balakrishnan and Fox 1993, Kochhar and Hitt 1998),
and by applying the agency cost theory (Jensen 1986, Kochhar 1996).
The coinsurance effect deals with the reduction of operating risk due to the imperfect
correlation between the different cash flows of a firm running diverse businesses (Lewellen, 1971;
4 Related diversification is based on operational synergies related to: (1) resource sharing in the value chains among
businesses, and (2) the transfer of skills, which involves the transfer of knowledge from one value chain to the other.
Thus, related diversification is based on the sharing and transfer of skills connected to tangible (plant and equipment,
sales forces, distribution channels) and intangible (brand names, innovative capabilities, know-how) resources.
Conversely, unrelated diversification is associated with the financial synergies hypothesis, which states that firms
diversify to benefit from the economies of an internal capital market and an internal labor market, to obtain tax benefits,
and to reduce business risk (coinsurance argument). Financial resources, which are more mobile and less rare and thus
likely to create less value than other types of resources, are associated with unrelated diversification. For details on the
definitions of related and unrelated diversification, the reader is referred to Ansoff (1958), Lewellen (1971), and
Rumelt (1974).
5
Kim and McConnell, 1977). It is more relevant for firms that develop unrelated diversification
strategies because the lack of correlation between businesses is greater: these firms should be able
to assume more debt (Kim and McConnell 1977 and Bergh 1997)5. The transaction cost approach
deals with the governance of contractual relations in transactions between two parties (Williamson
1988). In particular, by matching corporate finance theory and strategy theory, this approach
examines a firm’s financial decisions in terms of its specific assets, considering debt and equity as
alternative governance structures (Markides and Williamson 1996). Firms diversify their activities
in response to the presence of an excess of unutilized assets (Penrose 1959), and the kind of
diversification strategy depends on the characteristics of these resources (Chatterjee and Wernerfelt
1991, Mahoney and Pandian 1992)6. Therefore, the transaction cost approach, considering debt as a
rule-based governance structure and equity as a discretionary governance device; supports the use
of debt to finance non-specific assets and the use of equity to finance specific ones (Williamsom
1988)7. As a consequence, in the presence of highly specific assets (mainly associated with related-
diversified firms), that keep a limited liquidation value in case of default, equity is the preferred
financial instrument because such assets cannot be easily re-employed. In contrast, in the presence
of general purpose assets (mainly associated to unrelated-diversified firms), more valuable as
collateral and able to retain their value in the event of liquidation/default, debt is the preferred
financing tool (relation with debtholders, based on the availability of non specific assets, are
cheaper)8. Agency cost theory, rooted on the existence of conflicts of interest between shareholders
5 Consistent with this argument, several studies (Kim and McConnell 1977, Bergh 1997 and Alonso 2003) have found
that the coinsurance effect is one of the most important value-increasing sources associated with unrelated
diversification. Firms that follow unrelated diversification can issue more debt and benefit from the fiscal advantages
related to debt financing (Bergh 1997). The tax liability of the diversified firm may be less than the cumulated tax
liabilities of the different (single) business units. 6 An excess of highly specific assets is more likely to lead to related diversification because these assets can only be
transferred across similar businesses. Conversely, an unrelated diversification strategy should be based on the presence
of an excess of non-specific assets. 7 Debt financing requires a firm to make interest and principal payments according to a schedule stipulated in the
contract; in the event of default, debtholders may exercise their pre-emptive claims against the firm’s assets (Shleifer
and Vishny 1992). At the same time, the shareholders bear a residual-claimant status with regard to earnings and to
assets liquidation; their relations with the firms last for the lifetime of the business. 8 For instance, in the case of financial distress, a firm that operates in three sectors, grocery, mechanical and
pharmaceutical, and that has basically general-purpose assets, has the opportunity to liquidate the assets easily and
quickly (as it is useable in many activities and industry sectors). As a consequence, the higher capacity to meet the
6
and managers (Jensen and Meckling, 1976)9, provides a further theoretical scheme that supports the
influence of diversification strategy on capital structure (Kochhar 1996 and Kochhar and Hitt 1998).
Jensen (1986) pointed out the disciplining role of debt on managerial behaviour, in that it reduces
managerial discretion regarding free-cash flow. Thus, the Jensen perspective supports the positive
role of debt in reducing the ability of a manager to realize detrimental diversification strategies,
especially unrelated ones. As a consequence, the result of diversification on the debt/equity choice
can be interpreted according to the monitoring effect. Stakeholders, and in particular shareholders,
are assumed to have the capacity to affect the strategic decisions of managers, in order to avoid a
diversification strategy, especially unrelated, being realized for opportunistic reasons.
Consequently, shareholders will promote the use of debt as a device to discipline managerial
behaviour, limiting diversification decisions (especially unrelated)10
.
In addition to an analysis of the different use of debt in specialized or diversified firms and,
more specifically, in firms adopting related or unrelated diversification, the present study attempts
to verify the changing role of capital-structure determinants for these different categories of firms.
Accordingly, it tests whether, in reaching capital-structure decisions based on different degrees and
directions of diversification, firms seek to move toward a target optimal-leverage ratio (according to
the trade-off theory). The standard trade-off theory (discussed in detail by Frank and Goyal 2008)
suggests that firms maximize their value when the benefits from debt (tax shield, the disciplinary
role of debt, and the fact that debt suffers less than outside equity from informational costs) equal
the marginal cost of the debt (bankruptcy costs, agency costs between shareholders and
bondholders, lack of financial flexibility). According to the trade-off theory, a firm has to set a
scheduled debt payment, thanks to general-purpose asset liquidity, provides security for the loan provided, reducing the
cost of capital and increasing the debt capacity. 9 Managers, acting as agents, may make non-profitable investments, which are inconsistent with the objective of value
creation for shareholders (the principal); while shareholders are strictly interested in the maximization of shareholder
value, managers consider the firm as an instrument to increase their wage, self-esteem, private benefits, and, generally,
their human capital value. In paying attention to all these benefits, of which just one is based on shareholder value,
managers may exhibit opportunistic behaviours. 10
A diversified firm, especially if organised in unrelated business segments, will increase the use of debt, under the
influence of the stakeholders, to constrain potential opportunistic behaviours of the management, that does not allow to
face the interest payment at the due deadline (Jensen 1986). Therefore, debt prevents manager from using
diversification to destroy value (for private benefit).
7
target debt level and then gradually move toward it. Existing capital structure theories have
different implications about a firm’s adjustment process toward this target level. According to the
trade-off theory, given an equilibrium level of leverage ratio, a firm will strive to reach this target.
In the presence of a deviation from the equilibrium level, firms will rebalance their capital
structures toward the target level. In a static framework, this adjustment occurs instantaneously.
With respect to transaction costs, the adjustment process will be incomplete in a given year.
Specifically, the dynamic version of the trade-off theory implies that adjustment costs will prevent
firms from constantly adjusting their leverage ratio11
. Moreover, the trade-off theory states that if
firms follow a target optimal level of debt, deviations from the equilibrium level are expected to be
temporary and therefore the speed of adjustment will be relatively high. Conversely, if firms do not
attribute great importance to their target leverage ratios (or if the transaction costs are high), then an
adjustment of capital structure toward the optimal level, for example in response to a shock, will be
slow or even non-existent in a given year.
While the main research compares the adjustment speed among countries, looking to
institutional differences, this study aims to provide the first analysis within Italy, measuring also the
different effect for related diversified firms, where operational synergies and core competences
resource sharing are provided, compared to unrelated diversified firms, where an internal capital
market works and tax benefits, jointly with a reduced business risk, are provided.
3. Methodology and Variables
In this empirical analysis, different financial behaviours, in terms of capital-structure
choices, were taken into account according to their degree and direction, related or unrelated, of
diversification. Firm leverage (variable named debt), measured as the ratio of total financial debt to
total financial debt plus equity (Rajan and Zingales 1995), was used as the dependent variable.
Diversification was measured by taking into account the number of business segments to
define product diversification, the amount of sales in each business segment and identifying the
11
Firms must trade off these adjustment costs with the costs of being away from the equilibrium level, with the latter
defined as the costs for operating with a less-than-optimal capital structure. Firms will rebalance their capital structure
only when the costs of deviating from the equilibrium level exceed the adjustment costs.
8
degree of relatedness for each segment. In Italy, diversification is assessed through the Standard
Industrial Codes (S.I.C. code). Specifically, entropy indicators were employed in the empirical
analysis as the main measures to operationalize diversification, as they allowed the objectivity of
the product-count measures to be combined with the ability to apply the relatedness concept
categorically, weighting the businesses by the relative size of their sales (Jacquemin and Berry
1979, Palepu 1985). Entropy measures consider simultaneously the number of businesses in which
a firm operates, the distribution of a firm’s total sales across industry segments, and the different
degrees of relatedness among the various industries. The entropy measure of total level of
diversification (DT) is calculated as ΣPj * ln(1/Pj), where P refers to the proportion of sales in
business segment j and ln(1/pj) is the weight for that segment. Therefore, this indicator considers
the number of segments in which a firm operates and the relative importance of each segment for
firm sales. The DT variable is a better diversification measure compared to the Herfendahl index
because it can be decomposed into the related and unrelated component of diversification. The
related diversification index (DR) and the unrelated diversification index (DU) take into account the
roles of all business units in which the firm is involved, without over-emphasizing only those
business segments with higher proportions of sales. DR is the related diversification index resulting
from businesses different at 3 or 4-digit segment, within a 2-digit industry group; vice versa, DU is
the unrelated diversification index resulting from businesses in different 2-digit industry groups12
.
To verify the existences of differences in capital-structure determinants for groups of firms
the following model was used:
12
DR is the related diversification index resulting from businesses in a 4-digit segment within a 2-digit industry group.
For example, Barilla, operates in Pasta production industry and in Sauce industry, different at 4-digit; both are related.
DU is the unrelated diversification index resulting from businesses in different 2-digit industry groups. For example, it
is unrelated a firm operating in Paper and Allied Products and Textile Mill Products, different at 2-digit industry code.
Villalonga (2000) claimed that in many research on diversification there were some data trouble in the collection and
treatment of data. To avoid mechanical treatment of data we used some rational adjustment, jointly with the number on
digits in the Industry Code, to appreciate the type of diversification. We considered as related two businesses when they
provide a product or service to a similar group of customer, sharing the same technology in the production system or
operating in the same industry as client and supplier. For example, Clothing industry and Textile industry, that are
different at 2 digits, are considered complementary, and so related. Overall, these adjustments comprised aproximately
7% of the sample.
9
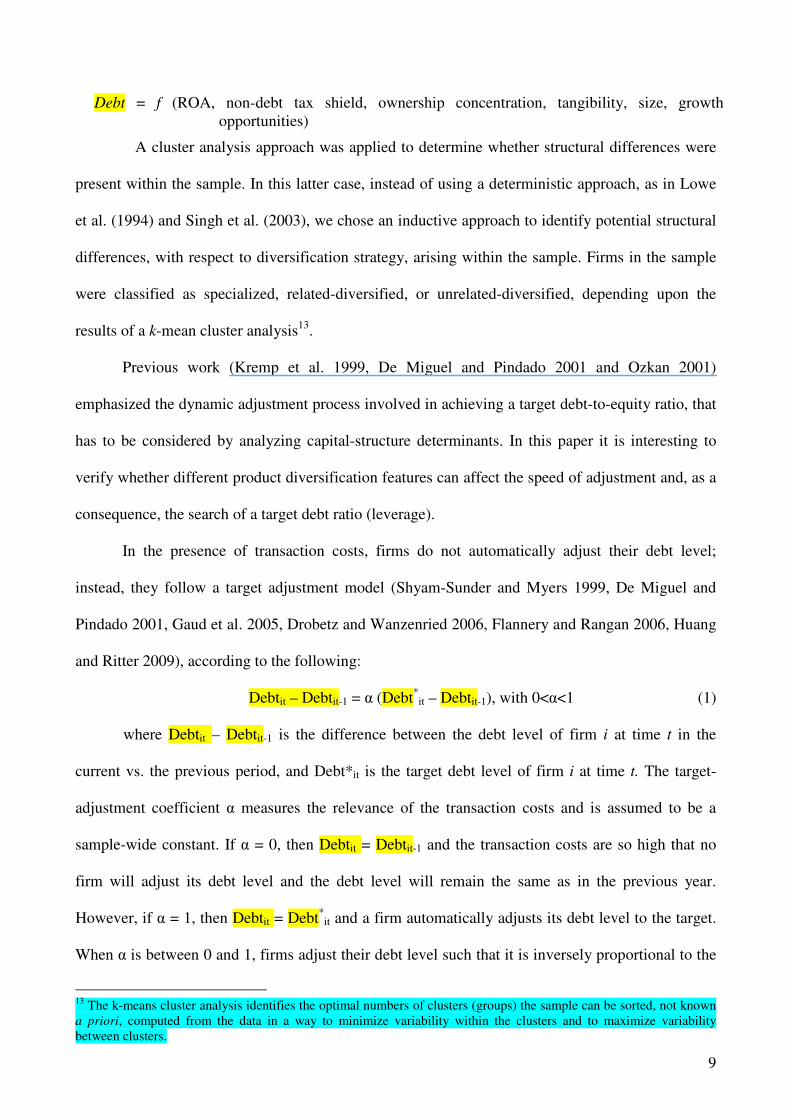
Debt = f (ROA, non-debt tax shield, ownership concentration, tangibility, size, growth
opportunities)
A cluster analysis approach was applied to determine whether structural differences were
present within the sample. In this latter case, instead of using a deterministic approach, as in Lowe
et al. (1994) and Singh et al. (2003), we chose an inductive approach to identify potential structural
differences, with respect to diversification strategy, arising within the sample. Firms in the sample
were classified as specialized, related-diversified, or unrelated-diversified, depending upon the
results of a k-mean cluster analysis13
.
Previous work (Kremp et al. 1999, De Miguel and Pindado 2001 and Ozkan 2001)
emphasized the dynamic adjustment process involved in achieving a target debt-to-equity ratio, that
has to be considered by analyzing capital-structure determinants. In this paper it is interesting to
verify whether different product diversification features can affect the speed of adjustment and, as a
consequence, the search of a target debt ratio (leverage).
In the presence of transaction costs, firms do not automatically adjust their debt level;
instead, they follow a target adjustment model (Shyam-Sunder and Myers 1999, De Miguel and
Pindado 2001, Gaud et al. 2005, Drobetz and Wanzenried 2006, Flannery and Rangan 2006, Huang
and Ritter 2009), according to the following:
Debtit – Debtit-1 = α (Debt*it – Debtit-1), with 0<α<1 (1)
where Debtit – Debtit-1 is the difference between the debt level of firm i at time t in the
current vs. the previous period, and Debt*it is the target debt level of firm i at time t. The target-
adjustment coefficient α measures the relevance of the transaction costs and is assumed to be a
sample-wide constant. If α = 0, then Debtit = Debtit-1 and the transaction costs are so high that no
firm will adjust its debt level and the debt level will remain the same as in the previous year.
However, if α = 1, then Debtit = Debt*it and a firm automatically adjusts its debt level to the target.
When α is between 0 and 1, firms adjust their debt level such that it is inversely proportional to the
13
The k-means cluster analysis identifies the optimal numbers of clusters (groups) the sample can be sorted, not known
a priori, computed from the data in a way to minimize variability within the clusters and to maximize variability
between clusters.
10
adjustment (transactional) costs. As the value of α approaches 1, adjustment of the current capital
structure toward either the target or an optimal capital structure becomes more rapid.
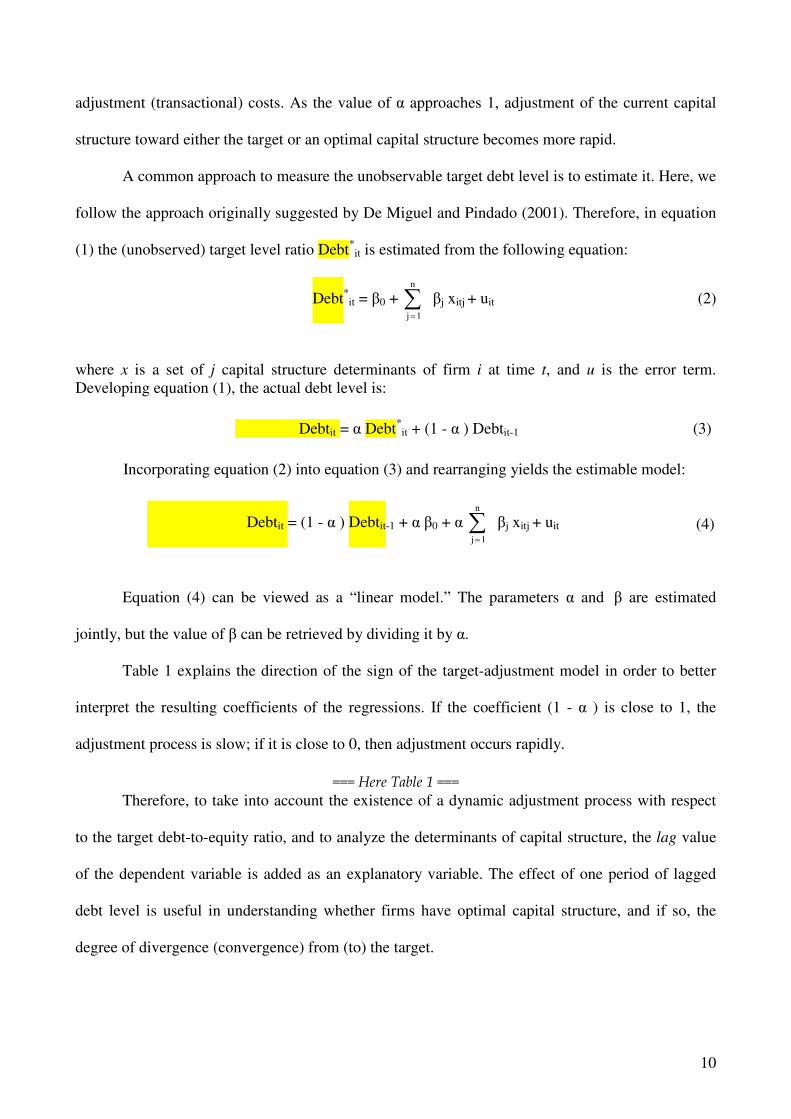
A common approach to measure the unobservable target debt level is to estimate it. Here, we
follow the approach originally suggested by De Miguel and Pindado (2001). Therefore, in equation
(1) the (unobserved) target level ratio Debt*it is estimated from the following equation:
Debt*it = β0 + ∑
=
n
1 j
βj xitj + uit (2)
where x is a set of j capital structure determinants of firm i at time t, and u is the error term.
Developing equation (1), the actual debt level is:
Debtit = α Debt*it + (1 - α ) Debtit-1 (3)
Incorporating equation (2) into equation (3) and rearranging yields the estimable model:
Debtit = (1 - α ) Debtit-1 + α β0 + α ∑=
n
1 j
βj xitj + uit (4)
Equation (4) can be viewed as a “linear model.” The parameters α and β are estimated
jointly, but the value of β can be retrieved by dividing it by α.
Table 1 explains the direction of the sign of the target-adjustment model in order to better
interpret the resulting coefficients of the regressions. If the coefficient (1 - α ) is close to 1, the
adjustment process is slow; if it is close to 0, then adjustment occurs rapidly.
=== Here Table 1 ===
Therefore, to take into account the existence of a dynamic adjustment process with respect
to the target debt-to-equity ratio, and to analyze the determinants of capital structure, the lag value
of the dependent variable is added as an explanatory variable. The effect of one period of lagged
debt level is useful in understanding whether firms have optimal capital structure, and if so, the
degree of divergence (convergence) from (to) the target.

11
Panel-data estimation was used in the present study because it is appropriate for analyzing
the dynamic nature of capital-structure decisions. The estimation method was selected in order to
avoid unobservable heterogeneity and endogeneity.
In fact, because firms are heterogeneous there are always characteristics influencing capital
structure which are difficult to measure or hard to obtain, and which do not enter our model.
Therefore, if we do not control for this heterogeneity, we will run the risk of obtaining biased
results. Unlike cross-sectional analysis, the panel data methodology has a great advantage in that it
allows us to control for unobservable heterogeneity through an individual (firm-specific) effect, ηi.
We also included the variable dt to measure the temporal effect with corresponding year dummy
variables14
, taking into account the effect of macroeconomic variables on corporate capital
structure. Therefore, consistent with Bond and Meghir (1994), our approach controlled for
unobservable firm-specific fixed effects and for the time dummy variable. Consequently, in order to
eliminate individual heterogeneity, our model was transformed into the following equation:
Debtit = (1 - α ) Debtit-1 + α β0 + α ∑=
n
1 j
βj xitj + ηi. + dt + υit (5)
Therefore, the error term in our models uit, has been split into components. First, the above
mentioned individual or firm-specific effect, ηi. Second, dt that measures the time-specific effect by
the year dummies. Finally, vit is the random disturbance.
In addition, the clear endogeneity of the corporate decision variables in our model, and
especially with the use of the lag value of the debt level, could seriously affect the estimation
results. Statistically, endogeneity means that the model’s errors are not truly random and so the
regression is mis-specified in a way that makes identifying a causal effect between two economic
variables difficult. There are several potential sources of endogeneity. One of the more relevant is
reverse causality. For example, it is certainly possible that some variables, as ROA, influences the
debt level, but it is also possible the other way around, that leverage can influence ROA. Although
14
There are 26 year dummies for the 27 years of analysis and each year dummy x is equal to 1 for the year x and equal
to 0 for years different from x.
12
poor performance may lead to higher observed debt levels (either because distressed firms borrow
more, or because their market values decline, which increases their leverage ratios), high leverage
levels may also lead firms to experience poor performance. Moreover, the literature, theoretically
(Jensen 1986) and empirically (Balakrishnan and Fox 1993, Kochhar and Hitt 1998), highlighted
that there are some studies trying to explain the effects of diversification strategy on the financial
choices of the firms and others trying to explain the effects of debt/equity choice on diversification
strategy. Another issue is related to the fact that leverage can be chosen by management
concurrently with other firm’s decisions, raising a problem of simultaneity that can suggest the use
of lags of some variables. The simultaneity bias that could be present may be a result of joint
determination that is present between many corporate variables. For example, the decision to issue
debt can be made concurrently with the decision of a new investment in diversification. As a
consequence, due to the fact that variables may correlate with the error term, and the simultaneity
bias between the leverage measure and the explanatory variables can be problematic (especially
with the lagged dependent variable used), seriously affecting the estimation results, it may be
preferable to use instrumental variables15
.
Therefore, the panel-data methodology and estimation by the Generalized Method of
Moments (GMM) together allow studies of the dynamic nature of capital-structure decisions at the
firm level, thereby eliminating unobservable heterogeneity and controlling for the endogeneity
problem.
The GMM approach was used to estimate equation 5. Specifically, as suggested by Arellano
and Bond (1991), this equation was estimated in first differences, using lag effects as instruments16
.
However, Monte Carlo simulations suggest that the first-difference GMM estimator could display
large finite sample biases and very low precision in the estimation of the autoregressive parameter
15
Testing the hypothesis of endogeneity explicitly involves testing for endogeneity in the variables, to determine
whether there is a simultaneity bias in the OLS regression results, using a standard Hausman test. The results of the test
of simultaneity suggest the presence of this problem. 16
Since the lagged dependent variables correlate with the error term, parameters estimated by conventional panel-data
methodologies, such as the fixed effects model, lack desirable properties, including consistency and absence of bias.
Such biases can be avoided by using the GMM after taking the first-order difference. For details, see Baltagi (2001).
13
(Blundell and Bond 1998)17
. Blundell and Bond (1998) address these shortcomings of the first
difference GMM estimator by introducing the GMM in system estimator18
. We use all the right-
hand-side variables in the model lagged twice or more as instruments. Specifically, in order to
eliminate the individual effect, we took first differences of the variables, and then we estimated the
model thus obtained. This approach is correct if there is no second-order serial correlation between
error terms of the first-differenced equation. In our model, this hypothesis of second-order serial
correlation is always rejected. The statistics m2 were used to test for the lack of second-order serial
correlation. Concerning the instruments, the Sargan statistic, which tests for the presence of over-
identifying restrictions and for the validity of instrumental variables, is reported, as are two Wald
statistics. Wald 1 is a test of the joint significance of the time dummy variables, and Wald 2 a test of
the joint significance of the reported determinants.
Theoretical and empirical studies19
have shown that ROA, non-debt tax-shields, ownership,
tangibility, size, and growth opportunities affect capital structure. These variables were also included
in this empirical study to underline the relation between diversification strategies and capital
structure. In addition, the role of these determinants with respect to diversification status was
compared in the sorted sample.
ROA – The relation between the capital structure and the return on asset (ROA) is
theoretically and empirically controversial. In the pecking-order theory, each investment is financed
with internal funds, primarily retained earnings, then with new issues of debt and, finally, with new
issues of equity (Myers 1984). It follows that a more profitable firm is more likely to substitute debt
for internal funds. Therefore, according to the pecking-order theory, a negative relation among debt
levels and ROA is expected. However, according to the trade-off theory, more-profitable firms
prefer debt in order to benefit from the tax shield; thus, a positive correlation with leverage is
17
Weak instruments in difference GMM motivated the development of system GMM (Blundell and Bond 1998). 18
System GMM augments difference GMM by estimating simultaneously in differences and levels, the two equations
being distinctly instrumented. 19
The work of Harris and Raviv (1991) is still valid in summarizing many of the empirical studies on the capital-
structure determinant of US firms, while Rajan and Zingales (1995) showed the main determinants in an international
context.
14
expected. Empirical evidence from previous studies supported both theories (Harris and Raviv
1991). Our empirical model included ROA defined as earnings before interest and taxes (EBIT)
relative to total assets.
Non-debt tax shields (NDTS) - The Italian legislation specifies that firms are subject to a
complex tax system. This system is difficult to manage, and allows for strong penalties to be
imposed on transgressing managers and entrepreneurs. Moreover, the overall tax rate for companies
has been one of the highest in Europe for decades, with an overall tax rate of about 40-43%. As a
consequence, in Italy firms are particularly sensitive to the possibility of tax deductions. DeAngelo
and Masulis (1980) argued that firms able to reduce taxes by methods other than deducting interest
will employ less debt in their capital structure. Non-debt tax shields may be regarded as substitutes
for tax benefits of debt financing; as a consequence, tax advantage of leverage will decrease when
other tax deductions (such as depreciation) increase. Accordingly, if a firm has a large amount of
NDTS, such as depreciation, the probability of negative taxable income is higher and it is less likely
that the amount of debt will be increased for tax reasons. Consistent with this argument, debt level
should be inversely related to the level of the NDTS, measured in this study as depreciation divided
by total assets.
Ownership concentration – Due to the fact that the governance of a firm, and thus its
financial decision-making, is strictly influenced by the ownership structure (Jensen and Meckling
1976), a variable that addressed ownership control has to be included. A feature of the Italian
economy is that, in most cases, the Italian model of corporate governance far from the one proposed
by Berle and Means (1932); there is not a wide separation between ownership and control.
Generally, the largest shareholder holds a substantial block of shares, holding an effective control
(La Porta et al. 1999). In a country such as Italy, the inefficiency of law, combined with weak
enforcement and the weak legal protection prevalent in the Italian economic system leads to a
higher concentration of ownership as a mechanism of protecting owners’ interests (La Porta et al.
1999). Indeed, the dominant shareholder has a relevant discretionary power to use financial
15
resources, sometimes allowing for opportunistic behaviours. Individuals holding a majority of the
controlling power (high level of equity shares) are not inclined to loosen their grip on their
companies. This can limit the financial resources available to a firm because growth frequently
requires significant levels of outside equity resources. Moreover, one of the disadvantages of this
tight concentration of ownership is that it acts as an additional factor influencing financial decisions
and may serve as a constraint on a firm’s expansion - since growth often requires a significant
amount of outside financing, which would reduce control20
. Thus, the variable ownership
concentration included in the model takes into account an important characteristic of Italian firms’
ownership structure and considers the percentage of shares held by the primary shareholder (who
has the highest percentage of shares).
Tangibility - The agency costs of debt due to the possibility of moral hazards on the part of
borrowers increases when firms cannot collateralize their debt (Jensen and Meckling 1976). Hence,
lenders will require more-favorable terms and firms may choose equity instead. To mitigate this
problem, a large percentage of a firm’s assets can be used as collateral. Tangible assets provide
better collateral for loans and thus are associated with higher leverage (Titman and Wessels 1988,
Rajan and Zingales 1995). Asset tangibility is measured as the ratio of property, plants, and
equipment to total assets.
Size - In previous studies, the size of a firm was found to be an important determinant of
leverage (Harris and Raviv 1991, Rajan and Zingales 1995). Large firms tend to have more
collateralizable assets and more-stable cash flows. Thus, typically, a company’s size is inversely
related to the probability of default, which suggests that large firms are expected to carry more debt.
Diamond (1989) also argued that large established firms have better reputations in the debt markets
and thus can assume more debt. The size of a firm is measured by the log of its total assets.
Growth opportunities - Firms with high growth opportunities will retain financial flexibility
through a low leverage in order to be able to exercise those opportunities in subsequent years
20
This concentration, a by-product of the relative lack of protection of minority shareholders by Italian securities law,
has been suggested to also restrict growth.
16
(Myers 1977). A firm with outstanding debt may forgo such opportunities because investment
effectively transfers wealth from stockholders to debtholders (Jensen and Meckling 1976).
Therefore, leverage is expected to be negatively related to growth opportunities. Growth
opportunities are expressed by the growth rate of annual sales (sales growth).
4. Data and Descriptives
The analysis is based on the data provided by Mediobanca - Ricerche & Studi (R&S) for
Italy. The R&S Directory is the source provided by Mediobanca, the first edition of which appeared
in 1976, is an annual publication that contains a broad range of high-quality financial and non-
financial information on the leading Italian companies, in terms of total assets and value added; the
aim is to provide a fully comprehensive financial profile of their operations, enabling the user to
gain in-depth knowledge of large leading Italian companies21
. The sample consisted of a panel
made up of 180 Italian listed and unlisted firms evaluated in the period from 1980 to 2006. Data for
a firm included in the sample were considered only if available for at least six consecutive years
between 1980 and 200622
. Firms belonging to the financial-services industry were excluded. The
sample comprised 2085 observations. This is a unique database, created using the R&S books until
the 2000 and the PDF-files up to the 2006. R&S is the only database on Italy with details on the
numbers and the amount of sales for each business segments, that allows analysis on the corporate
diversification; we get all the data available with the features we need.
Compared with previous studies, our sample focused on a smaller number of firms but the
analysis was based on a longer period. Previous empirical evidence regarding the effect of
diversification on capital-structure determinants is quite limited. Rumelt (1974), for 249 USA firms,
observed that firms employing a strategy of unrelated diversification have the highest debt level.
21
R&S by Mediobanca, available through the subscription of University of Calabria, provides a detailed balance sheet
analysis, complemented by a profile of the company's history and its operations, the names of its directors, and major
shareholders, figures on production and market share, details of production facilities, sales, employees and, in the case
of listed companies, stock market performance. 22
This strong requirement is a necessary condition since we lost one-year data in the construction of some variables
(the growth opportunities variable, for instance), we lost another year-data because of the estimation of the model in
first differences, and four consecutive year information is required in order to test for second-order serial correlation, as
Arellano and Bond (1991) point out. We need to test for the second-order serial correlation because our estimation
method, the Generalized Method of Moments (GMM) is based on this assumption.
17
Barton and Gordon (1988), for 279 USA firms, and Lowe et al. (1994), for 176 Australian firms,
obtained similar results. Kochran and Hitt (1998), focusing on 187 USA firms, showed that equity
financing is preferred for related diversification, while unrelated diversification is associated with
debt financing. Anderson et al. (2000) found that 199 USA multi-business firms have higher debt
ratios than firms that operate in a single segment. In contrast, Alonso (2003) analyzed 480 Spanish
manufacturing firms during the period from 1991 to 1994 but did not find a significant relation
between leverage and diversification. While many of these articles used the deterministic Rumelt
categories to study the capital structure-diversification relation (Lowe et al. 1994, Barton and
Gordon 1988, Rumelt 1974), others used directly total diversification measures (Low and Chen
2004, Alonso 2003, Singh et al. 2003), while just Kochhar and Hitt (1998) use the related-unrelated
diversification measures. Instead, our analysis tried to be comprehensive applying a multiple
research approach and paying attention to the related-unrelated type of diversification.
An inductive approach was applied to identify structural differences between the firms in the
sample with respect to diversification strategies. Therefore, a k-means cluster analysis was carried
out with the goal of verifying whether there were differences between groups of firms in terms of
diversification strategies (according to the DT, DR, and DU). Therefore, we ran a k-means cluster
analysis using DT, DR and DU as input data in order to identify and to profile firms according to
their diversification features. The number of clusters k leading to the greatest separation (distance)
was not known a priori but was computed from the data. The goals were to minimize variability
within the clusters and to maximize variability between clusters. The cluster analysis examined two,
three, four, five, six and seven clusters and, to infer the correct cluster number, we conducted a
pseudo-F test (Calinski and Harabasz 1974). Pseudo-F increases up to the three-cluster solution,
suggesting the latter as the optimal one. The three-cluster solution yielded F-values larger than
74.318 (all p-values 0.000); therefore, three clusters were identified that presented different
diversification features. For robustness we re-ran the k-means cluster analysis using as input data
DT, DR and DU jointly with some control variables to take into account firm-specific factors

18
(ROA, Leverage and Size); the results were less then 1% different in the output, suggesting that the
diversification variables used provide important scores to differentiate firms23
.
To gain further support for the three-cluster solution, we conducted a validation procedure
suggested by Lattin et al. (2003). Specifically, we split the sample into two subgroups by applying a
random selection procedure. The calibration sample included 1475 firms (around 70%), whereas the
validation sample encompasses 610 firms (around 30%). First, we ran a k-means cluster analysis on
the calibration sample and saved final centroids. The resulting three-cluster solution was
substantially identical to the whole sample analysis. Second, we used final centroids from the
calibration data to classify firms from the validation sample. This classification is denoted as S1.
Third, we ran a k-means cluster analysis on the validation sample and used final centroids from
such application to classify firms from the validation sample. This classification is denoted as S2.
Finally, we cross-tabulated S1 versus S2 and assessed the agreement between the two solutions. The
latter step was achieved by computing the Rand Index (Lattin et al. 2003), which indicates the
proportion of agreement between S1 and S2 over all the possible combinations between firms in the
clusters. We found a Rand Index of 0.925, which shows a quite perfect agreement between S1 and
S2 and suggests a strong capability of the clustering model to classify firms.
Firms in cluster 1 were low in diversification measures. Firms in cluster 2 had a high level
of total diversification, with a high degree of related diversification and a low degree of unrelated
diversification. Firms in cluster 3 had a high level of total diversification, with a low degree of
related diversification and a high degree of unrelated diversification. According to these results, and
by looking at the descriptives of these three clusters, it was possible to describe, refer and label to
these groups of firms as “specialized” (cluster 1), “related-diversified” (cluster 2), and “unrelated-
diversified” (cluster 3). We computed cross-tabulations to describe clusters relative to the main
variables of the analysis. Table 2 show the descriptive statistics for the three groups of firms as
outcomes of the cluster analysis.
23
Moreover, as a further robustness check, we ran the cluster analysis with period-average value for all the firms. The
results did not change the cluster membership.
19
=== Here Table 2 ===
The first part of table 2 shows the main descriptive statistics for the variables used in the
analysis. Some variables, such as debt, were symmetrically distributed while others, such as
diversification measures, were quite asymmetrically distributed. The second part of table 2
compares, respectively, the mean by groups of firms, sorting the samples by groups resulting from
the cluster analysis.
The cluster analysis reveals relevant and statistically significant differences among the three
groups of firms, showing that the debt level in the firms depended on the type of diversification.
Related diversified firms made much less use of debt than was the case for either unrelated-
diversified or specialized firms (as predicted by the transaction cost theory). Unrelated-diversified
firms carried more debt than either related-diversified or specialized firms, probably due to the low
probability of distress and the low cost of debt (coinsurance effect). Therefore, it is important to
differentiate among the financial policies adopted by product-diversified firms with respect to the
degree of relatedness of the business segments in which they operate.
5. Empirical Results This section presents the results obtained by estimating the model with the GMM technique.
The key identifying assumption, that there is no serial correlation in the error terms, was verified by
testing for the absence of a second-order serial correlation in the first residuals. The Sargan statistic,
which confirms the absence of correlation between the instruments and the error term24
, as well as
the m2 tests, suggested that the dynamic feature of our model for the sample of Italian firms was
valid, well-specified, and consistent
25.
Table 3 shows the GMM results for groups of firms compared according to the degree and
direction of diversification, defining diversity by the cluster analysis approach.
24
We have applied some straightforward techniques that provide the basis for some minimally arbitrary robustness
tests: simply cutting the number of instrument count (lag) and examining the behaviour of the coefficient estimates and
overidentification tests. As suggested by Roodman (2007), we repeatedly selected random subsets from the collection of
potential instruments and looked how key results such as coefficients of interest and the p-value on the Sargan statistic
vary with the number of instruments. None of the coefficients systematically lose significance as the instrument count
falls, this should signal the lack of overfitting problems. 25
Specifically, the Sargan statistic confirms the absence of correlation between the instruments and the error term in the
model, and the hypothesis of serial correlation in the residuals is always rejected.
20
=== Here Table 3 ===
The previous year’s debt ratio has a positive influence on the current debt level, significant
at the 1% level. As a general overview the size of the coefficient of the lagged debt level variable,
(1 - α), interpreted according to the direction provided in table 1, was in the range 0.29–0.65. As a
consequence, the parameter α, which measures a firm’s speed of adjustment of the current debt ratio
toward a target debt ratio, was in the range 0.35-0.71.
Therefore, the adjustment coefficient presented a relatively wide range, having values below
and above 0.5, showing a certain variety in the financial behaviour for firms with different
diversification strategies26
. In particular, the speed of this adjustment was changing among the three
groups of firms, according to the different diversification strategy adopted; the significant results
obtained for the coefficient (1-α) showed a wide spread, especially between related and unrelated
diversified firms. As argued by Ozkan (2001), the adjustment process is a trade-off between the
adjustment (transaction) costs involved in moving towards a target ratio and the costs of being in
disequilibrium. If the latter costs are greater than the former ones, then the estimated coefficient 1 -
α should be close to zero and firms will try to quickly attain the target of an optimal debt level.
Based on the estimated adjustment speed, convergence toward a target seems to explain much of the
variation in firms’ debt ratios. However, as showed in table 4, it is fundamental to differentiate this
effect for level of diversification and for type of diversification, related or unrelated.
Specifically, specialized firms reported a target-adjustment coefficient that, although is
statistically significant, did not show any economic significance; a value close to 0.5 means that it is
both far from zero as well as from one. Instead, firms that had adopted a related diversification
strategy moved more slowly toward their target capital structure, while firms with an unrelated
diversification strategy quickly adjusted their capital structure to the equilibrium level. In the latter
case, the role of the internal capital market is supposed to be relevant in providing support in
26
According to table 1, if the coefficients of the target-adjustment model is close to 1, firms do not adjust, while if the
coefficients of the target-adjustment model is close to 0 firms automatically adjust. Thus, if the coefficient of the target-
adjustment model is lower than 0.5, that separates in two equal half the possible range of the target-adjustment
coefficients [0 – 1], firms tend to adjust, and the opposite can be implied if the target-adjustment model is higher than
0.5.
21
adjusting toward the target debt level. According to the transaction cost theory, unrelated-
diversified firms—by mainly using general-purpose assets, which have a high liquidation value in
case of bankruptcy—have a higher capacity to meet scheduled interest payments and can easily
manage more debt. Therefore, easier access to the credit market together with the existence of an
internal capital market allows unrelated-diversified firms to strictly move toward a target debt ratio.
Conversely, related-diversified firms, which mainly use special-purpose assets and which have a
low liquidation value, more than specialized firms, face higher transaction costs and adjust
relatively slowly to their target debt ratio. These firms face contingent problems in their access to
the credit market and are more vulnerable to situations that must be dealt with by management over
time.
Therefore, we found that while unrelated-diversified firms quickly move toward an optimal
debt ratio, related-diversified firms do so more slowly. Firms that adopt a related diversification
strategy are subject to greater transaction costs and thus have to maintain financial flexibility to
satisfy their financial needs and be able to not miss investments with positive net present value.
Conversely, firms that have diversified into unrelated businesses are subject to lower transaction
costs and, in general, are able to quickly adjust to their target debt level; they are thus less exposed
to contingencies in the capital market. In this case the results generally supported the trade-off
theory for unrelated diversified firms.
As previous research has shown, capital structure depends on several firm-specific
characteristics, and diversification features seems to reveal differences in their effects.
The results, generally, show that the choice of debt level is a negative function of ROA and
NDTS, and a positive function of size and tangibility. In general, to differentiate between related
and unrelated diversification seemed to be justified; a comparison of the three groups of firms
established that there are relevant differences in the sign (ROA and ownership) and in the intensity
(tangibility and size) of the coefficients of capital-structure determinants.
22
The link between ROA and debt was different for unrelated-diversified firms compared to
related-diversified or specialized firms. The positive link between ROA and debt indicated that
more-profitable unrelated-diversified firms preferred debt as a source of finance. According to the
trade-off model, expected bankruptcy costs decline when ROA increases, the deductibility of
interest payments induces more-profitable firms to use debt, and a higher debt ratio helps to control
for agency problems by forcing managers to pay out more of a firm’s excess cash. Conversely, a
negative link between ROA and debt was exhibited by specialized and, especially, by related-
diversified firms. According to the pecking-order theory, these two types of firms seem to prefer to
raise capital, first from retained earnings and second from debt. This preference is due to the costs
associated with external-financing issues in the presence of asymmetric information. Therefore, the
market seems to raise doubts about the soundness of strategies based on diversification into related
business, and such firms have to finance this choice through internal resources.
The relation between NDTS and debt was always negative and it was slightly stronger for
unrelated-diversified firms. This result corroborates the role of the tax factor, in which NDTS is a
substitute for debt in reducing firms’ tax burdens. When NDTS exist, then firms are not likely to
fully use debt tax shields (substitution effect). In other words, firms with large NDTS have less
incentive to use debt tax shield to benefit interest deductibility, and thus may issue less debt.
Ownership exerted a negative influence on debt ratio for specialized firms (and mainly for
related-diversified firms) and a positive one for unrelated-diversified firms. In particular, when
diversified firms were sorted according to the degree of correlation among businesses, then
ownership concentration influenced capital-structure decisions for related-diversified firms while,
vice versa, it positively affected debt use in unrelated-diversified firms. For the latter type of firm,
debt and ownership exerted a controlling effect on management with respect to value-destroying
decisions.
23
Specialized firms and related-diversified firms were also sensitive to the level of tangibility,
since higher levels of tangible assets grant these firms cheaper access to debt27
. These assets are less
subject to information asymmetries and usually retain a high value in case of liquidation. More-
tangible assets alleviate bondholder-shareholder conflicts, since creditors have a guarantee of
repayment, even during liquidation. This result suggests that specialized firms and related-
diversified firms use tangible assets as collateral when negotiating borrowing. Vice versa,
unrelated-diversified firms are able to borrow by relying on cash-flow stability and reduced
business risks; when cash flows are more stable and firms are less exposed to the risk of
bankruptcy, the relevance of tangibility to borrowing disappears.
Size was also positively related to the debt ratio. It was particularly relevant in granting
better access to credit for specialized firms and related-diversified firms; the effect of the coefficient
was economically stronger for such firms than for unrelated-diversified firms. Relatively large firms
tend to be less prone to bankruptcy, since they have better access to the credit market, as it is less
subject to asymmetric information, and therefore are granted better borrowing conditions. For
unrelated-diversified firms, which are inherently larger, size is less relevant in affecting debt choice.
Finally, the growth opportunity variable was not statistically significant. While theoretical
arguments assume the relevant role of the growth opportunity factor, the lack of any significant
result could be due to the fact that we used sales growth as proxy. In general, this is not a good
proxy, because it accounts for past growth and not for future opportunities. However, we could not
apply better proxies as the Tobin’s Q, scrutinizing a sample of Italian listed and unlisted firms.
To sum-up, the behaviour of unrelated-diversified firms seems to support the trade-off
theory. In addition to the rapid speed of adjustment, this conclusion is justified by the positive link
between ROA and debt for these firms, compared to the negative link for the other two groups of
firms. According to the coinsurance effect, diversified firms in unrelated business are less
27
From the viewpoint of transaction-cost economics, tangible assets usually have less asset specificity, which increases
their use as collateral for debt to reduce lenders’ risks (Williamson 1988).
24
financially constrained and less sensitive to changes in ROA. Instead, the tax benefit associated
with the use of debt by more-profitable firms is particularly relevant for unrelated-diversified firms.
Specialized firms and firms adopting a strategy of related diversification prefer to preserve their
financial flexibility; they use less debt to be able to exploit future growth opportunities. Unrelated-
diversified firms rely on the internal capital market to take advantage of growth opportunities and
they use debt for tax reasons. The role of tangibility as collateral, especially in the presence of
asymmetric information, is absent for unrelated-diversified firms but relevant for specialized and
related-diversified firms. Moreover, size is particularly of importance for specialized and related-
diversified firms. By contrast, unrelated-diversified firms, which are generally larger than
specialized or related-diversified firms, have access to credit based on factors less connected to size,
such as risk diversification. Due to the reduced variance in the future cash supplies of an unrelated-
diversified firm, its creditors rely on the combined fortunes of the firm’s total operating units. Its
cash flows are less than perfectly correlated, and tangibility and size become less important factors
(coinsurance effect).
6. The Direct Effect of Diversification, both Related and Unrelated, on Capital Structure
In this section we directly analyse the effect of diversification measures, both related and
unrelated, on the use of debt. In this case the model is characterized by the direct consideration of
the diversification measures in the empirical analysis, to test directly the link between
diversification, related as well as unrelated, and debt/equity choice. This approach permitted us to
directly identify the sign and magnitude of the relation between diversification and capital structure,
differentiating between the effect of related and unrelated diversification. Therefore, the direct
effect of diversification measures on debt was investigated, in a traditional capital structure
determinants model, according to the following empirical form:
Debt = f (diversification, ROA, non-debt tax shield, ownership concentration, tangibility, size,
growth opportunities)
The variables are as explained in the previous section. Table 4 reports the results for the
model based directly on diversification measures. Measures of diversification were used to capture
25
the direction and magnitude of the effect on capital structure. Here we took into account the fact
that DR and DU are sensitive to the number of business segments of a firm by including in the
regression, both when considering DR and DR alternatively, a variable called Number of Corporate
Segments to control for the fact that the effect of an increase of DR (or DU) on Debt can be
sensitive to the different level of diversification28
.
=== Here Table 4 ===
The estimate of the speed of adjustment of the debt ratio was around 0.426–0.427.
Therefore, the adjustment coefficient α, which is given by 1 - α, is relatively large (in the sense that
it is greater then 0.5), providing possibly evidence that firms adjust their debt ratio relatively
quickly in an attempt to reach their target capital structure.
Compared to other empirical analyses, the empirical evidence reported here suggests that
corporate diversification has a substantial influence on a firm’s capital-structure decisions. The
variable Number of Corporate Segments was negative and statistically significant; it means that the
overall diversification of a firm has a general negative effect on the use of debt. In particular, DR
was negative and statistically significant, indicating that related diversification leads to lower levels
of debt in capital structures. Firms diversified in related segments promoted the use of equity to
finance the growth of the companies29
. The coefficient for the DU variable was positive and
statistically significant. Firms diversified in unrelated segments had significantly higher debt ratios
and the unrelated-diversification strategy tended to increase their use of debt.
Therefore, the analysis showed a differential effect of diversification strategy on debt/equity
choice; specifically, the relation between diversification and capital structure depended upon the
degree of relatedness. The two types of diversification had opposite effects on debt. Unrelated-
diversified firms had higher debt level than the two other types of firms, and increased their use of
debt is connected to increase unrelatedness, in contrast to the strategy of related-diversified firms.
28
A detailed description of the content validity of measure of relatedness are provided in Robins and Wiersema (2003). 29
As a robustness test, the analysis also used pure diversification (the number of business segments) and the Rumelt
measure of specialization (SR), which is interpreted in the opposite sense of total diversification, obtaining the same
results. The Rumelt measure of related diversification (RR) was not significant.
26
According to the transaction cost hypothesis, an increase in the degree of business relatedness is
followed by a reduction in the use of debt; special purpose assets, mainly used by related-diversified
firms, are better managed by less-leveraged firms. Unrelated diversification positively influences
debt usage, and general-purpose assets, mainly used by unrelated-diversified firms, can provide
easer access to debt due to their higher liquidation value in the market, in case of default. Moreover,
unrelated-diversified firms can exploit the tax benefit resulting from diversification into unrelated
businesses, while benefiting from the reduced business risk Therefore, according to the coinsurance
effect approach and the transaction-cost hypothesis, unrelated-diversified firms have a higher debt
capacity and can assume more debt as a source of finance. Regarding control variables, our model
highlights the relevance of ROA, NDTS, firm size, and growth opportunities in explaining debt
ratios, in line with previous studies of capital structure (Titman and Wessels 1988, Balakrishnan and
Fox 1993, Rajan and Zingales 1995).
7. Conclusion
The controversial results on capital-structure decisions suggested the need for further
research, such as an examination of the effectiveness of corporate-strategy analysis in
understanding capital structure. Accordingly, the present work examined the relation between
strategy and finance by investigating the role of diversification on capital-structure choices,
differentiating between related and unrelated diversification.
Previously, empirical financial studies paid little attention to the role of diversification as a
determinant of capital structure. The results of the present analysis indicate that the product-
diversification strategies developed by firms indeed affect their capital-structure decisions, together
with other firm-specific characteristics as well as industrial and institutional factors. While our
findings point to the importance of diversification in explaining financing choices, they also reveal
that diversified firms cannot be considered as a homogeneous group. The degree of product
specialization/diversification and the direction of diversification (related or unrelated) translate into
27
different corporate financial behaviours. Diversification is clearly a determining factor in capital-
structure decisions and thus deserves more attention in future investigations.
According to the present descriptive analysis and similarly to the general conclusions of
earlier studies on the effect of product diversification on capital structure, firms that diversify across
product lines are likely to have higher debt ratios than non-diversified firms. However, we have
shown that these observations need to be sorted by the type of diversification. In differentiating
between the scope of diversification and observing the difference between related and unrelated
diversification, we found that related-diversified firms have a lower debt ratio than specialized
firms, whereas unrelated-diversified firms have higher debt level.
Furthermore, with respect to analyses of capital-structure determinants, related and unrelated
diversification seems to have opposite effects on debt level and debt determinants. Specifically, a
related-diversification strategy, which is associated with lower debt ratios and is based on business
synergies and resource sharing, has a negative influence on debt. By contrast, unrelated diversity,
which is associated with higher debt usage and based on financial synergies, has a positive effect on
debt. Accordingly, our results suggest that a diversified firm, organized in unrelated business
segments, increases its use of debt to take advantage of the tax deductions and benefits derived from
the coinsurance effect.
Another important result of this analysis was the large and statistically significant lagged-
debt effect on a firm’s current debt level. This finding implied that there is a target debt-to-equity
ratio for Italian firms and that it was therefore correct to use a dynamic panel-data analysis. These
results validated the target-adjustment model for capital-structure decisions, but highlighted a
differential effect according to diversification strategy. Italian firms tend to move toward an optimal
debt level such that a trade-off approach well-explains their capital-structure decisions. In
particular, the capital-structure decisions of unrelated-diversified firms seem to be strictly aimed at
reaching their target optimal debt level—a behaviour that is consistent with the trade-off hypothesis.
28
Therefore, while an assessment of capital-structure choices must take into account
diversification strategy, it is equally important that it differentiates between related and unrelated
product diversification. This conclusion implies that diversification strategy is a feature that
differentiates firms with respect to their financial behaviours. An interesting direction for future
empirical studies is the combined effect of international (geographical) diversification and product
diversification, according to their degree of relatedness, on capital-structure decisions.
References
Alonso, E., “Does diversification strategy matter in explaining capital structure? Some evidence from
Spain”, Applied Financial Economics, Vol. 13, 2003, pp. 427-430. A previous and extended version of
the paper is also available on www.ssrn.com.
Anderson, R., Bates, T., Bizjak, J. and Lemmon, M., “Corporate governance and firm diversification,
Financial Management, Vol. 29, 2000, pp. 5–22.
Ansoff, H., “A model for diversification”, Management Science, Vol. 4, 1958, pp. 392-414.
Arellano, M. and Bond S., “Some Tests of Specification for Panel Data: Monte Carlo Evidence and an
Application to Employment Equations”, Review of Economic Studies, Vol. 58, 1991, pp. 277–297.
Balakrishnan, S. and Fox, I, “Asset specificity, firm heterogeneity and capital structure”, Strategic
Management Journal, Vol. 14, 1993, pp. 3-16.
Barton, S. and Gordon, P., “Corporate strategy and capital structure”, Strategic Management Journal, Vol. 9,
1988, pp. 623-632.
Barton, S. and Gordon, P., “Corporate Strategy: Useful Perspective for the Study of Capital Structure?”,
Academy of Management Review, Vol. 12, 1987, pp. 67-75.
Bergh, D., “Predicting divestiture of unrelated acquisitions: An integrative model of ex-ante conditions”,
Strategic Management Journal, Vol. 18, 1997, pp.715-731.
Bond, S. and Meghir, C., “Dynamic Investment Models and the Firm's Financial Policy”, Review of
Economic Studies, Vol. 61, 1994, pp. 197-222.
Bromiley, P., “On the Use of Financial Theory in Strategic Management”, in Shrivastava P., Lamb R. (Eds.),
Advances in Strategic Management, Vol. 6, 1990, pp. 71-98.
Berle, A. and Means, G. The Modern Corporation and Private Property, 1932, New York, Macmillan.
Blundell, R. and Bond, S. “Initial conditions and moment restrictions in dynamic panel data models”, Journal
of Econometrics, Vol. 87, 1988, pp. 115-143
Baltagi, B., Econometric analysis of panel data, New York: Wiley, 2001.
Chatterjee, S. and Wernerfelt, B., “The link between resources and type of diversification: theory and
evidence”, Strategic Management Journal, Vol. 12, 1991, pp. 33-48.
Chkir, I. and Cosset, J., “Diversification strategy and capital structure of multinational corporations”, Journal
of Multinational Financial Management, Vol. 11, 2001, pp. 17–37.
Calinski, T., and Harabasz, J. “A Dendrite Method for Cluster Analysis”, Communications in Statistics, Vol.
3, 1974, pp. 1–27.
29
Comment, R. and Jarrell, G., “Corporate Focus and Stock Returns”, Journal of Financial Economics, Vol.
37, 1995, pp. 67-87.
De Miguel, A. and Pindado, J., “Determinants of capital structure: new evidence from Spanish panel data”,
Journal of Corporate Finance, Vol. 7, 2001, pp. 77–99.
Deangelo, H. and Masulis, R., “Optimal Capital Structure under Corporate and Personal Taxation”, Journal
of Financial Economics, Vol. 8, 1980, pp. 3–29.
Diamond, D., “Reputation acquisition in debt markets”, Journal of Political Economy, Vol. 97, 1989, pp.
828-862.
Drobetz, W. and Wanzenried, G., “What determines the speed of adjustment to the target capital structure?”
Applied Financial Economics, Vol. 16, 2006, pp. 941–958.
Flannery, Mark J. & Rangan, Kasturi P., “Partial adjustment toward target capital structures”, Journal of
Financial Economics, Elsevier, Vol. 79, 2006, pp. 469-506.
Frank, M. and Goyal, V., Trade-off and Pecking Order Theories of Debt, to appear in Espen Eckbo (editor)
The Handbook of Empirical Corporate Finance, 2008, Elsevier Science.
Gaud, P., Jani, E., Hoesli, M. and Bender, A., “The Capital Structure of Swiss Companies: an Empirical
Analysis Using Dynamic Panel Data”, European Financial Management, Vol. 11, 2005, pp. 51-72.
Gertner, R., Gibbons, R. and Scharfstein, D., “Simultaneous signalling to the capital and products markets”,
RAND Journal of Economics, Vol. 19, 1988, pp 173-190.
Harris, M. and Raviv, A., “The theory of capital structure”, Journal of Finance, Vol. 46, 1991, pp. 297–355.
Huang, R. and Ritter, J., “Testing Theories of Capital Structure and Estimating the Speed of Adjustment”,
forthcoming to Journal of Financial and Quantitative Analysis, 2009.
Jacquemin, A. and Berry, C., “Entropy measure of diversification and corporate growth”, Journal of
Industrial Economics, Vol. 27, 1979, pp. 359-369.
Jensen, M. and Meckling, W., “Theory of the Firm: Managerial Behaviour, Agency Costs and Ownership
Structure”, Journal of Financial Economics, Vol. 3, 1976, pp. 305-360.
Jensen, M., “Agency cost of Free Cash Flow, Corporate Finance and Takeovers”, American Economic
Review, Vol. 76, 1986, pp.323-339.
Kaplan, S. and Weisbach, M., “The success of acquisitions: Evidence for divestitures”, Journal of Finance,
Vol. 47, 1992, pp.107–138.
Kim, E. and McConnell, J., “Corporate mergers and the coinsurance of corporate debt”, Journal of Finance,
Vol. 32, 1977, pp 349-365.
Kochhar, R. and Hitt, M., “Linking corporate strategy to capital structure: diversification strategy, type and
source of financing”, Strategic Management Journal, Vol. 19, 1998, pp. 601-610.
Kochhar, R., “Explaining firm capital structure: the role of agency theory vs transaction cost economics”,
Strategic Management Journal, Vol. 17, 1996, pp. 713-728.
Kremp, E., Stoss, E. and Gerdesmeier, D., “Estimation of a debt function: Evidence from French and
German firm panel data”, in: Sauve A., Scheuer M., (eds.), Corporate finance in Germany and France,
Deutsche Bundesbank and the Banque de France, 1999, pp. 139-194.
La Porta, R., Lopez de Silanes, F., Shleifer, A. and Vishny, R., “Corporate ownership around the world”,
Journal of Finance, Vol.54, 1999, pp.471–518.
Lattin, J., Carroll, J., and Green, P., Analyzing Multivariate Data, 2003, Toronto, Thomson, Brooks/Cole.
Lewellen, W., “A pure financial rational for the conglomerate merger”, Journal of Finance, Vol. 26, 1971,
pp. 521-37.

30
Li, D. and Li, S., “A theory of corporate scope and financial structure”, Journal of Finance, Vol. 51, 1996,
pp. 691-709.
Low, P. and Chen, K., “Diversification and Capital Structure: Some International Evidence”, Review of
Quantitative Finance and Accounting, Vol. 23, 2004, pp. 55 – 71.
Lowe, J., Naughton, A. and Taylor, P., “The impact of corporate strategy on capital structure of Australian
companies”, Managerial and Decision Economics, Vol. 15, 1994, pp. 245-257.
Mahoney, J. and Pandian, J., “The resource-based view within the conversation of strategic management”,
Strategic Management Journal, Vol. 13, 1992, pp. 363-380.
Markides, C. and Williamson, P., “Corporate diversification and organizational structure: a resource-based
view”, Academy of Management Journal, Vol. 39, 1996, pp. 340-367.
Myers, S., “Determinants of corporate borrowing”, Journal of Financial Economics, Vol. 5, 1977, pp. 147–
175.
Myers, S., “The capital structure puzzle”, Journal of Finance, Vol. 39, 1984, pp.575-592.
Myers, S., Financing of corporations, in ed. Constantinides, G. and Harris, M., Handbook of the Economics
of Finance, 2003, Elsevier.
Oviatt, B., “On the Integration of Financial Management and Strategic Management,” Academy of
Management, Best Paper Proceedings, 1984, pp. 27-31.
Ozkan, A., “Determinants of capital structure and adjustment to long run target: evidence from UK company
panel data”, Journal of Business Finance and Accounting, Vol. 28, 2001, pp. 175–199.
Palepu, K., “Diversification strategy, profit performance and the entropy measure”, Strategic Management
Journal, Vol. 6, 1985, pp. 239-255.
Parson, C, and Titman, S., 2007, Capital Structure and Corporate Strategy, working paper University of
Texas
Penrose, E., The theory of the growth of the firm, Wiley, New York. 1959.
Rajan, R. and Zingales, L., “What do we know about capital structure? Some evidence from international
data”, Journal of Finance, Vol. 50, 1995, pp. 1421-1460.
Riahi-Belkaoui, A. and Bannister, J., “Multidivisional structure and capital structure: The contingency of
diversification strategy”, Managerial and Decision Economics, Vol. 15, 1994, pp.267-276.
Robins, J. and Wiersema, M., “The measurement of corporate portfolio strategy. Analysis of the content
validity of related diversification indexes”, Strategic Management Journal, Vol. 24, 2003, pp 39-59.
Roodman, D., A Short Note on the Theme of Too Many Instruments”, Working Paper 127, Center for
Global Development, Washington, 2007.
Rumelt, R., Strategy, Structure and Economic Performance, Cambrige, MA, Harvard University Press, 1974.
Shleifer, A. and, Vishny, R., “Liquidation values and debt capacity: a market equilibrium approach”, Journal
of Finance, Vol. 47, 1992, pp. 1343-1366.
Shyam-Sunder, L. and Myers, S., “Testing static tradeoff against pecking order models of capital structure”,
Journal of Financial Economics, Vol. 51, 1999, pp. 219–244.
Singh, M., Davidson III, W. and Suchard, J., “Corporate diversification strategies and capital structure”,
Quarterly Review of Economics and Finance, Vol. 43, 2003, pp. 147–167.
Taylor, P. and Lowe, J., “A note on corporate strategy and capital structure”, Strategic Management Journal,
Vol. 16, 1995, pp. 411-414.
Titman, S. and Wessels, R., “The determinants of capital structure”, Journal of Finance, Vol. 43, 1988, pp.
1-19

31
Titman, S., “The effect of capital structure on a firm’s liquidation decision”, Journal of Financial
Economics, Vol. 13, 1984, pp. 1351-1371.
Villalonga, B., "Does Diversification Cause the 'Diversification Discount'?" Vol. 33, 2000, pp. 5-27.
Williamson, O, “Corporate finance and corporate governance”, Journal of Finance, Vol. 43, 1988, pp. 567-
591.
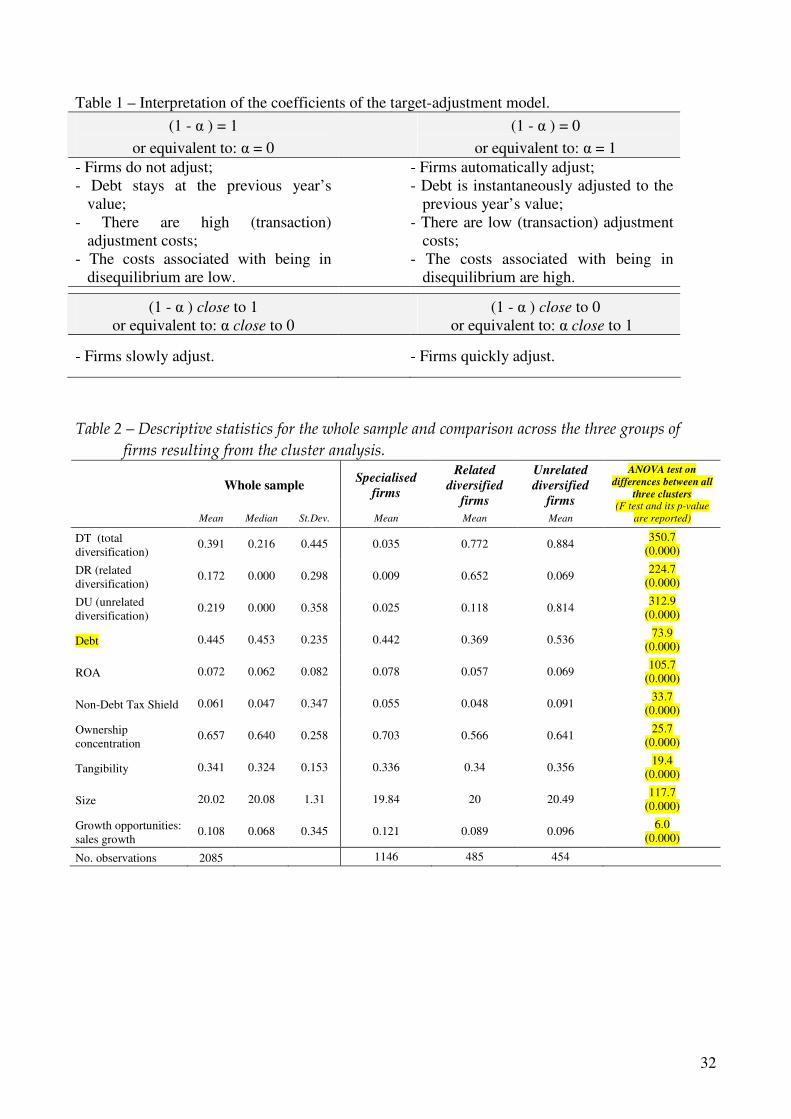
32
Table 1 – Interpretation of the coefficients of the target-adjustment model.
(1 - α ) = 1
or equivalent to: α = 0
(1 - α ) = 0
or equivalent to: α = 1
- Firms do not adjust;
- Debt stays at the previous year’s
value;
- There are high (transaction)
adjustment costs;
- The costs associated with being in
disequilibrium are low.
- Firms automatically adjust;
- Debt is instantaneously adjusted to the
previous year’s value;
- There are low (transaction) adjustment
costs;
- The costs associated with being in
disequilibrium are high.
(1 - α ) close to 1
or equivalent to: α close to 0
(1 - α ) close to 0
or equivalent to: α close to 1
- Firms slowly adjust. - Firms quickly adjust.
Table 2 – Descriptive statistics for the whole sample and comparison across the three groups of
firms resulting from the cluster analysis.
Whole sample Specialised
firms
Related
diversified
firms
Unrelated
diversified
firms
Mean Median St.Dev. Mean Mean Mean
ANOVA test on
differences between all
three clusters (F test and its p-value
are reported)
DT (total
diversification) 0.391 0.216 0.445 0.035 0.772 0.884
350.7
(0.000)
DR (related
diversification) 0.172 0.000 0.298 0.009 0.652 0.069
224.7
(0.000)
DU (unrelated
diversification) 0.219 0.000 0.358 0.025 0.118 0.814
312.9
(0.000)
Debt 0.445 0.453 0.235 0.442 0.369 0.536 73.9
(0.000)
ROA 0.072 0.062 0.082 0.078 0.057 0.069 105.7
(0.000)
Non-Debt Tax Shield 0.061 0.047 0.347 0.055 0.048 0.091 33.7
(0.000)
Ownership
concentration 0.657 0.640 0.258 0.703 0.566 0.641
25.7
(0.000)
Tangibility 0.341 0.324 0.153 0.336 0.34 0.356 19.4
(0.000)
Size 20.02 20.08 1.31 19.84 20 20.49 117.7
(0.000)
Growth opportunities:
sales growth 0.108 0.068 0.345 0.121 0.089 0.096
6.0
(0.000)
No. observations 2085 1146 485 454
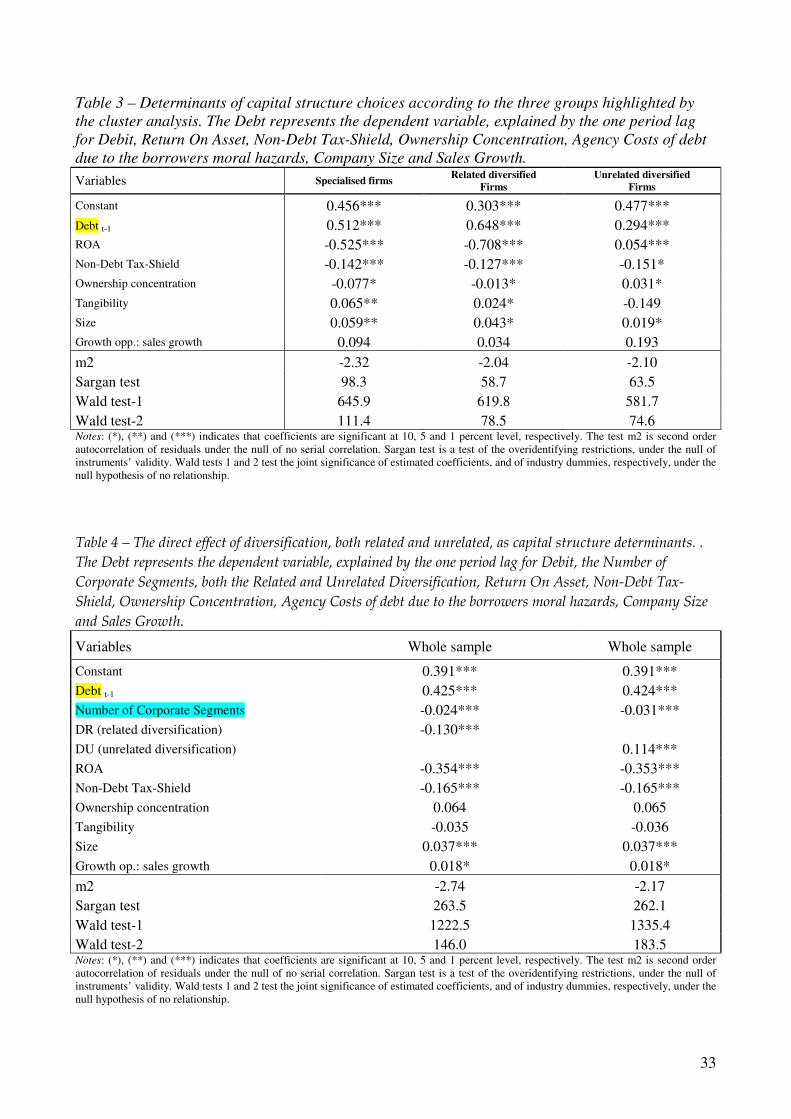
33
Table 3 – Determinants of capital structure choices according to the three groups highlighted by
the cluster analysis. The Debt represents the dependent variable, explained by the one period lag
for Debit, Return On Asset, Non-Debt Tax-Shield, Ownership Concentration, Agency Costs of debt
due to the borrowers moral hazards, Company Size and Sales Growth.
Variables Specialised firms Related diversified
Firms
Unrelated diversified
Firms
Constant 0.456*** 0.303*** 0.477***
Debt t-1 0.512*** 0.648*** 0.294***
ROA -0.525*** -0.708*** 0.054***
Non-Debt Tax-Shield -0.142*** -0.127*** -0.151*
Ownership concentration -0.077* -0.013* 0.031*
Tangibility 0.065** 0.024* -0.149
Size 0.059** 0.043* 0.019*
Growth opp.: sales growth 0.094 0.034 0.193
m2 -2.32 -2.04 -2.10
Sargan test 98.3 58.7 63.5
Wald test-1 645.9 619.8 581.7
Wald test-2 111.4 78.5 74.6 Notes: (*), (**) and (***) indicates that coefficients are significant at 10, 5 and 1 percent level, respectively. The test m2 is second order
autocorrelation of residuals under the null of no serial correlation. Sargan test is a test of the overidentifying restrictions, under the null of
instruments’ validity. Wald tests 1 and 2 test the joint significance of estimated coefficients, and of industry dummies, respectively, under the
null hypothesis of no relationship.
Table 4 – The direct effect of diversification, both related and unrelated, as capital structure determinants. .
The Debt represents the dependent variable, explained by the one period lag for Debit, the Number of
Corporate Segments, both the Related and Unrelated Diversification, Return On Asset, Non-Debt Tax-
Shield, Ownership Concentration, Agency Costs of debt due to the borrowers moral hazards, Company Size
and Sales Growth.
Variables Whole sample Whole sample
Constant 0.391*** 0.391***
Debt t-1 0.425*** 0.424***
Number of Corporate Segments -0.024*** -0.031***
DR (related diversification) -0.130***
DU (unrelated diversification) 0.114***
ROA -0.354*** -0.353***
Non-Debt Tax-Shield -0.165*** -0.165***
Ownership concentration 0.064 0.065
Tangibility -0.035 -0.036
Size 0.037*** 0.037***
Growth op.: sales growth 0.018* 0.018*
m2 -2.74 -2.17
Sargan test 263.5 262.1
Wald test-1 1222.5 1335.4
Wald test-2 146.0 183.5 Notes: (*), (**) and (***) indicates that coefficients are significant at 10, 5 and 1 percent level, respectively. The test m2 is second order
autocorrelation of residuals under the null of no serial correlation. Sargan test is a test of the overidentifying restrictions, under the null of
instruments’ validity. Wald tests 1 and 2 test the joint significance of estimated coefficients, and of industry dummies, respectively, under the
null hypothesis of no relationship.