Embed Size (px)
Citation preview
_____________________________________________________________________________________________________ *Corresponding author: Email: [email protected];
Asian Journal of Economics, Finance and Management
4(1): 33-45, 2021; Article no.AJEFM.430
A Study on the Impact of Capital Structure and Financial Risk of IT Industry
V. S. Abhilash1, Mohamed Shaheen Anzer1* and G. Raju2
1CET School of Management, Thiruvananthapuram, India.
2Government College for Women, Thiruvananthapuram, India.
Authors’ contributions
This work was carried out in collaboration among all authors. All authors read and approved the final manuscript.
Received 25 March 2021 Accepted 31 May 2021
Published 01 June 2021
ABSTRACT
From the past 2 decades, the IT industry is one of the largest employers in India. It also contributes to the nations GDP. Like any firm, even for the IT industries to finance its operations, it has to raise funds. These funds can be raised either by issuing shares or by debt financing. This project aims to study whether the capital structure of the IT industry has any impact on the profitability. The capital structure and profitability of the top 10 IT companies for the past 10 years are taken. The capital structure variables are Debt-Asset ratio and Debt-Equity ratio. The profitability variables are Net profit ratio, Return on Assets, Return on Equity and Return on Capital Employed. Regression analysis has been used to find whether there is any relationship between capital structure variables and profitability variables. Correlation analysis has been used to find the direction of change in profitability variables due to the change in capital structure variables. The profitability of the firm is obtained from Net Profit ratio.
Keywords: Capital structure; financial risk; risk management; debt financing; equity financing.
1. INTRODUCTION Technology based firms are one of the important contributors in the Indian economy. Over the last 2-3 decades India has seen a massive growth in the IT sector. This IT sector has been a major center for employment, innovation, business development, etc. Raising funds for the IT industry is difficult and many firms are built on intellectual capital rather than physical assets.
Any business organization required funds for its various activities. These requirement of funds can be classified as Long Term Funds and Short Term Funds. Short Term Funds are for financing the day to day operations of the company, whereas the long term funds are for the purposes of fixed asset allocation. A new business requires capital and still more capital is needed if the firm is to expand. The required funds can come from many different sources and by different forms. Firms can use either debt or equity capital to
Original Research Article
Abhilash et al.; AJEFM, 4(1): 33-45, 2021; Article no.AJEFM.430
34
finance their assets. The best choice is a mix of debt and equity. One of the most perplexing issues facing financial managers is the relationship between capital structure, which is the mix of debt and equity financing, and stock prices. The debt is advantageous (relative to equity) if Debt Equity Ratio (der > 1), otherwise it is harmful. The value of the firm is independent of its debt policy and is based on the critical assumption that corporate income taxes do not exist. In reality, corporate income taxes do exist, and interest paid to debt-holders is treated as a deductible expense. Thus, interest payable by firms saves taxes. This makes for debt financing advantages. The value of the firm will increase with debt due to the deductibility of interest charges for tax computation, and the value of the levered firm will be higher than that of the un-levered firm. “What will be an optimal capital structure for a firm?” has been one of the most difficult question to answer as well as the most important decision which a firm has to take. The financial manager has to select a capital structure which will reduce cost of capital, reduce tax, increase profits, meet shareholders expectation, etc. Several theories has been proposed for capital structure. Modigliani- Miller theorem is one of the theories in a perfect market situation. Though there are several other theories like trade off theory, pecking order theory, capital structure substitution theory, etc the capital structure is dependent on various factors business risk of company, company’s corporate governance, tax structure, degree to which company’s assets are tangible and transparency of financial information. Profitability is one of the most important criteria for the survival and growth of companies. When the firms profitability is high, then only lenders, shareholders and the investors will show interest in that firm.
2. REVIEW OF LITERATURE Capital structure is the way through which the firm raises funds for itself through debt, securities and equities. The capital structure of a form is related to its ability to meet the expectation and demands of its stakeholders. The boards of directors and financial managers should always develop a capital structure which is beneficial for
its stakeholders, employees, customers, etc. Modigliani and Miller [1] note that tax shields for interest produce strong incentives for businesses to increase leverage. Yet leverage can also be impacted by the extent of non-debt corporate tax shields, such as tax deductions for depreciation and investment tax credits. The theories that have various analytical consequences are extended by Titman and Wessels [2]; short-term, long-term, and convertible debt metrics rather than an aggregate calculation of total debt. According to Brander & Lewis [3], in favorable economic circumstances, companies in the oligopoly sector would follow the strategy of optimizing their production to increase profitability. They would take a cut in production and reduce their profitability in adverse economic conditions. Lalith, P.S (1999) analyzed the capital structure of Sri Lankan companies and found that the use of long-term debt in Sri Lankan companies is relatively low. Sri Lanka's average leverage is calculated at 13.5 percent, while the overall debt to equity ratio is 104.1 percent. The long-term debt to equity ratio is 24 percent. In addition, Kester [4] discovered a negative relationship between profitability and debt/asset ratios. In their study, Rajan and Zingalas [5] found a strong negative association between profitability and leverage. Taub [6] found an important positive relationship between debt and profitability in a regression study of four profitability metrics against debt ratio. Using a sample of French manufacturing firms, Margaritis and Psillaki [7] investigated the relationship between capital structure, ownership structure, and firm output across industries. They discovered a negative relationship between past profitability and leverage, as well as a positive relationship between profitability and leverage in the future. Hijazi and Tariq [8] researched the capital structure determinants of Pakistan's automotive industry from 1997 to 2001. The findings revealed that firm size is negatively correlated but not significant, meaning that firms with a large firm size would use less debt. Profitability was also negatively correlated but significant. According to Abor [9], Capital structure and profitability have a detailed and constructive relationship. He also discovered a favourable relationship between short-term debt-to-assets and Return on Equity, as well as a negative relationship between long-term debt-to-assets and Return on Equity. Trade-off theory was coined by Kraus and Litzebnerger in the year 1973 [10]. This theory mainly argues that a firm’s
Abhilash et al.; AJEFM, 4(1): 33-45, 2021; Article no.AJEFM.430
35
optimal debt ratio can be determined by making a trade off between the benefit and costs of debt. Firms can alter debt for equity or equity for debt in order to maximize the firm value. Sheel [11] showed that all leverage determinants factors studied, excepting firm size, are significant to explain debt behaviour variations. According to Roshan [12], capital structure is a financial structure of an organisation that is managed by a company and is a mixture of debt and equity funds. According to Brendea [13], capital structure is an entity's long-term funding policy. Capital structure, according to Nirajini and Priya [14], refers to how the company funded a combination of long-term capital and short-term liabilities. Nirajini and Priya [14] discovered a positive correlation between debt and company profitability. Azhagaiah and Premgeetha (2004) indicated that the rapid capacity to acquire and dispose of debt offers a growth target for companies with the desired financial flexibility. The rate of growth and the non-debt tax shield are statistically important, meaning that these factors are the key determinants of India's pharmaceutical firms. Fama and French [15] agree that the adverse effects of leverage profitability are consistent with the pecking order model, but also find that leverage's reaction to changes in earnings is compensatory, suggesting that the profitability effects are partly attributable to transitional changes in leverage rather than changes in the goal. Deari and Deari (2009) attempted to examine the factors deciding the structure of wealth. The study concludes that capital structure decisions are influenced by profitability, tangibility, size and growth, while the non-debt tax shield does not affect capital structure decisions. From their report, Onaolapo and Kajola [16] concluded that the debt ratio has a substantial negative effect on the financial measures of the company. As a measure of calculation, they have employed ordinary least squares. ROA and return on equity were the variables used for financial metrics in the report. The relationship between capital structure and financial results has been explored by San and Heng (2011). ROA was taken as one of the financial results variables. Their paper concluded that the capital structure and financial results have a substantial relationship. Chisti, Khursheed and Sangmi (2013) Effect of the capital structure on the profitability of listed companies (Evidence from India) The study's results have shown that the capital structure has a statistically important impact on the profitability of companies. In the report of Arindam and Anoop (2014) found that debt service capacity
(interest), financial leverage and size (log assets) are essential variables for determining the profitability of Indian iron and steel industry companies. The relationship between profitability, capital cost and capital structure among property developers and contractors in Hong Kong is demonstrated by Chiang Yat Hung, Chan Ping Chuen Albert & Hui Chi Man Eddie (2002). The study of this paper shows that gearing among contractors is generally higher than developers and capital gearing is positively associated with assets but negatively associated with profit margins. In a study designed to analyze the relationship, Peterson & Rajan [17] found a substantially positive correlation between profitability and debt ratios. Ooi (1999) claims that, as lending opportunities, profitable businesses are more attractive to financial institutions. The explanation for this is that higher tax shields and low bankruptcy costs are required for those companies. Debt finance caused the payment of interest which reduces the profit (Frangouli & ventoura, 2011). Further studies also examine that debt ratio has negative impact on the profitability of the firm ([16]. Mishra et al. (2009) indicated that Returns on Assets is a measure of financial performance commonly utilized and adopted by many researchers to measure the firm’s financial performance. Moncef Guizani, Ahdi Noomen Ajmi [18] study demonstrate that the capital structure of IBs appears to be influenced by characteristics that are comparable to those previously identified in the corporate finance literature. They also show that for Islamic and CBs, there is a long- and short-run relationship between leverage and its primary determinants. The findings, on the other hand, reveal that multiple independent variables on the capital structure do affect the capital structure. However, the findings demonstrate that different independent variables on capital structure have distinct effects (in terms of coefficient magnitude) among Islamic and CBs. Mr. Bhushan Singh & Dr. Mohinder Singh (2016) focused on listed Cement Companies in India for the period 2009 to 2014. Based on correlation coefficient, it was found that there was a negative relationship between debt and profitability i.e. companies with higher proportion of debt tend to have low profitability. April Bhattacharjee and Mihir Dash [19] stated that the capital structure of the Indian cement industry is essentially controlled by two factors: Collateralizable Asset Value and Profitability. Profitability was found to be negatively connected to Financial Leverage, whilst Collateralizable Value of Assets was found to be positively associated to Financial Leverage.
Abhilash et al.; AJEFM, 4(1): 33-45, 2021; Article no.AJEFM.430
36
Because the Indian cement industry is so capital-intensive, debt may be a better way to fund projects because tangible assets can be used as collateral for creditors. Nilesh P. Movalia did a study on Capital Structure Analysis and Profitability of Indian Tyres Industry for all the listed companies in BSE and NSE for the period 2009-10 to 2013-14. The paper concluded that there was significant relation between capital structure (Debt-Equity Ratio) on profitability (Net Profit Ratio, ROI, ROCE) of tyre companies in India. If company maintains ideal capital structure it helps to generate more profit and vice versa. Booth et al. [20] suggest that debt ratios tend to be influenced in developing countries in the same way and by the same type of variables that are relevant in developed countries. However, there are systemic variations in how country variables such as GDP growth rates, inflation rates and capital market developments influence these ratios Aguome et al. [21]. The study discovered that capital structure had no bearing on the financial performance of N-REITs. The outcome was the opposite for Sky Shelter Fund REIT, due to a statistically significant positive link between capital structure and returns. The study's findings on the averages, median, and standard deviation of NREIT capital structures support the firm financing pecking order hypothesis. Strebulaev [22] concluded that while it is possible to assume a positive relationship between profitability and the ideal leverage ratio, a negative relationship exists between profitability and the real leverage ratio. Firms do not continually rebalance their leverage ratios because of transaction costs; instead, they allow them to shift within a range surrounding the ideal leverage ratios. The non-linear dynamics between size, capital structure, and profitability of 1194 publicly traded manufacturing firms in India were studied by Jaisinghani and Kanjilal [23], who discovered the significance of a single size threshold and two distinct regimes where capital structure differentially affects profitability. According to Chauhan [24], the most consistent theoretical predictors of corporate leverage, such as size, profitability, and asset tangibility growth, are insufficient to explain the drop in Indian enterprises' debt ratios. Giovanni et al. [25] findings show that profitability and capital structure have a negative and significant association, while firm growth and capital structure have a positive and substantial link. This research also shows that the size of a company has no bearing on its capital structure.
3. RESEARCH METHODOLGY 3.1 Objectives The study is basically undertaken to investigate the impact of capital structure on the profitability of the firms. The capital structure of a firm is represented by independent variables Debt Equity Ratio and Debt Asset Ratio and dependent variables such as Return on Assets, Return on Equity, Return on Capital Employed and Net Profit ratio denote the profitability of the firm. To study the impact of capital structure on
the profitability of IT industries. To find out the profitability of the firm. To determine the change in profitability
variables with the change in capital structure.
3.2 Hypothesis The following hypothesis were formed and tested. H01: There is significant relation between Debt
equity Ratio and Profitability variables. H02: There is significant relation between Debt
Asset Ratio and Profitability variables..
3.3 Research Design The study is for a period of 10 years from 2010-2020. The variables used for analysis are Return on Assets, Return on capital employed, Return on Equity, Net Profit Ratio, Debt equity ratio and Debt Asset ratio. The study was conducted based on the secondary data of the IT industries listed in the NSE and BSE. The IT industry was selected due to its huge contribution in the nations economy and GDP in the past decade. It also accounted for a large number of job opportunities. The data was obtained from money control website and the annual financial statements of the selected companies. The data of top 10 IT companies of India was chosen for the study. Karl Pearson’s correlation analysis were used to understand the influence of independent variables which are Debt-equity ratio, Debt Asset Ratio on dependent variables Return on Assets, Return on capital employed, Return on Equity and Net Profit Ratio.
Abhilash et al.; AJEFM, 4(1): 33-45, 2021; Article no.AJEFM.430
37
3.3.1 Tools used for analysis The statistical techniques used for analysis are Regression analysis and Pearson’s coefficient of correlation to analyse the impact of capital structure on profitability. 3.3.2 Regression ANALYSIS Regression analysis is a statistical method used to identify relationships between a independent variable and one or more dependent variables. Regression analysis can be linear regression, multiple linear regression or non linear regression. The multiple regression model has been selected to check the financial performance of the firm with other dependent variables. Formula
Y = a + bX1 + cX2 + dX3 + eX4 + fX5 + ϵ Where, Y is Debt Asset Ratio and Debt Equity Ratio. X1 is Net profit ratio, X2 is return on assets, X3 is return on capital employed, X4 is Return on Equity.
3.3.3 Pearson’s coefficient of correlation Correlation coefficient shows the degree of relationship between two quantitative or qualitative variables. It is a statistical tool which shows the degree of linear relationship between two variables. Correlation can be positive, negative or zero. The correlation coefficient is represented using letter ‘r’. Formula :
r = �(∑��)�(∑�)(∑�)
�(�∑���(∑�)�)�(�∑���(∑�)�)
The correlation can be positive, negative or zero.
Positive Correlation : Both the variables change in the same direction. Negative Correlation : Both the variables change in the opposite direction. Neutral / Zero Correlation : No relationship or change of the variables.
3.4 Data Analysis
3.4.1 Regression
Multiple regression has been performed between the independent and dependent variables. The independent variables are Debt Equity ratio and Debt Asset ratio. The dependent variables are Net profit ratio, Return on assets, Return on Capital employed and Return on equity.
A. Regression on Debt Equity Ratio
Table 1. Regression of Debt Equity Ratio with profitability variables
Regression statistics Multiple R 0.801155449 R Square 0.641850053 Adjusted R Square 0.624795294 Standard Error 0.090712874 Observations 89
ANOVA
df SS MS F Significance F Regression 4 1.238756179 0.309689045 37.63466 5.21E-18 Residual 84 0.691221349 0.008228826 Total 88 1.929977528
Interpretation: From the regression analysis performed between Debt equity ratio and the dependent variables, it is observed that, R-square value is 0.6418, which means 64.18% of the independent variable – Debt equity ratio is explained by the dependent variables. The ANOVA table shows that the significance F value is 5.21E-18 which is less that 0.05. Hence, there is significant relation between Debt Equity ratio and profitability variables.
Abhilash et al.; AJEFM, 4(1): 33-45, 2021; Article no.AJEFM.430
38
Debt Equity Ratio = 0.2202 + 0.011 ROE + 0.006 ROCE – 0.0298 ROA – 0.00303 NPR
B. Regression on Debt Asset Ratio
Table 2. Regression of Debt Asset Ratio with profitability variables
Regression Statistics Multiple R 0.527361143 R Square 0.278109775 Adjusted R Square 0.24373405 Standard Error 0.064042138 Observations 89
ANOVA
df SS MS F Significance F Regression 4 0.132726006 0.033181502 8.090296 1.44E-05 Residual 84 0.344517219 0.004101395 Total 88 0.477243226
Interpretation: From the regression analysis performed between Debt Asset ratio and the dependent variables, the significance F from the ANOVA table is 1.44E-05, which is less than 0.05. Hence, there is significant relation between Debt Asset ratio and profitability variables. Debt Asset Ratio = 0.1877 + 0.0059 ROE -0.0002 ROCE – 0.0078 ROA – 0.0023 NPR
3.5 Correlation Matrix
Table 3. Correlation Matrix DEBT EQUITY
RATIO DEBT/ ASSETS
ROE ROCE NET PROFIT RATIO (%)
ROA (%)
DEBT EQUITY RATIO
1
DEBT/ ASSETS 0.503206 1 ROE -0.30547 -0.07758 1 ROCE -0.23307 -0.08698 0.90264 1 NET PROFIT RATIO (%)
-0.65929 -0.43444 0.504282 0.423575 1
ROA (%) -0.57748 -0.2805 0.903717 0.842274 0.702274 1 The correlation matrix gives the following results between the independent and dependent variables. From the correlation matrix: There is low negative correlation between;
a) Debt Equity ratio and Return on Equity (-0.3054). b) Debt Equity ratio and Return on Capital Employed (-0.233). c) Debt Asset ratio and Return on Assets (-0.2805).
There is moderate negative correlation between;
a) Debt Equity ratio and Net Profit ratio (-0.6592). b) Debt Equity ratio and Return on Assets (-0.5774). c) Debt Assets ratio and Net Profit ratio (-0.4344).
Abhilash et al.; AJEFM, 4(1): 33-45, 2021; Article no.AJEFM.430
39
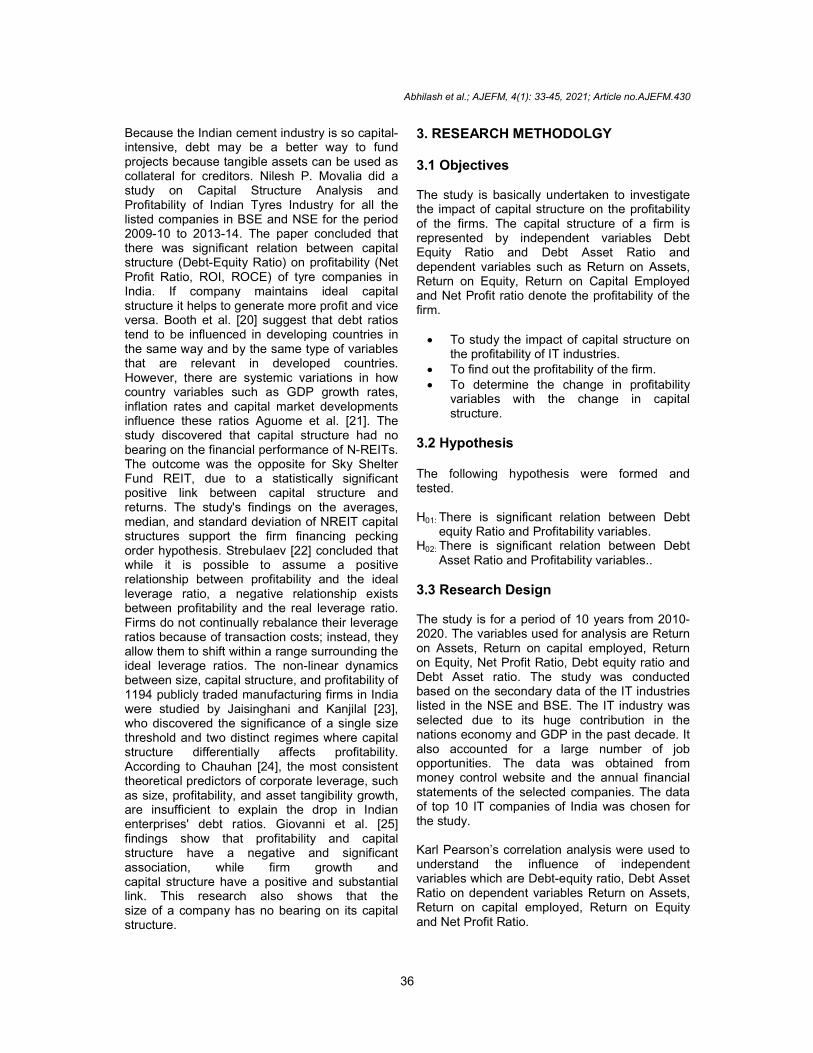
Fig. 1. Scatter plot of Debt Equity Ratio and ROA
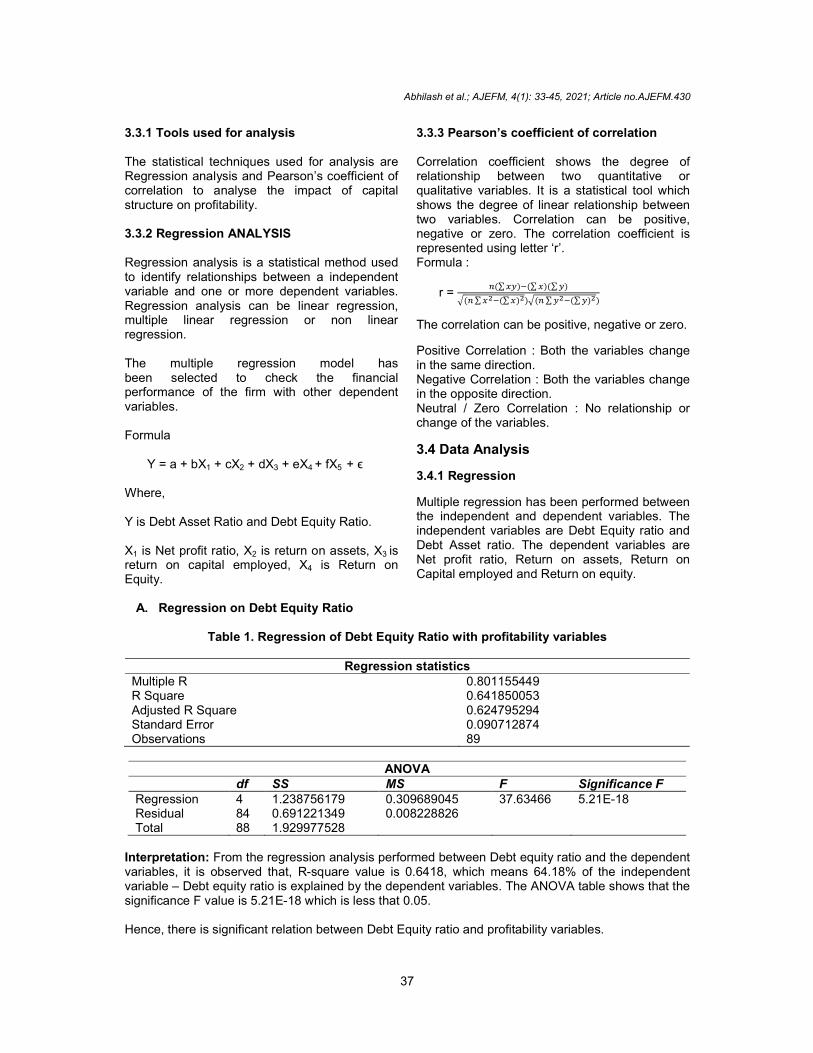
Fig. 2. Scatter plot of Debt Equity Ratio and ROE
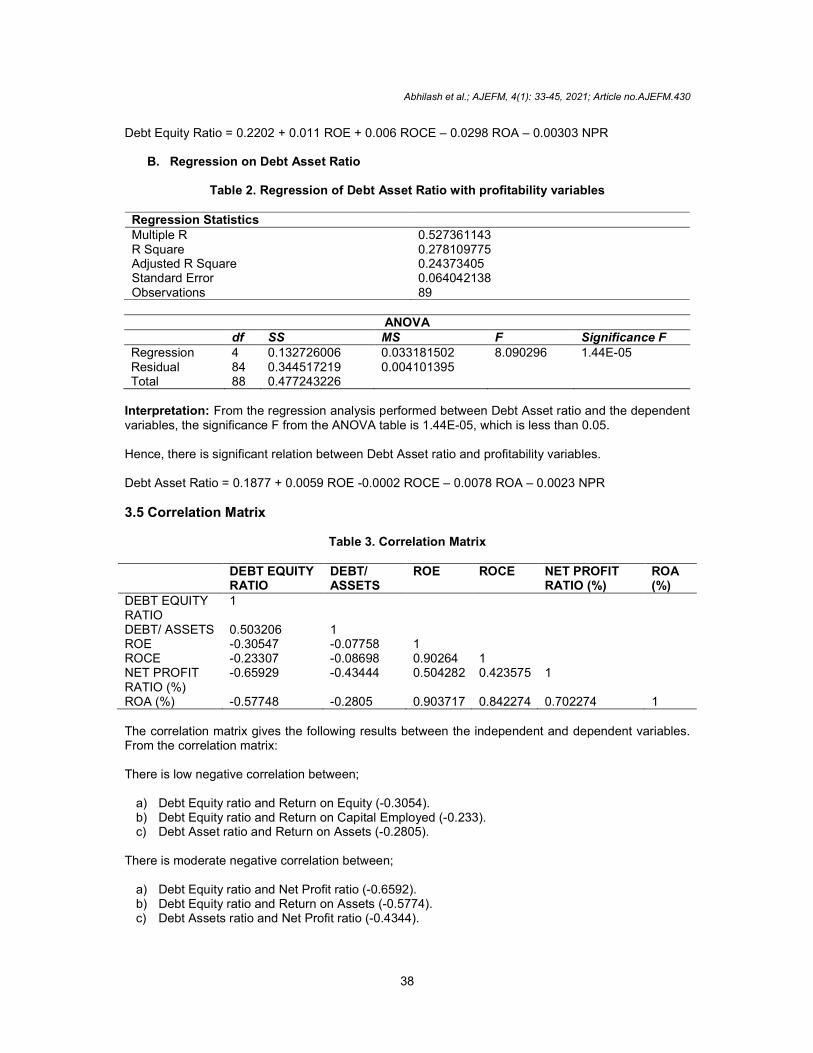
Fig. 3. Scatter plot of Debt Equity Ratio and ROCE
0
10
20
30
40
0 0.2 0.4 0.6 0.8
ROA
0
10
20
30
40
50
60
70
0 0.1 0.2 0.3 0.4 0.5 0.6 0.7 0.8
ROE
0
10
20
30
40
50
60
0 0.1 0.2 0.3 0.4 0.5 0.6 0.7 0.8
ROCE
Abhilash et al.; AJEFM, 4(1): 33-45, 2021; Article no.AJEFM.430
40
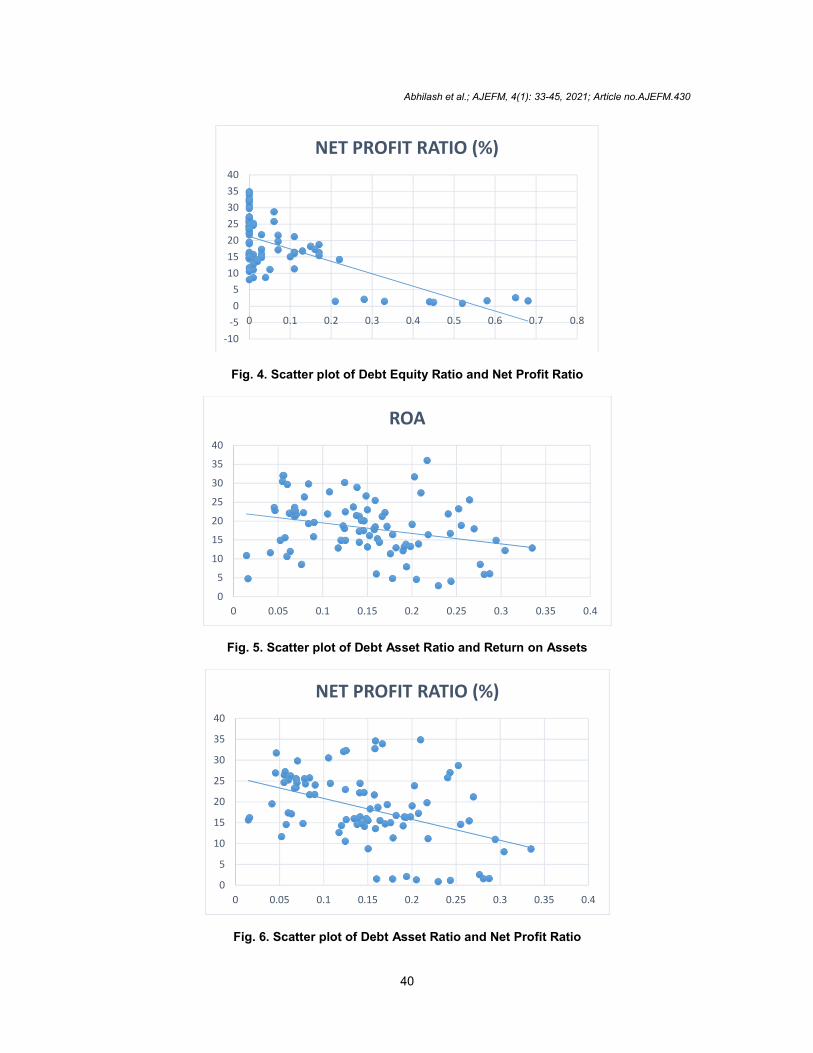
Fig. 4. Scatter plot of Debt Equity Ratio and Net Profit Ratio
Fig. 5. Scatter plot of Debt Asset Ratio and Return on Assets
Fig. 6. Scatter plot of Debt Asset Ratio and Net Profit Ratio
-10
-5
0
5
10
15
20
25
30
35
40
0 0.1 0.2 0.3 0.4 0.5 0.6 0.7 0.8
NET PROFIT RATIO (%)
0
5
10
15
20
25
30
35
40
0 0.05 0.1 0.15 0.2 0.25 0.3 0.35 0.4
ROA
0
5
10
15
20
25
30
35
40
0 0.05 0.1 0.15 0.2 0.25 0.3 0.35 0.4
NET PROFIT RATIO (%)
Abhilash et al.; AJEFM, 4(1): 33-45, 2021; Article no.AJEFM.430
41
3.6 Profitability of The Firm
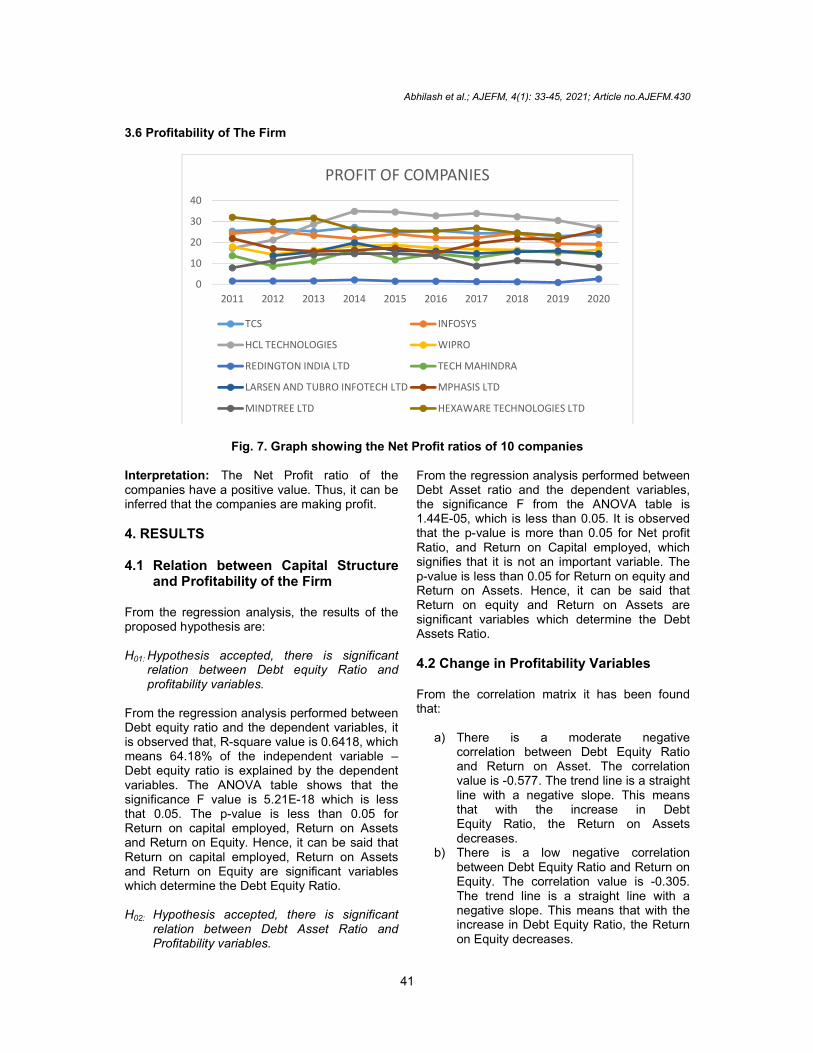
Fig. 7. Graph showing the Net Profit ratios of 10 companies Interpretation: The Net Profit ratio of the companies have a positive value. Thus, it can be inferred that the companies are making profit.
4. RESULTS 4.1 Relation between Capital Structure
and Profitability of the Firm From the regression analysis, the results of the proposed hypothesis are: H01: Hypothesis accepted, there is significant
relation between Debt equity Ratio and profitability variables.
From the regression analysis performed between Debt equity ratio and the dependent variables, it is observed that, R-square value is 0.6418, which means 64.18% of the independent variable – Debt equity ratio is explained by the dependent variables. The ANOVA table shows that the significance F value is 5.21E-18 which is less that 0.05. The p-value is less than 0.05 for Return on capital employed, Return on Assets and Return on Equity. Hence, it can be said that Return on capital employed, Return on Assets and Return on Equity are significant variables which determine the Debt Equity Ratio. H02: Hypothesis accepted, there is significant
relation between Debt Asset Ratio and Profitability variables.
From the regression analysis performed between Debt Asset ratio and the dependent variables, the significance F from the ANOVA table is 1.44E-05, which is less than 0.05. It is observed that the p-value is more than 0.05 for Net profit Ratio, and Return on Capital employed, which signifies that it is not an important variable. The p-value is less than 0.05 for Return on equity and Return on Assets. Hence, it can be said that Return on equity and Return on Assets are significant variables which determine the Debt Assets Ratio.
4.2 Change in Profitability Variables From the correlation matrix it has been found that:
a) There is a moderate negative correlation between Debt Equity Ratio and Return on Asset. The correlation value is -0.577. The trend line is a straight line with a negative slope. This means that with the increase in Debt Equity Ratio, the Return on Assets decreases.
b) There is a low negative correlation between Debt Equity Ratio and Return on Equity. The correlation value is -0.305. The trend line is a straight line with a negative slope. This means that with the increase in Debt Equity Ratio, the Return on Equity decreases.
0
10
20
30
40
2011 2012 2013 2014 2015 2016 2017 2018 2019 2020
PROFIT OF COMPANIES
TCS INFOSYS
HCL TECHNOLOGIES WIPRO
REDINGTON INDIA LTD TECH MAHINDRA
LARSEN AND TUBRO INFOTECH LTD MPHASIS LTD
MINDTREE LTD HEXAWARE TECHNOLOGIES LTD
Abhilash et al.; AJEFM, 4(1): 33-45, 2021; Article no.AJEFM.430
42
c) There is a low negative correlation between Debt Equity Ratio and Return on Capital Employed. The correlation value is -0.233. The trend line is a straight line with a negative slope. This means that with the increase in Debt Equity Ratio, the Return on Capital Employed decreases.
d) There is a moderate negative correlation between Equity Asset Ratio and Net Profit ratio. The correlation value is -0.659. The trend line is a straight line with a negative slope. This means that with the increase in Debt Equity Ratio, the Net Profit Ratio decreases.
e) There is a low negative correlation between Debt Asset Ratio and Return on Assets. The correlation value is -0.28. The trend line is a straight line with a negative slope. This means that with the increase in Debt Asset Ratio, the Return on Assets decreases.
f) There is a moderate negative correlation between Debt Asset Ratio and Net Profit Ratio. The correlation value is -0.434. The trend line is a straight line with a negative slope. This means that with the increase in Debt Asset Ratio, the Net Profit Ratio decreases.
4.3 Profitability of the Firm For all the chosen companies, the net profit ratio has a positive value, it is understood that the selected IT companies are making profit in the last decade. Companies with more Debt capital are having lower Net profit ratio as compared to companies having Equity capital. This is also understood from the correlation matrix as there is a negative correlation between Net profit ratio and Debt-Equity Ratio. Hence, the type of capital structure has an effect on the profitability of the firm.
5. DISCUSSION AND CONCLUSION For an industry,
a) The optimal capital structure of a firm is the best mix of debt and equity financing that maximizes a company’s market value while minimizing its cost of capital. In theory, debt financing offers the lowest cost of capital due to its tax deductibility.
b) Too much debt increases the financial risk to shareholders and the return on
equity that they require. So, company should raise less capital through debt.
c) There is no upper limit to both Debt Asset and Debt Equity Ratios, however, if the ratio is more than 2, the company is said to be in high financial risk.
d) Its better if the Capital structure ratio is less than 1. This means that company raises more capital through equity and assets as compared to debt.
e) Minimizing the weighted average cost of capital (WACC) is one way to optimize for the lowest cost mix of financing.
f) Excessive debt increases the interest payments, the volatility of earnings, and the risk of bankruptcy, so reducing the debt reduces the risk to shareholders.
g) The debt equity ratio and debt asset ratio does not have a fixed value, it depends on firms forecasted revenue, external factors like government policies, recession, etc.
The capital structure is the particular combination of debt and equity which is used by the company to raise funds. Debt financing means the company raises the capital through loans or credit. Debt financing enables more rapid growth of the firm and also, payments in debt are tax deductible. Equity financing means the fund is raised by the sale of stock. The benefit of equity financing over debt financing is that the amount need not be repaid. The capital structure plays an important role in determining the profitability of the company. From the regression analysis of Debt Equity ratio, we find that the p-value is less than 0.05. So, it can be concluded that the Debt Equity Ratio has an impact on the profitability variables; i.e., Return on Assets, Return on Capital Employed, Return on Equity and Net Profit Ratio. Similarly, the p-value obtained between the regression on Debt Asset ratio and Profitability variables is also less than 0.05. Hence, the Debt Asset Ratio has an influence on the profitability variables. The correlation matrix showed that the capital structure variables (Debt Asset ratio and Debt Equity ratio) has a negative correlation with Profitability Variables (Return on Assets, return on capital employed, Return on Equity and Net Profit Ratio). It can be inferred that with the increase in Debt Asset Ratio and Debt Equity
Abhilash et al.; AJEFM, 4(1): 33-45, 2021; Article no.AJEFM.430
43
ratio, causes a decrease in profitability of the company. The profitability of the company is understood from the Net profit Ratio. The net profit ratio has a positive value throughout in the last 10 years for the selected companies. So, the companies are making profit.
COMPETING INTERESTS Authors have declared that no competing interests exist.
REFERENCES 1. Modigliani F, Miller MH. The cost of capital,
corporate finance and the theory of investment, American Economic Review. 1958;48:261-97.
2. Titman S, Wessels R. The determinants of capital structure choice. Journal of Finance. 1988;43(1):1-19.
3. Brander JA, Lewis TR. Oligopoly and financial structure: The limited liability effect. American Economic Review. 1986;76(5):956-970.
4. Kester WC. Capital and ownership structure: A comparison of United States and Japanese Manufacturing Corporations. Financial Management. 1986;15(1):5-15.
5. Rajan RG, Zingalas L. What do we know about capital structure? Some evidence from International Data. Journal of Finance. 1995;50(5):1421-1460.
6. Taub AJ. Determinants of the firm’s capital structure. Revie of Economics and Statistics. 1975;57:410-416.
7. Margaritis D, Psillaki M. Capital structure, equity ownership and firm performance. Journal of Banking & Finance. 2010;34(3): 621-632.
8. Hijazi. Determinants of capital structure: A case for pakistani automobile industry. Lahore Journal of Economics; 2006.
9. Abor J. The effect of capital structure on profitability: An empirical analysis of listed firms in Ghana”, The Journal of Risk Finance. 2005;6(5).
10. Kraus A, Litzebnerger R. A State-preference model of optimal financial leverage. Journal of finance. 1973;28(4): 911-922.
11. Sheel A. Determinants of capital structure choice and empirics on leverage behaviour: A comparative analysis of Hotel
and manufacturing firms. Journal of Hospitality and Tourism Research. 1994; 1-16.
12. Roshan B. Capital structure and ownership structure: A review of literature. The Journal of Online Education. 2009; 1-8.
13. Brendea G. Capital structure theories: A critical approach. Studia Universitatis Babes-Bolyai. 2011;56(2):29.
14. Nirajini A, Priya KB. Impact of capital structure on financial performance of the listed trading companies in Sri Lanka. International Journal of Scientific and Research Publications. 2013;3(5):1-9.
15. Fama, French. (June). financeprofessor.com. [Internet]; 1998 Available:http://www.financeprofessor.coml[Accessed November 7, 2011]
16. Onaolapo AA, Kajola SO. Capital structure and firm performance: Evidence from Nigeria. European Journal of Economics, Finance and Administrative Sciences, 2010;25(1):70-82.
17. Peterson MA, Rajan RG. The benefits of lending relationship: Evidence from small business data. Journal of Finance. 1994; 49(1):3-37.
18. Moncef Guizani, Ahdi Noomen Ajmi. “The capital structure decision of Islamic and conventional banks: empirical evidence from Malaysia. Asia-Pacific Journal of Business Administration; 2021. ISSN: 1757-4323
19. April Bhattacharjee, Mihir Dash. Determinants of capital structure in the Indian Cement Sector. Asian Journal of Economics, Finance and Management 2021;4(1):1-8. Article no.AJEFM.414
20. Booth L, Aivazian V, Demirguc-Kunt A, Maksimovic V. Capital structures in developing countries. The Journal of Finance. 2001;56(2):87-130.
21. Njideka Maryclara Aguome, Oluchi Adeline Diala, Chicheta Francis Nissi. Capital structure and financial returns: Longitudinal panel evidence from NReits. Journal of Economics, Finance and Management Studies ISSN(print): 2644-0490, ISSN(online): 2644-0504. 2021;4(01). January 2021
22. Strebulaev, Ilya A, Baozhong Yang. The mystery of zero-leverage firms. Journal of Financial Economics. 2013;109:1–23.
23. Jaisinghani D, Kanjilal K. Non-linear dynamics of size, capital structure and profitability: empirical evidence from Indian

Abhilash et al.; AJEFM, 4(1): 33-45, 2021; Article no.AJEFM.430
44
manufacturing sector. Asia Pacific Management Review. 2017;22(3):159- 165.
24. Chauhan GS. Corporate financing and deleveraging of firms in India. IIMB
Management Review. 2017;29(3):170- 187.
25. Orcid Axel Giovanni, Devi Wahyu Utami, Eka Widiyaningrum. Size, Growth, Profitability and Capital Structure; 2021.
Abhilash et al.; AJEFM, 4(1): 33-45, 2021; Article no.AJEFM.430
45
ANNEXURE The companies selected for analysis are:
1. Tata Consultancy Services 2. Infosys 3. HCL Technologies 4. Wipro 5. Readington India Ltd 6. Tech Mahindra 7. Larsen and Tubro Infotech Ltd 8. Mphasis Ltd 9. Mindtree Ltd 10. Hexaware Technologies Ltd
_____________________________________________________________________________________________________ © Copyright Global Press Hub. All rights reserved.