Embed Size (px)
Citation preview
Economic versus Regulatory Capital for Financial
Conglomerates
J.A. Bikker and I.P.P. van Lelyveld1
April 2002
Abstract
The new Basel Capital Accord will result in more risk sensitive regulatory capital for banks.
Likewise, financial conglomerates’ internal models will become more important in group-wide
supervision. Such models are relatively well developed for market and credit risk but for others,
such as operational risk, many issues remain to be resolved. An even greater challenge is the
development of models that aggregate risks across risk areas and business units, in particular
across bank and insurance activities. Such internal economic capital models should deliver the
total amount of capital needed to cover risks, as perceived by a financial conglomerate. An
important determinant of total risk, and hence capital, are the diversification effect that the
combination of different activities, such as banking and insurance, might offer. Two empirical
analyses investigate cross-sector correlations and diversification effects in order to find the
optimal level of capital for Financial Conglomerates. The results suggest substantial
diversification effects but they may be offset by contagion risk.
Research Series Supervision no. 45
Paper prepared for the conference “Banking Supervision at the Crossroads”
Amsterdam, 24-25 April 2002
1 De Nederlandsche Bank, Directorate Supervision, Section Banking and Supervisory Strategies, PO Box 98, 1000 ABAmsterdam. E-mail addresses: [email protected] and [email protected]. The views expressed in this paper arethose of the authors and not necessarily those of De Nederlandsche Bank. The authors are grateful to R.T.A. de Haas,K.H.W. Knot, G.C.M. Siegelaer, and H.L.T. Wanders for valuable comment, R. Lammers for essential information and D.van den Kommer for excellent research assistance.

Economic versus Regulatory Capital for Financial Conglomerates
J.A. Bikker and I.P.P. van Lelyveld
1 Introduction
In a number of larger financial institutions, firm-wide risk measurement and management currently
experience significant growth. Recent methodological advances in measuring individual risk types, such
as credit and operational risk, and sharply improved techniques for gathering and analysing information,
are making truly firm-wide risk measurement systems feasible. An example of such a system is an
economic capital model used to determine the total amount of capital needed to cover all risks, as
perceived by the institution. However, a number of conceptual and practical difficulties still need to be
resolved. This is especially the case where models seek to aggregate risks across risk areas, business
units or even sectors, or alternatively across risk drivers.
Simultaneously to these developments in the financial industry, banking regulators are framing a new
set of supervisory rules, especially with respect to minimum required capital. The most recent
formulation of these rules by the Basel Committee, the Second Consultative Package BCBS (2001), is
currently under revision and will soon be tested in a third Quantitative Impact Study. In the near future,
banks will be allowed to base their required capital in risk areas such as credit and operational risk on
internal approaches and models, as currently is the case for market risk. The new rules will result in
more risk sensitive regulatory capital. Insurance supervisors in a number of countries consider
developing similar market-conforming and risk-sensitive capital requirements.2 This advance of internal
approaches and models contributes to the further development and application of economic capital
models.
In addition to the minimum regulatory capital charges (referred to as Pillar I), the new Basel accord
discerns two further pillars, namely supervisory review and disclosure. Under the supervisory review
Pillar, banks are required to assess their economic capital and to have a strategic view on capital
management. Supervisors would only assess the process and result of the banks own evaluation in
second instance. The question arises whether and, if so, how economic capital models may be
employed in the supervisory review processes. Therefore, supervisors need a good understanding of
the current and future state of economic capital models, not only with regard to their strengths and
weaknesses in general, but especially with respect to the applicability in regulatory practice.
2 The International Accounting Standards Board (IASB) is developing an international standard for accounting. See IAA(2002) for comments.
Since the early nineties, banks and insurance companies in the Netherlands have been allowed to
merge, which has resulted in a few large financial conglomerates. Similar large financial groups have
also emerged in other countries, albeit in more limited numbers. Owing to their size, the larger
institutions are of major importance for financial stability, prompting question of whether or not these
conglomerates are more stable than their constituent parts. This could be the case when typical bank
and insurance shocks are for the greater part uncorrelated or - even better - negatively correlated. If,
on the other hand, contagion risk plays a major role, e.g. if both components are threatened with loss of
reputation should problems arise in one of the constituent parts, financial stability would suffer from
these cross-sector mergers. Closely related to this is the too-big-to-fail issue: is the moral hazard risk
larger for large financial groups? Of course, these issues are tied in with the question of whether the
simple sum of separate minimum capital requirements for banks and insurance firms is still adequate
for a financial conglomerate.
The present paper investigates the usefulness of economic capital models for the assessment of
adequate capital requirements and the supervisory review process. First the rationale of supervision will
be discussed: what makes banks and insurers so special that exceptional treatment is justified and are
there differences in this respect between the two sectors? The current regulation for the components
of the financial groups is analysed and we examine whether additional rules or different capital
requirements for financial conglomerates are called for. The next section presents a theoretical basis
for economic capital models and discusses the current state-of-the-art regarding these models in
practice. Where in any case the aggregation of risk is one of the greater issues in economic capital
models, the aggregation of risk across sectors is a major problem. How are the various risk types
correlated with each other and what diversification effects result? Section 4 deals with these issues and
provides empirical evidence from different angles. The first analysis investigates the sensitivity of bank
and insurance balance sheets for stochastic shocks and assesses how the shock effects are correlated.
The second analysis uses an option-pricing model to estimate the relative riskiness of banks, insurance
companies and their (fictitious) combinations. The fifth section contemplates the differences between
economic and regulatory capital and the potential possibilities and shortcomings of economic capital
models for supervisory purposes. The last section rounds off with a summary and conclusions.

2 Motivation for capital regulation of financial institutions
Society wishes to regulate and supervise financial institutions for a number of reasons: (1) protecting
consumers, (2) promoting systemic stability, and (3) maintaining the financial soundness of individual
institutions.3 This paper focuses on capital as a means to promote these objectives, particularly (2) and
(3), and hence concentrates on prudential regulation only, thereby ignoring conduct of business
regulation.
We will consider the need for regulatory capital for banks, insurance firms and financial conglomerates
(FCs), respectively.4 In addition, we seek to establish whether the ‘silo’ approach or the ‘integrated’
approach is more appropriate for financial conglomerates. In the silo approach total capital is a simple
sum of sectoral capital requirements, whereas in the ‘integrated’ approach capital reduction for
diversification effects or a capital add-on for contagion risk is incorporated.
Different from other firms, banks may use deposits for their funding needs. Unlike other types of debt,
a substantial part of these deposits may be retrieved on sight. The first come-first served (FCFS)
constraint, applicable for demand depositors, means that there is a strong incentive for depositors to be
in the front of the queue, generating the possibility of a bank run on an individual bank, suspected to be
insolvent (Chen (1999)). In regular near-bankruptcies it is more difficult to jump the queue and thus
evade costs.
Another typical characteristic of banks (and other financial firms) is their opacity: it is hard to assess
the total risk a bank is running. In particular, the value of longer-term investments which are not
publicly traded is difficult to establish, especially for relative outsiders such as depositors.5 As the
banking operations of different banks are fairly similar, financial stress in one bank may indicate similar
difficulties in others. Therefore, a run on one bank may generate bank runs on other banks, causing
serious financial instability.6 Contagion may also be reinforced because banks are interwoven through
heavy interbank lending and cross participations. If bank runs are not triggered by true insolvency, they
are detrimental to social welfare, because in a bankruptcy contracts will have to be renegotiated or
3 Llewellyn (1999). See Allen and Herring (2001), Table I, for a discussion of additional motives, including measuresemployed.
4 Reflecting continental European practice, we consider FCs which combine universal banking and insurance activities andnot FCs which combine banking and security activities, as is more common in Anglo-Saxon countries. Note that pensionfunds are not yet subsidiaries of FCs, although that may change in the future. Their position with respect to supervisionis similar to that of insurers.
5 For that reason, the new Basel capital accord introduces a set of disclosure requirements to foster greater transparencyand reduce uncertainty.
6 Seminal contributions in this area are Bryant (1980) and Diamond and Dybvig (1983).
traded at a discount. Hence, special measures are required to reduce these welfare impairing bank runs
and their threat of financial instability.
Banks also differ from other lines of business in that the contracts on both sides of the balance sheet
have different maturities: funding is of a short-term nature, whereas lending is generally long-term. This
creates both liquidity risk, which is often the immediate cause of a bank run, and interest rate risk ,
possibly damaging solvency. Finally, banks have a pivotal role in the financial system in the clearing and
settlement of transactions and - above all - providing finance, in particular to small and medium-sized
enterprises.
Two solutions for bank-run problems have been proposed and adopted. First, a deposit insurance
scheme for the deposits of households.7 An additional motivation for deposit insurance is consumer
protection.8 Second, the central bank may, as the lender of last resort, provide funds to illiquid but
solvent banks. The support can also go further, as the central bank or the supervisor may carry out a
complete rescue operation. Deposit insurance, however, causes risk shifting from the bank’s deposit
holders to all other banks or the taxpayer and these moral hazard problems brought about by
instruments to reduce the fragility of banks imply a need to further refine banking regulation in order to
prevent banks from overly risky behaviour at the expense of others.9
To safeguard the financial soundness of banks and, more generally, achieve financial stability, minimum
capital requirements are seen as the most effective tools of banking supervision, as they guarantee that
banks possess buffers to absorb unexpected losses. Ideally, the level of these requirements is linked to
the probability of default on the part of the bank and reflects the degree of confidence society demands
with respect to financial stability and the financial soundness of individual banks.10
The main argument for bank supervision is banks’ funding by deposit holders, with their special FCFS
status, in combination with their long-term assets. Insurance firms, however, are not funded by deposit
holders but by policyholders, with long-running contracts. They do not have the FCFS rights of deposit
7 For an overview, see Garcia (2000). Deposits held by households in the Netherlands amount to € 190 billion, i.e. 54% ofall deposits held by the private and government sector. Note that this insurance scheme only covers deposits held bybank offices in the Netherlands.
8 For instance, in the Netherlands, all deposits are covered, not only the deposits which are directly demandable and hencecontribute to the bank-run risk, but also non-demandable liabilities such as fixed long-term time deposits. Moreover,securities in trust are also covered to some extent.
9 Unless the deposit insurance is based on risk sensitive premiums, as is the objective in a growing number of countries(Garcia (2000)).
10 Many banks choose a capital level that is substantially higher than the regulatory minimum for purely commercialreasons, e.g. in order to obtain a higher rating, as this makes capital market funding cheaper, or to avoid downgrading forreputational reasons. Some argue that financial firms do not directly target a certain probability of default (PD) level but
holders. They do have the right to surrender a policy, but refunding takes time, which allows the
insurance firm to liquidate investments under more favourable, normal conditions. In the Netherlands,
refunding generally takes place under a discount, covering at least administration and liquidation costs.
Often tax treatment is less favourable if the policy is surrendered before legal minimum terms are met.
The situation might however be different in other countries, where other legal conditions prevail for
surrendering.
In some respect, policyholders have a position similar to that of deposit holders: banks and life
insurance firms are both opaque institutions, with a degree of riskiness which is hard to assess for the
lay person. Firms might attempt to gain market share with cheap policies against actuarially insufficient
premiums and then proceed to gamble with the received monies. Hence, consumer protection is a
strong argument for supervision, similarly to deposit insurance. For life-insurance firms it may even be
the sole argument for regulation, gaining in weight because contracts last very long.
Where banks and insurance firms share their opacity and the ensuing need for consumer protection,
they differ with respect to the other arguments for supervision. Insurance firms do not constitute a
major threat to financial stability, due to “bank-runs”, as surrendering of policies takes time and involves
costs for the policyholders. However, as these institutions are heavily involved in credit derivatives,
some fall-out might occur. The possible negative effects on financial stability caused by the
interwovenness of insurers and banks will be discussed in the next section. Liquidity risk is not a major
problem for insurance firms as their balance sheets generally have a reversed duration structure, with
long-term liabilities and short-term assets. Finally, insurance firms do not play a pivotal role in the
financial system by lending and by maintaining the payment system, as banks do. Hence, the list of
arguments for supervision of insurance firms is short: only consumer protection remains. It should be
noted that this does not imply that capital requirements for insurers are lower than they are for banks.
The question arises whether the reasons for regulating financial conglomerates differ from the ones
discussed so far. The current regulatory regime for an FC is a silo approach, explained above.11 Bank
and insurance firms within an FC are required to work in distinct limited liability corporation structures,
separated by a legal firewall. Minimum capital requirements hold for the bank and the insurance firm,
as if they were independent institutions. In determining the optimal level of economic capital, however,
want to avoid a downgrade during a severe downturn. Hence, one can not draw the conclusion that an AA rating reflectsthe management’s target of at the worst only one default in thousand years.
11 Supervision of FCs is based on the so-called ‘silo plus’ approach, as additional rules - not directly regarding capitalrequirements - apply for FCs.
FCs themselves will be inclined to consider the total risk of the FC, including diversification effects,
rather than the simple sum of bank and insurance requirements.
When their legal firewalls crack, or are ignored by the public, FCs may find themselves in a difficult
position. This can be the case when financial difficulties in one of the subsidiaries in one sector have
contagion or reputation effects on another subsidiary in a different sector, especially when they use the
same brand name. In that case, the FC may be more vulnerable than its constituting subsidiaries.
Similar contagion problems may also arise with non-regulated entities in an FC. These possible
contagion and moral hazard risks form an argument for minimum required capital of an FC that is
higher than the simple sum of its financial components and that also includes capital requirements for
non-regulated entities.12
Related to this contagion problem is the too-big-to-fail (TBTF) issue, yet another moral hazard problem:
big financial institutions with a large impact on financial stability may expect a rescue operation to be
undertaken by the lender of last resort. Similar to the contagion argument, this TBTF-problem is
another argument for additional capital requirements for FCs, as FCs tend to be large.
It might be rational for a bank to support an insurance firm of the same FC financially, or vice versa, in
spite of the legal firewalls, in order to reduce contagion risk and to preserve shareholders’ interests.13
A certain degree of cross-sector support could also exist within the current limits of legal firewalls, in
cases where capital in excess of minimum requirements for each of the two sectors is held at the
holding level and is used to cover losses where necessary.14 The possibility of cross-sector support
raises the question central to economic capital models (ECMs), as to what diversification effect will
occur for the FC as a whole. In the case of contrary (i.e. compensating) shocks, cross-section support
would be more acceptable from a supervisor’s point of view, because the financial soundness of the
FC is not at stake. Alternatively, when shocks tend to have similar effect on the various subsidiaries,
the contagion risk argument for additional minimum capital gains weight. A stipulation is that
diversification effects should remain robust under stress where - contrary to normal conditions -
correlation coefficients tend to approach one. In Section 4, this issue of diversification or correlation of
risk across sectors is investigated further.
12 An integrated capital requirement regime for FCs would also raise practical problems, as supervision of insurance firms isbased on host country control, whereas supervision of banks is based on home country control. As capital requirementsof insurance firms are not based on an international agreement (such as the Basel Accord for banks), domestic and foreigninsurance divisions face different regulatory treatment.
13 See Rule (2001) for a description of the various channels that are employed.14 Note that there are limits to shifting of surplus capital. For instance, a bank in the Netherlands needs a vvgb (declaration
of no objection) by the supervisor to distribute supernormal dividend to the holding company.
In determining economic capital of an FC, the diversification effect is an argument for holding less
capital than would be required under the simple-sum rule of economic capital for subdivisions.
However, from a regulatory point of view, the additional contagion risk, the increased TBTF-problem
and other moral hazard issues constitute arguments for additional minimum capital requirements, if
these partly or fully outweigh the diversification benefits. In extreme cases, the risk of an FC could
even outstrip the simple sum of its components.
3 Economic capital in theory and practice
Economic capital is the amount of capital a financial firm itself deems necessary to operate normally,
given its risk profile and its state of controls. This concept is not new but recent innovations in
information technology and risk management have made it possible to measure economic capital in a
firm-wide, comprehensive and model-based fashion. Institutions themselves increasingly feel the need
for ECMs to allocate the scarce capital in order to maximise the risk-adjusted return on capital
(RAROC) across different business lines. Measurement of firm-wide, interdependent risk on the
various types of activities is a particular challenge for financial conglomerates, which include both
banking and insurance activities. The RAROC approach allows management to make better-informed
strategic decisions and to recognise ‘natural hedges’, which are important in connection with possible
new activities and in the event of a potential merger. Besides, this approach is also important for
managerial compensation and pricing. Regulators might find the ECM a useful tool in the Basel II
“supervisory review” process. Published results might give shareholders a better feel for the riskiness
of a firm.
Notwithstanding the needs felt in the financial industry, theoretical underpinnings for the formulation of
firm-wide ECMs are rare. To quote Leland (1998): “The theory addressing capital structure remains
distressingly imprecise”. A relatively simple model has been developed by Froot and Stein (1998).
Essential ingredients in their model are the understanding that external finance is costly and that at least
a part of the risk taken by an institution is non-tradable and thus cannot be hedged. Given that there is
some cost involved in holding capital, the issues of risk management, capital budgeting and capital
structure policy become linked. Given the space constraint in this abridged version of our paper we will
not discuss the model but present the general conclusions. Contrary to the Modigliani-Miller theorem,
there is a reason for managing the riskiness of an institution. An essential point in the Froot and Stein
story is that each investment decision will affect the (optimal) capital structure, which in turn influences
the hurdle rate the particular investment has to pass. This point gains in importance for FCs because
their risk types are more diverse and their total risk is thus more unpredictable. Although it is
impracticable to determine the impact of each individual investment on the hurdle rate, such feedback

effects should be incorporated in sizeable investments decisions, particularly if covariance with the
existing portfolio is large.
Given the Froot and Stein model, three weak spots can be identified. First, RAROC can only deliver
value maximisation if it is applied on a post-hedged basis (i.e. does not contain any tradable risk) which
might be difficult to implement in practice. Secondly, the equation should include not only an asset or
activity’s variance but also its covariance with the existing portfolio. Finally, calculating the correct cost
of capital or relevant beta is not easy (see also Chatterjee, et al. (1999)). A more practical criticism is
voiced by Robinson (2001): decisions based on this framework may be arbitrary because the
VaR(a %)-amount is highly sensitive to the choice of a in combination with the actual loss-distribution.
The shape of the tail of the distribution differs significantly between different kind of returns and raising
a will thus have significant effects on the relative expected returns. This in turn might change
depending on which projects eventually pass the hurdle rate.
In recent years a number of large financial institutions have shown an increasing interest in ECMs.
RAROC-type applications aiming at optimising allocation of economic capital in order to improve
returns constitute the main motive for developing these models. The need for a common measurement
of returns increases with the diversity and complexity of financial organisations. In the Netherlands two
financial conglomerates, viz. ING and Fortis, have developed such models, use them and even publish
results in their annual reports. Other financial conglomerates which are known for developing such
models are Citigroup-Travellers, Credit Suisse and Dresdner Allianz. These large conglomerates have
stronger incentives to develop and use such models as their activities are diverse and dispersed.
Incidentally, the models mentioned above generally do not yet cover insurance activities.
There are various classifications of risk types applicable to an FC.15 Market or ALM, credit,
operational and business risk occur in both banks and insurance firms, but the focus may differ (see
Cumming and Hirtle (2001)). For instance, banks consider the risk of price changes regarding their
trading activities based on a time horizon of 1 to 10 days. In addition, they examine the interest rate risk
of their (long-term) assets and liabilities. Life-insurance firms look at the risk of price changes of their
assets and liabilities on a time horizon of many years or even decades, as their liabilities have extremely
long maturities. This touches upon one of the fundamental problems in building ECMs, which the choice
of a common time horizon in order to assess risk integrated across business lines and sectors.16 Credit
risk is the major source of risk for universal banks. Much more than typical insurance risk categories
15 An overview of the FC’s risk types, including their definitions, measurement approaches and underlying risk drivers, isavailable from the authors upon request.
16 The time horizon is the period which is chosen to investigate the potential unexpected loss of a portfolio.
such as mortality and (non-catastrophe) property & casualty (P&C) risk, the so-called broad ALM risk
(including market risk and embedded insurance options) is the dominant source of uncertainty for
insurers, due to their long-lasting liabilities. The typical measurement approaches vary tremendously
across the risk types. This indicates a second problem in building ECMs, namely the choice of a
common unit of risk.
The level of sophistication of models for the various risk types varies significantly and is mainly
determined by the availability of relevant data. In general, models for market risk are well developed.
Data is available on a daily basis allowing back testing. The 1996 Amendment to the Basel capital
accord allows banks to calculate their minimum capital requirement for trading risk activities according
to these models. Since then, these models have been developed and applied on a large scale. Insurance
models for life and non-catastrophe P&C risk profit from a similar kind of data abundance. Credit risk
models have come into vogue more recently. As the availability of default data is limited, these models
are based on many assumptions, constraining their usefulness. The new Basel capital accord allows the
internal rating-based (IRB) approach for credit risk and models for operational risk for calculating
minimum capital requirements, which is currently stimulating the development of these models and data
collection efforts world-wide.
The various models or measurement approaches for the distinguished risk types constitute the building
blocks of ECMs. Many problems regarding the unit of measurement, time horizon and aggregation -
each of them both across types of risks and across types of business units or sectors - need to be
solved. The difficulties in the search for a ‘common currency’ for risk seem to be reduced because a
common focus emerges on the potential for unexpected losses, either in earnings or economic value.17
Practitioners have generally chosen a holding period of one year, because this best fits the control cycle
(i.e. budgets) and the time needed to raise new capital. One year is also an average value across the
various measurement approaches, a mid point between the short trading risk horizons and the long
insurance risk horizons. Of course, such a standard period is unlikely to fit all activities perfectly.
The Froot and Stein model underlines that interaction between risks is of crucial importance. However,
in most, if not all, financial institutions, risk measurement and management started as a bottom-up
approach, resulting in a patchwork of differing approaches which makes aggregation across risk types
and sectors rather complicated. In theory, all risks are interrelated, but in practice the correlation
structure needs to be simplified. OWC (2001) observes that the coherence in the portfolio is often
17 As noted by Cumming and Hirtle (2001), p 11, who also note that "other potential definitions of risk could involve purevolatility measures, such as standard deviations of earnings or economic value, or sensitivity measures that capture thedeviations of earnings or economic value with respect to particular risk factors, such as the ‘value of a basis point’".
modelled on three levels: the portfolio, the business unit, and the holding level, termed level I, II, III,
respectively. An alternative for levels II and III would be aggregation of, first, the risk for each risk
type across the whole conglomerate and, second, across risk types. For most of the higher level
correlations, financial institutions do not have the data required to obtain meaningful estimates. They
rely on ‘human judgement’ or the consultant’s perception of ‘industry practice’. Some institutions set
correlation values at rather conservative levels, whereas others use rough approximations such as
correlations between – baskets of – appropriate shares. As correlations determine the diversification
effects, they are crucially important for determining the ultimate level of economic capital. An issue is
whether correlations should reflect normal conditions like those reflected in the building blocks of the
ECM, or stress conditions under which capital is really needed to absorb losses. In practice, large
diversification effects are found at the portfolio level (80% to 90%), smaller ones a the business line
level (40%), whereas minor effects (5% to 10%) are assumed at the cross-sector level (OWC (2001)).
In the next section we proceed to investigate correlations and diversification effects on the holding level
by providing various empirical estimates.
4 Correlations, aggregation and diversification
In the theoretical model developed by Froot and Stein (1998), we need to establish the degree of
correlations between all individual investments are needed. As mentioned above, the more pragmatic
approach of OWC (2001) distinguishes three levels of diversification: the portfolio, the business unit,
and the holding level. The question we would like to answer is: what are sensible and reasonable
empirical values to be used in the economic capital models? In particular we will focus on the holding
level. The literature in this area is understandably very scarce. On the one hand the consulting firms
that implement economic capital have no incentive to publish and jeopardise their livelihood, whereas on
the other hand the institutions treat their data as confidential.
Data for the OWC level I or within portfolio correlations is plentiful. For the higher levels one may
think of a number of different sources. Conversely, finding an adequate source for correlation on the
business unit level (level II) is difficult. One possibility is to analyse how the Dow Jones index, as an
indicator of market risk, is related to credit spreads on corporate bonds, as an indicator for credit risk18
Correlations between insurers and banks on the holding level (level III) could, among other things, be
18 OWC finds, after an analysis of “normal times” that the correlation between market and credit risk is 0.8. For moregeneral studies of non-crisis cross-asset interdependency, see e.g. Longin and Solnik (1995), Fleming, et al. (1998), andBodart and Reding (1999).
based on the returns on equity or bonds.19 More specifically, one may ask to what degree the results
from pure banking- and insurance-firms are correlated? In this vein the American Bank Holding
Companies have been examined using various methods (see Section 4.2).
In addition to values for “normal times” we are also interested in the behaviour of parameters during
recessions or crisis periods. There is an extensive literature studying the linkage between various
markets in various countries.20 Generally these studies focus on how turmoil in one market “spills over”
to other markets during crisis periods. Recent studies investigate whether the correlation, often derived
from ARCH type models, becomes stronger during a crisis.21 Although this issue does merit attention,
we will abstract from it in the light of the scarcity of consensus about reasonable values for empirical
parameters and investigate two different approaches. The first, presented in the next section,
investigates the sensitivity of banks and insurance balance sheets for stochastic shocks and assesses
how the effects of these shocks are correlated. The second analysis uses an option-pricing model to
estimate the relative riskiness of banks, insurance companies and their (fictitious) combinations.
4.1 A simple ALM model to simulate diversification between banks and life insurers
The balance sheets of banks and life insurers are each others counterparts in the sense that bank
assets have a longer maturity than bank liabilities, whereas for insurers it is the other way around. This
creates asymmetry in the sensitivity to interest rate shocks of these institutions, in particular for
changes in the slope of the yield curve. This asymmetry is often mentioned as an argument for the
existence of negative correlation between interest rate risk of banks and insurance firms, or in terms of
OWC (2001), of diversification on level III. On the other hand, both sectors invest in shares,
participations and subsidiaries, which contributes to a positive correlation. This section develops a
strongly stylised Asset-Liability Model (ALM) for banks’ and insurance firms’ balance sheets. In this
model, we consider life insurers only, as P&C insurers have only limited balance sheet sizes, so that
interest rate and asset price risk only play a minor role.22 Moreover, the main risk types P&C insurers
run are P&C risk, operational and business risk, which are assumed to be uncorrelated to the risk run
19 Using market rates does not guarantee a clear answer because of for instance the distortions caused by tax-incentives.Moreover, does the market perceive that a conglomerate can cash in on the (risk)benefits of conglomeration? If risk is notcentrally managed, there are still benefits from scope and scale but not a reduction in risk. An alternative source ofinformation, not pursued here, could be to use accounting data and for instance measure to what degree the results of thebanking and insurance part in a financial conglomerate are related.
20 See De Bandt and Hartmann (2001) for an excellent survey of the financial market crises and contagion literature.21 A related literature examines whether currency crises are contagious as in for instance Eichengreen, et al. (1996). Finally,
Borio and McCauly (1996) study bond market spill-overs in volatile periods.22 In the Netherlands, the aggregated balance sheet total of P&C insurers in 2000 is only 80 billion guilders against 541
billion guilders for life insurers, where net premium income has a similar size (36.5 versus 52.5 billion guilders) (PVK(2001a) and PVK (2001b)).
by banks and life insurers.23 For the same reason, we ignore non-regulated entities. Note that these
activities with uncorrelated risk would contribute to further diversification at the holding level.
Our model simulates the balance sheet values in a stochastic environment, where values of interest
rates and asset prices are subject to shocks. Economic capital models (ECMs) or the ALMs of
individual banks, insurance firms and FCs are able to provide a much more detailed description of the
dependence of the balance sheet items on such external shocks, as they have more information
available. However, only a few FCs are able to model interest rate and asset prices shocks for both
their banks and insurance firms simultaneously. In particular, we do not have sufficient data on off-
balance sheet positions of banks. However, our simple stylised model can provide a general picture of
the diversification effects with respect to shocks in interest rates and asset prices.
Our model exercises are based on the aggregated balance sheets of domestic bank activities of the five
largest commercial bank conglomerates in the Netherlands (covering 79% of all Dutch domestic
banking activities) and of domestic insurance activities of Dutch insurance firms.24 To illustrate our
model, Appendix 1 provides stylised versions of the aggregated balance sheets used in the calculations.
As an alternative, the calculations have also been executed with consolidated data of all Dutch banks.
The analyses on an aggregated level provide average effects of interest rate and asset price shocks on
the profit or wealth of banks and insurance firms and their mutual interdependence. Our ALM model
distinguishes a large number of interest rates. A set of interest rate equations, presented in Appendix 1,
link these rates to two core rates: the short-term rate (reflecting monetary policy) and the long-term
rate (reflecting capital market conditions). The value of each balance sheet item is linked to one – or
more – of the interest rates or to an asset price. Where useful and possible, balance sheet items have
been split using internal data. Many of these interest-link equations are based on distributed lags (DLs)
of interest rates, of which the length reflects the maximum maturity of the respective balance sheet
item (see also Appendix 1). These equations take lags in interest payments into account as well. For
banks, the average lag of the DL is set to reflect the average duration found in the interest rate risk
surveys of DNB. Similar information and details on the (distribution of the) remaining length of life
insurance contracts are obtained from insurance firms.
A first complication in incorporating bank and insurers balance sheets into one model, is the difference
in accounting rules. Dutch banks use the Dutch accounting authority’s rules for their annual public
23 That is uncorrelated with interest rate and market price risk, central in these analysis, as well as credit risk, life risk andthe operational and business risk banks and insurers run.
24 Bank supervision is based on home control, whereas insurance supervision is based on host control. Therefore bankspublish consolidated figures, including domestic and foreign activities, whereas (Dutch) insurance firms only publishdomestic figures.
statement and quite similar supervisory rules for their reports to their supervisor. The value of the
trading portfolio - which in Dutch banks is small compared to the banking book portfolio - is recorded at
market prices. Bonds and promissory notes are recorded at their nominal value. In principle, other
financial assets are booked at acquisition values, downwards adjusted if necessary, whereas
participations show up at the lowest of acquisition values and market prices. Subsidiaries are recorded
at net wealth or revenue value, whereas real estate investment is booked at market prices, but after
deduction of depreciations.25 In the near future, the EU will implement a new International Accounting
Standards Board (IASB) accounting regime for banks, which relies more on market values.
Valuation rules in the insurance sector vary from firm to firm. In general, insurers record shares, other
non-fixed income securities and real estate investment at market prices. This also holds for
investments, which is at the risk of policyholders or insured thrift clubs. The valuation of life insurance
liabilities (technical life insurance reserve) is based on a fixed ‘calculation interest rate’ of 3%.
Investment in fixed-income securities stemming from insurance policies, which are sold at a ‘level of
interest rate’ discount (in Dutch: rentestandskorting), are recorded at redemption value.26 For insurance
balance sheets items we use actual values, as far as possible.
For our simulations, we have to bridge the different accounting regimes. For asset price scenarios, we
assume that the shock effects are based on (changes in) market value. This does not reflect current
accounting practice, but is in line with economic theory. For interest rate scenarios, we distinguish two
regimes. First an accrual accounting regime, where the value of the fixed-income securities and the
technical life insurance reserves remain unchanged, so that the shock effects reflect merely changes in
net interest income. Secondly, a fair value type of accounting regime, where all interest rate sensitive
balance sheet items, including saving accounts and technical provisions on life insurance policies are
marked-to-market (as will be explained below). These distinguished regimes reflect two extremes,
which encompass the actual regime.
We checked the model by an ex-post forecasting test. For banks we compared predicted paid and
received interest with actual values. For insurance firms, we forecasted and compared investment
revenues and funding costs to actual outcomes on a balance sheet item basis, because realisations are
known in greater detail for insurers (PVK (2001a), Table 24).
25 Subsidiaries are investments with control, but not necessary full control.26 The discount is based at the difference between the actual interest rate at the moment of the sale and the ‘calculation rate’
3%, which determines the insured nominal amount (endowment insurance or annuity). The alternative would be to use thedifference to guarantee higher revenue.
4.1.1 Interest rate shocks under an accrual accounting regime
In this section we assume an accrual accounting regime, where the only changes are on net interest
income.27 We evaluate the following four interest rate scenarios: (i) a 2 percentage point short-term
interest rate rise where the long-term rate is defined by the model,28 (ii) a 2 percentage point short-term
interest rate rise with a fixed, unchanged long-term rate, (iii) a 2 percentage point long-term interest
rate rise,29 and (iv) a 2 percentage point increase in the yield curve’s slope, caused by a 1 percentage
point increase of the long term rate and a 1 percentage point fall in the short term rate. These shock
sizes are not unrealistic: over the last two decades, the average absolute annual change in the short and
long rates were more than 1 and 0.75%, respectively, and over two year periods 1.75 and 1.25%,
respectively. All shocks are once off events (i.e. not repeated) but permanent, unexpected and
occurring early in the year.
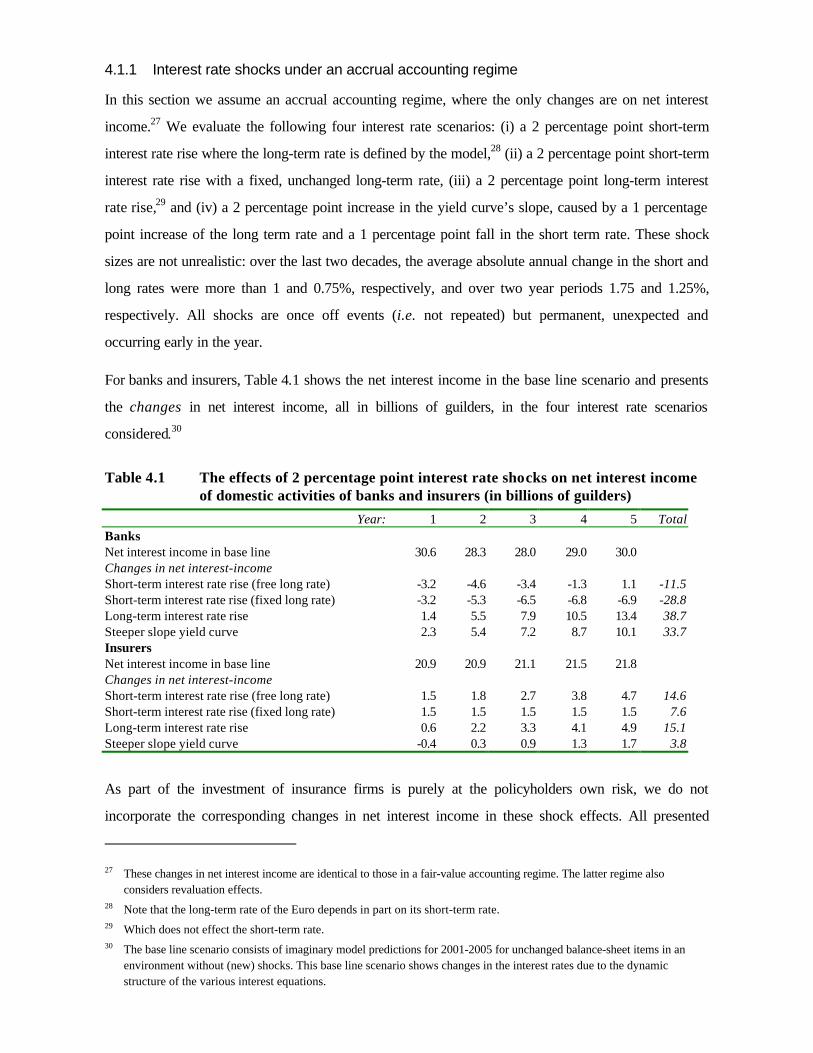
For banks and insurers, Table 4.1 shows the net interest income in the base line scenario and presents
the changes in net interest income, all in billions of guilders, in the four interest rate scenarios
considered.30
Table 4.1 The effects of 2 percentage point interest rate shocks on net interest incomeof domestic activities of banks and insurers (in billions of guilders)
Year: 1 2 3 4 5 TotalBanksNet interest income in base line 30.6 28.3 28.0 29.0 30.0Changes in net interest-incomeShort-term interest rate rise (free long rate) -3.2 -4.6 -3.4 -1.3 1.1 -11.5Short-term interest rate rise (fixed long rate) -3.2 -5.3 -6.5 -6.8 -6.9 -28.8Long-term interest rate rise 1.4 5.5 7.9 10.5 13.4 38.7Steeper slope yield curve 2.3 5.4 7.2 8.7 10.1 33.7InsurersNet interest income in base line 20.9 20.9 21.1 21.5 21.8Changes in net interest-incomeShort-term interest rate rise (free long rate) 1.5 1.8 2.7 3.8 4.7 14.6Short-term interest rate rise (fixed long rate) 1.5 1.5 1.5 1.5 1.5 7.6Long-term interest rate rise 0.6 2.2 3.3 4.1 4.9 15.1Steeper slope yield curve -0.4 0.3 0.9 1.3 1.7 3.8
As part of the investment of insurance firms is purely at the policyholders own risk, we do not
incorporate the corresponding changes in net interest income in these shock effects. All presented
27 These changes in net interest income are identical to those in a fair-value accounting regime. The latter regime alsoconsiders revaluation effects.
28 Note that the long-term rate of the Euro depends in part on its short-term rate.29 Which does not effect the short-term rate.30 The base line scenario consists of imaginary model predictions for 2001-2005 for unchanged balance-sheet items in an
environment without (new) shocks. This base line scenario shows changes in the interest rates due to the dynamicstructure of the various interest equations.
effects assume that the behaviour of banks and their customers remains constant.31 Of course, banks
and customers might react to changed interest rate conditions, in general reducing the shock effects,
but probably only slightly for reasons of continuity and lacking alternatives. Furthermore, it should be
emphasised that our analysis does not include off-balance sheet positions. Hence, our model ignores full
or partial coverage of interest rate mismatches of banks or insurers by, say, interest rate swaps, and
also disregards speculative positions of banks or insurers on future interest rate developments.
In the short run, a 2% rise in the short-term-interest rate would eat into the net interest income of
banks, as funding costs would rise (see first row of Table 4.1). Provided the long-term interest rate
rises too (according to the underlying term-structure relationship), additional received interest revenues
from lending and investment would compensate for the higher funding costs, particularly in the long run.
In a simulation where the long rate would remain unchanged (further flattening the yield curve), the full
funding cost rise shows up (see second row). A rise in the long-term rate has purely favourable
effects, gradually growing over time, as more new loans and investment yields revenues based on the
new interest rate level (see third row). According to our model, the short-term interest rate is not
affected by the long-term rate and so remains unchanged in this scenario.
For insurers, all scenarios with rising interest rates are favourable, as investment dominates funding by
far, in spite of the fact that the higher rates feed through with substantial delays. For banks and
insurers, the effects of a long-term interest rate rise are similar and hence are correlated, whereas for
the short-term interest rate rise, they diverge, indicating negative correlation. In the latter case, a
hypothetical FC would encounter a strong diversification effect. A steeper slope of the yield curve has
favourable interest revenue effects for both types of institutions, increasing over time, although for
banks, the effect is far stronger, owing to the lower short rate.32
Table 4.2 presents the simulation results of Table 4.1 scaled by profit before taxation. The effects in
percentages of profits indicate how sizeable the observed changes in net income are for banks and
insurers, normally hidden from view, as day to day interest rate shock follow an erratic pattern. In
order to obtain further insight into the diversification effects of FCs, the lower part of Table 4.2
calculates the effects of imaginary mergers of (all) banks and insurers, assuming that banks and
insurers within an FC continue to operate independently from each other as before, but pool their
profits on the holding level.33 It is clear from the first four FC rows that the impact of short-term
31 Banks can adjust the allocation of their asset and the composition of their funding, whereas customers can reduce theirlending and hold more or less monies on deposits.
32 The changed slope of the yield curve is approximated: the third shock minus the second one, both divided by two.33 In fact, the aggregated balance sheets of banks and insurers are added together.

shocks on the profit of the FC is far smaller, compared to the profits of their components, reflecting the
negative correlation between banks and insurers (due to different funding behaviour). The long-term
shock effects for the FC are slightly smaller than for their constituent banks, but somewhat greater
than for their insurers. For the yield curve shocks, a similar conclusion may be drawn, be it that the
differences are larger.
The diversification effects can be illustrated best by expressing the changes in profits of FCs as shares
of those of banks (last four rows).34 Changes in profits, however, are lower for FC than for their
constituent banks in all cases, due to the two well-known facets of diversification. On the one hand,
profit shocks are smaller where correlations are negative, as for short rate shocks (the ‘hedging’
effect) and, on the other, profit shocks for FCs tend to be lower, as they are the weighted average of
the two underlying profit shocks (the ‘levelling out’ or ‘spread’ effect of averages).35
Table 4.2 The effects of 2 percentage point interest rate shocks on profits of banks,insurers and (imaginary) financial conglomerates
Year: 1 2 3 4 5Changes in profit(%)BanksShort-term interest rate rise (free long rate) -18 -26 -19 -8 6Short-term interest rate rise (fixed long rate) -19 -30 -37 -39 -39Long-term interest rate rise 8 31 45 60 77Steeper slope yield curve 13 31 41 50 58InsurersShort-term interest rate rise (free long rate) 20 23 36 49 61Short-term interest rate rise (fixed long rate) 20 19 20 20 20Long-term interest shock 8 28 43 53 64Steeper slope yield curve -6 4 12 17 22Imaginary financial conglomerates (FC)Short-term interest rate rise (free long rate) -7 -11 -3 10 23Short-term interest rate rise (fixed long rate) -7 -15 -20 -21 -21Long-term interest shock 8 30 44 58 73Steeper slope yield curve 7 23 32 40 47
Changes in profit of FC compared tobanks (index)
34 This index is less meaningful where the denominator - change in bank profits - is close to zero, as for the 4th and 5th yearin the first row. For similar failures, an alternative index - changes in profits of FCs as shares of those of insurers - wouldbe less useful.
35 This can be illustrated as follows, assuming that x and y are stochasts with zero expectation; var (α x + (1-α) y) = α2 var(x) + (1-α)2 var (y) +2 α (1-α) ρ v (var (x) var (y)). For, say, α = 0,5, and var (x) = var (y), this implies var ((x+y)/2) =0,5 (1 + ρ) var (x) < var (x), where the inequality holds, as long as ρ < 1. For ρ = 0, the variance of the average is half thevariance of x or y. In our case, α = p / (p + q) stands for the share of bank profits in the FC profits, (1-α) = q / (p + q) forthe share of insurance profits, x = X / p is the profit shock of banks and y = Y / q stands for the profit shock of insurers(p and q are profits of banks and insurers, respectively, and X and Y are net interest income shocks of banks and insurers,respectively). Thus a linear combination of shocks has a lower variance than its components (the more so the lower ρ is),and hence, given the zero expectations of x and y, that, in general, it is probable that this combination is closer to zerothan its components, and thus the index below 1.

Short-term interest shock (free long rate) 0.37 0.43 0.13 a a
Short-term interest shock (fixed long rate) 0.37 0.50 0.53 0.54 0.54Long-term interest shock 0.99 0.97 0.98 0.97 0.95Steeper slope yield curve 0.57 0.74 0.78 0.80 0.81a This index is less useful where the denominator - change in bank profits - is close to zero.
The considerable diversification effects suggest that a hypothetical merger is rewarding. However, two
remarks should be made here. First, the diversification effects of Table 4.2 do not imply any kind of
synergy; investors could also achieve these gains by holding both bank and insurance shares in their
portfolio. Second, the diversification effects suggest some gain in terms of financial stability, as insurers
can absorb bank shocks and vice versa.36 However, in principle, legal firewalls between banks and
insurers may limit financial cross-sector support. In practice, however, such firewalls may prove less
robust under crises conditions.
4.1.2 Interest rate shocks under a fair-value accounting regime
Under fair value accounting, assets are valued at market prices. Approximating such a regime we use
a broad-brush approach for our balance sheets. In case of an interest rate hike the value of a fixed rate
instrument diminishes with the net present value of all future interest rate differences.37 This section
presents the effects of a 2 percentage point rise in all interest rates, where the current level of the long-
term rate is 5%. Other fixed-income securities, including credits, have been treated more or less like
bonds. This is not apparent for credit loans, where in general no market prices are observed and
uncertainty may exist about creditworthiness. Moreover, many credits have embedded options such as
early settlement or renegotiation of the interest rate.38 Of course, such options only come into the
money when the interest rate declines and are worthless in our scenario of an interest rate rise. For
most long-term fixed income assets, we assume a term structure of 12 years and a duration of around
3 years (or in the case of mortgages close to 5 years), in line with interest rate risk reports of banks in
the Netherlands. This generates discounts of 5% to 7% (See Appendix 1). The revaluation of liabilities
has been treated likewise, as is obvious for fixed-income time deposits and debentures. Of course, the
discounting of debt is favourable for the wealth of the bank or the insurer. Serious difficulties arise in
revaluation of the various savings accounts and demand deposits or current accounts. The interest
rates on these accounts are not very sensitive to movements in model rates. Therefore, the ‘value’ of
these accounts rises, as this cheap debt becomes relatively cheaper. Naturally, the accountholders have
36 An alternative view is that financial conglomerates harm financial stability, as banks can be dragged down by severeproblems of insurers.
37 Comparing the lower interest rate of an existing bond with the higher interest rate of a newly emitted bond.

the permanent option to move their funds to other more rewarding investment. However, as most of
the accountholders do not use this option under the current rates, we assume that many of them will not
do so under the higher rates.39
The valuation of the balance sheet of insurers has been dealt with in a similar way, taking into account
that a part of these assets is held at the policy holders own risk. A problem is how to revalue the
technical provision for life insurance policies. Formally, the technical provision for life insurances is
based on a certain ‘calculation’ rate which remains unchanged when market rates move. The required
funds to cover the liabilities of the policy portfolio (or the debt) decreases. However, when interest
rates rise, it is easier to satisfy the corresponding liabilities or to make a profit on this portfolio.40 Based
on a gradually declining term structure of 40 years for the technical life insurance reserve (in line with
what can be observed in large insurance companies), the interest rate rise from 5% to 7% would imply
a reduction of required reserves (or investment) of more than 13% (see Appendix 1).41 As in the
earlier simulations, we calculate the effects of the interest rate changes, assuming unchanged
behaviour of banks and insurers. In any case, gains and losses due to unexpected market price changes
are unavoidable (except in the case of hedging).
38 Other counterparties do not have these options, for instance, because (i) they cannot find another bank willing to lend,(iii) their creditworthiness has declined since the loan was granted, or (iii) a penalty clause applies (as in the case ofmortgages).
39 Which is in line with the assumed duration of these accounts in the interest rate risk reports of banks.40 ‘Interest rate discounts’ and ‘return guarantees’ for policyholders are not taken into account as they are fixed. We ignore
optionality in the policy portfolio, in particular, the possibility to surrender. In general, surrender is not profitable, as theinsurers discount the surrender value and its tax treatment may be unfavourable.
41 This reduction does not apply to technical provision for life insurance reserve for those policies, where policyholders bearthe risk of the related investment themselves.
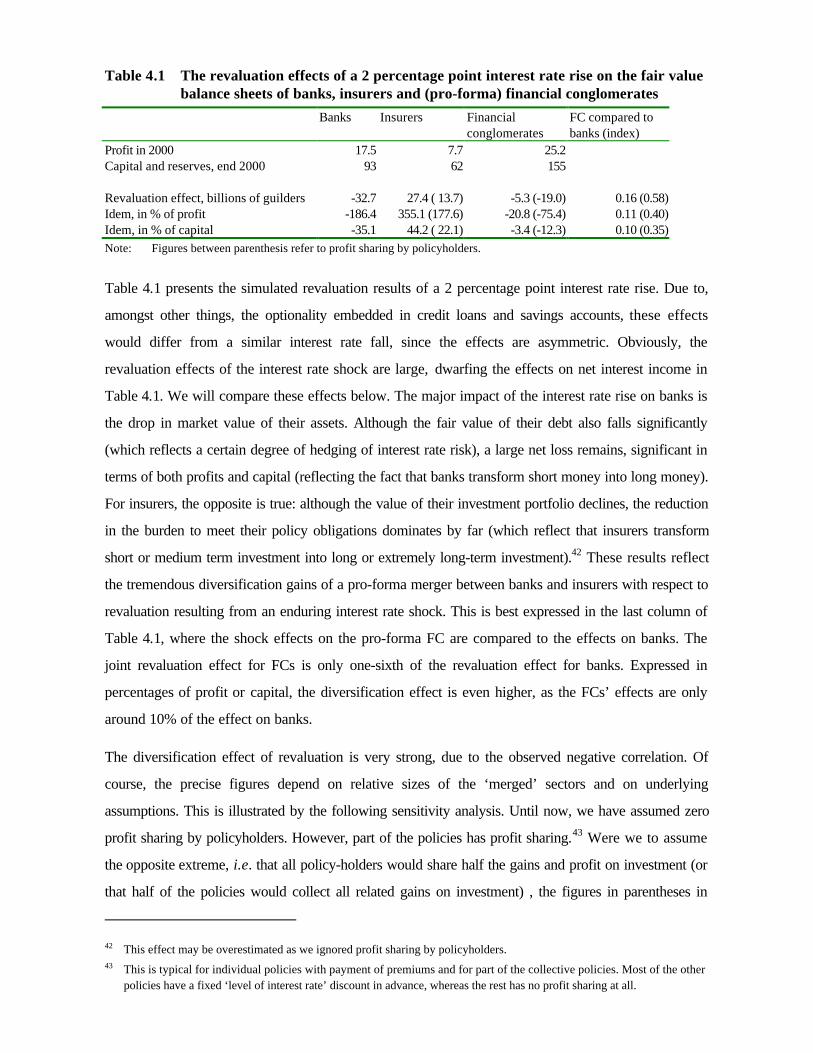
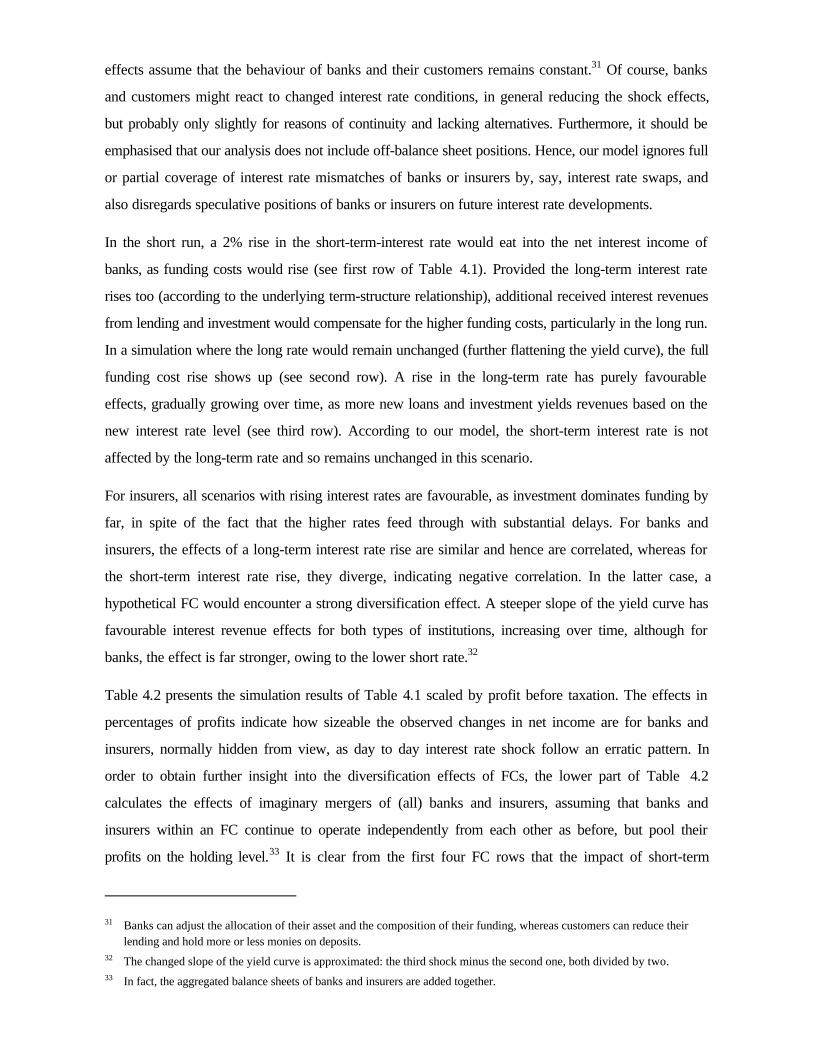
Table 4.1 The revaluation effects of a 2 percentage point interest rate rise on the fair valuebalance sheets of banks, insurers and (pro-forma) financial conglomerates
Banks Insurers Financialconglomerates
FC compared tobanks (index)
Profit in 2000 17.5 7.7 25.2Capital and reserves, end 2000 93 62 155
Revaluation effect, billions of guilders -32.7 27.4 ( 13.7) -5.3 (-19.0) 0.16 (0.58)Idem, in % of profit -186.4 355.1 (177.6) -20.8 (-75.4) 0.11 (0.40)Idem, in % of capital -35.1 44.2 ( 22.1) -3.4 (-12.3) 0.10 (0.35)Note: Figures between parenthesis refer to profit sharing by policyholders.
Table 4.1 presents the simulated revaluation results of a 2 percentage point interest rate rise. Due to,
amongst other things, the optionality embedded in credit loans and savings accounts, these effects
would differ from a similar interest rate fall, since the effects are asymmetric. Obviously, the
revaluation effects of the interest rate shock are large, dwarfing the effects on net interest income in
Table 4.1. We will compare these effects below. The major impact of the interest rate rise on banks is
the drop in market value of their assets. Although the fair value of their debt also falls significantly
(which reflects a certain degree of hedging of interest rate risk), a large net loss remains, significant in
terms of both profits and capital (reflecting the fact that banks transform short money into long money).
For insurers, the opposite is true: although the value of their investment portfolio declines, the reduction
in the burden to meet their policy obligations dominates by far (which reflect that insurers transform
short or medium term investment into long or extremely long-term investment).42 These results reflect
the tremendous diversification gains of a pro-forma merger between banks and insurers with respect to
revaluation resulting from an enduring interest rate shock. This is best expressed in the last column of
Table 4.1, where the shock effects on the pro-forma FC are compared to the effects on banks. The
joint revaluation effect for FCs is only one-sixth of the revaluation effect for banks. Expressed in
percentages of profit or capital, the diversification effect is even higher, as the FCs’ effects are only
around 10% of the effect on banks.
The diversification effect of revaluation is very strong, due to the observed negative correlation. Of
course, the precise figures depend on relative sizes of the ‘merged’ sectors and on underlying
assumptions. This is illustrated by the following sensitivity analysis. Until now, we have assumed zero
profit sharing by policyholders. However, part of the policies has profit sharing.43 Were we to assume
the opposite extreme, i.e. that all policy-holders would share half the gains and profit on investment (or
that half of the policies would collect all related gains on investment) , the figures in parentheses in
42 This effect may be overestimated as we ignored profit sharing by policyholders.43 This is typical for individual policies with payment of premiums and for part of the collective policies. Most of the other
policies have a fixed ‘level of interest rate’ discount in advance, whereas the rest has no profit sharing at all.
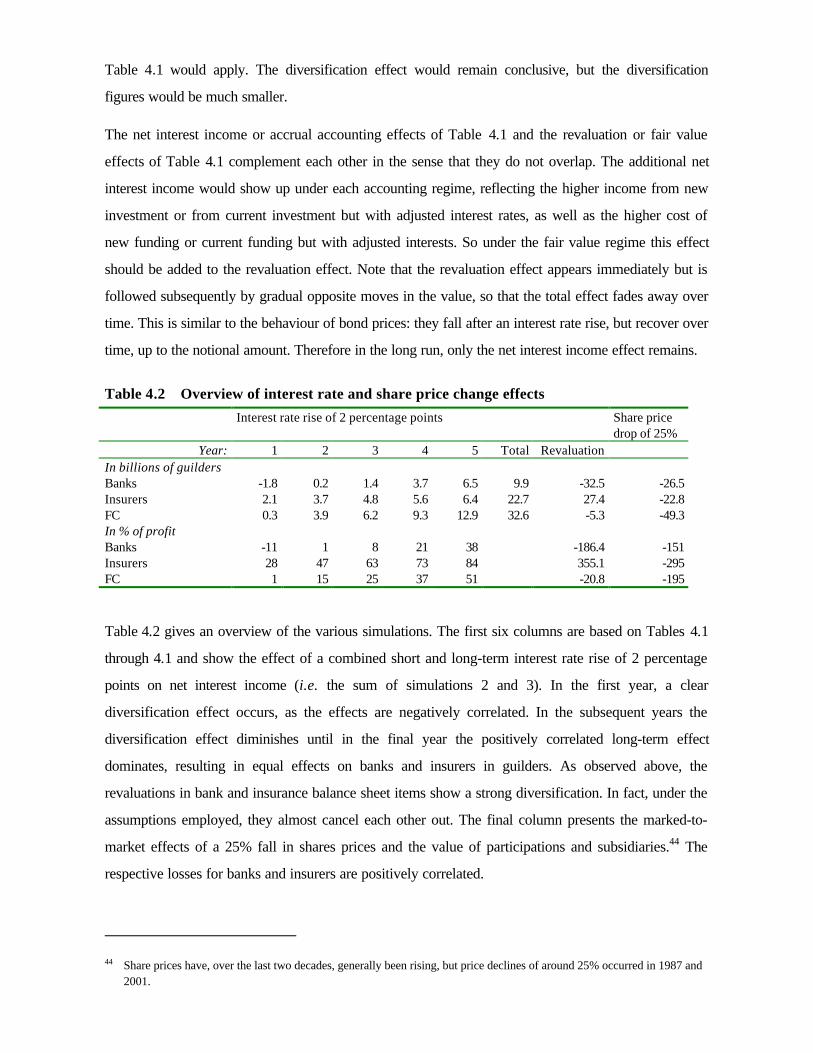
Table 4.1 would apply. The diversification effect would remain conclusive, but the diversification
figures would be much smaller.
The net interest income or accrual accounting effects of Table 4.1 and the revaluation or fair value
effects of Table 4.1 complement each other in the sense that they do not overlap. The additional net
interest income would show up under each accounting regime, reflecting the higher income from new
investment or from current investment but with adjusted interest rates, as well as the higher cost of
new funding or current funding but with adjusted interests. So under the fair value regime this effect
should be added to the revaluation effect. Note that the revaluation effect appears immediately but is
followed subsequently by gradual opposite moves in the value, so that the total effect fades away over
time. This is similar to the behaviour of bond prices: they fall after an interest rate rise, but recover over
time, up to the notional amount. Therefore in the long run, only the net interest income effect remains.
Table 4.2 Overview of interest rate and share price change effects
Interest rate rise of 2 percentage points Share pricedrop of 25%
Year: 1 2 3 4 5 Total RevaluationIn billions of guildersBanks -1.8 0.2 1.4 3.7 6.5 9.9 -32.5 -26.5Insurers 2.1 3.7 4.8 5.6 6.4 22.7 27.4 -22.8FC 0.3 3.9 6.2 9.3 12.9 32.6 -5.3 -49.3In % of profitBanks -11 1 8 21 38 -186.4 -151Insurers 28 47 63 73 84 355.1 -295FC 1 15 25 37 51 -20.8 -195
Table 4.2 gives an overview of the various simulations. The first six columns are based on Tables 4.1
through 4.1 and show the effect of a combined short and long-term interest rate rise of 2 percentage
points on net interest income (i.e. the sum of simulations 2 and 3). In the first year, a clear
diversification effect occurs, as the effects are negatively correlated. In the subsequent years the
diversification effect diminishes until in the final year the positively correlated long-term effect
dominates, resulting in equal effects on banks and insurers in guilders. As observed above, the
revaluations in bank and insurance balance sheet items show a strong diversification. In fact, under the
assumptions employed, they almost cancel each other out. The final column presents the marked-to-
market effects of a 25% fall in shares prices and the value of participations and subsidiaries.44 The
respective losses for banks and insurers are positively correlated.
44 Share prices have, over the last two decades, generally been rising, but price declines of around 25% occurred in 1987 and2001.

Of course, there is a limitless list of other shocks which could affect banks and insurers. Some are
likely to be positively correlated, such as higher wages, lower demand due to business cycle downturns,
lower real estate prices or extreme events, and would thus contribute little to diversification. Other
shocks are likely to be uncorrelated and would therefore contribute more to diversification - such as
losses from operational risk, unfavourable developments in lapses, mortality, longevity, morbidity and
disability expectancies and tax rules with respect to life insurances or interest rates.45 Another example
would be that an increase in credit losses due to business cycle deterioration is likely to hurt banks
much more than insurers.
The simulation model is based on many assumptions and the data used is not representative for all FCs,
so that the results should be evaluated with some caution. Nevertheless, the results provide ample
evidence that part of the risks within an FC - in particularly, the short-term interest rate movements - is
negatively correlated and that the diversification effect of the combination of bank and insurance
activities may be considerable, depending on the origin of changes and the employed accounting
regime. This outcome is reassuring in the sense that this diversification gain compensates for increased
risk of financial stability and contagion as discussed in Section 2.
4.2 Diversification estimates from market data
4.2.1 Bank holding company literature
A useful literature to look at if we want to analyse the degree to which the risks in financial sector
activities are interrelated is the primarily American discussion as to what activities are permitted for
bank holding companies (BHSs).46 The relative impact of mixing banking activities with various other
kinds of activities has been discussed in depth and this discussion is nested in the more general one
whether diversification is always a good thing for any company, to which the answer is often thought to
be negative (cf. Berger and Ofek (1995) and Lamont and Polk (2002)).
Research can be categorised into studies that look at activities already permitted (Wall (1987)) and at
‘forbidden’ activities (Boyd, et al. (1993)).47 Another distinction that can be drawn is between studies
using market information and studies using book values (e.g. Estrella (2001) versus the work of Boyd
and Graham). There is some debate as to whether accounting or market data provide the best measure
45 There may be negative correlation and stronger diversification when unfavourable tax rule changes for life insuranceproducts cause a shift from investment in these products towards savings.
46 This debate was especially relevant in the abolition of Glass-Steagall act (See Kwan and Laderman (1999)). The BHC-literature is discussed in Laderman (2000). Contributions are for instance Boyd and Graham (1988), Boyd, et al. (1993),Estrella (2001), Gully , et al. (2001), Kwan and Laderman (1999), Kwast (1989), Lown, et al. (2000), and Santomero andChung (1992).

of risk and return.48 It is well known that accounting data show a smoothed picture of profits, partly
because assets and liabilities are shown at historical cost rather than at market value. Stock prices, in
contrast, quickly reflect all relevant information as it becomes known. However, equity price series
show substantial volatility indicating that other factors than just developments relevant to the value of
the firm itself are reflected. Some of the studies on hypothetical mergers have been criticised because
the variability of profits has been used instead of the more appropriate probability of bankruptcy
(Santos (1998)). Other studies use measures aggregated over industries, introducing an aggregation
bias. Finally, it has been pointed out that a merger is more than just combining balance sheets.
Following a merger, policies are very likely to be changed to take advantage of the new situation.
The conclusions reached are mixed. Life insurance seems to be unambiguously a good choice for
banks looking for a reduction of risk. Diversification into real estate seems to generally increase risk
but the strength of this result might be driven by particular sample-selections. The effect of
diversification into securities activities seems to be unclear, depending on method, period or definition.
The only study using European data Gully, et al. (2001), is different in the sense that the institution’s
risk is modelled in a bottom-up fashion, starting with the assets on the balance sheet of the banks and
insurers.
4.2.2 Diversification: an empirical peek
The first question that comes to mind if we want to look at if there are possible diversification benefits
is whether a given stock moves with it’s own kind or moves more in line with the movements in the
other sector. To analyse this we computed the correlations between all possible combinations of equity
series, excluding combinations of two equal series, in each country, as shown in Table 4.1. We limit
ourselves to within-country analysis because we feel that differences in regulatory, tax, and institutional
conditions between countries are too large to ignore.
Table 4.1 Median correlation of stock prices between the sectors, by country, 1990-2000.
France Germany Netherlands UK US JapanBank-Bank 0.53 0.85 0.86 0.79 0.77 0.87
(132) (90) (30) (90) (132) (86)Bank-Ins. 0.54 0.71 0.92 0.77 0.72 0.81
(210) (180) (36) (160) (264) (240)Ins.-Ins. 0.73 0.60 0.94 0.83 0.85 0.85
(64) (72) (6) (56) (110) (132)
47 See Boyd, et al. (1993) for an overview of many of the relevant papers.48 The standard measure of risk is volatility. See Harrison and Kreps (1979) for alternative measures of risk.

Note: The number in parentheses is the number of within country combinations available. The boldfigures are the lowest correlations by country (column).
The bold figures in the table are the lowest correlations by country. The table shows that in a number
of countries (e.g. UK, US, and Japan) the correlations between sectors are as expected: those
between banks and insurers are the lowest of all possible combinations. Diversification benefits would
thus be the highest in mergers across sectors. Judging by the table, it is likely that the most
diversification benefit within a sector might be attained by French banks. For the US the results
correspond to previous results (viz. Estrella (2001), p.2373).
Most of the larger banks and insurers in the sample are already well diversified and the deck is thus
stacked against finding substantial diversification benefits. Smaller institutions generally operate largely
in a single sector and should thus give us a better picture of sector-risk. To see whether smaller
institutions are indeed more likely to see benefits in merging we split the sample in 2 using the median
market capitalisation (within country and sector) as an indicator variable. Table 4.2 shows the
combinations involving just small firms.
Table 4.2 Median correlation of stock prices of small firms between the sectors, bycountry, 1990-2000.
France Germany Netherlands UK US JapanBank-Bank 0.43 0.79 0.94 0.50 0.75 0.80
(20) (20) (2) (20) (20) (20)Bank-Ins. 0.56 0.61 0.92 0.61 0.75 0.86
(28) (40) (4) (40) (50) (50)Ins.-Ins. 0.07 0.67 - 0.68 0.70 0.94
(6) (12) (12) (20) (20)Note: The number in parentheses is the number of within country combinations available. The bold
figures are the lowest correlations by country (column).
Here compared to the previous table a different, rather erratic picture emerges. However, the number
of available observations in some countries, especially the Netherlands, is so low as to make the results
somewhat fragile. The interesting – counterintuitive - results emerges that in most countries smaller
institutions would benefit most from mergers with their own kind, contrary to the results shown in the
previous table where cross-sector mergers looked most promising.
Note that the correlations discussed are the correlations over the full sample period. These are more or
less the “going concern” correlations. The table thus does not address issue that these correlations
might increase significantly in times of stress as discussed above.

4.2.3 An option pricing method
Following an approach similar to Estrella (2001) and Santomero and Chung (1992), we apply an option-
pricing model to estimate the volatility of assets and a measure of the likelihood of failure of a firm.49
Using the standard Black-Scholes (BS) model, we compare the likelihood of various pro forma
combinations of firms. The model assumes that the market value of a firm’s assets follow a stochastic
process
dzVdtVdV AAAA σµ +=
(1)
where AV and AdV are the firm’s asset value and its change, µ is the firm’s growth rate, sA the firm’s
asset volatility and dz is a Wiener process. A simplifying assumption in the BS model is that there is
just a single class of both debt and equity. The market value of equity (VE) and the market value of
assets are related by
( ) ( )2r
1 dLedVV TAE Φ−Φ= − (2)
where F is the cumulative normal distribution, r denotes the risk free interest rate, T is the expiration
date of the option, L are the firm’s liabilities and
TTr
dA
LV AA
σ
σ )()ln(1 2
2
++= ,
Tdd Aσ−= 12 .
In addition it can be shown that
AE
AE d
VV σσ )1(Φ= (3)
where sE is the volatility of equity. The market value of assets and the volatility of assets are not
directly observable but are implied by the market price and its volatility. VA and sA are found through
solving (2) and (3) simultaneously by iterative imputations. Given equation (2) we can derive a function
for the probability of failure. However, for the firms in our sample the probability of failure at short
horizons are typically very small and thus analysing the argument in the distribution function of the
failure equation, also known as the distance to default or z*, is more fruitful
49 See Crosbie and Bohn (2002), p. 14 and onward or Hull (2000), CH 11 for derivation and discussion of this kind ofmodel. An alternative route would be to recast the problem using a different type of option, such as for instance a barrier-option, along the lines of Avellaneda and Zhu (2002). Ritchken, et al. (1993) find a barrier-option framework to be usefulfor explaining the behaviour of bank equity prices.

TT
zA
LV AA
σµ σ )()ln(
* 22
−+= (4)
z* is the number of standard deviations that the firm is away from default. A standard assumption is
that the leverage ratio, LVA , is constant over time. Firms however adjust their gearing as they approach
default (Crosbie and Bohn (2002) and Bliss (2001)). Unfortunately, this biases our measure in an
opposite way.
To compute the measures of risk just discussed we need values for L, VE, sE, µ, r, and T. Book values
for liabilities (L) for the year 2000 are taken from Bankscope and ISIS databases, for banks and
insurance companies, respectively. The value of equity, VE, and equity prices are taken from
Datastream and Bloomberg for a sample period of 1990 to 2000. The volatility of equity prices, sE, is
computed as the standard deviation of log price differences for each month, which is then annualised
by multiplying by the square root of 12 (months). For µ, the expected rate of asset growth, we use the
average yearly growth rate of the share price of each institution over the last 5 years.50 The risk free
rate, r, is the long-term government bond yield average of December 2000, taken from the IMF
International Financial Statistics. T, the expiration date, is set to 12 months.51 We includes the largest
20 institutions by country, aiming at an equal split between insurers and banks, except for the
Netherlands for which we took all the larger institutions available.
The option pricing results model provides a fuller picture of risk. Next to the average return, µ, and its
variability it estimates the variability of assets, as implied by market perceptions, and z*, the markets’
expectation of default. As discussed previously, z* is an inverse measure of risk; higher values of z*
indicate lower risk. In Table 4.1 we show the risk-return characteristics of the firms in our sample.
Table 4.1 Risk and return characteristics by country and industry
Industry France Germany Netherlands UK US JapanBanks z* 10.6730 1.4719 6.6638 1.3644 0.2792 -1.2504
s A 0.0100 0.0100 0.0600 0.1535 0.3010 0.1110s E 0.2331 0.2960 0.2852 0.3738 0.5102 0.3234µ 0.1077 0.0645 0.1611 0.1845 0.1800 -0.1374N 7 7 3 8 10 9
Insurance z* 5.6357 2.9613 0.6479 3.4848 3.5909 -0.6002s A 0.0355 0.0390 0.2690 0.0490 0.1325 0.2440s E 0.2057 0.2572 0.3739 0.3622 0.4142 0.3478µ 0.0877 0.0718 0.2481 0.0726 0.1700 -0.0740N 6 7 3 7 8 10
50 Admittedly this is not the most forward looking proxy. We have computed ohter variants (viz. the risk free rate ,suplemented with an equity premium. The results are not very sensitive to this assumption. See also formula (4).
51 We ran the estimations for T=18 and 24 months with qualitatively similar results.

Note: µ is the median value of the average return by firm over the sample. s E is the annualisedstandard deviation of stock prices. s A is the estimated standard deviation of asset values impliedby market values and volatility. All variables are median values. N is the number ofobservations.
The table clearly shows the decade-long decline in Japanese equity prices. Banking is on average the
more profitable activity in half of the countries. The fuller measure of risk, z*, shows that banking is
generally the more risky sector.
The next step in our analysis is the construction of pro-forma mergers between the banks and insurers
in our data set. Again we limit ourselves to mergers within each country. To construct an observation
of a merged bank we weigh the appropriate values by market capitalisation.
Table 4.2 The effects of pro-forma mergers, weighted by market capitalisation
France Germany Netherlands UK US JapanBank-Bank z* 31.9622 28.1148 15.6132 -0.1368 1.7603 5.0692
s A 0.0150 0.0110 0.0980 0.6820 0.3260 0.1100s E 0.2328 0.2789 0.2952 0.3882 0.5037 0.3528N 75 57 19 70 107 37
Bank-Ins. z* 25.8278 27.3863 4.7246 2.4294 2.8081 4.8059s A 0.0215 0.0215 0.1910 0.4585 0.3140 0.1265s E 0.2235 0.2684 0.3279 0.3813 0.4617 0.3528N 104 126 28 124 218 130
Ins.-Ins. z* 13.9754 8.7715 1.8017 4.7920 6.4965 11.4867s A 0.0335 0.0820 0.2925 0.3240 0.2990 0.1435s E 0.2057 0.2572 0.3739 0.3622 0.4147 0.3634N 30 51 6 42 86 86
Note: µ is the median value of the average return by firm over the sample. s E is the annualisedstandard deviation of stock prices. s A is the estimated standard deviation of asset values impliedby market values and volatility. All variables are median values. N is the number ofobservations.
Looking at the z* values, two groups can be discerned with regard to the pro-forma mergers. On the
one hand we have the continental European countries France, Germany, and the Netherlands, where
the combination of just insurers leads to the lowest z* values, implying the largest probability of default.
On the other hand, we find the Anglo-Saxon countries and Japan, where the combination of just banks
leads to the lowest z*.
Again, we split the sample into smaller and larger firms and construct fictitious combinations. The
results in the table below seem to suggest that hypothetical mergers of just small banks are relatively
more risky than their insurance counterparts.
Table 4.3 The effects of pro-forma mergers of small firms, weighted by marketcapitalisation
France Germany UK USA JapanBank-Bank z* 33.2452 15.8618 3.5676 3.1307 1.8889
s A 0.0230 0.0100 0.3815 0.2160 0.0530s E 0.1075 0.1162 0.4600 0.5166 0.3528N 15 18 18 18 15
Bank-Ins. z* 64.1046 67.5561 6.0584 6.5103 4.7268s A 0.0245 0.0130 0.3385 0.2345 0.1220s E 0.1873 0.1193 0.4469 0.5100 0.3322N 24 35 38 50 44
Ins.-Ins. z* 55.1670 235.3528 13.3447 8.3980 24.8102s A 0.0205 0.0160 0.2820 0.1725 0.1285s E 0.1880 0.2489 0.4204 0.4887 0.2699N 6 8 12 18 20
Note: µ is the median value of the average return by firm over the sample. s E is the annualisedstandard deviation of stock prices. s A is the estimated standard deviation of asset values impliedby market values and volatility. All variables are median values. N is the number ofobservations. The Netherlands is not included due to lack of observations.
What do these results teach us for regulatory or economic capital? The first thing to note is that there is
no clear international pattern in the various results. Depending on the particular country and sectors
involved in the pro-forma merger, risk could reduce or increase risk. A second observation is that some
of the more robust US findings are difficult to replicate using the current sample. The banks and
insurance companies in our sample are the large and hence more diversified firms. The more
fragmented US firms are more focussed and are thus more likely to be less than perfectly correlated,
leading to diversification gains for at least one of the prospective merger candidates. Since the FCs in
our analyses are already highly diversified, gains are likely to be less impressive. Nevertheless, some
mergers would yield diversification gains although, again, the pattern of these gains would differ from
country to country.
5 Supervisor's view on economic capital
As mentioned above, economic capital is the buffer which a financial institution itself considers as
necessary to absorb unexpected losses, given its risk profile, controls and degree of risk aversion. One
of the tools for measuring the risks of a financial institution and determining the level of economic
capital is an economic capital model. It is beyond the scope of this paper to give a detailed outline of
the requirements these models should meet. In this section we will briefly discuss the merit and possible
shortcomings of economic capital (models) for supervisors.
Since economic capital models can play an important role as an instrument for firm-wide risk
management, their development should be encouraged strongly. However, at this stage of
developments, the existing models have several shortcomings. The measurement of some of the risk
types is well-developed, but the measurement of many other risk types is still in its infancy. In most
cases this is due to insufficiencies in the data. For some areas this problem will solve itself over time, as
data continue to be collected and stored and measurement techniques are developed further. For other
areas, however, the problem of data inadequacy will probably persist, as many relevant phenomena,
such as major catastrophes, large-scale frauds and defaults of high-rated corporates, occur only rarely.
With respect to certain risk types, lack of data will hinder the correct measurement of correlations. In
addition to these practical difficulties, however, there are several fundamental problems, in particular
regarding cross-sector risk measurement, such as the issue of choosing a unit risk measurement and an
appropriate time horizon. Yet despite these inadequacies, the ECM is the most promising tool for FCs
to measure and manage their firm-wide risk. Besides, ECMs can be used for commercial purposes, in
particular, to measure the (risk adjusted return) performance of the various units in the FC and to
allocate economic capital in order to increase shareholder value.
The supervisor might employ ECMs in a number of ways. Firstly, an FCs ECM can be used to
increase the knowledge and understanding of the risk profile of a supervised financial institution.
Particularly under the Second Pillar, where banks are required to have instruments in place to assess
the adequacy of their (economic) capital, given their particular risk profile. Secondly, the ECM can be
utilised to evaluate whether the current (simple sum) minimum capital requirements for FCs are
adequate and, especially, to assess what the level III type diversification is in cross-section institutions.
One might even consider whether - in the distant future – an ECM could be used by financial
institutions to calculate their minimum required capital, as they already do for market risk.
Both supervisory uses make strong demands on the ECM. As a central requirement, the financial
institution should be able to convince the supervisor that the ECM is able to measure all material risk
accurately and reliably. As has been argued above, this may currently be the case for some risk types,
but it is not universally true, and hence not for the model as a whole. Nevertheless, ECMs might be
acceptable as long as they are the best available tool, as is probably the case for Pillar II risk
assessment. It is worth mentioning that the general problem of model validation might be rather similar
for FCs and for supervisors. An FC’s central risk management unit may find itself facing the situation
where a large number of legal entities provide building blocks for the ECM (describing their risk levels),
while at the same time, these entities may have incentives to underestimate their risks. Similarly the
supervisor could encounter institutions that might have stimuli to underrate their own riskiness.
For the second supervisory goal - the assessment of the current minimum required capital - ECMs
have a further shortcoming as they ignore risks, such as contagion risk, that are important for the
supervisor. Here a difference between economic capital (optimised in the eyes of the firm’s
management) and regulatory capital (minimum requirement as seen by the supervisors) emerges. In
theory, supervisors could compute the magnitude and likelihood of all ignored risks and social costs.
Knowing the expected value, the supervisor would then be able to charge an institution accordingly,
either through the formation of a fund or requiring the allocation of some risk-bearing capital. The
current state of risk-measurement, however, has not yet attained a level that would make the practical
implementation of this theoretical exercise feasible.
A second issue in this respect is the risk aversion of a supervisor relative to that of – the management
of – an institution. In all likelihood, both parties will have divergent perceptions of risks. It is also
common for supervisors to stress prudence and - if there is model-uncertainty - an additional capital
surcharge is often added. Hence we may expect that an economic capital model constructed from a
number of sub-models (of e.g. market risk, credit risk, etc.) may have several representations of
‘prudence’ invisibly concealed in its inner working. Care should be taken that such accumulation does
not result in a too high a minimum requirement.
A third issue is that supervisors will be inclined to focus on the parameter values used to represent
conditions in periods of stress. In other words, a supervisor will place more weight on the role of an
ECM as a risk measurement system under all circumstances than on the other functions of an ECM
(e.g. pricing and management fees).
6 Summary and conclusions
Economic capital models can improve firm-wide risk management substantially, particularly in mixed
conglomerates, and their development and use should therefore be strongly encouraged. However, at
the present stage of development, such models have a number of serious shortcomings, most of them
owing to lack of data. Although ECMs can be useful for some regulatory purposes, such as the
“supervisory review”, we conclude that their immaturity and insufficient validation possibilities prohibits
their use in a wider regulatory context. This holds true especially for the assessment of the adequate
minimum required capital for cross-sector FCs. The main determinant of an FC’s optimal regulatory
capital is the correlation or diversification of risk across sectors. Neither ECMs nor other measurement
instruments provide convincing results regarding the degree of diversification. This paper addresses this
issue by presenting two empirical analyses, which are quite different and therefore complement each
other. The first analysis is based on an asset and liability model and identifies diversification effects for
FCs under various shocks. The diversification effects appear to be very strong for some scenarios,
particularly when the full fair value effects are taken into account, but rather weak for other shocks.
The second investigation employs correlations across share prices and option models and finds that

diversification occurs not only when banks and insurers merge, but also when banks are combined with
other banks or insurers with insurers. The correlations between share prices make clear that - except
for the Netherlands - diversification effects for FCs are substantially larger than found by OWC (5%-
10%). The option model suggests that FCs have lower default probabilities than separate bank or
insurance firms. A caveat applies as the model estimated is relatively stylised. On the whole, however,
empirical evidence reveals that diversification effects are substantial and possibly somewhat larger than
suggested by OWC. This is important information for regulatory purposes, but insufficient for any
conclusions regarding minimum capital requirements as far as deviating from the current simple sum.
After all, these studies ignore the non-negligible additional risk run by FCs, namely contagion risk and
the moral hazard risk which goes with non-regulated entities.
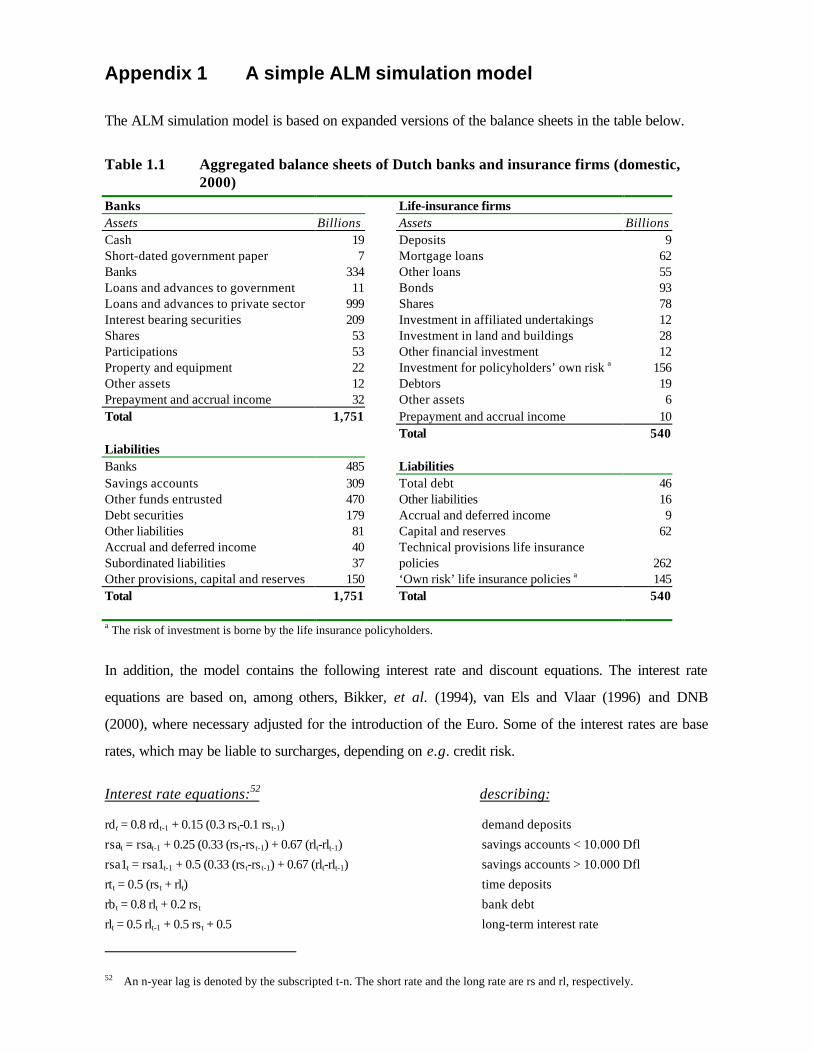
Appendix 1 A simple ALM simulation model
The ALM simulation model is based on expanded versions of the balance sheets in the table below.
Table 1.1 Aggregated balance sheets of Dutch banks and insurance firms (domestic,2000)
Banks Life-insurance firmsAssets Billions Assets BillionsCash 19 Deposits 9Short-dated government paper 7 Mortgage loans 62Banks 334 Other loans 55Loans and advances to government 11 Bonds 93Loans and advances to private sector 999 Shares 78Interest bearing securities 209 Investment in affiliated undertakings 12Shares 53 Investment in land and buildings 28Participations 53 Other financial investment 12Property and equipment 22 Investment for policyholders’ own risk a 156Other assets 12 Debtors 19Prepayment and accrual income 32 Other assets 6Total 1,751 Prepayment and accrual income 10
Total 540LiabilitiesBanks 485 LiabilitiesSavings accounts 309 Total debt 46Other funds entrusted 470 Other liabilities 16Debt securities 179 Accrual and deferred income 9Other liabilities 81 Capital and reserves 62Accrual and deferred income 40 Technical provisions life insuranceSubordinated liabilities 37 policies 262Other provisions, capital and reserves 150 ‘Own risk’ life insurance policies a 145Total 1,751 Total 540
a The risk of investment is borne by the life insurance policyholders.
In addition, the model contains the following interest rate and discount equations. The interest rate
equations are based on, among others, Bikker, et al. (1994), van Els and Vlaar (1996) and DNB
(2000), where necessary adjusted for the introduction of the Euro. Some of the interest rates are base
rates, which may be liable to surcharges, depending on e.g. credit risk.
Interest rate equations:52 describing:
rdt = 0.8 rdt-1 + 0.15 (0.3 rst-0.1 rs t-1) demand deposits
rsat = rsat-1 + 0.25 (0.33 (rst-rs t-1) + 0.67 (rlt-rlt-1) savings accounts < 10.000 Dfl
rsa1t = rsa1t-1 + 0.5 (0.33 (rst-rs t-1) + 0.67 (rlt-rlt-1) savings accounts > 10.000 Dfl
rtt = 0.5 (rs t + rlt) time deposits
rbt = 0.8 rlt + 0.2 rs t bank debt
rlt = 0.5 rlt-1 + 0.5 rs t + 0.5 long-term interest rate
52 An n-year lag is denoted by the subscripted t-n. The short rate and the long rate are rs and rl, respectively.
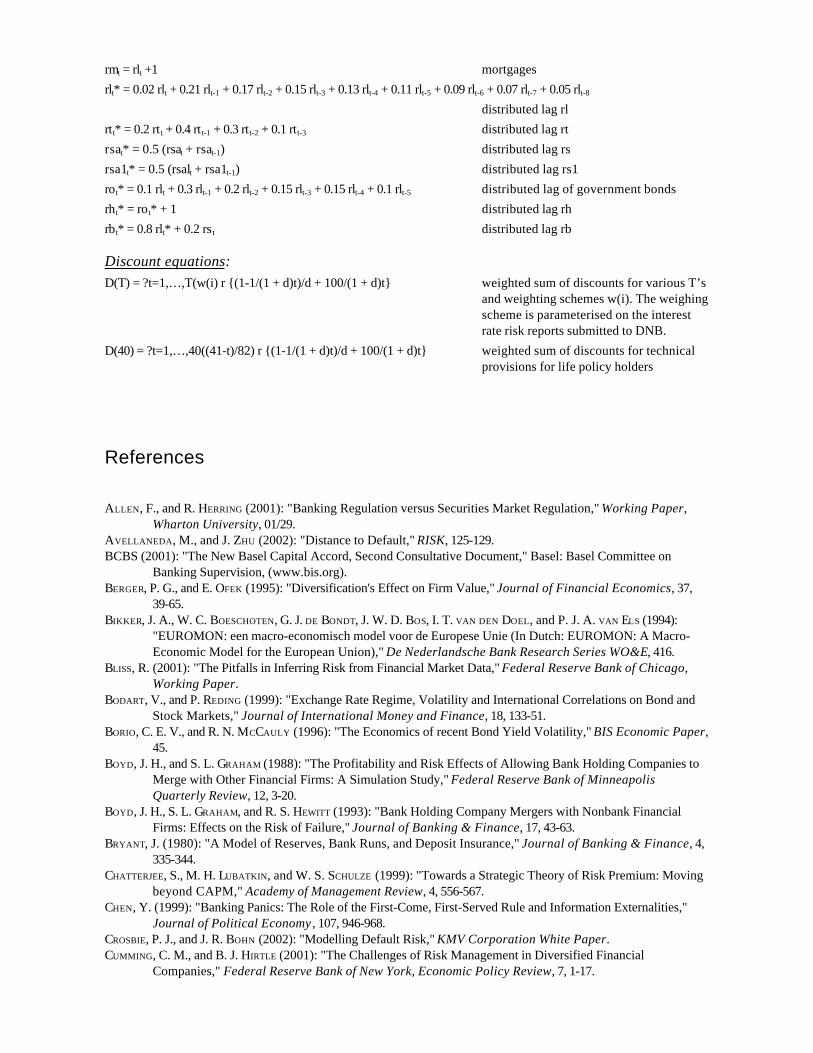
rmt = rlt +1 mortgages
rlt* = 0.02 rlt + 0.21 rlt-1 + 0.17 rlt-2 + 0.15 rlt-3 + 0.13 rlt-4 + 0.11 rlt-5 + 0.09 rlt-6 + 0.07 rlt-7 + 0.05 rlt-8distributed lag rl
rtt* = 0.2 rt t + 0.4 rtt-1 + 0.3 rtt-2 + 0.1 rtt-3 distributed lag rt
rsat* = 0.5 (rsat + rsat-1) distributed lag rs
rsa1t* = 0.5 (rsalt + rsa1t-1) distributed lag rs1
rot* = 0.1 rlt + 0.3 rlt-1 + 0.2 rlt-2 + 0.15 rlt-3 + 0.15 rlt-4 + 0.1 rlt-5 distributed lag of government bonds
rht* = ro t* + 1 distributed lag rh
rbt* = 0.8 rlt* + 0.2 rs t distributed lag rb
Discount equations:D(T) = ?t=1,…,T(w(i) r {(1-1/(1 + d)t)/d + 100/(1 + d)t} weighted sum of discounts for various T’s
and weighting schemes w(i). The weighingscheme is parameterised on the interestrate risk reports submitted to DNB.
D(40) = ?t=1,…,40((41-t)/82) r {(1-1/(1 + d)t)/d + 100/(1 + d)t} weighted sum of discounts for technicalprovisions for life policy holders
References
ALLEN, F., and R. HERRING (2001): "Banking Regulation versus Securities Market Regulation," Working Paper,Wharton University, 01/29.
AVELLANEDA, M., and J. ZHU (2002): "Distance to Default," RISK, 125-129.BCBS (2001): "The New Basel Capital Accord, Second Consultative Document," Basel: Basel Committee on
Banking Supervision, (www.bis.org).BERGER, P. G., and E. OFEK (1995): "Diversification's Effect on Firm Value," Journal of Financial Economics, 37,
39-65.BIKKER, J. A., W. C. BOESCHOTEN, G. J. DE BONDT, J. W. D. BOS, I. T. VAN DEN DOEL, and P. J. A. VAN ELS (1994):
"EUROMON: een macro-economisch model voor de Europese Unie (In Dutch: EUROMON: A Macro-Economic Model for the European Union)," De Nederlandsche Bank Research Series WO&E, 416.
BLISS, R. (2001): "The Pitfalls in Inferring Risk from Financial Market Data," Federal Reserve Bank of Chicago,Working Paper.
BODART, V., and P. REDING (1999): "Exchange Rate Regime, Volatility and International Correlations on Bond andStock Markets," Journal of International Money and Finance, 18, 133-51.
BORIO, C. E. V., and R. N. MCCAULY (1996): "The Economics of recent Bond Yield Volatility," BIS Economic Paper,45.
BOYD, J. H., and S. L. GRAHAM (1988): "The Profitability and Risk Effects of Allowing Bank Holding Companies toMerge with Other Financial Firms: A Simulation Study," Federal Reserve Bank of MinneapolisQuarterly Review, 12, 3-20.
BOYD, J. H., S. L. GRAHAM, and R. S. HEWITT (1993): "Bank Holding Company Mergers with Nonbank FinancialFirms: Effects on the Risk of Failure," Journal of Banking & Finance, 17, 43-63.
BRYANT, J. (1980): "A Model of Reserves, Bank Runs, and Deposit Insurance," Journal of Banking & Finance, 4,335-344.
CHATTERJEE, S., M. H. LUBATKIN, and W. S. SCHULZE (1999): "Towards a Strategic Theory of Risk Premium: Movingbeyond CAPM," Academy of Management Review, 4, 556-567.
CHEN, Y. (1999): "Banking Panics: The Role of the First-Come, First-Served Rule and Information Externalities,"Journal of Political Economy , 107, 946-968.
CROSBIE, P. J., and J. R. BOHN (2002): "Modelling Default Risk," KMV Corporation White Paper.CUMMING, C. M., and B. J. HIRTLE (2001): "The Challenges of Risk Management in Diversified Financial
Companies," Federal Reserve Bank of New York, Economic Policy Review, 7, 1-17.
DE BANDT, O., and P. HARTMANN (2001): "Systemic Risk: a Survey," CEPR Discussion Paper Series, 2634.DIAMOND, D. W., and P. H. DYBVIG (1983): "Bank Runs, Deposit Insurance, and Liquidity," Journal of Political
Economy , 91, 401-419.DNB (2000): EUROMON: The Netherlandsche Bank's Multi-Country Model for Policy Analysis in Europe.
Amsterdam: De Nederlandsche Bank / NIBE-SVV, Monetaire Monografieën 19.EICHENGREEN, B., A. K. ROSE , and C. WYPLOSZ (1996): "Contagious Currency Crises," Berkeley: University of
California: Graduate Institute of International Studies.ESTRELLA, A. (2001): "Mixing and Matching: Prospective Financial Sector Mergers and Market Valuation,"
Journal of Banking & Finance, 25, 2367-2392.FLEMING, J., C. KIRBY, and B. OSTDIEK (1998): "Information and Volatility Linkages in the Stock, Bond, and Money
Markets," Journal of Financial Economics, 49, 111-137.FROOT, K. A., and J. C. STEIN (1998): "Risk Management, Capital Budgeting, and Capital Structure Policy for
Financial Institutions: An Integrated Approach," Journal of Financial Economics, 47, 55-82.GARCIA, G. G. H. (2000): "Deposit Insurance: A Survey of Actual and Best Practices," International Monetary
Fund Occasional Paper, 197.GULLY, B., W. PERRAUDIN, and V. SAPORTA (2001): "Capital Requirements for Combined Banking and Insurance
Activities," London: Bank of England.HARRISON, J. M., and D. M. KREPS (1979): "Call Options and the Risk of Underlying Securities," Journal of
Financial Economics, 13, 425-434.HULL, J. C. (2000): Options, Futures, & other Derivatives. Upper Sadle River, NJ: Prentice Hall.IAA (2002): "Report of Solvency Working Party: prepared for IAA Insurance Regulation Committee,"
International Actuarial Association.KWAN, S. H., and E. S. LADERMAN (1999): "On the Portfolio Effects of Financial Convergence: A Review of the
Literature," Federal Reserve Bank of San Francisco Economic Review, 2, 18-31.KWAST, M. L. (1989): "The Impact of Underwriting and Dealing on Bank Returns and Risks," Journal of Banking
& Finance, 13, 101-25.LADERMAN, E. S. (2000): "The Potential Diversification and Failure Reduction Benefits of Bank Expansion into
Nonbanking Activities," Federal Reserve Bank of San Francisco, Working Paper, 2000-01.LAMONT, O. A., and C. POLK (2002): "Does Diversification Destroy Value? Evidence from the Industry Shocks,"
Journal of Financial Economics, 63, 51-77.LELAND, H. E. (1998): "Agency Costs, Risk Management, and Capital Structure," Journal of Finance, 53, 1213-
1243.LLEWELLYN, D. T. (1999): "The Economic Rationale for Financial Regulation," FSA Occasional Paper Series, 1.LONGIN, F., and B. SOLNIK (1995): "Is the Correlation in International Equity Returns Constant: 1960-1990?,"
Journal of International Money and Finance, 14, 3-26.LOWN, C. S., C. L. OSLER, P. E. STRAHAN, and A. SUFI (2000): "The Changing Landscape of the Financial Services
Industry: What Lies Ahead?," Federal Reserve Bank of New York Economic Policy Review, 39-55.OWC (2001): "Study on the Risk Profile and Capital Adequacy of Financial Conglomerates," London: Oliver,
Wyman and Company.PVK (2001a): "Financiële gegevens levensverzekeraars 2000 (In Dutch: Financial Data of Property and CasualtyInsurance Firms)," Apeldoorn: Pensioen- & Verzekeringskamer.— (2001b): "Financiële gegevens schadeverzekeraars 2000 (In Dutch: Financial Data of Life Insurance Firms),"
Apeldoorn: Pensioen- & Verzekeringskamer.RITCHKEN, P., J. B. THOMSON, R. P. DEGENNARO , and A. LI (1993): "On Flexibility, Capital Structure and Investment
Decisions for the Insured Bank," Journal of Banking & Finance, 17, 1133-1146.ROBINSON, G. (2001): "The Destructive Power of 'Best Practice'," RISK, September, 123-125.RULE, D. (2001): "Risk Transfer between Banks, Insurance Companies and Capital Markets: an Overview,"
Financial Stability Review, Bank of England, December, 137-159.SANTOMERO , A. M., and E. J. CHUNG (1992): Evidence in Support of Broader Bank Powers. New York: New York
University, Salomon Center.SANTOS, J. A. C. (1998): "Commercial Banks in the Securities Business: A Review," Journal of Financial Services
Research, 14, 35-60.VAN ELS, P. J. A., and P. J. G. VLAAR (1996): MORKMON III: een geactualiseerde versie van het macro-
economische beleidsmodel van de Nederlandsche Bank (In Dutch: MORKMON III: An UpdatedVersion of the Macro-Economic Policy Model of De Nederlandsche Bank). Amsterdam: DeNederlandsche Bank.
WALL, L. D. (1987): "Has Bank Holding Companies' Diversification Affected their Risk of Failure?," Journal ofEconomics and Business, 39, 313-326.