Embed Size (px)
Citation preview
Page 1 of 33
Next release: 14 November 2014
Release date: 2 July 2014
Contact: Wesley Harris [email protected] +44 (0)1633 455250
Statistical bulletin
Capital stocks and fixed capital consumption, UK: 2013
Annual estimates of the value and types of non-financial assets used in the production of goods or services within the UK economy and their loss in value over time.
Table of contents
1. Key points
2. Overview
3. Background
4. Key terms
5. Changes to methodology
6. What do you think?
7. Capital stocks and consumption of fixed capital in detail
8. Analysis by institutional sector
9. Analysis by type of asset
10. Analysis by industry
11. Capital output ratio analysis
12. Net capital stocks per employed person
13. International comparisons
14. Background notes
Page 2 of 33
1 . Key points
This is the first publication of capital stock estimates since 2010. Estimates of capital stocks and consumption of fixed capital are now produced using a new methodology, as explained in the methodological changes to the estimation of capital stocks and consumption of fixed capital and impact of the methodological changes to the estimation of capital stocks and consumption of fixed capital articles published in June and July 2014. Users are strongly advised to read these articles and the background notes of this release
All data referred to in this bulletin are annual estimates of chained volume measures (CVM), unless specified otherwise
The United Kingdom’s (UK) net capital stock was estimated at £3.5 trillion at the end of 2012. Between 1998 and 2007, annual growth averaged at 1.9% but this slowed between 2008 and 2012 to 1.1%. Since 1997, estimates of net capital stocks increased by £750 billion (28%)
Consumption of fixed capital for the UK was estimated at £183 billion in 2012, an increase of £40 billion (28%) compared with 1997. However, the 2012 estimate remains £13 billion (6%) below the 2007 peak for this series, having fallen during the economic downturn
Services industries held an estimated 79% of total net capital stocks at the end of 2012
In 2012 the level of net capital stock per employed person fell by 1% following a slowdown in growth in 2010 and 2011
This release contains analysis of the capital stock to output ratio, and ratio of capital stock to employment
2 . Overview
This is the first publication of capital stock estimates since 2010, as explained in the methodological changes to and the estimation of capital stocks and consumption of fixed capital impact of the methodological changes to the
articles published in June and July 2014. The estimation of capital stocks and consumption of fixed capitalinformation within these articles will assist users’ interpretation of these statistics as there have been significant changes to methodology since the last release of these estimates in 2010. The background notes of this release contain further information on understanding and using the data. Users may also find the definitions in the ‘key terms’ section useful.
The estimates in this release cover the period 1997 to 2012. Estimates for 2013 will be published in the next release of these data in November 2014. Estimates for periods before 1997 are not yet available. ONS is working to re-instate these estimates and provide users with a longer time series. A progress update on the pre-1997 estimates will be included in the November 2014 publication.
All data referred to in this bulletin are annual estimates of chained volume measures (CVM). These are time series put in real terms by computing the volume of each year in the prices of the preceding year. The data are then chained together to obtain a time series of production figures from which the effect of price changes have been removed. The CVMs in this publication are referenced to 2010. Current Price estimates are available in the tables and time series dataset.
This bulletin is split into five main sections:
Page 3 of 33
Background
Key terms
Changes to methodology
Capital stocks and consumption of fixed capital in detail
Background notes
3 . Background
Capital stocks and the consumption of fixed capital are estimated using the Perpetual Inventory Method (PIM). The PIM models capital stocks and capital consumption from estimates of gross fixed capital formation (GFCF). It is described in greater detail in the background notes of this release.
Estimates of GFCF and its breakdowns by sector and asset (from 1997) are published separately in the quarterly Business Investment Statistical Release.
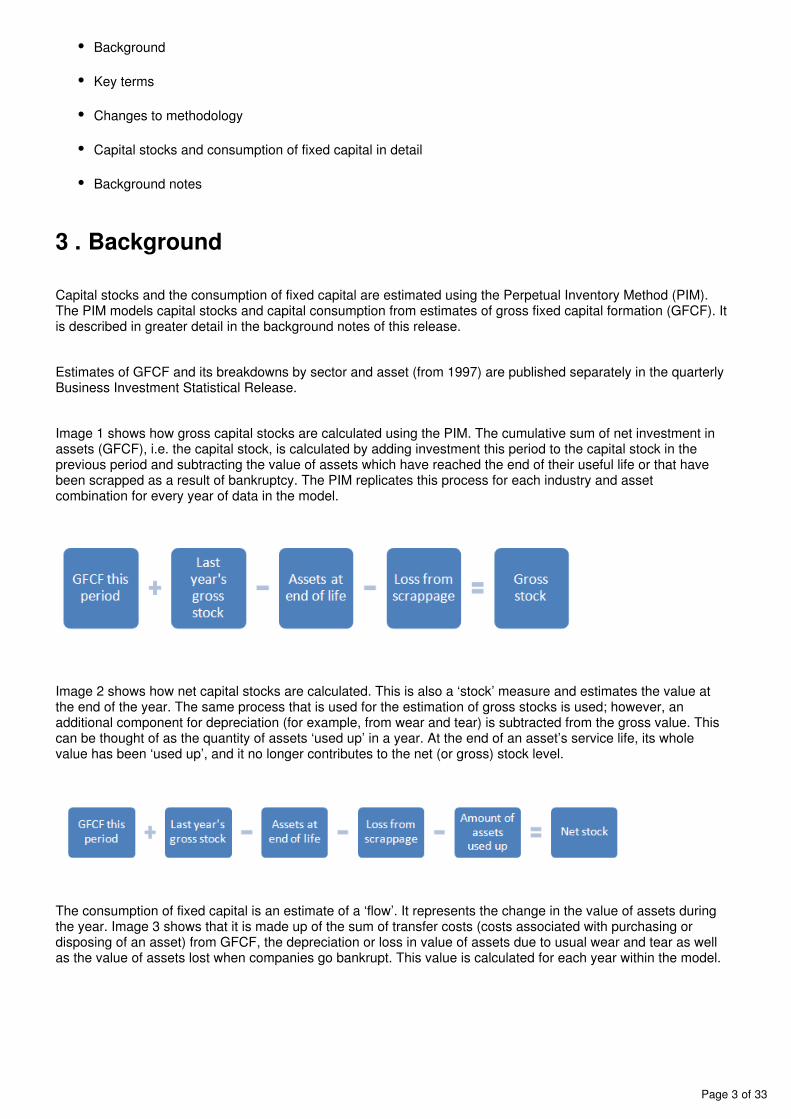
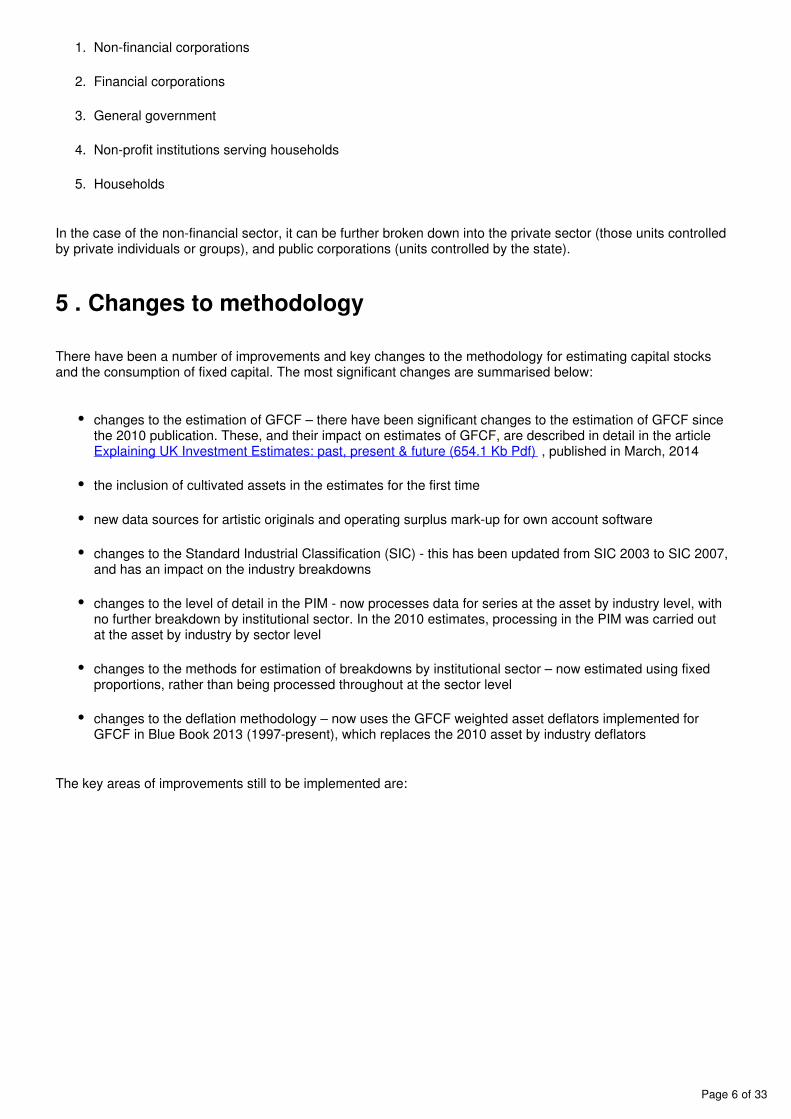
Image 1 shows how gross capital stocks are calculated using the PIM. The cumulative sum of net investment in assets (GFCF), i.e. the capital stock, is calculated by adding investment this period to the capital stock in the previous period and subtracting the value of assets which have reached the end of their useful life or that have been scrapped as a result of bankruptcy. The PIM replicates this process for each industry and asset combination for every year of data in the model.
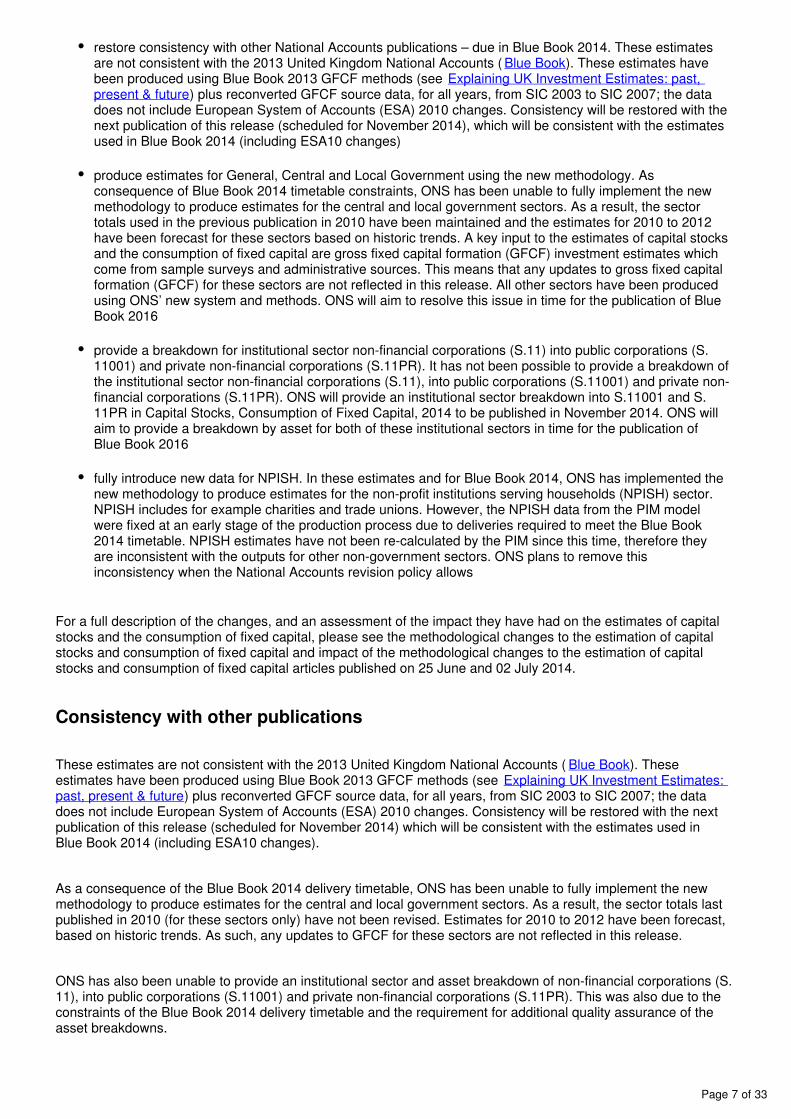
Image 2 shows how net capital stocks are calculated. This is also a ‘stock’ measure and estimates the value at the end of the year. The same process that is used for the estimation of gross stocks is used; however, an additional component for depreciation (for example, from wear and tear) is subtracted from the gross value. This can be thought of as the quantity of assets ‘used up’ in a year. At the end of an asset’s service life, its whole value has been ‘used up’, and it no longer contributes to the net (or gross) stock level.
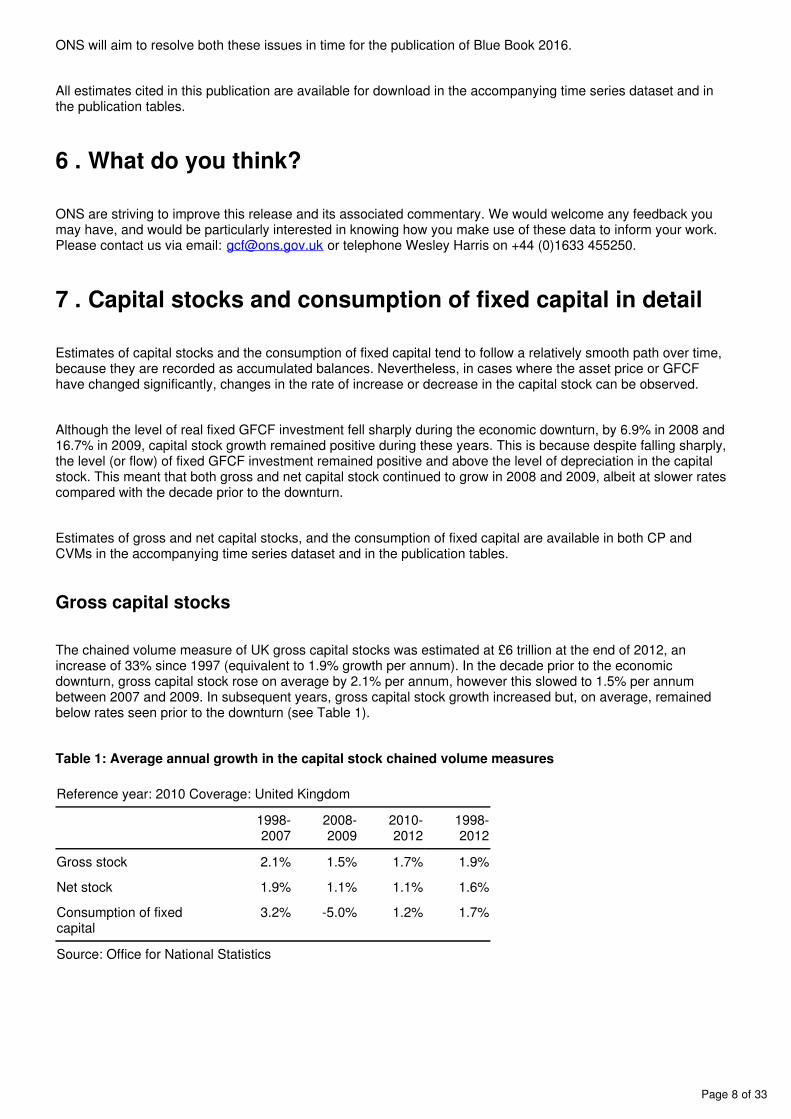
The consumption of fixed capital is an estimate of a ‘flow’. It represents the change in the value of assets during the year. Image 3 shows that it is made up of the sum of transfer costs (costs associated with purchasing or disposing of an asset) from GFCF, the depreciation or loss in value of assets due to usual wear and tear as well as the value of assets lost when companies go bankrupt. This value is calculated for each year within the model.

Page 4 of 33
Further explanations of the terms used are available in the key terms section of this release.
Capital stocks and the consumption of fixed capital estimates are produced annually and used by ONS in the compilation of the UK National and Economic Accounts and Public Sector Finances. They are also used by the Bank of England (BoE), the Office for Budgetary Responsibility (OBR), Her Majesty’s Treasury (HMT), the Department for Business, Innovation and Skills (BIS), the Statistical Office of the European Union (Eurostat), business and research communities, educational communities, the media and the general public. These estimates are used to monitor economic performance and inform monetary and fiscal policy decisions, as well as for international comparisons.
4 . Key terms
Page 5 of 33
Capital stocks represent the value of all fixed assets used in production in the economy that are still in use, such as machinery, dwellings and intangible fixed assets such as software
Economic assets are a store of value representing the benefits the economic owner will get by holding or using the asset over a period of time
Fixed assets are non-financial items which are used repeatedly in the process of production for more than one year, for example, a machine on a production line or software used in production
Gross capital stocks tell us how much the economy’s assets would cost to buy again as new, or their replacement cost. All of the fixed assets in the economy, that are still productive and in use, are added up to calculate this, regardless of how old they are or how much they may have deteriorated since they were first used. This measure shows the value at the end of the quarter or year. This is mainly calculated as an intermediate step towards net capital stocks but individually provides a broad indicator of the productive capacity of an economy
Net capital stocks show the market value of fixed assets. The market value is the amount that the assets could be sold for, which will be lower than the value of gross capital stocks. This reflects the fact that the assets will have had some wear and tear compared to a new asset. This measure shows the value at the end of the quarter or year. This measure is used in preference to gross capital stocks as it provides a valuation of assets in the economy after depreciation has been removed
The consumption of fixed capital is the decline in the value, or depreciation, of fixed assets in the economy over a time period. The decline in value can be due to wear and tear, assets no longer being used, or normal accidental damage. It can also be described as the quantity (or value) of the capital stocks which is used up in that period. Whilst these data are interesting, their primary purpose is to move from various gross measures of economic flows to the corresponding “net” variable, in particular for production and income (net domestic product, net value added) and a number of demand variables such as net investment
Gross fixed capital formation (GFCF) is the acquisition less disposals of produced fixed assets; that is assets intended for use in the production of other goods and services for a period of more than a year. Acquisition includes both purchases of assets (new or second-hand) and the construction of assets by producers for their own use. New buildings and dwellings, and major improvements to buildings and dwellings are included in GFCF, but the acquisition and disposal of existing buildings and dwellings are not
Current prices (CP), also known as nominal terms, are the value for an item expressed in terms of the prices of that period, for example the cost of a new machine bought in 1998 in 1998 prices
Constant price (KP) series have had the effects of inflation or deflation removed by fixing the prices of goods and services in one period (the base year), so that only the volumes change. For example the cost of a new machine bought in 1998 in 2009 prices
Chained volume measures (CVM) are a series of economic data from successive years put in real terms by computing the production volume for each year in the prices of the preceding year. The data are then chain linked together to obtain a time-series of production figures from which the effects of price changes (that is, monetary inflation or deflation) have been removed. In other words, a series is obtained from the raw data which reflects only the production volume
Institutional sectors are defined in the System of National Accounts (SNA) glossary as: units that are grouped together to form institutional sectors; on the basis of their principal functions, behaviour and objectives
The institutional units of the UK that make up the total economy are grouped into five mutually exclusive sectors:
Page 6 of 33
1.
2.
3.
4.
5.
Non-financial corporations
Financial corporations
General government
Non-profit institutions serving households
Households
In the case of the non-financial sector, it can be further broken down into the private sector (those units controlled by private individuals or groups), and public corporations (units controlled by the state).
5 . Changes to methodology
There have been a number of improvements and key changes to the methodology for estimating capital stocks and the consumption of fixed capital. The most significant changes are summarised below:
changes to the estimation of GFCF – there have been significant changes to the estimation of GFCF since the 2010 publication. These, and their impact on estimates of GFCF, are described in detail in the article
, published in March, 2014Explaining UK Investment Estimates: past, present & future (654.1 Kb Pdf)
the inclusion of cultivated assets in the estimates for the first time
new data sources for artistic originals and operating surplus mark-up for own account software
changes to the Standard Industrial Classification (SIC) - this has been updated from SIC 2003 to SIC 2007, and has an impact on the industry breakdowns
changes to the level of detail in the PIM - now processes data for series at the asset by industry level, with no further breakdown by institutional sector. In the 2010 estimates, processing in the PIM was carried out at the asset by industry by sector level
changes to the methods for estimation of breakdowns by institutional sector – now estimated using fixed proportions, rather than being processed throughout at the sector level
changes to the deflation methodology – now uses the GFCF weighted asset deflators implemented for GFCF in Blue Book 2013 (1997-present), which replaces the 2010 asset by industry deflators
The key areas of improvements still to be implemented are:
Page 7 of 33
restore consistency with other National Accounts publications – due in Blue Book 2014. These estimates are not consistent with the 2013 United Kingdom National Accounts ( ). These estimates have Blue Bookbeen produced using Blue Book 2013 GFCF methods (see Explaining UK Investment Estimates: past,
) plus reconverted GFCF source data, for all years, from SIC 2003 to SIC 2007; the data present & futuredoes not include European System of Accounts (ESA) 2010 changes. Consistency will be restored with the next publication of this release (scheduled for November 2014), which will be consistent with the estimates used in Blue Book 2014 (including ESA10 changes)
produce estimates for General, Central and Local Government using the new methodology. As consequence of Blue Book 2014 timetable constraints, ONS has been unable to fully implement the new methodology to produce estimates for the central and local government sectors. As a result, the sector totals used in the previous publication in 2010 have been maintained and the estimates for 2010 to 2012 have been forecast for these sectors based on historic trends. A key input to the estimates of capital stocks and the consumption of fixed capital are gross fixed capital formation (GFCF) investment estimates which come from sample surveys and administrative sources. This means that any updates to gross fixed capital formation (GFCF) for these sectors are not reflected in this release. All other sectors have been produced using ONS’ new system and methods. ONS will aim to resolve this issue in time for the publication of Blue Book 2016
provide a breakdown for institutional sector non-financial corporations (S.11) into public corporations (S.11001) and private non-financial corporations (S.11PR). It has not been possible to provide a breakdown of the institutional sector non-financial corporations (S.11), into public corporations (S.11001) and private non-financial corporations (S.11PR). ONS will provide an institutional sector breakdown into S.11001 and S.11PR in Capital Stocks, Consumption of Fixed Capital, 2014 to be published in November 2014. ONS will aim to provide a breakdown by asset for both of these institutional sectors in time for the publication of Blue Book 2016
fully introduce new data for NPISH. In these estimates and for Blue Book 2014, ONS has implemented the new methodology to produce estimates for the non-profit institutions serving households (NPISH) sector. NPISH includes for example charities and trade unions. However, the NPISH data from the PIM model were fixed at an early stage of the production process due to deliveries required to meet the Blue Book 2014 timetable. NPISH estimates have not been re-calculated by the PIM since this time, therefore they are inconsistent with the outputs for other non-government sectors. ONS plans to remove this inconsistency when the National Accounts revision policy allows
For a full description of the changes, and an assessment of the impact they have had on the estimates of capital stocks and the consumption of fixed capital, please see the methodological changes to the estimation of capital stocks and consumption of fixed capital and impact of the methodological changes to the estimation of capital stocks and consumption of fixed capital articles published on 25 June and 02 July 2014.
Consistency with other publications
These estimates are not consistent with the 2013 United Kingdom National Accounts ( ). These Blue Bookestimates have been produced using Blue Book 2013 GFCF methods (see Explaining UK Investment Estimates:
) plus reconverted GFCF source data, for all years, from SIC 2003 to SIC 2007; the data past, present & futuredoes not include European System of Accounts (ESA) 2010 changes. Consistency will be restored with the next publication of this release (scheduled for November 2014) which will be consistent with the estimates used in Blue Book 2014 (including ESA10 changes).
As a consequence of the Blue Book 2014 delivery timetable, ONS has been unable to fully implement the new methodology to produce estimates for the central and local government sectors. As a result, the sector totals last published in 2010 (for these sectors only) have not been revised. Estimates for 2010 to 2012 have been forecast, based on historic trends. As such, any updates to GFCF for these sectors are not reflected in this release.
ONS has also been unable to provide an institutional sector and asset breakdown of non-financial corporations (S.11), into public corporations (S.11001) and private non-financial corporations (S.11PR). This was also due to the constraints of the Blue Book 2014 delivery timetable and the requirement for additional quality assurance of the asset breakdowns.
Page 8 of 33
ONS will aim to resolve both these issues in time for the publication of Blue Book 2016.
All estimates cited in this publication are available for download in the accompanying time series dataset and in the publication tables.
6 . What do you think?
ONS are striving to improve this release and its associated commentary. We would welcome any feedback you may have, and would be particularly interested in knowing how you make use of these data to inform your work. Please contact us via email: or telephone Wesley Harris on +44 (0)1633 [email protected]
7 . Capital stocks and consumption of fixed capital in detail
Estimates of capital stocks and the consumption of fixed capital tend to follow a relatively smooth path over time, because they are recorded as accumulated balances. Nevertheless, in cases where the asset price or GFCF have changed significantly, changes in the rate of increase or decrease in the capital stock can be observed.
Although the level of real fixed GFCF investment fell sharply during the economic downturn, by 6.9% in 2008 and 16.7% in 2009, capital stock growth remained positive during these years. This is because despite falling sharply, the level (or flow) of fixed GFCF investment remained positive and above the level of depreciation in the capital stock. This meant that both gross and net capital stock continued to grow in 2008 and 2009, albeit at slower rates compared with the decade prior to the downturn.
Estimates of gross and net capital stocks, and the consumption of fixed capital are available in both CP and CVMs in the accompanying time series dataset and in the publication tables.
Gross capital stocks
The chained volume measure of UK gross capital stocks was estimated at £6 trillion at the end of 2012, an increase of 33% since 1997 (equivalent to 1.9% growth per annum). In the decade prior to the economic downturn, gross capital stock rose on average by 2.1% per annum, however this slowed to 1.5% per annum between 2007 and 2009. In subsequent years, gross capital stock growth increased but, on average, remained below rates seen prior to the downturn (see Table 1).
Table 1: Average annual growth in the capital stock chained volume measures
Reference year: 2010 Coverage: United Kingdom
1998-2007
2008-2009
2010-2012
1998-2012
Gross stock 2.1% 1.5% 1.7% 1.9%
Net stock 1.9% 1.1% 1.1% 1.6%
Consumption of fixed capital
3.2% -5.0% 1.2% 1.7%
Source: Office for National Statistics
Page 9 of 33
Net capital stocks
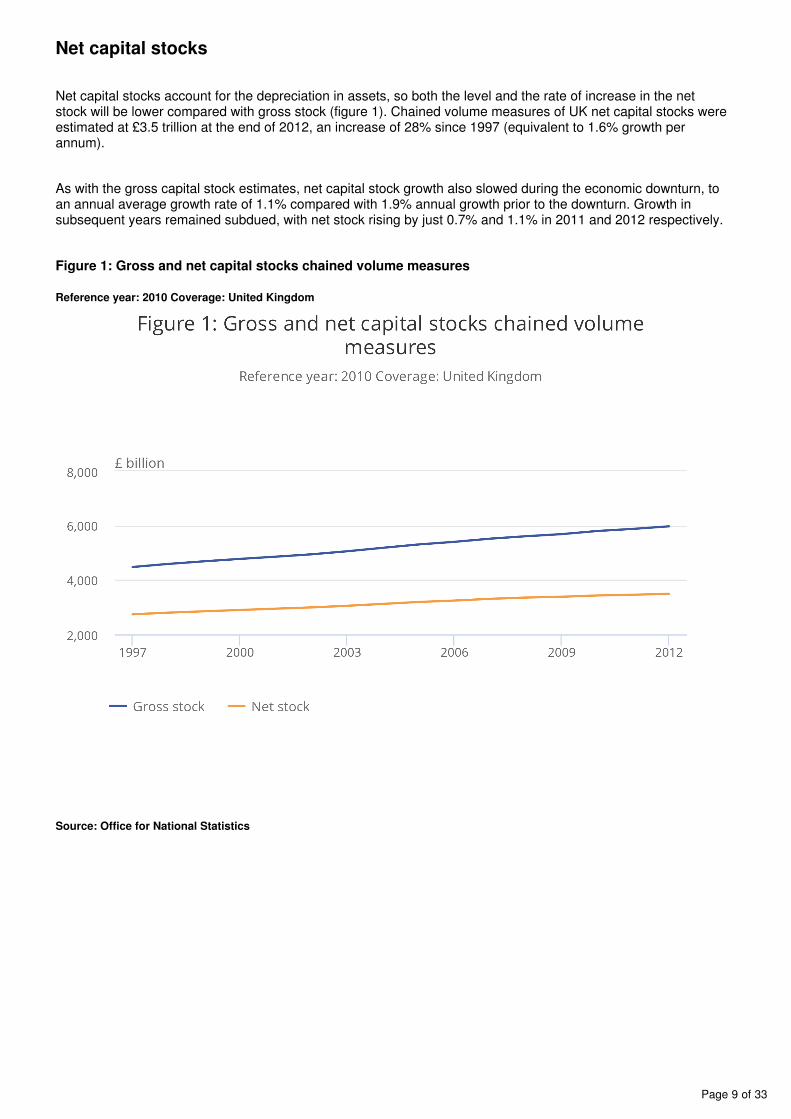
Net capital stocks account for the depreciation in assets, so both the level and the rate of increase in the net stock will be lower compared with gross stock (figure 1). Chained volume measures of UK net capital stocks were estimated at £3.5 trillion at the end of 2012, an increase of 28% since 1997 (equivalent to 1.6% growth per annum).
As with the gross capital stock estimates, net capital stock growth also slowed during the economic downturn, to an annual average growth rate of 1.1% compared with 1.9% annual growth prior to the downturn. Growth in subsequent years remained subdued, with net stock rising by just 0.7% and 1.1% in 2011 and 2012 respectively.
Figure 1: Gross and net capital stocks chained volume measures
Reference year: 2010 Coverage: United Kingdom
Source: Office for National Statistics
Page 10 of 33
Consumption of fixed capital
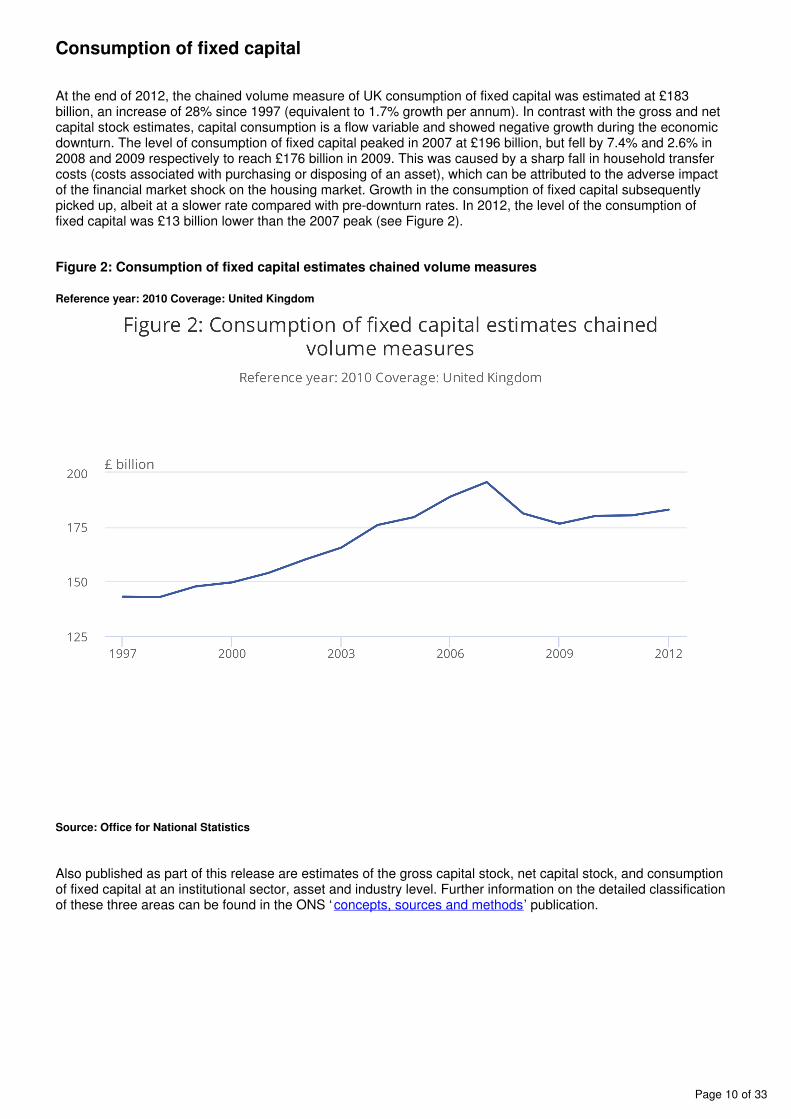
At the end of 2012, the chained volume measure of UK consumption of fixed capital was estimated at £183 billion, an increase of 28% since 1997 (equivalent to 1.7% growth per annum). In contrast with the gross and net capital stock estimates, capital consumption is a flow variable and showed negative growth during the economic downturn. The level of consumption of fixed capital peaked in 2007 at £196 billion, but fell by 7.4% and 2.6% in 2008 and 2009 respectively to reach £176 billion in 2009. This was caused by a sharp fall in household transfer costs (costs associated with purchasing or disposing of an asset), which can be attributed to the adverse impact of the financial market shock on the housing market. Growth in the consumption of fixed capital subsequently picked up, albeit at a slower rate compared with pre-downturn rates. In 2012, the level of the consumption of fixed capital was £13 billion lower than the 2007 peak (see Figure 2).
Figure 2: Consumption of fixed capital estimates chained volume measures
Reference year: 2010 Coverage: United Kingdom
Source: Office for National Statistics
Also published as part of this release are estimates of the gross capital stock, net capital stock, and consumption of fixed capital at an institutional sector, asset and industry level. Further information on the detailed classification of these three areas can be found in the ONS ‘ ’ publication.concepts, sources and methods
Page 11 of 33
8 . Analysis by institutional sector
The percentage share of net capital stocks owned by the institutional sectors remained relatively stable between 1997 and 2012 in CVM terms. The net capital stocks estimates have been used for this analysis because it is a measure of the market value of fixed assets, that is, what these assets were worth at the time. Users will notice a large change in estimates of ‘other machinery and equipment’, in non-financial corporations (S.11) and central government (S.13) in 2005. This was due to the reclassification of British Nuclear Fuels Limited (BNFL) in April 2005 - more information is available in the background notes.
At the end of 2012, non-financial corporations (NFCs) were estimated to have held the largest share of total net capital stock at £1.5 trillion (43%), followed by the households and non-profit institutions serving households (NPISH) sector which held an estimated £1.3 trillion (38%) of assets.
Within this, NFCs held the largest number of assets in ‘other buildings and structures’, at £805 billion (54% of total net capital stock held by NFCs). Households and NPISH primarily held assets in dwellings (excluding land) at £1.3 trillion (96% of total net capital stock held by households).
Page 12 of 33
1.
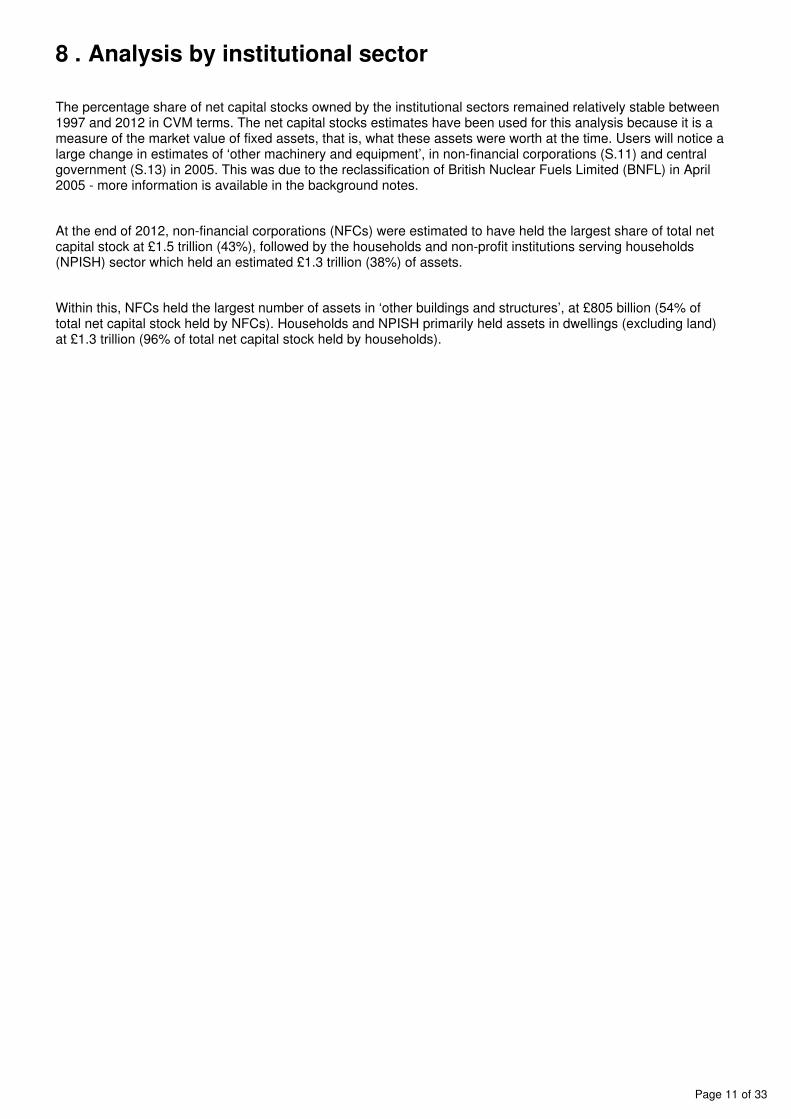
Figure 3: Net capital stocks by institutional sector, 1997 and 2012, chained volume measures
Reference year: 2010 Coverage: United Kingdom
Source: Office for National Statistics
Notes:
(a) NPISH stands for non-profit institutions serving households, such as universities and charities. (b) General Government (i.e. Central and Local Government) sectors have been forecast based on historic trends, any updates to GFCF for these sectors are not reflected in the estimates in this release – see changes to methodology section for further details
Figure 3 and Table 2 show that all institutional sectors experienced growth in net capital stocks between 1997 and 2012, albeit at different rates. In percentage terms, general government experienced the strongest growth at 56% (equivalent to 3.0% per annum), followed by NFCs at 27% (equivalent to 1.6% per annum) and financial corporations, which rose by 24% (an increase of 1.5% per annum). Households and NPISH increased by 19%, or 1.2% per annum.
Table 2 shows that the economic downturn affected the growth of net capital stock to varying degrees by institutional sectors. For example, growth in net capital stock held by financial corporations was adversely affected by the downturn, falling from 2.0% per annum in the pre-downturn decade, to 0.8% in 2008 and 2009 before falling again to just 0.3% on average in subsequent years. In contrast, growth in net capital stock held by general government remained stable during the downturn at 2.6%, before rising strongly in subsequent years.
Page 13 of 33
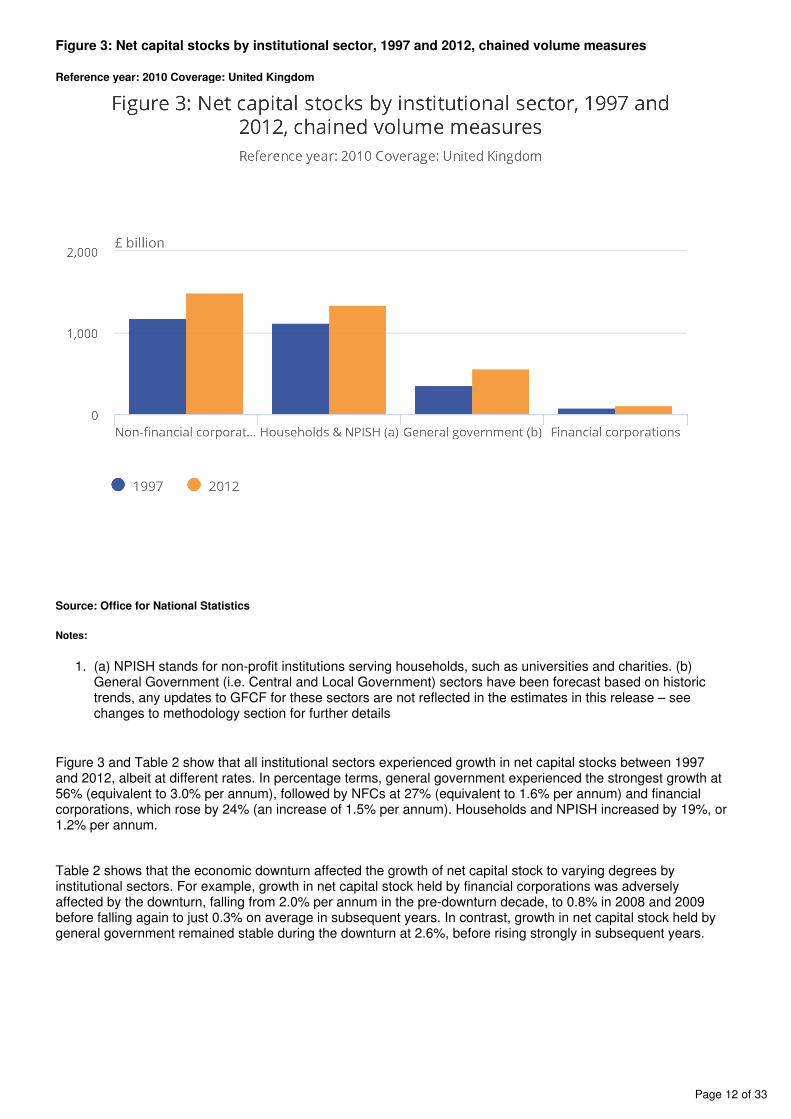
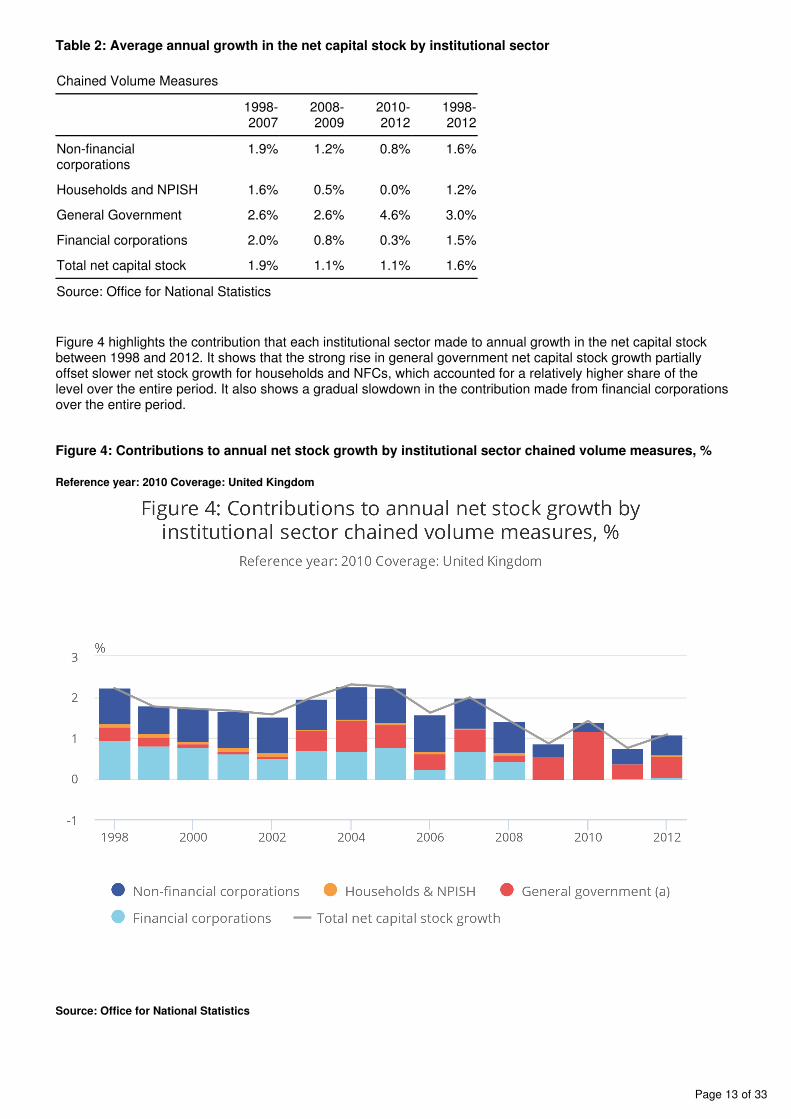
Table 2: Average annual growth in the net capital stock by institutional sector
Chained Volume Measures
1998-2007
2008-2009
2010-2012
1998-2012
Non-financial corporations
1.9% 1.2% 0.8% 1.6%
Households and NPISH 1.6% 0.5% 0.0% 1.2%
General Government 2.6% 2.6% 4.6% 3.0%
Financial corporations 2.0% 0.8% 0.3% 1.5%
Total net capital stock 1.9% 1.1% 1.1% 1.6%
Source: Office for National Statistics
Figure 4 highlights the contribution that each institutional sector made to annual growth in the net capital stock between 1998 and 2012. It shows that the strong rise in general government net capital stock growth partially offset slower net stock growth for households and NFCs, which accounted for a relatively higher share of the level over the entire period. It also shows a gradual slowdown in the contribution made from financial corporations over the entire period.
Figure 4: Contributions to annual net stock growth by institutional sector chained volume measures, %
Reference year: 2010 Coverage: United Kingdom
Source: Office for National Statistics

Page 14 of 33
1.
9 . Analysis by type of asset
Figure 5 shows that ‘dwellings’ accounted for the largest share of assets in 2012, at £1.4 trillion (41.2% of the total net capital stocks in 2012). ‘Other buildings and structures’ accounted for the second largest share at 37.8% (£1.3 trillion in 2012), while ‘other machinery and equipment’, ‘intangible fixed assets’ and ‘other assets’ follow with 15.1%, 3.3% and 2.7% respectively.
Figure 5: Net capital stocks estimates by asset, 1997 and 2012, chained volume measures
Reference year: 2010 Coverage: United Kingdom
Source: Office for National Statistics
Notes:
(a) Intangible fixed assets include software, entertainment and mineral exploration. (b) Other assets includes transport equipment and cultivated assets
Figure 5 and Table 3 show that net capital stocks of ‘intangible fixed assets’ were the only assets to decrease between 1997 and 2012, falling by 2% per annum on average over the entire period. The asset that experienced the strongest growth was ‘other machinery and equipment’, which increased by 50% over the entire period (or 2.7% per annum), followed by ‘other buildings and structures’, which increased by 42% since 1997 (2.4% per annum).

Page 15 of 33
Table 3 shows that the economic downturn affected the pace of net capital stock accumulation by varying amounts across assets. For example, ‘other buildings and structures’ rose at broadly similar rates across the pre-downturn (2.4%), downturn (2.4%), and post-downturn (2.5%) periods. In contrast, ‘other machinery and equipment’ growth fell to 1.0% and 0.8% during the downturn and in subsequent years, compared with 3.7% average annual growth in the pre-downturn decade.
Table 3: Average annual growth in net capital stock by asset
Chained Volume Measures (CVM)
1998-2007
2008-2009
2010-2012
1998-2012
Dwellings 1.4% 0.5% 0.2% 1.0%
Other buildings and structures 2.4% 2.4% 2.5% 2.4%
Other machinery and equipment
3.7% 1.0% 0.8% 2.7%
Intangible fixed assets -2.0% -2.5% -1.8% -2.0%
Other assets 1.6% -0.7% 0.0% 1.0%
Total net stock 1.9% 1.1% 1.1% 1.6%
Source: Office for National Statistics
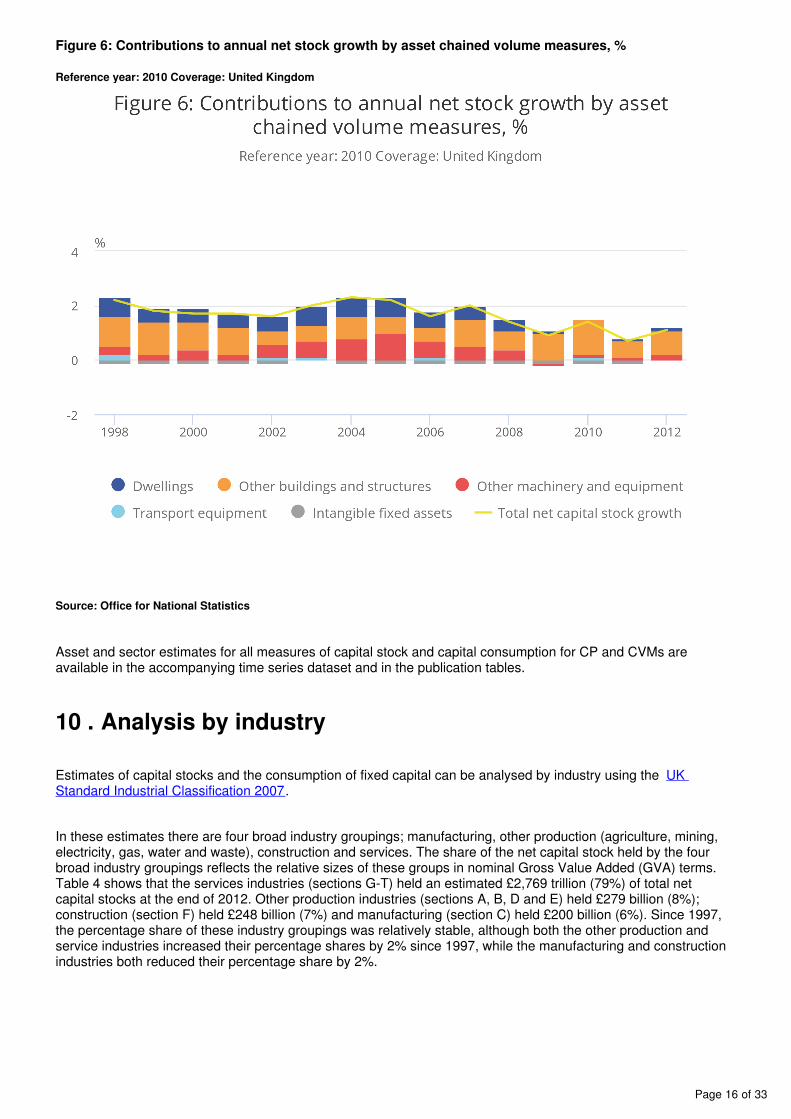
Figure 6 decomposes annual net capital stock growth between 1998 and 2012, according to the contribution made from the headline assets cited in Table 3. The largest growth in net capital stock between 1998 and 2012 was in ‘other machinery and equipment’ (2.7%) and ‘other buildings and structures’ (2.4%). This reflected relatively strong growth in both assets and the relatively large share of ‘other buildings and structures’. ‘Intangible fixed assets’ showed a consistently negative contribution to growth. During the economic downturn, ‘other buildings and structures’ continued to make strong positive contributions to annual growth, while the contributions from ‘other machinery and equipment’ and ‘dwellings’ fell and have not increased since.
Page 16 of 33
Figure 6: Contributions to annual net stock growth by asset chained volume measures, %
Reference year: 2010 Coverage: United Kingdom
Source: Office for National Statistics
Asset and sector estimates for all measures of capital stock and capital consumption for CP and CVMs are available in the accompanying time series dataset and in the publication tables.
10 . Analysis by industry
Estimates of capital stocks and the consumption of fixed capital can be analysed by industry using the UK .Standard Industrial Classification 2007
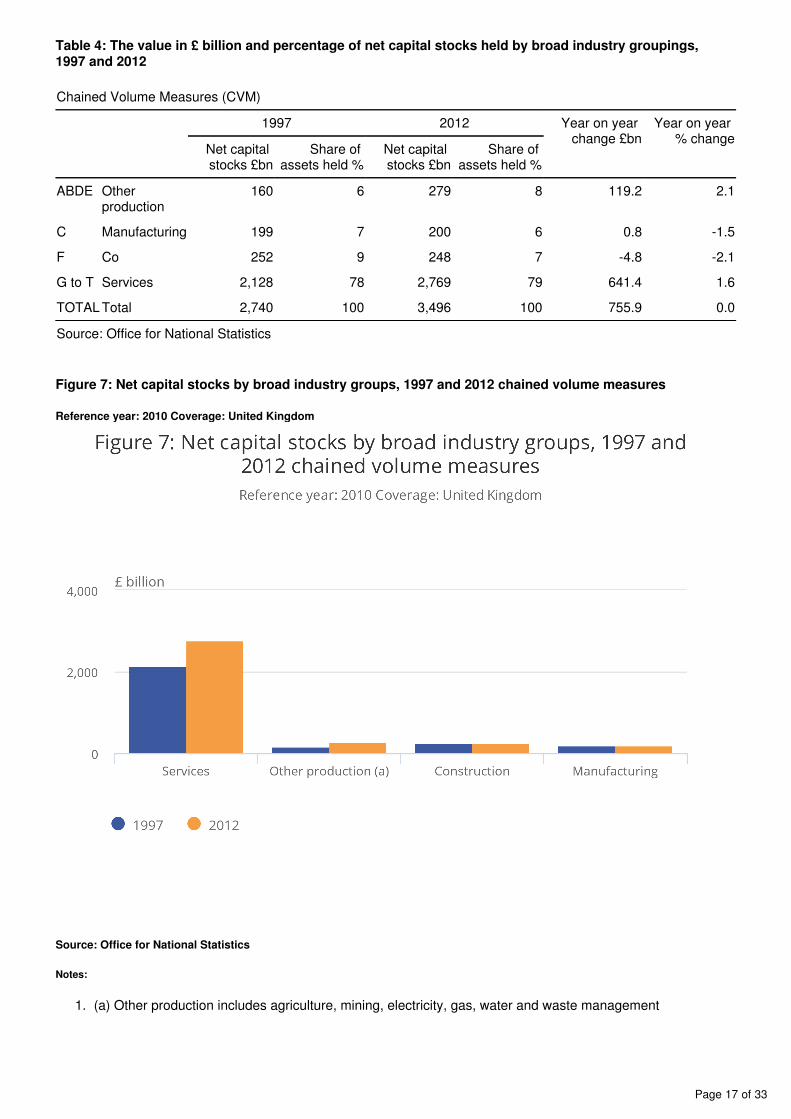
In these estimates there are four broad industry groupings; manufacturing, other production (agriculture, mining, electricity, gas, water and waste), construction and services. The share of the net capital stock held by the four broad industry groupings reflects the relative sizes of these groups in nominal Gross Value Added (GVA) terms. Table 4 shows that the services industries (sections G-T) held an estimated £2,769 trillion (79%) of total net capital stocks at the end of 2012. Other production industries (sections A, B, D and E) held £279 billion (8%); construction (section F) held £248 billion (7%) and manufacturing (section C) held £200 billion (6%). Since 1997, the percentage share of these industry groupings was relatively stable, although both the other production and service industries increased their percentage shares by 2% since 1997, while the manufacturing and construction industries both reduced their percentage share by 2%.
Page 17 of 33
1.
Table 4: The value in £ billion and percentage of net capital stocks held by broad industry groupings, 1997 and 2012
Chained Volume Measures (CVM)
1997 2012 Year on year change £bn
Year on year % change
Net capital stocks £bn
Share of assets held %
Net capital stocks £bn
Share of assets held %
ABDE Other production
160 6 279 8 119.2 2.1
C Manufacturing 199 7 200 6 0.8 -1.5
F Co 252 9 248 7 -4.8 -2.1
G to T Services 2,128 78 2,769 79 641.4 1.6
TOTAL Total 2,740 100 3,496 100 755.9 0.0
Source: Office for National Statistics
Figure 7: Net capital stocks by broad industry groups, 1997 and 2012 chained volume measures
Reference year: 2010 Coverage: United Kingdom
Source: Office for National Statistics
Notes:
(a) Other production includes agriculture, mining, electricity, gas, water and waste management
Page 18 of 33
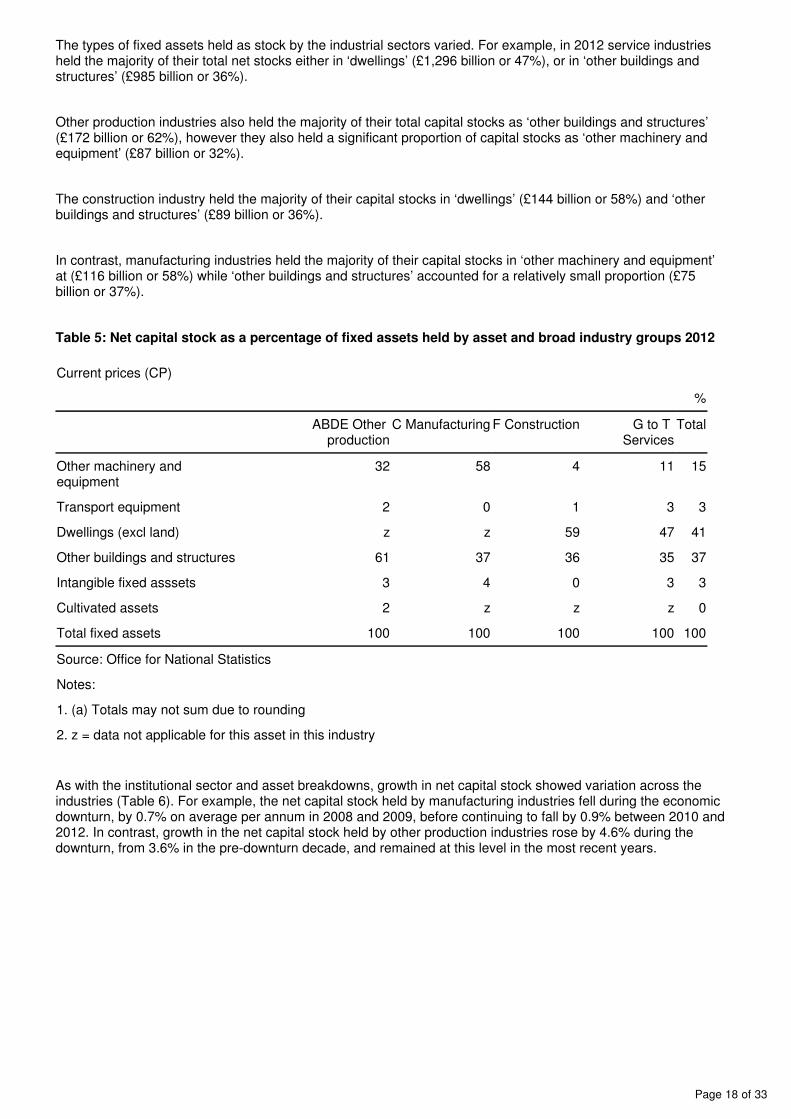
The types of fixed assets held as stock by the industrial sectors varied. For example, in 2012 service industries held the majority of their total net stocks either in ‘dwellings’ (£1,296 billion or 47%), or in ‘other buildings and structures’ (£985 billion or 36%).
Other production industries also held the majority of their total capital stocks as ‘other buildings and structures’ (£172 billion or 62%), however they also held a significant proportion of capital stocks as ‘other machinery and equipment’ (£87 billion or 32%).
The construction industry held the majority of their capital stocks in ‘dwellings’ (£144 billion or 58%) and ‘other buildings and structures’ (£89 billion or 36%).
In contrast, manufacturing industries held the majority of their capital stocks in ‘other machinery and equipment’ at (£116 billion or 58%) while ‘other buildings and structures’ accounted for a relatively small proportion (£75 billion or 37%).
Table 5: Net capital stock as a percentage of fixed assets held by asset and broad industry groups 2012
Current prices (CP)
%
ABDE Other production
C Manufacturing F Construction G to T Services
Total
Other machinery and equipment
32 58 4 11 15
Transport equipment 2 0 1 3 3
Dwellings (excl land) z z 59 47 41
Other buildings and structures 61 37 36 35 37
Intangible fixed asssets 3 4 0 3 3
Cultivated assets 2 z z z 0
Total fixed assets 100 100 100 100 100
Source: Office for National Statistics
Notes:
1. (a) Totals may not sum due to rounding
2. z = data not applicable for this asset in this industry
As with the institutional sector and asset breakdowns, growth in net capital stock showed variation across the industries (Table 6). For example, the net capital stock held by manufacturing industries fell during the economic downturn, by 0.7% on average per annum in 2008 and 2009, before continuing to fall by 0.9% between 2010 and 2012. In contrast, growth in the net capital stock held by other production industries rose by 4.6% during the downturn, from 3.6% in the pre-downturn decade, and remained at this level in the most recent years.
Page 19 of 33
Table 6: Average annual growth in net capital stock by industry
Chained Volume Measures (CVM)
Net stock by industry (CVM)
1998-2007
2008-2009
2010-2012
1998-2012
Manufacturing 0.5% -0.7% -0.9% 0.0%
Other production 3.6% 4.6% 3.9% 3.8%
Construction 0.3% -0.8% -1.0% -0.1%
Services 2.1% 1.2% 1.2% 1.8%
Total net stock 1.9% 1.1% 1.1% 1.6%
Source: Office for National Statistics
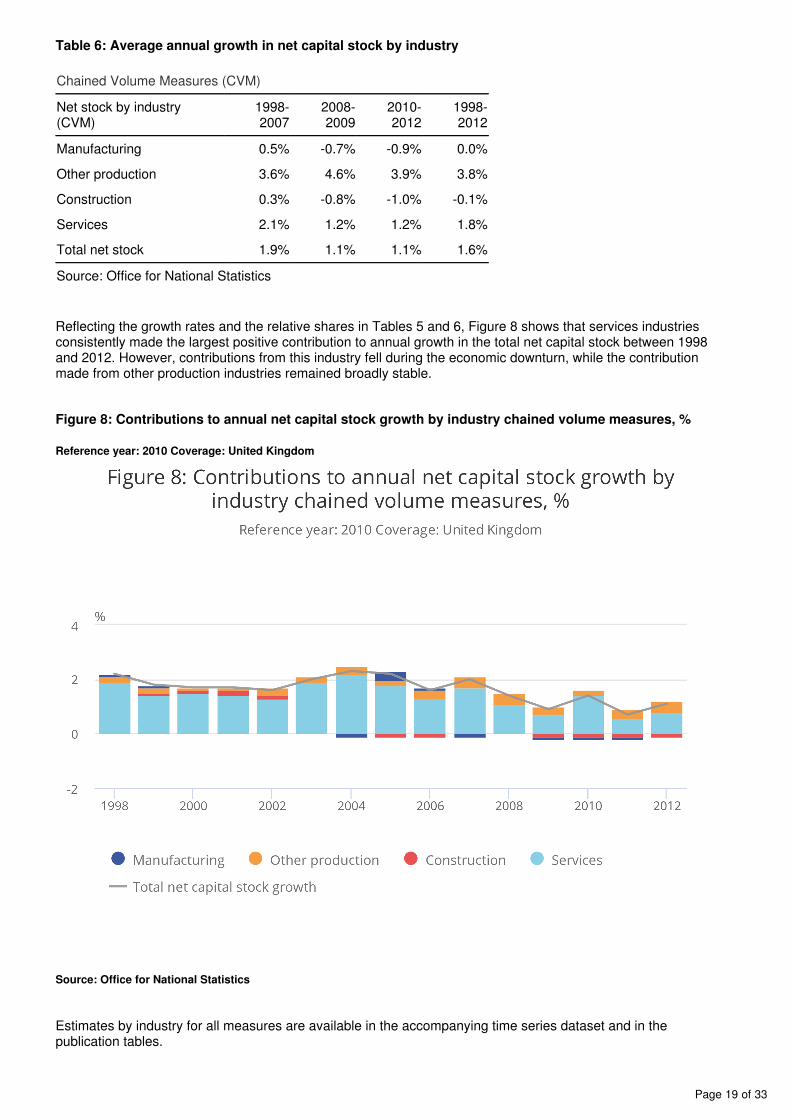
Reflecting the growth rates and the relative shares in Tables 5 and 6, Figure 8 shows that services industries consistently made the largest positive contribution to annual growth in the total net capital stock between 1998 and 2012. However, contributions from this industry fell during the economic downturn, while the contribution made from other production industries remained broadly stable.
Figure 8: Contributions to annual net capital stock growth by industry chained volume measures, %
Reference year: 2010 Coverage: United Kingdom
Source: Office for National Statistics
Estimates by industry for all measures are available in the accompanying time series dataset and in the publication tables.
Page 20 of 33
11 . Capital output ratio analysis
The capital output ratio is calculated by dividing capital stocks estimates by Gross Value Added (GVA), to obtain a measure of the capital intensity of each industry. GVA is the value of output less the value of intermediate consumption; it is a measure of the contribution to Gross Domestic Production (GDP) made by an individual producer, industry or sector. Intermediate consumption consists of the value of the goods and services consumed as inputs by the process of production, excluding fixed assets whose consumption are recorded as consumption of fixed capital; the goods or services may be either transformed or used up by the production process.
The capital output ratio shows the ratio of capital stocks to output. It has been calculated for gross and net capital stocks measures in the publication tables back to 1997.
All else being equal, if there is a higher level of capital stock in the economy; workers should theoretically be able to produce a greater quantity or quality of output using the same quantity of labour input. Thus, higher level of productivity arises because workers have more, or better tools or facilities at their disposal.
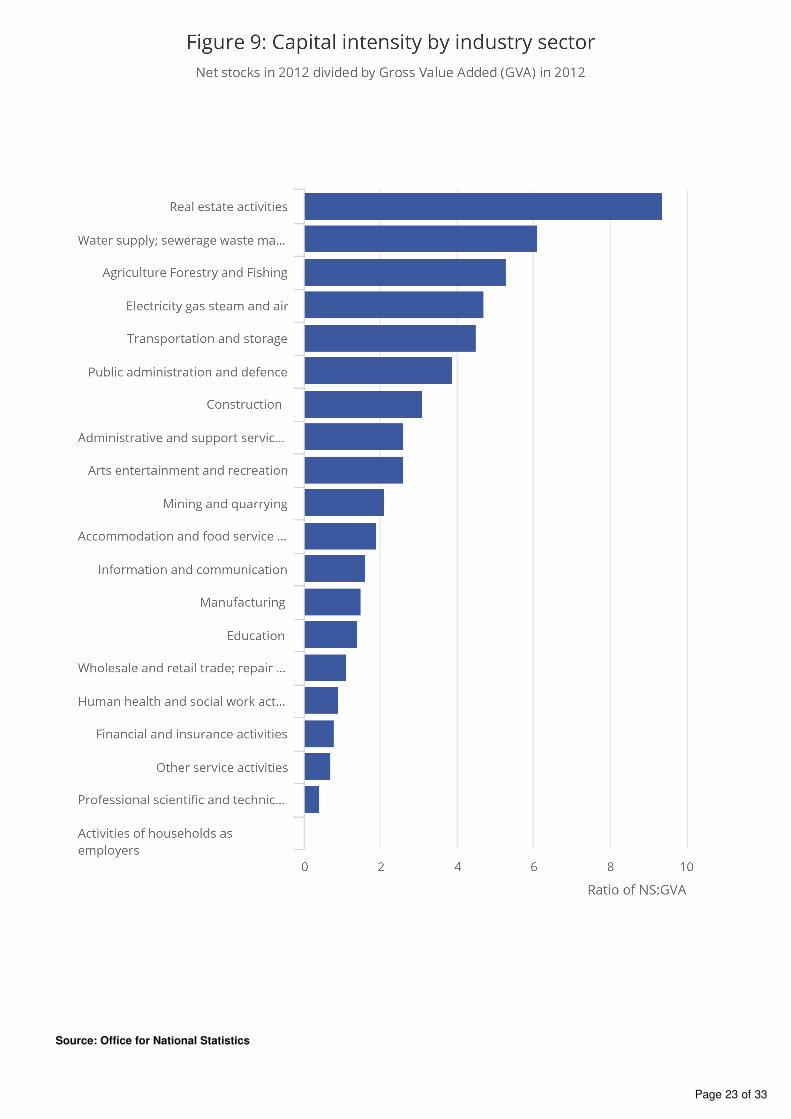
Figure 9 shows that using this measure, the most ‘capital intensive’ industry in 2012 was the real estate industry, which held the vast majority of its assets in dwellings. Manufacturing, construction and utilities industries also showed relatively high levels of ‘capital intensity’ (of which a smaller proportion of this can be attributed to dwellings). In contrast, other professional and government services industries showed smaller rates of capital intensity.

Page 21 of 33
Page 22 of 33
Figure 9: Capital intensity by industry sector
Net stocks in 2012 divided by Gross Value Added (GVA) in 2012
Page 23 of 33
Source: Office for National Statistics

Page 24 of 33
1.
Industries have different levels of capital output ratios over time, as shown in Figure 10, which indexes the aforementioned ratios to 2010=100. An increase in a line shows that the capital output ratio has increased. Construction and manufacturing rose sharply in their intensity in 2008; this was because the level of GVA fell during this period while the capital stock continued to grow.
Figure 10: Net capital stocks to output ratio, chained volume measures
ratio of net stock (NS): Gross Value Added (GVA)
Source: Office for National Statistics
Notes:
Index 2010=100
Capital output ratio estimates by industry for all measures are available in the accompanying time series dataset and in publication tables.
12 . Net capital stocks per employed person
In this release, ONS have also published data for the level of capital stock per employed person. Net capital stocks are used in this calculation because they provide a better estimate of the value of capital stocks at a point in time than gross stocks. Data on employment includes both employees and the self-employed by industry sector, sourced from table of the ONS , May 2014.EMP14 (262.5 Kb Excel sheet) Labour Market Statistics

Page 25 of 33
Figure 11 shows the annual growth in capital stock per employee from 1998 to 2012. Between 2008 and 2009 there were sharp rises, reflecting a sharp fall in employees, which more than offset slower capital stock growth during this period. In the most recent years, this ratio rose at a slower rate and even fell in 2012. This suggested that firms were diverting resources away from capital and more into labour inputs. This is explored further in the
published alongside this bulletin.July 2014 Economic Review
Figure 11: Year on year growth in net capital stock per employed person
% change in capital per employed person
Source: Office for National Statistics
Capital stocks per employed person estimates by industry for gross and net stocks are available in the accompanying time series dataset and in publication tables.
13 . International comparisons
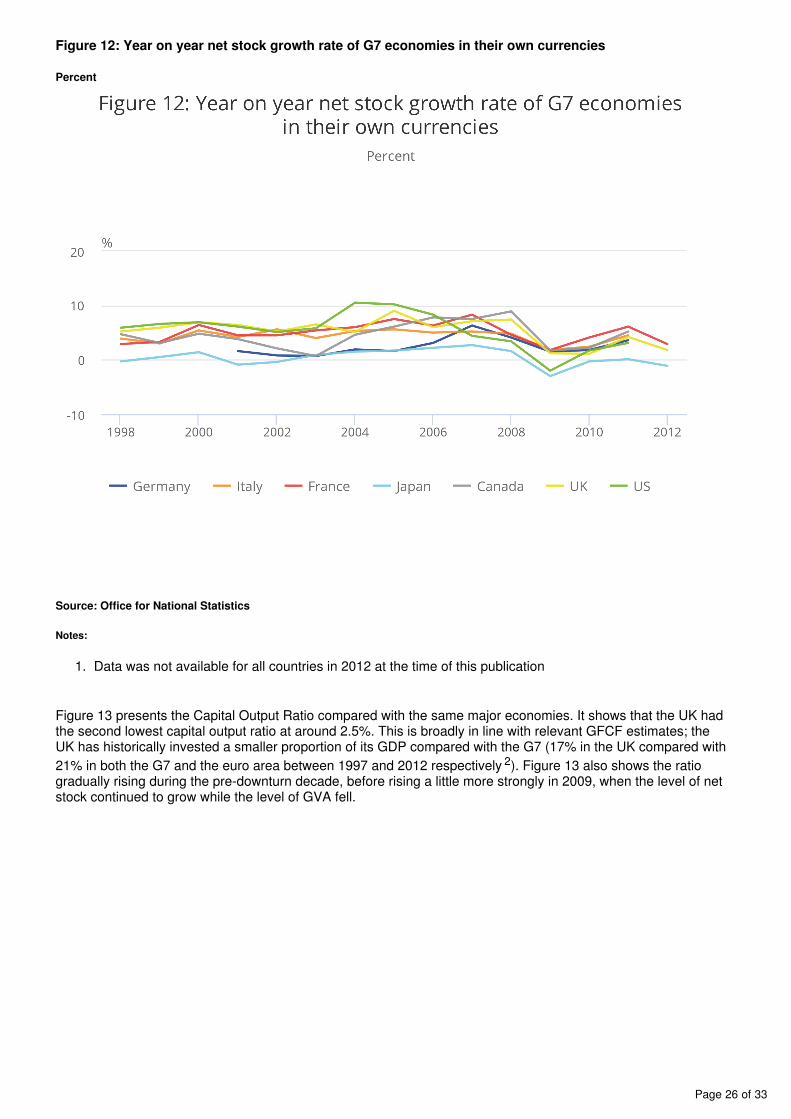
Broadly speaking, net capital stock has moved in line with the UK’s major counterparts, in terms of both annual growth and capital output shares. This can be seen in figure 12, which plots the UK year on year net capital stock
growth rate compared with other members of the G7 . The UK has among the highest rates of net capital stock 1
growth across the G7, and is broadly comparable to France. Figure 12 also shows that growth in the net capital stock fell noticeably across all G7 economies during the economic downturn, recovering somewhat in 2010 and 2011 before falling again in 2012 (estimates for 2012 are not currently available for all countries). The latter could have been attributed to renewed economic uncertainty in the euro area.
Page 26 of 33
1.
Figure 12: Year on year net stock growth rate of G7 economies in their own currencies
Percent
Source: Office for National Statistics
Notes:
Data was not available for all countries in 2012 at the time of this publication
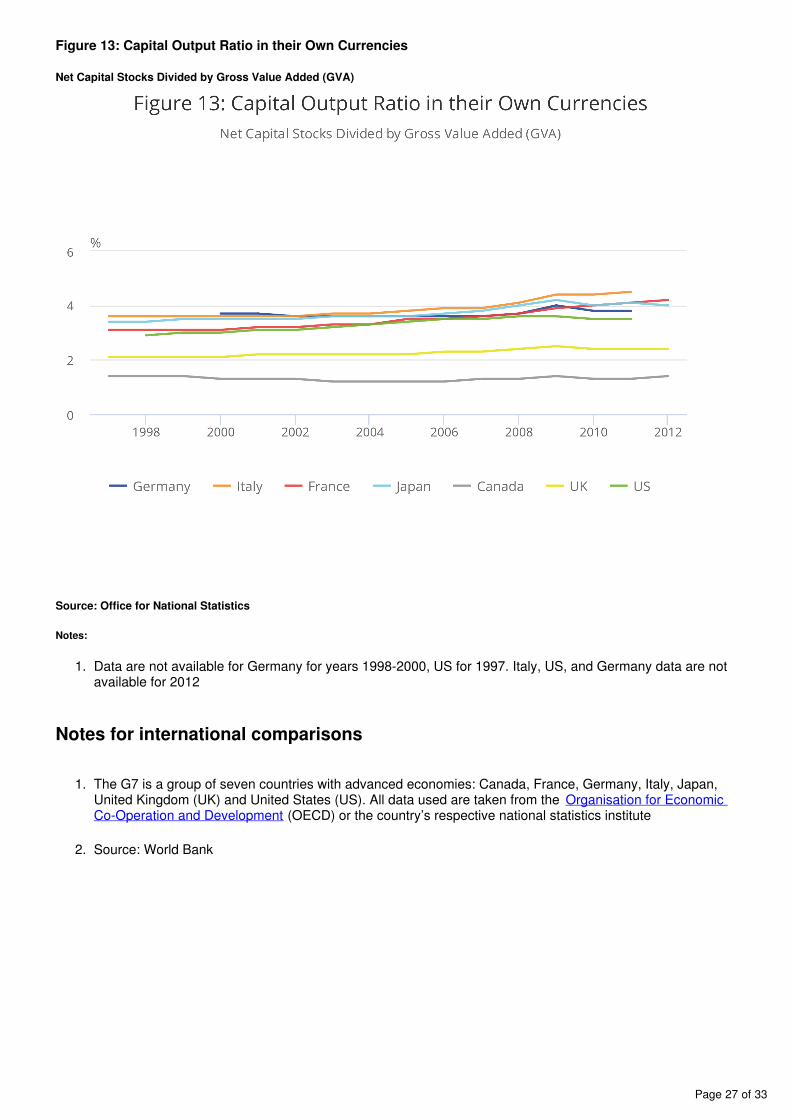
Figure 13 presents the Capital Output Ratio compared with the same major economies. It shows that the UK had the second lowest capital output ratio at around 2.5%. This is broadly in line with relevant GFCF estimates; the UK has historically invested a smaller proportion of its GDP compared with the G7 (17% in the UK compared with
21% in both the G7 and the euro area between 1997 and 2012 respectively ). Figure 13 also shows the ratio 2
gradually rising during the pre-downturn decade, before rising a little more strongly in 2009, when the level of net stock continued to grow while the level of GVA fell.
Page 27 of 33
1.
1.
2.
Figure 13: Capital Output Ratio in their Own Currencies
Net Capital Stocks Divided by Gross Value Added (GVA)
Source: Office for National Statistics
Notes:
Data are not available for Germany for years 1998-2000, US for 1997. Italy, US, and Germany data are not available for 2012
Notes for international comparisons
The G7 is a group of seven countries with advanced economies: Canada, France, Germany, Italy, Japan, United Kingdom (UK) and United States (US). All data used are taken from the Organisation for Economic
(OECD) or the country’s respective national statistics instituteCo-Operation and Development
Source: World Bank
Page 28 of 33
1.
2.
3.
14. Background notes
Important information for users
These estimates are not consistent with the 2013 United Kingdom National Accounts ( ). These Blue Bookestimates have been produced using Blue Book 2013 GFCF methods (see Explaining UK Investment
) plus reconverted GFCF source data, for all years, from SIC 2003 to SIC Estimates: past, present & future2007; the data do not includes European System of Accounts (ESA) 2010 changes. Consistency will be restored with the next publication of this release (scheduled for November 2014) which will be consistent with the estimates used in Blue Book 2014 (including ESA10 changes).
The series in this release cover the period 1997 to 2012. Estimates for 2013 will be published in the next release in November 2014. Estimates for periods before 1997 are not yet available. ONS will be working to re-instate these estimates and provide users with a longer time series. An update on progress on pre-1997 estimates will be included in the November 2014 publication.
Revisions
There are revisions to the estimates for 1997 to 2009, this is not in line with the National Accounts revisions policy. This is the result of the introduction of new methods and more up-to-date GFCF estimates being available since the last publication in 2010. This publication will rejoin the usual National Accounts Revision Policy for Blue Book 2014.
A full explanation of the National Accounts revisions policy is available on the .ONS website (43.3 Kb Pdf)
Use of the data
Capital stocks and the consumption of fixed capital estimates are produced annually and used internally by ONS in the UK National and Economic Accounts and Public Sector Finances. They are also used externally by the Bank of England, the Office for Budgetary Responsibility, Her Majesty’s Treasury, the Statistical Office of the European Communities (EUROSTAT), business and research communities, educational communities, the media and the general public. These estimates are used to monitor economic performance and inform monetary and fiscal policy decisions, as well as for international comparisons.
The consumption of fixed capital is used in various ways in the National Accounts, in particular:
a) For all sectors, consumption of fixed capital is used to convert the gross-based estimates, such as gross domestic product or gross operating surplus, into the net estimates such as net national income.
b) For the non-market sectors (central and local government, and non-profit institutions serving households) consumption of fixed capital forms part of the sectors’ contributions to the economy as measured using gross value added, and is the only component of gross operating surplus for these sectors, leaving the net operating surplus as zero.
Additionally, capital stocks and capital consumption estimates are also used in the calculation of quarterly profitability estimates of UK companies.
Page 29 of 33
4. Methods
The aims of the Quality and Methodology Information (QMI) report are to provide users with a greater understanding of ONS’ statistics, their quality and the methods that are used to create them. A Quality and
report for this publication can be found on the ONS website; Methodology Information (88.9 Kb Pdf)however the methods used to compile these estimates have changed significantly since it was last updated. This bulletin and the articles that accompany it, provide an updated description of the methods and sources. ONS aims to update the QMI report ahead of the next publication in November 2014.
Estimates of capital stocks and consumption of fixed capital are now produced using a new methodology, as explained in the methodological changes to the estimation of capital stocks and consumption of fixed capital and impact of the methodological changes to the estimation of capital stocks and consumption of fixed capital articles published in June and July 2014.
Estimates of capital stocks are calculated using the Perpetual Inventory Method (PIM).
Data sources
The input data for the PIM system are provided at a low level of aggregation with industries classified using the 2007 version of the Standard Industrial Classification (SIC2007). The main input data sets entering the PIM model are given below.
i) GFCF (investment) data
The PIM uses a long run constant price time series of GFCF estimates (investment in capital assets) classified by SIC2007 industries. The series extend as far back as the nineteenth century for some long-lived assets such as buildings and dwellings. The PIM system uses constant price investment data based at 2010 prices.
Estimates of GFCF and its breakdowns by sector and asset (from 1997) are published separately in the quarterly .Business Investment Statistical Release
ii) Price indices (deflators)
The capital stocks system uses, from 1997 onwards, the same deflators used to deflate GFCF; prior to 1997 consistent deflators are used. The GFCF asset deflators are constructed from product based Producer Price Indices (PPIs), Services Producer Price Indices (SPPIs), construction price indices and some Gross Domestic Product (GDP) implied deflators. The product-based deflators are weighted to assets using estimates from ONS’ annual Business Spending on Capital Items Survey (BCIS). BCIS collects detailed data on GFCF by product, which informs the weight of each product in each asset. A list of the deflators used for each asset, and their source, is given in Table 6. The same deflator is used for each asset, regardless of the industry it is in. ONS is planning a full review of the GFCF deflators, as part of the
.national accounts programme of continuous improvement
iii) Life lengths and premature scrapping
Each asset is assumed to have a life length during which it is economically productive. This will differ between assets with buildings typically having a longer life length than computer software for example.
Bankruptcy series are used in the PIM to model firm closures, and it is assumed that half the plant assets of insolvent firms are prematurely scrapped. Bankruptcy data are provided to the ONS by the UK’s Insolvency Service on an annual basis.
iv) Other data
Retirements of assets are assumed to be normally distributed around the mean asset life length. That is, not all of the stocks of an asset which lasts five years, for example, are assumed to leave the PIM after five years – rather, the retirements are spread around this date. To model this, the parameters for the distribution of asset retirements are entered into the PIM. This is called the coefficient of variation for each asset.
Understanding the data: Perpetual Inventory Method (PIM)
A PIM is an economic model that enables balance sheets (or stocks) to be calculated from the associated flows. In this case, the PIM uses GFCF estimates to model the value of capital stocks in use in the UK. Assumptions about the life of these capital stocks are used to ensure that they are withdrawn from the
Page 30 of 33
model when they are no longer economically useful.
For estimates of consumption of fixed capital and net capital stocks, assets are written down (i.e. decrease in value) over their lifetime. For gross capital stocks, the asset is valued at its new replacement cost until it is retired.
In the ONS PIM straight line depreciation is assumed. This is a depreciation profile based on a constant rate for the consumption of fixed capital over the service life of the asset. This service life is the total period during which the asset remains in use or ready to be used, in a productive process, even if the asset has more than one owner.
The main measures produced by the PIM are gross capital stocks, net capital stocks and consumption of fixed capital by asset, industry and sector. The PIM calculates all the series at constant prices and then uses appropriate price indices to produce (reflate) current price estimates.
The PIM uses GFCF at constant prices for low-level assets and industries across the whole economy. It calculates the capital stocks and consumption of fixed capital series at constant prices at this level. It then applies proportions to sectorise these across the economy based on the historic pattern of capital stocks across sectors of the economy. These series are then reflated using deflators to give current price estimates.
Further information on PIM model can be found in the following articles: UK capital stocks developments in coverage and methodology (446.3 Kb Pdf) Improving non financial balance sheets and capital stocks
(609.9 Kb Pdf)
International reporting standards
The International Financial Reporting Standards (IFRS) were introduced from 2005 onwards in the UK. IFRS is the legally-required financial reporting framework for the consolidated accounts of EU listed groups of companies. IFRS differs in some respects from the UK financial reporting standards.
The impact on the capital stocks and consumption of fixed capital estimates is difficult to assess as the impact of the transition to IFRS varies by company. Work by ONS provided little evidence that material differences would occur as a result of the transition. Furthermore, the Quarterly Capital Expenditure Survey, which is the source for around 50% of GFCF estimates, asks respondents to record their investment data without any allowance for depreciation. On this basis, the transition to IFRS should not prevent time series analysis of the capital stocks and consumption of fixed capital dataset.
Further information on methodology
Users will notice a large change in estimates of ‘other machinery and equipment’, in non-financial corporations (S.11) and central government (S.13) in 2005. This is due to the reclassification of British Nuclear Fuels Limited (BNFL) in April 2005. As part of this classification change, nuclear reactors were transferred from to the Nuclear Decommissioning British Nuclear Fuels Limited (BNFL) (414.3 Kb Pdf)Authority (NDA). BNFL is classified as a public corporation in National Accounts and the NDA as a central government body. The estimates in this release reflect this transfer from the public corporations sector. The value of the transfer was -£15.6 billion. The negative value reflects the fact that the reactors are at the end of their productive lives and have large decommissioning and clean-up liabilities.
International comparisons
The UK aims to produce the capital stocks and consumption of fixed capital estimates to correspond with international standards, namely the System of National Accounts (SNA) and the European System of Accounts (ESA). The PIM model used to calculate capital stocks and consumption of fixed capital is utilised across the world and is in line with international guidance. The way in which the PIM model and its assumptions are implemented will differ between countries. This will reflect the differing circumstances in different countries. This means that users can compare estimates between countries but should be aware that differences in methods may contribute to differences in estimates.
Both and the hold internationally comparable estimates for capital stocks and the Eurostat OECDconsumption of fixed capital. When comparing between countries, users should ensure that they are comparing figures in the same currency and that there are no definitional differences noted.
Eurostat currently have a reservation in place concerning the average life length of roads in the UK. The UK PIM model uses an average life length of 75 years, whereas European guidance states that it should be in the range of 50 to 60 years. By reducing the average life length of roads this asset will live for a shorter period. Therefore the consumption of fixed capital for this asset will increase. Reservations are

Page 31 of 33
5.
used to bring greater consistency and compliance with regulations across member states. ONS is working to lift the reservation.
Comparisons with Other data sources
National Balance Sheet (NBS)
There are links between the net capital stocks estimates and the estimates shown for AN.111 Fixed assets in the non-financial section of the NBS. In the NBS, estimates are taken directly from the current price net capital stocks dataset for assets ‘machinery and equipment’ and ‘intangible fixed assets’ for all sectors except central and local government.
For all other assets, data are calculated based on a wide range of data sources about asset values in the economy. For this reason, these two data sources will show differing values. The biggest difference is the valuation of dwellings. The capital stocks data uses investment data over time in the dwellings only and not the land. The NBS is calculated using property market data and also includes the value of land. As a result, the valuation of fixed assets in the NBS are higher than in the net capital stocks dataset.
Capital services
Capital services are the flow of services into the production of output that are generated by the capital stock, as opposed to the stock of capital itself. Capital services are a measure of capital input that is more suitable for analysing and modelling productivity.
The fundamental difference between capital stocks and capital services is that whereas capital stocks are a wealth-based measure of the total amount of capital within the economy, capital services are a measure of the flow of services derived from net stock. Capital services weight together the different assets by their relative productivity, measured by a derived rent function. The rent function, otherwise known as the user cost, is essentially how much the user is willing to pay to use the asset. As a user is willing to pay up to what an asset will give back, the rent function can be seen as measuring the difference in the additional returns between assets. The rent function is important because assets such as computers and software have become cheaper over the last decade, meaning a wealth measure like capital stocks does not truly reflect the return to those assets.
The ONS has not published a paper on the stand-alone capital service also known as VICS (Volume Indices of Capital Services) since . However capital service estimates have been Appleton & Wallis 2011produced for Multi Factor Productivity (MFP) the latest paper being . However users Field & Franklin 2014should note that these estimates are highly experimental.
Quality assurance
These statistics were withdrawn from publication in 2011 after standard ONS quality assurance checks raised issues with the quality of the data. As explained in a update published on 17 January progress2013, ONS identified two main issues which prevented publication:
the transition from the Standard Industrial Classification 2003 (SIC2003) to the Standard Industrial Classification 2007 (SIC2007)

Page 32 of 33
6.
the series break in 1997
The detailed breakdown of industries on a SIC2007 basis varies greatly from the previous SIC2003. There was a series break in 1997 (the first year of national accounts central system processing) which also led to processing issues. This was due to post-1997 data having already been collected on/converted to a SIC2007 basis and pre-1997 data being on a SIC2003 basis.
To address these concerns, the estimates in this statistical bulletin and all associated outputs have been extensively quality assured in line with the Code of Practice for Official Statistics.
What quality assurance has taken place?
Quality assurance checks have included detailed analysis at all levels of the data, to guarantee integrity and consistency. This has included a complete review of the capital stocks system in order to ensure that everything is performing as expected.
In terms of detail, the process has involved analysing all data being entered in to the system, and every process involved in the calculation of capital stocks estimates to ensure that the outputs are correct according to our specified methodology.
The quality assurance process has also included economic analysis of the estimates, to confirm that the data are changing in a plausible manner, and that expected changes over time (for example, the recent economic downturn) can be seen and explained.
To summarise, the quality assurance process has included:
thorough dataset analysis, ensuring that the data are correct at the lowest level of detail
a review of the deflators used within the capital stocks system, to maintain consistency with other deflators and to keep in line with National Accounts methodology
a complete system review, to ensure integrity and consistency throughout the process
economic analysis, to review what the data are showing at a macroeconomic level and to see how the proposed estimates compare with existing economic figures
publication analysis – detailed checking of all published articles and tables for accuracy and to better tailor the material to serve the citizen user
Who carried out the quality assurance?
This extensive Quality Assurance process has been carried out by:
the ONS capital stocks and Gross Fixed Capital Formation (GFCF) team
ONS economists from the Office of the Chief Economic Advisor (OCEA)
aspects of the methodology have been reviewed by ONS methodologists
What do you think?
We are striving to improve this release and its associated commentary. We would welcome any feedback you may have, and would be particularly interested in knowing how you make use of these data to inform your work. Please contact us via email: or telephone Wesley Harris on +44 (0)1633 [email protected].
There is a community on the website. StatsUserNet is the Business and Trade Statistics StatsUserNetRoyal Statistical Society’s interactive site for users of official statistics. The community objectives are to promote dialogue between users and producers of official business and trade statistics about the structure, content and performance of businesses within the UK. Anyone can join the discussions by registering via either of the links above.
Page 33 of 33
7.
8.
9.
10.
11.
12.
National statistics
The United Kingdom Statistics Authority has designated these statistics as National Statistics, in accordance with the Statistics and Registration Service Act 2007 and signifying compliance with the Code
. Designation can be broadly interpreted to mean that the statistics:of Practice for Official Statistics
meet identified user needs
are well explained and readily accessible
are produced according to sound methods
are managed impartially and objectively in the public interest
Once statistics have been designated as National Statistics it is a statutory requirement that the Code of Practice shall continue to be observed.
Social media
Follow ONS on and receive up to date information about our statistics. Like ONS on to Twitter Facebookreceive our updates in your newsfeed and to post comments on our page.
Government Statistical Service (GSS) business statistics
To find out about other official business statistics, and choose the right data for your needs, use the GSS . By selecting your topics of interest, the tool will pinpoint Business Statistics Interactive User Guide
publications that should be of interest to you, and provide you with links to more detailed information and the relevant statistical releases. It also offers guidance on which statistics are appropriate for different uses.
Special events
ONS has published commentary, analysis and policy on 'Special Events' which may affect statistical outputs. For full details visit the page on the ONS website.Special Events
Release Policy
All data in this release can be downloaded free of charge from the ONS website. Here are the instructions to obtain a full time series of data from the statistical bulletin or release pages:
Select 'Data in this release' Select 'View datasets associated with this release' Select the latest release Select 'Select series from this dataset' Select the reference table of interest Select 'View series' Select the series of interest (Hint: for a custom download you can use SHIFT to select a range of series or CTRL to select multiple individual series) Select 'View selection' Select 'Download'.
Details of the policy governing the release of new data are available by visiting www.statisticsauthority.gov. or from the Media Relations Office email: uk/assessment/code-of-practice/index.html media.relations@ons.
gsi.gov.uk

14th November 2014 - Correction
Please note, as of 14th November 2014, Table 2.5.2 previously published on 2nd July 2014 has been amended.
This error affects total 'other production' (MRIJ) and 'manufacturing' (MQX7). capital stocks to output ratios.
Important Information for Users
This is the first publication of capital stock estimates since 2010. Estimates of capital stocks and consumption of fixed cap ital are now produced using a new methodology, as
e plai ed i the methodological changes to the estimation of capital stocks and consumption of fixed capital a d impact of the methodological changes to the estimation of
capital stocks and consumption of fixed capital arti les pu lished i Ju e a d Jul 4. Users are ad ised to read these arti les a d the a kgrou d otes of this release .
Key changes to the 2013 publication tables are:
A change to the Standard Industrial Classification (SIC) - this has been updated from SIC2003 to SIC2007, and has an impact on the industry breakdowns;
'Culti ated assets ha e ee i luded i these esti ates for the first ti e;
A detailed reakdo of I ta gi le assets has ee pro ided i the pu li atio ta les.
It has not been possible to provide an asset breakdown of the institutional sector non -financial corporations (S.11), into public corporations (S.11001) and private non-financial
corporations (S.11PR). ONS will aim to resolve this issue in time for the publication of Blue Book 2016.
ONS has been unable to fully implement the new methodology produce estimates for the central and local government sectors.
ONS has been unable to fully implement the new methodology to produce estimates for the non -profit institutions serving households (NPISH) sector. NPISH includes for
example charities and trade unions. This means that the changes described in the article published on 25 June 2014 have been implemented. However the NPISH data from the
PIM model were fixed at an early stage of the timetable and are not consistent with the outputs for other non -government sectors. ONS plan to remove this inconsistency as
National Accounts revision policy allows.
All data within these tables are available to download for periods 1997 to 2012 from the time series dataset.
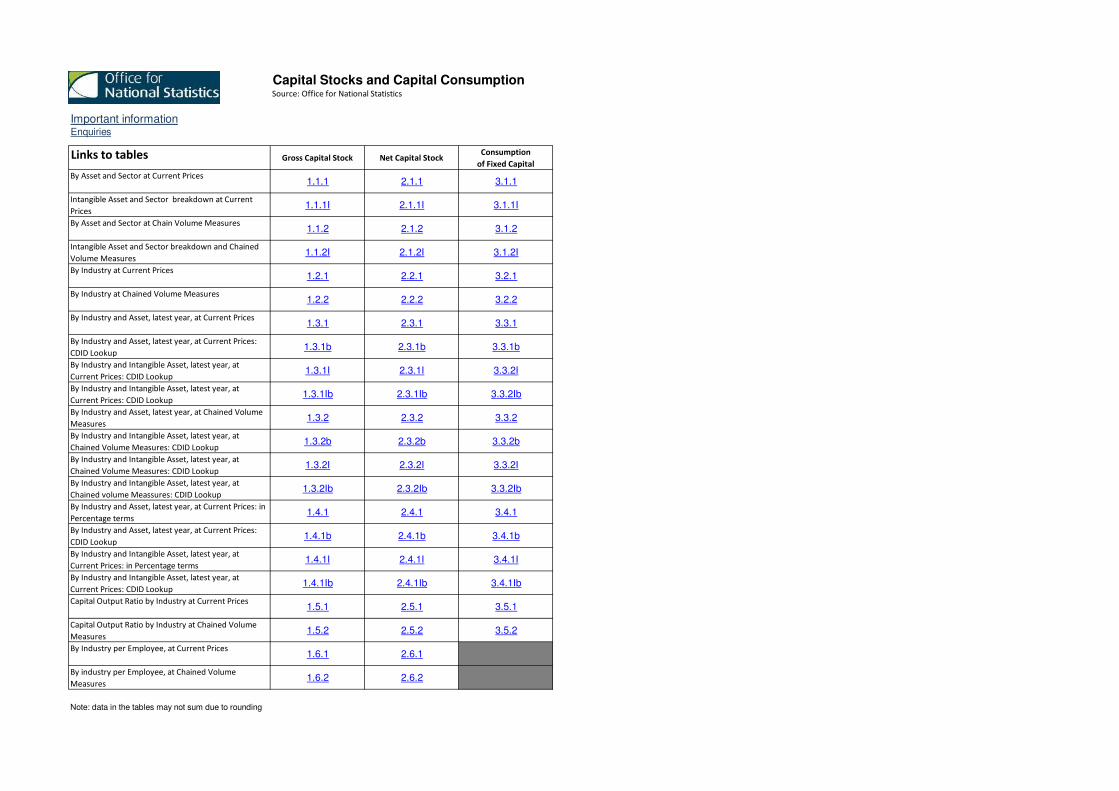
Capital Stocks and Capital ConsumptionSource: Office for National Statistics
Important informationEnquiries
Links to tables Gross Capital Stock Net Capital StockConsumption
of Fixed Capital
By Asset and Sector at Current Prices1.1.1 2.1.1 3.1.1
Intangible Asset and Sector breakdown at Current
Prices1.1.1I 2.1.1I 3.1.1I
By Asset and Sector at Chain Volume Measures1.1.2 2.1.2 3.1.2
Intangible Asset and Sector breakdown and Chained
Volume Measures1.1.2I 2.1.2I 3.1.2I
By Industry at Current Prices1.2.1 2.2.1 3.2.1
By Industry at Chained Volume Measures1.2.2 2.2.2 3.2.2
By Industry and Asset, latest year, at Current Prices1.3.1 2.3.1 3.3.1
By Industry and Asset, latest year, at Current Prices:
CDID Lookup1.3.1b 2.3.1b 3.3.1b
By Industry and Intangible Asset, latest year, at
Current Prices: CDID Lookup1.3.1I 2.3.1I 3.3.2I
By Industry and Intangible Asset, latest year, at
Current Prices: CDID Lookup1.3.1Ib 2.3.1Ib 3.3.2Ib
By Industry and Asset, latest year, at Chained Volume
Measures1.3.2 2.3.2 3.3.2
By Industry and Intangible Asset, latest year, at
Chained Volume Measures: CDID Lookup1.3.2b 2.3.2b 3.3.2b
By Industry and Intangible Asset, latest year, at
Chained Volume Measures: CDID Lookup1.3.2I 2.3.2I 3.3.2I
By Industry and Intangible Asset, latest year, at
Chained volume Meassures: CDID Lookup1.3.2Ib 2.3.2Ib 3.3.2Ib
By Industry and Asset, latest year, at Current Prices: in
Percentage terms1.4.1 2.4.1 3.4.1
By Industry and Asset, latest year, at Current Prices:
CDID Lookup1.4.1b 2.4.1b 3.4.1b
By Industry and Intangible Asset, latest year, at
Current Prices: in Percentage terms1.4.1I 2.4.1I 3.4.1I
By Industry and Intangible Asset, latest year, at
Current Prices: CDID Lookup1.4.1Ib 2.4.1Ib 3.4.1Ib
Capital Output Ratio by Industry at Current Prices1.5.1 2.5.1 3.5.1
Capital Output Ratio by Industry at Chained Volume
Measures1.5.2 2.5.2 3.5.2
By Industry per Employee, at Current Prices1.6.1 2.6.1
By industry per Employee, at Chained Volume
Measures1.6.2 2.6.2
Note: data in the tables may not sum due to rounding
Next publication: 2014
Issued by:
Media contact:
Tel Media Relations Office 0845 6041858
Emergency on-call 07867 906553
Email [email protected]
Statistical contact:
Name Wesley Harris
Tel Wesley Harris 01633 455250
Email [email protected]
Contact us:
Tel 0845 601 3034
Email [email protected]
Website www.statistics.gov.uk
Twitter www.twitter.com/statisticsONS
Back to Content
Office for National Statistics, Government Buildings, Cardiff Road,
Newport NP10 8XG
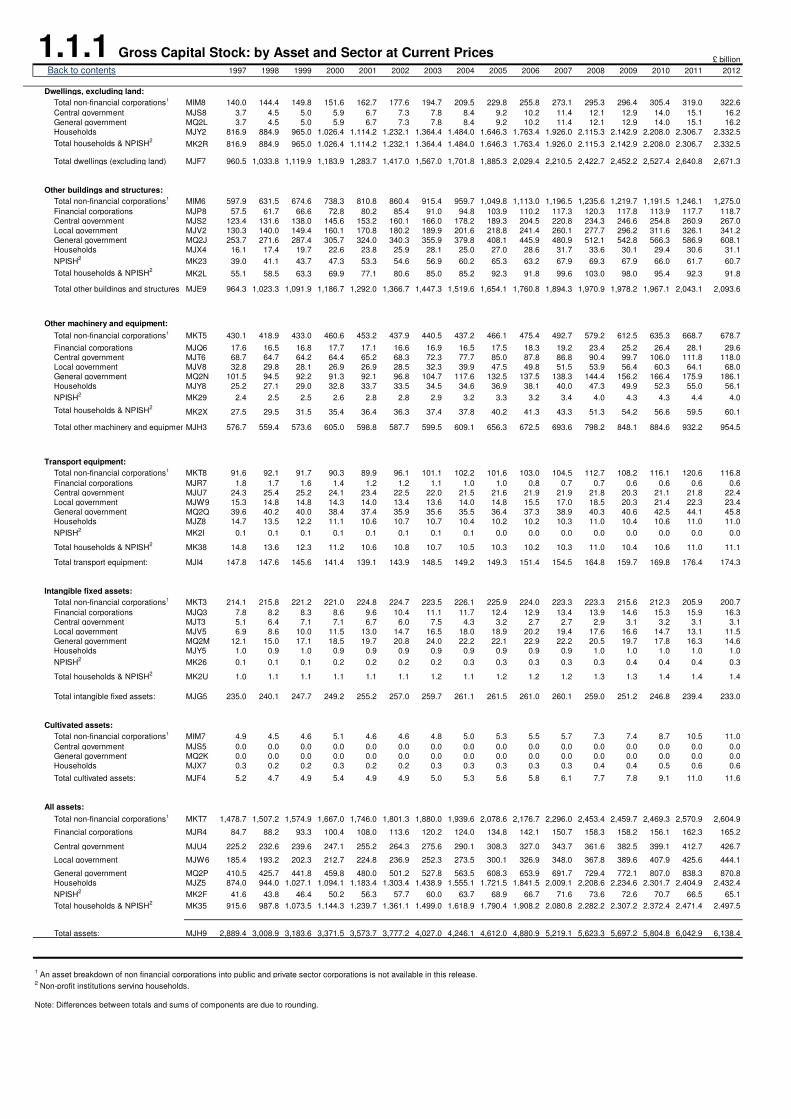
1.1.1 Gross Capital Stock: by Asset and Sector at Current Prices£ billion
1997 1998 1999 2000 2001 2002 2003 2004 2005 2006 2007 2008 2009 2010 2011 2012
Dwellings, excluding land:
MIM8 140.0 144.4 149.8 151.6 162.7 177.6 194.7 209.5 229.8 255.8 273.1 295.3 296.4 305.4 319.0 322.6
Central government MJS8 3.7 4.5 5.0 5.9 6.7 7.3 7.8 8.4 9.2 10.2 11.4 12.1 12.9 14.0 15.1 16.2
General government MQ2L 3.7 4.5 5.0 5.9 6.7 7.3 7.8 8.4 9.2 10.2 11.4 12.1 12.9 14.0 15.1 16.2
Households MJY2 816.9 884.9 965.0 1,026.4 1,114.2 1,232.1 1,364.4 1,484.0 1,646.3 1,763.4 1,926.0 2,115.3 2,142.9 2,208.0 2,306.7 2,332.5
Total households & NPISH2
MK2R 816.9 884.9 965.0 1,026.4 1,114.2 1,232.1 1,364.4 1,484.0 1,646.3 1,763.4 1,926.0 2,115.3 2,142.9 2,208.0 2,306.7 2,332.5
Total dwellings (excluding land) MJF7 960.5 1,033.8 1,119.9 1,183.9 1,283.7 1,417.0 1,567.0 1,701.8 1,885.3 2,029.4 2,210.5 2,422.7 2,452.2 2,527.4 2,640.8 2,671.3
Other buildings and structures:
MIM6 597.9 631.5 674.6 738.3 810.8 860.4 915.4 959.7 1,049.8 1,113.0 1,196.5 1,235.6 1,219.7 1,191.5 1,246.1 1,275.0
Financial corporations MJP8 57.5 61.7 66.6 72.8 80.2 85.4 91.0 94.8 103.9 110.2 117.3 120.3 117.8 113.9 117.7 118.7
Central government MJS2 123.4 131.6 138.0 145.6 153.2 160.1 166.0 178.2 189.3 204.5 220.8 234.3 246.6 254.8 260.9 267.0
Local government MJV2 130.3 140.0 149.4 160.1 170.8 180.2 189.9 201.6 218.8 241.4 260.1 277.7 296.2 311.6 326.1 341.2
General government MQ2J 253.7 271.6 287.4 305.7 324.0 340.3 355.9 379.8 408.1 445.9 480.9 512.1 542.8 566.3 586.9 608.1
Households MJX4 16.1 17.4 19.7 22.6 23.8 25.9 28.1 25.0 27.0 28.6 31.7 33.6 30.1 29.4 30.6 31.1
NPISH2
MK23 39.0 41.1 43.7 47.3 53.3 54.6 56.9 60.2 65.3 63.2 67.9 69.3 67.9 66.0 61.7 60.7
Total households & NPISH2
MK2L 55.1 58.5 63.3 69.9 77.1 80.6 85.0 85.2 92.3 91.8 99.6 103.0 98.0 95.4 92.3 91.8
Total other buildings and structures MJE9 964.3 1,023.3 1,091.9 1,186.7 1,292.0 1,366.7 1,447.3 1,519.6 1,654.1 1,760.8 1,894.3 1,970.9 1,978.2 1,967.1 2,043.1 2,093.6
Other machinery and equipment:
MKT5 430.1 418.9 433.0 460.6 453.2 437.9 440.5 437.2 466.1 475.4 492.7 579.2 612.5 635.3 668.7 678.7
Financial corporations MJQ6 17.6 16.5 16.8 17.7 17.1 16.6 16.9 16.5 17.5 18.3 19.2 23.4 25.2 26.4 28.1 29.6
Central government MJT6 68.7 64.7 64.2 64.4 65.2 68.3 72.3 77.7 85.0 87.8 86.8 90.4 99.7 106.0 111.8 118.0
Local government MJV8 32.8 29.8 28.1 26.9 26.9 28.5 32.3 39.9 47.5 49.8 51.5 53.9 56.4 60.3 64.1 68.0
General government MQ2N 101.5 94.5 92.2 91.3 92.1 96.8 104.7 117.6 132.5 137.5 138.3 144.4 156.2 166.4 175.9 186.1
Households MJY8 25.2 27.1 29.0 32.8 33.7 33.5 34.5 34.6 36.9 38.1 40.0 47.3 49.9 52.3 55.0 56.1
NPISH2
MK29 2.4 2.5 2.5 2.6 2.8 2.8 2.9 3.2 3.3 3.2 3.4 4.0 4.3 4.3 4.4 4.0
Total households & NPISH2
MK2X 27.5 29.5 31.5 35.4 36.4 36.3 37.4 37.8 40.2 41.3 43.3 51.3 54.2 56.6 59.5 60.1
Total other machinery and equipmenMJH3 576.7 559.4 573.6 605.0 598.8 587.7 599.5 609.1 656.3 672.5 693.6 798.2 848.1 884.6 932.2 954.5
Transport equipment:
MKT8 91.6 92.1 91.7 90.3 89.9 96.1 101.1 102.2 101.6 103.0 104.5 112.7 108.2 116.1 120.6 116.8
Financial corporations MJR7 1.8 1.7 1.6 1.4 1.2 1.2 1.1 1.0 1.0 0.8 0.7 0.7 0.6 0.6 0.6 0.6
Central government MJU7 24.3 25.4 25.2 24.1 23.4 22.5 22.0 21.5 21.6 21.9 21.9 21.8 20.3 21.1 21.8 22.4
Local government MJW9 15.3 14.8 14.8 14.3 14.0 13.4 13.6 14.0 14.8 15.5 17.0 18.5 20.3 21.4 22.3 23.4
General government MQ2Q 39.6 40.2 40.0 38.4 37.4 35.9 35.6 35.5 36.4 37.3 38.9 40.3 40.6 42.5 44.1 45.8
Households MJZ8 14.7 13.5 12.2 11.1 10.6 10.7 10.7 10.4 10.2 10.2 10.3 11.0 10.4 10.6 11.0 11.0
NPISH2
MK2I 0.1 0.1 0.1 0.1 0.1 0.1 0.1 0.1 0.0 0.0 0.0 0.0 0.0 0.0 0.0 0.0
Total households & NPISH2
MK38 14.8 13.6 12.3 11.2 10.6 10.8 10.7 10.5 10.3 10.2 10.3 11.0 10.4 10.6 11.0 11.1
Total transport equipment: MJI4 147.8 147.6 145.6 141.4 139.1 143.9 148.5 149.2 149.3 151.4 154.5 164.8 159.7 169.8 176.4 174.3
Intangible fixed assets:
MKT3 214.1 215.8 221.2 221.0 224.8 224.7 223.5 226.1 225.9 224.0 223.3 223.3 215.6 212.3 205.9 200.7
Financial corporations MJQ3 7.8 8.2 8.3 8.6 9.6 10.4 11.1 11.7 12.4 12.9 13.4 13.9 14.6 15.3 15.9 16.3
Central government MJT3 5.1 6.4 7.1 7.1 6.7 6.0 7.5 4.3 3.2 2.7 2.7 2.9 3.1 3.2 3.1 3.1
Local government MJV5 6.9 8.6 10.0 11.5 13.0 14.7 16.5 18.0 18.9 20.2 19.4 17.6 16.6 14.7 13.1 11.5
General government MQ2M 12.1 15.0 17.1 18.5 19.7 20.8 24.0 22.2 22.1 22.9 22.2 20.5 19.7 17.8 16.3 14.6
Households MJY5 1.0 0.9 1.0 0.9 0.9 0.9 0.9 0.9 0.9 0.9 0.9 1.0 1.0 1.0 1.0 1.0
NPISH2
MK26 0.1 0.1 0.1 0.2 0.2 0.2 0.2 0.3 0.3 0.3 0.3 0.3 0.4 0.4 0.4 0.3
Total households & NPISH2
MK2U 1.0 1.1 1.1 1.1 1.1 1.1 1.2 1.1 1.2 1.2 1.2 1.3 1.3 1.4 1.4 1.4
Total intangible fixed assets: MJG5 235.0 240.1 247.7 249.2 255.2 257.0 259.7 261.1 261.5 261.0 260.1 259.0 251.2 246.8 239.4 233.0
Cultivated assets:
MIM7 4.9 4.5 4.6 5.1 4.6 4.6 4.8 5.0 5.3 5.5 5.7 7.3 7.4 8.7 10.5 11.0
Central government MJS5 0.0 0.0 0.0 0.0 0.0 0.0 0.0 0.0 0.0 0.0 0.0 0.0 0.0 0.0 0.0 0.0
General government MQ2K 0.0 0.0 0.0 0.0 0.0 0.0 0.0 0.0 0.0 0.0 0.0 0.0 0.0 0.0 0.0 0.0
Households MJX7 0.3 0.2 0.2 0.3 0.2 0.2 0.3 0.3 0.3 0.3 0.3 0.4 0.4 0.5 0.6 0.6
Total cultivated assets: MJF4 5.2 4.7 4.9 5.4 4.9 4.9 5.0 5.3 5.6 5.8 6.1 7.7 7.8 9.1 11.0 11.6
All assets:
MKT7 1,478.7 1,507.2 1,574.9 1,667.0 1,746.0 1,801.3 1,880.0 1,939.6 2,078.6 2,176.7 2,296.0 2,453.4 2,459.7 2,469.3 2,570.9 2,604.9
Financial corporations MJR4 84.7 88.2 93.3 100.4 108.0 113.6 120.2 124.0 134.8 142.1 150.7 158.3 158.2 156.1 162.3 165.2
Central government MJU4 225.2 232.6 239.6 247.1 255.2 264.3 275.6 290.1 308.3 327.0 343.7 361.6 382.5 399.1 412.7 426.7
Local government MJW6 185.4 193.2 202.3 212.7 224.8 236.9 252.3 273.5 300.1 326.9 348.0 367.8 389.6 407.9 425.6 444.1
General government MQ2P 410.5 425.7 441.8 459.8 480.0 501.2 527.8 563.5 608.3 653.9 691.7 729.4 772.1 807.0 838.3 870.8
Households MJZ5 874.0 944.0 1,027.1 1,094.1 1,183.4 1,303.4 1,438.9 1,555.1 1,721.5 1,841.5 2,009.1 2,208.6 2,234.6 2,301.7 2,404.9 2,432.4
NPISH2
MK2F 41.6 43.8 46.4 50.2 56.3 57.7 60.0 63.7 68.9 66.7 71.6 73.6 72.6 70.7 66.5 65.1
Total households & NPISH2
MK35 915.6 987.8 1,073.5 1,144.3 1,239.7 1,361.1 1,499.0 1,618.9 1,790.4 1,908.2 2,080.8 2,282.2 2,307.2 2,372.4 2,471.4 2,497.5
Total assets: MJH9 2,889.4 3,008.9 3,183.6 3,371.5 3,573.7 3,777.2 4,027.0 4,246.1 4,612.0 4,880.9 5,219.1 5,623.3 5,697.2 5,804.8 6,042.9 6,138.4
1 An asset breakdown of non financial corporations into public and private sector corporations is not available in this release.
2 Non-profit institutions serving households.
Note: Differences between totals and sums of components are due to rounding.
Total non-financial corporations1
Total non-financial corporations1
Total non-financial corporations1
Back to contents
Total non-financial corporations1
Total non-financial corporations1
Total non-financial corporations1
Total non-financial corporations1
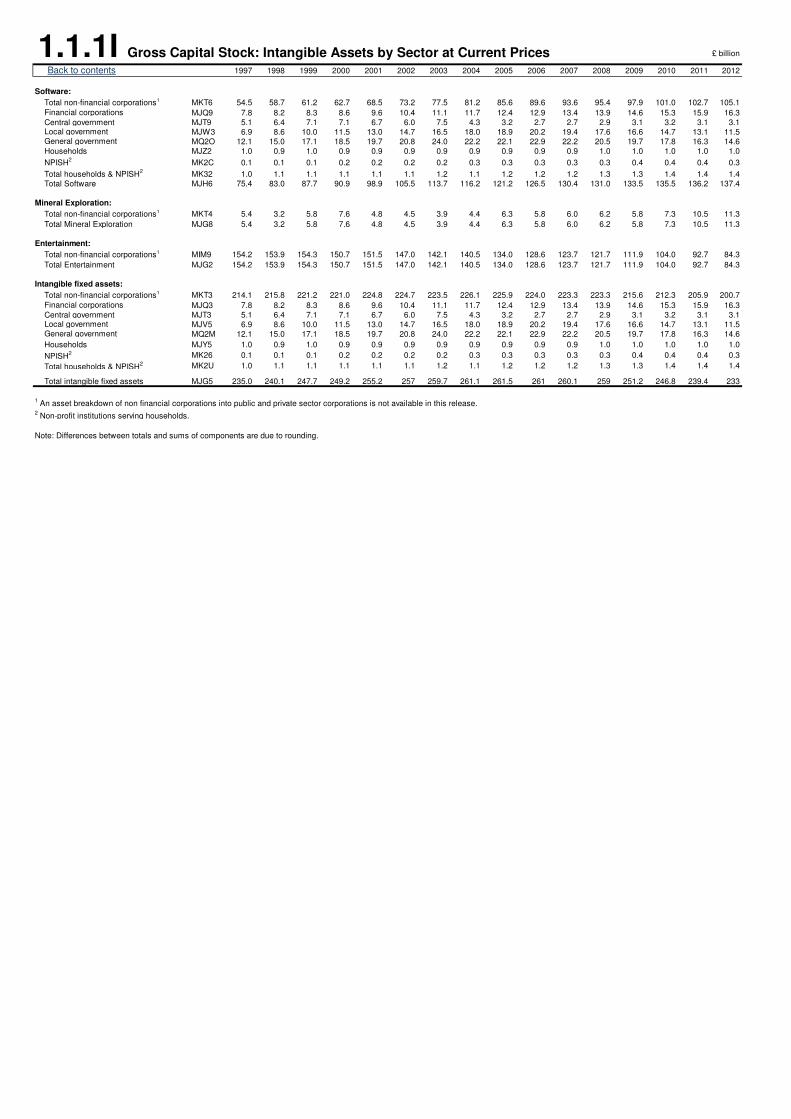
1.1.1I Gross Capital Stock: Intangible Assets by Sector at Current Prices £ billion
1997 1998 1999 2000 2001 2002 2003 2004 2005 2006 2007 2008 2009 2010 2011 2012
Software:
MKT6 54.5 58.7 61.2 62.7 68.5 73.2 77.5 81.2 85.6 89.6 93.6 95.4 97.9 101.0 102.7 105.1
Financial corporations MJQ9 7.8 8.2 8.3 8.6 9.6 10.4 11.1 11.7 12.4 12.9 13.4 13.9 14.6 15.3 15.9 16.3
Central government MJT9 5.1 6.4 7.1 7.1 6.7 6.0 7.5 4.3 3.2 2.7 2.7 2.9 3.1 3.2 3.1 3.1Local government MJW3 6.9 8.6 10.0 11.5 13.0 14.7 16.5 18.0 18.9 20.2 19.4 17.6 16.6 14.7 13.1 11.5General government MQ2O 12.1 15.0 17.1 18.5 19.7 20.8 24.0 22.2 22.1 22.9 22.2 20.5 19.7 17.8 16.3 14.6
Households MJZ2 1.0 0.9 1.0 0.9 0.9 0.9 0.9 0.9 0.9 0.9 0.9 1.0 1.0 1.0 1.0 1.0
NPISH2
MK2C 0.1 0.1 0.1 0.2 0.2 0.2 0.2 0.3 0.3 0.3 0.3 0.3 0.4 0.4 0.4 0.3
Total households & NPISH2
MK32 1.0 1.1 1.1 1.1 1.1 1.1 1.2 1.1 1.2 1.2 1.2 1.3 1.3 1.4 1.4 1.4
Total Software MJH6 75.4 83.0 87.7 90.9 98.9 105.5 113.7 116.2 121.2 126.5 130.4 131.0 133.5 135.5 136.2 137.4
Mineral Exploration:
MKT4 5.4 3.2 5.8 7.6 4.8 4.5 3.9 4.4 6.3 5.8 6.0 6.2 5.8 7.3 10.5 11.3
Total Mineral Exploration MJG8 5.4 3.2 5.8 7.6 4.8 4.5 3.9 4.4 6.3 5.8 6.0 6.2 5.8 7.3 10.5 11.3
Entertainment:
MIM9 154.2 153.9 154.3 150.7 151.5 147.0 142.1 140.5 134.0 128.6 123.7 121.7 111.9 104.0 92.7 84.3
Total Entertainment MJG2 154.2 153.9 154.3 150.7 151.5 147.0 142.1 140.5 134.0 128.6 123.7 121.7 111.9 104.0 92.7 84.3
Intangible fixed assets:
MKT3 214.1 215.8 221.2 221.0 224.8 224.7 223.5 226.1 225.9 224.0 223.3 223.3 215.6 212.3 205.9 200.7
Financial corporations MJQ3 7.8 8.2 8.3 8.6 9.6 10.4 11.1 11.7 12.4 12.9 13.4 13.9 14.6 15.3 15.9 16.3
Central government MJT3 5.1 6.4 7.1 7.1 6.7 6.0 7.5 4.3 3.2 2.7 2.7 2.9 3.1 3.2 3.1 3.1Local government MJV5 6.9 8.6 10.0 11.5 13.0 14.7 16.5 18.0 18.9 20.2 19.4 17.6 16.6 14.7 13.1 11.5General government MQ2M 12.1 15.0 17.1 18.5 19.7 20.8 24.0 22.2 22.1 22.9 22.2 20.5 19.7 17.8 16.3 14.6
Households MJY5 1.0 0.9 1.0 0.9 0.9 0.9 0.9 0.9 0.9 0.9 0.9 1.0 1.0 1.0 1.0 1.0
NPISH2 MK26 0.1 0.1 0.1 0.2 0.2 0.2 0.2 0.3 0.3 0.3 0.3 0.3 0.4 0.4 0.4 0.3
Total households & NPISH2 MK2U 1.0 1.1 1.1 1.1 1.1 1.1 1.2 1.1 1.2 1.2 1.2 1.3 1.3 1.4 1.4 1.4
Total intangible fixed assets MJG5 235.0 240.1 247.7 249.2 255.2 257 259.7 261.1 261.5 261 260.1 259 251.2 246.8 239.4 233
1 An asset breakdown of non financial corporations into public and private sector corporations is not available in this release.
2 Non-profit institutions serving households.
Note: Differences between totals and sums of components are due to rounding.
Total non-financial corporations1
Back to contents
Total non-financial corporations1
Total non-financial corporations1
Total non-financial corporations1
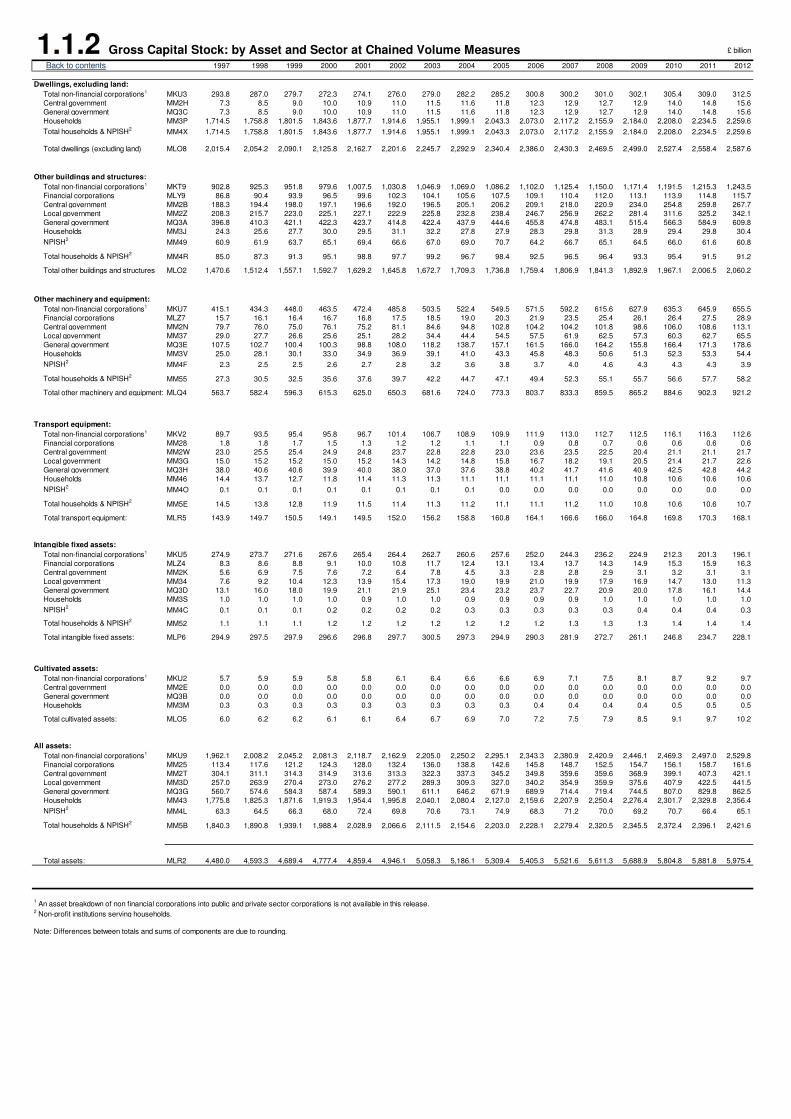
1.1.2 Gross Capital Stock: by Asset and Sector at Chained Volume Measures £ billion
1997 1998 1999 2000 2001 2002 2003 2004 2005 2006 2007 2008 2009 2010 2011 2012
Dwellings, excluding land:
MKU3 293.8 287.0 279.7 272.3 274.1 276.0 279.0 282.2 285.2 300.8 300.2 301.0 302.1 305.4 309.0 312.5
Central government MM2H 7.3 8.5 9.0 10.0 10.9 11.0 11.5 11.6 11.8 12.3 12.9 12.7 12.9 14.0 14.8 15.6
General government MQ3C 7.3 8.5 9.0 10.0 10.9 11.0 11.5 11.6 11.8 12.3 12.9 12.7 12.9 14.0 14.8 15.6
Households MM3P 1,714.5 1,758.8 1,801.5 1,843.6 1,877.7 1,914.6 1,955.1 1,999.1 2,043.3 2,073.0 2,117.2 2,155.9 2,184.0 2,208.0 2,234.5 2,259.6
Total households & NPISH2MM4X 1,714.5 1,758.8 1,801.5 1,843.6 1,877.7 1,914.6 1,955.1 1,999.1 2,043.3 2,073.0 2,117.2 2,155.9 2,184.0 2,208.0 2,234.5 2,259.6
Total dwellings (excluding land) MLO8 2,015.4 2,054.2 2,090.1 2,125.8 2,162.7 2,201.6 2,245.7 2,292.9 2,340.4 2,386.0 2,430.3 2,469.5 2,499.0 2,527.4 2,558.4 2,587.6
Other buildings and structures:
MKT9 902.8 925.3 951.8 979.6 1,007.5 1,030.8 1,046.9 1,069.0 1,086.2 1,102.0 1,125.4 1,150.0 1,171.4 1,191.5 1,215.3 1,243.5
Financial corporations MLY9 86.8 90.4 93.9 96.5 99.6 102.3 104.1 105.6 107.5 109.1 110.4 112.0 113.1 113.9 114.8 115.7
Central government MM2B 188.3 194.4 198.0 197.1 196.6 192.0 196.5 205.1 206.2 209.1 218.0 220.9 234.0 254.8 259.8 267.7
Local government MM2Z 208.3 215.7 223.0 225.1 227.1 222.9 225.8 232.8 238.4 246.7 256.9 262.2 281.4 311.6 325.2 342.1
General government MQ3A 396.8 410.3 421.1 422.3 423.7 414.8 422.4 437.9 444.6 455.8 474.8 483.1 515.4 566.3 584.9 609.8
Households MM3J 24.3 25.6 27.7 30.0 29.5 31.1 32.2 27.8 27.9 28.3 29.8 31.3 28.9 29.4 29.8 30.4
NPISH2MM49 60.9 61.9 63.7 65.1 69.4 66.6 67.0 69.0 70.7 64.2 66.7 65.1 64.5 66.0 61.6 60.8
Total households & NPISH2MM4R 85.0 87.3 91.3 95.1 98.8 97.7 99.2 96.7 98.4 92.5 96.5 96.4 93.3 95.4 91.5 91.2
Total other buildings and structures MLO2 1,470.6 1,512.4 1,557.1 1,592.7 1,629.2 1,645.8 1,672.7 1,709.3 1,736.8 1,759.4 1,806.9 1,841.3 1,892.9 1,967.1 2,006.5 2,060.2
Other machinery and equipment:
MKU7 415.1 434.3 448.0 463.5 472.4 485.8 503.5 522.4 549.5 571.5 592.2 615.6 627.9 635.3 645.9 655.5
Financial corporations MLZ7 15.7 16.1 16.4 16.7 16.8 17.5 18.5 19.0 20.3 21.9 23.5 25.4 26.1 26.4 27.5 28.9
Central government MM2N 79.7 76.0 75.0 76.1 75.2 81.1 84.6 94.8 102.8 104.2 104.2 101.8 98.6 106.0 108.6 113.1
Local government MM37 29.0 27.7 26.6 25.6 25.1 28.2 34.4 44.4 54.5 57.5 61.9 62.5 57.3 60.3 62.7 65.5
General government MQ3E 107.5 102.7 100.4 100.3 98.8 108.0 118.2 138.7 157.1 161.5 166.0 164.2 155.8 166.4 171.3 178.6
Households MM3V 25.0 28.1 30.1 33.0 34.9 36.9 39.1 41.0 43.3 45.8 48.3 50.6 51.3 52.3 53.3 54.4
NPISH2MM4F 2.3 2.5 2.5 2.6 2.7 2.8 3.2 3.6 3.8 3.7 4.0 4.6 4.3 4.3 4.3 3.9
Total households & NPISH2MM55 27.3 30.5 32.5 35.6 37.6 39.7 42.2 44.7 47.1 49.4 52.3 55.1 55.7 56.6 57.7 58.2
Total other machinery and equipment: MLQ4 563.7 582.4 596.3 615.3 625.0 650.3 681.6 724.0 773.3 803.7 833.3 859.5 865.2 884.6 902.3 921.2
Transport equipment:
MKV2 89.7 93.5 95.4 95.8 96.7 101.4 106.7 108.9 109.9 111.9 113.0 112.7 112.5 116.1 116.3 112.6
Financial corporations MM28 1.8 1.8 1.7 1.5 1.3 1.2 1.2 1.1 1.1 0.9 0.8 0.7 0.6 0.6 0.6 0.6
Central government MM2W 23.0 25.5 25.4 24.9 24.8 23.7 22.8 22.8 23.0 23.6 23.5 22.5 20.4 21.1 21.1 21.7
Local government MM3G 15.0 15.2 15.2 15.0 15.2 14.3 14.2 14.8 15.8 16.7 18.2 19.1 20.5 21.4 21.7 22.6
General government MQ3H 38.0 40.6 40.6 39.9 40.0 38.0 37.0 37.6 38.8 40.2 41.7 41.6 40.9 42.5 42.8 44.2
Households MM46 14.4 13.7 12.7 11.8 11.4 11.3 11.3 11.1 11.1 11.1 11.1 11.0 10.8 10.6 10.6 10.6
NPISH2MM4O 0.1 0.1 0.1 0.1 0.1 0.1 0.1 0.1 0.0 0.0 0.0 0.0 0.0 0.0 0.0 0.0
Total households & NPISH2MM5E 14.5 13.8 12.8 11.9 11.5 11.4 11.3 11.2 11.1 11.1 11.2 11.0 10.8 10.6 10.6 10.7
Total transport equipment: MLR5 143.9 149.7 150.5 149.1 149.5 152.0 156.2 158.8 160.8 164.1 166.6 166.0 164.8 169.8 170.3 168.1
Intangible fixed assets:
MKU5 274.9 273.7 271.6 267.6 265.4 264.4 262.7 260.6 257.6 252.0 244.3 236.2 224.9 212.3 201.3 196.1
Financial corporations MLZ4 8.3 8.6 8.8 9.1 10.0 10.8 11.7 12.4 13.1 13.4 13.7 14.3 14.9 15.3 15.9 16.3
Central government MM2K 5.6 6.9 7.5 7.6 7.2 6.4 7.8 4.5 3.3 2.8 2.8 2.9 3.1 3.2 3.1 3.1
Local government MM34 7.6 9.2 10.4 12.3 13.9 15.4 17.3 19.0 19.9 21.0 19.9 17.9 16.9 14.7 13.0 11.3
General government MQ3D 13.1 16.0 18.0 19.9 21.1 21.9 25.1 23.4 23.2 23.7 22.7 20.9 20.0 17.8 16.1 14.4
Households MM3S 1.0 1.0 1.0 1.0 0.9 1.0 1.0 0.9 0.9 0.9 0.9 1.0 1.0 1.0 1.0 1.0
NPISH2MM4C 0.1 0.1 0.1 0.2 0.2 0.2 0.2 0.3 0.3 0.3 0.3 0.3 0.4 0.4 0.4 0.3
Total households & NPISH2MM52 1.1 1.1 1.1 1.2 1.2 1.2 1.2 1.2 1.2 1.2 1.3 1.3 1.3 1.4 1.4 1.4
Total intangible fixed assets: MLP6 294.9 297.5 297.9 296.6 296.8 297.7 300.5 297.3 294.9 290.3 281.9 272.7 261.1 246.8 234.7 228.1
Cultivated assets:
MKU2 5.7 5.9 5.9 5.8 5.8 6.1 6.4 6.6 6.6 6.9 7.1 7.5 8.1 8.7 9.2 9.7
Central government MM2E 0.0 0.0 0.0 0.0 0.0 0.0 0.0 0.0 0.0 0.0 0.0 0.0 0.0 0.0 0.0 0.0
General government MQ3B 0.0 0.0 0.0 0.0 0.0 0.0 0.0 0.0 0.0 0.0 0.0 0.0 0.0 0.0 0.0 0.0
Households MM3M 0.3 0.3 0.3 0.3 0.3 0.3 0.3 0.3 0.3 0.4 0.4 0.4 0.4 0.5 0.5 0.5
Total cultivated assets: MLO5 6.0 6.2 6.2 6.1 6.1 6.4 6.7 6.9 7.0 7.2 7.5 7.9 8.5 9.1 9.7 10.2
All assets:
MKU9 1,962.1 2,008.2 2,045.2 2,081.3 2,118.7 2,162.9 2,205.0 2,250.2 2,295.1 2,343.3 2,380.9 2,420.9 2,446.1 2,469.3 2,497.0 2,529.8
Financial corporations MM25 113.4 117.6 121.2 124.3 128.0 132.4 136.0 138.8 142.6 145.8 148.7 152.5 154.7 156.1 158.7 161.6
Central government MM2T 304.1 311.1 314.3 314.9 313.6 313.3 322.3 337.3 345.2 349.8 359.6 359.6 368.9 399.1 407.3 421.1
Local government MM3D 257.0 263.9 270.4 273.0 276.2 277.2 289.3 309.3 327.0 340.2 354.9 359.9 375.6 407.9 422.5 441.5
General government MQ3G 560.7 574.6 584.3 587.4 589.3 590.1 611.1 646.2 671.9 689.9 714.4 719.4 744.5 807.0 829.8 862.5
Households MM43 1,775.8 1,825.3 1,871.6 1,919.3 1,954.4 1,995.8 2,040.1 2,080.4 2,127.0 2,159.6 2,207.9 2,250.4 2,276.4 2,301.7 2,329.8 2,356.4
NPISH2MM4L 63.3 64.5 66.3 68.0 72.4 69.8 70.6 73.1 74.9 68.3 71.2 70.0 69.2 70.7 66.4 65.1
Total households & NPISH2MM5B 1,840.3 1,890.8 1,939.1 1,988.4 2,028.9 2,066.6 2,111.5 2,154.6 2,203.0 2,228.1 2,279.4 2,320.5 2,345.5 2,372.4 2,396.1 2,421.6
Total assets: MLR2 4,480.0 4,593.3 4,689.4 4,777.4 4,859.4 4,946.1 5,058.3 5,186.1 5,309.4 5,405.3 5,521.6 5,611.3 5,688.9 5,804.8 5,881.8 5,975.4
1 An asset breakdown of non financial corporations into public and private sector corporations is not available in this release.2 Non-profit institutions serving households.
Note: Differences between totals and sums of components are due to rounding.
Total non-financial corporations1
Total non-financial corporations1
Back to contents
Total non-financial corporations1
Total non-financial corporations1
Total non-financial corporations1
Total non-financial corporations1
Total non-financial corporations1

1.1.2I Gross Capital Stock: Intangible Assets by Sector at Chained Volume Measures£ billion
1997 1998 1999 2000 2001 2002 2003 2004 2005 2006 2007 2008 2009 2010 2011 2012
Software:
MKU8 58.1 61.4 64.6 66.8 71.2 76.5 81.4 86.1 90.4 93.2 95.5 98.2 99.8 101.0 102.7 105.1
Financial corporations MM22 8.3 8.6 8.8 9.1 10.0 10.8 11.7 12.4 13.1 13.4 13.7 14.3 14.9 15.3 15.9 16.3
Central government MM2Q 5.6 6.9 7.5 7.6 7.2 6.4 7.8 4.5 3.3 2.8 2.8 2.9 3.1 3.2 3.1 3.1Local government MM3A 7.6 9.2 10.4 12.3 13.9 15.4 17.3 19.0 19.9 21.0 19.9 17.9 16.9 14.7 13.0 11.3General government MQ3F 13.1 16.0 18.0 19.9 21.1 21.9 25.1 23.4 23.2 23.7 22.7 20.9 20.0 17.8 16.1 14.4
Households MM3Y 1.0 1.0 1.0 1.0 0.9 1.0 1.0 0.9 0.9 0.9 0.9 1.0 1.0 1.0 1.0 1.0
NPISH2
MM4I 0.1 0.1 0.1 0.2 0.2 0.2 0.2 0.3 0.3 0.3 0.3 0.3 0.4 0.4 0.4 0.3
Total households & NPISH2
MM58 1.1 1.1 1.1 1.2 1.2 1.2 1.2 1.2 1.2 1.2 1.3 1.3 1.3 1.4 1.4 1.4
Total Software MLQ7 80.7 87.2 92.4 97.0 103.5 110.5 119.4 123.1 127.9 131.6 133.1 134.8 136.1 135.5 136.1 137.2
Mineral Exploration:
MKU6 24.9 23.9 22.1 19.5 16.5 13.8 11.8 10.3 9.9 9.1 7.8 7.1 7.0 7.3 7.7 8.4
Total Mineral Exploration MLP9 24.9 23.9 22.1 19.5 16.5 13.8 11.8 10.3 9.9 9.1 7.8 7.1 7.0 7.3 7.7 8.4
Entertainment:
MKU4 212.1 206.8 200.9 194.7 188.6 182.2 175.4 168.3 160.6 152.1 142.4 131.2 118.3 104.0 90.8 82.6
Total Entertainment MLP3 212.1 206.8 200.9 194.7 188.6 182.2 175.4 168.3 160.6 152.1 142.4 131.2 118.3 104.0 90.8 82.6
Intangible fixed assets:
MKU5 274.9 273.7 271.6 267.6 265.4 264.4 262.7 260.6 257.6 252.0 244.3 236.2 224.9 212.3 201.3 196.1
Financial corporations MLZ4 8.3 8.6 8.8 9.1 10.0 10.8 11.7 12.4 13.1 13.4 13.7 14.3 14.9 15.3 15.9 16.3
Central government MM2K 5.6 6.9 7.5 7.6 7.2 6.4 7.8 4.5 3.3 2.8 2.8 2.9 3.1 3.2 3.1 3.1Local government MM34 7.6 9.2 10.4 12.3 13.9 15.4 17.3 19.0 19.9 21.0 19.9 17.9 16.9 14.7 13.0 11.3General government MQ3D 13.1 16.0 18.0 19.9 21.1 21.9 25.1 23.4 23.2 23.7 22.7 20.9 20.0 17.8 16.1 14.4
Households MM3S 1.0 1.0 1.0 1.0 0.9 1.0 1.0 0.9 0.9 0.9 0.9 1.0 1.0 1.0 1.0 1.0
NPISH2
MM4C 0.1 0.1 0.1 0.2 0.2 0.2 0.2 0.3 0.3 0.3 0.3 0.3 0.4 0.4 0.4 0.3
Total households & NPISH2
MM52 1.1 1.1 1.1 1.2 1.2 1.2 1.2 1.2 1.2 1.2 1.3 1.3 1.3 1.4 1.4 1.4
Total intangible fixed assets MLP6 294.9 297.5 297.9 296.6 296.8 297.7 300.5 297.3 294.9 290.3 281.9 272.7 261.1 246.8 234.7 228.1
Note: Differences between totals and sums of components are due to rounding.
1 An asset breakdown of non financial corporations into public and private sector corporations is not available in this release.
2 Non-profit institutions serving households.
Total non-financial corporations1
Back to contents
Total non-financial corporations1
Total non-financial corporations1
Total non-financial corporations1
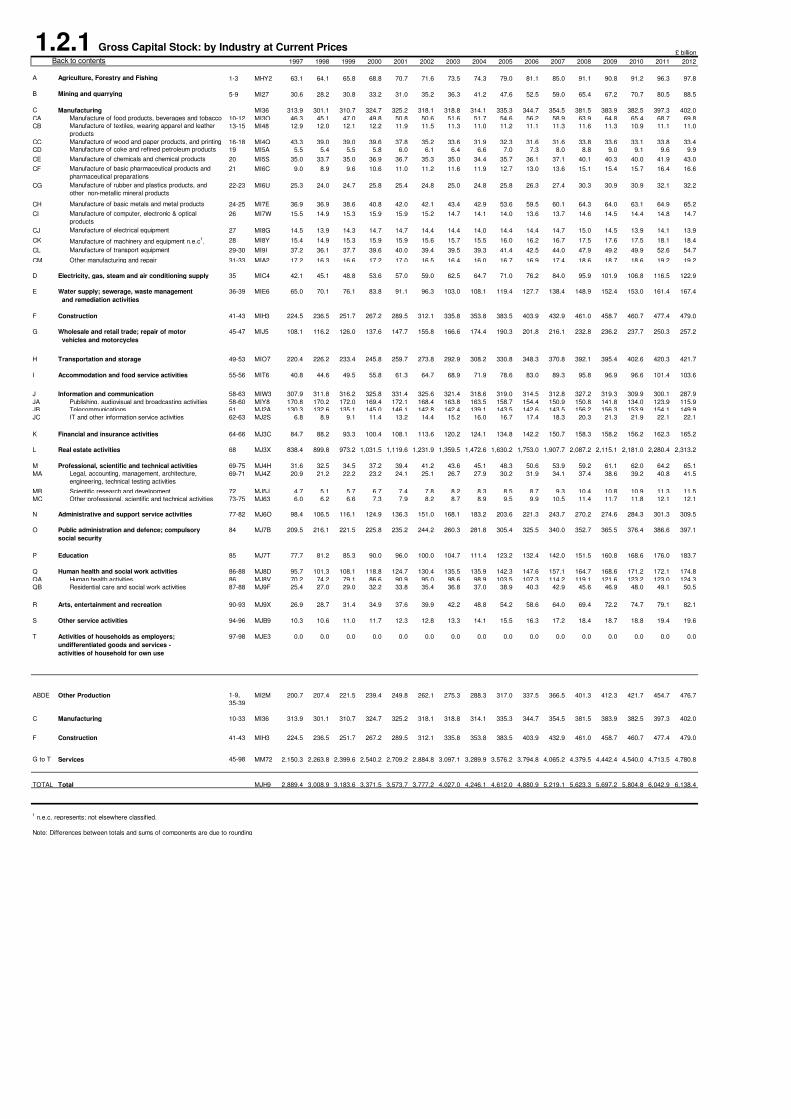
1.2.1 Gross Capital Stock: by Industry at Current Prices£ billion
1997 1998 1999 2000 2001 2002 2003 2004 2005 2006 2007 2008 2009 2010 2011 2012
A Agriculture, Forestry and Fishing 1-3 MHY2 63.1 64.1 65.8 68.8 70.7 71.6 73.5 74.3 79.0 81.1 85.0 91.1 90.8 91.2 96.3 97.8
B Mining and quarrying 5-9 MI27 30.6 28.2 30.8 33.2 31.0 35.2 36.3 41.2 47.6 52.5 59.0 65.4 67.2 70.7 80.5 88.5
C Manufacturing MI36 313.9 301.1 310.7 324.7 325.2 318.1 318.8 314.1 335.3 344.7 354.5 381.5 383.9 382.5 397.3 402.0
CA 10-12 MI3O 46.3 45.1 47.0 49.8 50.8 50.6 51.6 51.7 54.6 56.2 58.9 63.9 64.8 65.4 68.7 69.8
CB 13-15 MI48 12.9 12.0 12.1 12.2 11.9 11.5 11.3 11.0 11.2 11.1 11.3 11.6 11.3 10.9 11.1 11.0
CC 16-18 MI4Q 43.3 39.0 39.0 39.6 37.8 35.2 33.6 31.9 32.3 31.6 31.6 33.8 33.6 33.1 33.8 33.4
CD 19 MI5A 5.5 5.4 5.5 5.8 6.0 6.1 6.4 6.6 7.0 7.3 8.0 8.8 9.0 9.1 9.6 9.9
CE 20 MI5S 35.0 33.7 35.0 36.9 36.7 35.3 35.0 34.4 35.7 36.1 37.1 40.1 40.3 40.0 41.9 43.0
CF 21 MI6C 9.0 8.9 9.6 10.6 11.0 11.2 11.6 11.9 12.7 13.0 13.6 15.1 15.4 15.7 16.4 16.6
CG 22-23 MI6U 25.3 24.0 24.7 25.8 25.4 24.8 25.0 24.8 25.8 26.3 27.4 30.3 30.9 30.9 32.1 32.2
CH 24-25 MI7E 36.9 36.9 38.6 40.8 42.0 42.1 43.4 42.9 53.6 59.5 60.1 64.3 64.0 63.1 64.9 65.2
CI 26 MI7W 15.5 14.9 15.3 15.9 15.9 15.2 14.7 14.1 14.0 13.6 13.7 14.6 14.5 14.4 14.8 14.7
CJ 27 MI8G 14.5 13.9 14.3 14.7 14.7 14.4 14.4 14.0 14.4 14.4 14.7 15.0 14.5 13.9 14.1 13.9
CK 28 MI8Y 15.4 14.9 15.3 15.9 15.9 15.6 15.7 15.5 16.0 16.2 16.7 17.5 17.6 17.5 18.1 18.4
CL 29-30 MI9I 37.2 36.1 37.7 39.6 40.0 39.4 39.5 39.3 41.4 42.5 44.0 47.9 49.2 49.9 52.6 54.7
CM 31-33 MIA2 17.2 16.3 16.6 17.2 17.0 16.5 16.4 16.0 16.7 16.9 17.4 18.6 18.7 18.6 19.2 19.2
D 35 MIC4 42.1 45.1 48.8 53.6 57.0 59.0 62.5 64.7 71.0 76.2 84.0 95.9 101.9 106.8 116.5 122.9
E 36-39 MIE6 65.0 70.1 76.1 83.8 91.1 96.3 103.0 108.1 119.4 127.7 138.4 148.9 152.4 153.0 161.4 167.4
F Construction 41-43 MIH3 224.5 236.5 251.7 267.2 289.5 312.1 335.8 353.8 383.5 403.9 432.9 461.0 458.7 460.7 477.4 479.0
G 45-47 MIJ5 108.1 116.2 126.0 137.6 147.7 155.8 166.6 174.4 190.3 201.8 216.1 232.8 236.2 237.7 250.3 257.2
H Transportation and storage 49-53 MIO7 220.4 226.2 233.4 245.8 259.7 273.8 292.9 308.2 330.8 348.3 370.8 392.1 395.4 402.6 420.3 421.7
I Accommodation and food service activities 55-56 MIT6 40.8 44.6 49.5 55.8 61.3 64.7 68.9 71.9 78.6 83.0 89.3 95.8 96.9 96.6 101.4 103.6
J Information and communication 58-63 MIW3 307.9 311.8 316.2 325.8 331.4 325.6 321.4 318.6 319.0 314.5 312.8 327.2 319.3 309.9 300.1 287.9
JA Publishing, audiovisual and broadcasting activities 58-60 MIY8 170.8 170.2 172.0 169.4 172.1 168.4 163.8 163.5 158.7 154.4 150.9 150.8 141.8 134.0 123.9 115.9
JB Telecommunications 61 MJ2A 130.3 132.6 135.1 145.0 146.1 142.8 142.4 139.1 143.5 142.6 143.5 156.2 156.3 153.9 154.1 149.9
JC IT and other information service activities 62-63 MJ2S 6.8 8.9 9.1 11.4 13.2 14.4 15.2 16.0 16.7 17.4 18.3 20.3 21.3 21.9 22.1 22.1
K Financial and insurance activities 64-66 MJ3C 84.7 88.2 93.3 100.4 108.1 113.6 120.2 124.1 134.8 142.2 150.7 158.3 158.2 156.2 162.3 165.2
L Real estate activities 68 MJ3X 838.4 899.8 973.2 1,031.5 1,119.6 1,231.9 1,359.5 1,472.6 1,630.2 1,753.0 1,907.7 2,087.2 2,115.1 2,181.0 2,280.4 2,313.2
M Professional, scientific and technical activities 69-75 MJ4H 31.6 32.5 34.5 37.2 39.4 41.2 43.6 45.1 48.3 50.6 53.9 59.2 61.1 62.0 64.2 65.1
MA 69-71 MJ4Z 20.9 21.2 22.2 23.2 24.1 25.1 26.7 27.9 30.2 31.9 34.1 37.4 38.6 39.2 40.8 41.5
MB Scientific research and development 72 MJ5J 4.7 5.1 5.7 6.7 7.4 7.8 8.2 8.3 8.5 8.7 9.3 10.4 10.8 10.9 11.3 11.5
MC Other professional, scientific and technical activities 73-75 MJ63 6.0 6.2 6.6 7.3 7.9 8.2 8.7 8.9 9.5 9.9 10.5 11.4 11.7 11.8 12.1 12.1
N Administrative and support service activities 77-82 MJ6O 98.4 106.5 116.1 124.9 136.3 151.0 168.1 183.2 203.6 221.3 243.7 270.2 274.6 284.3 301.3 309.5
O 84 MJ7B 209.5 216.1 221.5 225.8 235.2 244.2 260.3 281.8 305.4 325.5 340.0 352.7 365.5 376.4 386.6 397.1
P Education 85 MJ7T 77.7 81.2 85.3 90.0 96.0 100.0 104.7 111.4 123.2 132.4 142.0 151.5 160.8 168.6 176.0 183.7
Q Human health and social work activities 86-88 MJ8D 95.7 101.3 108.1 118.8 124.7 130.4 135.5 135.9 142.3 147.6 157.1 164.7 168.6 171.2 172.1 174.8
QA Human health activities 86 MJ8V 70.2 74.2 79.1 86.6 90.9 95.0 98.6 98.9 103.5 107.3 114.2 119.1 121.6 123.2 123.0 124.3
QB Residential care and social work activities 87-88 MJ9F 25.4 27.0 29.0 32.2 33.8 35.4 36.8 37.0 38.9 40.3 42.9 45.6 46.9 48.0 49.1 50.5
R Arts, entertainment and recreation 90-93 MJ9X 26.9 28.7 31.4 34.9 37.6 39.9 42.2 48.8 54.2 58.6 64.0 69.4 72.2 74.7 79.1 82.1
S Other service activities 94-96 MJB9 10.3 10.6 11.0 11.7 12.3 12.8 13.3 14.1 15.5 16.3 17.2 18.4 18.7 18.8 19.4 19.6
T 97-98 MJE3 0.0 0.0 0.0 0.0 0.0 0.0 0.0 0.0 0.0 0.0 0.0 0.0 0.0 0.0 0.0 0.0
ABDE Other Production 1-9,
35-39
MI2M 200.7 207.4 221.5 239.4 249.8 262.1 275.3 288.3 317.0 337.5 366.5 401.3 412.3 421.7 454.7 476.7
C Manufacturing 10-33 MI36 313.9 301.1 310.7 324.7 325.2 318.1 318.8 314.1 335.3 344.7 354.5 381.5 383.9 382.5 397.3 402.0
F Construction 41-43 MIH3 224.5 236.5 251.7 267.2 289.5 312.1 335.8 353.8 383.5 403.9 432.9 461.0 458.7 460.7 477.4 479.0
G to T Services 45-98 MM72 2,150.3 2,263.8 2,399.6 2,540.2 2,709.2 2,884.8 3,097.1 3,289.9 3,576.2 3,794.8 4,065.2 4,379.5 4,442.4 4,540.0 4,713.5 4,780.8
TOTAL Total MJH9 2,889.4 3,008.9 3,183.6 3,371.5 3,573.7 3,777.2 4,027.0 4,246.1 4,612.0 4,880.9 5,219.1 5,623.3 5,697.2 5,804.8 6,042.9 6,138.4
1 n.e.c. represents; not elsewhere classified.
Note: Differences between totals and sums of components are due to rounding
Legal, accounting, management, architecture,
engineering, technical testing activities
Public administration and defence; compulsory
social security
Activities of households as employers;
undifferentiated goods and services -
activities of household for own use
Manufacture of machinery and equipment n.e.c1.
Manufacture of transport equipment
Other manufacturing and repair
Electricity, gas, steam and air conditioning supply
Water supply; sewerage, waste management
and remediation activities
Wholesale and retail trade; repair of motor
vehicles and motorcycles
Manufacture of electrical equipment
Back to contents
Manufacture of food products, beverages and tobacco
Manufacture of textiles, wearing apparel and leather
products
Manufacture of wood and paper products, and printing
Manufacture of coke and refined petroleum products
Manufacture of chemicals and chemical products
Manufacture of basic pharmaceutical products and
pharmaceutical preparations
Manufacture of rubber and plastics products, and
other non-metallic mineral products
Manufacture of basic metals and metal products
Manufacture of computer, electronic & optical
products

1.2.2 Gross Capital Stock: by Industry at Chained Volume Measures£ billion
1997 1998 1999 2000 2001 2002 2003 2004 2005 2006 2007 2008 2009 2010 2011 2012
A Agriculture, Forestry and Fishing 1-3 MK3Q 85.9 86.9 87.0 86.3 85.9 86.1 86.0 86.1 86.4 86.3 87.1 88.5 89.8 91.2 92.4 93.8
B Mining and quarrying 5-9 MK4D 49.2 47.8 46.2 44.2 41.8 46.0 46.1 50.6 53.2 57.2 61.0 64.4 67.1 70.7 75.8 83.4
C Manufacturing MK5C 351.6 357.5 363.3 365.6 365.5 365.0 364.6 362.9 371.8 377.1 376.9 380.4 382.0 382.5 385.0 389.5
CA 10-12 MK5U 53.9 55.0 56.4 57.3 58.0 58.6 59.3 59.9 60.4 61.1 62.1 63.5 64.4 65.4 66.6 67.6
CB 13-15 MK6E 14.9 14.7 14.5 14.1 13.5 13.2 12.9 12.5 12.1 11.8 11.6 11.4 11.2 10.9 10.8 10.6
CC 16-18 MK6W 42.0 41.6 41.2 40.6 39.8 38.8 37.6 36.6 36.2 35.4 34.7 34.3 33.8 33.1 32.7 32.3
CD 19 MK7G 7.2 7.1 7.1 7.2 7.2 7.4 7.6 7.7 7.8 7.9 8.3 8.7 8.9 9.1 9.3 9.6
CE 20 MK7Y 37.5 38.6 39.6 40.2 40.4 40.1 39.9 39.8 39.8 39.8 39.9 40.1 40.2 40.0 40.5 41.6
CF 21 MK8I 9.8 10.3 11.0 11.6 12.2 12.8 13.3 13.8 14.2 14.5 14.8 15.2 15.4 15.7 15.9 16.1
CG 22-23 MK92 27.3 27.6 28.1 28.4 28.2 28.3 28.6 28.9 29.0 29.2 29.8 30.6 30.9 30.9 31.0 31.2
CH 24-25 MK9K 46.7 48.1 49.2 49.7 49.9 50.2 50.8 50.0 59.5 65.0 63.6 63.9 63.5 63.1 62.9 63.2
CI 26 MKA4 16.1 16.7 16.9 17.1 17.2 17.0 16.5 16.1 15.4 14.8 14.6 14.5 14.4 14.4 14.4 14.3
CJ 27 MKC6 17.8 17.8 17.8 17.5 17.1 16.7 16.3 15.8 15.3 14.9 14.6 14.4 14.2 13.9 13.8 13.5
CK 28 MKE7 17.7 18.0 18.2 18.1 17.9 17.8 17.7 17.5 17.3 17.1 17.1 17.2 17.4 17.5 17.6 18.0
CL 29-30 MKG9 41.3 42.5 43.7 44.3 44.8 45.2 45.3 45.8 46.4 47.1 47.5 48.1 49.1 49.9 50.9 53.0
CM 31-33 MKJ3 18.7 18.9 19.0 19.0 18.8 18.7 18.6 18.3 18.3 18.4 18.4 18.5 18.6 18.6 18.6 18.6
D 35 MKL5 54.9 58.3 61.9 64.9 67.3 69.7 72.7 75.6 79.1 83.5 89.4 95.5 101.3 106.8 112.9 119.1
E 36-39 MKN7 92.0 97.6 103.0 107.5 111.5 115.2 119.1 123.3 128.0 132.5 137.8 143.2 148.7 153.0 157.1 163.0
F Construction 41-43 MKQ4 403.5 408.6 413.9 421.3 431.0 438.0 442.3 445.6 448.4 450.4 454.2 457.5 458.5 460.7 462.2 463.8
G 45-47 MKS6 137.2 147.0 156.5 164.4 171.1 179.2 188.0 196.4 204.7 212.3 220.3 227.9 233.1 237.7 244.2 250.8
H Transportation and storage 49-53 MKX8 290.4 296.5 300.4 304.4 308.9 317.1 330.5 343.7 352.4 359.6 370.4 379.0 387.9 402.6 410.2 411.5
I Accommodation and food service activities 55-56 ML2N 56.8 61.1 65.9 70.4 73.9 76.9 79.3 81.8 84.1 86.1 88.8 92.1 94.6 96.6 98.7 100.8
J Information and communication 58-63 ML3A 370.3 374.7 373.3 377.3 379.0 378.7 375.4 372.7 368.0 361.3 353.3 342.6 327.6 309.9 293.0 281.3
JA Publishing, audiovisual and broadcasting activities 58-60 ML3V 230.1 224.7 220.3 214.5 210.2 204.5 197.9 192.4 185.8 178.0 169.3 159.3 147.4 134.0 121.4 113.6
JB Telecommunications 61 ML4F 140.7 146.4 148.7 155.0 158.1 161.0 162.7 163.8 164.7 164.8 164.0 162.4 158.7 153.9 149.7 145.7
JC IT and other information service activities 62-63 ML4X 6.5 8.8 9.0 11.1 12.9 14.7 15.8 17.0 18.0 18.9 20.1 21.2 21.6 21.9 22.0 22.0
K Financial and insurance activities 64-66 ML5H 113.4 117.6 121.2 124.3 128.1 132.4 136.1 138.8 142.6 145.8 148.7 152.5 154.7 156.2 158.8 161.6
L Real estate activities 68 ML64 1,707.8 1,741.2 1,773.3 1,806.6 1,841.0 1,876.4 1,916.4 1,959.0 2,001.3 2,040.7 2,082.3 2,119.8 2,148.7 2,181.0 2,212.6 2,244.1
M Professional, scientific and technical activities 69-75 ML6M 34.8 37.0 38.8 40.6 42.6 45.2 47.8 50.0 52.4 54.3 56.9 59.7 61.1 62.0 63.1 63.9
MA 69-71 ML76 23.0 24.1 25.0 25.3 26.1 27.6 29.3 30.9 32.7 34.2 35.9 37.7 38.6 39.2 40.1 40.8
MB Scientific research and development 72 ML7O 5.2 5.8 6.5 7.3 8.0 8.6 9.0 9.3 9.3 9.4 9.9 10.6 10.8 10.9 11.1 11.2
MC Other professional, scientific and technical activities 73-75 ML88 6.7 7.1 7.4 7.9 8.5 9.0 9.5 9.9 10.3 10.7 11.0 11.5 11.7 11.8 11.9 11.9
N Administrative and support service activities 77-82 ML8T 159.0 169.4 178.6 186.7 196.1 207.0 219.0 230.4 241.4 252.5 264.5 273.0 278.3 284.3 291.4 299.4
O 84 ML9G 275.6 282.4 284.1 282.4 284.5 285.7 298.4 323.4 338.9 346.6 354.9 351.6 353.9 376.4 381.9 392.1
P Education 85 ML9Y 115.3 117.7 120.4 120.6 122.4 120.2 122.0 126.8 133.4 135.9 141.5 144.9 154.2 168.6 175.0 183.3
Q Human health and social work activities 86-88 MLC2 139.7 144.4 150.1 156.8 156.8 155.7 160.5 156.0 155.3 152.6 157.4 157.7 161.2 171.2 170.8 174.0
QA Human health activities 86 MLE4 103.1 106.3 110.2 114.7 114.6 113.6 117.0 113.6 112.9 110.7 114.2 113.9 116.1 123.2 122.1 123.9
QB Residential care and social work activities 87-88 MLG6 36.6 38.0 39.8 42.0 42.2 42.1 43.5 42.5 42.4 41.8 43.2 43.8 45.1 48.0 48.7 50.2
R Arts, entertainment and recreation 90-93 MLI8 37.8 39.6 42.2 44.6 45.8 47.2 48.5 55.2 58.1 60.2 63.4 66.4 69.8 74.7 77.7 80.8
S Other service activities 94-96 MLL2 11.7 12.2 12.7 13.1 13.7 14.3 14.8 15.8 16.8 17.4 17.9 18.4 18.6 18.8 18.9 19.2
T 97-98 MLN4 0.0 0.0 0.0 0.0 0.0 0.0 0.0 0.0 0.0 0.0 0.0 0.0 0.0 0.0 0.0 0.0
ABDE Other Production 1-9,
35-39
MK4S 281.2 290.1 298.2 303.4 307.2 317.4 324.6 336.1 347.0 359.7 375.5 391.7 407.0 421.7 438.2 459.3
C Manufacturing 10-33 MK5C 351.6 357.5 363.3 365.6 365.5 365.0 364.6 362.9 371.8 377.1 376.9 380.4 382.0 382.5 385.0 389.5
F Construction 41-43 MKQ4 403.5 408.6 413.9 421.3 431.0 438.0 442.3 445.6 448.4 450.4 454.2 457.5 458.5 460.7 462.2 463.8
G to T Services 45-98 MM75 3,438.8 3,532.7 3,609.2 3,683.7 3,754.4 3,825.5 3,927.5 4,042.9 4,143.3 4,218.8 4,315.5 4,382.0 4,441.5 4,540.0 4,596.3 4,662.8
TOTAL Total MLR2 4,480.0 4,593.3 4,689.4 4,777.4 4,859.4 4,946.1 5,058.3 5,186.1 5,309.4 5,405.3 5,521.6 5,611.3 5,688.9 5,804.8 5,881.8 5,975.4
1 n.e.c. represents; not elsewhere classified.
Note: Differences between totals and sums of components are due to rounding
Public administration and defence;
compulsory social security
Activities of households as employers;
undifferentiated goods and services -
activities of household for own use
Manufacture of transport equipment
Other manufacturing and repair
Electricity, gas, steam and air conditioning supply
Water supply; sewerage, waste management
and remediation activities
Wholesale and retail trade; repair of motor
vehicles and motorcycles
Legal, accounting, management, architecture,
engineering, technical testing activities
Manufacture of machinery and equipment n.e.c1.
Back to contents
Manufacture of food products, beverages and tobacco
Manufacture of textiles, wearing apparel and leather
products
Manufacture of wood and paper products, and printing
Manufacture of coke and refined petroleum products
Manufacture of chemicals and chemical products
Manufacture of basic pharmaceutical products and
pharmaceutical preparations
Manufacture of rubber and plastics products, and
other non-metallic mineral products
Manufacture of basic metals and metal products
Manufacture of computer, electronic & optical
products
Manufacture of electrical equipment
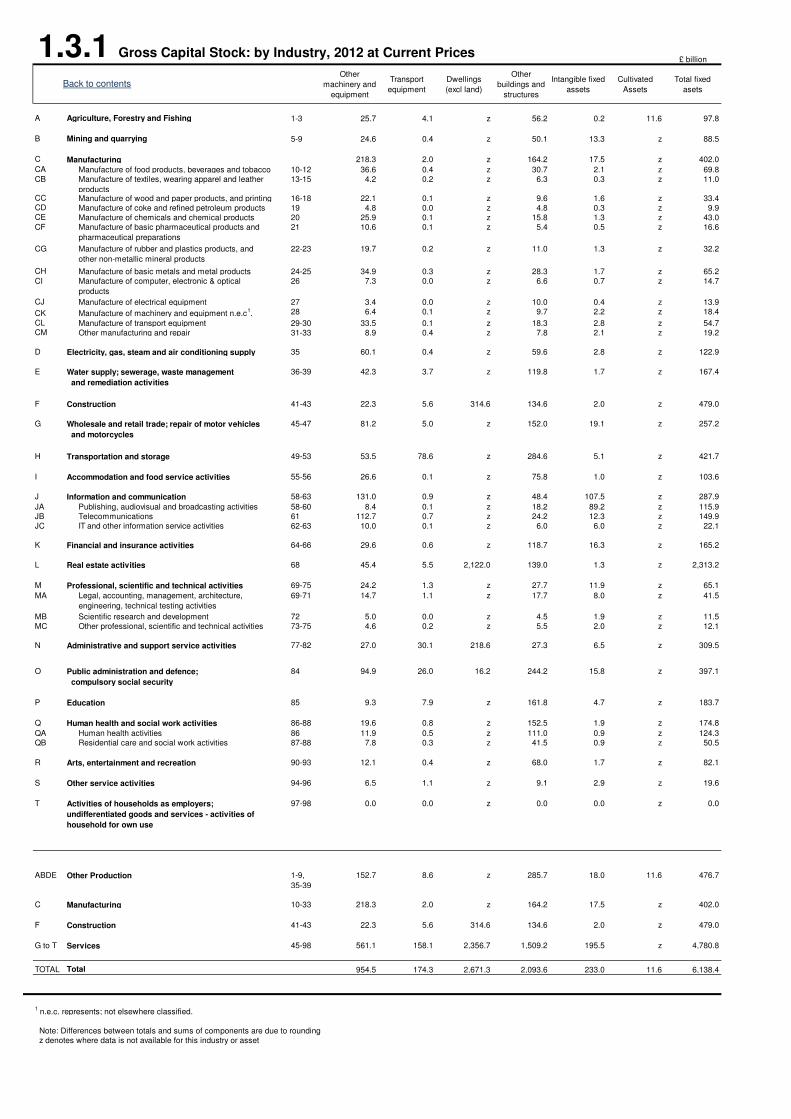
1.3.1 Gross Capital Stock: by Industry, 2012 at Current Prices£ billion
Other
machinery and
equipment
Transport
equipment
Dwellings
(excl land)
Other
buildings and
structures
Intangible fixed
assets
Cultivated
Assets
Total fixed
asets
A Agriculture, Forestry and Fishing 1-3 25.7 4.1 z 56.2 0.2 11.6 97.8
B Mining and quarrying 5-9 24.6 0.4 z 50.1 13.3 z 88.5
C Manufacturing 218.3 2.0 z 164.2 17.5 z 402.0
CA 10-12 36.6 0.4 z 30.7 2.1 z 69.8
CB 13-15 4.2 0.2 z 6.3 0.3 z 11.0
CC 16-18 22.1 0.1 z 9.6 1.6 z 33.4CD 19 4.8 0.0 z 4.8 0.3 z 9.9CE 20 25.9 0.1 z 15.8 1.3 z 43.0
CF 21 10.6 0.1 z 5.4 0.5 z 16.6
CG 22-23 19.7 0.2 z 11.0 1.3 z 32.2
CH 24-25 34.9 0.3 z 28.3 1.7 z 65.2
CI 26 7.3 0.0 z 6.6 0.7 z 14.7
CJ 27 3.4 0.0 z 10.0 0.4 z 13.9
CK 28 6.4 0.1 z 9.7 2.2 z 18.4
CL 29-30 33.5 0.1 z 18.3 2.8 z 54.7CM 31-33 8.9 0.4 z 7.8 2.1 z 19.2
D 35 60.1 0.4 z 59.6 2.8 z 122.9
E 36-39 42.3 3.7 z 119.8 1.7 z 167.4
F Construction 41-43 22.3 5.6 314.6 134.6 2.0 z 479.0
G 45-47 81.2 5.0 z 152.0 19.1 z 257.2
H Transportation and storage 49-53 53.5 78.6 z 284.6 5.1 z 421.7
I Accommodation and food service activities 55-56 26.6 0.1 z 75.8 1.0 z 103.6
J Information and communication 58-63 131.0 0.9 z 48.4 107.5 z 287.9
JA Publishing, audiovisual and broadcasting activities 58-60 8.4 0.1 z 18.2 89.2 z 115.9
JB Telecommunications 61 112.7 0.7 z 24.2 12.3 z 149.9
JC IT and other information service activities 62-63 10.0 0.1 z 6.0 6.0 z 22.1
K Financial and insurance activities 64-66 29.6 0.6 z 118.7 16.3 z 165.2
L Real estate activities 68 45.4 5.5 2,122.0 139.0 1.3 z 2,313.2
M Professional, scientific and technical activities 69-75 24.2 1.3 z 27.7 11.9 z 65.1
MA 69-71 14.7 1.1 z 17.7 8.0 z 41.5
MB Scientific research and development 72 5.0 0.0 z 4.5 1.9 z 11.5
MC Other professional, scientific and technical activities 73-75 4.6 0.2 z 5.5 2.0 z 12.1
N Administrative and support service activities 77-82 27.0 30.1 218.6 27.3 6.5 z 309.5
O 84 94.9 26.0 16.2 244.2 15.8 z 397.1
P Education 85 9.3 7.9 z 161.8 4.7 z 183.7
Q Human health and social work activities 86-88 19.6 0.8 z 152.5 1.9 z 174.8
QA Human health activities 86 11.9 0.5 z 111.0 0.9 z 124.3
QB Residential care and social work activities 87-88 7.8 0.3 z 41.5 0.9 z 50.5
R Arts, entertainment and recreation 90-93 12.1 0.4 z 68.0 1.7 z 82.1
S Other service activities 94-96 6.5 1.1 z 9.1 2.9 z 19.6
T 97-98 0.0 0.0 z 0.0 0.0 z 0.0
ABDE Other Production 1-9,
35-39
152.7 8.6 z 285.7 18.0 11.6 476.7
C Manufacturing 10-33 218.3 2.0 z 164.2 17.5 z 402.0
F Construction 41-43 22.3 5.6 314.6 134.6 2.0 z 479.0
G to T Services 45-98 561.1 158.1 2,356.7 1,509.2 195.5 z 4,780.8
TOTAL Total 954.5 174.3 2,671.3 2,093.6 233.0 11.6 6,138.4
1 n.e.c. represents; not elsewhere classified.
Note: Differences between totals and sums of components are due to rounding
z denotes where data is not available for this industry or asset
Public administration and defence;
compulsory social security
Activities of households as employers;
undifferentiated goods and services - activities of
household for own use
Manufacture of transport equipment
Other manufacturing and repair
Electricity, gas, steam and air conditioning supply
Water supply; sewerage, waste management
and remediation activities
Wholesale and retail trade; repair of motor vehicles
and motorcycles
Legal, accounting, management, architecture,
engineering, technical testing activities
Manufacture of machinery and equipment n.e.c1.
Back to contents
Manufacture of food products, beverages and tobacco
Manufacture of textiles, wearing apparel and leather
products Manufacture of wood and paper products, and printing
Manufacture of coke and refined petroleum products
Manufacture of chemicals and chemical products
Manufacture of basic pharmaceutical products and
pharmaceutical preparations
Manufacture of rubber and plastics products, and
other non-metallic mineral products
Manufacture of basic metals and metal products
Manufacture of computer, electronic & optical
products
Manufacture of electrical equipment
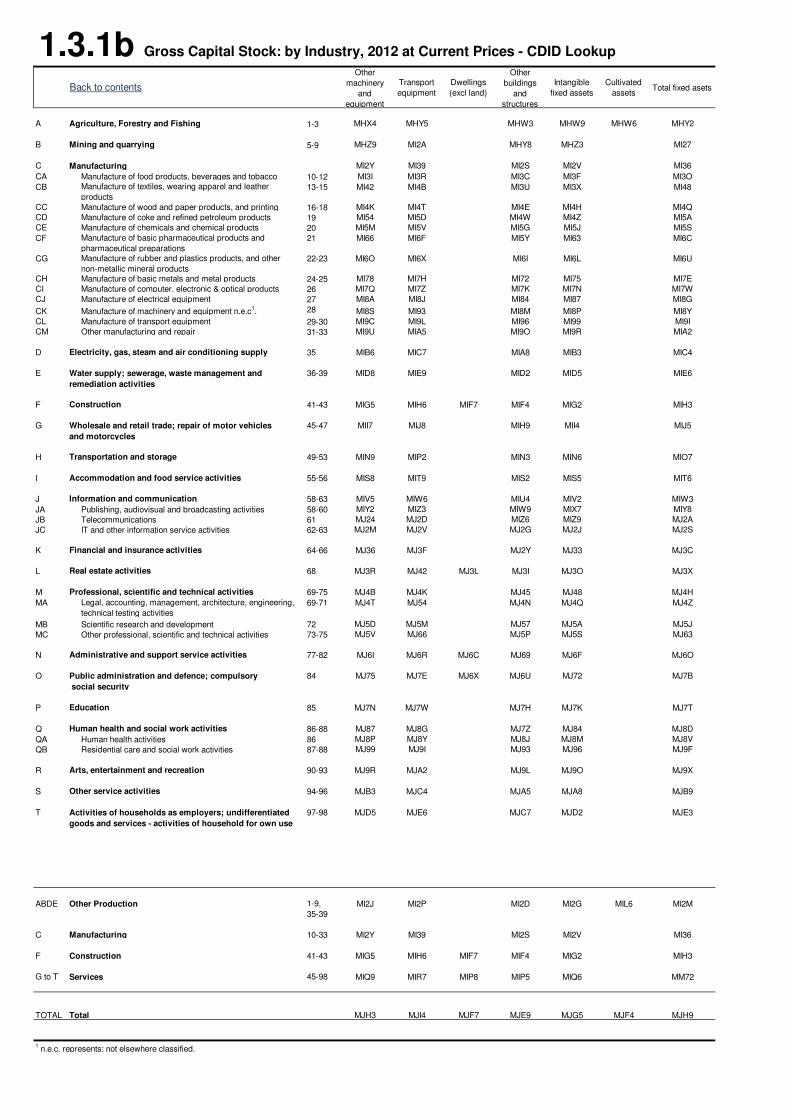
1.3.1b Gross Capital Stock: by Industry, 2012 at Current Prices - CDID Lookup
Back to contents
Other
machinery
and
equipment
Transport
equipment
Dwellings
(excl land)
Other
buildings
and
structures
Intangible
fixed assets
Cultivated
assetsTotal fixed asets
A Agriculture, Forestry and Fishing 1-3 MHX4 MHY5 MHW3 MHW9 MHW6 MHY2
B Mining and quarrying 5-9 MHZ9 MI2A MHY8 MHZ3 MI27
C Manufacturing MI2Y MI39 MI2S MI2V MI36
CA Manufacture of food products, beverages and tobacco 10-12 MI3I MI3R MI3C MI3F MI3O
CB Manufacture of textiles, wearing apparel and leather
products13-15 MI42 MI4B MI3U MI3X MI48
CC Manufacture of wood and paper products, and printing 16-18 MI4K MI4T MI4E MI4H MI4Q
CD Manufacture of coke and refined petroleum products 19 MI54 MI5D MI4W MI4Z MI5A
CE Manufacture of chemicals and chemical products 20 MI5M MI5V MI5G MI5J MI5S
CF Manufacture of basic pharmaceutical products and
pharmaceutical preparations
21 MI66 MI6F MI5Y MI63 MI6C
CG Manufacture of rubber and plastics products, and other
non-metallic mineral products
22-23 MI6O MI6X MI6I MI6L MI6U
CH Manufacture of basic metals and metal products 24-25 MI78 MI7H MI72 MI75 MI7E
CI Manufacture of computer, electronic & optical products 26 MI7Q MI7Z MI7K MI7N MI7W
CJ Manufacture of electrical equipment 27 MI8A MI8J MI84 MI87 MI8G
CK Manufacture of machinery and equipment n.e.c1. 28 MI8S MI93 MI8M MI8P MI8Y
CL Manufacture of transport equipment 29-30 MI9C MI9L MI96 MI99 MI9I
CM Other manufacturing and repair 31-33 MI9U MIA5 MI9O MI9R MIA2
D Electricity, gas, steam and air conditioning supply 35 MIB6 MIC7 MIA8 MIB3 MIC4
E Water supply; sewerage, waste management and
remediation activities
36-39 MID8 MIE9 MID2 MID5 MIE6
F Construction 41-43 MIG5 MIH6 MIF7 MIF4 MIG2 MIH3
G Wholesale and retail trade; repair of motor vehicles
and motorcycles
45-47 MII7 MIJ8 MIH9 MII4 MIJ5
H Transportation and storage 49-53 MIN9 MIP2 MIN3 MIN6 MIO7
I Accommodation and food service activities 55-56 MIS8 MIT9 MIS2 MIS5 MIT6
J Information and communication 58-63 MIV5 MIW6 MIU4 MIV2 MIW3
JA Publishing, audiovisual and broadcasting activities 58-60 MIY2 MIZ3 MIW9 MIX7 MIY8
JB Telecommunications 61 MJ24 MJ2D MIZ6 MIZ9 MJ2A
JC IT and other information service activities 62-63 MJ2M MJ2V MJ2G MJ2J MJ2S
K Financial and insurance activities 64-66 MJ36 MJ3F MJ2Y MJ33 MJ3C
L Real estate activities 68 MJ3R MJ42 MJ3L MJ3I MJ3O MJ3X
M Professional, scientific and technical activities 69-75 MJ4B MJ4K MJ45 MJ48 MJ4H
MA Legal, accounting, management, architecture, engineering,
technical testing activities
69-71 MJ4T MJ54 MJ4N MJ4Q MJ4Z
MB Scientific research and development 72 MJ5D MJ5M MJ57 MJ5A MJ5J
MC Other professional, scientific and technical activities 73-75 MJ5V MJ66 MJ5P MJ5S MJ63
N Administrative and support service activities 77-82 MJ6I MJ6R MJ6C MJ69 MJ6F MJ6O
O Public administration and defence; compulsory
social security
84 MJ75 MJ7E MJ6X MJ6U MJ72 MJ7B
P Education 85 MJ7N MJ7W MJ7H MJ7K MJ7T
Q Human health and social work activities 86-88 MJ87 MJ8G MJ7Z MJ84 MJ8D
QA Human health activities 86 MJ8P MJ8Y MJ8J MJ8M MJ8V
QB Residential care and social work activities 87-88 MJ99 MJ9I MJ93 MJ96 MJ9F
R Arts, entertainment and recreation 90-93 MJ9R MJA2 MJ9L MJ9O MJ9X
S Other service activities 94-96 MJB3 MJC4 MJA5 MJA8 MJB9
T 97-98 MJD5 MJE6 MJC7 MJD2 MJE3
ABDE Other Production 1-9,
35-39
MI2J MI2P MI2D MI2G MIL6 MI2M
C Manufacturing 10-33 MI2Y MI39 MI2S MI2V MI36
F Construction 41-43 MIG5 MIH6 MIF7 MIF4 MIG2 MIH3
G to T Services 45-98 MIQ9 MIR7 MIP8 MIP5 MIQ6 MM72
TOTAL Total MJH3 MJI4 MJF7 MJE9 MJG5 MJF4 MJH9
1 n.e.c. represents; not elsewhere classified.
Activities of households as employers; undifferentiated
goods and services - activities of household for own use
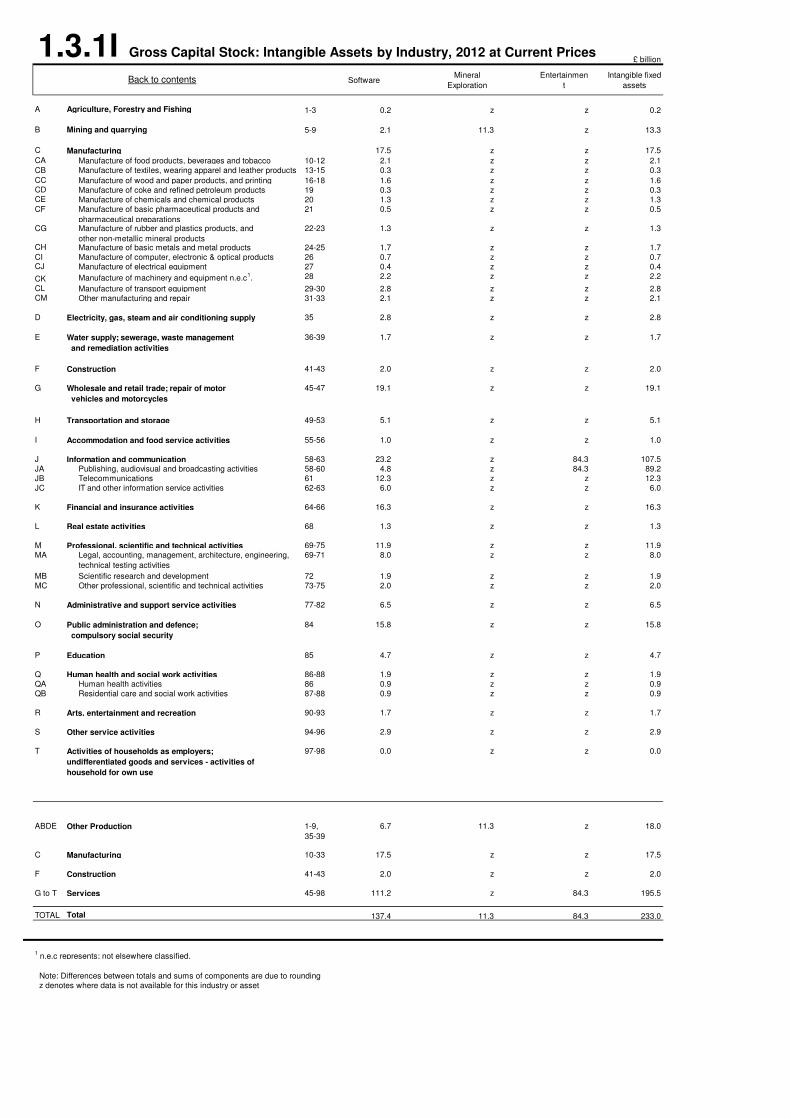
1.3.1I£ billion
SoftwareMineral
Exploration
Entertainmen
t
Intangible fixed
assets
A Agriculture, Forestry and Fishing 1-3 0.2 z z 0.2
B Mining and quarrying 5-9 2.1 11.3 z 13.3
C Manufacturing 17.5 z z 17.5
CA 10-12 2.1 z z 2.1
CB 13-15 0.3 z z 0.3
CC 16-18 1.6 z z 1.6CD 19 0.3 z z 0.3CE 20 1.3 z z 1.3
CF 21 0.5 z z 0.5
CG 22-23 1.3 z z 1.3
CH 24-25 1.7 z z 1.7
CI 26 0.7 z z 0.7CJ 27 0.4 z z 0.4
CK 28 2.2 z z 2.2
CL 29-30 2.8 z z 2.8CM 31-33 2.1 z z 2.1
D 35 2.8 z z 2.8
E 36-39 1.7 z z 1.7
F Construction 41-43 2.0 z z 2.0
G 45-47 19.1 z z 19.1
H Transportation and storage 49-53 5.1 z z 5.1
I Accommodation and food service activities 55-56 1.0 z z 1.0
J Information and communication 58-63 23.2 z 84.3 107.5
JA Publishing, audiovisual and broadcasting activities 58-60 4.8 z 84.3 89.2
JB Telecommunications 61 12.3 z z 12.3
JC IT and other information service activities 62-63 6.0 z z 6.0
K Financial and insurance activities 64-66 16.3 z z 16.3
L Real estate activities 68 1.3 z z 1.3
M Professional, scientific and technical activities 69-75 11.9 z z 11.9
MA 69-71 8.0 z z 8.0
MB Scientific research and development 72 1.9 z z 1.9
MC Other professional, scientific and technical activities 73-75 2.0 z z 2.0
N Administrative and support service activities 77-82 6.5 z z 6.5
O 84 15.8 z z 15.8
P Education 85 4.7 z z 4.7
Q Human health and social work activities 86-88 1.9 z z 1.9
QA Human health activities 86 0.9 z z 0.9
QB Residential care and social work activities 87-88 0.9 z z 0.9
R Arts, entertainment and recreation 90-93 1.7 z z 1.7
S Other service activities 94-96 2.9 z z 2.9
T 97-98 0.0 z z 0.0
ABDE Other Production 1-9,
35-39
6.7 11.3 z 18.0
C Manufacturing 10-33 17.5 z z 17.5
F Construction 41-43 2.0 z z 2.0
G to T Services 45-98 111.2 z 84.3 195.5
TOTAL Total 137.4 11.3 84.3 233.0
1 n.e.c represents; not elsewhere classified.
Note: Differences between totals and sums of components are due to rounding
z denotes where data is not available for this industry or asset
Activities of households as employers;
undifferentiated goods and services - activities of
household for own use
Wholesale and retail trade; repair of motor
vehicles and motorcycles
Legal, accounting, management, architecture, engineering,
technical testing activities
Public administration and defence;
compulsory social security
Water supply; sewerage, waste management
and remediation activities
Manufacture of electrical equipment
Manufacture of machinery and equipment n.e.c1.
Manufacture of transport equipment
Other manufacturing and repair
Electricity, gas, steam and air conditioning supply
Manufacture of rubber and plastics products, and
other non-metallic mineral products Manufacture of basic metals and metal products
Manufacture of computer, electronic & optical products
Manufacture of coke and refined petroleum products
Manufacture of chemicals and chemical products
Manufacture of basic pharmaceutical products and
pharmaceutical preparations
Back to contents
Manufacture of food products, beverages and tobacco
Manufacture of textiles, wearing apparel and leather products
Manufacture of wood and paper products, and printing
Gross Capital Stock: Intangible Assets by Industry, 2012 at Current Prices
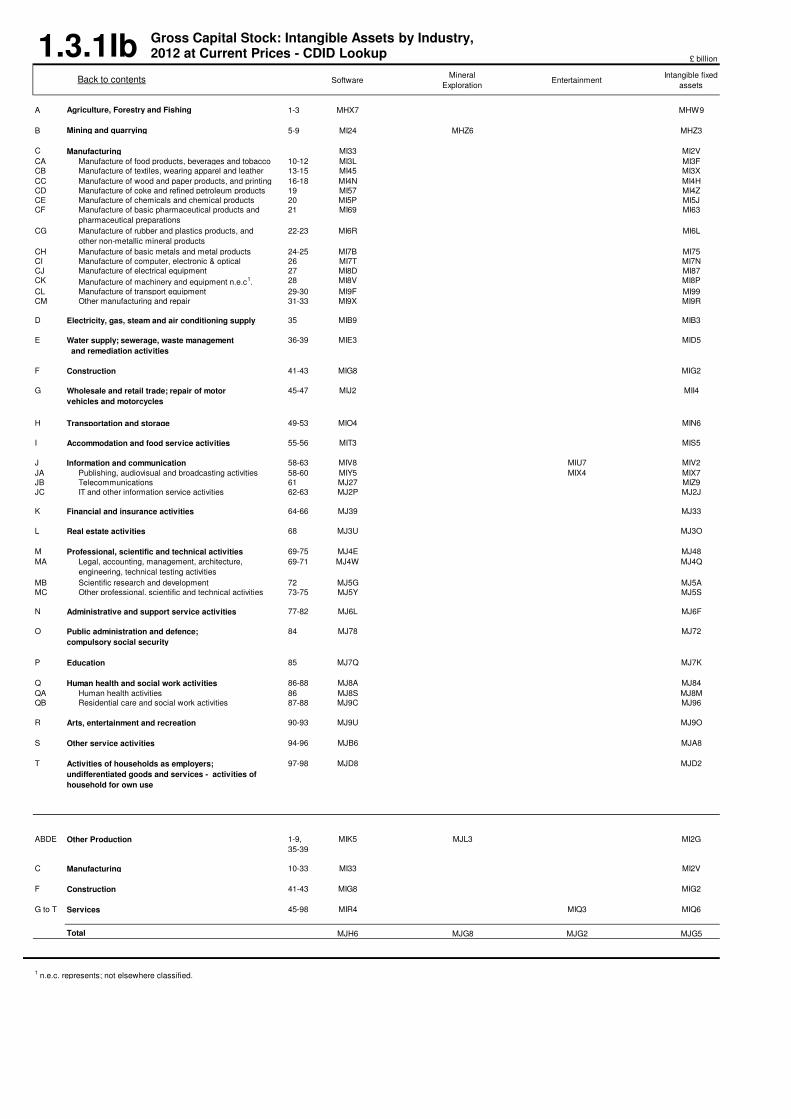
1.3.1Ib£ billion
SoftwareMineral
ExplorationEntertainment
Intangible fixed
assets
A Agriculture, Forestry and Fishing 1-3 MHX7 MHW9
B Mining and quarrying 5-9 MI24 MHZ6 MHZ3
C Manufacturing MI33 MI2V
CA 10-12 MI3L MI3F
CB 13-15 MI45 MI3X
CC 16-18 MI4N MI4H
CD 19 MI57 MI4Z
CE 20 MI5P MI5J
CF 21 MI69 MI63
CG 22-23 MI6R MI6L
CH 24-25 MI7B MI75
CI 26 MI7T MI7N
CJ 27 MI8D MI87
CK 28 MI8V MI8P
CL 29-30 MI9F MI99
CM 31-33 MI9X MI9R
D 35 MIB9 MIB3
E 36-39 MIE3 MID5
F Construction 41-43 MIG8 MIG2
G 45-47 MIJ2 MII4
H Transportation and storage 49-53 MIO4 MIN6
I Accommodation and food service activities 55-56 MIT3 MIS5
J Information and communication 58-63 MIV8 MIU7 MIV2
JA Publishing, audiovisual and broadcasting activities 58-60 MIY5 MIX4 MIX7
JB Telecommunications 61 MJ27 MIZ9
JC IT and other information service activities 62-63 MJ2P MJ2J
K Financial and insurance activities 64-66 MJ39 MJ33
L Real estate activities 68 MJ3U MJ3O
M Professional, scientific and technical activities 69-75 MJ4E MJ48
MA 69-71 MJ4W MJ4Q
MB Scientific research and development 72 MJ5G MJ5A
MC Other professional, scientific and technical activities 73-75 MJ5Y MJ5S
N Administrative and support service activities 77-82 MJ6L MJ6F
O 84 MJ78 MJ72
P Education 85 MJ7Q MJ7K
Q Human health and social work activities 86-88 MJ8A MJ84
QA Human health activities 86 MJ8S MJ8M
QB Residential care and social work activities 87-88 MJ9C MJ96
R Arts, entertainment and recreation 90-93 MJ9U MJ9O
S Other service activities 94-96 MJB6 MJA8
T 97-98 MJD8 MJD2
ABDE Other Production 1-9,
35-39
MIK5 MJL3 MI2G
C Manufacturing 10-33 MI33 MI2V
F Construction 41-43 MIG8 MIG2
G to T Services 45-98 MIR4 MIQ3 MIQ6
Total MJH6 MJG8 MJG2 MJG5
1 n.e.c. represents; not elsewhere classified.
Public administration and defence;
compulsory social security
Activities of households as employers;
undifferentiated goods and services - activities of
household for own use
Manufacture of transport equipment
Other manufacturing and repair
Electricity, gas, steam and air conditioning supply
Water supply; sewerage, waste management
and remediation activities
Wholesale and retail trade; repair of motor
vehicles and motorcycles
Legal, accounting, management, architecture,
engineering, technical testing activities
Manufacture of machinery and equipment n.e.c1.
Back to contents
Manufacture of food products, beverages and tobacco
Manufacture of textiles, wearing apparel and leather
Manufacture of wood and paper products, and printing
Manufacture of coke and refined petroleum products
Manufacture of chemicals and chemical products
Manufacture of basic pharmaceutical products and
pharmaceutical preparations
Manufacture of rubber and plastics products, and
other non-metallic mineral products
Manufacture of basic metals and metal products
Manufacture of computer, electronic & optical
Manufacture of electrical equipment
Gross Capital Stock: Intangible Assets by Industry, 2012 at Current Prices - CDID Lookup
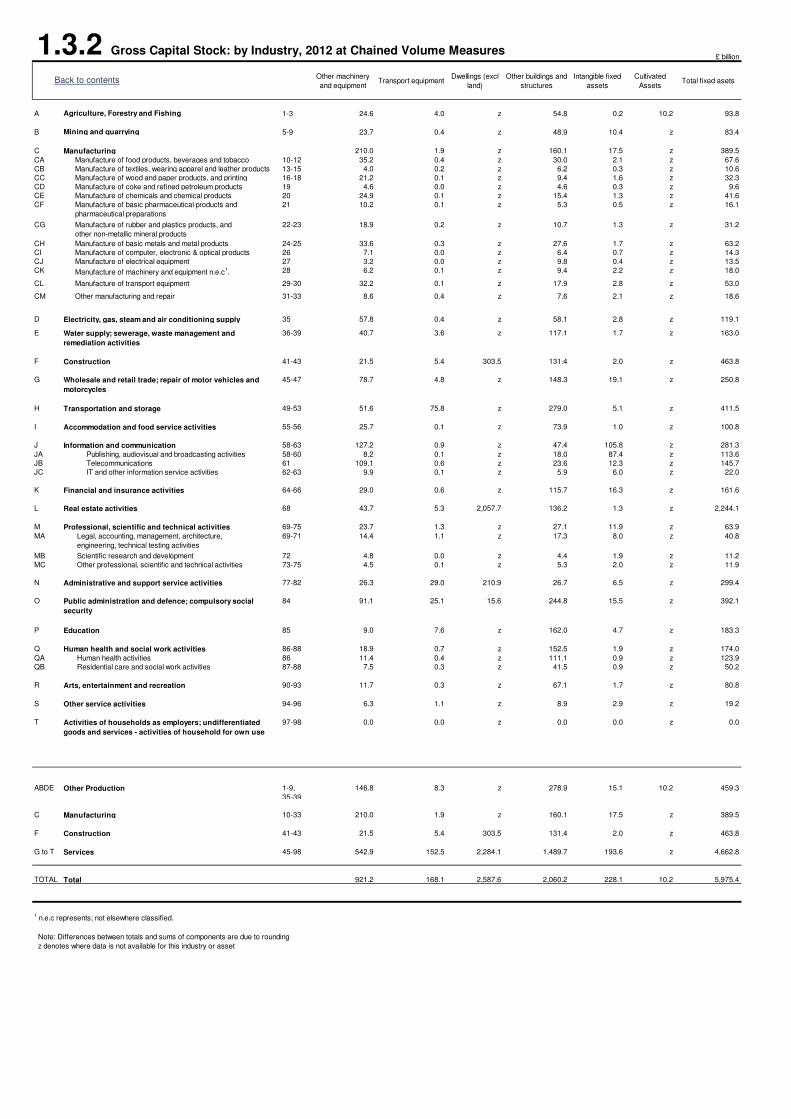
1.3.2 Gross Capital Stock: by Industry, 2012 at Chained Volume Measures£ billion
Other machinery
and equipmentTransport equipment
Dwellings (excl
land)
Other buildings and
structures
Intangible fixed
assets
Cultivated
AssetsTotal fixed asets
A Agriculture, Forestry and Fishing 1-3 24.6 4.0 z 54.8 0.2 10.2 93.8
B Mining and quarrying 5-9 23.7 0.4 z 48.9 10.4 z 83.4
C Manufacturing 210.0 1.9 z 160.1 17.5 z 389.5
CA 10-12 35.2 0.4 z 30.0 2.1 z 67.6
CB 13-15 4.0 0.2 z 6.2 0.3 z 10.6
CC 16-18 21.2 0.1 z 9.4 1.6 z 32.3
CD 19 4.6 0.0 z 4.6 0.3 z 9.6
CE 20 24.9 0.1 z 15.4 1.3 z 41.6
CF 21 10.2 0.1 z 5.3 0.5 z 16.1
CG 22-23 18.9 0.2 z 10.7 1.3 z 31.2
CH 24-25 33.6 0.3 z 27.6 1.7 z 63.2
CI 26 7.1 0.0 z 6.4 0.7 z 14.3
CJ 27 3.2 0.0 z 9.8 0.4 z 13.5
CK 28 6.2 0.1 z 9.4 2.2 z 18.0
CL 29-30 32.2 0.1 z 17.9 2.8 z 53.0
CM 31-33 8.6 0.4 z 7.6 2.1 z 18.6
D 35 57.8 0.4 z 58.1 2.8 z 119.1
E 36-39 40.7 3.6 z 117.1 1.7 z 163.0
F Construction 41-43 21.5 5.4 303.5 131.4 2.0 z 463.8
G 45-47 78.7 4.8 z 148.3 19.1 z 250.8
H Transportation and storage 49-53 51.6 75.8 z 279.0 5.1 z 411.5
I Accommodation and food service activities 55-56 25.7 0.1 z 73.9 1.0 z 100.8
J Information and communication 58-63 127.2 0.9 z 47.4 105.8 z 281.3
JA Publishing, audiovisual and broadcasting activities 58-60 8.2 0.1 z 18.0 87.4 z 113.6
JB Telecommunications 61 109.1 0.6 z 23.6 12.3 z 145.7
JC IT and other information service activities 62-63 9.9 0.1 z 5.9 6.0 z 22.0
K Financial and insurance activities 64-66 29.0 0.6 z 115.7 16.3 z 161.6
L Real estate activities 68 43.7 5.3 2,057.7 136.2 1.3 z 2,244.1
M Professional, scientific and technical activities 69-75 23.7 1.3 z 27.1 11.9 z 63.9
MA 69-71 14.4 1.1 z 17.3 8.0 z 40.8
MB Scientific research and development 72 4.8 0.0 z 4.4 1.9 z 11.2
MC Other professional, scientific and technical activities 73-75 4.5 0.1 z 5.3 2.0 z 11.9
N Administrative and support service activities 77-82 26.3 29.0 210.9 26.7 6.5 z 299.4
O 84 91.1 25.1 15.6 244.8 15.5 z 392.1
P Education 85 9.0 7.6 z 162.0 4.7 z 183.3
Q Human health and social work activities 86-88 18.9 0.7 z 152.5 1.9 z 174.0
QA Human health activities 86 11.4 0.4 z 111.1 0.9 z 123.9
QB Residential care and social work activities 87-88 7.5 0.3 z 41.5 0.9 z 50.2
R Arts, entertainment and recreation 90-93 11.7 0.3 z 67.1 1.7 z 80.8
S Other service activities 94-96 6.3 1.1 z 8.9 2.9 z 19.2
T 97-98 0.0 0.0 z 0.0 0.0 z 0.0
ABDE Other Production 1-9,
35-39
146.8 8.3 z 278.9 15.1 10.2 459.3
C Manufacturing 10-33 210.0 1.9 z 160.1 17.5 z 389.5
F Construction 41-43 21.5 5.4 303.5 131.4 2.0 z 463.8
G to T Services 45-98 542.9 152.5 2,284.1 1,489.7 193.6 z 4,662.8
TOTAL Total 921.2 168.1 2,587.6 2,060.2 228.1 10.2 5,975.4
1 n.e.c represents; not elsewhere classified.
Note: Differences between totals and sums of components are due to rounding
z denotes where data is not available for this industry or asset
Public administration and defence; compulsory social
security
Activities of households as employers; undifferentiated
goods and services - activities of household for own use
Manufacture of transport equipment
Other manufacturing and repair
Electricity, gas, steam and air conditioning supply
Water supply; sewerage, waste management and
remediation activities
Wholesale and retail trade; repair of motor vehicles and
motorcycles
Legal, accounting, management, architecture,
engineering, technical testing activities
Manufacture of machinery and equipment n.e.c1.
Back to contents
Manufacture of food products, beverages and tobacco
Manufacture of textiles, wearing apparel and leather products
Manufacture of wood and paper products, and printing
Manufacture of coke and refined petroleum products
Manufacture of chemicals and chemical products
Manufacture of basic pharmaceutical products and
pharmaceutical preparations
Manufacture of rubber and plastics products, and
other non-metallic mineral products
Manufacture of basic metals and metal products
Manufacture of computer, electronic & optical products
Manufacture of electrical equipment
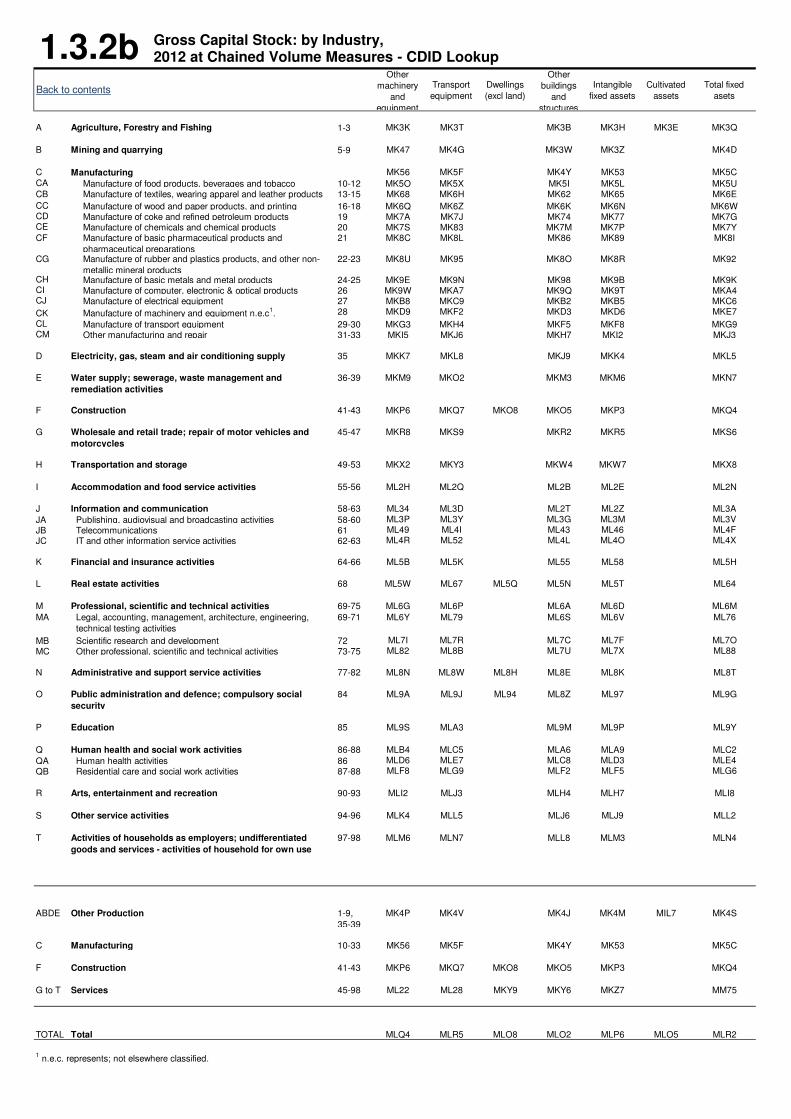
1.3.2bBack to contents
Other
machinery
and
equipment
Transport
equipment
Dwellings
(excl land)
Other
buildings
and
structures
Intangible
fixed assets
Cultivated
assets
Total fixed
asets
A Agriculture, Forestry and Fishing 1-3 MK3K MK3T MK3B MK3H MK3E MK3Q
B Mining and quarrying 5-9 MK47 MK4G MK3W MK3Z MK4D
C Manufacturing MK56 MK5F MK4Y MK53 MK5C
CA Manufacture of food products, beverages and tobacco 10-12 MK5O MK5X MK5I MK5L MK5UCB Manufacture of textiles, wearing apparel and leather products 13-15 MK68 MK6H MK62 MK65 MK6E
CC Manufacture of wood and paper products, and printing 16-18 MK6Q MK6Z MK6K MK6N MK6WCD Manufacture of coke and refined petroleum products 19 MK7A MK7J MK74 MK77 MK7GCE Manufacture of chemicals and chemical products 20 MK7S MK83 MK7M MK7P MK7YCF Manufacture of basic pharmaceutical products and
pharmaceutical preparations
21 MK8C MK8L MK86 MK89 MK8I
CG Manufacture of rubber and plastics products, and other non-
metallic mineral products
22-23 MK8U MK95 MK8O MK8R MK92
CH Manufacture of basic metals and metal products 24-25 MK9E MK9N MK98 MK9B MK9KCI Manufacture of computer, electronic & optical products 26 MK9W MKA7 MK9Q MK9T MKA4CJ Manufacture of electrical equipment 27 MKB8 MKC9 MKB2 MKB5 MKC6
CK Manufacture of machinery and equipment n.e.c1. 28 MKD9 MKF2 MKD3 MKD6 MKE7
CL Manufacture of transport equipment 29-30 MKG3 MKH4 MKF5 MKF8 MKG9CM Other manufacturing and repair 31-33 MKI5 MKJ6 MKH7 MKI2 MKJ3
D Electricity, gas, steam and air conditioning supply 35 MKK7 MKL8 MKJ9 MKK4 MKL5
E Water supply; sewerage, waste management and
remediation activities
36-39 MKM9 MKO2 MKM3 MKM6 MKN7
F Construction 41-43 MKP6 MKQ7 MKO8 MKO5 MKP3 MKQ4
G Wholesale and retail trade; repair of motor vehicles and
motorcycles
45-47 MKR8 MKS9 MKR2 MKR5 MKS6
H Transportation and storage 49-53 MKX2 MKY3 MKW4 MKW7 MKX8
I Accommodation and food service activities 55-56 ML2H ML2Q ML2B ML2E ML2N
J Information and communication 58-63 ML34 ML3D ML2T ML2Z ML3A
JA Publishing, audiovisual and broadcasting activities 58-60 ML3P ML3Y ML3G ML3M ML3V
JB Telecommunications 61 ML49 ML4I ML43 ML46 ML4F
JC IT and other information service activities 62-63 ML4R ML52 ML4L ML4O ML4X
K Financial and insurance activities 64-66 ML5B ML5K ML55 ML58 ML5H
L Real estate activities 68 ML5W ML67 ML5Q ML5N ML5T ML64
M Professional, scientific and technical activities 69-75 ML6G ML6P ML6A ML6D ML6M
MA Legal, accounting, management, architecture, engineering,
technical testing activities
69-71 ML6Y ML79 ML6S ML6V ML76
MB Scientific research and development 72 ML7I ML7R ML7C ML7F ML7O
MC Other professional, scientific and technical activities 73-75 ML82 ML8B ML7U ML7X ML88
N Administrative and support service activities 77-82 ML8N ML8W ML8H ML8E ML8K ML8T
O Public administration and defence; compulsory social
security
84 ML9A ML9J ML94 ML8Z ML97 ML9G
P Education 85 ML9S MLA3 ML9M ML9P ML9Y
Q Human health and social work activities 86-88 MLB4 MLC5 MLA6 MLA9 MLC2
QA Human health activities 86 MLD6 MLE7 MLC8 MLD3 MLE4
QB Residential care and social work activities 87-88 MLF8 MLG9 MLF2 MLF5 MLG6
R Arts, entertainment and recreation 90-93 MLI2 MLJ3 MLH4 MLH7 MLI8
S Other service activities 94-96 MLK4 MLL5 MLJ6 MLJ9 MLL2
T Activities of households as employers; undifferentiated
goods and services - activities of household for own use
97-98 MLM6 MLN7 MLL8 MLM3 MLN4
ABDE Other Production 1-9,
35-39
MK4P MK4V MK4J MK4M MIL7 MK4S
C Manufacturing 10-33 MK56 MK5F MK4Y MK53 MK5C
F Construction 41-43 MKP6 MKQ7 MKO8 MKO5 MKP3 MKQ4
G to T Services 45-98 ML22 ML28 MKY9 MKY6 MKZ7 MM75
TOTAL Total MLQ4 MLR5 MLO8 MLO2 MLP6 MLO5 MLR2
1 n.e.c. represents; not elsewhere classified.
Gross Capital Stock: by Industry, 2012 at Chained Volume Measures - CDID Lookup
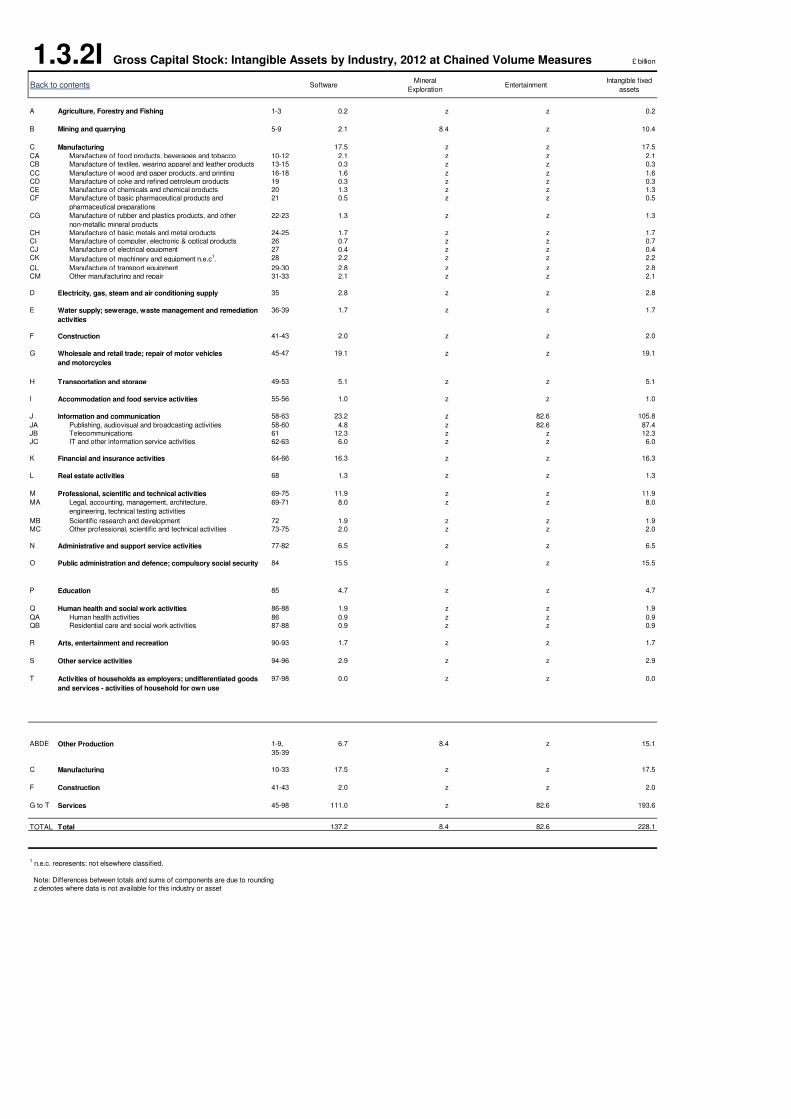
1.3.2I £ billion
Back to contents SoftwareMineral
ExplorationEntertainment
Intangible fixed
assets
A Agriculture, Forestry and Fishing 1-3 0.2 z z 0.2
B Mining and quarrying 5-9 2.1 8.4 z 10.4
C Manufacturing 17.5 z z 17.5
CA Manufacture of food products, beverages and tobacco 10-12 2.1 z z 2.1CB Manufacture of textiles, wearing apparel and leather products 13-15 0.3 z z 0.3
CC Manufacture of wood and paper products, and printing 16-18 1.6 z z 1.6CD Manufacture of coke and refined petroleum products 19 0.3 z z 0.3CE Manufacture of chemicals and chemical products 20 1.3 z z 1.3CF Manufacture of basic pharmaceutical products and
pharmaceutical preparations
21 0.5 z z 0.5
CG Manufacture of rubber and plastics products, and other
non-metallic mineral products
22-23 1.3 z z 1.3
CH Manufacture of basic metals and metal products 24-25 1.7 z z 1.7CI Manufacture of computer, electronic & optical products 26 0.7 z z 0.7CJ Manufacture of electrical equipment 27 0.4 z z 0.4CK Manufacture of machinery and equipment n.e.c
1. 28 2.2 z z 2.2
CL Manufacture of transport equipment 29-30 2.8 z z 2.8CM Other manufacturing and repair 31-33 2.1 z z 2.1
D Electricity, gas, steam and air conditioning supply 35 2.8 z z 2.8
E Water supply; sewerage, waste management and remediation
activities
36-39 1.7 z z 1.7
F Construction 41-43 2.0 z z 2.0
G Wholesale and retail trade; repair of motor vehicles
and motorcycles
45-47 19.1 z z 19.1
H Transportation and storage 49-53 5.1 z z 5.1
I Accommodation and food service activities 55-56 1.0 z z 1.0
J Information and communication 58-63 23.2 z 82.6 105.8
JA Publishing, audiovisual and broadcasting activities 58-60 4.8 z 82.6 87.4JB Telecommunications 61 12.3 z z 12.3JC IT and other information service activities 62-63 6.0 z z 6.0
K Financial and insurance activities 64-66 16.3 z z 16.3
L Real estate activities 68 1.3 z z 1.3
M Professional, scientific and technical activities 69-75 11.9 z z 11.9
MA Legal, accounting, management, architecture,
engineering, technical testing activities
69-71 8.0 z z 8.0
MB Scientific research and development 72 1.9 z z 1.9MC Other professional, scientific and technical activities 73-75 2.0 z z 2.0
N Administrative and support service activities 77-82 6.5 z z 6.5
O Public administration and defence; compulsory social security 84 15.5 z z 15.5
P Education 85 4.7 z z 4.7
Q Human health and social work activities 86-88 1.9 z z 1.9
QA Human health activities 86 0.9 z z 0.9QB Residential care and social work activities 87-88 0.9 z z 0.9
R Arts, entertainment and recreation 90-93 1.7 z z 1.7
S Other service activities 94-96 2.9 z z 2.9
T Activities of households as employers; undifferentiated goods
and services - activities of household for own use
97-98 0.0 z z 0.0
ABDE Other Production 1-9,
35-39
6.7 8.4 z 15.1
C Manufacturing 10-33 17.5 z z 17.5
F Construction 41-43 2.0 z z 2.0
G to T Services 45-98 111.0 z 82.6 193.6
TOTAL Total 137.2 8.4 82.6 228.1
1 n.e.c. represents; not elsewhere classified.
Note: Differences between totals and sums of components are due to rounding z denotes where data is not available for this industry or asset
Gross Capital Stock: Intangible Assets by Industry, 2012 at Chained Volume Measures
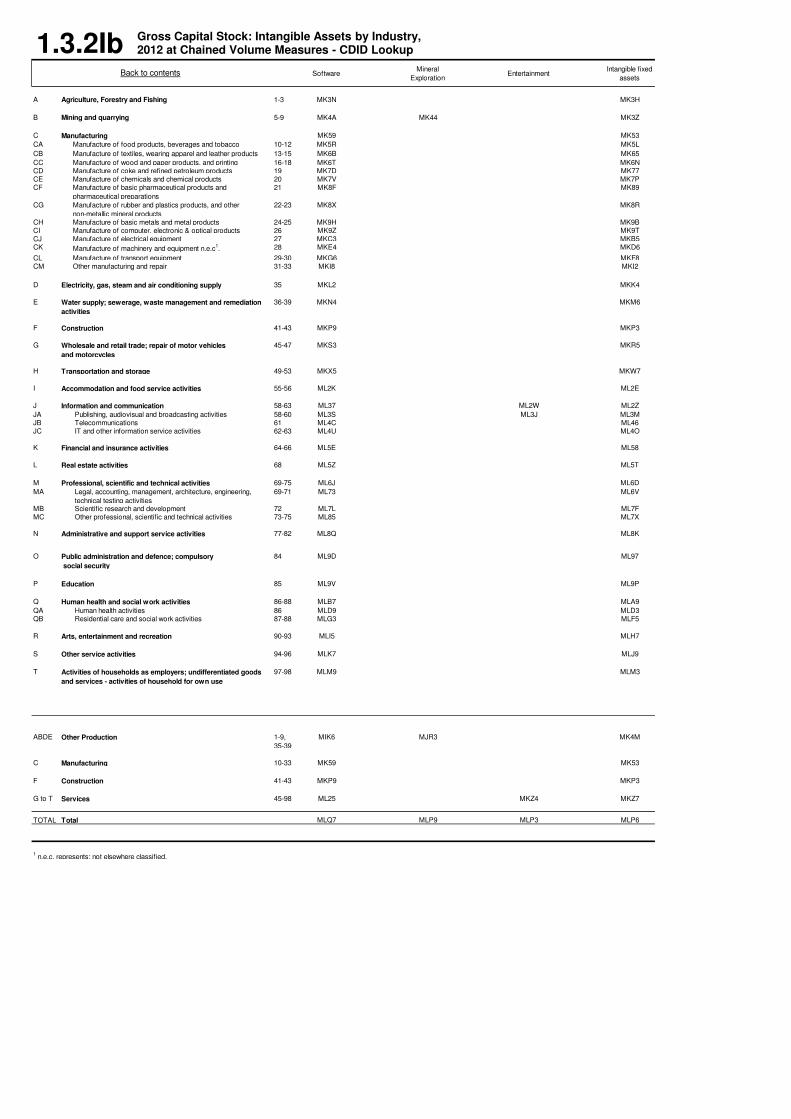
1.3.2IbSoftware
Mineral
ExplorationEntertainment
Intangible fixed
assets
A Agriculture, Forestry and Fishing 1-3 MK3N MK3H
B Mining and quarrying 5-9 MK4A MK44 MK3Z
C Manufacturing MK59 MK53
CA Manufacture of food products, beverages and tobacco 10-12 MK5R MK5L
CB Manufacture of textiles, wearing apparel and leather products 13-15 MK6B MK65
CC Manufacture of wood and paper products, and printing 16-18 MK6T MK6NCD Manufacture of coke and refined petroleum products 19 MK7D MK77CE Manufacture of chemicals and chemical products 20 MK7V MK7PCF Manufacture of basic pharmaceutical products and
pharmaceutical preparations
21 MK8F MK89
CG Manufacture of rubber and plastics products, and other
non-metallic mineral products
22-23 MK8X MK8R
CH Manufacture of basic metals and metal products 24-25 MK9H MK9BCI Manufacture of computer, electronic & optical products 26 MK9Z MK9TCJ Manufacture of electrical equipment 27 MKC3 MKB5CK Manufacture of machinery and equipment n.e.c
1. 28 MKE4 MKD6
CL Manufacture of transport equipment 29-30 MKG6 MKF8CM Other manufacturing and repair 31-33 MKI8 MKI2
D Electricity, gas, steam and air conditioning supply 35 MKL2 MKK4
E Water supply; sewerage, waste management and remediation
activities
36-39 MKN4 MKM6
F Construction 41-43 MKP9 MKP3
G Wholesale and retail trade; repair of motor vehicles
and motorcycles
45-47 MKS3 MKR5
H Transportation and storage 49-53 MKX5 MKW7
I Accommodation and food service activities 55-56 ML2K ML2E
J Information and communication 58-63 ML37 ML2W ML2Z
JA Publishing, audiovisual and broadcasting activities 58-60 ML3S ML3J ML3MJB Telecommunications 61 ML4C ML46JC IT and other information service activities 62-63 ML4U ML4O
K Financial and insurance activities 64-66 ML5E ML58
L Real estate activities 68 ML5Z ML5T
M Professional, scientific and technical activities 69-75 ML6J ML6D
MA Legal, accounting, management, architecture, engineering,
technical testing activities
69-71 ML73 ML6V
MB Scientific research and development 72 ML7L ML7FMC Other professional, scientific and technical activities 73-75 ML85 ML7X
N Administrative and support service activities 77-82 ML8Q ML8K
O Public administration and defence; compulsory
social security
84 ML9D ML97
P Education 85 ML9V ML9P
Q Human health and social work activities 86-88 MLB7 MLA9
QA Human health activities 86 MLD9 MLD3QB Residential care and social work activities 87-88 MLG3 MLF5
R Arts, entertainment and recreation 90-93 MLI5 MLH7
S Other service activities 94-96 MLK7 MLJ9
T Activities of households as employers; undifferentiated goods
and services - activities of household for own use
97-98 MLM9 MLM3
ABDE Other Production 1-9,
35-39
MIK6 MJR3 MK4M
C Manufacturing 10-33 MK59 MK53
F Construction 41-43 MKP9 MKP3
G to T Services 45-98 ML25 MKZ4 MKZ7
TOTAL Total MLQ7 MLP9 MLP3 MLP6
1 n.e.c. represents; not elsewhere classified.
Back to contents
Gross Capital Stock: Intangible Assets by Industry, 2012 at Chained Volume Measures - CDID Lookup
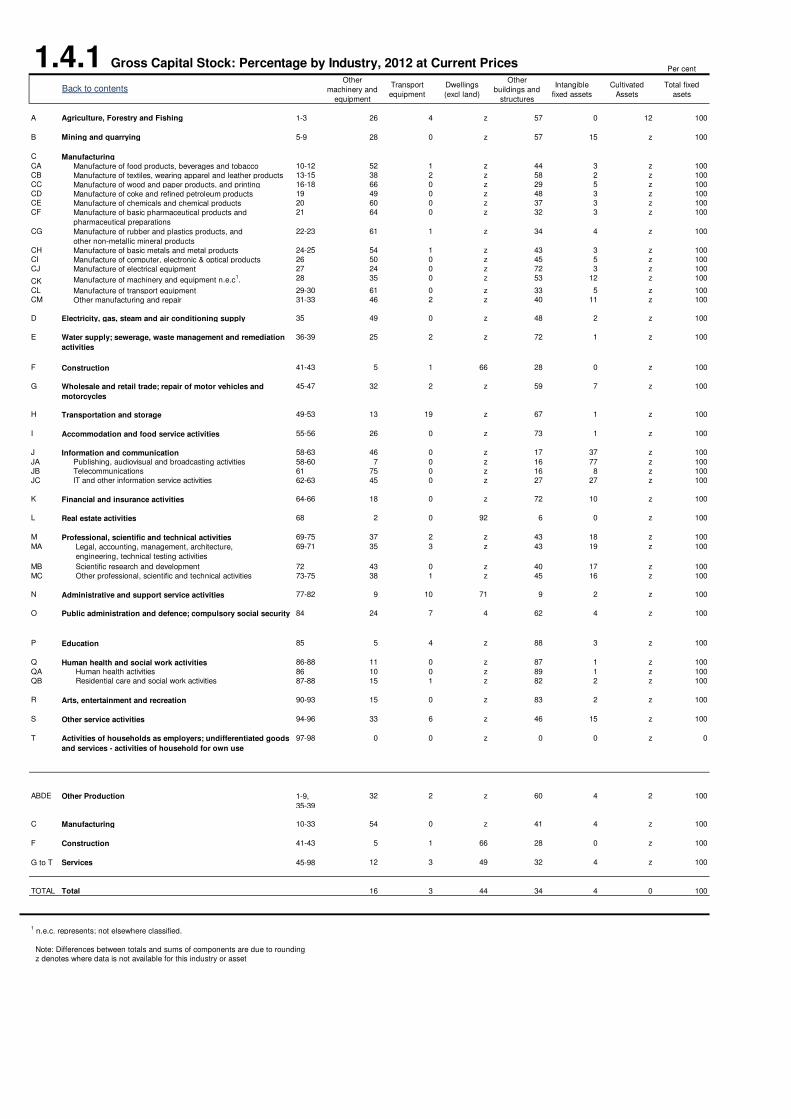
1.4.1 Gross Capital Stock: Percentage by Industry, 2012 at Current PricesPer cent
Other
machinery and
equipment
Transport
equipment
Dwellings
(excl land)
Other
buildings and
structures
Intangible
fixed assets
Cultivated
Assets
Total fixed
asets
A Agriculture, Forestry and Fishing 1-3 26 4 z 57 0 12 100
B Mining and quarrying 5-9 28 0 z 57 15 z 100
C Manufacturing CA 10-12 52 1 z 44 3 z 100
CB 13-15 38 2 z 58 2 z 100
CC 16-18 66 0 z 29 5 z 100
CD 19 49 0 z 48 3 z 100
CE 20 60 0 z 37 3 z 100
CF 21 64 0 z 32 3 z 100
CG 22-23 61 1 z 34 4 z 100
CH 24-25 54 1 z 43 3 z 100
CI 26 50 0 z 45 5 z 100
CJ 27 24 0 z 72 3 z 100
CK 28 35 0 z 53 12 z 100
CL 29-30 61 0 z 33 5 z 100
CM 31-33 46 2 z 40 11 z 100
D 35 49 0 z 48 2 z 100
E 36-39 25 2 z 72 1 z 100
F Construction 41-43 5 1 66 28 0 z 100
G 45-47 32 2 z 59 7 z 100
H Transportation and storage 49-53 13 19 z 67 1 z 100
I Accommodation and food service activities 55-56 26 0 z 73 1 z 100
J Information and communication 58-63 46 0 z 17 37 z 100
JA Publishing, audiovisual and broadcasting activities 58-60 7 0 z 16 77 z 100
JB Telecommunications 61 75 0 z 16 8 z 100
JC IT and other information service activities 62-63 45 0 z 27 27 z 100
K Financial and insurance activities 64-66 18 0 z 72 10 z 100
L Real estate activities 68 2 0 92 6 0 z 100
M Professional, scientific and technical activities 69-75 37 2 z 43 18 z 100
MA 69-71 35 3 z 43 19 z 100
MB Scientific research and development 72 43 0 z 40 17 z 100
MC Other professional, scientific and technical activities 73-75 38 1 z 45 16 z 100
N Administrative and support service activities 77-82 9 10 71 9 2 z 100
O 84 24 7 4 62 4 z 100
P Education 85 5 4 z 88 3 z 100
Q Human health and social work activities 86-88 11 0 z 87 1 z 100
QA Human health activities 86 10 0 z 89 1 z 100
QB Residential care and social work activities 87-88 15 1 z 82 2 z 100
R Arts, entertainment and recreation 90-93 15 0 z 83 2 z 100
S Other service activities 94-96 33 6 z 46 15 z 100
T 97-98 0 0 z 0 0 z 0
ABDE Other Production 1-9,
35-39
32 2 z 60 4 2 100
C Manufacturing 10-33 54 0 z 41 4 z 100
F Construction 41-43 5 1 66 28 0 z 100
G to T Services 45-98 12 3 49 32 4 z 100
TOTAL Total 16 3 44 34 4 0 100
1 n.e.c. represents; not elsewhere classified.
Note: Differences between totals and sums of components are due to rounding
z denotes where data is not available for this industry or asset
Public administration and defence; compulsory social security
Activities of households as employers; undifferentiated goods
and services - activities of household for own use
Manufacture of transport equipment
Other manufacturing and repair
Electricity, gas, steam and air conditioning supply
Water supply; sewerage, waste management and remediation
activities
Wholesale and retail trade; repair of motor vehicles and
motorcycles
Legal, accounting, management, architecture,
engineering, technical testing activities
Manufacture of machinery and equipment n.e.c1.
Back to contents
Manufacture of food products, beverages and tobacco
Manufacture of textiles, wearing apparel and leather products
Manufacture of wood and paper products, and printing
Manufacture of coke and refined petroleum products
Manufacture of chemicals and chemical products
Manufacture of basic pharmaceutical products and
pharmaceutical preparations
Manufacture of rubber and plastics products, and
other non-metallic mineral products
Manufacture of basic metals and metal products
Manufacture of computer, electronic & optical products
Manufacture of electrical equipment
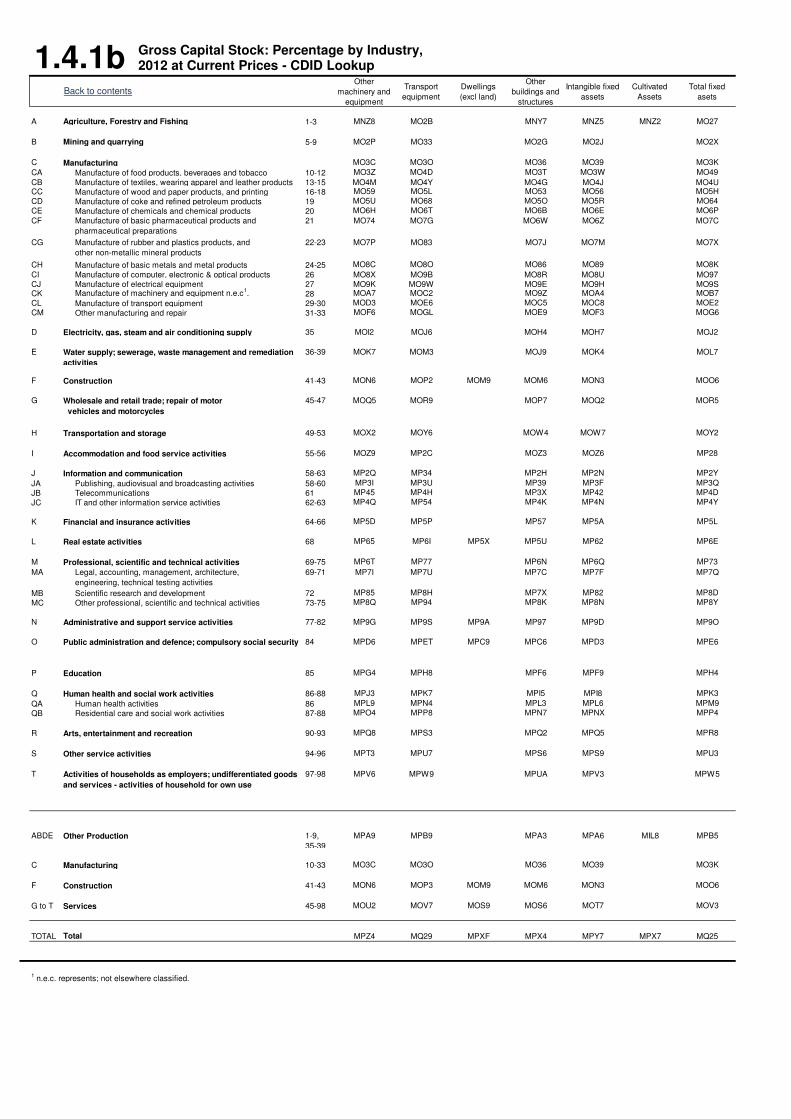
1.4.1bOther
machinery and
equipment
Transport
equipment
Dwellings
(excl land)
Other
buildings and
structures
Intangible fixed
assets
Cultivated
Assets
Total fixed
asets
A Agriculture, Forestry and Fishing 1-3 MNZ8 MO2B MNY7 MNZ5 MNZ2 MO27
B Mining and quarrying 5-9 MO2P MO33 MO2G MO2J MO2X
C Manufacturing MO3C MO3O MO36 MO39 MO3K
CA 10-12 MO3Z MO4D MO3T MO3W MO49
CB 13-15 MO4M MO4Y MO4G MO4J MO4UCC 16-18 MO59 MO5L MO53 MO56 MO5H
CD 19 MO5U MO68 MO5O MO5R MO64
CE 20 MO6H MO6T MO6B MO6E MO6P
CF 21 MO74 MO7G MO6W MO6Z MO7C
CG 22-23 MO7P MO83 MO7J MO7M MO7X
CH 24-25 MO8C MO8O MO86 MO89 MO8K
CI 26 MO8X MO9B MO8R MO8U MO97
CJ 27 MO9K MO9W MO9E MO9H MO9SCK 28 MOA7 MOC2 MO9Z MOA4 MOB7
CL 29-30 MOD3 MOE6 MOC5 MOC8 MOE2
CM 31-33 MOF6 MOGL MOE9 MOF3 MOG6
D 35 MOI2 MOJ6 MOH4 MOH7 MOJ2
E 36-39 MOK7 MOM3 MOJ9 MOK4 MOL7
F Construction 41-43 MON6 MOP2 MOM9 MOM6 MON3 MOO6
G 45-47 MOQ5 MOR9 MOP7 MOQ2 MOR5
H Transportation and storage 49-53 MOX2 MOY6 MOW4 MOW7 MOY2
I Accommodation and food service activities 55-56 MOZ9 MP2C MOZ3 MOZ6 MP28
J Information and communication 58-63 MP2Q MP34 MP2H MP2N MP2Y
JA Publishing, audiovisual and broadcasting activities 58-60 MP3I MP3U MP39 MP3F MP3Q
JB Telecommunications 61 MP45 MP4H MP3X MP42 MP4D
JC IT and other information service activities 62-63 MP4Q MP54 MP4K MP4N MP4Y
K Financial and insurance activities 64-66 MP5D MP5P MP57 MP5A MP5L
L Real estate activities 68 MP65 MP6I MP5X MP5U MP62 MP6E
M Professional, scientific and technical activities 69-75 MP6T MP77 MP6N MP6Q MP73
MA 69-71 MP7I MP7U MP7C MP7F MP7Q
MB Scientific research and development 72 MP85 MP8H MP7X MP82 MP8D
MC Other professional, scientific and technical activities 73-75 MP8Q MP94 MP8K MP8N MP8Y
N Administrative and support service activities 77-82 MP9G MP9S MP9A MP97 MP9D MP9O
O 84 MPD6 MPET MPC9 MPC6 MPD3 MPE6
P Education 85 MPG4 MPH8 MPF6 MPF9 MPH4
Q Human health and social work activities 86-88 MPJ3 MPK7 MPI5 MPI8 MPK3
QA Human health activities 86 MPL9 MPN4 MPL3 MPL6 MPM9
QB Residential care and social work activities 87-88 MPO4 MPP8 MPN7 MPNX MPP4
R Arts, entertainment and recreation 90-93 MPQ8 MPS3 MPQ2 MPQ5 MPR8
S Other service activities 94-96 MPT3 MPU7 MPS6 MPS9 MPU3
T 97-98 MPV6 MPW9 MPUA MPV3 MPW5
ABDE Other Production 1-9,
35-39
MPA9 MPB9 MPA3 MPA6 MIL8 MPB5
C Manufacturing 10-33 MO3C MO3O MO36 MO39 MO3K
F Construction 41-43 MON6 MOP3 MOM9 MOM6 MON3 MOO6
G to T Services 45-98 MOU2 MOV7 MOS9 MOS6 MOT7 MOV3
TOTAL Total MPZ4 MQ29 MPXF MPX4 MPY7 MPX7 MQ25
1 n.e.c. represents; not elsewhere classified.
Public administration and defence; compulsory social security
Activities of households as employers; undifferentiated goods
and services - activities of household for own use
Manufacture of transport equipment
Other manufacturing and repair
Electricity, gas, steam and air conditioning supply
Water supply; sewerage, waste management and remediation
activities
Wholesale and retail trade; repair of motor
vehicles and motorcycles
Legal, accounting, management, architecture,
engineering, technical testing activities
Manufacture of machinery and equipment n.e.c1.
Back to contents
Manufacture of food products, beverages and tobacco
Manufacture of textiles, wearing apparel and leather products
Manufacture of wood and paper products, and printing
Manufacture of coke and refined petroleum products
Manufacture of chemicals and chemical products
Manufacture of basic pharmaceutical products and
pharmaceutical preparations
Manufacture of rubber and plastics products, and
other non-metallic mineral products
Manufacture of basic metals and metal products
Manufacture of computer, electronic & optical products
Manufacture of electrical equipment
Gross Capital Stock: Percentage by Industry, 2012 at Current Prices - CDID Lookup
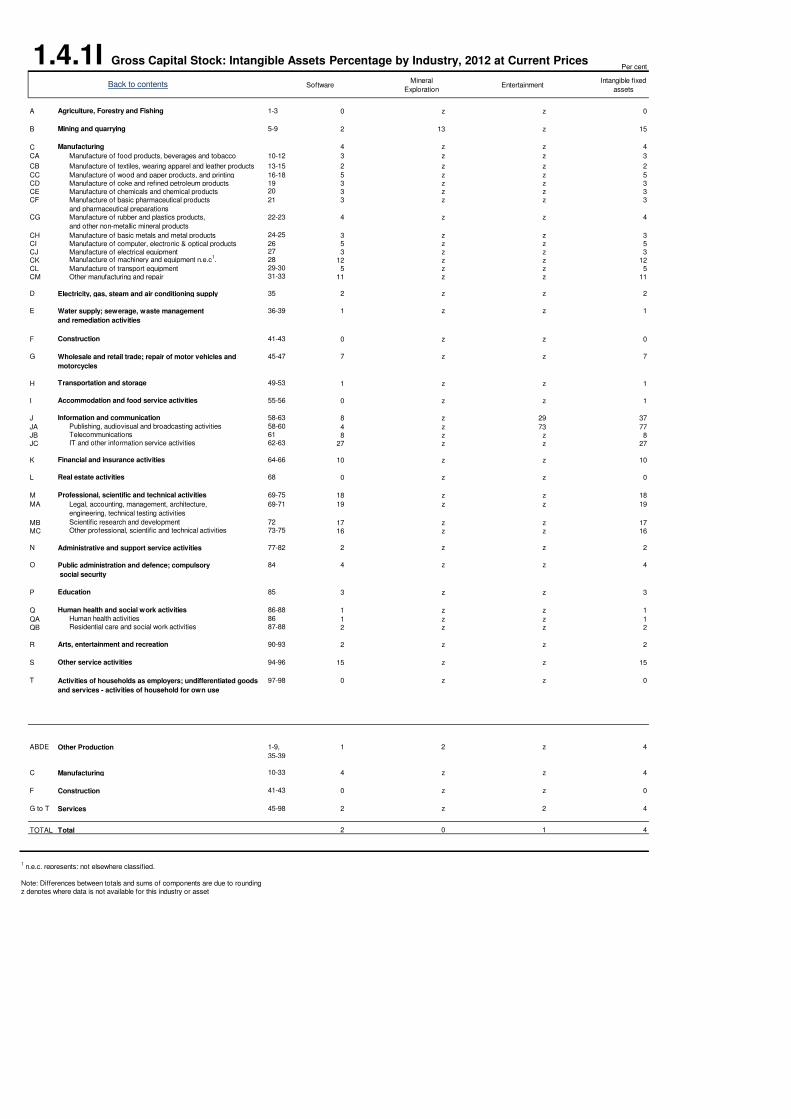
1.4.1IPer cent
SoftwareMineral
ExplorationEntertainment
Intangible fixed
assets
A Agriculture, Forestry and Fishing 1-3 0 z z 0
B Mining and quarrying 5-9 2 13 z 15
C Manufacturing 4 z z 4
CA 10-12 3 z z 3
CB 13-15 2 z z 2
CC 16-18 5 z z 5CD 19 3 z z 3CE 20 3 z z 3CF 21 3 z z 3
CG 22-23 4 z z 4
CH 24-25 3 z z 3CI 26 5 z z 5CJ 27 3 z z 3CK 28 12 z z 12CL 29-30 5 z z 5CM 31-33 11 z z 11
D 35 2 z z 2
E 36-39 1 z z 1
F Construction 41-43 0 z z 0
G 45-47 7 z z 7
H Transportation and storage 49-53 1 z z 1
I Accommodation and food service activities 55-56 0 z z 1
J Information and communication 58-63 8 z 29 37
JA Publishing, audiovisual and broadcasting activities 58-60 4 z 73 77JB Telecommunications 61 8 z z 8JC IT and other information service activities 62-63 27 z z 27
K Financial and insurance activities 64-66 10 z z 10
L Real estate activities 68 0 z z 0
M Professional, scientific and technical activities 69-75 18 z z 18
MA 69-71 19 z z 19
MB Scientific research and development 72 17 z z 17MC Other professional, scientific and technical activities 73-75 16 z z 16
N Administrative and support service activities 77-82 2 z z 2
O 84 4 z z 4
P Education 85 3 z z 3
Q Human health and social work activities 86-88 1 z z 1
QA Human health activities 86 1 z z 1QB Residential care and social work activities 87-88 2 z z 2
R Arts, entertainment and recreation 90-93 2 z z 2
S Other service activities 94-96 15 z z 15
T 97-98 0 z z 0
ABDE Other Production 1-9,
35-39
1 2 z 4
C Manufacturing 10-33 4 z z 4
F Construction 41-43 0 z z 0
G to T Services 45-98 2 z 2 4
z z z z z z zTOTAL Total 2 0 1 4
1 n.e.c. represents; not elsewhere classified.
Note: Differences between totals and sums of components are due to roundingz denotes where data is not available for this industry or asset
Public administration and defence; compulsory
social security
Activities of households as employers; undifferentiated goods
and services - activities of household for own use
Manufacture of transport equipment Other manufacturing and repair
Electricity, gas, steam and air conditioning supply
Water supply; sewerage, waste management
and remediation activities
Wholesale and retail trade; repair of motor vehicles and
motorcycles
Legal, accounting, management, architecture,
engineering, technical testing activities
Manufacture of machinery and equipment n.e.c1.
Back to contents
Manufacture of food products, beverages and tobacco
Manufacture of textiles, wearing apparel and leather products
Manufacture of wood and paper products, and printing Manufacture of coke and refined petroleum products Manufacture of chemicals and chemical products Manufacture of basic pharmaceutical products
and pharmaceutical preparations Manufacture of rubber and plastics products,
and other non-metallic mineral products
Manufacture of basic metals and metal products Manufacture of computer, electronic & optical products Manufacture of electrical equipment
Gross Capital Stock: Intangible Assets Percentage by Industry, 2012 at Current Prices
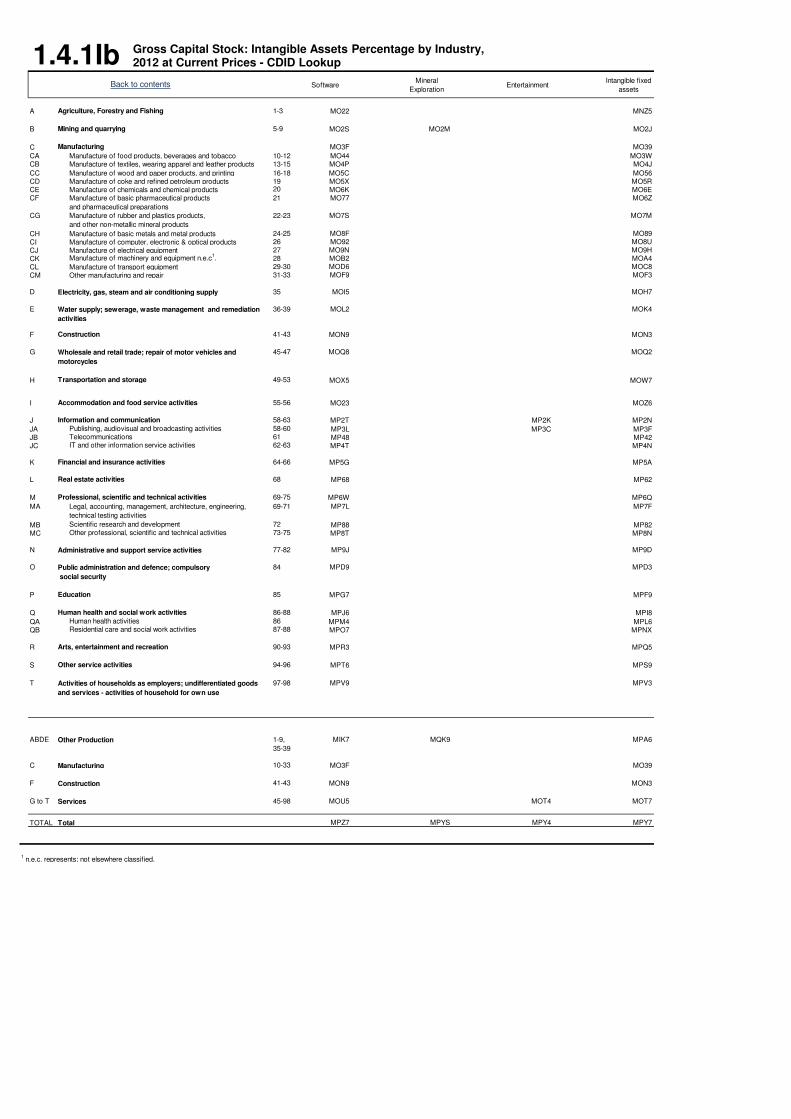
1.4.1IbSoftware
Mineral
ExplorationEntertainment
Intangible fixed
assets
A Agriculture, Forestry and Fishing 1-3 MO22 MNZ5
B Mining and quarrying 5-9 MO2S MO2M MO2J
C Manufacturing MO3F MO39
CA 10-12 MO44 MO3WCB 13-15 MO4P MO4J
CC 16-18 MO5C MO56CD 19 MO5X MO5RCE 20 MO6K MO6ECF 21 MO77 MO6Z
CG 22-23 MO7S MO7M
CH 24-25 MO8F MO89
CI 26 MO92 MO8U
CJ 27 MO9N MO9H
CK 28 MOB2 MOA4
CL 29-30 MOD6 MOC8
CM 31-33 MOF9 MOF3
D 35 MOI5 MOH7
E 36-39 MOL2 MOK4
F Construction 41-43 MON9 MON3
G 45-47 MOQ8 MOQ2
H Transportation and storage 49-53 MOX5 MOW7
I Accommodation and food service activities 55-56 MO23 MOZ6
J Information and communication 58-63 MP2T MP2K MP2N
JA Publishing, audiovisual and broadcasting activities 58-60 MP3L MP3C MP3FJB Telecommunications 61 MP48 MP42JC IT and other information service activities 62-63 MP4T MP4N
K Financial and insurance activities 64-66 MP5G MP5A
L Real estate activities 68 MP68 MP62
M Professional, scientific and technical activities 69-75 MP6W MP6Q
MA 69-71 MP7L MP7F
MB Scientific research and development 72 MP88 MP82MC Other professional, scientific and technical activities 73-75 MP8T MP8N
N Administrative and support service activities 77-82 MP9J MP9D
O 84 MPD9 MPD3
P Education 85 MPG7 MPF9
Q Human health and social work activities 86-88 MPJ6 MPI8
QA Human health activities 86 MPM4 MPL6QB Residential care and social work activities 87-88 MPO7 MPNX
R Arts, entertainment and recreation 90-93 MPR3 MPQ5
S Other service activities 94-96 MPT6 MPS9
T 97-98 MPV9 MPV3
ABDE Other Production 1-9,
35-39
MIK7 MQK9 MPA6
C Manufacturing 10-33 MO3F MO39
F Construction 41-43 MON9 MON3
G to T Services 45-98 MOU5 MOT4 MOT7
TOTAL Total MPZ7 MPYS MPY4 MPY7
1 n.e.c. represents; not elsewhere classified.
Public administration and defence; compulsory
social security
Activities of households as employers; undifferentiated goods
and services - activities of household for own use
Manufacture of transport equipment Other manufacturing and repair
Electricity, gas, steam and air conditioning supply
Water supply; sewerage, waste management and remediation
activities
Wholesale and retail trade; repair of motor vehicles and
motorcycles
Legal, accounting, management, architecture, engineering,
technical testing activities
Manufacture of machinery and equipment n.e.c1.
Back to contents
Manufacture of food products, beverages and tobacco Manufacture of textiles, wearing apparel and leather products
Manufacture of wood and paper products, and printing Manufacture of coke and refined petroleum products Manufacture of chemicals and chemical products Manufacture of basic pharmaceutical products
and pharmaceutical preparations
Manufacture of rubber and plastics products,
and other non-metallic mineral products
Manufacture of basic metals and metal products Manufacture of computer, electronic & optical products Manufacture of electrical equipment
Gross Capital Stock: Intangible Assets Percentage by Industry, 2012 at Current Prices - CDID Lookup

1.5.1 Gross Capital Stock to Output Ratio1 by Industry at Current Prices
Ratio
1997 1998 1999 2000 2001 2002 2003 2004 2005 2006 2007 2008 2009 2010 2011 2012
A Agriculture, Forestry and Fishing 1-3 MO26 6.9 7.6 7.9 8.8 9.4 9.0 8.3 7.7 11.0 11.3 10.6 10.0 12.3 10.1 10.2 10.8
B Mining and quarrying 5-9 MO2W 1.7 1.8 1.8 1.4 1.4 1.6 1.7 1.8 1.7 1.7 1.9 1.8 2.7 2.3 2.6 3.1
C Manufacturing MO3J 2.2 2.1 2.2 2.4 2.4 2.4 2.4 2.4 2.5 2.5 2.5 2.7 2.9 2.8 2.8 2.9
CA 10-12 MO48 2.3 2.3 2.3 2.5 2.5 2.4 2.3 2.3 2.4 2.5 2.7 3.0 3.1 3.0 3.1 3.3
CB 13-15 MO4T 1.6 1.6 1.8 1.9 2.1 2.4 2.5 2.6 2.7 2.5 2.5 2.6 2.8 2.6 2.7 2.8
CC 16-18 MO5G 3.6 3.2 3.1 3.1 3.0 2.7 2.6 2.4 2.5 2.5 2.4 2.7 2.9 3.0 3.2 3.4
CD 19 MO63 2.6 2.4 2.5 3.0 2.9 3.3 3.3 2.8 3.7 3.3 2.7 3.0 2.6 2.7 3.5 3.6
CE 20 MO6O 3.3 3.3 3.4 3.8 3.7 3.5 3.5 3.6 3.5 3.4 3.8 4.1 4.8 4.7 4.7 5.4
CF 21 MO7B 2.2 2.0 2.1 2.2 1.9 2.0 1.9 2.0 2.0 1.9 1.7 1.4 1.3 1.2 1.2 1.2
CG 22-23 MO7W 2.0 1.8 2.0 2.1 2.0 1.9 2.0 2.0 2.0 2.1 2.2 2.5 2.6 2.7 3.0 3.2
CH 24-25 MO8J 2.1 2.0 2.3 2.5 2.6 2.8 2.8 2.8 3.2 3.4 3.3 3.7 4.2 4.1 4.2 4.1
CI 26 MO96 1.5 1.4 1.5 1.6 1.6 1.7 1.8 1.7 1.6 1.5 1.6 1.7 1.8 1.6 1.6 1.6
CJ 27 MO9R 2.7 2.6 2.6 2.8 2.9 3.0 3.0 3.1 3.1 3.1 3.3 3.3 3.2 3.3 3.1 2.7
CK 28 MOB6 1.4 1.3 1.4 1.6 1.6 1.6 1.6 1.6 1.6 1.6 1.6 1.7 1.9 1.7 1.7 1.7
CL 29-30 MODD 2.4 2.3 2.5 2.6 2.7 2.6 2.6 2.6 2.8 2.7 2.9 3.0 3.9 3.2 3.1 3.1
CM 31-33 MOG5 1.6 1.4 1.4 1.5 1.5 1.6 1.6 1.6 1.6 1.5 1.5 1.7 1.7 1.7 1.8 1.9
D 35 MOI9 3.3 3.5 3.9 4.2 4.6 4.5 4.6 4.9 5.3 4.7 4.8 6.1 5.8 6.2 6.7 6.6
E 36-39 MOL6 8.5 8.5 8.9 9.6 9.6 9.5 9.3 9.3 9.5 9.5 9.5 9.6 10.4 9.5 10.2 10.6
F Construction 41-43 MOO5 5.3 5.2 5.2 5.1 5.1 5.0 4.9 4.7 4.9 4.8 4.8 5.3 5.6 5.5 5.5 5.8
G 45-47 MOR4 1.3 1.2 1.3 1.3 1.3 1.4 1.4 1.4 1.5 1.5 1.5 1.6 1.7 1.6 1.6 1.7
H Transportation and storage 49-53 MOX9 5.5 5.3 5.3 5.4 5.6 5.7 5.8 5.9 6.1 6.2 6.3 6.5 6.8 6.8 7.1 7.1
I Accommodation and food service activities 55-56 MP27 2.0 2.0 2.0 2.1 2.2 2.2 2.2 2.2 2.3 2.4 2.4 2.6 2.8 2.7 2.8 2.7
J Information and communication 58-63 MP2X 7.1 6.3 5.8 5.5 5.2 4.8 4.4 4.2 4.1 4.0 3.7 3.8 3.9 3.7 3.4 3.2
JA Publishing, audiovisual and broadcasting activities 58-60 MP3P 10.0 9.6 9.1 8.6 8.3 7.9 7.4 7.4 7.0 6.9 6.7 6.6 6.5 5.7 5.3 4.8
JB Telecommunications 61 MP4C 10.0 8.8 8.2 7.8 7.7 7.0 6.5 6.3 6.7 6.6 6.2 6.5 6.5 6.6 6.1 6.0
JC IT and other information service activities 62-63 MP4X 0.5 0.5 0.5 0.5 0.6 0.6 0.5 0.5 0.5 0.5 0.5 0.5 0.6 0.6 0.6 0.5
K Financial and insurance activities 64-66 MP5K 1.6 1.7 1.8 2.0 1.9 1.9 1.7 1.6 1.5 1.4 1.3 1.3 1.2 1.2 1.4 1.5
L Real estate activities 68 MP6D 14.6 14.0 14.1 13.8 14.3 14.9 15.4 15.7 16.4 16.6 16.3 17.5 19.5 17.0 15.9 15.3
M Professional, scientific and technical activities 69-75 MP72 0.7 0.7 0.7 0.7 0.7 0.6 0.6 0.6 0.6 0.6 0.6 0.6 0.7 0.7 0.7 0.7
MA 69-71 MP7P 0.7 0.6 0.6 0.6 0.5 0.5 0.5 0.5 0.5 0.5 0.5 0.5 0.6 0.6 0.5 0.5
MB Scientific research and development 72 MP8C 1.3 1.4 1.5 1.7 1.8 1.9 1.9 1.8 1.8 1.7 1.8 2.1 2.5 2.7 2.7 2.7
MC Other professional, scientific and technical activities 73-75 MP8X 0.7 0.7 0.6 0.6 0.6 0.6 0.6 0.6 0.6 0.6 0.6 0.7 0.7 0.7 0.7 0.7
N Administrative and support service activities 77-82 MP9N 3.4 3.2 3.2 3.1 3.2 3.4 3.5 3.6 3.9 3.9 4.1 4.4 4.5 4.6 4.8 4.6
O 84 MPE5 5.3 5.6 5.4 5.3 5.2 5.1 5.1 5.1 5.1 5.2 5.3 5.4 5.3 5.3 5.5 5.5
P Education 85 MPH3 1.9 1.9 1.9 1.8 1.8 1.8 1.8 1.8 1.8 1.9 1.9 1.9 2.0 2.0 2.1 2.1
Q Human health and social work activities 86-88 MPK2 2.1 2.1 2.1 2.1 2.1 2.0 1.9 1.8 1.7 1.7 1.7 1.7 1.7 1.7 1.7 1.6
QA Human health activities 86 MPM8 2.1 2.1 2.2 2.2 2.1 2.0 1.9 1.8 1.8 1.7 1.7 1.7 1.7 1.7 1.6 1.6
QB Residential care and social work activities 87-88 MPP3 1.9 1.9 1.9 2.0 1.9 1.9 1.8 1.8 1.7 1.7 1.7 1.8 1.8 1.8 1.8 1.8
R Arts, entertainment and recreation 90-93 MPR7 2.6 2.5 2.5 2.7 2.8 2.7 2.6 2.8 3.0 3.2 3.4 3.6 3.8 3.8 3.9 3.6
S Other service activities 94-96 MPU2 1.1 1.1 1.0 1.0 1.0 1.0 1.0 1.0 1.0 1.0 1.1 1.1 1.0 1.0 1.0 1.0
T 97-98 MPW4 0.0 0.0 0.0 0.0 0.0 0.0 0.0 0.0 0.0 0.0 0.0 0.0 0.0 0.0 0.0 0.0
ABDE Other Production 1-9,
35-39
MPB4 4.2 4.6 4.8 4.5 4.8 4.9 5.0 5.0 5.2 5.0 5.2 5.3 6.3 5.8 6.1 6.6
C Manufacturing 10-33 MO3J 2.2 2.1 2.2 2.4 2.4 2.4 2.4 2.4 2.5 2.5 2.5 2.7 2.9 2.8 2.8 2.9
F Construction 41-43 MOO5 5.3 5.2 5.2 5.1 5.1 5.0 4.9 4.7 4.9 4.8 4.8 5.3 5.6 5.5 5.5 5.8
G to T Services 45-98 MOV2 4.1 4.0 4.0 4.0 4.0 4.0 4.0 4.0 4.1 4.2 4.2 4.4 4.4 4.4 4.4 4.4
TOTAL Total MQ24 15.8 15.9 16.2 16.0 16.3 16.3 16.3 16.1 16.7 16.5 16.7 17.7 19.2 18.5 18.8 19.7
2 n.e.c. represents; not elsewhere classified.
Note: Differences between totals and sums of components are due to rounding
z denotes where data is not collected, not present or unavailable for an industry or asset.
Legal, accounting, management, architecture,
engineering, technical testing activities
Public administration and defence;
compulsory social security
Activities of households as employers; undifferentiated goods
and services - activities of household for own use
1 Capital stock to output ratio has been calculated by dividing gross capital stocks by Gross Value Added estimates published in the
Second Estimate of GDP, 22 May 2014.
Manufacture of machinery and equipment n.e.c.
Manufacture of transport equipment
Other manufacturing and repair
Electricity, gas, steam and air conditioning supply
Water supply; sewerage, waste management and remediation
activities
Wholesale and retail trade; repair of motor vehicles and
motorcycles
Manufacture of electrical equipment
Back to contents
Manufacture of food products, beverages and tobacco
Manufacture of textiles, wearing apparel and leather products
Manufacture of wood and paper products, and printing
Manufacture of coke and refined petroleum products
Manufacture of chemicals and chemical products
Manufacture of basic pharmaceutical products and
pharmaceutical preparations
Manufacture of rubber and plastics products, and
other non-metallic mineral products
Manufacture of basic metals and metal products
Manufacture of computer, electronic & optical products
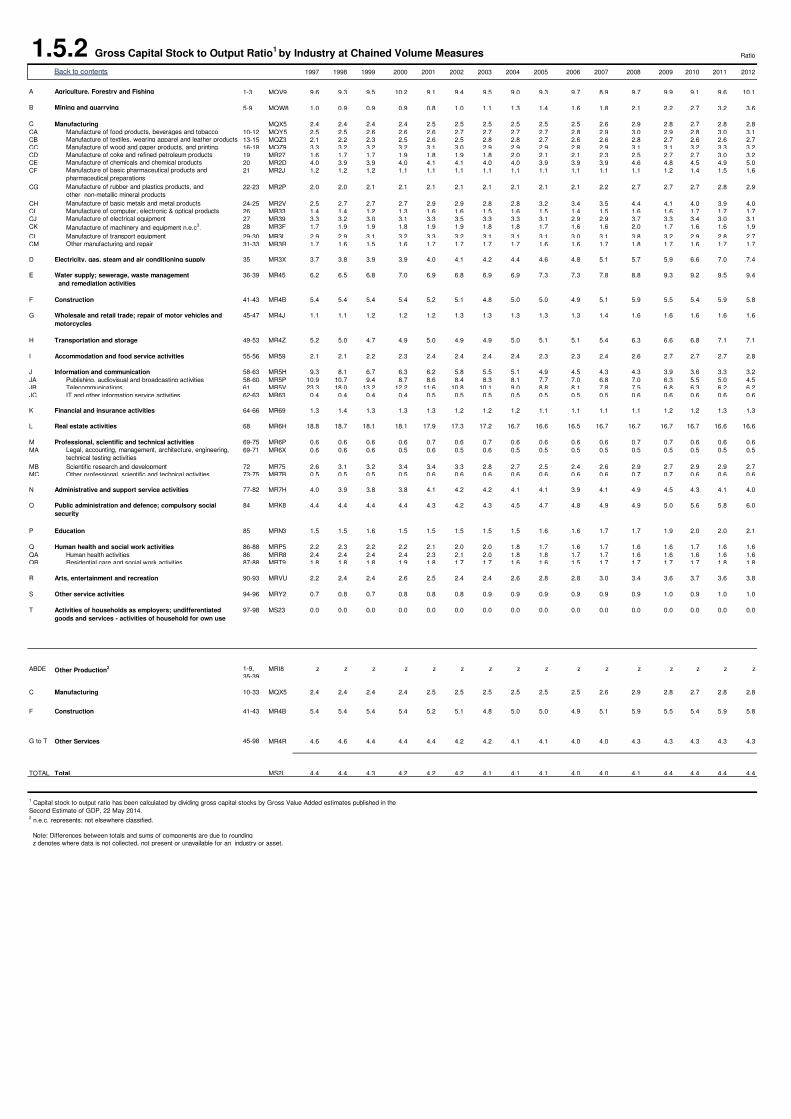
1.5.2 Gross Capital Stock to Output Ratio1 by Industry at Chained Volume Measures Ratio
1997 1998 1999 2000 2001 2002 2003 2004 2005 2006 2007 2008 2009 2010 2011 2012
A Agriculture, Forestry and Fishing 1-3 MQV9 9.6 9.3 9.5 10.2 9.1 9.4 9.5 9.0 9.3 9.7 8.9 9.7 9.9 9.1 9.6 10.1
B Mining and quarrying 5-9 MQW8 1.0 0.9 0.9 0.9 0.8 1.0 1.1 1.3 1.4 1.6 1.8 2.1 2.2 2.7 3.2 3.6
C Manufacturing MQX5 2.4 2.4 2.4 2.4 2.5 2.5 2.5 2.5 2.5 2.5 2.6 2.9 2.8 2.7 2.8 2.8
CA 10-12 MQY5 2.5 2.5 2.6 2.6 2.6 2.7 2.7 2.7 2.7 2.8 2.9 3.0 2.9 2.8 3.0 3.1
CB 13-15 MQZ3 2.1 2.2 2.3 2.5 2.6 2.5 2.8 2.8 2.7 2.6 2.6 2.8 2.7 2.6 2.6 2.7
CC 16-18 MQZ9 3.3 3.2 3.2 3.2 3.1 3.0 2.9 2.9 2.9 2.8 2.9 3.1 3.1 3.2 3.3 3.2
CD 19 MR27 1.6 1.7 1.7 1.9 1.8 1.9 1.8 2.0 2.1 2.1 2.3 2.5 2.7 2.7 3.0 3.2
CE 20 MR2D 4.0 3.9 3.9 4.0 4.1 4.1 4.0 4.0 3.9 3.9 3.9 4.6 4.8 4.5 4.9 5.0
CF 21 MR2J 1.2 1.2 1.2 1.1 1.1 1.1 1.1 1.1 1.1 1.1 1.1 1.1 1.2 1.4 1.5 1.6
CG 22-23 MR2P 2.0 2.0 2.1 2.1 2.1 2.1 2.1 2.1 2.1 2.1 2.2 2.7 2.7 2.7 2.8 2.9
CH 24-25 MR2V 2.5 2.7 2.7 2.7 2.9 2.9 2.8 2.8 3.2 3.4 3.5 4.4 4.1 4.0 3.9 4.0
CI 26 MR33 1.4 1.4 1.2 1.3 1.6 1.6 1.5 1.6 1.5 1.4 1.5 1.6 1.6 1.7 1.7 1.7
CJ 27 MR39 3.3 3.2 3.0 3.1 3.3 3.5 3.3 3.3 3.1 2.9 2.9 3.7 3.3 3.4 3.0 3.1
CK 28 MR3F 1.7 1.9 1.9 1.8 1.9 1.9 1.8 1.8 1.7 1.6 1.6 2.0 1.7 1.6 1.6 1.9
CL 29-30 MR3L 2.9 2.9 3.1 3.2 3.3 3.2 3.1 3.1 3.1 3.0 3.1 3.8 3.2 2.9 2.8 2.7
CM 31-33 MR3R 1.7 1.6 1.5 1.6 1.7 1.7 1.7 1.7 1.6 1.6 1.7 1.8 1.7 1.6 1.7 1.7
D 35 MR3X 3.7 3.8 3.9 3.9 4.0 4.1 4.2 4.4 4.6 4.8 5.1 5.7 5.9 6.6 7.0 7.4
E 36-39 MR45 6.2 6.5 6.8 7.0 6.9 6.8 6.9 6.9 7.3 7.3 7.8 8.8 9.3 9.2 9.5 9.4
F Construction 41-43 MR4B 5.4 5.4 5.4 5.4 5.2 5.1 4.8 5.0 5.0 4.9 5.1 5.9 5.5 5.4 5.9 5.8
G 45-47 MR4J 1.1 1.1 1.2 1.2 1.2 1.3 1.3 1.3 1.3 1.3 1.4 1.6 1.6 1.6 1.6 1.6
H Transportation and storage 49-53 MR4Z 5.2 5.0 4.7 4.9 5.0 4.9 4.9 5.0 5.1 5.1 5.4 6.3 6.6 6.8 7.1 7.1
I Accommodation and food service activities 55-56 MR59 2.1 2.1 2.2 2.3 2.4 2.4 2.4 2.4 2.3 2.3 2.4 2.6 2.7 2.7 2.7 2.8
J Information and communication 58-63 MR5H 9.3 8.1 6.7 6.3 6.2 5.8 5.5 5.1 4.9 4.5 4.3 4.3 3.9 3.6 3.3 3.2
JA Publishing, audiovisual and broadcasting activities 58-60 MR5P 10.9 10.7 9.4 8.7 8.6 8.4 8.3 8.1 7.7 7.0 6.8 7.0 6.3 5.5 5.0 4.5
JB Telecommunications 61 MR5V 23.3 18.0 13.2 12.2 11.6 10.8 10.1 9.0 8.8 8.1 7.8 7.5 6.8 6.3 6.2 6.2
JC IT and other information service activities 62-63 MR63 0.4 0.4 0.4 0.4 0.5 0.5 0.5 0.5 0.5 0.5 0.5 0.6 0.6 0.6 0.6 0.6
K Financial and insurance activities 64-66 MR69 1.3 1.4 1.3 1.3 1.3 1.2 1.2 1.2 1.1 1.1 1.1 1.1 1.2 1.2 1.3 1.3
L Real estate activities 68 MR6H 18.8 18.7 18.1 18.1 17.9 17.3 17.2 16.7 16.6 16.5 16.7 16.7 16.7 16.7 16.6 16.6
M Professional, scientific and technical activities 69-75 MR6P 0.6 0.6 0.6 0.6 0.7 0.6 0.7 0.6 0.6 0.6 0.6 0.7 0.7 0.6 0.6 0.6
MA 69-71 MR6X 0.6 0.6 0.6 0.5 0.6 0.5 0.6 0.5 0.5 0.5 0.5 0.5 0.5 0.5 0.5 0.5
MB Scientific research and development 72 MR75 2.6 3.1 3.2 3.4 3.4 3.3 2.8 2.7 2.5 2.4 2.6 2.9 2.7 2.9 2.9 2.7
MC Other professional, scientific and technical activities 73-75 MR7B 0.5 0.5 0.5 0.5 0.6 0.6 0.6 0.6 0.6 0.6 0.6 0.7 0.7 0.6 0.6 0.6
N Administrative and support service activities 77-82 MR7H 4.0 3.9 3.8 3.8 4.1 4.2 4.2 4.1 4.1 3.9 4.1 4.9 4.5 4.3 4.1 4.0
O 84 MRK8 4.4 4.4 4.4 4.4 4.3 4.2 4.3 4.5 4.7 4.8 4.9 4.9 5.0 5.6 5.8 6.0
P Education 85 MRN3 1.5 1.5 1.6 1.5 1.5 1.5 1.5 1.5 1.6 1.6 1.7 1.7 1.9 2.0 2.0 2.1
Q Human health and social work activities 86-88 MRP5 2.2 2.3 2.2 2.2 2.1 2.0 2.0 1.8 1.7 1.6 1.7 1.6 1.6 1.7 1.6 1.6
QA Human health activities 86 MRR8 2.4 2.4 2.4 2.4 2.3 2.1 2.0 1.8 1.8 1.7 1.7 1.6 1.6 1.6 1.6 1.6
QB Residential care and social work activities 87-88 MRT9 1.8 1.8 1.8 1.9 1.8 1.7 1.7 1.6 1.6 1.5 1.7 1.7 1.7 1.7 1.8 1.8
R Arts, entertainment and recreation 90-93 MRVU 2.2 2.4 2.4 2.6 2.5 2.4 2.4 2.6 2.8 2.8 3.0 3.4 3.6 3.7 3.6 3.8
S Other service activities 94-96 MRY2 0.7 0.8 0.7 0.8 0.8 0.8 0.9 0.9 0.9 0.9 0.9 0.9 1.0 0.9 1.0 1.0
T 97-98 MS23 0.0 0.0 0.0 0.0 0.0 0.0 0.0 0.0 0.0 0.0 0.0 0.0 0.0 0.0 0.0 0.0
ABDE Other Production2 1-9,
35-39
MRI8 z z z z z z z z z z z z z z z z
C Manufacturing 10-33 MQX5 2.4 2.4 2.4 2.4 2.5 2.5 2.5 2.5 2.5 2.5 2.6 2.9 2.8 2.7 2.8 2.8
F Construction 41-43 MR4B 5.4 5.4 5.4 5.4 5.2 5.1 4.8 5.0 5.0 4.9 5.1 5.9 5.5 5.4 5.9 5.8
G to T Other Services 45-98 MR4R 4.6 4.6 4.4 4.4 4.4 4.2 4.2 4.1 4.1 4.0 4.0 4.3 4.3 4.3 4.3 4.3
TOTAL Total MS2L 4.4 4.4 4.3 4.2 4.2 4.2 4.1 4.1 4.1 4.0 4.0 4.1 4.4 4.4 4.4 4.4
2 n.e.c. represents; not elsewhere classified.
Note: Differences between totals and sums of components are due to rounding
z denotes where data is not collected, not present or unavailable for an industry or asset.
Legal, accounting, management, architecture, engineering,
technical testing activities
Public administration and defence; compulsory social
security
Activities of households as employers; undifferentiated
goods and services - activities of household for own use
1 Capital stock to output ratio has been calculated by dividing gross capital stocks by Gross Value Added estimates published in the
Second Estimate of GDP, 22 May 2014.
Manufacture of machinery and equipment n.e.c3.
Manufacture of transport equipment
Other manufacturing and repair
Electricity, gas, steam and air conditioning supply
Water supply; sewerage, waste management
and remediation activities
Wholesale and retail trade; repair of motor vehicles and
motorcycles
Manufacture of electrical equipment
Back to contents
Manufacture of food products, beverages and tobacco
Manufacture of textiles, wearing apparel and leather products
Manufacture of wood and paper products, and printing
Manufacture of coke and refined petroleum products
Manufacture of chemicals and chemical products
Manufacture of basic pharmaceutical products and
pharmaceutical preparations
Manufacture of rubber and plastics products, and
other non-metallic mineral products
Manufacture of basic metals and metal products
Manufacture of computer, electronic & optical products
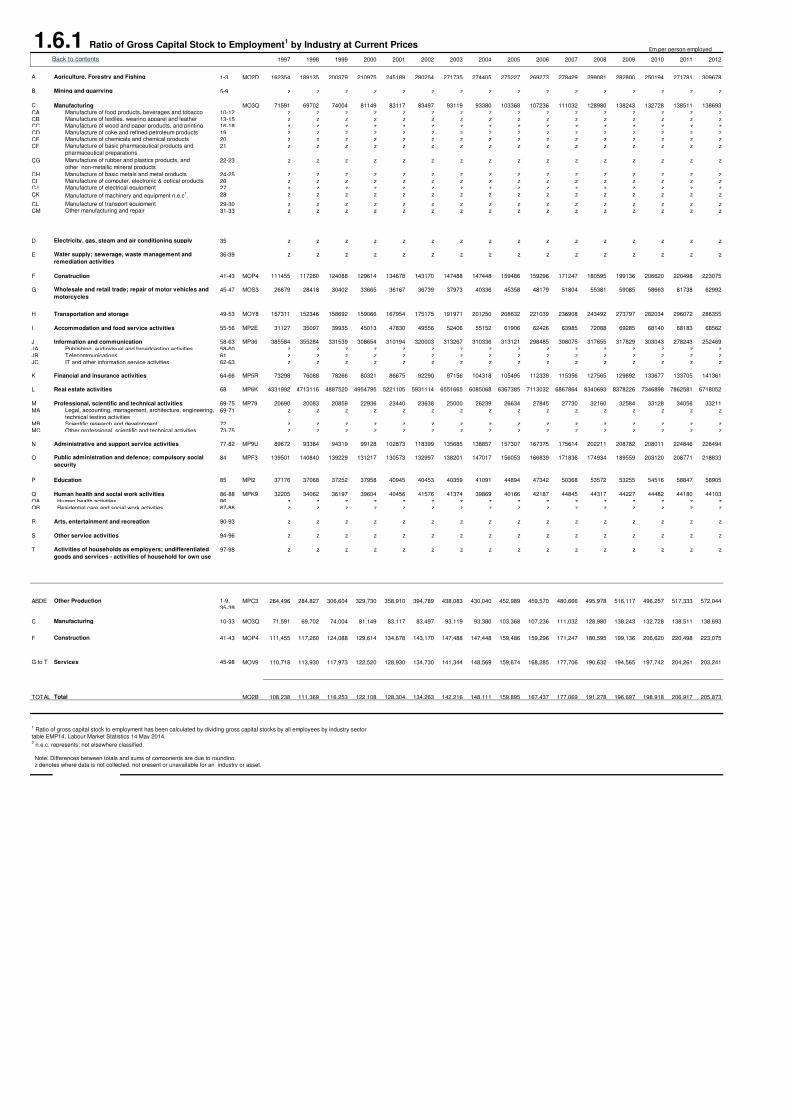
1.6.1 Ratio of Gross Capital Stock to Employment1 by Industry at Current Prices
£m per person employed
1997 1998 1999 2000 2001 2002 2003 2004 2005 2006 2007 2008 2009 2010 2011 2012
A Agriculture, Forestry and Fishing 1-3 MO2D 162354 189135 200379 210975 245189 280254 271735 274405 275227 269273 278429 299081 282800 250194 271781 309678
B Mining and quarrying 5-9 z z z z z z z z z z z z z z z z
C Manufacturing MO3Q 71591 69702 74004 81149 83117 83497 93119 93380 103368 107236 111032 128980 138243 132728 138511 138693
CA 10-12 z z z z z z z z z z z z z z z zCB 13-15 z z z z z z z z z z z z z z z zCC 16-18 z z z z z z z z z z z z z z z zCD 19 z z z z z z z z z z z z z z z zCE 20 z z z z z z z z z z z z z z z zCF 21 z z z z z z z z z z z z z z z z
CG 22-23 z z z z z z z z z z z z z z z z
CH 24-25 z z z z z z z z z z z z z z z zCI 26 z z z z z z z z z z z z z z z zCJ 27 z z z z z z z z z z z z z z z zCK 28 z z z z z z z z z z z z z z z z
CL 29-30 z z z z z z z z z z z z z z z zCM 31-33 z z z z z z z z z z z z z z z z
D 35 z z z z z z z z z z z z z z z z
E 36-39 z z z z z z z z z z z z z z z z
F Construction 41-43 MOP4 111455 117260 124088 129614 134678 143170 147488 147448 159486 159296 171247 180595 199136 206620 220498 223075
G 45-47 MOS3 26679 28418 30402 33665 36167 36739 37973 40336 45358 48179 51804 55381 59085 58663 61738 62992
H Transportation and storage 49-53 MOY8 157311 152346 158692 159066 167954 175175 191971 201250 208632 221039 236908 243492 273797 282034 296072 286355
I Accommodation and food service activities 55-56 MP2E 31127 35097 39935 45013 47830 49556 52406 55152 61906 62426 63985 72088 69285 68140 68183 68562
J Information and communication 58-63 MP36 385584 355284 331539 308654 310194 320003 313267 310336 313121 298485 308075 317655 317829 303043 278243 252469
JA Publishing, audiovisual and broadcasting activities 58-60 z z z z z z z z z z z z z z z zJB Telecommunications 61 z z z z z z z z z z z z z z z zJC IT and other information service activities 62-63 z z z z z z z z z z z z z z z z
K Financial and insurance activities 64-66 MP5R 73298 76088 78266 80321 86675 92290 97156 104318 105495 112339 115356 127565 129892 133677 133705 141361
L Real estate activities 68 MP6K 4331992 4713116 4887520 4954795 5221105 5931114 6551665 6085068 6367385 7113032 6867864 8340693 8378226 7346898 7862581 6718052
M Professional, scientific and technical activities 69-75 MP79 20690 20083 20859 22936 23440 23638 25000 26239 26634 27845 27730 32160 32584 33128 34056 33211
MA 69-71 z z z z z z z z z z z z z z z z
MB Scientific research and development 72 z z z z z z z z z z z z z z z zMC Other professional, scientific and technical activities 73-75 z z z z z z z z z z z z z z z z
N Administrative and support service activities 77-82 MP9U 89672 93364 94319 99128 102873 118399 135685 138857 157307 167375 175614 202211 208782 208011 224846 226494
O 84 MPF3 139501 140840 139229 131217 130573 132997 138201 147017 156053 166839 171836 174934 189559 203120 208771 218833
P Education 85 MPI2 37176 37068 37252 37958 40945 40453 40359 41091 44894 47342 50368 53572 53255 54516 58847 58905
Q Human health and social work activities 86-88 MPK9 32205 34062 36197 39604 40456 41576 41374 39869 40166 42187 44845 44317 44227 44482 44180 44103
QA Human health activities 86 z z z z z z z z z z z z z z z zQB Residential care and social work activities 87-88 z z z z z z z z z z z z z z z z
R Arts, entertainment and recreation 90-93 z z z z z z z z z z z z z z z z
S Other service activities 94-96 z z z z z z z z z z z z z z z z
T 97-98 z z z z z z z z z z z z z z z z
ABDE Other Production 1-9,
35-39MPC3 264,496 284,827 306,604 329,730 358,910 394,789 438,083 430,040 452,989 459,570 480,666 495,978 516,117 496,257 517,333 572,044
C Manufacturing 10-33 MO3Q 71,591 69,702 74,004 81,149 83,117 83,497 93,119 93,380 103,368 107,236 111,032 128,980 138,243 132,728 138,511 138,693
F Construction 41-43 MOP4 111,455 117,260 124,088 129,614 134,678 143,170 147,488 147,448 159,486 159,296 171,247 180,595 199,136 206,620 220,498 223,075
G to T Services 45-98 MOV9 110,718 113,930 117,973 122,520 128,930 134,730 141,344 148,569 159,674 168,285 177,706 190,632 194,565 197,742 204,261 203,241
TOTAL Total MQ2B 108,238 111,369 116,253 122,108 128,304 134,263 142,216 148,111 159,895 167,437 177,069 191,278 196,697 198,918 206,917 205,873
2 n.e.c. represents; not elsewhere classified.
Note: Differences between totals and sums of components are due to rounding. z denotes where data is not collected, not present or unavailable for an industry or asset.
Legal, accounting, management, architecture, engineering,
technical testing activities
Public administration and defence; compulsory social
security
Activities of households as employers; undifferentiated
goods and services - activities of household for own use
1 Ratio of gross capital stock to employment has been calculated by dividing gross capital stocks by all employees by industry sector
table EMP14, Labour Market Statistics 14 May 2014.
Wholesale and retail trade; repair of motor vehicles and
motorcycles
Manufacture of chemicals and chemical products Manufacture of basic pharmaceutical products and
pharmaceutical preparations
Manufacture of rubber and plastics products, and
other non-metallic mineral products
Manufacture of basic metals and metal products Manufacture of computer, electronic & optical products Manufacture of electrical equipment
Manufacture of machinery and equipment n.e.c1.
Manufacture of transport equipment Other manufacturing and repair
Electricity, gas, steam and air conditioning supply
Water supply; sewerage, waste management and
remediation activities
Manufacture of coke and refined petroleum products
Back to contents
Manufacture of food products, beverages and tobacco Manufacture of textiles, wearing apparel and leather Manufacture of wood and paper products, and printing
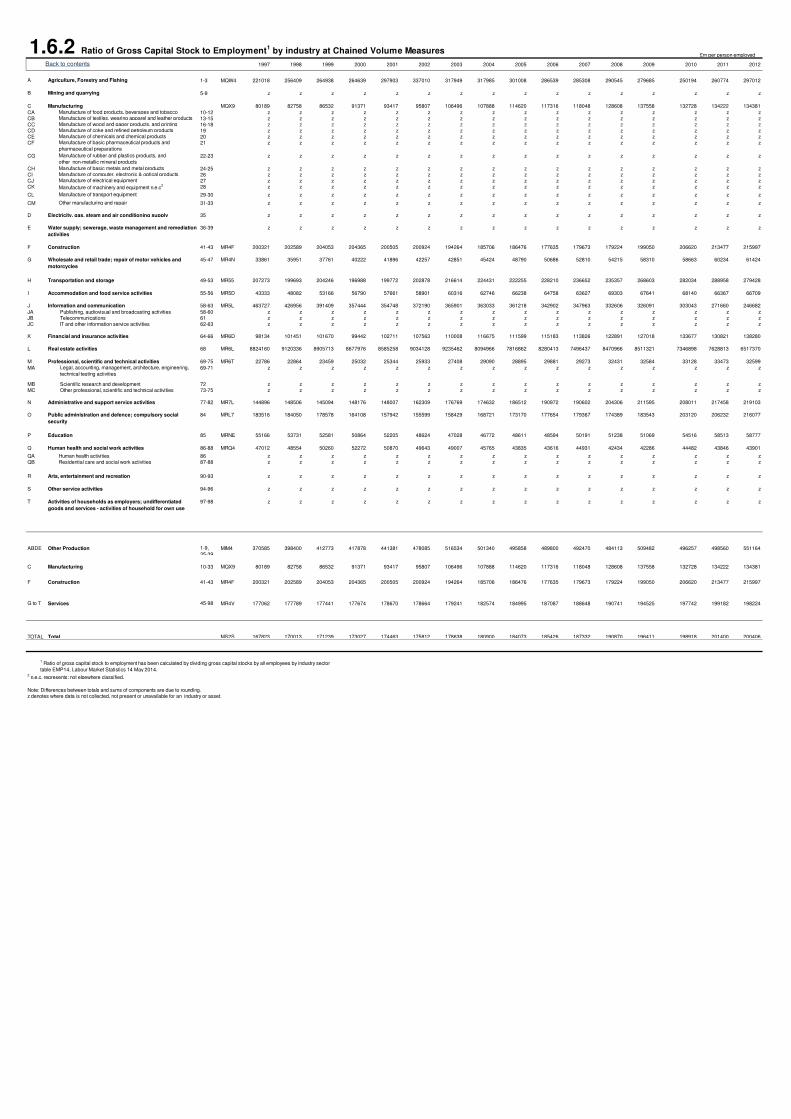
1.6.2 Ratio of Gross Capital Stock to Employment1 by industry at Chained Volume Measures
£m per person employed
1997 1998 1999 2000 2001 2002 2003 2004 2005 2006 2007 2008 2009 2010 2011 2012
A Agriculture, Forestry and Fishing 1-3 MQW4 221018 256409 264938 264639 297903 337010 317949 317985 301008 286539 285308 290545 279685 250194 260774 297012
B Mining and quarrying 5-9 z z z z z z z z z z z z z z z z
C Manufacturing MQX9 80189 82758 86532 91371 93417 95807 106496 107888 114620 117316 118048 128608 137558 132728 134222 134381
CA 10-12 z z z z z z z z z z z z z z z zCB 13-15 z z z z z z z z z z z z z z z zCC 16-18 z z z z z z z z z z z z z z z zCD 19 z z z z z z z z z z z z z z z zCE 20 z z z z z z z z z z z z z z z zCF 21 z z z z z z z z z z z z z z z z
CG 22-23 z z z z z z z z z z z z z z z z
CH 24-25 z z z z z z z z z z z z z z z zCI 26 z z z z z z z z z z z z z z z zCJ 27 z z z z z z z z z z z z z z z zCK 28 z z z z z z z z z z z z z z z z
CL 29-30 z z z z z z z z z z z z z z z z
CM 31-33 z z z z z z z z z z z z z z z z
D 35 z z z z z z z z z z z z z z z z
E 36-39 z z z z z z z z z z z z z z z z
F Construction 41-43 MR4F 200321 202589 204053 204365 200505 200924 194264 185706 186476 177635 179673 179224 199050 206620 213477 215997
G 45-47 MR4N 33861 35951 37761 40222 41896 42257 42851 45424 48790 50686 52810 54215 58310 58663 60234 61424
H Transportation and storage 49-53 MR55 207273 199693 204246 196988 199772 202878 216614 224431 222255 228210 236652 235357 268603 282034 288958 279428
I Accommodation and food service activities 55-56 MR5D 43333 48082 53166 56790 57661 58901 60316 62746 66238 64758 63627 69303 67641 68140 66367 66709
J Information and communication 58-63 MR5L 463727 426956 391409 357444 354748 372190 365901 363033 361218 342902 347963 332606 326091 303043 271660 246682
JA Publishing, audiovisual and broadcasting activities 58-60 z z z z z z z z z z z z z z z zJB Telecommunications 61 z z z z z z z z z z z z z z z zJC IT and other information service activities 62-63 z z z z z z z z z z z z z z z z
K Financial and insurance activities 64-66 MR6D 98134 101451 101670 99442 102711 107563 110008 116675 111599 115183 113826 122891 127018 133677 130821 138280
L Real estate activities 68 MR6L 8824160 9120336 8905713 8677976 8585258 9034128 9235462 8094966 7816862 8280413 7496437 8470966 8511321 7346898 7628813 6517370
M Professional, scientific and technical activities 69-75 MR6T 22786 22864 23459 25032 25344 25933 27408 29090 28895 29881 29273 32431 32584 33128 33473 32599
MA 69-71 z z z z z z z z z z z z z z z z
MB Scientific research and development 72 z z z z z z z z z z z z z z z zMC Other professional, scientific and technical activities 73-75 z z z z z z z z z z z z z z z z
N Administrative and support service activities 77-82 MR7L 144896 148506 145094 148176 148007 162309 176769 174632 186512 190972 190602 204306 211595 208011 217458 219103
O 84 MRL7 183516 184050 178578 164108 157942 155599 158429 168721 173170 177654 179367 174389 183543 203120 206232 216077
P Education 85 MRNE 55166 53731 52581 50864 52205 48624 47028 46772 48611 48594 50191 51238 51069 54516 58513 58777
Q Human health and social work activities 86-88 MRQ4 47012 48554 50260 52272 50870 49643 49007 45765 43835 43616 44931 42434 42286 44482 43846 43901
QA Human health activities 86 z z z z z z z z z z z z z z z zQB Residential care and social work activities 87-88 z z z z z z z z z z z z z z z z
R Arts, entertainment and recreation 90-93 z z z z z z z z z z z z z z z z
S Other service activities 94-96 z z z z z z z z z z z z z z z z
T 97-98 z z z z z z z z z z z z z z z z
ABDE Other Production 1-9,
35-39MIM4 370585 398400 412773 417878 441381 478085 516534 501340 495858 489800 492470 484113 509482 496257 498560 551164
C Manufacturing 10-33 MQX9 80189 82758 86532 91371 93417 95807 106496 107888 114620 117316 118048 128608 137558 132728 134222 134381
F Construction 41-43 MR4F 200321 202589 204053 204365 200505 200924 194264 185706 186476 177635 179673 179224 199050 206620 213477 215997
G to T Services 45-98 MR4V 177062 177789 177441 177674 178670 178664 179241 182574 184995 187087 188648 190741 194525 197742 199182 198224
TOTAL Total MS2S 167823 170013 171239 173027 174463 175812 178638 180900 184073 185426 187332 190870 196411 198918 201400 200406
2 n.e.c. represents; not elsewhere classified.
Note: Differences between totals and sums of components are due to rounding.z denotes where data is not collected, not present or unavailable for an industry or asset.
Legal, accounting, management, architecture, engineering,
technical testing activities
Public administration and defence; compulsory social
security
Activities of households as employers; undifferentiated
goods and services - activities of household for own use
1 Ratio of gross capital stock to employment has been calculated by dividing gross capital stocks by all employees by industry sector
table EMP14, Labour Market Statistics 14 May 2014.
Manufacture of machinery and equipment n.e.c2
Manufacture of transport equipment
Other manufacturing and repair
Electricity, gas, steam and air conditioning supply
Water supply; sewerage, waste management and remediation
activities
Wholesale and retail trade; repair of motor vehicles and
motorcycles
Manufacture of electrical equipment
Back to contents
Manufacture of food products, beverages and tobacco Manufacture of textiles, wearing apparel and leather products Manufacture of wood and paper products, and printing Manufacture of coke and refined petroleum products Manufacture of chemicals and chemical products Manufacture of basic pharmaceutical products and
pharmaceutical preparations
Manufacture of rubber and plastics products, and
other non-metallic mineral products
Manufacture of basic metals and metal products Manufacture of computer, electronic & optical products
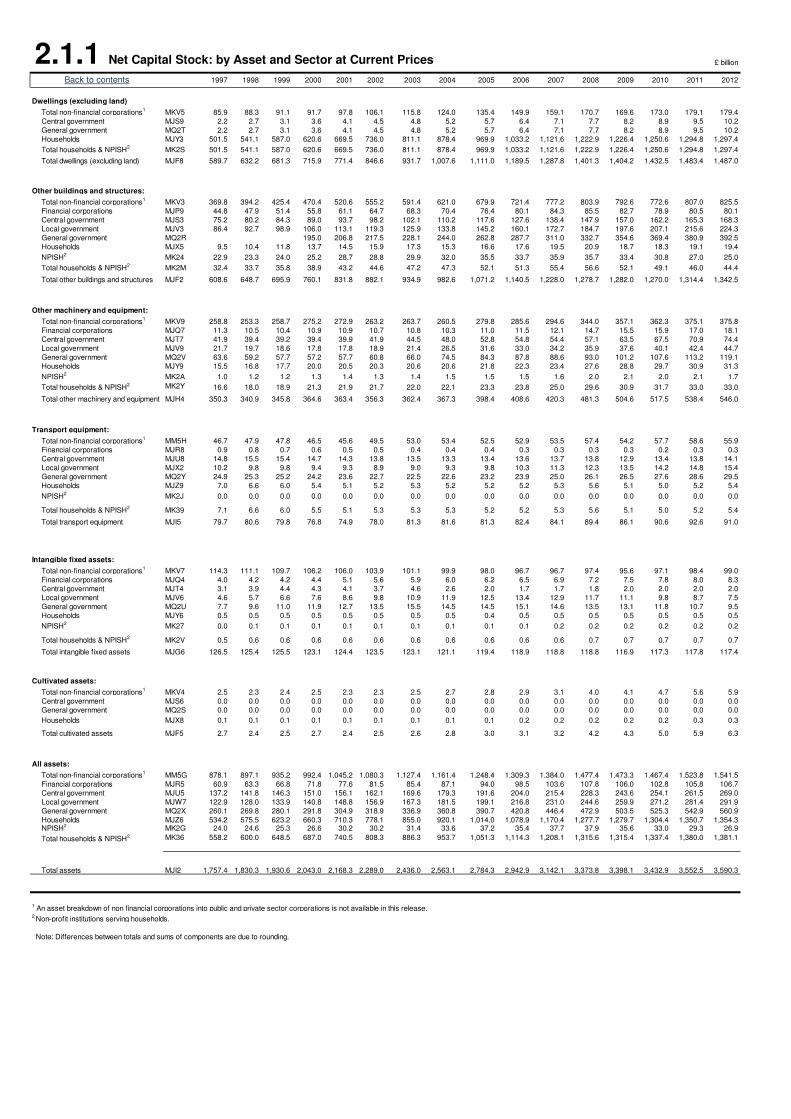
2.1.1 Net Capital Stock: by Asset and Sector at Current Prices £ billion
1997 1998 1999 2000 2001 2002 2003 2004 2005 2006 2007 2008 2009 2010 2011 2012
Dwellings (excluding land)
Total non-financial corporations1 MKV5 85.9 88.3 91.1 91.7 97.8 106.1 115.8 124.0 135.4 149.9 159.1 170.7 169.6 173.0 179.1 179.4
Central government MJS9 2.2 2.7 3.1 3.6 4.1 4.5 4.8 5.2 5.7 6.4 7.1 7.7 8.2 8.9 9.5 10.2
General government MQ2T 2.2 2.7 3.1 3.6 4.1 4.5 4.8 5.2 5.7 6.4 7.1 7.7 8.2 8.9 9.5 10.2
Households MJY3 501.5 541.1 587.0 620.6 669.5 736.0 811.1 878.4 969.9 1,033.2 1,121.6 1,222.9 1,226.4 1,250.6 1,294.8 1,297.4
Total households & NPISH2 MK2S 501.5 541.1 587.0 620.6 669.5 736.0 811.1 878.4 969.9 1,033.2 1,121.6 1,222.9 1,226.4 1,250.6 1,294.8 1,297.4
Total dwellings (excluding land) MJF8 589.7 632.2 681.3 715.9 771.4 846.6 931.7 1,007.6 1,111.0 1,189.5 1,287.8 1,401.3 1,404.2 1,432.5 1,483.4 1,487.0
Other buildings and structures:
Total non-financial corporations1 MKV3 369.8 394.2 425.4 470.4 520.6 555.2 591.4 621.0 679.9 721.4 777.2 803.9 792.6 772.6 807.0 825.5
Financial corporations MJP9 44.8 47.9 51.4 55.8 61.1 64.7 68.3 70.4 76.4 80.1 84.3 85.5 82.7 78.9 80.5 80.1
Central government MJS3 75.2 80.2 84.3 89.0 93.7 98.2 102.1 110.2 117.6 127.6 138.4 147.9 157.0 162.2 165.3 168.3
Local government MJV3 86.4 92.7 98.9 106.0 113.1 119.3 125.9 133.8 145.2 160.1 172.7 184.7 197.6 207.1 215.6 224.3
General government MQ2R 195.0 206.8 217.5 228.1 244.0 262.8 287.7 311.0 332.7 354.6 369.4 380.9 392.5
Households MJX5 9.5 10.4 11.8 13.7 14.5 15.9 17.3 15.3 16.6 17.6 19.5 20.9 18.7 18.3 19.1 19.4
NPISH2 MK24 22.9 23.3 24.0 25.2 28.7 28.8 29.9 32.0 35.5 33.7 35.9 35.7 33.4 30.8 27.0 25.0
Total households & NPISH2 MK2M 32.4 33.7 35.8 38.9 43.2 44.6 47.2 47.3 52.1 51.3 55.4 56.6 52.1 49.1 46.0 44.4
Total other buildings and structures MJF2 608.6 648.7 695.9 760.1 831.8 882.1 934.9 982.6 1,071.2 1,140.5 1,228.0 1,278.7 1,282.0 1,270.0 1,314.4 1,342.5
Other machinery and equipment:
Total non-financial corporations1 MKV9 258.8 253.3 258.7 275.2 272.9 263.2 263.7 260.5 279.8 285.6 294.6 344.0 357.1 362.3 375.1 375.8
Financial corporations MJQ7 11.3 10.5 10.4 10.9 10.9 10.7 10.8 10.3 11.0 11.5 12.1 14.7 15.5 15.9 17.0 18.1
Central government MJT7 41.9 39.4 39.2 39.4 39.9 41.9 44.5 48.0 52.8 54.8 54.4 57.1 63.5 67.5 70.9 74.4
Local government MJV9 21.7 19.7 18.6 17.8 17.8 18.9 21.4 26.5 31.6 33.0 34.2 35.9 37.6 40.1 42.4 44.7
General government MQ2V 63.6 59.2 57.7 57.2 57.7 60.8 66.0 74.5 84.3 87.8 88.6 93.0 101.2 107.6 113.2 119.1
Households MJY9 15.5 16.8 17.7 20.0 20.5 20.3 20.6 20.6 21.8 22.3 23.4 27.6 28.8 29.7 30.9 31.3
NPISH2 MK2A 1.0 1.2 1.2 1.3 1.4 1.3 1.4 1.5 1.5 1.5 1.6 2.0 2.1 2.0 2.1 1.7
Total households & NPISH2 MK2Y 16.6 18.0 18.9 21.3 21.9 21.7 22.0 22.1 23.3 23.8 25.0 29.6 30.9 31.7 33.0 33.0
Total other machinery and equipment MJH4 350.3 340.9 345.8 364.6 363.4 356.3 362.4 367.3 398.4 408.6 420.3 481.3 504.6 517.5 538.4 546.0
Transport equipment:
Total non-financial corporations1 MM5H 46.7 47.9 47.8 46.5 45.6 49.5 53.0 53.4 52.5 52.9 53.5 57.4 54.2 57.7 58.6 55.9
Financial corporations MJR8 0.9 0.8 0.7 0.6 0.5 0.5 0.4 0.4 0.4 0.3 0.3 0.3 0.3 0.2 0.3 0.3
Central government MJU8 14.8 15.5 15.4 14.7 14.3 13.8 13.5 13.3 13.4 13.6 13.7 13.8 12.9 13.4 13.8 14.1
Local government MJX2 10.2 9.8 9.8 9.4 9.3 8.9 9.0 9.3 9.8 10.3 11.3 12.3 13.5 14.2 14.8 15.4
General government MQ2Y 24.9 25.3 25.2 24.2 23.6 22.7 22.5 22.6 23.2 23.9 25.0 26.1 26.5 27.6 28.6 29.5
Households MJZ9 7.0 6.6 6.0 5.4 5.1 5.2 5.3 5.2 5.2 5.2 5.3 5.6 5.1 5.0 5.2 5.4
NPISH2 MK2J 0.0 0.0 0.0 0.0 0.0 0.0 0.0 0.0 0.0 0.0 0.0 0.0 0.0 0.0 0.0 0.0
Total households & NPISH2 MK39 7.1 6.6 6.0 5.5 5.1 5.3 5.3 5.3 5.2 5.2 5.3 5.6 5.1 5.0 5.2 5.4
Total transport equipment MJI5 79.7 80.6 79.8 76.8 74.9 78.0 81.3 81.6 81.3 82.4 84.1 89.4 86.1 90.6 92.6 91.0
Intangible fixed assets:
Total non-financial corporations1 MKV7 114.3 111.1 109.7 106.2 106.0 103.9 101.1 99.9 98.0 96.7 96.7 97.4 95.6 97.1 98.4 99.0
Financial corporations MJQ4 4.0 4.2 4.2 4.4 5.1 5.6 5.9 6.0 6.2 6.5 6.9 7.2 7.5 7.8 8.0 8.3
Central government MJT4 3.1 3.9 4.4 4.3 4.1 3.7 4.6 2.6 2.0 1.7 1.7 1.8 2.0 2.0 2.0 2.0
Local government MJV6 4.6 5.7 6.6 7.6 8.6 9.8 10.9 11.9 12.5 13.4 12.9 11.7 11.1 9.8 8.7 7.5
General government MQ2U 7.7 9.6 11.0 11.9 12.7 13.5 15.5 14.5 14.5 15.1 14.6 13.5 13.1 11.8 10.7 9.5
Households MJY6 0.5 0.5 0.5 0.5 0.5 0.5 0.5 0.5 0.4 0.5 0.5 0.5 0.5 0.5 0.5 0.5
NPISH2 MK27 0.0 0.1 0.1 0.1 0.1 0.1 0.1 0.1 0.1 0.1 0.2 0.2 0.2 0.2 0.2 0.2
Total households & NPISH2 MK2V 0.5 0.6 0.6 0.6 0.6 0.6 0.6 0.6 0.6 0.6 0.6 0.7 0.7 0.7 0.7 0.7
Total intangible fixed assets MJG6 126.5 125.4 125.5 123.1 124.4 123.5 123.1 121.1 119.4 118.9 118.8 118.8 116.9 117.3 117.8 117.4
Cultivated assets:
Total non-financial corporations1 MKV4 2.5 2.3 2.4 2.5 2.3 2.3 2.5 2.7 2.8 2.9 3.1 4.0 4.1 4.7 5.6 5.9
Central government MJS6 0.0 0.0 0.0 0.0 0.0 0.0 0.0 0.0 0.0 0.0 0.0 0.0 0.0 0.0 0.0 0.0
General government MQ2S 0.0 0.0 0.0 0.0 0.0 0.0 0.0 0.0 0.0 0.0 0.0 0.0 0.0 0.0 0.0 0.0
Households MJX8 0.1 0.1 0.1 0.1 0.1 0.1 0.1 0.1 0.1 0.2 0.2 0.2 0.2 0.2 0.3 0.3
Total cultivated assets MJF5 2.7 2.4 2.5 2.7 2.4 2.5 2.6 2.8 3.0 3.1 3.2 4.2 4.3 5.0 5.9 6.3
All assets:
Total non-financial corporations1 MM5G 878.1 897.1 935.2 992.4 1,045.2 1,080.3 1,127.4 1,161.4 1,248.4 1,309.3 1,384.0 1,477.4 1,473.3 1,467.4 1,523.8 1,541.5
Financial corporations MJR5 60.9 63.3 66.8 71.8 77.6 81.5 85.4 87.1 94.0 98.5 103.6 107.8 106.0 102.8 105.8 106.7
Central government MJU5 137.2 141.8 146.3 151.0 156.1 162.1 169.6 179.3 191.6 204.0 215.4 228.3 243.6 254.1 261.5 269.0
Local government MJW7 122.9 128.0 133.9 140.8 148.8 156.9 167.3 181.5 199.1 216.8 231.0 244.6 259.9 271.2 281.4 291.9
General government MQ2X 260.1 269.8 280.1 291.8 304.9 318.9 336.9 360.8 390.7 420.8 446.4 472.9 503.5 525.3 542.9 560.9
Households MJZ6 534.2 575.5 623.2 660.3 710.3 778.1 855.0 920.1 1,014.0 1,078.9 1,170.4 1,277.7 1,279.7 1,304.4 1,350.7 1,354.3NPISH2 MK2G 24.0 24.6 25.3 26.6 30.2 30.2 31.4 33.6 37.2 35.4 37.7 37.9 35.6 33.0 29.3 26.9
Total households & NPISH2 MK36 558.2 600.0 648.5 687.0 740.5 808.3 886.3 953.7 1,051.3 1,114.3 1,208.1 1,315.6 1,315.4 1,337.4 1,380.0 1,381.1
Total assets MJI2 1,757.4 1,830.3 1,930.6 2,043.0 2,168.3 2,289.0 2,436.0 2,563.1 2,784.3 2,942.9 3,142.1 3,373.8 3,398.1 3,432.9 3,552.5 3,590.3
1 An asset breakdown of non financial corporations into public and private sector corporations is not available in this release.2 Non-profit institutions serving households.
Note: Differences between totals and sums of components are due to rounding.
Back to contents
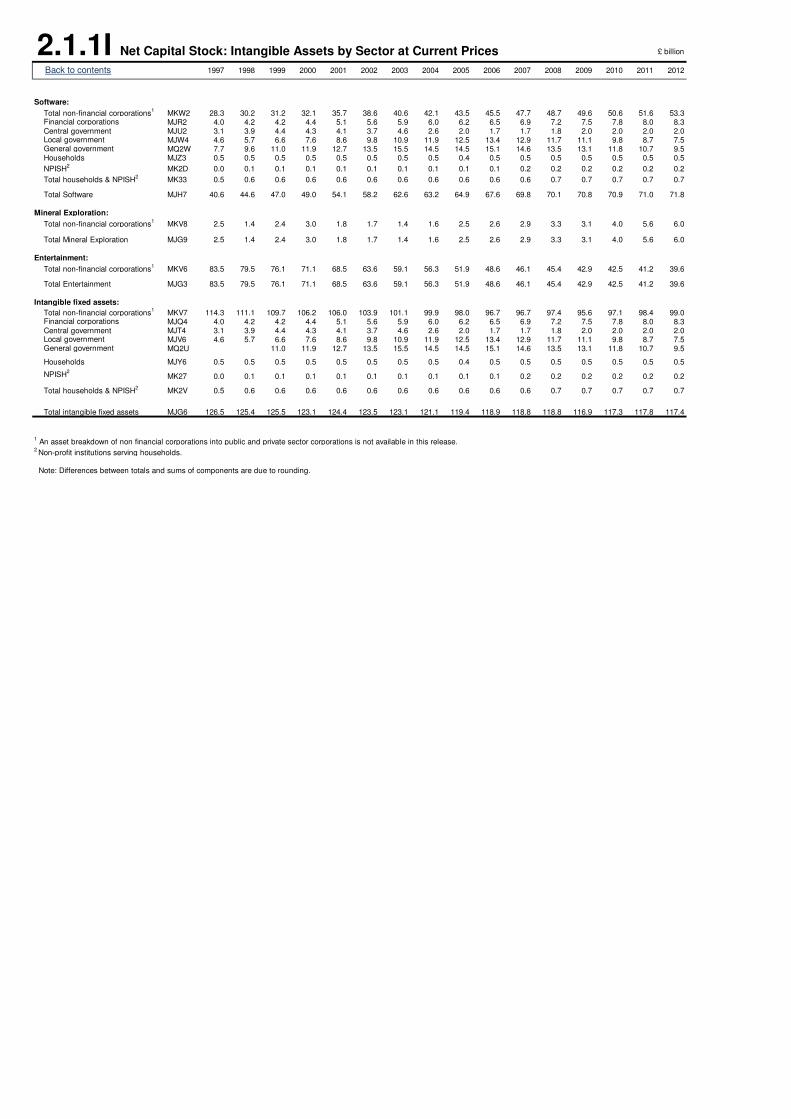
2.1.1I Net Capital Stock: Intangible Assets by Sector at Current Prices £ billion
1997 1998 1999 2000 2001 2002 2003 2004 2005 2006 2007 2008 2009 2010 2011 2012
Software:
Total non-financial corporations1
MKW2 28.3 30.2 31.2 32.1 35.7 38.6 40.6 42.1 43.5 45.5 47.7 48.7 49.6 50.6 51.6 53.3Financial corporations MJR2 4.0 4.2 4.2 4.4 5.1 5.6 5.9 6.0 6.2 6.5 6.9 7.2 7.5 7.8 8.0 8.3Central government MJU2 3.1 3.9 4.4 4.3 4.1 3.7 4.6 2.6 2.0 1.7 1.7 1.8 2.0 2.0 2.0 2.0Local government MJW4 4.6 5.7 6.6 7.6 8.6 9.8 10.9 11.9 12.5 13.4 12.9 11.7 11.1 9.8 8.7 7.5General government MQ2W 7.7 9.6 11.0 11.9 12.7 13.5 15.5 14.5 14.5 15.1 14.6 13.5 13.1 11.8 10.7 9.5Households MJZ3 0.5 0.5 0.5 0.5 0.5 0.5 0.5 0.5 0.4 0.5 0.5 0.5 0.5 0.5 0.5 0.5
NPISH2
MK2D 0.0 0.1 0.1 0.1 0.1 0.1 0.1 0.1 0.1 0.1 0.2 0.2 0.2 0.2 0.2 0.2
Total households & NPISH2
MK33 0.5 0.6 0.6 0.6 0.6 0.6 0.6 0.6 0.6 0.6 0.6 0.7 0.7 0.7 0.7 0.7
Total Software MJH7 40.6 44.6 47.0 49.0 54.1 58.2 62.6 63.2 64.9 67.6 69.8 70.1 70.8 70.9 71.0 71.8
Mineral Exploration:
Total non-financial corporations1
MKV8 2.5 1.4 2.4 3.0 1.8 1.7 1.4 1.6 2.5 2.6 2.9 3.3 3.1 4.0 5.6 6.0
Total Mineral Exploration MJG9 2.5 1.4 2.4 3.0 1.8 1.7 1.4 1.6 2.5 2.6 2.9 3.3 3.1 4.0 5.6 6.0
Entertainment:
Total non-financial corporations1
MKV6 83.5 79.5 76.1 71.1 68.5 63.6 59.1 56.3 51.9 48.6 46.1 45.4 42.9 42.5 41.2 39.6
Total Entertainment MJG3 83.5 79.5 76.1 71.1 68.5 63.6 59.1 56.3 51.9 48.6 46.1 45.4 42.9 42.5 41.2 39.6
Intangible fixed assets:
Total non-financial corporations1
MKV7 114.3 111.1 109.7 106.2 106.0 103.9 101.1 99.9 98.0 96.7 96.7 97.4 95.6 97.1 98.4 99.0Financial corporations MJQ4 4.0 4.2 4.2 4.4 5.1 5.6 5.9 6.0 6.2 6.5 6.9 7.2 7.5 7.8 8.0 8.3Central government MJT4 3.1 3.9 4.4 4.3 4.1 3.7 4.6 2.6 2.0 1.7 1.7 1.8 2.0 2.0 2.0 2.0Local government MJV6 4.6 5.7 6.6 7.6 8.6 9.8 10.9 11.9 12.5 13.4 12.9 11.7 11.1 9.8 8.7 7.5General government MQ2U 11.0 11.9 12.7 13.5 15.5 14.5 14.5 15.1 14.6 13.5 13.1 11.8 10.7 9.5
Households MJY6 0.5 0.5 0.5 0.5 0.5 0.5 0.5 0.5 0.4 0.5 0.5 0.5 0.5 0.5 0.5 0.5
NPISH2
MK27 0.0 0.1 0.1 0.1 0.1 0.1 0.1 0.1 0.1 0.1 0.2 0.2 0.2 0.2 0.2 0.2
Total households & NPISH2
MK2V 0.5 0.6 0.6 0.6 0.6 0.6 0.6 0.6 0.6 0.6 0.6 0.7 0.7 0.7 0.7 0.7
Total intangible fixed assets MJG6 126.5 125.4 125.5 123.1 124.4 123.5 123.1 121.1 119.4 118.9 118.8 118.8 116.9 117.3 117.8 117.4
1 An asset breakdown of non financial corporations into public and private sector corporations is not available in this release.
2 Non-profit institutions serving households.
Note: Differences between totals and sums of components are due to rounding.
Back to contents

2.1.2 Net Capital Stock: by Asset and Sector at Chained Volume Measures £ billion
1997 1998 1999 2000 2001 2002 2003 2004 2005 2006 2007 2008 2009 2010 2011 2012
Dwellings (excluding land)
Total non-financial corporations1 MM5K 180.4 175.5 170.2 164.7 164.7 164.9 165.9 167.0 168.1 176.2 174.9 174.0 172.9 173.0 173.5 173.8Central government MM2I 4.4 5.2 5.5 6.1 6.7 6.8 7.1 7.2 7.4 7.6 8.1 8.0 8.2 8.9 9.4 9.8General government MQ3K 4.4 5.2 5.5 6.1 6.7 6.8 7.1 7.2 7.4 7.6 8.1 8.0 8.2 8.9 9.4 9.8Households MM3Q 1,052.6 1,075.5 1,095.9 1,114.7 1,128.3 1,143.8 1,162.3 1,183.3 1,203.8 1,214.6 1,233.0 1,246.4 1,249.9 1,250.6 1,254.3 1,256.8
Total households & NPISH2 MM4Y 1,052.6 1,075.5 1,095.9 1,114.7 1,128.3 1,143.8 1,162.3 1,183.3 1,203.8 1,214.6 1,233.0 1,246.4 1,249.9 1,250.6 1,254.3 1,256.8
Total dwellings (excluding land) MLO9 1,237.3 1,256.2 1,271.5 1,285.4 1,299.7 1,315.4 1,335.2 1,357.5 1,379.3 1,398.5 1,415.9 1,428.4 1,431.0 1,432.5 1,437.1 1,440.5
Other buildings and structures:
Total non-financial corporations1 MM5I 558.3 577.6 600.2 624.0 646.9 665.2 676.3 691.7 703.5 714.2 731.0 748.2 761.2 772.6 787.0 805.1Financial corporations MLZ2 67.6 70.1 72.6 74.1 76.0 77.5 78.1 78.4 79.0 79.3 79.3 79.6 79.5 78.9 78.5 78.1Central government MM2C 114.8 118.6 120.9 120.5 120.2 117.7 120.9 126.8 128.1 130.5 136.6 139.4 149.0 162.2 164.6 168.7Local government MM32 138.1 142.9 147.6 149.0 150.4 147.6 149.8 154.5 158.2 163.6 170.5 174.4 187.7 207.1 215.0 224.9General government MQ3I 253.0 261.5 268.5 269.5 270.6 265.3 270.7 281.3 286.3 294.1 307.1 313.8 336.7 369.4 379.6 393.6Households MM3K 14.4 15.2 16.7 18.2 18.0 19.0 19.7 17.0 17.1 17.4 18.4 19.4 17.9 18.3 18.6 18.9
NPISH2 MM4A 35.7 35.1 35.0 34.7 37.5 35.1 35.2 36.6 38.5 34.3 35.3 33.6 31.7 30.8 27.0 25.0
Total households & NPISH2 MM4S 49.9 50.2 51.6 52.8 55.3 54.1 54.9 53.6 55.5 51.7 53.6 53.0 49.6 49.1 45.5 44.0
Total other buildings and structures MLO3 928.1 958.7 992.3 1,019.9 1,048.6 1,062.3 1,080.3 1,105.1 1,124.5 1,139.4 1,171.0 1,194.6 1,226.8 1,270.0 1,290.6 1,320.8
Other machinery and equipment:
Total non-financial corporations1 MM5P 258.5 267.8 273.1 282.6 288.7 295.2 303.6 313.0 330.3 343.5 353.8 365.2 365.9 362.3 362.1 362.7Financial corporations MLZ8 10.5 10.3 10.3 10.5 10.9 11.4 11.9 11.9 12.8 13.8 14.7 15.9 16.0 15.9 16.6 17.6Central government MM2O 48.6 46.4 45.8 46.5 46.0 49.8 52.1 58.6 63.9 65.0 65.3 64.3 62.8 67.5 68.8 71.3Local government MM38 19.2 18.4 17.6 17.0 16.6 18.7 22.8 29.5 36.2 38.1 41.1 41.5 38.2 40.1 41.4 43.1General government MQ3M 67.1 64.1 62.7 62.6 61.7 67.6 74.4 87.8 99.9 103.0 106.3 105.8 101.0 107.6 110.2 114.4Households MM3W 15.6 17.5 18.4 20.2 21.4 22.4 23.4 24.4 25.5 26.7 28.2 29.5 29.6 29.7 29.9 30.3
NPISH2
MM4G 1.0 1.1 1.2 1.3 1.3 1.3 1.4 1.6 1.7 1.7 1.9 2.3 2.1 2.0 2.0 1.7
Total households & NPISH2 MM56 16.5 18.6 19.6 21.4 22.6 23.7 24.8 26.0 27.3 28.4 30.1 31.8 31.7 31.7 31.9 31.9
Total other machinery and equipment MLQ5 351.6 360.0 364.9 376.4 383.3 397.3 414.1 438.3 469.9 488.3 504.6 518.3 514.4 517.5 520.9 526.6
Transport equipment:
Total non-financial corporations1 MM5T 45.8 48.7 49.8 49.3 49.1 52.3 55.9 56.9 56.7 57.4 57.8 57.4 56.4 57.7 56.5 53.9Financial corporations MM29 0.9 0.8 0.8 0.7 0.6 0.5 0.5 0.4 0.4 0.4 0.3 0.3 0.3 0.2 0.3 0.3Central government MM2X 14.0 15.5 15.5 15.2 15.2 14.5 14.1 14.1 14.3 14.7 14.7 14.2 13.0 13.4 13.4 13.6Local government MM3H 9.9 10.0 10.1 9.9 10.1 9.5 9.4 9.8 10.5 11.1 12.1 12.7 13.6 14.2 14.3 14.8General government MQ3P 23.9 25.6 25.6 25.1 25.2 24.0 23.5 23.9 24.8 25.8 26.8 26.9 26.7 27.6 27.7 28.5Households MM47 6.9 6.7 6.2 5.8 5.5 5.5 5.6 5.6 5.6 5.7 5.7 5.6 5.3 5.0 5.0 5.2
NPISH2 MM4P 0.0 0.0 0.0 0.0 0.0 0.0 0.0 0.0 0.0 0.0 0.0 0.0 0.0 0.0 0.0 0.0
Total households & NPISH2 MM5F 6.9 6.7 6.3 5.8 5.5 5.6 5.6 5.6 5.6 5.7 5.7 5.6 5.3 5.0 5.0 5.2
Total transport equipment MLR6 77.5 81.7 82.3 80.9 80.4 82.4 85.5 86.9 87.6 89.2 90.7 90.3 88.7 90.6 89.4 87.8
Intangible fixed assets:
Total non-financial corporations1 MM5N 144.7 138.7 132.9 127.2 123.7 120.9 117.6 114.3 111.0 108.0 105.0 102.8 99.7 97.1 96.1 96.6Financial corporations MLZ5 4.2 4.4 4.4 4.7 5.3 5.8 6.2 6.4 6.6 6.8 7.0 7.5 7.7 7.8 8.0 8.3Central government MM2L 3.4 4.2 4.6 4.6 4.4 3.9 4.8 2.8 2.1 1.7 1.8 1.9 2.0 2.0 2.0 1.9Local government MM35 5.0 6.1 6.9 8.1 9.2 10.2 11.5 12.6 13.2 13.9 13.2 11.9 11.2 9.8 8.6 7.4General government MQ3L 8.4 10.2 11.5 12.8 13.6 14.2 16.3 15.3 15.3 15.6 14.9 13.8 13.2 11.8 10.6 9.4Households MM3T 0.5 0.5 0.5 0.5 0.5 0.5 0.5 0.5 0.5 0.5 0.5 0.5 0.5 0.5 0.5 0.5
NPISH2 MM4D 0.0 0.1 0.1 0.1 0.1 0.1 0.1 0.1 0.2 0.2 0.2 0.2 0.2 0.2 0.2 0.2
Total households & NPISH2 MM53 0.6 0.6 0.6 0.6 0.6 0.6 0.6 0.6 0.6 0.6 0.6 0.7 0.7 0.7 0.7 0.7
Total intangible fixed assets MLP7 156.0 152.5 148.4 144.5 142.6 141.1 140.6 136.6 133.4 131.0 127.6 124.7 121.3 117.3 115.4 114.9
Cultivated assets:
Total non-financial corporations1 MM5J 2.9 3.1 3.0 2.9 2.9 3.1 3.3 3.5 3.5 3.6 3.8 4.1 4.5 4.7 4.9 5.2
Central government MM2F 0.0 0.0 0.0 0.0 0.0 0.0 0.0 0.0 0.0 0.0 0.0 0.0 0.0 0.0 0.0 0.0
General government MQ3J 0.0 0.0 0.0 0.0 0.0 0.0 0.0 0.0 0.0 0.0 0.0 0.0 0.0 0.0 0.0 0.0
Households MM3N 0.2 0.2 0.2 0.2 0.2 0.2 0.2 0.2 0.2 0.2 0.2 0.2 0.2 0.2 0.3 0.3
Total cultivated assets: MLO6 3.1 3.2 3.2 3.0 3.0 3.2 3.5 3.7 3.7 3.8 4.0 4.3 4.7 5.0 5.2 5.5
All assets:
Total non-financial corporations1 MM5R 1,181.6 1,205.9 1,225.0 1,248.1 1,273.3 1,299.7 1,321.6 1,345.9 1,372.2 1,401.0 1,424.8 1,450.3 1,460.0 1,467.4 1,480.0 1,497.2Financial corporations MM26 83.8 86.1 88.2 90.1 93.0 95.6 97.1 97.6 99.3 100.6 101.7 103.4 103.4 102.8 103.4 104.3Central government MM2U 185.3 189.7 191.9 192.4 191.8 192.1 198.3 208.5 214.5 218.3 225.4 227.0 234.9 254.1 258.1 265.4Local government MM3E 170.4 174.8 179.0 180.7 182.9 183.6 191.8 205.3 217.0 225.6 235.6 239.3 250.6 271.2 279.3 290.2General government MQ3O 355.6 364.3 370.6 372.9 374.4 375.5 389.9 413.6 431.3 443.8 461.0 466.3 485.5 525.3 537.5 555.6Households MM44 1,086.8 1,113.4 1,136.1 1,158.7 1,173.3 1,191.6 1,212.2 1,230.9 1,252.7 1,265.1 1,286.0 1,301.7 1,303.5 1,304.4 1,308.5 1,312.0
NPISH2 MM4M 36.6 36.2 36.3 36.1 38.9 36.6 36.9 38.5 40.5 36.3 37.5 36.0 34.0 33.0 29.2 26.9Total households & NPISH2 MM5C 1,124.7 1,150.7 1,173.2 1,195.5 1,213.5 1,228.7 1,249.6 1,270.1 1,294.1 1,301.7 1,323.8 1,338.0 1,337.5 1,337.4 1,337.7 1,338.9
Total assets MLR3 2,740.0 2,800.7 2,850.1 2,898.9 2,947.0 2,993.3 3,052.7 3,123.1 3,193.3 3,244.8 3,309.3 3,356.3 3,385.1 3,432.9 3,458.6 3,495.9
1 An asset breakdown of non financial corporations into public and private sector corporations is not available in this release.2 Non-profit institutions serving households.
Note: Differences between totals and sums of components are due to rounding.
Back to contents
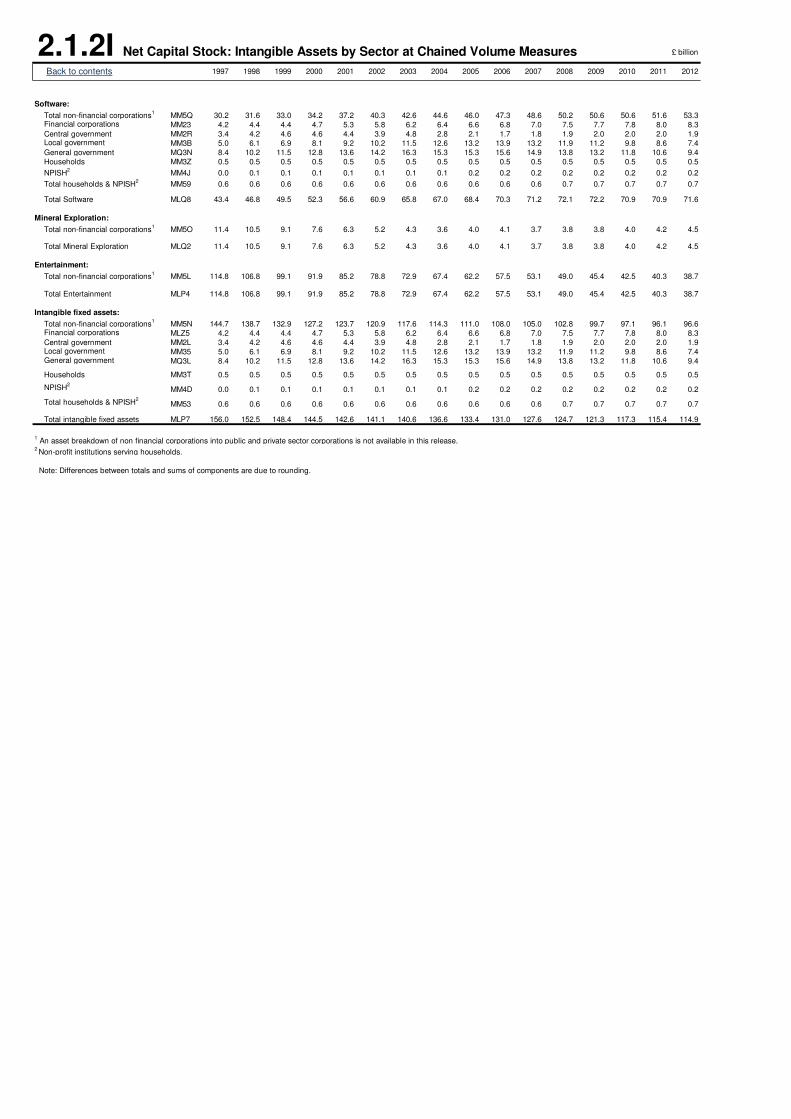
2.1.2I Net Capital Stock: Intangible Assets by Sector at Chained Volume Measures £ billion
1997 1998 1999 2000 2001 2002 2003 2004 2005 2006 2007 2008 2009 2010 2011 2012
Software:
Total non-financial corporations1
MM5Q 30.2 31.6 33.0 34.2 37.2 40.3 42.6 44.6 46.0 47.3 48.6 50.2 50.6 50.6 51.6 53.3Financial corporations MM23 4.2 4.4 4.4 4.7 5.3 5.8 6.2 6.4 6.6 6.8 7.0 7.5 7.7 7.8 8.0 8.3
Central government MM2R 3.4 4.2 4.6 4.6 4.4 3.9 4.8 2.8 2.1 1.7 1.8 1.9 2.0 2.0 2.0 1.9Local government MM3B 5.0 6.1 6.9 8.1 9.2 10.2 11.5 12.6 13.2 13.9 13.2 11.9 11.2 9.8 8.6 7.4
General government MQ3N 8.4 10.2 11.5 12.8 13.6 14.2 16.3 15.3 15.3 15.6 14.9 13.8 13.2 11.8 10.6 9.4
Households MM3Z 0.5 0.5 0.5 0.5 0.5 0.5 0.5 0.5 0.5 0.5 0.5 0.5 0.5 0.5 0.5 0.5
NPISH2
MM4J 0.0 0.1 0.1 0.1 0.1 0.1 0.1 0.1 0.2 0.2 0.2 0.2 0.2 0.2 0.2 0.2
Total households & NPISH2
MM59 0.6 0.6 0.6 0.6 0.6 0.6 0.6 0.6 0.6 0.6 0.6 0.7 0.7 0.7 0.7 0.7
Total Software MLQ8 43.4 46.8 49.5 52.3 56.6 60.9 65.8 67.0 68.4 70.3 71.2 72.1 72.2 70.9 70.9 71.6
Mineral Exploration:
Total non-financial corporations1
MM5O 11.4 10.5 9.1 7.6 6.3 5.2 4.3 3.6 4.0 4.1 3.7 3.8 3.8 4.0 4.2 4.5
Total Mineral Exploration MLQ2 11.4 10.5 9.1 7.6 6.3 5.2 4.3 3.6 4.0 4.1 3.7 3.8 3.8 4.0 4.2 4.5
Entertainment:
Total non-financial corporations1
MM5L 114.8 106.8 99.1 91.9 85.2 78.8 72.9 67.4 62.2 57.5 53.1 49.0 45.4 42.5 40.3 38.7
Total Entertainment MLP4 114.8 106.8 99.1 91.9 85.2 78.8 72.9 67.4 62.2 57.5 53.1 49.0 45.4 42.5 40.3 38.7
Intangible fixed assets:
Total non-financial corporations1
MM5N 144.7 138.7 132.9 127.2 123.7 120.9 117.6 114.3 111.0 108.0 105.0 102.8 99.7 97.1 96.1 96.6Financial corporations MLZ5 4.2 4.4 4.4 4.7 5.3 5.8 6.2 6.4 6.6 6.8 7.0 7.5 7.7 7.8 8.0 8.3
Central government MM2L 3.4 4.2 4.6 4.6 4.4 3.9 4.8 2.8 2.1 1.7 1.8 1.9 2.0 2.0 2.0 1.9Local government MM35 5.0 6.1 6.9 8.1 9.2 10.2 11.5 12.6 13.2 13.9 13.2 11.9 11.2 9.8 8.6 7.4General government MQ3L 8.4 10.2 11.5 12.8 13.6 14.2 16.3 15.3 15.3 15.6 14.9 13.8 13.2 11.8 10.6 9.4
Households MM3T 0.5 0.5 0.5 0.5 0.5 0.5 0.5 0.5 0.5 0.5 0.5 0.5 0.5 0.5 0.5 0.5
NPISH2
MM4D 0.0 0.1 0.1 0.1 0.1 0.1 0.1 0.1 0.2 0.2 0.2 0.2 0.2 0.2 0.2 0.2
Total households & NPISH2
MM53 0.6 0.6 0.6 0.6 0.6 0.6 0.6 0.6 0.6 0.6 0.6 0.7 0.7 0.7 0.7 0.7
Total intangible fixed assets MLP7 156.0 152.5 148.4 144.5 142.6 141.1 140.6 136.6 133.4 131.0 127.6 124.7 121.3 117.3 115.4 114.9
1 An asset breakdown of non financial corporations into public and private sector corporations is not available in this release.
2 Non-profit institutions serving households.
Note: Differences between totals and sums of components are due to rounding.
Back to contents
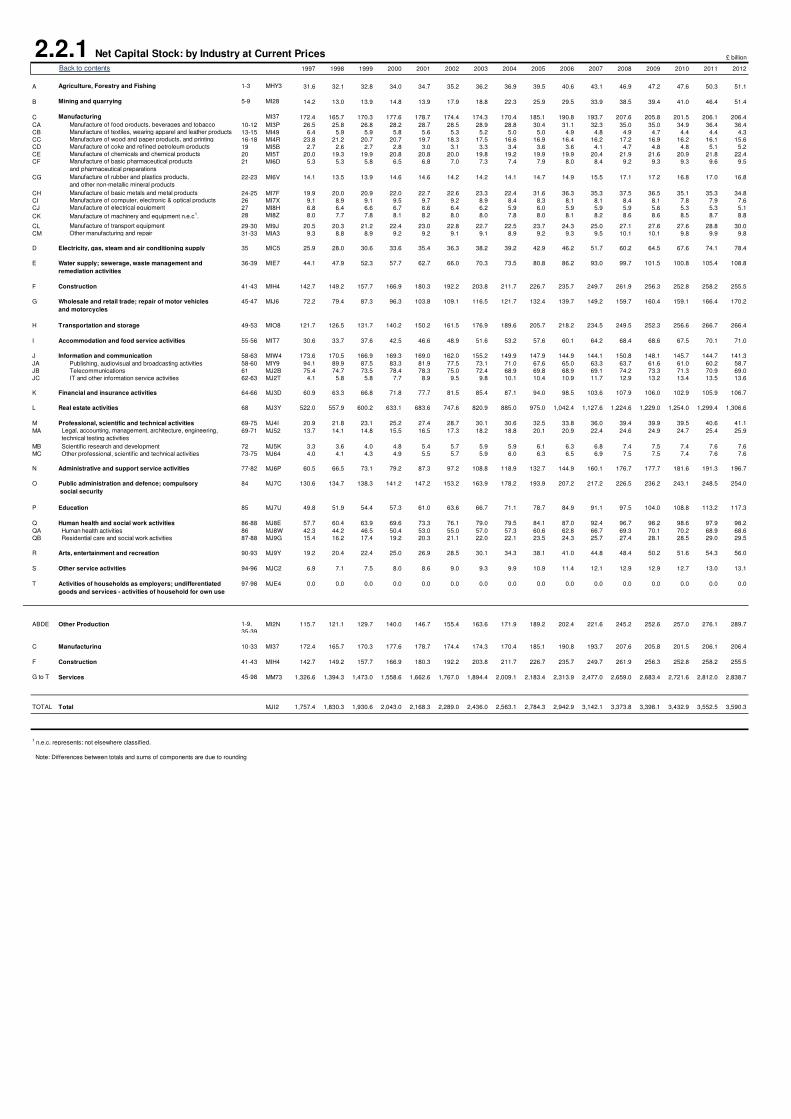
2.2.1 Net Capital Stock: by Industry at Current Prices £ billion
1997 1998 1999 2000 2001 2002 2003 2004 2005 2006 2007 2008 2009 2010 2011 2012
A Agriculture, Forestry and Fishing 1-3 MHY3 31.6 32.1 32.8 34.0 34.7 35.2 36.2 36.9 39.5 40.6 43.1 46.9 47.2 47.6 50.3 51.1
B Mining and quarrying 5-9 MI28 14.2 13.0 13.9 14.8 13.9 17.9 18.8 22.3 25.9 29.5 33.9 38.5 39.4 41.0 46.4 51.4
C Manufacturing MI37 172.4 165.7 170.3 177.6 178.7 174.4 174.3 170.4 185.1 190.8 193.7 207.6 205.8 201.5 206.1 206.4
CA 10-12 MI3P 26.5 25.8 26.8 28.2 28.7 28.5 28.9 28.8 30.4 31.1 32.3 35.0 35.0 34.9 36.4 36.4
CB 13-15 MI49 6.4 5.9 5.9 5.8 5.6 5.3 5.2 5.0 5.0 4.9 4.8 4.9 4.7 4.4 4.4 4.3
CC 16-18 MI4R 23.8 21.2 20.7 20.7 19.7 18.3 17.5 16.6 16.9 16.4 16.2 17.2 16.9 16.2 16.1 15.6
CD 19 MI5B 2.7 2.6 2.7 2.8 3.0 3.1 3.3 3.4 3.6 3.6 4.1 4.7 4.8 4.8 5.1 5.2
CE 20 MI5T 20.0 19.3 19.9 20.8 20.8 20.0 19.8 19.2 19.9 19.9 20.4 21.9 21.6 20.9 21.8 22.4
CF 21 MI6D 5.3 5.3 5.8 6.5 6.8 7.0 7.3 7.4 7.9 8.0 8.4 9.2 9.3 9.3 9.6 9.5
CG 22-23 MI6V 14.1 13.5 13.9 14.6 14.6 14.2 14.2 14.1 14.7 14.9 15.5 17.1 17.2 16.8 17.0 16.8
CH 24-25 MI7F 19.9 20.0 20.9 22.0 22.7 22.6 23.3 22.4 31.6 36.3 35.3 37.5 36.5 35.1 35.3 34.8
CI 26 MI7X 9.1 8.9 9.1 9.5 9.7 9.2 8.9 8.4 8.3 8.1 8.1 8.4 8.1 7.8 7.9 7.6
CJ 27 MI8H 6.8 6.4 6.6 6.7 6.6 6.4 6.2 5.9 6.0 5.9 5.9 5.9 5.6 5.3 5.3 5.1
CK 28 MI8Z 8.0 7.7 7.8 8.1 8.2 8.0 8.0 7.8 8.0 8.1 8.2 8.6 8.6 8.5 8.7 8.8
CL 29-30 MI9J 20.5 20.3 21.2 22.4 23.0 22.8 22.7 22.5 23.7 24.3 25.0 27.1 27.6 27.6 28.8 30.0
CM 31-33 MIA3 9.3 8.8 8.9 9.2 9.2 9.1 9.1 8.9 9.2 9.3 9.5 10.1 10.1 9.8 9.9 9.8
D 35 MIC5 25.9 28.0 30.6 33.6 35.4 36.3 38.2 39.2 42.9 46.2 51.7 60.2 64.5 67.6 74.1 78.4
E 36-39 MIE7 44.1 47.9 52.3 57.7 62.7 66.0 70.3 73.5 80.8 86.2 93.0 99.7 101.5 100.8 105.4 108.8
F Construction 41-43 MIH4 142.7 149.2 157.7 166.9 180.3 192.2 203.8 211.7 226.7 235.7 249.7 261.9 256.3 252.8 258.2 255.5
G 45-47 MIJ6 72.2 79.4 87.3 96.3 103.8 109.1 116.5 121.7 132.4 139.7 149.2 159.7 160.4 159.1 166.4 170.2
H Transportation and storage 49-53 MIO8 121.7 126.5 131.7 140.2 150.2 161.5 176.9 189.6 205.7 218.2 234.5 249.5 252.3 256.6 266.7 266.4
I Accommodation and food service activities 55-56 MIT7 30.6 33.7 37.6 42.5 46.6 48.9 51.6 53.2 57.6 60.1 64.2 68.4 68.6 67.5 70.1 71.0
J Information and communication 58-63 MIW4 173.6 170.5 166.9 169.3 169.0 162.0 155.2 149.9 147.9 144.9 144.1 150.8 148.1 145.7 144.7 141.3
JA Publishing, audiovisual and broadcasting activities 58-60 MIY9 94.1 89.9 87.5 83.3 81.9 77.5 73.1 71.0 67.6 65.0 63.3 63.7 61.6 61.0 60.2 58.7
JB Telecommunications 61 MJ2B 75.4 74.7 73.5 78.4 78.3 75.0 72.4 68.9 69.8 68.9 69.1 74.2 73.3 71.3 70.9 69.0
JC IT and other information service activities 62-63 MJ2T 4.1 5.8 5.8 7.7 8.9 9.5 9.8 10.1 10.4 10.9 11.7 12.9 13.2 13.4 13.5 13.6
K Financial and insurance activities 64-66 MJ3D 60.9 63.3 66.8 71.8 77.7 81.5 85.4 87.1 94.0 98.5 103.6 107.9 106.0 102.9 105.9 106.7
L Real estate activities 68 MJ3Y 522.0 557.9 600.2 633.1 683.6 747.6 820.9 885.0 975.0 1,042.4 1,127.6 1,224.6 1,229.0 1,254.0 1,299.4 1,306.6
M Professional, scientific and technical activities 69-75 MJ4I 20.9 21.8 23.1 25.2 27.4 28.7 30.1 30.6 32.5 33.8 36.0 39.4 39.9 39.5 40.6 41.1
MA 69-71 MJ52 13.7 14.1 14.8 15.5 16.5 17.3 18.2 18.8 20.1 20.9 22.4 24.6 24.9 24.7 25.4 25.9
MB Scientific research and development 72 MJ5K 3.3 3.6 4.0 4.8 5.4 5.7 5.9 5.9 6.1 6.3 6.8 7.4 7.5 7.4 7.6 7.6
MC Other professional, scientific and technical activities 73-75 MJ64 4.0 4.1 4.3 4.9 5.5 5.7 5.9 6.0 6.3 6.5 6.9 7.5 7.5 7.4 7.6 7.6
N Administrative and support service activities 77-82 MJ6P 60.5 66.5 73.1 79.2 87.3 97.2 108.8 118.9 132.7 144.9 160.1 176.7 177.7 181.6 191.3 196.7
O 84 MJ7C 130.6 134.7 138.3 141.2 147.2 153.2 163.9 178.2 193.9 207.2 217.2 226.5 236.2 243.1 248.5 254.0
P Education 85 MJ7U 49.8 51.9 54.4 57.3 61.0 63.6 66.7 71.1 78.7 84.9 91.1 97.5 104.0 108.8 113.2 117.3
Q Human health and social work activities 86-88 MJ8E 57.7 60.4 63.9 69.6 73.3 76.1 79.0 79.5 84.1 87.0 92.4 96.7 98.2 98.6 97.9 98.2
QA Human health activities 86 MJ8W 42.3 44.2 46.5 50.4 53.0 55.0 57.0 57.3 60.6 62.8 66.7 69.3 70.1 70.2 68.9 68.6
QB Residential care and social work activities 87-88 MJ9G 15.4 16.2 17.4 19.2 20.3 21.1 22.0 22.1 23.5 24.3 25.7 27.4 28.1 28.5 29.0 29.5
R Arts, entertainment and recreation 90-93 MJ9Y 19.2 20.4 22.4 25.0 26.9 28.5 30.1 34.3 38.1 41.0 44.8 48.4 50.2 51.6 54.3 56.0
S Other service activities 94-96 MJC2 6.9 7.1 7.5 8.0 8.6 9.0 9.3 9.9 10.9 11.4 12.1 12.9 12.9 12.7 13.0 13.1
T 97-98 MJE4 0.0 0.0 0.0 0.0 0.0 0.0 0.0 0.0 0.0 0.0 0.0 0.0 0.0 0.0 0.0 0.0
ABDE Other Production 1-9,
35-39
MI2N 115.7 121.1 129.7 140.0 146.7 155.4 163.6 171.9 189.2 202.4 221.6 245.2 252.6 257.0 276.1 289.7
C Manufacturing 10-33 MI37 172.4 165.7 170.3 177.6 178.7 174.4 174.3 170.4 185.1 190.8 193.7 207.6 205.8 201.5 206.1 206.4
F Construction 41-43 MIH4 142.7 149.2 157.7 166.9 180.3 192.2 203.8 211.7 226.7 235.7 249.7 261.9 256.3 252.8 258.2 255.5
G to T Services 45-98 MM73 1,326.6 1,394.3 1,473.0 1,558.6 1,662.6 1,767.0 1,894.4 2,009.1 2,183.4 2,313.9 2,477.0 2,659.0 2,683.4 2,721.6 2,812.0 2,838.7
TOTAL Total MJI2 1,757.4 1,830.3 1,930.6 2,043.0 2,168.3 2,289.0 2,436.0 2,563.1 2,784.3 2,942.9 3,142.1 3,373.8 3,398.1 3,432.9 3,552.5 3,590.3
1 n.e.c. represents; not elsewhere classified.
Note: Differences between totals and sums of components are due to rounding
Public administration and defence; compulsory
social security
Activities of households as employers; undifferentiated
goods and services - activities of household for own use
Manufacture of transport equipment
Other manufacturing and repair
Electricity, gas, steam and air conditioning supply
Water supply; sewerage, waste management and
remediation activities
Wholesale and retail trade; repair of motor vehicles
and motorcycles
Legal, accounting, management, architecture, engineering,
technical testing activities
Manufacture of machinery and equipment n.e.c1.
Back to contents
Manufacture of food products, beverages and tobacco
Manufacture of textiles, wearing apparel and leather products
Manufacture of wood and paper products, and printing
Manufacture of coke and refined petroleum products
Manufacture of chemicals and chemical products
Manufacture of basic pharmaceutical products
and pharmaceutical preparations
Manufacture of rubber and plastics products,
and other non-metallic mineral products
Manufacture of basic metals and metal products
Manufacture of computer, electronic & optical products
Manufacture of electrical equipment
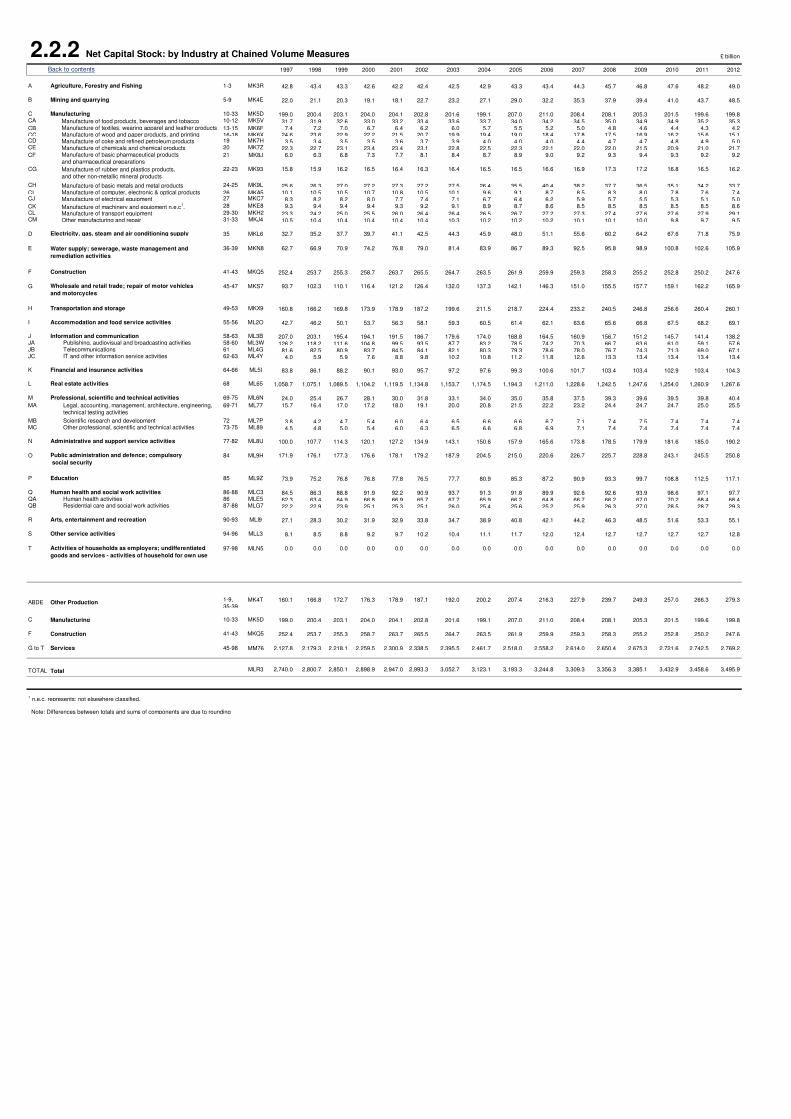
2.2.2 Net Capital Stock: by Industry at Chained Volume Measures £ billion
1997 1998 1999 2000 2001 2002 2003 2004 2005 2006 2007 2008 2009 2010 2011 2012
A Agriculture, Forestry and Fishing 1-3 MK3R 42.8 43.4 43.3 42.6 42.2 42.4 42.5 42.9 43.3 43.4 44.3 45.7 46.8 47.6 48.2 49.0
B Mining and quarrying 5-9 MK4E 22.0 21.1 20.3 19.1 18.1 22.7 23.2 27.1 29.0 32.2 35.3 37.9 39.4 41.0 43.7 48.5
C Manufacturing 10-33 MK5D 199.0 200.4 203.1 204.0 204.1 202.8 201.6 199.1 207.0 211.0 208.4 208.1 205.3 201.5 199.6 199.8CA 10-12 MK5V 31.7 31.9 32.6 33.0 33.2 33.4 33.6 33.7 34.0 34.2 34.5 35.0 34.9 34.9 35.2 35.3CB 13-15 MK6F 7.4 7.2 7.0 6.7 6.4 6.2 6.0 5.7 5.5 5.2 5.0 4.8 4.6 4.4 4.3 4.2CC 16-18 MK6X 24.6 23.6 22.9 22.2 21.5 20.7 19.9 19.4 19.0 18.4 17.8 17.5 16.9 16.2 15.6 15.1CD 19 MK7H 3.5 3.4 3.5 3.5 3.6 3.7 3.9 4.0 4.0 4.0 4.4 4.7 4.7 4.8 4.9 5.0CE 20 MK7Z 22.3 22.7 23.1 23.4 23.4 23.1 22.8 22.5 22.3 22.1 22.0 22.0 21.5 20.9 21.0 21.7CF 21 MK8J 6.0 6.3 6.8 7.3 7.7 8.1 8.4 8.7 8.9 9.0 9.2 9.3 9.4 9.3 9.2 9.2
CG 22-23 MK93 15.8 15.9 16.2 16.5 16.4 16.3 16.4 16.5 16.5 16.6 16.9 17.3 17.2 16.8 16.5 16.2
CH 24-25 MK9L 25.6 26.3 27.0 27.2 27.3 27.2 27.5 26.4 35.5 40.4 38.2 37.7 36.5 35.1 34.2 33.7CI 26 MKA5 10.1 10.5 10.5 10.7 10.8 10.5 10.1 9.6 9.1 8.7 8.5 8.3 8.0 7.8 7.6 7.4CJ 27 MKC7 8.3 8.2 8.2 8.0 7.7 7.4 7.1 6.7 6.4 6.2 5.9 5.7 5.5 5.3 5.1 5.0
CK 28 MKE8 9.3 9.4 9.4 9.4 9.3 9.2 9.1 8.9 8.7 8.6 8.5 8.5 8.5 8.5 8.5 8.6CL 29-30 MKH2 23.3 24.2 25.0 25.5 26.0 26.4 26.4 26.5 26.7 27.2 27.3 27.4 27.6 27.6 27.9 29.1CM 31-33 MKJ4 10.5 10.4 10.4 10.4 10.4 10.4 10.3 10.2 10.2 10.2 10.1 10.1 10.0 9.8 9.7 9.5
D 35 MKL6 32.7 35.2 37.7 39.7 41.1 42.5 44.3 45.9 48.0 51.1 55.6 60.2 64.2 67.6 71.8 75.9
E 36-39 MKN8 62.7 66.9 70.9 74.2 76.8 79.0 81.4 83.9 86.7 89.3 92.5 95.8 98.9 100.8 102.6 105.9
F Construction 41-43 MKQ5 252.4 253.7 255.3 258.7 263.7 265.5 264.7 263.5 261.9 259.9 259.3 258.3 255.2 252.8 250.2 247.6
G 45-47 MKS7 93.7 102.3 110.1 116.4 121.2 126.4 132.0 137.3 142.1 146.3 151.0 155.5 157.7 159.1 162.2 165.9
H Transportation and storage 49-53 MKX9 160.8 166.2 169.8 173.9 178.9 187.2 199.6 211.5 218.7 224.4 233.2 240.5 246.8 256.6 260.4 260.1
I Accommodation and food service activities 55-56 ML2O 42.7 46.2 50.1 53.7 56.3 58.1 59.3 60.5 61.4 62.1 63.6 65.6 66.8 67.5 68.2 69.1
J Information and communication 58-63 ML3B 207.0 203.1 195.4 194.1 191.5 186.7 179.6 174.0 168.8 164.5 160.9 156.7 151.2 145.7 141.4 138.2JA Publishing, audiovisual and broadcasting activities 58-60 ML3W 126.2 118.2 111.6 104.8 99.5 93.5 87.7 83.2 78.5 74.2 70.3 66.7 63.6 61.0 59.1 57.6JB Telecommunications 61 ML4G 81.6 82.5 80.9 83.7 84.5 84.1 82.1 80.3 79.3 78.6 78.0 76.7 74.3 71.3 69.0 67.1JC IT and other information service activities 62-63 ML4Y 4.0 5.9 5.9 7.6 8.8 9.8 10.2 10.8 11.2 11.8 12.6 13.3 13.4 13.4 13.4 13.4
K Financial and insurance activities 64-66 ML5I 83.8 86.1 88.2 90.1 93.0 95.7 97.2 97.6 99.3 100.6 101.7 103.4 103.4 102.9 103.4 104.3
L Real estate activities 68 ML65 1,058.7 1,075.1 1,089.5 1,104.2 1,119.5 1,134.8 1,153.7 1,174.5 1,194.3 1,211.0 1,228.6 1,242.5 1,247.6 1,254.0 1,260.9 1,267.6
M Professional, scientific and technical activities 69-75 ML6N 24.0 25.4 26.7 28.1 30.0 31.8 33.1 34.0 35.0 35.8 37.5 39.3 39.6 39.5 39.8 40.4
MA 69-71 ML77 15.7 16.4 17.0 17.2 18.0 19.1 20.0 20.8 21.5 22.2 23.2 24.4 24.7 24.7 25.0 25.5
MB Scientific research and development 72 ML7P 3.8 4.2 4.7 5.4 6.0 6.4 6.5 6.6 6.6 6.7 7.1 7.4 7.5 7.4 7.4 7.4MC Other professional, scientific and technical activities 73-75 ML89 4.5 4.8 5.0 5.4 6.0 6.3 6.5 6.6 6.8 6.9 7.1 7.4 7.4 7.4 7.4 7.4
N Administrative and support service activities 77-82 ML8U 100.0 107.7 114.3 120.1 127.2 134.9 143.1 150.6 157.9 165.6 173.8 178.5 179.9 181.6 185.0 190.2
O 84 ML9H 171.9 176.1 177.3 176.6 178.1 179.2 187.9 204.5 215.0 220.6 226.7 225.7 228.8 243.1 245.5 250.8
P Education 85 ML9Z 73.9 75.2 76.8 76.8 77.8 76.5 77.7 80.9 85.3 87.2 90.9 93.3 99.7 108.8 112.5 117.1
Q Human health and social work activities 86-88 MLC3 84.5 86.3 88.8 91.9 92.2 90.9 93.7 91.3 91.8 89.9 92.6 92.6 93.9 98.6 97.1 97.7QA Human health activities 86 MLE5 62.3 63.4 64.9 66.8 66.9 65.7 67.7 65.9 66.2 64.8 66.7 66.2 67.0 70.2 68.4 68.4QB Residential care and social work activities 87-88 MLG7 22.2 22.9 23.9 25.1 25.3 25.1 26.0 25.4 25.6 25.2 25.9 26.3 27.0 28.5 28.7 29.3
R Arts, entertainment and recreation 90-93 MLI9 27.1 28.3 30.2 31.9 32.9 33.8 34.7 38.9 40.8 42.1 44.2 46.3 48.5 51.6 53.3 55.1
S Other service activities 94-96 MLL3 8.1 8.5 8.8 9.2 9.7 10.2 10.4 11.1 11.7 12.0 12.4 12.7 12.7 12.7 12.7 12.8
T 97-98 MLN5 0.0 0.0 0.0 0.0 0.0 0.0 0.0 0.0 0.0 0.0 0.0 0.0 0.0 0.0 0.0 0.0
ABDE Other Production1-9,
35-39MK4T 160.1 166.8 172.7 176.3 178.9 187.1 192.0 200.2 207.4 216.3 227.9 239.7 249.3 257.0 266.3 279.3
C Manufacturing 10-33 MK5D 199.0 200.4 203.1 204.0 204.1 202.8 201.6 199.1 207.0 211.0 208.4 208.1 205.3 201.5 199.6 199.8
F Construction 41-43 MKQ5 252.4 253.7 255.3 258.7 263.7 265.5 264.7 263.5 261.9 259.9 259.3 258.3 255.2 252.8 250.2 247.6
G to T Services 45-98 MM76 2,127.8 2,179.3 2,218.1 2,259.5 2,300.9 2,338.5 2,395.5 2,461.7 2,518.0 2,558.2 2,614.0 2,650.4 2,675.3 2,721.6 2,742.5 2,769.2
TOTAL Total MLR3 2,740.0 2,800.7 2,850.1 2,898.9 2,947.0 2,993.3 3,052.7 3,123.1 3,193.3 3,244.8 3,309.3 3,356.3 3,385.1 3,432.9 3,458.6 3,495.9
1 n.e.c. represents; not elsewhere classified.
Note: Differences between totals and sums of components are due to rounding
Public administration and defence; compulsory
social security
Activities of households as employers; undifferentiated
goods and services - activities of household for own use
Manufacture of transport equipment Other manufacturing and repair
Electricity, gas, steam and air conditioning supply
Water supply; sewerage, waste management and
remediation activities
Wholesale and retail trade; repair of motor vehicles
and motorcycles
Legal, accounting, management, architecture, engineering,
technical testing activities
Manufacture of machinery and equipment n.e.c1.
Back to contents
Manufacture of food products, beverages and tobacco Manufacture of textiles, wearing apparel and leather products Manufacture of wood and paper products, and printing Manufacture of coke and refined petroleum products Manufacture of chemicals and chemical products Manufacture of basic pharmaceutical products
and pharmaceutical preparations
Manufacture of rubber and plastics products,
and other non-metallic mineral products
Manufacture of basic metals and metal products Manufacture of computer, electronic & optical products Manufacture of electrical equipment
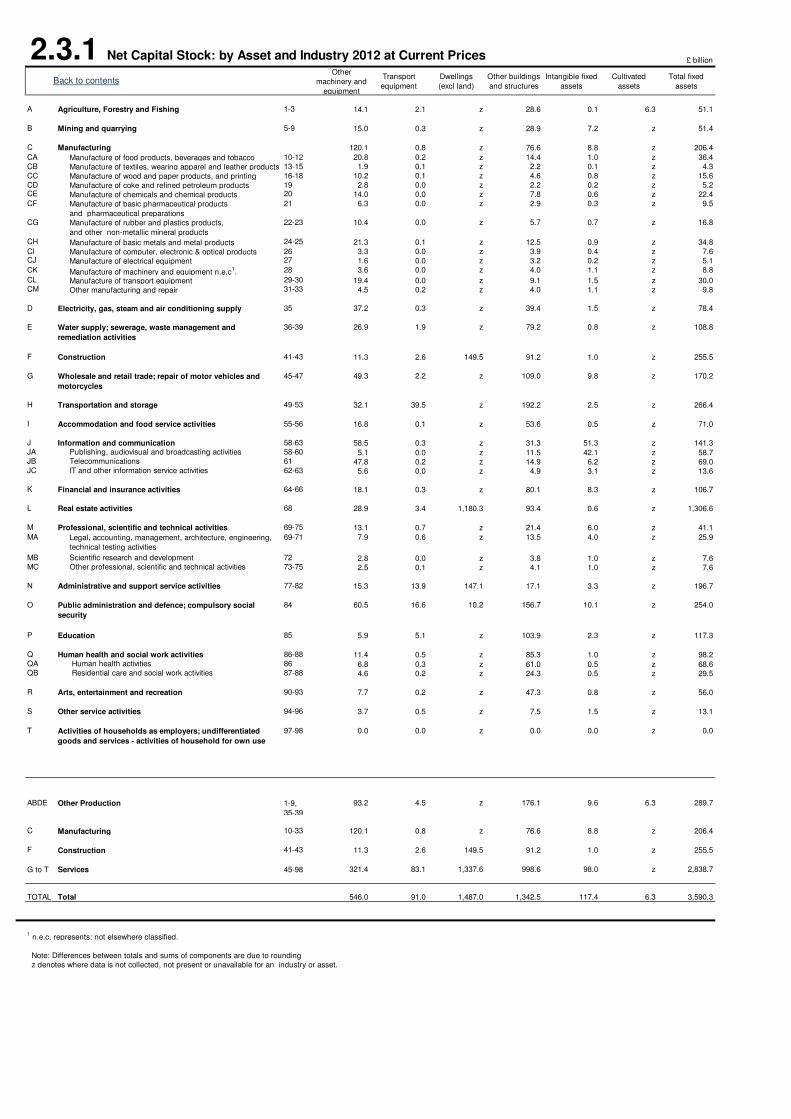
2.3.1 Net Capital Stock: by Asset and Industry 2012 at Current Prices £ billion
Other
machinery and
equipment
Transport
equipment
Dwellings
(excl land)
Other buildings
and structures
Intangible fixed
assets
Cultivated
assets
Total fixed
assets
A Agriculture, Forestry and Fishing 1-3 14.1 2.1 z 28.6 0.1 6.3 51.1
B Mining and quarrying 5-9 15.0 0.3 z 28.9 7.2 z 51.4
C Manufacturing 120.1 0.8 z 76.6 8.8 z 206.4
CA 10-12 20.8 0.2 z 14.4 1.0 z 36.4
CB 13-15 1.9 0.1 z 2.2 0.1 z 4.3
CC 16-18 10.2 0.1 z 4.6 0.8 z 15.6
CD 19 2.8 0.0 z 2.2 0.2 z 5.2CE 20 14.0 0.0 z 7.8 0.6 z 22.4
CF 21 6.3 0.0 z 2.9 0.3 z 9.5
CG 22-23 10.4 0.0 z 5.7 0.7 z 16.8
CH 24-25 21.3 0.1 z 12.5 0.9 z 34.8
CI 26 3.3 0.0 z 3.9 0.4 z 7.6CJ 27 1.6 0.0 z 3.2 0.2 z 5.1
CK 28 3.6 0.0 z 4.0 1.1 z 8.8
CL 29-30 19.4 0.0 z 9.1 1.5 z 30.0CM 31-33 4.5 0.2 z 4.0 1.1 z 9.8
D 35 37.2 0.3 z 39.4 1.5 z 78.4
E 36-39 26.9 1.9 z 79.2 0.8 z 108.8
F Construction 41-43 11.3 2.6 149.5 91.2 1.0 z 255.5
G 45-47 49.3 2.2 z 109.0 9.8 z 170.2
H Transportation and storage 49-53 32.1 39.5 z 192.2 2.5 z 266.4
I Accommodation and food service activities 55-56 16.8 0.1 z 53.6 0.5 z 71.0
J Information and communication 58-63 58.5 0.3 z 31.3 51.3 z 141.3JA Publishing, audiovisual and broadcasting activities 58-60 5.1 0.0 z 11.5 42.1 z 58.7JB Telecommunications 61 47.8 0.2 z 14.9 6.2 z 69.0JC IT and other information service activities 62-63 5.6 0.0 z 4.9 3.1 z 13.6
K Financial and insurance activities 64-66 18.1 0.3 z 80.1 8.3 z 106.7
L Real estate activities 68 28.9 3.4 1,180.3 93.4 0.6 z 1,306.6
M Professional, scientific and technical activities 69-75 13.1 0.7 z 21.4 6.0 z 41.1
MA 69-71 7.9 0.6 z 13.5 4.0 z 25.9
MB Scientific research and development 72 2.8 0.0 z 3.8 1.0 z 7.6MC Other professional, scientific and technical activities 73-75 2.5 0.1 z 4.1 1.0 z 7.6
N Administrative and support service activities 77-82 15.3 13.9 147.1 17.1 3.3 z 196.7
O 84 60.5 16.6 10.2 156.7 10.1 z 254.0
P Education 85 5.9 5.1 z 103.9 2.3 z 117.3
Q Human health and social work activities 86-88 11.4 0.5 z 85.3 1.0 z 98.2QA Human health activities 86 6.8 0.3 z 61.0 0.5 z 68.6QB Residential care and social work activities 87-88 4.6 0.2 z 24.3 0.5 z 29.5
R Arts, entertainment and recreation 90-93 7.7 0.2 z 47.3 0.8 z 56.0
S Other service activities 94-96 3.7 0.5 z 7.5 1.5 z 13.1
T 97-98 0.0 0.0 z 0.0 0.0 z 0.0
ABDE Other Production 1-9,
35-39
93.2 4.5 z 176.1 9.6 6.3 289.7
C Manufacturing 10-33 120.1 0.8 z 76.6 8.8 z 206.4
F Construction 41-43 11.3 2.6 149.5 91.2 1.0 z 255.5
G to T Services 45-98 321.4 83.1 1,337.6 998.6 98.0 z 2,838.7
TOTAL Total 546.0 91.0 1,487.0 1,342.5 117.4 6.3 3,590.3
1 n.e.c. represents; not elsewhere classified.
Note: Differences between totals and sums of components are due to rounding
z denotes where data is not collected, not present or unavailable for an industry or asset.
Public administration and defence; compulsory social
security
Activities of households as employers; undifferentiated
goods and services - activities of household for own use
Manufacture of transport equipment
Other manufacturing and repair
Electricity, gas, steam and air conditioning supply
Water supply; sewerage, waste management and
remediation activities
Wholesale and retail trade; repair of motor vehicles and
motorcycles
Legal, accounting, management, architecture, engineering,
technical testing activities
Manufacture of machinery and equipment n.e.c1.
Back to contents
Manufacture of food products, beverages and tobacco
Manufacture of textiles, wearing apparel and leather products
Manufacture of wood and paper products, and printing
Manufacture of coke and refined petroleum products
Manufacture of chemicals and chemical products
Manufacture of basic pharmaceutical products
and pharmaceutical preparations
Manufacture of rubber and plastics products,
and other non-metallic mineral products
Manufacture of basic metals and metal products
Manufacture of computer, electronic & optical products
Manufacture of electrical equipment
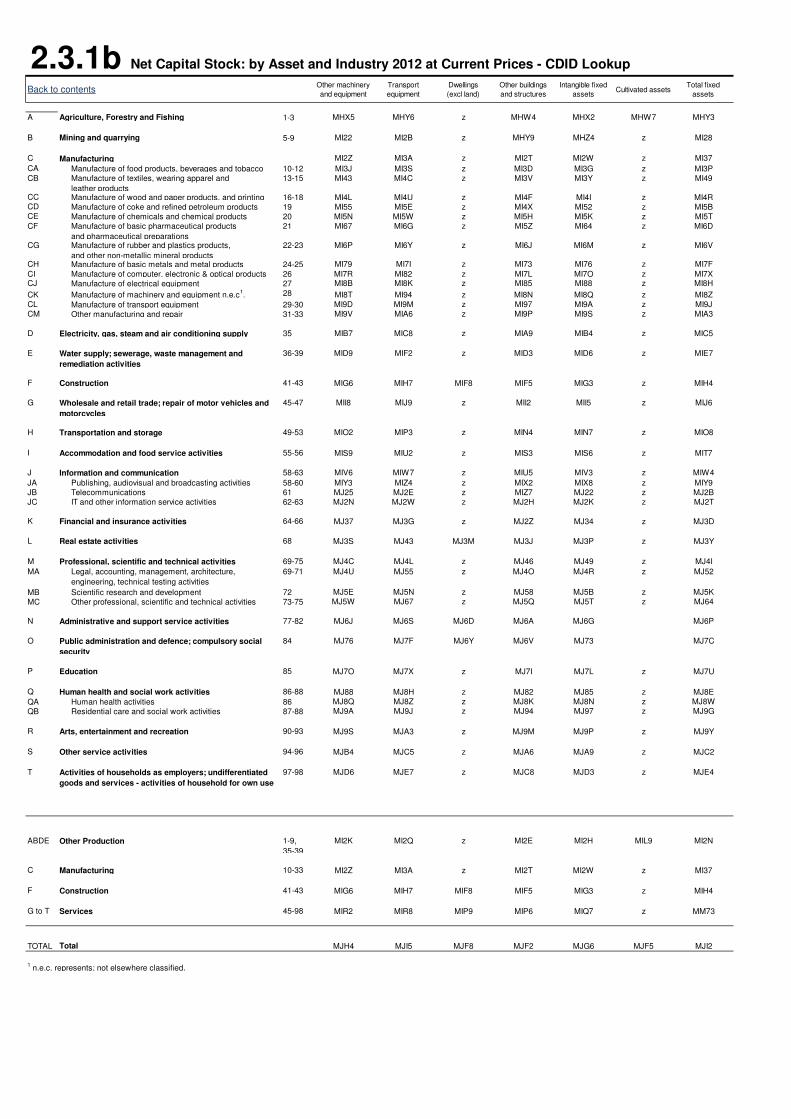
2.3.1b Net Capital Stock: by Asset and Industry 2012 at Current Prices - CDID Lookup
Back to contentsOther machinery
and equipment
Transport
equipment
Dwellings
(excl land)
Other buildings
and structures
Intangible fixed
assetsCultivated assets
Total fixed
assets
A Agriculture, Forestry and Fishing 1-3 MHX5 MHY6 z MHW4 MHX2 MHW7 MHY3
B Mining and quarrying 5-9 MI22 MI2B z MHY9 MHZ4 z MI28
C Manufacturing MI2Z MI3A z MI2T MI2W z MI37
CA Manufacture of food products, beverages and tobacco 10-12 MI3J MI3S z MI3D MI3G z MI3P
CB Manufacture of textiles, wearing apparel and
leather products
13-15 MI43 MI4C z MI3V MI3Y z MI49
CC Manufacture of wood and paper products, and printing 16-18 MI4L MI4U z MI4F MI4I z MI4RCD Manufacture of coke and refined petroleum products 19 MI55 MI5E z MI4X MI52 z MI5BCE Manufacture of chemicals and chemical products 20 MI5N MI5W z MI5H MI5K z MI5T
CF Manufacture of basic pharmaceutical products
and pharmaceutical preparations
21 MI67 MI6G z MI5Z MI64 z MI6D
CG Manufacture of rubber and plastics products,
and other non-metallic mineral products
22-23 MI6P MI6Y z MI6J MI6M z MI6V
CH Manufacture of basic metals and metal products 24-25 MI79 MI7I z MI73 MI76 z MI7F
CI Manufacture of computer, electronic & optical products 26 MI7R MI82 z MI7L MI7O z MI7XCJ Manufacture of electrical equipment 27 MI8B MI8K z MI85 MI88 z MI8H
CK Manufacture of machinery and equipment n.e.c1. 28 MI8T MI94 z MI8N MI8Q z MI8Z
CL Manufacture of transport equipment 29-30 MI9D MI9M z MI97 MI9A z MI9J
CM Other manufacturing and repair 31-33 MI9V MIA6 z MI9P MI9S z MIA3
D Electricity, gas, steam and air conditioning supply 35 MIB7 MIC8 z MIA9 MIB4 z MIC5
E Water supply; sewerage, waste management and
remediation activities
36-39 MID9 MIF2 z MID3 MID6 z MIE7
F Construction 41-43 MIG6 MIH7 MIF8 MIF5 MIG3 z MIH4
G Wholesale and retail trade; repair of motor vehicles and
motorcycles
45-47 MII8 MIJ9 z MII2 MII5 z MIJ6
H Transportation and storage 49-53 MIO2 MIP3 z MIN4 MIN7 z MIO8
I Accommodation and food service activities 55-56 MIS9 MIU2 z MIS3 MIS6 z MIT7
J Information and communication 58-63 MIV6 MIW7 z MIU5 MIV3 z MIW4
JA Publishing, audiovisual and broadcasting activities 58-60 MIY3 MIZ4 z MIX2 MIX8 z MIY9
JB Telecommunications 61 MJ25 MJ2E z MIZ7 MJ22 z MJ2B
JC IT and other information service activities 62-63 MJ2N MJ2W z MJ2H MJ2K z MJ2T
K Financial and insurance activities 64-66 MJ37 MJ3G z MJ2Z MJ34 z MJ3D
L Real estate activities 68 MJ3S MJ43 MJ3M MJ3J MJ3P z MJ3Y
M Professional, scientific and technical activities 69-75 MJ4C MJ4L z MJ46 MJ49 z MJ4I
MA Legal, accounting, management, architecture,
engineering, technical testing activities
69-71 MJ4U MJ55 z MJ4O MJ4R z MJ52
MB Scientific research and development 72 MJ5E MJ5N z MJ58 MJ5B z MJ5K
MC Other professional, scientific and technical activities 73-75 MJ5W MJ67 z MJ5Q MJ5T z MJ64
N Administrative and support service activities 77-82 MJ6J MJ6S MJ6D MJ6A MJ6G MJ6P
O Public administration and defence; compulsory social
security
84 MJ76 MJ7F MJ6Y MJ6V MJ73 MJ7C
P Education 85 MJ7O MJ7X z MJ7I MJ7L z MJ7U
Q Human health and social work activities 86-88 MJ88 MJ8H z MJ82 MJ85 z MJ8E
QA Human health activities 86 MJ8Q MJ8Z z MJ8K MJ8N z MJ8W
QB Residential care and social work activities 87-88 MJ9A MJ9J z MJ94 MJ97 z MJ9G
R Arts, entertainment and recreation 90-93 MJ9S MJA3 z MJ9M MJ9P z MJ9Y
S Other service activities 94-96 MJB4 MJC5 z MJA6 MJA9 z MJC2
T Activities of households as employers; undifferentiated
goods and services - activities of household for own use
97-98 MJD6 MJE7 z MJC8 MJD3 z MJE4
ABDE Other Production 1-9,
35-39
MI2K MI2Q z MI2E MI2H MIL9 MI2N
C Manufacturing 10-33 MI2Z MI3A z MI2T MI2W z MI37
F Construction 41-43 MIG6 MIH7 MIF8 MIF5 MIG3 z MIH4
G to T Services 45-98 MIR2 MIR8 MIP9 MIP6 MIQ7 z MM73
TOTAL Total MJH4 MJI5 MJF8 MJF2 MJG6 MJF5 MJI2
1 n.e.c. represents; not elsewhere classified.
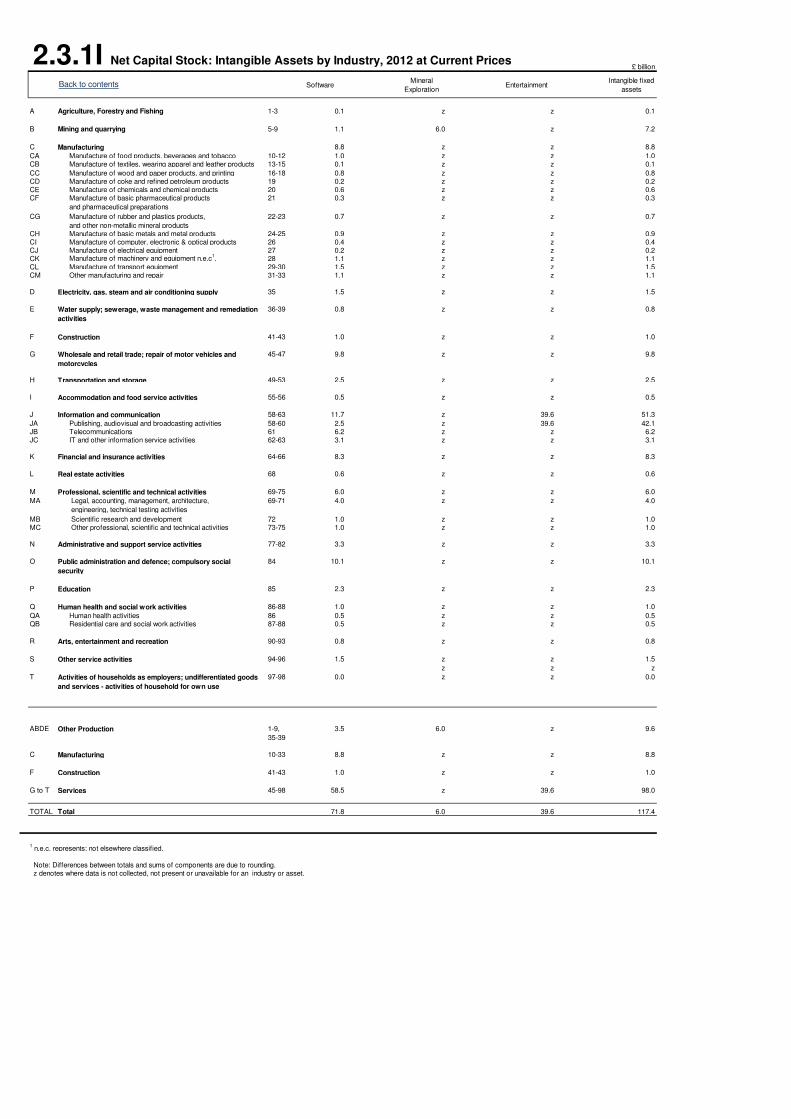
£ billion
SoftwareMineral
ExplorationEntertainment
Intangible fixed
assets
A Agriculture, Forestry and Fishing 1-3 0.1 z z 0.1
B Mining and quarrying 5-9 1.1 6.0 z 7.2
C Manufacturing 8.8 z z 8.8
CA Manufacture of food products, beverages and tobacco 10-12 1.0 z z 1.0CB Manufacture of textiles, wearing apparel and leather products 13-15 0.1 z z 0.1
CC Manufacture of wood and paper products, and printing 16-18 0.8 z z 0.8CD Manufacture of coke and refined petroleum products 19 0.2 z z 0.2CE Manufacture of chemicals and chemical products 20 0.6 z z 0.6CF Manufacture of basic pharmaceutical products
and pharmaceutical preparations
21 0.3 z z 0.3
CG Manufacture of rubber and plastics products,
and other non-metallic mineral products
22-23 0.7 z z 0.7
CH Manufacture of basic metals and metal products 24-25 0.9 z z 0.9CI Manufacture of computer, electronic & optical products 26 0.4 z z 0.4CJ Manufacture of electrical equipment 27 0.2 z z 0.2CK Manufacture of machinery and equipment n.e.c
1. 28 1.1 z z 1.1
CL Manufacture of transport equipment 29-30 1.5 z z 1.5CM Other manufacturing and repair 31-33 1.1 z z 1.1
D Electricity, gas, steam and air conditioning supply 35 1.5 z z 1.5
E Water supply; sewerage, waste management and remediation
activities
36-39 0.8 z z 0.8
F Construction 41-43 1.0 z z 1.0
G Wholesale and retail trade; repair of motor vehicles and
motorcycles
45-47 9.8 z z 9.8
H Transportation and storage 49-53 2.5 z z 2.5
I Accommodation and food service activities 55-56 0.5 z z 0.5
J Information and communication 58-63 11.7 z 39.6 51.3
JA Publishing, audiovisual and broadcasting activities 58-60 2.5 z 39.6 42.1JB Telecommunications 61 6.2 z z 6.2JC IT and other information service activities 62-63 3.1 z z 3.1
K Financial and insurance activities 64-66 8.3 z z 8.3
L Real estate activities 68 0.6 z z 0.6
M Professional, scientific and technical activities 69-75 6.0 z z 6.0
MA Legal, accounting, management, architecture,
engineering, technical testing activities
69-71 4.0 z z 4.0
MB Scientific research and development 72 1.0 z z 1.0MC Other professional, scientific and technical activities 73-75 1.0 z z 1.0
N Administrative and support service activities 77-82 3.3 z z 3.3
O Public administration and defence; compulsory social
security
84 10.1 z z 10.1
P Education 85 2.3 z z 2.3
Q Human health and social work activities 86-88 1.0 z z 1.0
QA Human health activities 86 0.5 z z 0.5QB Residential care and social work activities 87-88 0.5 z z 0.5
R Arts, entertainment and recreation 90-93 0.8 z z 0.8
S Other service activities 94-96 1.5 z z 1.5
z z z
T Activities of households as employers; undifferentiated goods
and services - activities of household for own use
97-98 0.0 z z 0.0
ABDE Other Production 1-9,
35-39
3.5 6.0 z 9.6
C Manufacturing 10-33 8.8 z z 8.8
F Construction 41-43 1.0 z z 1.0
G to T Services 45-98 58.5 z 39.6 98.0
z z z zTOTAL Total 71.8 6.0 39.6 117.4
1 n.e.c. represents; not elsewhere classified.
Note: Differences between totals and sums of components are due to rounding. z denotes where data is not collected, not present or unavailable for an industry or asset.
2.3.1I Net Capital Stock: Intangible Assets by Industry, 2012 at Current Prices
Back to contents
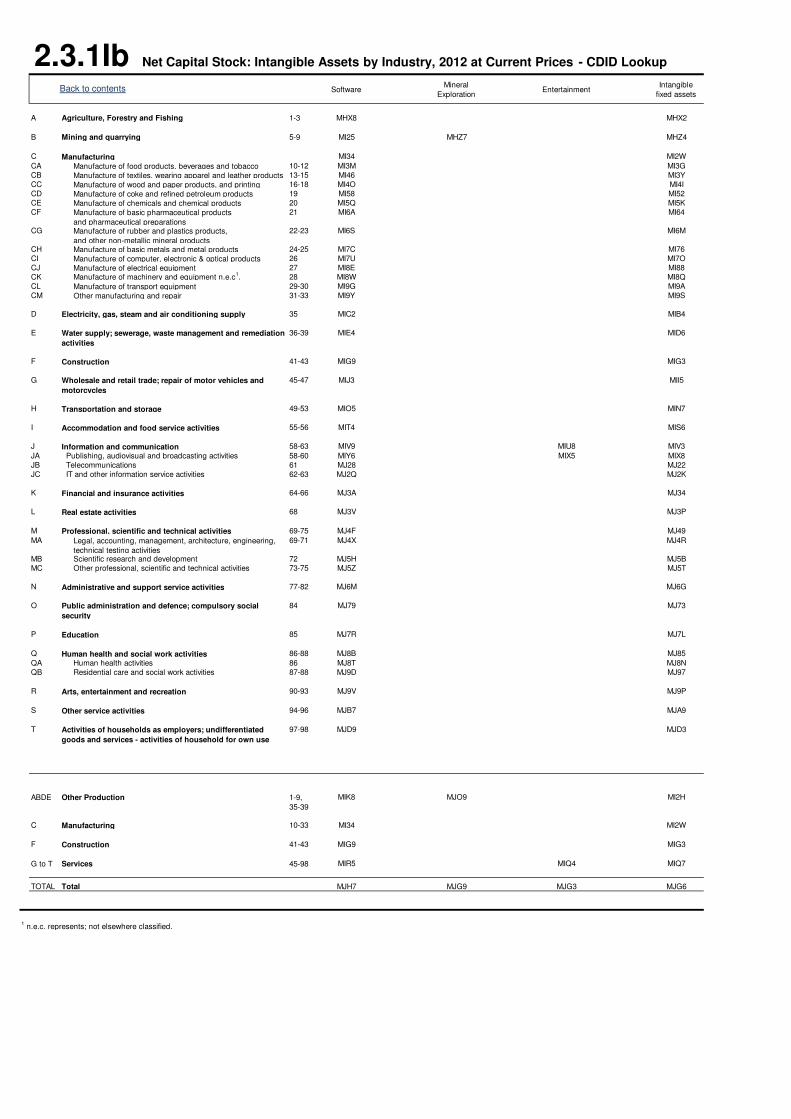
SoftwareMineral
ExplorationEntertainment
Intangible
fixed assets
A Agriculture, Forestry and Fishing 1-3 MHX8 MHX2
B Mining and quarrying 5-9 MI25 MHZ7 MHZ4
C Manufacturing MI34 MI2W
CA Manufacture of food products, beverages and tobacco 10-12 MI3M MI3G
CB Manufacture of textiles, wearing apparel and leather products 13-15 MI46 MI3Y
CC Manufacture of wood and paper products, and printing 16-18 MI4O MI4I
CD Manufacture of coke and refined petroleum products 19 MI58 MI52
CE Manufacture of chemicals and chemical products 20 MI5Q MI5K
CF Manufacture of basic pharmaceutical products
and pharmaceutical preparations
21 MI6A MI64
CG Manufacture of rubber and plastics products,
and other non-metallic mineral products
22-23 MI6S MI6M
CH Manufacture of basic metals and metal products 24-25 MI7C MI76
CI Manufacture of computer, electronic & optical products 26 MI7U MI7O
CJ Manufacture of electrical equipment 27 MI8E MI88
CK Manufacture of machinery and equipment n.e.c1. 28 MI8W MI8Q
CL Manufacture of transport equipment 29-30 MI9G MI9A
CM Other manufacturing and repair 31-33 MI9Y MI9S
D Electricity, gas, steam and air conditioning supply 35 MIC2 MIB4
E Water supply; sewerage, waste management and remediation
activities
36-39 MIE4 MID6
F Construction 41-43 MIG9 MIG3
G Wholesale and retail trade; repair of motor vehicles and
motorcycles
45-47 MIJ3 MII5
H Transportation and storage 49-53 MIO5 MIN7
I Accommodation and food service activities 55-56 MIT4 MIS6
J Information and communication 58-63 MIV9 MIU8 MIV3
JA Publishing, audiovisual and broadcasting activities 58-60 MIY6 MIX5 MIX8
JB Telecommunications 61 MJ28 MJ22
JC IT and other information service activities 62-63 MJ2Q MJ2K
K Financial and insurance activities 64-66 MJ3A MJ34
L Real estate activities 68 MJ3V MJ3P
M Professional, scientific and technical activities 69-75 MJ4F MJ49
MA Legal, accounting, management, architecture, engineering,
technical testing activities
69-71 MJ4X MJ4R
MB Scientific research and development 72 MJ5H MJ5B
MC Other professional, scientific and technical activities 73-75 MJ5Z MJ5T
N Administrative and support service activities 77-82 MJ6M MJ6G
O Public administration and defence; compulsory social
security
84 MJ79 MJ73
P Education 85 MJ7R MJ7L
Q Human health and social work activities 86-88 MJ8B MJ85
QA Human health activities 86 MJ8T MJ8N
QB Residential care and social work activities 87-88 MJ9D MJ97
R Arts, entertainment and recreation 90-93 MJ9V MJ9P
S Other service activities 94-96 MJB7 MJA9
T Activities of households as employers; undifferentiated
goods and services - activities of household for own use
97-98 MJD9 MJD3
ABDE Other Production 1-9,
35-39
MIK8 MJO9 MI2H
C Manufacturing 10-33 MI34 MI2W
F Construction 41-43 MIG9 MIG3
G to T Services 45-98 MIR5 MIQ4 MIQ7
TOTAL Total MJH7 MJG9 MJG3 MJG6
1 n.e.c. represents; not elsewhere classified.
2.3.1IbBack to contents
Net Capital Stock: Intangible Assets by Industry, 2012 at Current Prices - CDID Lookup
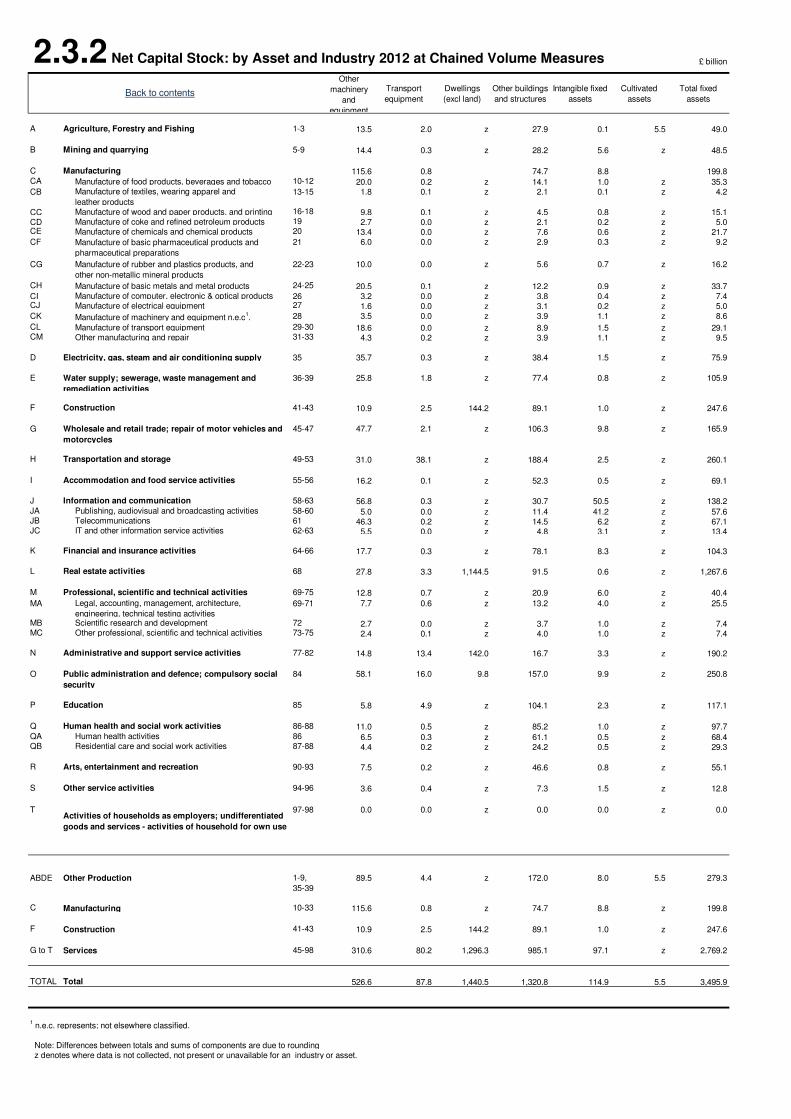
2.3.2 Net Capital Stock: by Asset and Industry 2012 at Chained Volume Measures £ billion
Other
machinery
and
equipment
Transport
equipment
Dwellings
(excl land)
Other buildings
and structures
Intangible fixed
assets
Cultivated
assets
Total fixed
assets
A Agriculture, Forestry and Fishing 1-3 13.5 2.0 z 27.9 0.1 5.5 49.0
B Mining and quarrying 5-9 14.4 0.3 z 28.2 5.6 z 48.5
C Manufacturing 115.6 0.8 74.7 8.8 199.8CA Manufacture of food products, beverages and tobacco 10-12 20.0 0.2 z 14.1 1.0 z 35.3CB Manufacture of textiles, wearing apparel and
leather products
13-15 1.8 0.1 z 2.1 0.1 z 4.2
CC Manufacture of wood and paper products, and printing 16-18 9.8 0.1 z 4.5 0.8 z 15.1CD Manufacture of coke and refined petroleum products 19 2.7 0.0 z 2.1 0.2 z 5.0CE Manufacture of chemicals and chemical products 20 13.4 0.0 z 7.6 0.6 z 21.7CF Manufacture of basic pharmaceutical products and
pharmaceutical preparations
21 6.0 0.0 z 2.9 0.3 z 9.2
CG Manufacture of rubber and plastics products, and
other non-metallic mineral products
22-23 10.0 0.0 z 5.6 0.7 z 16.2
CH Manufacture of basic metals and metal products 24-25 20.5 0.1 z 12.2 0.9 z 33.7CI Manufacture of computer, electronic & optical products 26 3.2 0.0 z 3.8 0.4 z 7.4CJ Manufacture of electrical equipment 27 1.6 0.0 z 3.1 0.2 z 5.0CK Manufacture of machinery and equipment n.e.c
1. 28 3.5 0.0 z 3.9 1.1 z 8.6
CL Manufacture of transport equipment 29-30 18.6 0.0 z 8.9 1.5 z 29.1CM Other manufacturing and repair 31-33 4.3 0.2 z 3.9 1.1 z 9.5
D Electricity, gas, steam and air conditioning supply 35 35.7 0.3 z 38.4 1.5 z 75.9
E Water supply; sewerage, waste management and
remediation activities
36-39 25.8 1.8 z 77.4 0.8 z 105.9
F Construction 41-43 10.9 2.5 144.2 89.1 1.0 z 247.6
G Wholesale and retail trade; repair of motor vehicles and
motorcycles
45-47 47.7 2.1 z 106.3 9.8 z 165.9
H Transportation and storage 49-53 31.0 38.1 z 188.4 2.5 z 260.1
I Accommodation and food service activities 55-56 16.2 0.1 z 52.3 0.5 z 69.1
J Information and communication 58-63 56.8 0.3 z 30.7 50.5 z 138.2JA Publishing, audiovisual and broadcasting activities 58-60 5.0 0.0 z 11.4 41.2 z 57.6JB Telecommunications 61 46.3 0.2 z 14.5 6.2 z 67.1JC IT and other information service activities 62-63 5.5 0.0 z 4.8 3.1 z 13.4
K Financial and insurance activities 64-66 17.7 0.3 z 78.1 8.3 z 104.3
L Real estate activities 68 27.8 3.3 1,144.5 91.5 0.6 z 1,267.6
M Professional, scientific and technical activities 69-75 12.8 0.7 z 20.9 6.0 z 40.4
MA Legal, accounting, management, architecture,
engineering, technical testing activities
69-71 7.7 0.6 z 13.2 4.0 z 25.5
MB Scientific research and development 72 2.7 0.0 z 3.7 1.0 z 7.4MC Other professional, scientific and technical activities 73-75 2.4 0.1 z 4.0 1.0 z 7.4
N Administrative and support service activities 77-82 14.8 13.4 142.0 16.7 3.3 z 190.2
O Public administration and defence; compulsory social
security
84 58.1 16.0 9.8 157.0 9.9 z 250.8
P Education 85 5.8 4.9 z 104.1 2.3 z 117.1
Q Human health and social work activities 86-88 11.0 0.5 z 85.2 1.0 z 97.7QA Human health activities 86 6.5 0.3 z 61.1 0.5 z 68.4QB Residential care and social work activities 87-88 4.4 0.2 z 24.2 0.5 z 29.3
R Arts, entertainment and recreation 90-93 7.5 0.2 z 46.6 0.8 z 55.1
S Other service activities 94-96 3.6 0.4 z 7.3 1.5 z 12.8
TActivities of households as employers; undifferentiated
goods and services - activities of household for own use
97-98 0.0 0.0 z 0.0 0.0 z 0.0
ABDE Other Production 1-9,
35-39
89.5 4.4 z 172.0 8.0 5.5 279.3
C Manufacturing 10-33 115.6 0.8 z 74.7 8.8 z 199.8
F Construction 41-43 10.9 2.5 144.2 89.1 1.0 z 247.6
G to T Services 45-98 310.6 80.2 1,296.3 985.1 97.1 z 2,769.2
TOTAL Total 526.6 87.8 1,440.5 1,320.8 114.9 5.5 3,495.9
1 n.e.c. represents; not elsewhere classified.
Note: Differences between totals and sums of components are due to rounding z denotes where data is not collected, not present or unavailable for an industry or asset.
Back to contents
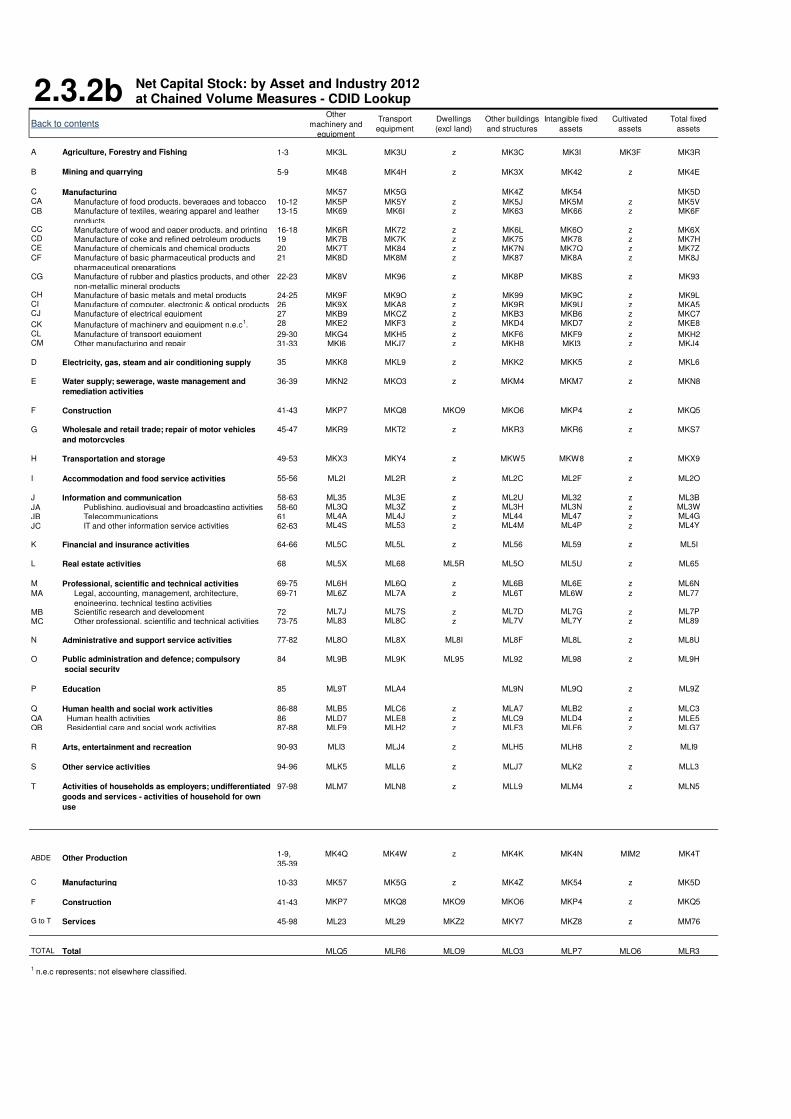
2.3.2bBack to contents
Other
machinery and
equipment
Transport
equipment
Dwellings
(excl land)
Other buildings
and structures
Intangible fixed
assets
Cultivated
assets
Total fixed
assets
A Agriculture, Forestry and Fishing 1-3 MK3L MK3U z MK3C MK3I MK3F MK3R
B Mining and quarrying 5-9 MK48 MK4H z MK3X MK42 z MK4E
C Manufacturing MK57 MK5G MK4Z MK54 MK5DCA Manufacture of food products, beverages and tobacco 10-12 MK5P MK5Y z MK5J MK5M z MK5VCB Manufacture of textiles, wearing apparel and leather
products
13-15 MK69 MK6I z MK63 MK66 z MK6F
CC Manufacture of wood and paper products, and printing 16-18 MK6R MK72 z MK6L MK6O z MK6XCD Manufacture of coke and refined petroleum products 19 MK7B MK7K z MK75 MK78 z MK7HCE Manufacture of chemicals and chemical products 20 MK7T MK84 z MK7N MK7Q z MK7ZCF Manufacture of basic pharmaceutical products and
pharmaceutical preparations
21 MK8D MK8M z MK87 MK8A z MK8J
CG Manufacture of rubber and plastics products, and other
non-metallic mineral products
22-23 MK8V MK96 z MK8P MK8S z MK93
CH Manufacture of basic metals and metal products 24-25 MK9F MK9O z MK99 MK9C z MK9LCI Manufacture of computer, electronic & optical products 26 MK9X MKA8 z MK9R MK9U z MKA5CJ Manufacture of electrical equipment 27 MKB9 MKCZ z MKB3 MKB6 z MKC7
CK Manufacture of machinery and equipment n.e.c1. 28 MKE2 MKF3 z MKD4 MKD7 z MKE8
CL Manufacture of transport equipment 29-30 MKG4 MKH5 z MKF6 MKF9 z MKH2CM Other manufacturing and repair 31-33 MKI6 MKJ7 z MKH8 MKI3 z MKJ4
D Electricity, gas, steam and air conditioning supply 35 MKK8 MKL9 z MKK2 MKK5 z MKL6
E Water supply; sewerage, waste management and
remediation activities
36-39 MKN2 MKO3 z MKM4 MKM7 z MKN8
F Construction 41-43 MKP7 MKQ8 MKO9 MKO6 MKP4 z MKQ5
G Wholesale and retail trade; repair of motor vehicles
and motorcycles
45-47 MKR9 MKT2 z MKR3 MKR6 z MKS7
H Transportation and storage 49-53 MKX3 MKY4 z MKW5 MKW8 z MKX9
I Accommodation and food service activities 55-56 ML2I ML2R z ML2C ML2F z ML2O
J Information and communication 58-63 ML35 ML3E z ML2U ML32 z ML3B
JA Publishing, audiovisual and broadcasting activities 58-60 ML3Q ML3Z z ML3H ML3N z ML3W
JB Telecommunications 61 ML4A ML4J z ML44 ML47 z ML4G
JC IT and other information service activities 62-63 ML4S ML53 z ML4M ML4P z ML4Y
K Financial and insurance activities 64-66 ML5C ML5L z ML56 ML59 z ML5I
L Real estate activities 68 ML5X ML68 ML5R ML5O ML5U z ML65
M Professional, scientific and technical activities 69-75 ML6H ML6Q z ML6B ML6E z ML6N
MA Legal, accounting, management, architecture,
engineering, technical testing activities
69-71 ML6Z ML7A z ML6T ML6W z ML77
MB Scientific research and development 72 ML7J ML7S z ML7D ML7G z ML7P
MC Other professional, scientific and technical activities 73-75 ML83 ML8C z ML7V ML7Y z ML89
N Administrative and support service activities 77-82 ML8O ML8X ML8I ML8F ML8L z ML8U
O Public administration and defence; compulsory
social security
84 ML9B ML9K ML95 ML92 ML98 z ML9H
P Education 85 ML9T MLA4 ML9N ML9Q z ML9Z
Q Human health and social work activities 86-88 MLB5 MLC6 z MLA7 MLB2 z MLC3
QA Human health activities 86 MLD7 MLE8 z MLC9 MLD4 z MLE5QB Residential care and social work activities 87-88 MLF9 MLH2 z MLF3 MLF6 z MLG7
R Arts, entertainment and recreation 90-93 MLI3 MLJ4 z MLH5 MLH8 z MLI9
S Other service activities 94-96 MLK5 MLL6 z MLJ7 MLK2 z MLL3
T Activities of households as employers; undifferentiated
goods and services - activities of household for own
use
97-98 MLM7 MLN8 z MLL9 MLM4 z MLN5
ABDE Other Production1-9,
35-39
MK4Q MK4W z MK4K MK4N MIM2 MK4T
C Manufacturing 10-33 MK57 MK5G z MK4Z MK54 z MK5D
F Construction 41-43 MKP7 MKQ8 MKO9 MKO6 MKP4 z MKQ5
G to T Services 45-98 ML23 ML29 MKZ2 MKY7 MKZ8 z MM76
TOTAL Total MLQ5 MLR6 MLO9 MLO3 MLP7 MLO6 MLR3
1 n.e.c represents; not elsewhere classified.
Net Capital Stock: by Asset and Industry 2012 at Chained Volume Measures - CDID Lookup
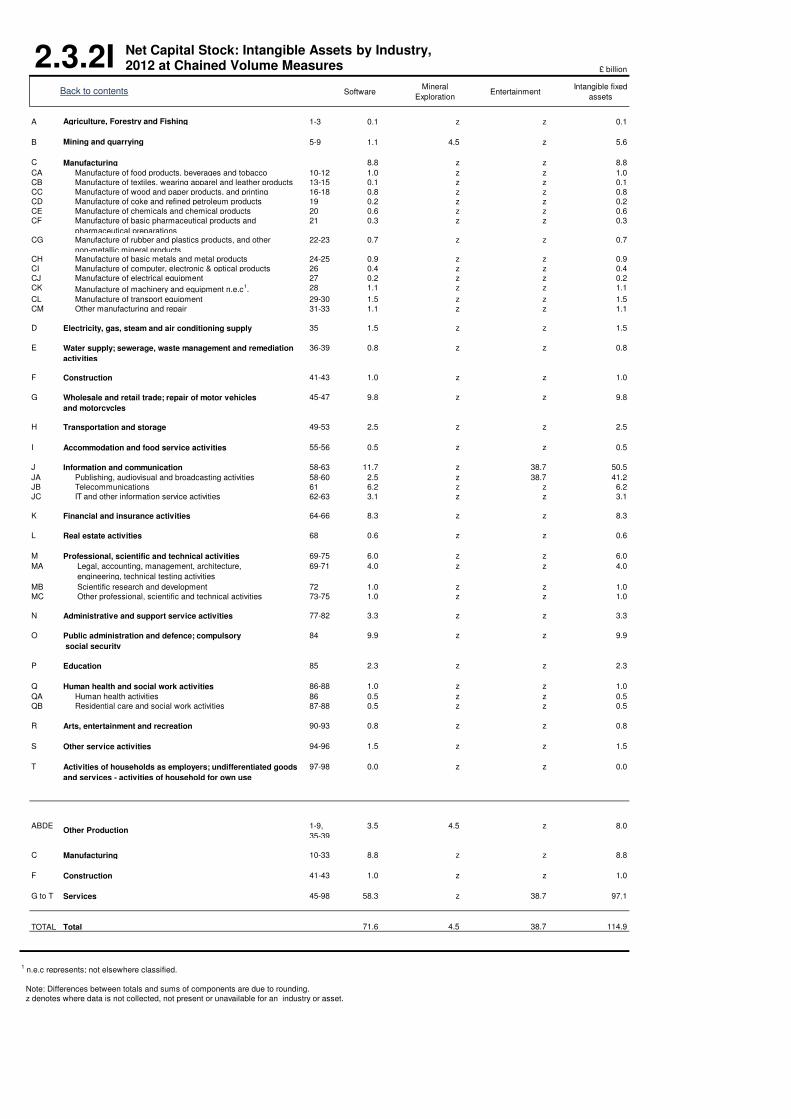
£ billion
SoftwareMineral
ExplorationEntertainment
Intangible fixed
assets
A Agriculture, Forestry and Fishing 1-3 0.1 z z 0.1
B Mining and quarrying 5-9 1.1 4.5 z 5.6
C Manufacturing 8.8 z z 8.8
CA Manufacture of food products, beverages and tobacco 10-12 1.0 z z 1.0
CB Manufacture of textiles, wearing apparel and leather products 13-15 0.1 z z 0.1
CC Manufacture of wood and paper products, and printing 16-18 0.8 z z 0.8
CD Manufacture of coke and refined petroleum products 19 0.2 z z 0.2
CE Manufacture of chemicals and chemical products 20 0.6 z z 0.6
CF Manufacture of basic pharmaceutical products and
pharmaceutical preparations
21 0.3 z z 0.3
CG Manufacture of rubber and plastics products, and other
non-metallic mineral products
22-23 0.7 z z 0.7
CH Manufacture of basic metals and metal products 24-25 0.9 z z 0.9
CI Manufacture of computer, electronic & optical products 26 0.4 z z 0.4
CJ Manufacture of electrical equipment 27 0.2 z z 0.2
CK Manufacture of machinery and equipment n.e.c1. 28 1.1 z z 1.1
CL Manufacture of transport equipment 29-30 1.5 z z 1.5
CM Other manufacturing and repair 31-33 1.1 z z 1.1
D Electricity, gas, steam and air conditioning supply 35 1.5 z z 1.5
E Water supply; sewerage, waste management and remediation
activities
36-39 0.8 z z 0.8
F Construction 41-43 1.0 z z 1.0
G Wholesale and retail trade; repair of motor vehicles
and motorcycles
45-47 9.8 z z 9.8
H Transportation and storage 49-53 2.5 z z 2.5
I Accommodation and food service activities 55-56 0.5 z z 0.5
J Information and communication 58-63 11.7 z 38.7 50.5
JA Publishing, audiovisual and broadcasting activities 58-60 2.5 z 38.7 41.2
JB Telecommunications 61 6.2 z z 6.2
JC IT and other information service activities 62-63 3.1 z z 3.1
K Financial and insurance activities 64-66 8.3 z z 8.3
L Real estate activities 68 0.6 z z 0.6
M Professional, scientific and technical activities 69-75 6.0 z z 6.0
MA Legal, accounting, management, architecture,
engineering, technical testing activities
69-71 4.0 z z 4.0
MB Scientific research and development 72 1.0 z z 1.0
MC Other professional, scientific and technical activities 73-75 1.0 z z 1.0
N Administrative and support service activities 77-82 3.3 z z 3.3
O Public administration and defence; compulsory
social security
84 9.9 z z 9.9
P Education 85 2.3 z z 2.3
Q Human health and social work activities 86-88 1.0 z z 1.0
QA Human health activities 86 0.5 z z 0.5
QB Residential care and social work activities 87-88 0.5 z z 0.5
R Arts, entertainment and recreation 90-93 0.8 z z 0.8
S Other service activities 94-96 1.5 z z 1.5
T Activities of households as employers; undifferentiated goods
and services - activities of household for own use
97-98 0.0 z z 0.0
ABDEOther Production
1-9,
35-39
3.5 4.5 z 8.0
C Manufacturing 10-33 8.8 z z 8.8
F Construction 41-43 1.0 z z 1.0
G to T Services 45-98 58.3 z 38.7 97.1
TOTAL Total 71.6 4.5 38.7 114.9
1 n.e.c represents; not elsewhere classified.
Note: Differences between totals and sums of components are due to rounding.
z denotes where data is not collected, not present or unavailable for an industry or asset.
2.3.2IBack to contents
Net Capital Stock: Intangible Assets by Industry, 2012 at Chained Volume Measures
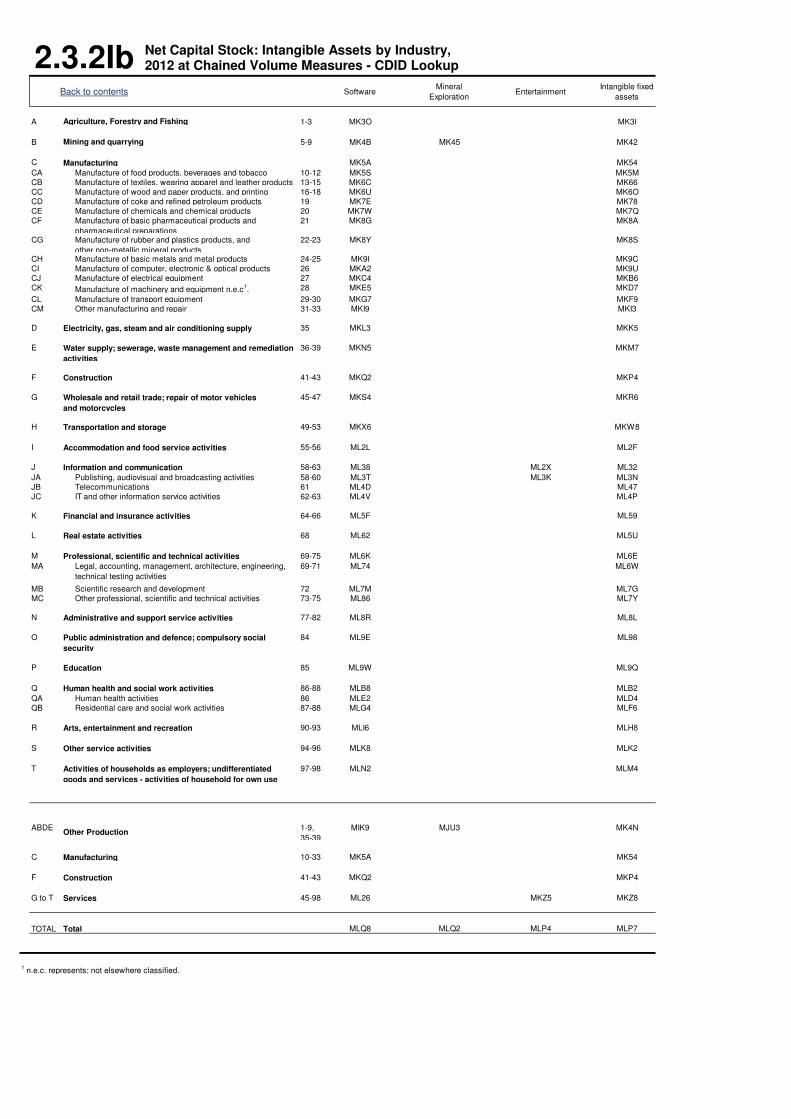
2.3.2IbBack to contents Software
Mineral
ExplorationEntertainment
Intangible fixed
assets
A Agriculture, Forestry and Fishing 1-3 MK3O MK3I
B Mining and quarrying 5-9 MK4B MK45 MK42
C Manufacturing MK5A MK54
CA Manufacture of food products, beverages and tobacco 10-12 MK5S MK5M
CB Manufacture of textiles, wearing apparel and leather products 13-15 MK6C MK66
CC Manufacture of wood and paper products, and printing 16-18 MK6U MK6O
CD Manufacture of coke and refined petroleum products 19 MK7E MK78
CE Manufacture of chemicals and chemical products 20 MK7W MK7Q
CF Manufacture of basic pharmaceutical products and
pharmaceutical preparations
21 MK8G MK8A
CG Manufacture of rubber and plastics products, and
other non-metallic mineral products
22-23 MK8Y MK8S
CH Manufacture of basic metals and metal products 24-25 MK9I MK9C
CI Manufacture of computer, electronic & optical products 26 MKA2 MK9U
CJ Manufacture of electrical equipment 27 MKC4 MKB6
CK Manufacture of machinery and equipment n.e.c1. 28 MKE5 MKD7
CL Manufacture of transport equipment 29-30 MKG7 MKF9
CM Other manufacturing and repair 31-33 MKI9 MKI3
D Electricity, gas, steam and air conditioning supply 35 MKL3 MKK5
E Water supply; sewerage, waste management and remediation
activities
36-39 MKN5 MKM7
F Construction 41-43 MKQ2 MKP4
G Wholesale and retail trade; repair of motor vehicles
and motorcycles
45-47 MKS4 MKR6
H Transportation and storage 49-53 MKX6 MKW8
I Accommodation and food service activities 55-56 ML2L ML2F
J Information and communication 58-63 ML38 ML2X ML32
JA Publishing, audiovisual and broadcasting activities 58-60 ML3T ML3K ML3N
JB Telecommunications 61 ML4D ML47
JC IT and other information service activities 62-63 ML4V ML4P
K Financial and insurance activities 64-66 ML5F ML59
L Real estate activities 68 ML62 ML5U
M Professional, scientific and technical activities 69-75 ML6K ML6E
MA Legal, accounting, management, architecture, engineering,
technical testing activities
69-71 ML74 ML6W
MB Scientific research and development 72 ML7M ML7G
MC Other professional, scientific and technical activities 73-75 ML86 ML7Y
N Administrative and support service activities 77-82 ML8R ML8L
O Public administration and defence; compulsory social
security
84 ML9E ML98
P Education 85 ML9W ML9Q
Q Human health and social work activities 86-88 MLB8 MLB2
QA Human health activities 86 MLE2 MLD4
QB Residential care and social work activities 87-88 MLG4 MLF6
R Arts, entertainment and recreation 90-93 MLI6 MLH8
S Other service activities 94-96 MLK8 MLK2
T Activities of households as employers; undifferentiated
goods and services - activities of household for own use
97-98 MLN2 MLM4
ABDEOther Production
1-9,
35-39
MIK9 MJU3 MK4N
C Manufacturing 10-33 MK5A MK54
F Construction 41-43 MKQ2 MKP4
G to T Services 45-98 ML26 MKZ5 MKZ8
TOTAL Total MLQ8 MLQ2 MLP4 MLP7
1 n.e.c. represents; not elsewhere classified.
Net Capital Stock: Intangible Assets by Industry, 2012 at Chained Volume Measures - CDID Lookup

2.4.1 Net Capital Stock: Percentage by Asset and Industry, 2012 at Current PricesPer cent
Other
machinery and
equipment
Transport
equipment
Dwellings (excl
land)
Other buildings
and structures
Intangible fixed
assets
Cultivated
assets
Total fixed
assets
A Agriculture, Forestry and Fishing 1-3 28 4 z 56 0 12 100
B Mining and quarrying 5-9 29 1 z 56 14 z 100
C Manufacturing
CA 10-12 57 0 z 40 3 z 100CB 13-15 44 2 z 51 3 z 100CC 16-18 65 0 z 30 5 z 100CD 19 55 0 z 42 3 z 100CE 20 62 0 z 35 3 z 100CF 21 66 0 z 31 3 z 100
CG 22-23 62 0 z 34 4 z 100
CH 24-25 61 0 z 36 2 z 100CI 26 44 0 z 51 5 z 100CJ 27 32 0 z 63 4 z 100
CK 28 41 0 z 46 13 z 100
CL 29-30 65 0 z 30 5 z 100CM 31-33 46 2 z 41 11 z 100
D 35 47 0 z 50 2 z 100
E 36-39 25 2 z 73 1 z 100
F Construction 41-43 4 1 58 36 0 z 100
G 45-47 29 1 z 64 6 z 100
H Transportation and storage 49-53 12 15 z 72 1 z 100
I Accommodation and food service activities 55-56 24 0 z 75 1 z 100
J Information and communication 58-63 41 0 z 22 36 z 100JA Publishing, audiovisual and broadcasting activities 58-60 9 0 z 20 72 z 100JB Telecommunications 61 69 0 z 22 9 z 100JC IT and other information service activities 62-63 41 0 z 36 23 z 100
K Financial and insurance activities 64-66 17 0 z 75 8 z 100
L Real estate activities 68 2 0 90 7 0 z 100
M Professional, scientific and technical activities 69-75 32 2 z 52 14 z 100
MA 69-71 30 2 z 52 15 z 100
MB Scientific research and development 72 36 0 z 50 13 z 100MC Other professional, scientific and technical activities 73-75 32 1 z 54 13 z 100
N Administrative and support service activities 77-82 8 7 75 9 2 z 100
O 84 24 7 4 62 4 z 100
P Education 85 5 4 z 89 2 z 100
Q Human health and social work activities 86-88 12 0 z 87 1 z 100QA Human health activities 86 10 0 z 89 1 z 100QB Residential care and social work activities 87-88 16 1 z 82 2 z 100
R Arts, entertainment and recreation 90-93 14 0 z 84 1 z 100
S Other service activities 94-96 28 3 z 57 11 z 100
T 97-98 0 0 z 0 0 z 0
ABDE Other Production 1-9,
35-3932 2 z 61 3 2 100
C Manufacturing 10-33 58 0 z 37 4 z 100
F Construction 41-43 4 1 58 36 0 z 100
G to T Services 45-98 11 3 47 35 3 z 100
TOTAL Total 15 3 41 37 3 0 100
1 n.e.c represents; not elsewhere classified.
Note: Differences between totals and sums of components are due to rounding z denotes where data is not collected, not present or unavailable for an industry or asset.
Public administration and defence; compulsory
social security
Activities of households as employers; undifferentiated
goods and services - activities of household for own use
Manufacture of transport equipment Other manufacturing and repair
Electricity, gas, steam and air conditioning supply
Water supply; sewerage, waste management and
remediation activities
Wholesale and retail trade; repair of motor vehicles and
motorcycles
Legal, accounting, management, architecture, engineering,
technical testing activities
Manufacture of machinery and equipment n.e.c1.
Back to contents
Manufacture of food products, beverages and tobacco Manufacture of textiles, wearing apparel and leather products Manufacture of wood and paper products, and printing Manufacture of coke and refined petroleum products Manufacture of chemicals and chemical products Manufacture of basic pharmaceutical products and
pharmaceutical preparations Manufacture of rubber and plastics products, and other
non-metallic mineral products
Manufacture of basic metals and metal products Manufacture of computer, electronic & optical products Manufacture of electrical equipment
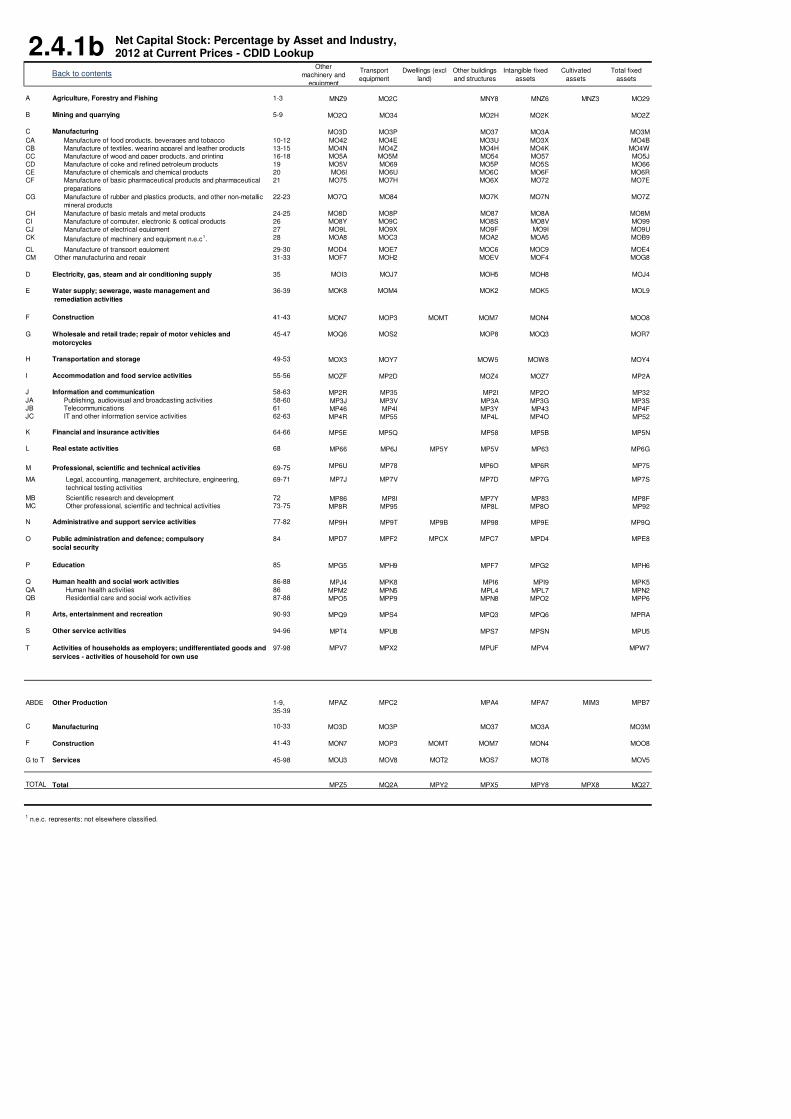
2.4.1bOther
machinery and
equipment
Transport
equipment
Dwellings (excl
land)
Other buildings
and structures
Intangible fixed
assets
Cultivated
assets
Total fixed
assets
A Agriculture, Forestry and Fishing 1-3 MNZ9 MO2C MNY8 MNZ6 MNZ3 MO29
B Mining and quarrying 5-9 MO2Q MO34 MO2H MO2K MO2Z
C Manufacturing MO3D MO3P MO37 MO3A MO3M
CA 10-12 MO42 MO4E MO3U MO3X MO4BCB 13-15 MO4N MO4Z MO4H MO4K MO4WCC 16-18 MO5A MO5M MO54 MO57 MO5JCD 19 MO5V MO69 MO5P MO5S MO66CE 20 MO6I MO6U MO6C MO6F MO6RCF 21 MO75 MO7H MO6X MO72 MO7E
CG 22-23 MO7Q MO84 MO7K MO7N MO7Z
CH 24-25 MO8D MO8P MO87 MO8A MO8MCI 26 MO8Y MO9C MO8S MO8V MO99CJ 27 MO9L MO9X MO9F MO9I MO9UCK 28 MOA8 MOC3 MOA2 MOA5 MOB9
CL 29-30 MOD4 MOE7 MOC6 MOC9 MOE4CM 31-33 MOF7 MOH2 MOEV MOF4 MOG8
D 35 MOI3 MOJ7 MOH5 MOH8 MOJ4
E 36-39 MOK8 MOM4 MOK2 MOK5 MOL9
F Construction 41-43 MON7 MOP3 MOMT MOM7 MON4 MOO8
G 45-47 MOQ6 MOS2 MOP8 MOQ3 MOR7
H Transportation and storage 49-53 MOX3 MOY7 MOW5 MOW8 MOY4
I Accommodation and food service activities 55-56 MOZF MP2D MOZ4 MOZ7 MP2A
J Information and communication 58-63 MP2R MP35 MP2I MP2O MP32JA Publishing, audiovisual and broadcasting activities 58-60 MP3J MP3V MP3A MP3G MP3SJB Telecommunications 61 MP46 MP4I MP3Y MP43 MP4FJC IT and other information service activities 62-63 MP4R MP55 MP4L MP4O MP52
K Financial and insurance activities 64-66 MP5E MP5Q MP58 MP5B MP5N
L Real estate activities 68 MP66 MP6J MP5Y MP5V MP63 MP6G
M Professional, scientific and technical activities 69-75 MP6U MP78 MP6O MP6R MP75
MA 69-71 MP7J MP7V MP7D MP7G MP7S
MB Scientific research and development 72 MP86 MP8I MP7Y MP83 MP8FMC Other professional, scientific and technical activities 73-75 MP8R MP95 MP8L MP8O MP92
N Administrative and support service activities 77-82 MP9H MP9T MP9B MP98 MP9E MP9Q
O 84 MPD7 MPF2 MPCX MPC7 MPD4 MPE8
P Education 85 MPG5 MPH9 MPF7 MPG2 MPH6
Q Human health and social work activities 86-88 MPJ4 MPK8 MPI6 MPI9 MPK5QA Human health activities 86 MPM2 MPN5 MPL4 MPL7 MPN2QB Residential care and social work activities 87-88 MPO5 MPP9 MPN8 MPO2 MPP6
R Arts, entertainment and recreation 90-93 MPQ9 MPS4 MPQ3 MPQ6 MPRA
S Other service activities 94-96 MPT4 MPU8 MPS7 MPSN MPU5
T 97-98 MPV7 MPX2 MPUF MPV4 MPW7
ABDE Other Production 1-9,
35-39
MPAZ MPC2 MPA4 MPA7 MIM3 MPB7
C Manufacturing 10-33 MO3D MO3P MO37 MO3A MO3M
F Construction 41-43 MON7 MOP3 MOMT MOM7 MON4 MOO8
G to T Services 45-98 MOU3 MOV8 MOT2 MOS7 MOT8 MOV5
TOTAL Total MPZ5 MQ2A MPY2 MPX5 MPY8 MPX8 MQ27
1 n.e.c. represents; not elsewhere classified.
Public administration and defence; compulsory
social security
Activities of households as employers; undifferentiated goods and
services - activities of household for own use
Manufacture of transport equipment Other manufacturing and repair
Electricity, gas, steam and air conditioning supply
Water supply; sewerage, waste management and
remediation activities
Wholesale and retail trade; repair of motor vehicles and
motorcycles
Legal, accounting, management, architecture, engineering,
technical testing activities
Manufacture of machinery and equipment n.e.c1.
Back to contents
Manufacture of food products, beverages and tobacco Manufacture of textiles, wearing apparel and leather products Manufacture of wood and paper products, and printing Manufacture of coke and refined petroleum products Manufacture of chemicals and chemical products Manufacture of basic pharmaceutical products and pharmaceutical
preparations
Manufacture of rubber and plastics products, and other non-metallic
mineral products
Manufacture of basic metals and metal products Manufacture of computer, electronic & optical products Manufacture of electrical equipment
Net Capital Stock: Percentage by Asset and Industry, 2012 at Current Prices - CDID Lookup

Per cent
SoftwareMineral
ExplorationEntertainment
Intangible
fixed assets
A Agriculture, Forestry and Fishing 1-3 0 z z 0
B Mining and quarrying 5-9 2 12 z 14
C Manufacturing 4 z z 4
CA 10-12 3 z z 3
CB 13-15 3 z z 3
CC 16-18 5 z z 5
CD 19 3 z z 3
CE 20 3 z z 3
CF 21 3 z z 3
CG 22-23 4 z z 4
CH 24-25 2 z z 2
CI 26 5 z z 5
CJ 27 4 z z 4
CK 28 13 z z 13
CL 29-30 5 z z 5
CM 31-33 11 z z 11
D 35 2 z z 2
E 36-39 1 z z 1
F Construction 41-43 0 z z 0
G 45-47 6 z z 6
H Transportation and storage 49-53 1 z z 1
I Accommodation and food service activities 55-56 1 z z 1
J Information and communication 58-63 8 z 28 36
JA Publishing, audiovisual and broadcasting activities 58-60 4 z 67 72
JB Telecommunications 61 9 z z 9
JC IT and other information service activities 62-63 23 z z 23
K Financial and insurance activities 64-66 8 z z 8
L Real estate activities 68 0 z z 0
M Professional, scientific and technical activities 69-75 14 z z 14
MA 69-71 15 z z 15
MB Scientific research and development 72 13 z z 13
MC Other professional, scientific and technical activities 73-75 3 z z 13
N Administrative and support service activities 77-82 2 z z 2
O 84 4 z z 4
P Education 85 2 z z 2
Q Human health and social work activities 86-88 1 z z 1
QA Human health activities 86 1 z z 1
QB Residential care and social work activities 87-88 2 z z 2
R Arts, entertainment and recreation 90-93 1 z z 1
S Other service activities 94-96 11 z z 11
T 97-98 0 z z 0
ABDE Other Production 1-9,
35-39
1 2 z 3
C Manufacturing 10-33 4 z z 4
F Construction 41-43 0 z z 0
G to T Services 45-98 2 z 1 3
z z z zTOTAL Total 2 0 1 3
1 n.e.c represents; not elsewhere classified.
Note: Differences between totals and sums of components are due to rounding.
z denotes where data is not collected, not present or unavailable for an industry or asset.
Legal, accounting, management, architecture, engineering,
technical testing activities
Public administration and defence; compulsory social
security
Activities of households as employers; undifferentiated goods
and services - activities of household for own use
Manufacture of machinery and equipment n.e.c1.
Manufacture of transport equipment
Other manufacturing and repair
Electricity, gas, steam and air conditioning supply
Water supply; sewerage, waste management and remediation
activities
Wholesale and retail trade; repair of motor vehicles and
motorcycles
Manufacture of electrical equipment
2.4.1IBack to contents
Manufacture of food products, beverages and tobacco
Manufacture of textiles, wearing apparel and leather products
Manufacture of wood and paper products, and printing
Manufacture of coke and refined petroleum products
Manufacture of chemicals and chemical products
Manufacture of basic pharmaceutical products
and pharmaceutical preparations
Manufacture of rubber and plastics products,
and other non-metallic mineral products
Manufacture of basic metals and metal products
Manufacture of computer, electronic & optical products
Net Capital Stock: Intangible Assets Percentage by Industry, 2012 at Current Prices
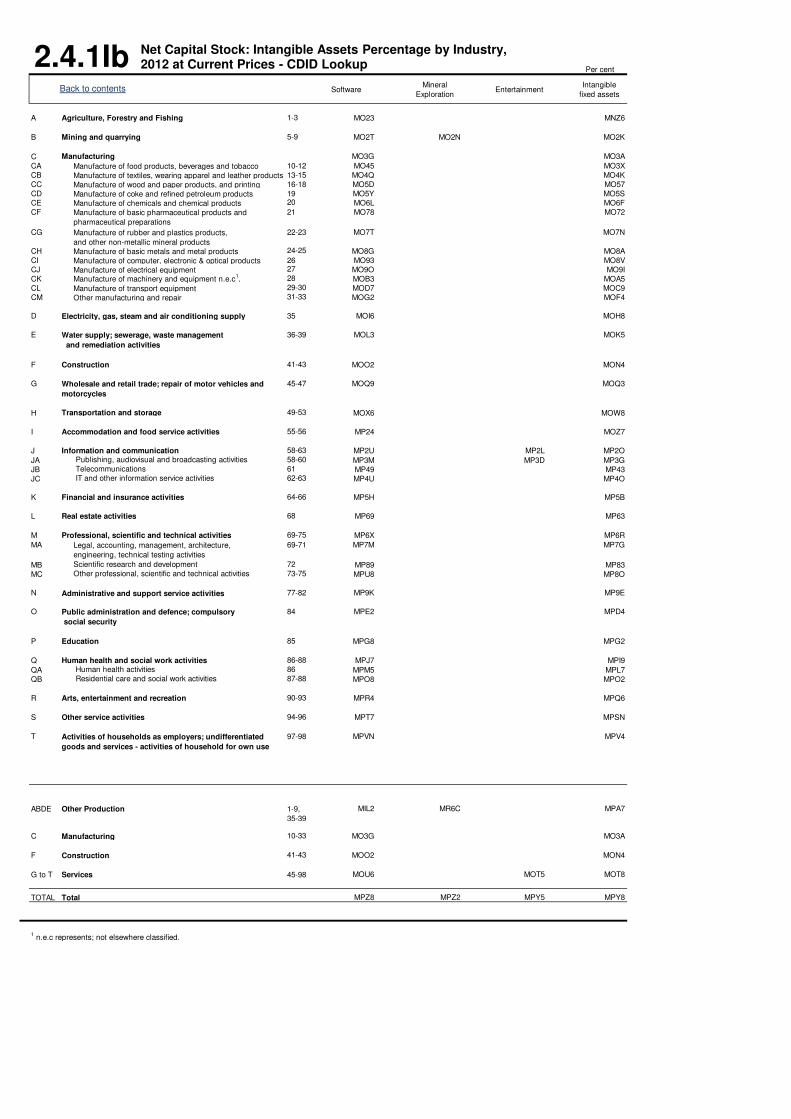
Per cent
SoftwareMineral
ExplorationEntertainment
Intangible
fixed assets
A Agriculture, Forestry and Fishing 1-3 MO23 MNZ6
B Mining and quarrying 5-9 MO2T MO2N MO2K
C Manufacturing MO3G MO3A
CA 10-12 MO45 MO3X
CB 13-15 MO4Q MO4K
CC 16-18 MO5D MO57
CD 19 MO5Y MO5S
CE 20 MO6L MO6F
CF 21 MO78 MO72
CG 22-23 MO7T MO7N
CH 24-25 MO8G MO8A
CI 26 MO93 MO8V
CJ 27 MO9O MO9I
CK 28 MOB3 MOA5
CL 29-30 MOD7 MOC9
CM 31-33 MOG2 MOF4
D 35 MOI6 MOH8
E 36-39 MOL3 MOK5
F Construction 41-43 MOO2 MON4
G 45-47 MOQ9 MOQ3
H Transportation and storage 49-53 MOX6 MOW8
I Accommodation and food service activities 55-56 MP24 MOZ7
J Information and communication 58-63 MP2U MP2L MP2O
JA Publishing, audiovisual and broadcasting activities 58-60 MP3M MP3D MP3G
JB Telecommunications 61 MP49 MP43
JC IT and other information service activities 62-63 MP4U MP4O
K Financial and insurance activities 64-66 MP5H MP5B
L Real estate activities 68 MP69 MP63
M Professional, scientific and technical activities 69-75 MP6X MP6R
MA 69-71 MP7M MP7G
MB Scientific research and development 72 MP89 MP83
MC Other professional, scientific and technical activities 73-75 MPU8 MP8O
N Administrative and support service activities 77-82 MP9K MP9E
O 84 MPE2 MPD4
P Education 85 MPG8 MPG2
Q Human health and social work activities 86-88 MPJ7 MPI9
QA Human health activities 86 MPM5 MPL7
QB Residential care and social work activities 87-88 MPO8 MPO2
R Arts, entertainment and recreation 90-93 MPR4 MPQ6
S Other service activities 94-96 MPT7 MPSN
T 97-98 MPVN MPV4
ABDE Other Production 1-9,
35-39
MIL2 MR6C MPA7
C Manufacturing 10-33 MO3G MO3A
F Construction 41-43 MOO2 MON4
G to T Services 45-98 MOU6 MOT5 MOT8
TOTAL Total MPZ8 MPZ2 MPY5 MPY8
1 n.e.c represents; not elsewhere classified.
Legal, accounting, management, architecture,
engineering, technical testing activities
Public administration and defence; compulsory
social security
Activities of households as employers; undifferentiated
goods and services - activities of household for own use
Manufacture of machinery and equipment n.e.c1.
Manufacture of transport equipment
Other manufacturing and repair
Electricity, gas, steam and air conditioning supply
Water supply; sewerage, waste management
and remediation activities
Wholesale and retail trade; repair of motor vehicles and
motorcycles
Manufacture of electrical equipment
2.4.1IbBack to contents
Manufacture of food products, beverages and tobacco
Manufacture of textiles, wearing apparel and leather products
Manufacture of wood and paper products, and printing
Manufacture of coke and refined petroleum products
Manufacture of chemicals and chemical products
Manufacture of basic pharmaceutical products and
pharmaceutical preparations
Manufacture of rubber and plastics products,
and other non-metallic mineral products
Manufacture of basic metals and metal products
Manufacture of computer, electronic & optical products
Net Capital Stock: Intangible Assets Percentage by Industry, 2012 at Current Prices - CDID Lookup
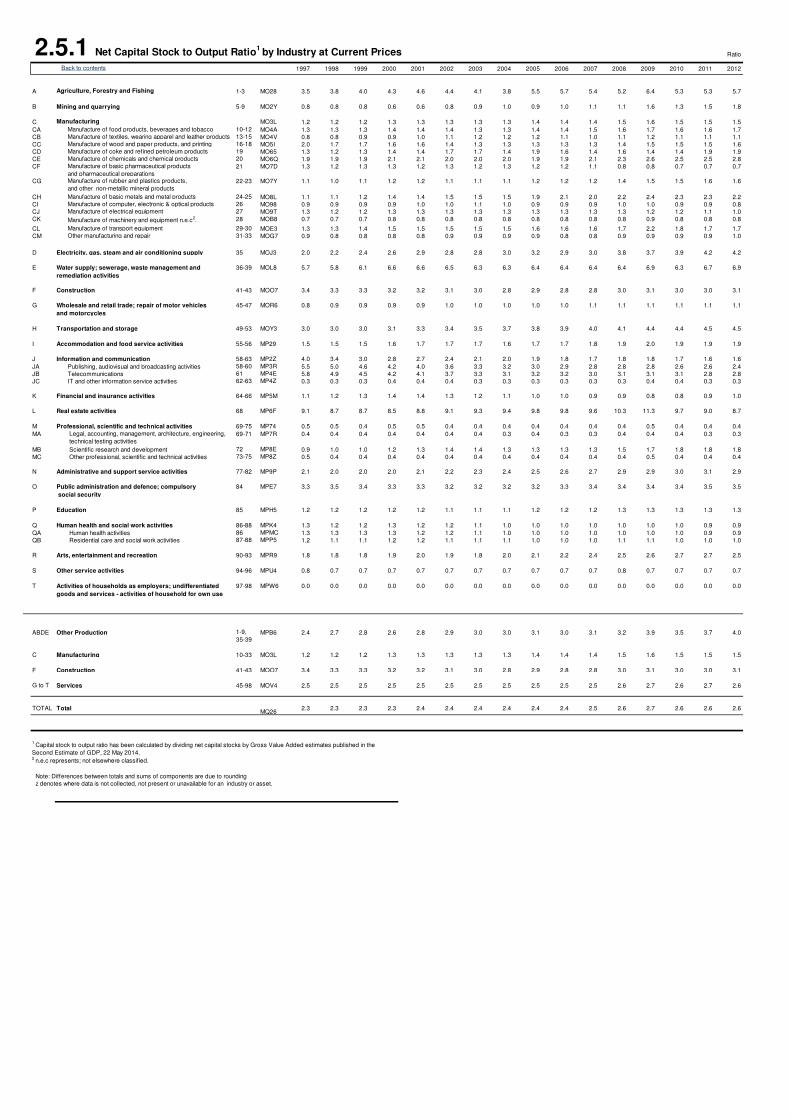
2.5.1 Net Capital Stock to Output Ratio1
by Industry at Current Prices Ratio
1997 1998 1999 2000 2001 2002 2003 2004 2005 2006 2007 2008 2009 2010 2011 2012
A Agriculture, Forestry and Fishing 1-3 MO28 3.5 3.8 4.0 4.3 4.6 4.4 4.1 3.8 5.5 5.7 5.4 5.2 6.4 5.3 5.3 5.7
B Mining and quarrying 5-9 MO2Y 0.8 0.8 0.8 0.6 0.6 0.8 0.9 1.0 0.9 1.0 1.1 1.1 1.6 1.3 1.5 1.8
C Manufacturing MO3L 1.2 1.2 1.2 1.3 1.3 1.3 1.3 1.3 1.4 1.4 1.4 1.5 1.6 1.5 1.5 1.5
CA 10-12 MO4A 1.3 1.3 1.3 1.4 1.4 1.4 1.3 1.3 1.4 1.4 1.5 1.6 1.7 1.6 1.6 1.7
CB 13-15 MO4V 0.8 0.8 0.9 0.9 1.0 1.1 1.2 1.2 1.2 1.1 1.0 1.1 1.2 1.1 1.1 1.1
CC 16-18 MO5I 2.0 1.7 1.7 1.6 1.6 1.4 1.3 1.3 1.3 1.3 1.3 1.4 1.5 1.5 1.5 1.6
CD 19 MO65 1.3 1.2 1.3 1.4 1.4 1.7 1.7 1.4 1.9 1.6 1.4 1.6 1.4 1.4 1.9 1.9
CE 20 MO6Q 1.9 1.9 1.9 2.1 2.1 2.0 2.0 2.0 1.9 1.9 2.1 2.3 2.6 2.5 2.5 2.8
CF 21 MO7D 1.3 1.2 1.3 1.3 1.2 1.3 1.2 1.3 1.2 1.2 1.1 0.8 0.8 0.7 0.7 0.7
CG 22-23 MO7Y 1.1 1.0 1.1 1.2 1.2 1.1 1.1 1.1 1.2 1.2 1.2 1.4 1.5 1.5 1.6 1.6
CH 24-25 MO8L 1.1 1.1 1.2 1.4 1.4 1.5 1.5 1.5 1.9 2.1 2.0 2.2 2.4 2.3 2.3 2.2
CI 26 MO98 0.9 0.9 0.9 0.9 1.0 1.0 1.1 1.0 0.9 0.9 0.9 1.0 1.0 0.9 0.9 0.8
CJ 27 MO9T 1.3 1.2 1.2 1.3 1.3 1.3 1.3 1.3 1.3 1.3 1.3 1.3 1.2 1.2 1.1 1.0
CK 28 MOB8 0.7 0.7 0.7 0.8 0.8 0.8 0.8 0.8 0.8 0.8 0.8 0.8 0.9 0.8 0.8 0.8
CL 29-30 MOE3 1.3 1.3 1.4 1.5 1.5 1.5 1.5 1.5 1.6 1.6 1.6 1.7 2.2 1.8 1.7 1.7
CM 31-33 MOG7 0.9 0.8 0.8 0.8 0.8 0.9 0.9 0.9 0.9 0.8 0.8 0.9 0.9 0.9 0.9 1.0
D 35 MOJ3 2.0 2.2 2.4 2.6 2.9 2.8 2.8 3.0 3.2 2.9 3.0 3.8 3.7 3.9 4.2 4.2
E 36-39 MOL8 5.7 5.8 6.1 6.6 6.6 6.5 6.3 6.3 6.4 6.4 6.4 6.4 6.9 6.3 6.7 6.9
F Construction 41-43 MOO7 3.4 3.3 3.3 3.2 3.2 3.1 3.0 2.8 2.9 2.8 2.8 3.0 3.1 3.0 3.0 3.1
G 45-47 MOR6 0.8 0.9 0.9 0.9 0.9 1.0 1.0 1.0 1.0 1.0 1.1 1.1 1.1 1.1 1.1 1.1
H Transportation and storage 49-53 MOY3 3.0 3.0 3.0 3.1 3.3 3.4 3.5 3.7 3.8 3.9 4.0 4.1 4.4 4.4 4.5 4.5
I Accommodation and food service activities 55-56 MP29 1.5 1.5 1.5 1.6 1.7 1.7 1.7 1.6 1.7 1.7 1.8 1.9 2.0 1.9 1.9 1.9
J Information and communication 58-63 MP2Z 4.0 3.4 3.0 2.8 2.7 2.4 2.1 2.0 1.9 1.8 1.7 1.8 1.8 1.7 1.6 1.6
JA Publishing, audiovisual and broadcasting activities 58-60 MP3R 5.5 5.0 4.6 4.2 4.0 3.6 3.3 3.2 3.0 2.9 2.8 2.8 2.8 2.6 2.6 2.4
JB Telecommunications 61 MP4E 5.8 4.9 4.5 4.2 4.1 3.7 3.3 3.1 3.2 3.2 3.0 3.1 3.1 3.1 2.8 2.8
JC IT and other information service activities 62-63 MP4Z 0.3 0.3 0.3 0.4 0.4 0.4 0.3 0.3 0.3 0.3 0.3 0.3 0.4 0.4 0.3 0.3
K Financial and insurance activities 64-66 MP5M 1.1 1.2 1.3 1.4 1.4 1.3 1.2 1.1 1.0 1.0 0.9 0.9 0.8 0.8 0.9 1.0
L Real estate activities 68 MP6F 9.1 8.7 8.7 8.5 8.8 9.1 9.3 9.4 9.8 9.8 9.6 10.3 11.3 9.7 9.0 8.7
M Professional, scientific and technical activities 69-75 MP74 0.5 0.5 0.4 0.5 0.5 0.4 0.4 0.4 0.4 0.4 0.4 0.4 0.5 0.4 0.4 0.4
MA 69-71 MP7R 0.4 0.4 0.4 0.4 0.4 0.4 0.4 0.3 0.4 0.3 0.3 0.4 0.4 0.4 0.3 0.3
MB Scientific research and development 72 MP8E 0.9 1.0 1.0 1.2 1.3 1.4 1.4 1.3 1.3 1.3 1.3 1.5 1.7 1.8 1.8 1.8
MC Other professional, scientific and technical activities 73-75 MP8Z 0.5 0.4 0.4 0.4 0.4 0.4 0.4 0.4 0.4 0.4 0.4 0.4 0.5 0.4 0.4 0.4
N Administrative and support service activities 77-82 MP9P 2.1 2.0 2.0 2.0 2.1 2.2 2.3 2.4 2.5 2.6 2.7 2.9 2.9 3.0 3.1 2.9
O 84 MPE7 3.3 3.5 3.4 3.3 3.3 3.2 3.2 3.2 3.2 3.3 3.4 3.4 3.4 3.4 3.5 3.5
P Education 85 MPH5 1.2 1.2 1.2 1.2 1.2 1.1 1.1 1.1 1.2 1.2 1.2 1.3 1.3 1.3 1.3 1.3
Q Human health and social work activities 86-88 MPK4 1.3 1.2 1.2 1.3 1.2 1.2 1.1 1.0 1.0 1.0 1.0 1.0 1.0 1.0 0.9 0.9
QA Human health activities 86 MPMC 1.3 1.3 1.3 1.3 1.2 1.2 1.1 1.0 1.0 1.0 1.0 1.0 1.0 1.0 0.9 0.9
QB Residential care and social work activities 87-88 MPP5 1.2 1.1 1.1 1.2 1.2 1.1 1.1 1.1 1.0 1.0 1.0 1.1 1.1 1.0 1.0 1.0
R Arts, entertainment and recreation 90-93 MPR9 1.8 1.8 1.8 1.9 2.0 1.9 1.8 2.0 2.1 2.2 2.4 2.5 2.6 2.7 2.7 2.5
S Other service activities 94-96 MPU4 0.8 0.7 0.7 0.7 0.7 0.7 0.7 0.7 0.7 0.7 0.7 0.8 0.7 0.7 0.7 0.7
T 97-98 MPW6 0.0 0.0 0.0 0.0 0.0 0.0 0.0 0.0 0.0 0.0 0.0 0.0 0.0 0.0 0.0 0.0
ABDE Other Production 1-9,
35-39MPB6 2.4 2.7 2.8 2.6 2.8 2.9 3.0 3.0 3.1 3.0 3.1 3.2 3.9 3.5 3.7 4.0
C Manufacturing 10-33 MO3L 1.2 1.2 1.2 1.3 1.3 1.3 1.3 1.3 1.4 1.4 1.4 1.5 1.6 1.5 1.5 1.5
F Construction 41-43 MOO7 3.4 3.3 3.3 3.2 3.2 3.1 3.0 2.8 2.9 2.8 2.8 3.0 3.1 3.0 3.0 3.1
G to T Services 45-98 MOV4 2.5 2.5 2.5 2.5 2.5 2.5 2.5 2.5 2.5 2.5 2.5 2.6 2.7 2.6 2.7 2.6
TOTAL TotalMQ26
2.3 2.3 2.3 2.3 2.4 2.4 2.4 2.4 2.4 2.4 2.5 2.6 2.7 2.6 2.6 2.6
Note: Differences between totals and sums of components are due to rounding
z denotes where data is not collected, not present or unavailable for an industry or asset.
Public administration and defence; compulsory
social security
Activities of households as employers; undifferentiated
goods and services - activities of household for own use
1 Capital stock to output ratio has been calculated by dividing net capital stocks by Gross Value Added estimates published in the
Second Estimate of GDP, 22 May 2014.2 n.e.c represents; not elsewhere classified.
Legal, accounting, management, architecture, engineering,
technical testing activities
Manufacture of basic pharmaceutical products
and pharmaceutical preparations Manufacture of rubber and plastics products,
and other non-metallic mineral products
Manufacture of basic metals and metal products
Manufacture of computer, electronic & optical products
Manufacture of electrical equipment
Manufacture of machinery and equipment n.e.c2.
Manufacture of transport equipment
Other manufacturing and repair
Electricity, gas, steam and air conditioning supply
Water supply; sewerage, waste management and
remediation activities
Wholesale and retail trade; repair of motor vehicles
and motorcycles
Manufacture of chemicals and chemical products
Back to contents
Manufacture of food products, beverages and tobacco
Manufacture of textiles, wearing apparel and leather products
Manufacture of wood and paper products, and printing
Manufacture of coke and refined petroleum products
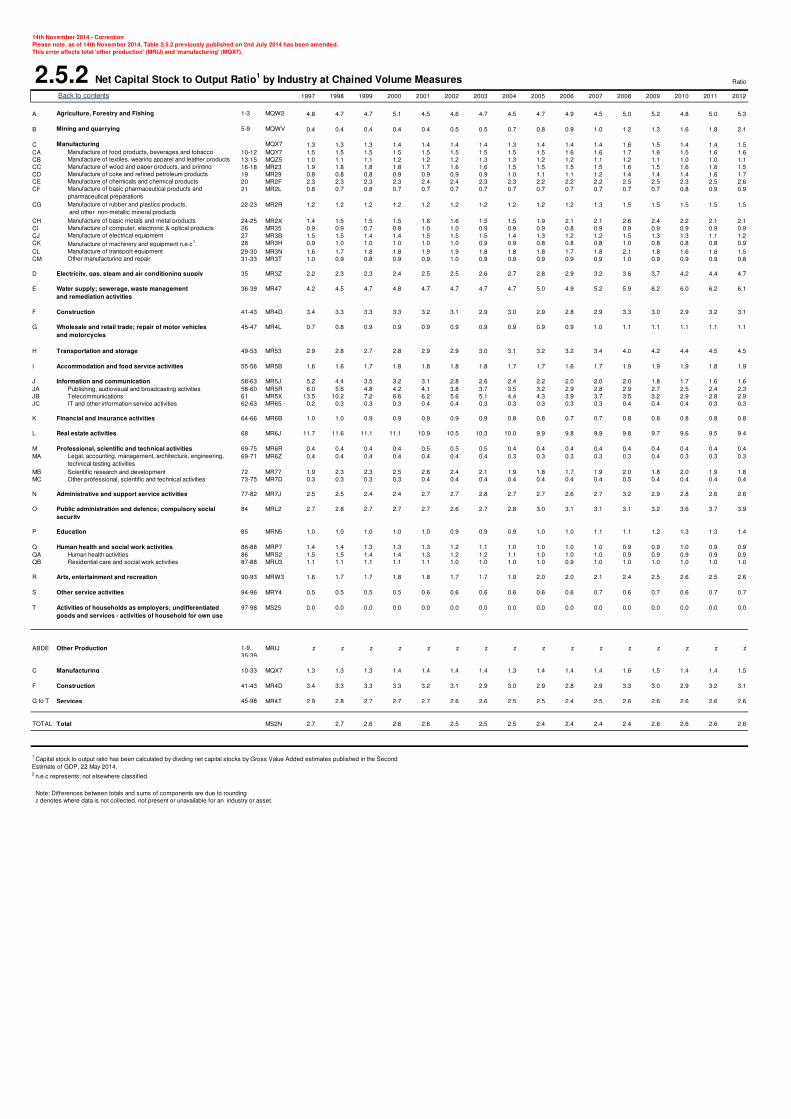
2.5.2 Net Capital Stock to Output Ratio1 by Industry at Chained Volume Measures Ratio
1997 1998 1999 2000 2001 2002 2003 2004 2005 2006 2007 2008 2009 2010 2011 2012
A Agriculture, Forestry and Fishing 1-3 MQW2 4.8 4.7 4.7 5.1 4.5 4.6 4.7 4.5 4.7 4.9 4.5 5.0 5.2 4.8 5.0 5.3
B Mining and quarrying 5-9 MQWV 0.4 0.4 0.4 0.4 0.4 0.5 0.5 0.7 0.8 0.9 1.0 1.2 1.3 1.6 1.8 2.1
C Manufacturing MQX7 1.3 1.3 1.3 1.4 1.4 1.4 1.4 1.3 1.4 1.4 1.4 1.6 1.5 1.4 1.4 1.5
CA 10-12 MQY7 1.5 1.5 1.5 1.5 1.5 1.5 1.5 1.5 1.5 1.6 1.6 1.7 1.6 1.5 1.6 1.6
CB 13-15 MQZ5 1.0 1.1 1.1 1.2 1.2 1.2 1.3 1.3 1.2 1.2 1.1 1.2 1.1 1.0 1.0 1.1
CC 16-18 MR23 1.9 1.8 1.8 1.8 1.7 1.6 1.6 1.5 1.5 1.5 1.5 1.6 1.5 1.6 1.6 1.5
CD 19 MR29 0.8 0.8 0.8 0.9 0.9 0.9 0.9 1.0 1.1 1.1 1.2 1.4 1.4 1.4 1.6 1.7
CE 20 MR2F 2.3 2.3 2.3 2.3 2.4 2.4 2.3 2.3 2.2 2.2 2.2 2.5 2.5 2.3 2.5 2.6
CF 21 MR2L 0.8 0.7 0.8 0.7 0.7 0.7 0.7 0.7 0.7 0.7 0.7 0.7 0.7 0.8 0.9 0.9
CG 22-23 MR2R 1.2 1.2 1.2 1.2 1.2 1.2 1.2 1.2 1.2 1.2 1.3 1.5 1.5 1.5 1.5 1.5
CH 24-25 MR2X 1.4 1.5 1.5 1.5 1.6 1.6 1.5 1.5 1.9 2.1 2.1 2.6 2.4 2.2 2.1 2.1
CI 26 MR35 0.9 0.9 0.7 0.8 1.0 1.0 0.9 0.9 0.9 0.8 0.9 0.9 0.9 0.9 0.9 0.9
CJ 27 MR3B 1.5 1.5 1.4 1.4 1.5 1.5 1.5 1.4 1.3 1.2 1.2 1.5 1.3 1.3 1.1 1.2
CK 28 MR3H 0.9 1.0 1.0 1.0 1.0 1.0 0.9 0.9 0.8 0.8 0.8 1.0 0.8 0.8 0.8 0.9
CL 29-30 MR3N 1.6 1.7 1.8 1.8 1.9 1.9 1.8 1.8 1.8 1.7 1.8 2.1 1.8 1.6 1.6 1.5
CM 31-33 MR3T 1.0 0.9 0.8 0.9 0.9 1.0 0.9 0.9 0.9 0.9 0.9 1.0 0.9 0.9 0.9 0.8
D 35 MR3Z 2.2 2.3 2.3 2.4 2.5 2.5 2.6 2.7 2.8 2.9 3.2 3.6 3.7 4.2 4.4 4.7
E 36-39 MR47 4.2 4.5 4.7 4.8 4.7 4.7 4.7 4.7 5.0 4.9 5.2 5.9 6.2 6.0 6.2 6.1
F Construction 41-43 MR4D 3.4 3.3 3.3 3.3 3.2 3.1 2.9 3.0 2.9 2.8 2.9 3.3 3.0 2.9 3.2 3.1
G 45-47 MR4L 0.7 0.8 0.9 0.9 0.9 0.9 0.9 0.9 0.9 0.9 1.0 1.1 1.1 1.1 1.1 1.1
H Transportation and storage 49-53 MR53 2.9 2.8 2.7 2.8 2.9 2.9 3.0 3.1 3.2 3.2 3.4 4.0 4.2 4.4 4.5 4.5
I Accommodation and food service activities 55-56 MR5B 1.6 1.6 1.7 1.8 1.8 1.8 1.8 1.7 1.7 1.6 1.7 1.9 1.9 1.9 1.8 1.9
J Information and communication 58-63 MR5J 5.2 4.4 3.5 3.2 3.1 2.8 2.6 2.4 2.2 2.0 2.0 2.0 1.8 1.7 1.6 1.6
JA Publishing, audiovisual and broadcasting activities 58-60 MR5R 6.0 5.6 4.8 4.2 4.1 3.8 3.7 3.5 3.2 2.9 2.8 2.9 2.7 2.5 2.4 2.3
JB Telecommunications 61 MR5X 13.5 10.2 7.2 6.6 6.2 5.6 5.1 4.4 4.3 3.9 3.7 3.5 3.2 2.9 2.8 2.9
JC IT and other information service activities 62-63 MR65 0.2 0.3 0.3 0.3 0.4 0.4 0.3 0.3 0.3 0.3 0.3 0.4 0.4 0.4 0.3 0.3
K Financial and insurance activities 64-66 MR6B 1.0 1.0 0.9 0.9 0.9 0.9 0.9 0.8 0.8 0.7 0.7 0.8 0.8 0.8 0.8 0.8
L Real estate activities 68 MR6J 11.7 11.6 11.1 11.1 10.9 10.5 10.3 10.0 9.9 9.8 9.9 9.8 9.7 9.6 9.5 9.4
M Professional, scientific and technical activities 69-75 MR6R 0.4 0.4 0.4 0.4 0.5 0.5 0.5 0.4 0.4 0.4 0.4 0.4 0.4 0.4 0.4 0.4
MA 69-71 MR6Z 0.4 0.4 0.4 0.4 0.4 0.4 0.4 0.3 0.3 0.3 0.3 0.3 0.4 0.3 0.3 0.3
MB Scientific research and development 72 MR77 1.9 2.3 2.3 2.5 2.6 2.4 2.1 1.9 1.8 1.7 1.9 2.0 1.8 2.0 1.9 1.8
MC Other professional, scientific and technical activities 73-75 MR7D 0.3 0.3 0.3 0.3 0.4 0.4 0.4 0.4 0.4 0.4 0.4 0.5 0.4 0.4 0.4 0.4
N Administrative and support service activities 77-82 MR7J 2.5 2.5 2.4 2.4 2.7 2.7 2.8 2.7 2.7 2.6 2.7 3.2 2.9 2.8 2.6 2.6
O 84 MRL2 2.7 2.8 2.7 2.7 2.7 2.6 2.7 2.8 3.0 3.1 3.1 3.1 3.2 3.6 3.7 3.9
P Education 85 MRN5 1.0 1.0 1.0 1.0 1.0 0.9 0.9 0.9 1.0 1.0 1.1 1.1 1.2 1.3 1.3 1.4
Q Human health and social work activities 86-88 MRP7 1.4 1.4 1.3 1.3 1.3 1.2 1.1 1.0 1.0 1.0 1.0 0.9 0.9 1.0 0.9 0.9
QA Human health activities 86 MRS2 1.5 1.5 1.4 1.4 1.3 1.2 1.2 1.1 1.0 1.0 1.0 0.9 0.9 0.9 0.9 0.9
QB Residential care and social work activities 87-88 MRU3 1.1 1.1 1.1 1.1 1.1 1.0 1.0 1.0 1.0 0.9 1.0 1.0 1.0 1.0 1.0 1.0
R Arts, entertainment and recreation 90-93 MRW3 1.6 1.7 1.7 1.8 1.8 1.7 1.7 1.9 2.0 2.0 2.1 2.4 2.5 2.6 2.5 2.6
S Other service activities 94-96 MRY4 0.5 0.5 0.5 0.5 0.6 0.6 0.6 0.6 0.6 0.6 0.7 0.6 0.7 0.6 0.7 0.7
T 97-98 MS25 0.0 0.0 0.0 0.0 0.0 0.0 0.0 0.0 0.0 0.0 0.0 0.0 0.0 0.0 0.0 0.0
ABDE Other Production 1-9,
35-39
MRIJ z z z z z z z z z z z z z z z z
C Manufacturing 10-33 MQX7 1.3 1.3 1.3 1.4 1.4 1.4 1.4 1.3 1.4 1.4 1.4 1.6 1.5 1.4 1.4 1.5
F Construction 41-43 MR4D 3.4 3.3 3.3 3.3 3.2 3.1 2.9 3.0 2.9 2.8 2.9 3.3 3.0 2.9 3.2 3.1
G to T Services 45-98 MR4T 2.9 2.8 2.7 2.7 2.7 2.6 2.6 2.5 2.5 2.4 2.5 2.6 2.6 2.6 2.6 2.6
TOTAL Total MS2N 2.7 2.7 2.6 2.6 2.6 2.5 2.5 2.5 2.4 2.4 2.4 2.4 2.6 2.6 2.6 2.6
Note: Differences between totals and sums of components are due to rounding
z denotes where data is not collected, not present or unavailable for an industry or asset.
Legal, accounting, management, architecture, engineering,
technical testing activities
Public administration and defence; compulsory social
security
Activities of households as employers; undifferentiated
goods and services - activities of household for own use
1 Capital stock to output ratio has been calculated by dividing net capital stocks by Gross Value Added estimates published in the Second
Estimate of GDP, 22 May 2014.2 n.e.c represents; not elsewhere classified.
Wholesale and retail trade; repair of motor vehicles
and motorcycles
Manufacture of chemicals and chemical products
Manufacture of basic pharmaceutical products and
pharmaceutical preparations
Manufacture of rubber and plastics products,
and other non-metallic mineral products
Manufacture of basic metals and metal products
Manufacture of computer, electronic & optical products
Manufacture of electrical equipment
Manufacture of machinery and equipment n.e.c1.
Manufacture of transport equipment
Other manufacturing and repair
Electricity, gas, steam and air conditioning supply
Water supply; sewerage, waste management
and remediation activities
Manufacture of coke and refined petroleum products
14th November 2014 - Correction
Please note, as of 14th November 2014, Table 2.5.2 previously published on 2nd July 2014 has been amended.
This error affects total 'other production' (MRIJ) and 'manufacturing' (MQX7).
Back to contents
Manufacture of food products, beverages and tobacco
Manufacture of textiles, wearing apparel and leather products
Manufacture of wood and paper products, and printing
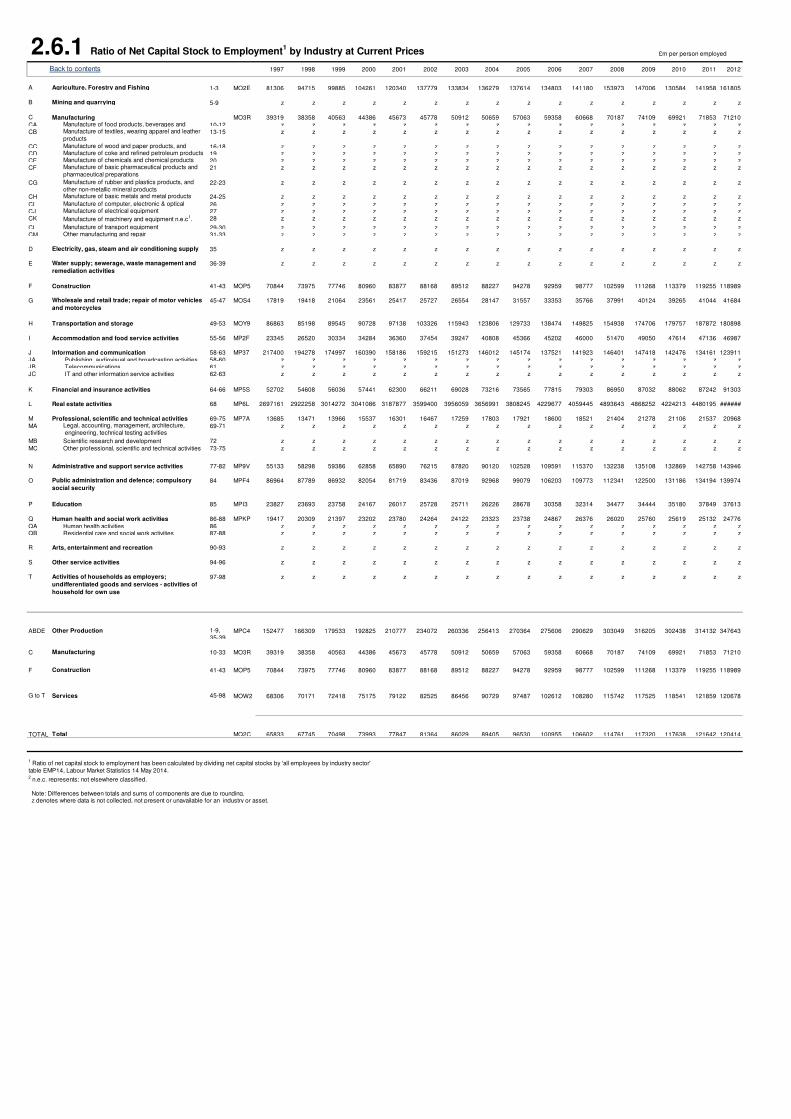
2.6.1 Ratio of Net Capital Stock to Employment1 by Industry at Current Prices £m per person employed
1997 1998 1999 2000 2001 2002 2003 2004 2005 2006 2007 2008 2009 2010 2011 2012
A Agriculture, Forestry and Fishing 1-3 MO2E 81306 94715 99885 104261 120340 137779 133834 136279 137614 134803 141180 153973 147006 130584 141958 161805
B Mining and quarrying 5-9 z z z z z z z z z z z z z z z z
C Manufacturing MO3R 39319 38358 40563 44386 45673 45778 50912 50659 57063 59358 60668 70187 74109 69921 71853 71210
CA 10-12 z z z z z z z z z z z z z z z zCB 13-15 z z z z z z z z z z z z z z z z
CC 16-18 z z z z z z z z z z z z z z z zCD 19 z z z z z z z z z z z z z z z zCE 20 z z z z z z z z z z z z z z z zCF 21 z z z z z z z z z z z z z z z z
CG 22-23 z z z z z z z z z z z z z z z z
CH 24-25 z z z z z z z z z z z z z z z z
CI 26 z z z z z z z z z z z z z z z zCJ 27 z z z z z z z z z z z z z z z zCK 28 z z z z z z z z z z z z z z z z
CL 29-30 z z z z z z z z z z z z z z z zCM 31-33 z z z z z z z z z z z z z z z z
D 35 z z z z z z z z z z z z z z z z
E 36-39 z z z z z z z z z z z z z z z z
F Construction 41-43 MOP5 70844 73975 77746 80960 83877 88168 89512 88227 94278 92959 98777 102599 111268 113379 119255 118989
G 45-47 MOS4 17819 19418 21064 23561 25417 25727 26554 28147 31557 33353 35766 37991 40124 39265 41044 41684
H Transportation and storage 49-53 MOY9 86863 85198 89545 90728 97138 103326 115943 123806 129733 138474 149825 154938 174706 179757 187872 180898
I Accommodation and food service activities 55-56 MP2F 23345 26520 30334 34284 36360 37454 39247 40808 45366 45202 46000 51470 49050 47614 47136 46987
J Information and communication 58-63 MP37 217400 194278 174997 160390 158186 159215 151273 146012 145174 137521 141923 146401 147418 142476 134161 123911
JA Publishing, audiovisual and broadcasting activities 58-60 z z z z z z z z z z z z z z z zJB Telecommunications 61 z z z z z z z z z z z z z z z zJC IT and other information service activities 62-63 z z z z z z z z z z z z z z z z
K Financial and insurance activities 64-66 MP5S 52702 54608 56036 57441 62300 66211 69028 73216 73565 77815 79303 86950 87032 88062 87242 91303
L Real estate activities 68 MP6L 2697161 2922258 3014272 3041086 3187877 3599400 3956059 3656991 3808245 4229677 4059445 4893643 4868252 4224213 4480195 ######
M Professional, scientific and technical activities 69-75 MP7A 13685 13471 13966 15537 16301 16467 17259 17803 17921 18600 18521 21404 21278 21106 21537 20968
MA 69-71 z z z z z z z z z z z z z z z z
MB Scientific research and development 72 z z z z z z z z z z z z z z z z
MC Other professional, scientific and technical activities 73-75 z z z z z z z z z z z z z z z z
N Administrative and support service activities 77-82 MP9V 55133 58298 59386 62858 65890 76215 87820 90120 102528 109591 115370 132238 135108 132869 142758 143946
O 84 MPF4 86964 87789 86932 82054 81719 83436 87019 92968 99079 106203 109773 112341 122500 131186 134194 139974
P Education 85 MPI3 23827 23693 23758 24167 26017 25728 25711 26226 28678 30358 32314 34477 34444 35180 37849 37613
Q Human health and social work activities 86-88 MPKP 19417 20309 21397 23202 23780 24264 24122 23323 23738 24867 26376 26020 25760 25619 25132 24776
QA Human health activities 86 z z z z z z z z z z z z z z z zQB Residential care and social work activities 87-88 z z z z z z z z z z z z z z z z
R Arts, entertainment and recreation 90-93 z z z z z z z z z z z z z z z z
S Other service activities 94-96 z z z z z z z z z z z z z z z z
T 97-98 z z z z z z z z z z z z z z z z
ABDE Other Production 1-9,
35-39MPC4 152477 166309 179533 192825 210777 234072 260336 256413 270364 275606 290629 303049 316205 302438 314132 347643
C Manufacturing 10-33 MO3R 39319 38358 40563 44386 45673 45778 50912 50659 57063 59358 60668 70187 74109 69921 71853 71210
F Construction 41-43 MOP5 70844 73975 77746 80960 83877 88168 89512 88227 94278 92959 98777 102599 111268 113379 119255 118989
G to T Services 45-98 MOW2 68306 70171 72418 75175 79122 82525 86456 90729 97487 102612 108280 115742 117525 118541 121859 120678
TOTAL Total MQ2C 65833 67745 70498 73993 77847 81364 86029 89405 96530 100955 106602 114761 117320 117638 121642 120414
2 n.e.c. represents; not elsewhere classified.
Note: Differences between totals and sums of components are due to rounding. z denotes where data is not collected, not present or unavailable for an industry or asset.
Legal, accounting, management, architecture,
engineering, technical testing activities
Public administration and defence; compulsory
social security
Activities of households as employers;
undifferentiated goods and services - activities of
household for own use
1 Ratio of net capital stock to employment has been calculated by dividing net capital stocks by 'all employees by industry sector'
table EMP14, Labour Market Statistics 14 May 2014.
Manufacture of machinery and equipment n.e.c1.
Manufacture of transport equipment Other manufacturing and repair
Electricity, gas, steam and air conditioning supply
Water supply; sewerage, waste management and
remediation activities
Wholesale and retail trade; repair of motor vehicles
and motorcycles
Manufacture of electrical equipment
Back to contents
Manufacture of food products, beverages and Manufacture of textiles, wearing apparel and leather
products
Manufacture of wood and paper products, and Manufacture of coke and refined petroleum products Manufacture of chemicals and chemical products Manufacture of basic pharmaceutical products and
pharmaceutical preparations
Manufacture of rubber and plastics products, and
other non-metallic mineral products Manufacture of basic metals and metal products
Manufacture of computer, electronic & optical
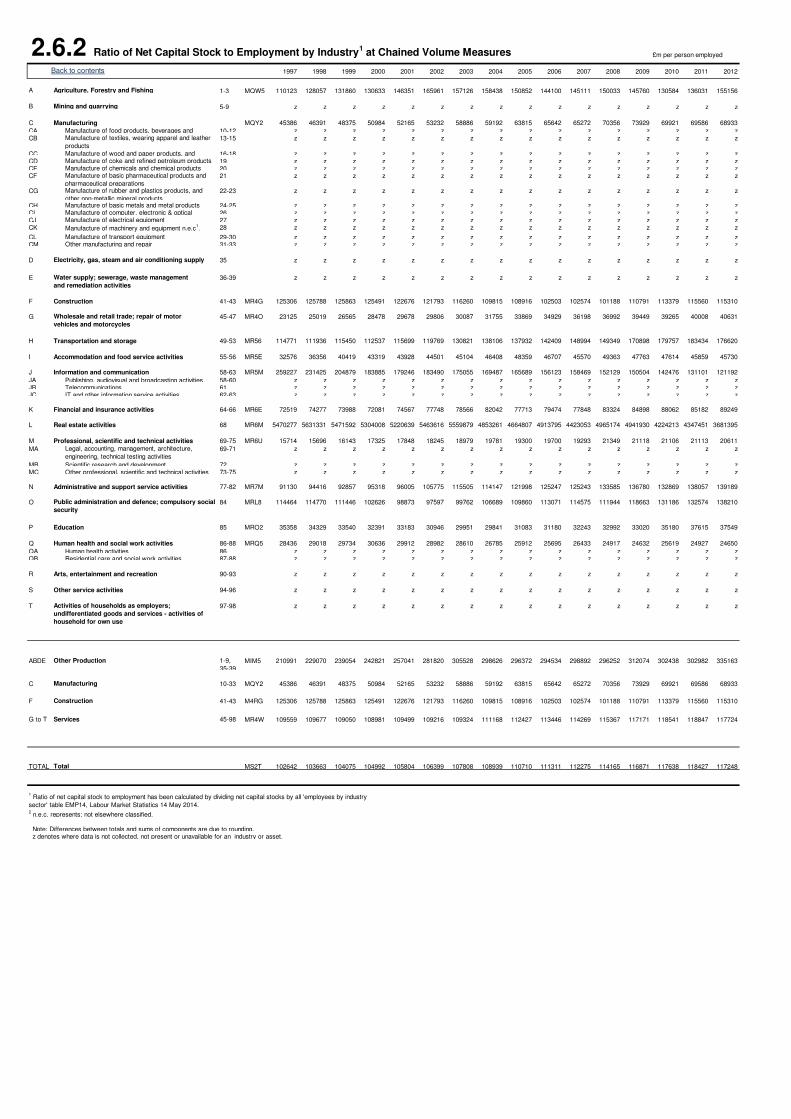
2.6.2 Ratio of Net Capital Stock to Employment by Industry1 at Chained Volume Measures £m per person employed
1997 1998 1999 2000 2001 2002 2003 2004 2005 2006 2007 2008 2009 2010 2011 2012
A Agriculture, Forestry and Fishing 1-3 MQW5 110123 128057 131860 130633 146351 165961 157126 158438 150852 144100 145111 150033 145760 130584 136031 155156
B Mining and quarrying 5-9 z z z z z z z z z z z z z z z z
C Manufacturing MQY2 45386 46391 48375 50984 52165 53232 58886 59192 63815 65642 65272 70356 73929 69921 69586 68933
CA 10-12 z z z z z z z z z z z z z z z zCB 13-15 z z z z z z z z z z z z z z z z
CC 16-18 z z z z z z z z z z z z z z z zCD 19 z z z z z z z z z z z z z z z zCE 20 z z z z z z z z z z z z z z z zCF 21 z z z z z z z z z z z z z z z z
CG 22-23 z z z z z z z z z z z z z z z z
CH 24-25 z z z z z z z z z z z z z z z zCI 26 z z z z z z z z z z z z z z z zCJ 27 z z z z z z z z z z z z z z z zCK 28 z z z z z z z z z z z z z z z z
CL 29-30 z z z z z z z z z z z z z z z zCM 31-33 z z z z z z z z z z z z z z z z
D 35 z z z z z z z z z z z z z z z z
E 36-39 z z z z z z z z z z z z z z z z
F Construction 41-43 MR4G 125306 125788 125863 125491 122676 121793 116260 109815 108916 102503 102574 101188 110791 113379 115560 115310
G 45-47 MR4O 23125 25019 26565 28478 29678 29806 30087 31755 33869 34929 36198 36992 39449 39265 40008 40631
H Transportation and storage 49-53 MR56 114771 111936 115450 112537 115699 119769 130821 138106 137932 142409 148994 149349 170898 179757 183434 176620
I Accommodation and food service activities 55-56 MR5E 32576 36356 40419 43319 43928 44501 45104 46408 48359 46707 45570 49363 47763 47614 45859 45730
J Information and communication 58-63 MR5M 259227 231425 204879 183885 179246 183490 175055 169487 165689 156123 158469 152129 150504 142476 131101 121192
JA Publishing, audiovisual and broadcasting activities 58-60 z z z z z z z z z z z z z z z zJB Telecommunications 61 z z z z z z z z z z z z z z z zJC IT and other information service activities 62-63 z z z z z z z z z z z z z z z z
K Financial and insurance activities 64-66 MR6E 72519 74277 73988 72081 74567 77748 78566 82042 77713 79474 77848 83324 84898 88062 85182 89249
L Real estate activities 68 MR6M 5470277 5631331 5471592 5304008 5220639 5463616 5559879 4853261 4664807 4913795 4423053 4965174 4941930 4224213 4347451 3681395
M Professional, scientific and technical activities 69-75 MR6U 15714 15696 16143 17325 17848 18245 18979 19781 19300 19700 19293 21349 21118 21106 21113 20611
MA 69-71 z z z z z z z z z z z z z z z z
MB Scientific research and development 72 z z z z z z z z z z z z z z z zMC Other professional, scientific and technical activities 73-75 z z z z z z z z z z z z z z z z
N Administrative and support service activities 77-82 MR7M 91130 94416 92857 95318 96005 105775 115505 114147 121998 125247 125243 133585 136780 132869 138057 139189
O 84 MRL8 114464 114770 111446 102626 98873 97597 99762 106689 109860 113071 114575 111944 118663 131186 132574 138210
P Education 85 MRO2 35358 34329 33540 32391 33183 30946 29951 29841 31083 31180 32243 32992 33020 35180 37615 37549
Q Human health and social work activities 86-88 MRQ5 28436 29018 29734 30636 29912 28982 28610 26785 25912 25695 26433 24917 24632 25619 24927 24650
QA Human health activities 86 z z z z z z z z z z z z z z z zQB Residential care and social work activities 87-88 z z z z z z z z z z z z z z z z
R Arts, entertainment and recreation 90-93 z z z z z z z z z z z z z z z z
S Other service activities 94-96 z z z z z z z z z z z z z z z z
T 97-98 z z z z z z z z z z z z z z z z
ABDE Other Production 1-9,
35-39
MIM5 210991 229070 239054 242821 257041 281820 305528 298626 296372 294534 298892 296252 312074 302438 302982 335163
C Manufacturing 10-33 MQY2 45386 46391 48375 50984 52165 53232 58886 59192 63815 65642 65272 70356 73929 69921 69586 68933
F Construction 41-43 M4RG 125306 125788 125863 125491 122676 121793 116260 109815 108916 102503 102574 101188 110791 113379 115560 115310
G to T Services 45-98 MR4W 109559 109677 109050 108981 109499 109216 109324 111168 112427 113446 114269 115367 117171 118541 118847 117724
TOTAL Total MS2T 102642 103663 104075 104992 105804 106399 107808 108939 110710 111311 112275 114165 116871 117638 118427 117248
2 n.e.c. represents; not elsewhere classified.
Note: Differences between totals and sums of components are due to rounding. z denotes where data is not collected, not present or unavailable for an industry or asset.
Legal, accounting, management, architecture,
engineering, technical testing activities
Public administration and defence; compulsory social
security
Activities of households as employers;
undifferentiated goods and services - activities of
household for own use
1 Ratio of net capital stock to employment has been calculated by dividing net capital stocks by all 'employees by industry
sector' table EMP14, Labour Market Statistics 14 May 2014.
Wholesale and retail trade; repair of motor
vehicles and motorcycles
Manufacture of chemicals and chemical products Manufacture of basic pharmaceutical products and
pharmaceutical preparations Manufacture of rubber and plastics products, and
other non-metallic mineral products Manufacture of basic metals and metal products Manufacture of computer, electronic & optical Manufacture of electrical equipment
Manufacture of machinery and equipment n.e.c1.
Manufacture of transport equipment Other manufacturing and repair
Electricity, gas, steam and air conditioning supply
Water supply; sewerage, waste management
and remediation activities
Manufacture of coke and refined petroleum products
Back to contents
Manufacture of food products, beverages and Manufacture of textiles, wearing apparel and leather
products
Manufacture of wood and paper products, and
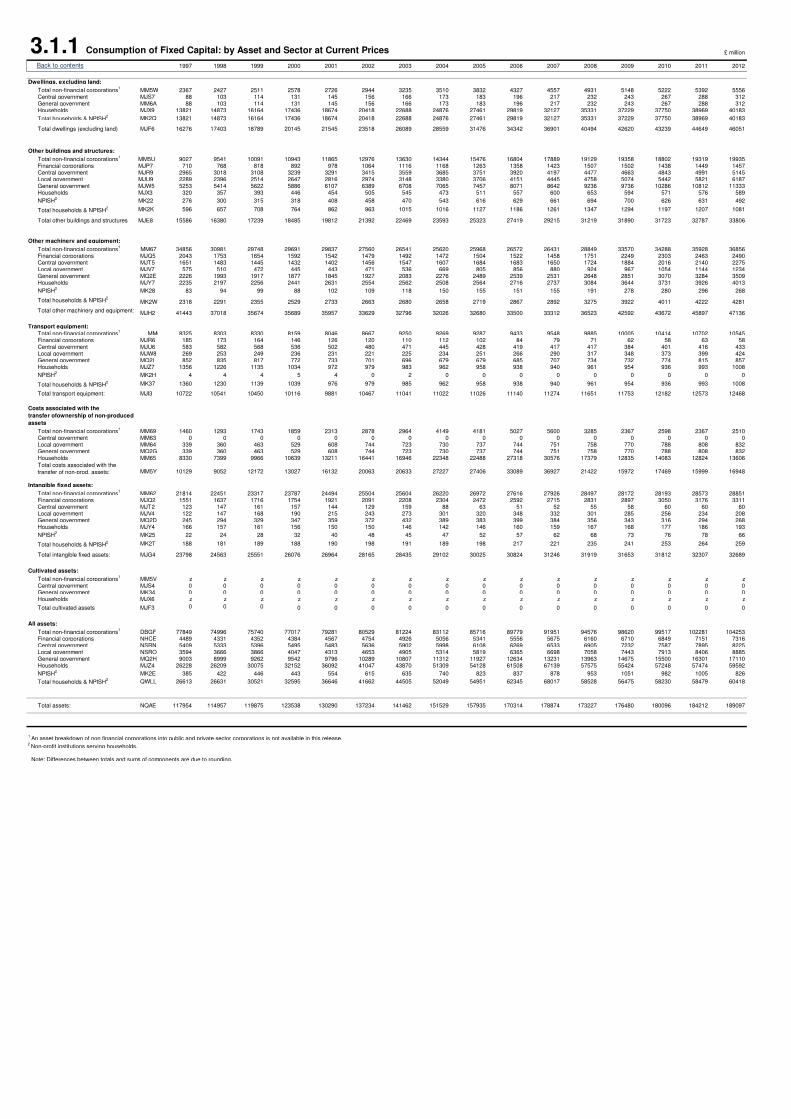
3.1.1 Consumption of Fixed Capital: by Asset and Sector at Current Prices £ million
1997 1998 1999 2000 2001 2002 2003 2004 2005 2006 2007 2008 2009 2010 2011 2012
Dwellings, excluding land:
Total non-financial corporations1
MM5W 2367 2427 2511 2578 2726 2944 3235 3510 3832 4327 4557 4931 5148 5222 5392 5556Central government MJS7 88 103 114 131 145 156 166 173 183 196 217 232 243 267 288 312General government MM6A 88 103 114 131 145 156 166 173 183 196 217 232 243 267 288 312Households MJX9 13821 14873 16164 17436 18674 20418 22688 24876 27461 29819 32127 35331 37229 37750 38969 40183
Total households & NPISH2 MK2Q 13821 14873 16164 17436 18674 20418 22688 24876 27461 29819 32127 35331 37229 37750 38969 40183
Total dwellings (excluding land) MJF6 16276 17403 18789 20145 21545 23518 26089 28559 31476 34342 36901 40494 42620 43239 44649 46051
Other buildings and structures:
Total non-financial corporations1
MM5U 9027 9541 10091 10943 11865 12976 13630 14344 15476 16804 17889 19129 19358 18802 19319 19935Financial corporations MJP7 710 768 818 892 978 1064 1116 1168 1263 1358 1423 1507 1502 1438 1449 1457Central government MJR9 2965 3018 3108 3239 3291 3415 3559 3685 3751 3920 4197 4477 4663 4843 4991 5145Local government MJU9 2289 2396 2514 2647 2816 2974 3148 3380 3706 4151 4445 4758 5074 5442 5821 6187General government MJW5 5253 5414 5622 5886 6107 6389 6708 7065 7457 8071 8642 9236 9736 10286 10812 11333Households MJX3 320 357 393 446 454 505 545 473 511 557 600 653 594 571 576 589
NPISH2
MK22 276 300 315 318 408 458 470 543 616 629 661 694 700 626 631 492
Total households & NPISH2 MK2K 596 657 708 764 862 963 1015 1016 1127 1186 1261 1347 1294 1197 1207 1081
Total other buildings and structures MJE8 15586 16380 17239 18485 19812 21392 22469 23593 25323 27419 29215 31219 31890 31723 32787 33806
Other machinery and equipment:
Total non-financial corporations1
MM67 34856 30981 29748 29691 29837 27560 26541 25620 25968 26572 26431 28849 33570 34288 35928 36856Financial corporations MJQ5 2043 1753 1654 1592 1542 1479 1492 1472 1504 1522 1458 1751 2249 2303 2463 2490Central government MJT5 1651 1483 1445 1432 1402 1456 1547 1607 1684 1683 1650 1724 1884 2016 2140 2275Local government MJV7 575 510 472 445 443 471 536 669 805 856 880 924 967 1054 1144 1234General government MQ2E 2226 1993 1917 1877 1845 1927 2083 2276 2489 2539 2531 2648 2851 3070 3284 3509Households MJY7 2235 2197 2256 2441 2631 2554 2562 2508 2564 2716 2737 3084 3644 3731 3926 4013
NPISH2
MK28 83 94 99 88 102 109 118 150 155 151 155 191 278 280 296 268
Total households & NPISH2
MK2W 2318 2291 2355 2529 2733 2663 2680 2658 2719 2867 2892 3275 3922 4011 4222 4281
Total other machinery and equipment: MJH2 41443 37018 35674 35689 35957 33629 32796 32026 32680 33500 33312 36523 42592 43672 45897 47136
Transport equipment:
Total non-financial corporations1
MM6B 8325 8303 8330 8159 8046 8667 9250 9269 9287 9433 9548 9885 10005 10414 10702 10545Financial corporations MJR6 185 173 164 146 126 120 110 112 102 84 79 71 62 58 63 58Central government MJU6 583 582 568 536 502 480 471 445 428 419 417 417 384 401 416 433Local government MJW8 269 253 249 236 231 221 225 234 251 266 290 317 348 373 399 424General government MQ2I 852 835 817 772 733 701 696 679 679 685 707 734 732 774 815 857Households MJZ7 1356 1226 1135 1034 972 979 983 962 958 938 940 961 954 936 993 1008
NPISH2
MK2H 4 4 4 5 4 0 2 0 0 0 0 0 0 0 0 0
Total households & NPISH2 MK37 1360 1230 1139 1039 976 979 985 962 958 938 940 961 954 936 993 1008
Total transport equipment: MJI3 10722 10541 10450 10116 9881 10467 11041 11022 11026 11140 11274 11651 11753 12182 12573 12468
Total non-financial corporations1
MM69 1460 1293 1743 1859 2313 2878 2964 4149 4181 5027 5600 3285 2367 2598 2367 2510Central government MM63 0 0 0 0 0 0 0 0 0 0 0 0 0 0 0 0Local government MM64 339 360 463 529 608 744 723 730 737 744 751 758 770 788 808 832General government MQ2G 339 360 463 529 608 744 723 730 737 744 751 758 770 788 808 832Households MM65 8330 7399 9966 10639 13211 16441 16946 22348 22488 27318 30576 17379 12835 14083 12824 13606
MM5Y 10129 9052 12172 13027 16132 20063 20633 27227 27406 33089 36927 21422 15972 17469 15999 16948
Intangible fixed assets:
Total non-financial corporations1
MM62 21814 22451 23317 23787 24494 25504 25604 26220 26972 27616 27926 28497 28172 28193 28573 28851Financial corporations MJQ2 1551 1637 1716 1754 1921 2091 2208 2304 2472 2592 2715 2831 2897 3050 3176 3311Central government MJT2 123 147 161 157 144 129 159 88 63 51 52 55 58 60 60 60Local government MJV4 122 147 168 190 215 243 273 301 320 348 332 301 285 256 234 208General government MQ2D 245 294 329 347 359 372 432 389 383 399 384 356 343 316 294 268Households MJY4 166 157 161 156 150 150 146 142 146 160 159 167 168 177 186 193
NPISH2
MK25 22 24 28 32 40 48 45 47 52 57 62 68 73 76 78 66
Total households & NPISH2 MK2T 188 181 189 188 190 198 191 189 198 217 221 235 241 253 264 259
Total intangible fixed assets: MJG4 23798 24563 25551 26076 26964 28165 28435 29102 30025 30824 31246 31919 31653 31812 32307 32689
Cultivated assets:
Total non-financial corporations1
MM5V z z z z z z z z z z z z z z z zCentral government MJS4 0 0 0 0 0 0 0 0 0 0 0 0 0 0 0 0General government MK34 0 0 0 0 0 0 0 0 0 0 0 0 0 0 0 0Households MJX6 z z z z z z z z z z z z z z z z
Total cultivated assets MJF3 0 0 0 0 0 0 0 0 0 0 0 0 0 0 0 0
All assets:
Total non-financial corporations1
DBGF 77849 74996 75740 77017 79281 80529 81224 83112 85716 89779 91951 94576 98620 99517 102281 104253Financial corporations NHCE 4489 4331 4352 4384 4567 4754 4926 5056 5341 5556 5675 6160 6710 6849 7151 7316Central government NSRN 5409 5333 5396 5495 5483 5636 5902 5998 6108 6269 6533 6905 7232 7587 7895 8225Local government NSRO 3594 3666 3866 4047 4313 4653 4905 5314 5819 6365 6698 7058 7443 7913 8406 8885General government MQ2H 9003 8999 9262 9542 9796 10289 10807 11312 11927 12634 13231 13963 14675 15500 16301 17110Households MJZ4 26228 26209 30075 32152 36092 41047 43870 51309 54128 61508 67139 57575 55424 57248 57474 59592
NPISH2
MK2E 385 422 446 443 554 615 635 740 823 837 878 953 1051 982 1005 826
Total households & NPISH2 QWLL 26613 26631 30521 32595 36646 41662 44505 52049 54951 62345 68017 58528 56475 58230 58479 60418
Total assets: NQAE 117954 114957 119875 123538 130290 137234 141462 151529 157935 170314 178874 173227 176480 180096 184212 189097
1 An asset breakdown of non financial corporations into public and private sector corporations is not available in this release.
2 Non-profit institutions serving households.
Note: Differences between totals and sums of components are due to rounding.
Back to contents
Costs associated with the
transfer ofownership of non-produced
assets
Total costs associated with the
transfer of non-prod. assets:
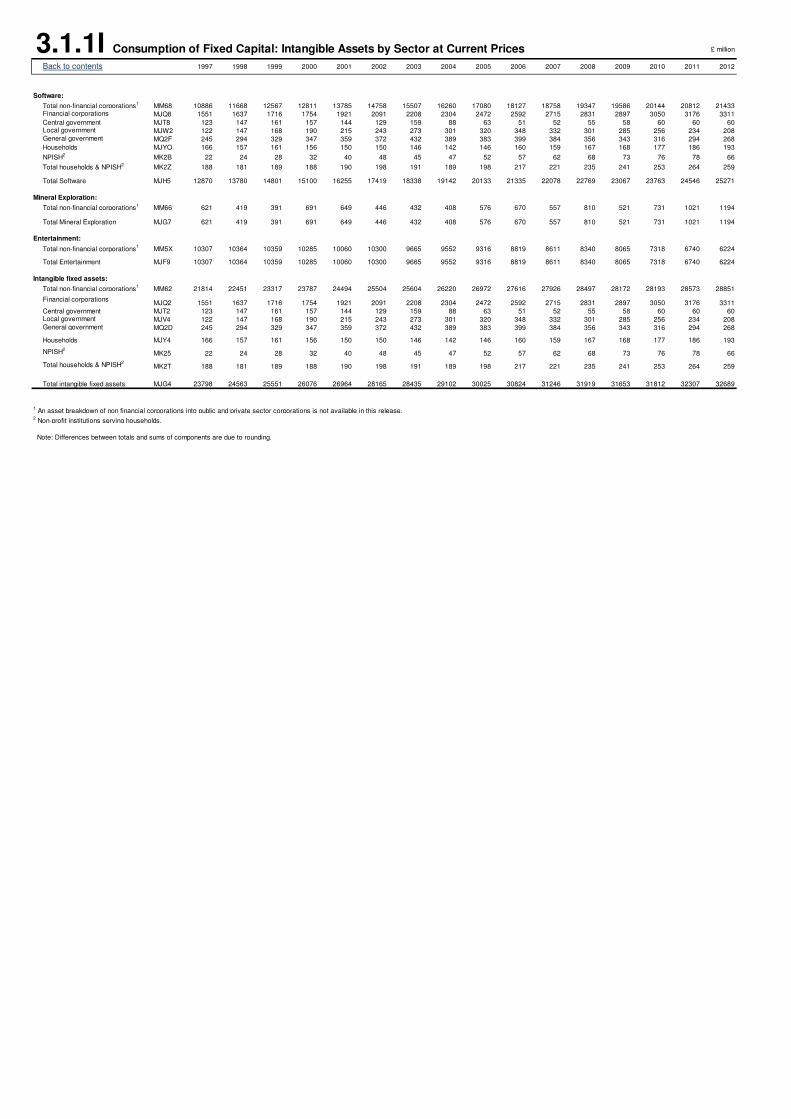
3.1.1I Consumption of Fixed Capital: Intangible Assets by Sector at Current Prices £ million
1997 1998 1999 2000 2001 2002 2003 2004 2005 2006 2007 2008 2009 2010 2011 2012
Software:
Total non-financial corporations1 MM68 10886 11668 12567 12811 13785 14758 15507 16260 17080 18127 18758 19347 19586 20144 20812 21433Financial corporations MJQ8 1551 1637 1716 1754 1921 2091 2208 2304 2472 2592 2715 2831 2897 3050 3176 3311
Central government MJT8 123 147 161 157 144 129 159 88 63 51 52 55 58 60 60 60Local government MJW2 122 147 168 190 215 243 273 301 320 348 332 301 285 256 234 208General government MQ2F 245 294 329 347 359 372 432 389 383 399 384 356 343 316 294 268
Households MJYO 166 157 161 156 150 150 146 142 146 160 159 167 168 177 186 193
NPISH2 MK2B 22 24 28 32 40 48 45 47 52 57 62 68 73 76 78 66
Total households & NPISH2 MK2Z 188 181 189 188 190 198 191 189 198 217 221 235 241 253 264 259
Total Software MJH5 12870 13780 14801 15100 16255 17419 18338 19142 20133 21335 22078 22769 23067 23763 24546 25271
Mineral Exploration:
Total non-financial corporations1 MM66 621 419 391 691 649 446 432 408 576 670 557 810 521 731 1021 1194
Total Mineral Exploration MJG7 621 419 391 691 649 446 432 408 576 670 557 810 521 731 1021 1194
Entertainment:
Total non-financial corporations1 MM5X 10307 10364 10359 10285 10060 10300 9665 9552 9316 8819 8611 8340 8065 7318 6740 6224
Total Entertainment MJF9 10307 10364 10359 10285 10060 10300 9665 9552 9316 8819 8611 8340 8065 7318 6740 6224
Intangible fixed assets:
Total non-financial corporations1 MM62 21814 22451 23317 23787 24494 25504 25604 26220 26972 27616 27926 28497 28172 28193 28573 28851
Financial corporationsMJQ2 1551 1637 1716 1754 1921 2091 2208 2304 2472 2592 2715 2831 2897 3050 3176 3311
Central government MJT2 123 147 161 157 144 129 159 88 63 51 52 55 58 60 60 60Local government MJV4 122 147 168 190 215 243 273 301 320 348 332 301 285 256 234 208General government MQ2D 245 294 329 347 359 372 432 389 383 399 384 356 343 316 294 268
Households MJY4 166 157 161 156 150 150 146 142 146 160 159 167 168 177 186 193
NPISH2MK25 22 24 28 32 40 48 45 47 52 57 62 68 73 76 78 66
Total households & NPISH2MK2T 188 181 189 188 190 198 191 189 198 217 221 235 241 253 264 259
Total intangible fixed assets MJG4 23798 24563 25551 26076 26964 28165 28435 29102 30025 30824 31246 31919 31653 31812 32307 32689
1 An asset breakdown of non financial corporations into public and private sector corporations is not available in this release.2 Non-profit institutions serving households.
Note: Differences between totals and sums of components are due to rounding.
Back to contents
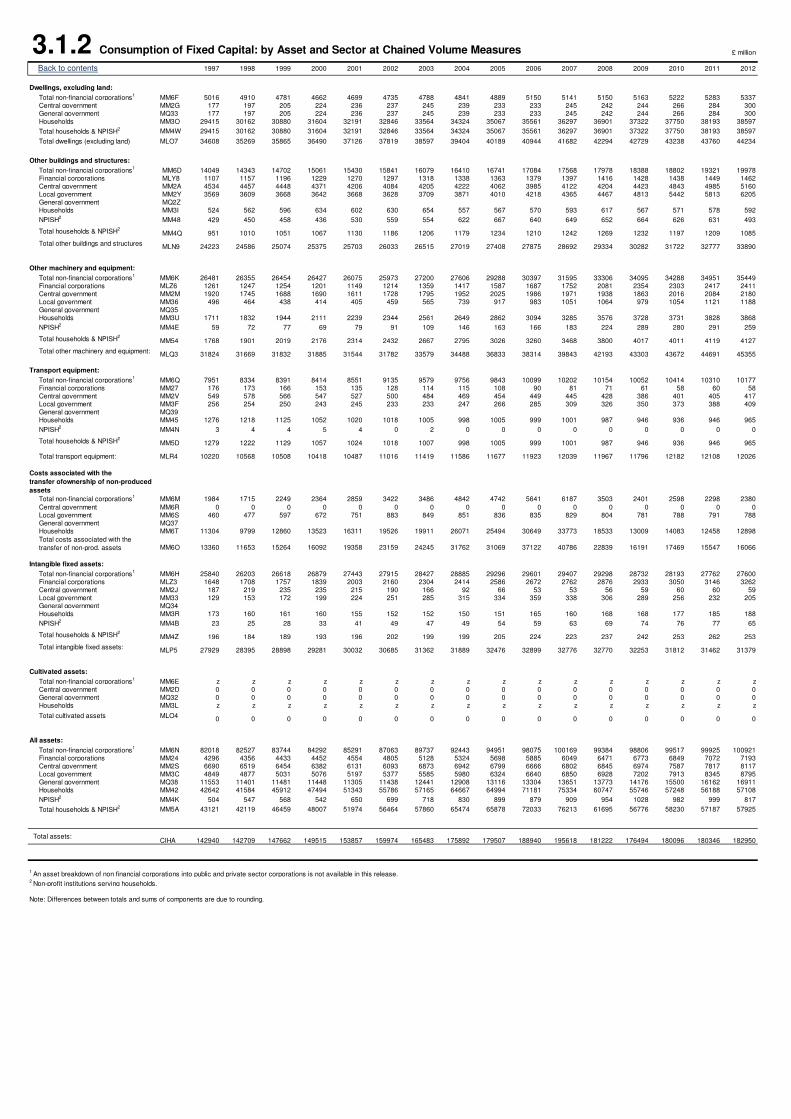
3.1.2 Consumption of Fixed Capital: by Asset and Sector at Chained Volume Measures £ million
1997 1998 1999 2000 2001 2002 2003 2004 2005 2006 2007 2008 2009 2010 2011 2012
Dwellings, excluding land:
Total non-financial corporations1 MM6F 5016 4910 4781 4662 4699 4735 4788 4841 4889 5150 5141 5150 5163 5222 5283 5337Central government MM2G 177 197 205 224 236 237 245 239 233 233 245 242 244 266 284 300General government MQ33 177 197 205 224 236 237 245 239 233 233 245 242 244 266 284 300Households MM3O 29415 30162 30880 31604 32191 32846 33564 34324 35067 35561 36297 36901 37322 37750 38193 38597
Total households & NPISH2 MM4W 29415 30162 30880 31604 32191 32846 33564 34324 35067 35561 36297 36901 37322 37750 38193 38597
Total dwellings (excluding land) MLO7 34608 35269 35865 36490 37126 37819 38597 39404 40189 40944 41682 42294 42729 43238 43760 44234
Other buildings and structures:
Total non-financial corporations1 MM6D 14049 14343 14702 15061 15430 15841 16079 16410 16741 17084 17568 17978 18388 18802 19321 19978Financial corporations MLY8 1107 1157 1196 1229 1270 1297 1318 1338 1363 1379 1397 1416 1428 1438 1449 1462Central government MM2A 4534 4457 4448 4371 4206 4084 4205 4222 4062 3985 4122 4204 4423 4843 4985 5160Local government MM2Y 3569 3609 3668 3642 3668 3628 3709 3871 4010 4218 4365 4467 4813 5442 5813 6205General government MQ2Z Households MM3I 524 562 596 634 602 630 654 557 567 570 593 617 567 571 578 592
NPISH2 MM48 429 450 458 436 530 559 554 622 667 640 649 652 664 626 631 493
Total households & NPISH2MM4Q 951 1010 1051 1067 1130 1186 1206 1179 1234 1210 1242 1269 1232 1197 1209 1085
Total other buildings and structures MLN9 24223 24586 25074 25375 25703 26033 26515 27019 27408 27875 28692 29334 30282 31722 32777 33890
Other machinery and equipment:
Total non-financial corporations1 MM6K 26481 26355 26454 26427 26075 25973 27200 27606 29288 30397 31595 33306 34095 34288 34951 35449Financial corporations MLZ6 1261 1247 1254 1201 1149 1214 1359 1417 1587 1687 1752 2081 2354 2303 2417 2411Central government MM2M 1920 1745 1688 1690 1611 1728 1795 1952 2025 1986 1971 1938 1863 2016 2084 2180Local government MM36 496 464 438 414 405 459 565 739 917 983 1051 1064 979 1054 1121 1188General government MQ35Households MM3U 1711 1832 1944 2111 2239 2344 2561 2649 2862 3094 3285 3576 3728 3731 3828 3868
NPISH2 MM4E 59 72 77 69 79 91 109 146 163 166 183 224 289 280 291 259
Total households & NPISH2MM54 1768 1901 2019 2176 2314 2432 2667 2795 3026 3260 3468 3800 4017 4011 4119 4127
Total other machinery and equipment: MLQ3 31824 31669 31832 31885 31544 31782 33579 34488 36833 38314 39843 42193 43303 43672 44691 45355
Transport equipment:
Total non-financial corporations1 MM6Q 7951 8334 8391 8414 8551 9135 9579 9756 9843 10099 10202 10154 10052 10414 10310 10177Financial corporations MM27 176 173 166 153 135 128 114 115 108 90 81 71 61 58 60 58Central government MM2V 549 578 566 547 527 500 484 469 454 449 445 428 386 401 405 417Local government MM3F 256 254 250 243 245 233 233 247 266 285 309 326 350 373 388 409General government MQ39Households MM45 1276 1218 1125 1052 1020 1018 1005 998 1005 999 1001 987 946 936 946 965
NPISH2 MM4N 3 4 4 5 4 0 2 0 0 0 0 0 0 0 0 0
Total households & NPISH2MM5D 1279 1222 1129 1057 1024 1018 1007 998 1005 999 1001 987 946 936 946 965
Total transport equipment: MLR4 10220 10568 10508 10418 10487 11016 11419 11586 11677 11923 12039 11967 11796 12182 12108 12026
Total non-financial corporations1 MM6M 1984 1715 2249 2364 2859 3422 3486 4842 4742 5641 6187 3503 2401 2598 2298 2380
Central government MM6R 0 0 0 0 0 0 0 0 0 0 0 0 0 0 0 0Local government MM6S 460 477 597 672 751 883 849 851 836 835 829 804 781 788 791 788General government MQ37Households MM6T 11304 9799 12860 13523 16311 19526 19911 26071 25494 30649 33773 18533 13009 14083 12458 12898
MM6O 13360 11653 15264 16092 19358 23159 24245 31762 31069 37122 40786 22839 16191 17469 15547 16066
Intangible fixed assets:
Total non-financial corporations1
MM6H 25840 26203 26618 26879 27443 27915 28427 28885 29296 29601 29407 29298 28732 28193 27762 27600Financial corporations MLZ3 1648 1708 1757 1839 2003 2160 2304 2414 2586 2672 2762 2876 2933 3050 3146 3262Central government MM2J 187 219 235 235 215 190 166 92 66 53 53 56 59 60 60 59Local government MM33 129 153 172 199 224 251 285 315 334 359 338 306 289 256 232 205General government MQ34Households MM3R 173 160 161 160 155 152 152 150 151 165 160 168 168 177 185 188
NPISH2 MM4B 23 25 28 33 41 49 47 49 54 59 63 69 74 76 77 65
Total households & NPISH2MM4Z 196 184 189 193 196 202 199 199 205 224 223 237 242 253 262 253
Total intangible fixed assets: MLP5 27929 28395 28898 29281 30032 30685 31362 31889 32476 32899 32776 32770 32253 31812 31462 31379
Cultivated assets:
Total non-financial corporations1 MM6E z z z z z z z z z z z z z z z zCentral government MM2D 0 0 0 0 0 0 0 0 0 0 0 0 0 0 0 0General government MQ32 0 0 0 0 0 0 0 0 0 0 0 0 0 0 0 0Households MM3L z z z z z z z z z z z z z z z z
Total cultivated assets MLO4 0 0 0 0 0 0 0 0 0 0 0 0 0 0 0 0
All assets:
Total non-financial corporations1 MM6N 82018 82527 83744 84292 85291 87063 89737 92443 94951 98075 100169 99384 98806 99517 99925 100921Financial corporations MM24 4296 4356 4433 4452 4554 4805 5128 5324 5698 5885 6049 6471 6773 6849 7072 7193Central government MM2S 6690 6519 6454 6382 6131 6093 6873 6942 6799 6666 6802 6845 6974 7587 7817 8117Local government MM3C 4849 4877 5031 5076 5197 5377 5585 5980 6324 6640 6850 6928 7202 7913 8345 8795General government MQ38 11553 11401 11481 11448 11305 11438 12441 12908 13116 13304 13651 13773 14176 15500 16162 16911Households MM42 42642 41584 45912 47494 51343 55786 57165 64667 64994 71181 75334 60747 55746 57248 56188 57108
NPISH2 MM4K 504 547 568 542 650 699 718 830 899 879 909 954 1028 982 999 817
Total households & NPISH2 MM5A 43121 42119 46459 48007 51974 56464 57860 65474 65878 72033 76213 61695 56776 58230 57187 57925
Total assets:CIHA 142940 142709 147662 149515 153857 159974 165483 175892 179507 188940 195618 181222 176494 180096 180346 182950
1 An asset breakdown of non financial corporations into public and private sector corporations is not available in this release.2 Non-profit institutions serving households.
Note: Differences between totals and sums of components are due to rounding.
Back to contents
Costs associated with the
transfer ofownership of non-produced
assets
Total costs associated with the
transfer of non-prod. assets
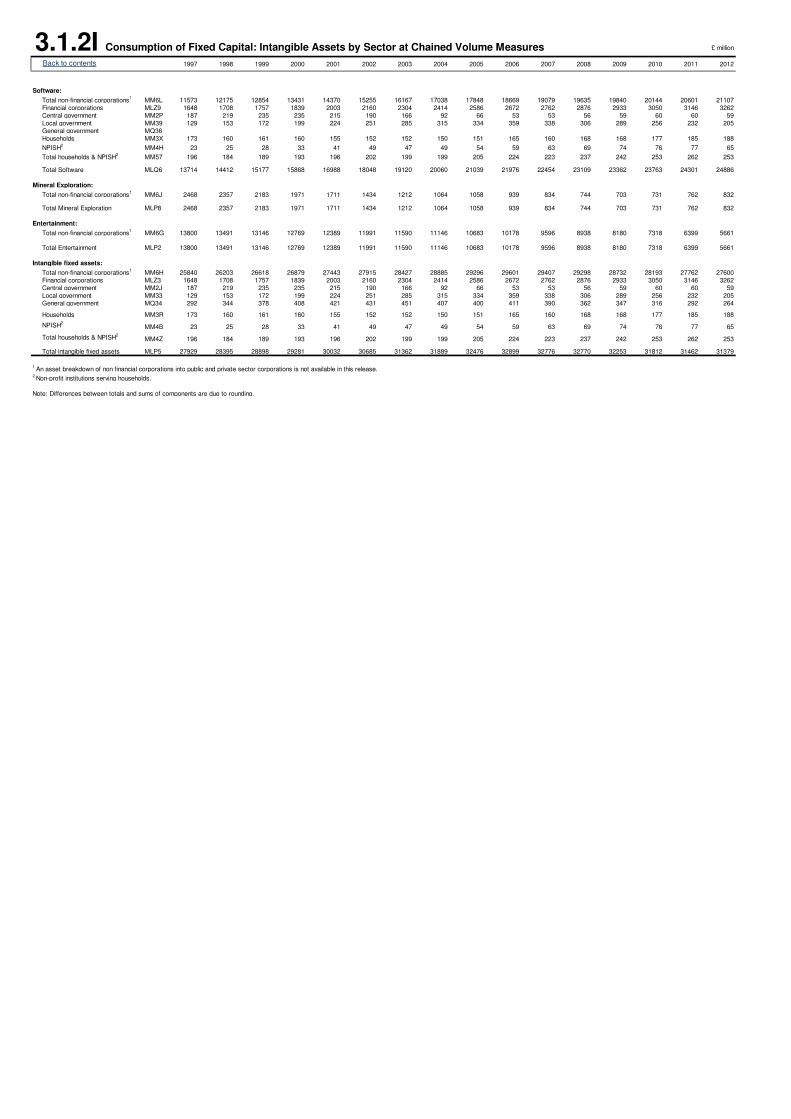
3.1.2I Consumption of Fixed Capital: Intangible Assets by Sector at Chained Volume Measures £ million
1997 1998 1999 2000 2001 2002 2003 2004 2005 2006 2007 2008 2009 2010 2011 2012
Software:
Total non-financial corporations1
MM6L 11573 12175 12854 13431 14370 15255 16167 17038 17848 18669 19079 19635 19840 20144 20601 21107
Financial corporations MLZ9 1648 1708 1757 1839 2003 2160 2304 2414 2586 2672 2762 2876 2933 3050 3146 3262
Central government MM2P 187 219 235 235 215 190 166 92 66 53 53 56 59 60 60 59
Local government MM39 129 153 172 199 224 251 285 315 334 359 338 306 289 256 232 205
General government MQ36
Households MM3X 173 160 161 160 155 152 152 150 151 165 160 168 168 177 185 188
NPISH2
MM4H 23 25 28 33 41 49 47 49 54 59 63 69 74 76 77 65
Total households & NPISH2
MM57 196 184 189 193 196 202 199 199 205 224 223 237 242 253 262 253
Total Software MLQ6 13714 14412 15177 15868 16988 18048 19120 20060 21039 21976 22454 23109 23362 23763 24301 24886
Mineral Exploration:
Total non-financial corporations1
MM6J 2468 2357 2183 1971 1711 1434 1212 1064 1058 939 834 744 703 731 762 832
Total Mineral Exploration MLP8 2468 2357 2183 1971 1711 1434 1212 1064 1058 939 834 744 703 731 762 832
Entertainment:
Total non-financial corporations1
MM6G 13800 13491 13146 12769 12389 11991 11590 11146 10683 10178 9596 8938 8180 7318 6399 5661
Total Entertainment MLP2 13800 13491 13146 12769 12389 11991 11590 11146 10683 10178 9596 8938 8180 7318 6399 5661
Intangible fixed assets:
Total non-financial corporations1
MM6H 25840 26203 26618 26879 27443 27915 28427 28885 29296 29601 29407 29298 28732 28193 27762 27600
Financial corporations MLZ3 1648 1708 1757 1839 2003 2160 2304 2414 2586 2672 2762 2876 2933 3050 3146 3262
Central government MM2J 187 219 235 235 215 190 166 92 66 53 53 56 59 60 60 59
Local government MM33 129 153 172 199 224 251 285 315 334 359 338 306 289 256 232 205
General government MQ34 292 344 378 408 421 431 451 407 400 411 390 362 347 316 292 264
Households MM3R 173 160 161 160 155 152 152 150 151 165 160 168 168 177 185 188
NPISH2
MM4B 23 25 28 33 41 49 47 49 54 59 63 69 74 76 77 65
Total households & NPISH2
MM4Z 196 184 189 193 196 202 199 199 205 224 223 237 242 253 262 253
Total intangible fixed assets MLP5 27929 28395 28898 29281 30032 30685 31362 31889 32476 32899 32776 32770 32253 31812 31462 31379
1 An asset breakdown of non financial corporations into public and private sector corporations is not available in this release.
2 Non-profit institutions serving households.
Note: Differences between totals and sums of components are due to rounding.
Back to contents

3.2.1 Consumption of Fixed Capital: by Industry at Current Prices £ million
1997 1998 1999 2000 2001 2002 2003 2004 2005 2006 2007 2008 2009 2010 2011 2012
A Agriculture, Forestry and Fishing 1-3 MHX9 2,715 2,746 2,799 2,856 2,954 3,021 3,042 3,069 3,177 3,318 3,421 3,677 3,929 3,870 4,006 4,077
B Mining and quarrying 5-9 MI26 1,461 1,232 1,183 1,459 1,425 1,471 1,761 1,990 2,460 2,916 3,091 3,720 3,683 3,986 4,701 5,440
C Manufacturing MI35 21,448 19,104 18,105 17,813 17,439 16,089 15,010 14,064 14,134 14,060 13,740 14,313 15,317 15,260 15,754 16,121
CA Manufacture of food products, beverages and 10-12 MI3N 2,882 2,553 2,376 2,351 2,361 2,229 2,128 2,071 2,063 2,105 2,100 2,223 2,426 2,468 2,556 2,611
CB Manufacture of textiles, wearing apparel and leather
products13-15 MI47 939 794 713 652 616 533 484 440 402 383 360 365 373 355 361 363
CC Manufacture of wood and paper products, and 16-18 MI4P 3,308 2,854 2,602 2,509 2,461 2,214 2,000 1,742 1,640 1,544 1,435 1,427 1,464 1,401 1,379 1,359CD Manufacture of coke and refined petroleum products 19 MI59 285 251 234 224 229 224 227 222 229 241 274 302 340 354 375 391CE Manufacture of chemicals and chemical products 20 MI5R 2,227 1,987 1,891 1,872 1,860 1,680 1,527 1,450 1,399 1,405 1,366 1,401 1,487 1,454 1,518 1,566CF Manufacture of basic pharmaceutical products and
pharmaceutical preparations21 MI6B 577 529 525 535 568 546 531 532 532 541 538 562 611 604 620 624
CG Manufacture of rubber and plastics products, and
other non-metallic mineral products22-23 MI6T 1,891 1,679 1,615 1,585 1,487 1,375 1,311 1,215 1,176 1,177 1,167 1,236 1,325 1,312 1,348 1,361
CH Manufacture of basic metals and metal products 24-25 MI7D 1,991 1,842 1,774 1,769 1,747 1,662 1,605 1,599 2,072 2,097 2,081 2,187 2,340 2,295 2,367 2,423CI Manufacture of computer, electronic & optical
products26 MI7V 1,419 1,285 1,200 1,208 1,178 1,044 917 827 744 671 605 608 635 634 647 635
CJ Manufacture of electrical equipment 27 MI8F 861 767 727 707 674 607 554 514 477 452 428 436 444 430 433 429CK Manufacture of machinery and equipment n.e.c
1. 28 MI8X 1,185 1,089 1,049 1,028 994 926 873 836 811 800 790 825 885 907 942 986
CL Manufacture of transport equipment 29-30 MI9H 2,483 2,231 2,218 2,221 2,133 2,002 1,876 1,692 1,675 1,729 1,699 1,798 1,985 2,034 2,178 2,338CM Other manufacturing and repair 31-33 MI9Z 1,400 1,243 1,181 1,152 1,131 1,047 977 924 914 915 897 943 1,002 1,012 1,030 1,035
D Electricity, gas, steam and air conditioning supply 35 MIC3 1,771 1,797 1,874 1,978 2,125 2,209 2,290 2,374 2,544 2,790 2,997 3,322 3,747 3,903 4,144 4,246
E Water supply; sewerage, waste management and
remediation activities
36-39 MIE5 1,725 1,787 1,904 2,031 2,154 2,280 2,404 2,483 2,696 2,935 3,126 3,473 3,797 3,881 4,071 4,300
F Construction 41-43 MIH2 4,939 5,061 5,225 5,461 5,728 6,091 6,479 6,820 7,199 7,611 7,929 8,450 8,727 8,672 8,819 8,928
G Wholesale and retail trade; repair of motor vehicles
and motorcycles45-47 MIJ4 6,606 6,645 6,910 6,963 7,234 7,448 7,754 8,026 8,212 8,585 8,804 9,260 9,777 9,972 10,361 10,725
H Transportation and storage 49-53 MIO6 7,541 7,449 7,533 7,674 7,875 8,433 8,990 9,371 9,748 10,414 10,972 11,851 12,557 13,278 13,655 13,541
I Accommodation and food service activities 55-56 MIT5 1,208 1,244 1,302 1,382 1,460 1,634 1,754 1,584 1,685 1,815 1,974 2,193 2,477 2,438 2,602 2,640
J Information and communication 58-63 MIW2 21,076 20,785 21,105 21,449 21,919 21,968 21,161 21,155 21,177 21,121 20,846 21,084 21,867 21,216 20,836 20,344
JA Publishing, audiovisual and broadcasting activities 58-60 MIY7 11,158 11,233 11,310 11,314 11,238 11,506 10,905 10,803 10,653 10,218 10,044 9,880 9,684 8,982 8,480 8,045JB Telecommunications 61 MJ29 9,040 8,572 8,644 8,783 8,996 8,588 8,296 8,251 8,372 8,650 8,567 8,904 9,679 9,676 9,793 9,780JC IT and other information service activities 62-63 MJ2R 877 980 1,151 1,352 1,685 1,874 1,959 2,101 2,152 2,253 2,235 2,300 2,504 2,557 2,563 2,519
K Financial and insurance activities 64-66 MJ3B 4,489 4,331 4,352 4,384 4,567 4,754 4,926 5,056 5,341 5,560 5,679 6,164 6,714 6,853 7,155 7,320
L Real estate activities 68 MJ3W 24,365 24,202 28,492 30,513 34,830 40,472 43,230 51,909 54,566 62,701 68,738 56,354 52,836 54,914 54,785 57,035
M Professional, scientific and technical activities 69-75 MJ4G 3,075 2,927 2,940 2,939 3,137 3,293 3,480 3,625 3,759 3,885 3,932 4,272 4,745 4,808 4,986 4,997
MA Legal, accounting, management, architecture,
engineering, technical testing activities69-71 MJ4Y 1,969 1,852 1,822 1,751 1,839 1,955 2,103 2,224 2,349 2,484 2,568 2,785 3,075 3,140 3,282 3,325
MB Scientific research and development 72 MJ5I 534 527 572 612 672 683 686 692 666 653 616 687 794 780 813 792MC Other professional, scientific and technical activities 73-75 MJ62 572 548 546 576 626 655 691 709 744 748 748 800 876 888 891 880
N Administrative and support service activities 77-82 MJ6N 5,100 5,116 5,259 5,394 5,712 6,065 6,580 6,947 7,415 7,922 8,382 8,895 9,295 9,406 9,936 10,377
O Public administration and defence; compulsory
social security 84 MJ7A
4,786 4,743 4,779 4,804 4,874 5,032 5,356 5,699 6,005 6,287 6,512 6,772 6,947 7,189 7,449 7,705
P Education 85 MJ7S 1,635 1,700 1,786 1,856 2,000 2,108 2,234 2,404 2,681 2,948 3,143 3,427 3,724 3,954 4,205 4,414
Q Human health and social work activities 86-88 MJ8C 2,155 2,165 2,250 2,401 2,465 2,554 2,699 2,664 2,719 2,844 2,957 3,173 3,316 3,407 3,547 3,594
QA Human health activities 86 MJ8U 1,483 1,488 1,544 1,645 1,689 1,753 1,864 1,829 1,861 1,949 2,032 2,146 2,223 2,263 2,316 2,302QB Residential care and social work activities 87-88 MJ9E 672 677 706 756 776 801 836 835 858 895 925 1,027 1,093 1,144 1,231 1,292
R Arts, entertainment and recreation 90-93 MJ9W 875 929 1,027 1,098 1,228 1,198 1,210 1,229 1,329 1,436 1,500 1,661 1,802 1,869 1,956 2,045
S Other service activities 94-96 MJB8 984 994 1,051 1,084 1,164 1,115 1,102 1,060 1,090 1,166 1,132 1,166 1,222 1,220 1,245 1,248
T Activities of households as employers;
undifferentiated goods and services -
activities of household for own use
97-98 MJE2 0 0 0 0 0 0 0 0 0 0 0 0 0 0 0 0
ABDE Other Production 1-9,
35-39MI2L 7,672 7,562 7,760 8,324 8,658 8,981 9,497 9,916 10,877 11,959 12,635 14,192 15,156 15,640 16,922 18,063
C Manufacturing 10-33 MI35 21,448 19,104 18,105 17,813 17,439 16,089 15,010 14,064 14,134 14,060 13,740 14,313 15,317 15,260 15,754 16,121
F Construction 41-43 MIH2 4,939 5,061 5,225 5,461 5,728 6,091 6,479 6,820 7,199 7,611 7,929 8,450 8,727 8,672 8,819 8,928
G to T Services 45-98 MM6Z 83,895 83,230 88,785 91,940 98,465 106,073 110,476 120,729 125,725 136,684 144,571 136,272 137,280 140,524 142,718 145,985
TOTAL Total NQAE 117,954 114,957 119,875 123,538 130,290 137,234 141,462 151,529 157,935 170,314 178,874 173,227 176,480 180,096 184,212 189,097
1 n.e.c. represents; not elsewhere classified.
Note: Differences between totals and sums of components are due to rounding
Back to contents
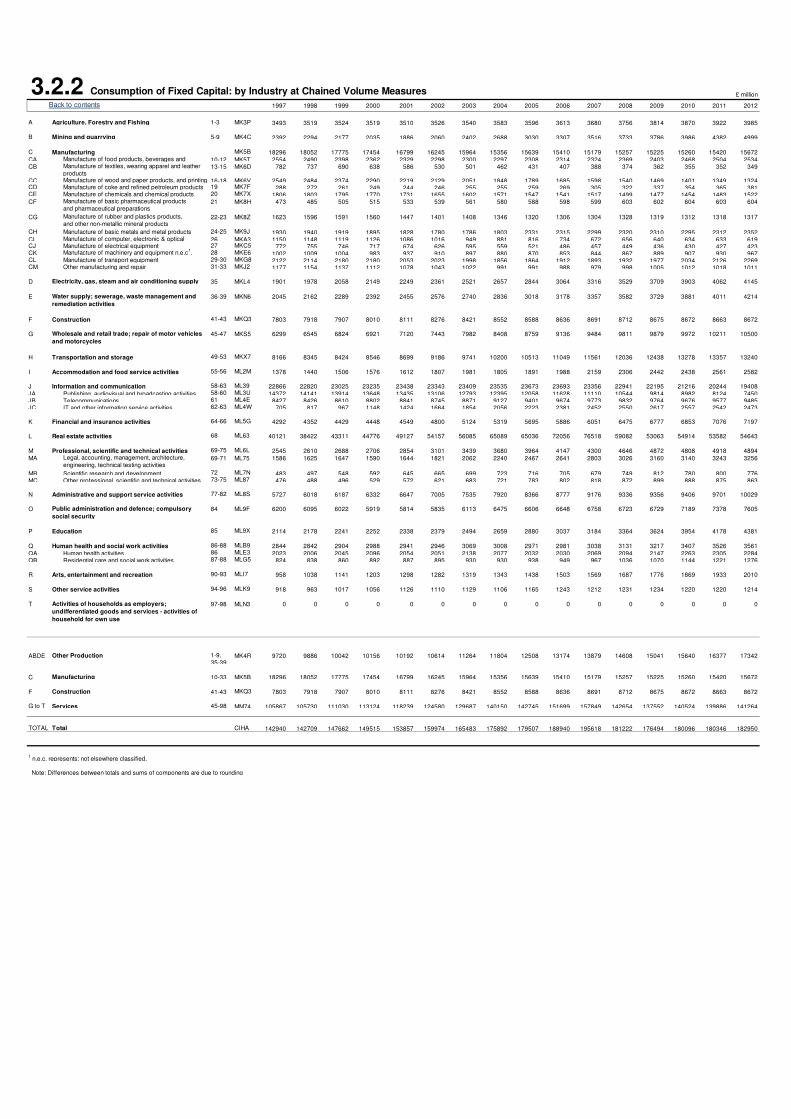
3.2.2 Consumption of Fixed Capital: by Industry at Chained Volume Measures £ million
1997 1998 1999 2000 2001 2002 2003 2004 2005 2006 2007 2008 2009 2010 2011 2012
A Agriculture, Forestry and Fishing 1-3 MK3P 3493 3519 3524 3519 3510 3526 3540 3583 3596 3613 3680 3756 3814 3870 3922 3985
B Mining and quarrying 5-9 MK4C 2392 2294 2177 2035 1886 2060 2402 2688 3030 3307 3516 3733 3786 3986 4382 4999
C Manufacturing MK5B 18296 18052 17775 17454 16799 16245 15964 15356 15639 15410 15179 15257 15225 15260 15420 15672
CA 10-12 MK5T 2554 2490 2398 2362 2329 2298 2300 2297 2308 2314 2324 2369 2403 2468 2504 2534CB 13-15 MK6D 782 737 690 638 586 530 501 462 431 407 388 374 362 355 352 349
CC 16-18 MK6V 2549 2484 2374 2290 2219 2129 2051 1848 1789 1685 1598 1540 1469 1401 1349 1324CD 19 MK7F 288 272 261 249 244 246 255 255 259 269 305 322 337 354 365 381CE 20 MK7X 1806 1803 1795 1770 1731 1655 1602 1571 1547 1541 1517 1499 1477 1454 1483 1522CF 21 MK8H 473 485 505 515 533 539 561 580 588 598 599 603 602 604 603 604
CG 22-23 MK8Z 1623 1596 1591 1560 1447 1401 1408 1346 1320 1306 1304 1328 1319 1312 1318 1317
CH 24-25 MK9J 1930 1940 1919 1895 1828 1780 1786 1803 2331 2315 2299 2320 2310 2295 2312 2352CI 26 MKA3 1150 1148 1119 1126 1086 1016 949 881 816 734 672 656 640 634 633 619CJ 27 MKC5 772 755 746 717 674 626 595 559 521 486 457 449 436 430 427 423CK 28 MKE6 1002 1009 1004 983 937 910 897 880 870 853 844 867 889 907 930 967CL 29-30 MKG8 2122 2114 2180 2180 2053 2023 1998 1856 1864 1912 1893 1932 1977 2034 2126 2269CM 31-33 MKJ2 1177 1154 1137 1112 1078 1043 1022 991 991 988 979 998 1005 1012 1018 1011
D 35 MKL4 1901 1978 2058 2149 2249 2361 2521 2657 2844 3064 3316 3529 3709 3903 4062 4145
E 36-39 MKN6 2045 2162 2289 2392 2455 2576 2740 2836 3018 3178 3357 3582 3729 3881 4011 4214
F Construction 41-43 MKQ3 7803 7918 7907 8010 8111 8276 8421 8552 8588 8636 8691 8712 8675 8672 8663 8672
G 45-47 MKS5 6299 6545 6824 6921 7120 7443 7982 8408 8759 9136 9484 9811 9879 9972 10211 10500
H Transportation and storage 49-53 MKX7 8166 8345 8424 8546 8699 9186 9741 10200 10513 11049 11561 12036 12438 13278 13357 13240
I Accommodation and food service activities 55-56 ML2M 1378 1440 1506 1576 1612 1807 1981 1805 1891 1988 2159 2306 2442 2438 2561 2582
J Information and communication 58-63 ML39 22866 22820 23025 23235 23438 23343 23409 23535 23673 23693 23356 22941 22195 21216 20244 19408
JA Publishing, audiovisual and broadcasting activities 58-60 ML3U 14372 14141 13914 13648 13435 13106 12793 12395 12058 11628 11110 10544 9814 8982 8124 7450JB Telecommunications 61 ML4E 8427 8426 8610 8802 8841 8745 8871 9127 9401 9674 9773 9832 9764 9676 9577 9485JC IT and other information service activities 62-63 ML4W 705 817 967 1148 1424 1664 1854 2056 2223 2381 2452 2550 2617 2557 2542 2473
K Financial and insurance activities 64-66 ML5G 4292 4352 4429 4448 4549 4800 5124 5319 5695 5886 6051 6475 6777 6853 7076 7197
L Real estate activities 68 ML63 40121 38422 43311 44776 49127 54157 56085 65089 65036 72056 76518 59082 53063 54914 53582 54643
M Professional, scientific and technical activities 69-75 ML6L 2545 2610 2688 2706 2854 3101 3439 3680 3964 4147 4300 4646 4872 4808 4918 4894
MA 69-71 ML75 1586 1625 1647 1590 1644 1821 2062 2240 2467 2641 2803 3026 3160 3140 3243 3256
MB Scientific research and development 72 ML7N 483 497 548 592 645 665 699 723 716 705 679 749 812 780 800 776MC Other professional, scientific and technical activities 73-75 ML87 476 488 496 529 572 621 683 721 783 802 818 872 899 888 875 863
N Administrative and support service activities 77-82 ML8S 5727 6018 6187 6332 6647 7005 7535 7920 8366 8777 9176 9336 9356 9406 9701 10029
O 84 ML9F 6200 6095 6022 5919 5814 5835 6113 6475 6606 6648 6758 6723 6729 7189 7378 7605
P Education 85 ML9X 2114 2178 2241 2252 2338 2379 2494 2659 2880 3037 3184 3364 3624 3954 4178 4381
Q Human health and social work activities 86-88 MLB9 2844 2842 2904 2988 2941 2946 3069 3008 2971 2981 3038 3131 3217 3407 3526 3561
QA Human health activities 86 MLE3 2023 2006 2045 2096 2054 2051 2138 2077 2032 2030 2069 2094 2147 2263 2305 2284QB Residential care and social work activities 87-88 MLG5 824 838 860 892 887 895 930 930 938 949 967 1036 1070 1144 1221 1276
R Arts, entertainment and recreation 90-93 MLI7 958 1038 1141 1203 1298 1282 1319 1343 1438 1503 1569 1687 1776 1869 1933 2010
S Other service activities 94-96 MLK9 918 963 1017 1056 1126 1110 1129 1106 1165 1243 1212 1231 1234 1220 1220 1214
T 97-98 MLN3 0 0 0 0 0 0 0 0 0 0 0 0 0 0 0 0
ABDE Other Production 1-9,
35-39MK4R 9720 9886 10042 10156 10192 10614 11264 11804 12508 13174 13879 14608 15041 15640 16377 17342
C Manufacturing 10-33 MK5B 18296 18052 17775 17454 16799 16245 15964 15356 15639 15410 15179 15257 15225 15260 15420 15672
F Construction 41-43 MKQ3 7803 7918 7907 8010 8111 8276 8421 8552 8588 8636 8691 8712 8675 8672 8663 8672
G to T Services 45-98 MM74 105867 105730 111030 113124 118239 124580 129687 140150 142745 151699 157849 142654 137552 140524 139886 141264
TOTAL Total CIHA 142940 142709 147662 149515 153857 159974 165483 175892 179507 188940 195618 181222 176494 180096 180346 182950
1 n.e.c. represents; not elsewhere classified.
Note: Differences between totals and sums of components are due to rounding
Legal, accounting, management, architecture,
engineering, technical testing activities
Public administration and defence; compulsory
social security
Activities of households as employers;
undifferentiated goods and services - activities of
household for own use
Manufacture of machinery and equipment n.e.c1.
Manufacture of transport equipment Other manufacturing and repair
Electricity, gas, steam and air conditioning supply
Water supply; sewerage, waste management and
remediation activities
Wholesale and retail trade; repair of motor vehicles
and motorcycles
Manufacture of electrical equipment
Back to contents
Manufacture of food products, beverages and Manufacture of textiles, wearing apparel and leather
products Manufacture of wood and paper products, and printing Manufacture of coke and refined petroleum products Manufacture of chemicals and chemical products Manufacture of basic pharmaceutical products
and pharmaceutical preparations
Manufacture of rubber and plastics products,
and other non-metallic mineral products
Manufacture of basic metals and metal products Manufacture of computer, electronic & optical
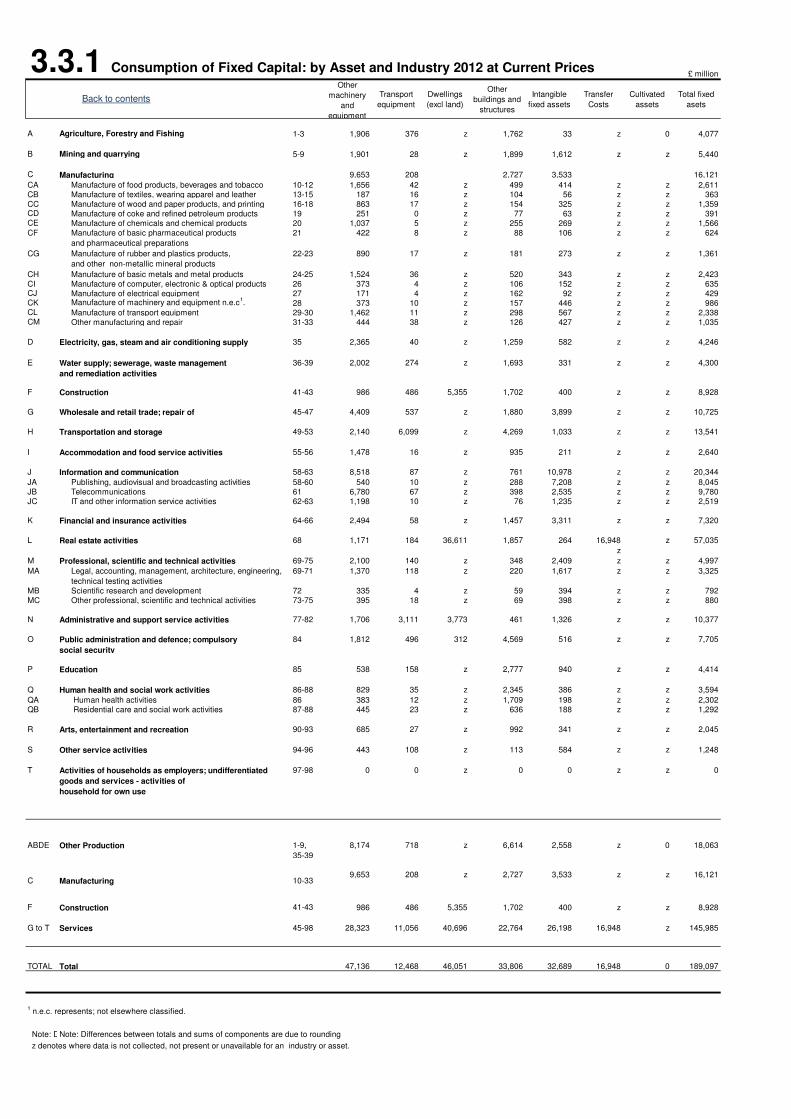
3.3.1 Consumption of Fixed Capital: by Asset and Industry 2012 at Current Prices£ million
Other
machinery
and
equipment
Transport
equipment
Dwellings
(excl land)
Other
buildings and
structures
Intangible
fixed assets
Transfer
Costs
Cultivated
assets
Total fixed
asets
A Agriculture, Forestry and Fishing 1-3 1,906 376 z 1,762 33 z 0 4,077
B Mining and quarrying 5-9 1,901 28 z 1,899 1,612 z z 5,440
C Manufacturing 9,653 208 2,727 3,533 16,121
CA 10-12 1,656 42 z 499 414 z z 2,611
CB 13-15 187 16 z 104 56 z z 363
CC 16-18 863 17 z 154 325 z z 1,359CD 19 251 0 z 77 63 z z 391CE 20 1,037 5 z 255 269 z z 1,566
CF 21 422 8 z 88 106 z z 624
CG 22-23 890 17 z 181 273 z z 1,361
CH 24-25 1,524 36 z 520 343 z z 2,423
CI 26 373 4 z 106 152 z z 635CJ 27 171 4 z 162 92 z z 429CK 28 373 10 z 157 446 z z 986CL 29-30 1,462 11 z 298 567 z z 2,338CM 31-33 444 38 z 126 427 z z 1,035
D 35 2,365 40 z 1,259 582 z z 4,246
E 36-39 2,002 274 z 1,693 331 z z 4,300
F Construction 41-43 986 486 5,355 1,702 400 z z 8,928
G Wholesale and retail trade; repair of 45-47 4,409 537 z 1,880 3,899 z z 10,725
H Transportation and storage 49-53 2,140 6,099 z 4,269 1,033 z z 13,541
I Accommodation and food service activities 55-56 1,478 16 z 935 211 z z 2,640
J Information and communication 58-63 8,518 87 z 761 10,978 z z 20,344
JA Publishing, audiovisual and broadcasting activities 58-60 540 10 z 288 7,208 z z 8,045
JB Telecommunications 61 6,780 67 z 398 2,535 z z 9,780
JC IT and other information service activities 62-63 1,198 10 z 76 1,235 z z 2,519
K Financial and insurance activities 64-66 2,494 58 z 1,457 3,311 z z 7,320
L Real estate activities 68 1,171 184 36,611 1,857 264 16,948 z 57,035
z
M Professional, scientific and technical activities 69-75 2,100 140 z 348 2,409 z z 4,997
MA 69-71 1,370 118 z 220 1,617 z z 3,325
MB Scientific research and development 72 335 4 z 59 394 z z 792
MC Other professional, scientific and technical activities 73-75 395 18 z 69 398 z z 880
N Administrative and support service activities 77-82 1,706 3,111 3,773 461 1,326 z z 10,377
O 84 1,812 496 312 4,569 516 z z 7,705
P Education 85 538 158 z 2,777 940 z z 4,414
Q Human health and social work activities 86-88 829 35 z 2,345 386 z z 3,594
QA Human health activities 86 383 12 z 1,709 198 z z 2,302
QB Residential care and social work activities 87-88 445 23 z 636 188 z z 1,292
R Arts, entertainment and recreation 90-93 685 27 z 992 341 z z 2,045
S Other service activities 94-96 443 108 z 113 584 z z 1,248
T 97-98 0 0 z 0 0 z z 0
ABDE Other Production 1-9,
35-39
8,174 718 z 6,614 2,558 z 0 18,063
C Manufacturing 10-339,653 208 z 2,727 3,533 z z 16,121
F Construction 41-43 986 486 5,355 1,702 400 z z 8,928
G to T Services 45-98 28,323 11,056 40,696 22,764 26,198 16,948 z 145,985
TOTAL Total 47,136 12,468 46,051 33,806 32,689 16,948 0 189,097
1 n.e.c. represents; not elsewhere classified.
Note: DiNote: Differences between totals and sums of components are due to rounding
z denotes where data is not collected, not present or unavailable for an industry or asset.
Activities of households as employers; undifferentiated
goods and services - activities of
household for own use
Manufacture of transport equipment
Other manufacturing and repair
Electricity, gas, steam and air conditioning supply
Water supply; sewerage, waste management
and remediation activities
Legal, accounting, management, architecture, engineering,
technical testing activities
Public administration and defence; compulsory
social security
Manufacture of machinery and equipment n.e.c1.
Back to contents
Manufacture of food products, beverages and tobacco
Manufacture of textiles, wearing apparel and leather
Manufacture of wood and paper products, and printing
Manufacture of coke and refined petroleum products
Manufacture of chemicals and chemical products
Manufacture of basic pharmaceutical products
and pharmaceutical preparations
Manufacture of rubber and plastics products,
and other non-metallic mineral products
Manufacture of basic metals and metal products
Manufacture of computer, electronic & optical products
Manufacture of electrical equipment
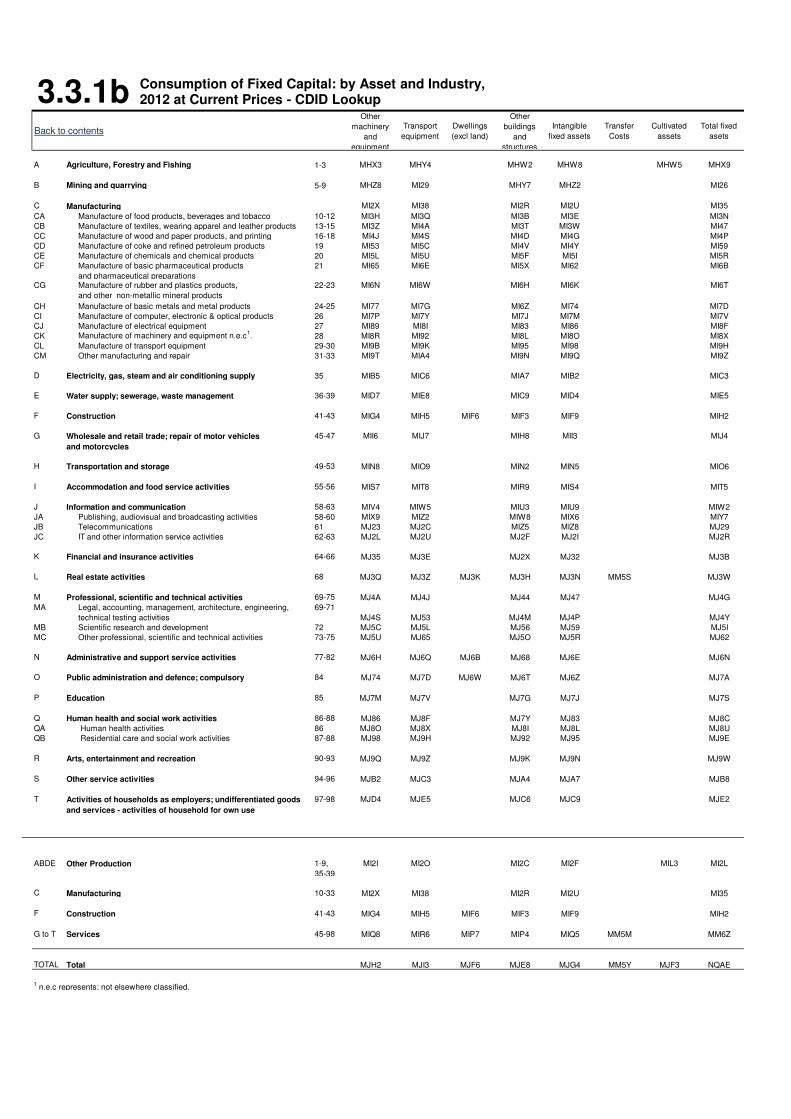
3.3.1bBack to contents
Other
machinery
and
equipment
Transport
equipment
Dwellings
(excl land)
Other
buildings
and
structures
Intangible
fixed assets
Transfer
Costs
Cultivated
assets
Total fixed
asets
A Agriculture, Forestry and Fishing 1-3 MHX3 MHY4 MHW2 MHW8 MHW5 MHX9
B Mining and quarrying 5-9 MHZ8 MI29 MHY7 MHZ2 MI26
C Manufacturing MI2X MI38 MI2R MI2U MI35
CA 10-12 MI3H MI3Q MI3B MI3E MI3N
CB 13-15 MI3Z MI4A MI3T MI3W MI47
CC 16-18 MI4J MI4S MI4D MI4G MI4P
CD 19 MI53 MI5C MI4V MI4Y MI59
CE 20 MI5L MI5U MI5F MI5I MI5R
CF 21 MI65 MI6E MI5X MI62 MI6B
CG 22-23 MI6N MI6W MI6H MI6K MI6T
CH 24-25 MI77 MI7G MI6Z MI74 MI7D
CI 26 MI7P MI7Y MI7J MI7M MI7V
CJ 27 MI89 MI8I MI83 MI86 MI8F
CK 28 MI8R MI92 MI8L MI8O MI8X
CL 29-30 MI9B MI9K MI95 MI98 MI9H
CM 31-33 MI9T MIA4 MI9N MI9Q MI9Z
D 35 MIB5 MIC6 MIA7 MIB2 MIC3
E 36-39 MID7 MIE8 MIC9 MID4 MIE5
F Construction 41-43 MIG4 MIH5 MIF6 MIF3 MIF9 MIH2
G Wholesale and retail trade; repair of motor vehicles
and motorcycles
45-47 MII6 MIJ7 MIH8 MII3 MIJ4
H Transportation and storage 49-53 MIN8 MIO9 MIN2 MIN5 MIO6
I Accommodation and food service activities 55-56 MIS7 MIT8 MIR9 MIS4 MIT5
J Information and communication 58-63 MIV4 MIW5 MIU3 MIU9 MIW2
JA Publishing, audiovisual and broadcasting activities 58-60 MIX9 MIZ2 MIW8 MIX6 MIY7
JB Telecommunications 61 MJ23 MJ2C MIZ5 MIZ8 MJ29
JC IT and other information service activities 62-63 MJ2L MJ2U MJ2F MJ2I MJ2R
K Financial and insurance activities 64-66 MJ35 MJ3E MJ2X MJ32 MJ3B
L Real estate activities 68 MJ3Q MJ3Z MJ3K MJ3H MJ3N MM5S MJ3W
M Professional, scientific and technical activities 69-75 MJ4A MJ4J MJ44 MJ47 MJ4G
MA 69-71
MJ4S MJ53 MJ4M MJ4P MJ4Y
MB Scientific research and development 72 MJ5C MJ5L MJ56 MJ59 MJ5I
MC Other professional, scientific and technical activities 73-75 MJ5U MJ65 MJ5O MJ5R MJ62
N Administrative and support service activities 77-82 MJ6H MJ6Q MJ6B MJ68 MJ6E MJ6N
O 84 MJ74 MJ7D MJ6W MJ6T MJ6Z MJ7A
P Education 85 MJ7M MJ7V MJ7G MJ7J MJ7S
Q Human health and social work activities 86-88 MJ86 MJ8F MJ7Y MJ83 MJ8C
QA Human health activities 86 MJ8O MJ8X MJ8I MJ8L MJ8U
QB Residential care and social work activities 87-88 MJ98 MJ9H MJ92 MJ95 MJ9E
R Arts, entertainment and recreation 90-93 MJ9Q MJ9Z MJ9K MJ9N MJ9W
S Other service activities 94-96 MJB2 MJC3 MJA4 MJA7 MJB8
T 97-98 MJD4 MJE5 MJC6 MJC9 MJE2
ABDE Other Production 1-9,
35-39
MI2I MI2O MI2C MI2F MIL3 MI2L
C Manufacturing 10-33 MI2X MI38 MI2R MI2U MI35
F Construction 41-43 MIG4 MIH5 MIF6 MIF3 MIF9 MIH2
G to T Services 45-98 MIQ8 MIR6 MIP7 MIP4 MIQ5 MM5M MM6Z
TOTAL Total MJH2 MJI3 MJF6 MJE8 MJG4 MM5Y MJF3 NQAE
1 n.e.c represents; not elsewhere classified.
Activities of households as employers; undifferentiated goods
and services - activities of household for own use
Manufacture of rubber and plastics products,
and other non-metallic mineral products
Manufacture of basic metals and metal products
Manufacture of computer, electronic & optical products
Manufacture of electrical equipment
Manufacture of machinery and equipment n.e.c1.
Manufacture of transport equipment
Other manufacturing and repair
Electricity, gas, steam and air conditioning supply
Water supply; sewerage, waste management
Legal, accounting, management, architecture, engineering,
technical testing activities
Public administration and defence; compulsory
Manufacture of basic pharmaceutical products
and pharmaceutical preparations
Manufacture of food products, beverages and tobacco
Manufacture of textiles, wearing apparel and leather products
Manufacture of wood and paper products, and printing
Manufacture of coke and refined petroleum products
Manufacture of chemicals and chemical products
Consumption of Fixed Capital: by Asset and Industry, 2012 at Current Prices - CDID Lookup
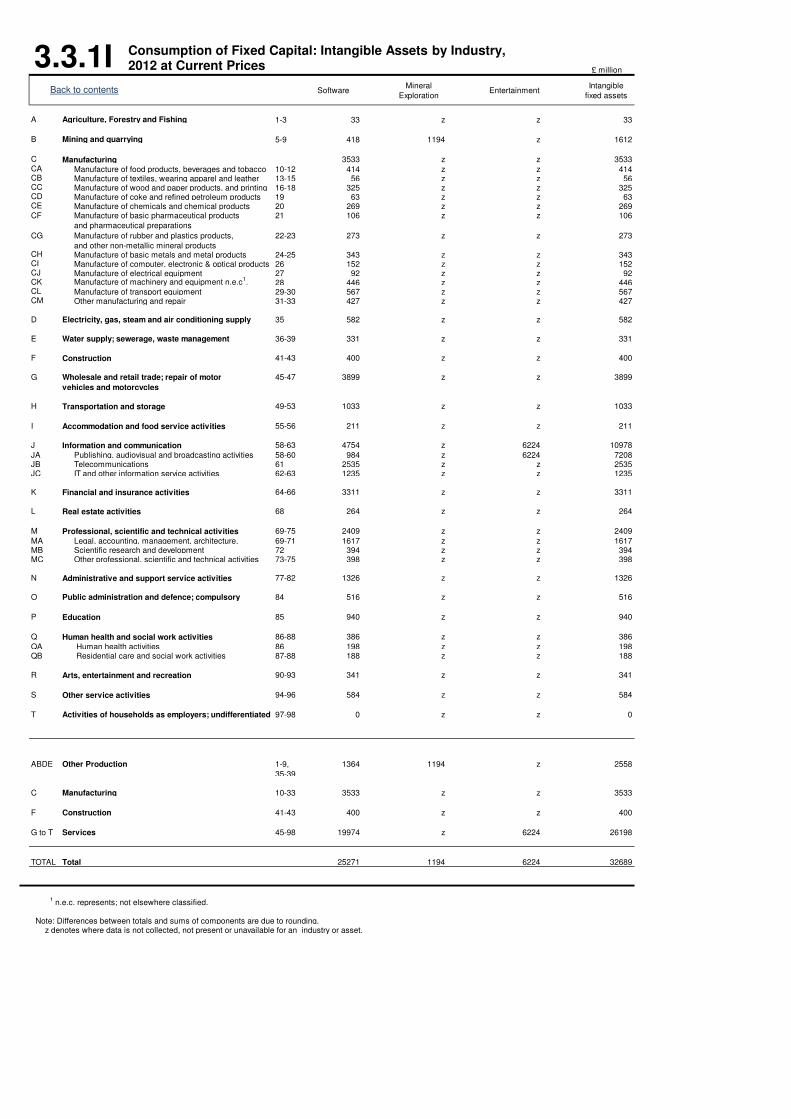
3.3.1I£ million
SoftwareMineral
ExplorationEntertainment
Intangible
fixed assets
A Agriculture, Forestry and Fishing 1-3 33 z z 33
B Mining and quarrying 5-9 418 1194 z 1612
C Manufacturing 3533 z z 3533CA 10-12 414 z z 414CB 13-15 56 z z 56CC 16-18 325 z z 325CD 19 63 z z 63CE 20 269 z z 269CF 21 106 z z 106
CG 22-23 273 z z 273
CH 24-25 343 z z 343CI 26 152 z z 152CJ 27 92 z z 92CK 28 446 z z 446CL 29-30 567 z z 567CM 31-33 427 z z 427
D 35 582 z z 582
E 36-39 331 z z 331
F Construction 41-43 400 z z 400
G Wholesale and retail trade; repair of motor
vehicles and motorcycles
45-47 3899 z z 3899
H Transportation and storage 49-53 1033 z z 1033
I Accommodation and food service activities 55-56 211 z z 211
J Information and communication 58-63 4754 z 6224 10978
JA Publishing, audiovisual and broadcasting activities 58-60 984 z 6224 7208JB Telecommunications 61 2535 z z 2535JC IT and other information service activities 62-63 1235 z z 1235
K Financial and insurance activities 64-66 3311 z z 3311
L Real estate activities 68 264 z z 264
M Professional, scientific and technical activities 69-75 2409 z z 2409
MA 69-71 1617 z z 1617MB Scientific research and development 72 394 z z 394MC Other professional, scientific and technical activities 73-75 398 z z 398
N Administrative and support service activities 77-82 1326 z z 1326
O 84 516 z z 516
P Education 85 940 z z 940
Q Human health and social work activities 86-88 386 z z 386
QA Human health activities 86 198 z z 198QB Residential care and social work activities 87-88 188 z z 188
R Arts, entertainment and recreation 90-93 341 z z 341
S Other service activities 94-96 584 z z 584
T 97-98 0 z z 0
ABDE Other Production 1-9,
35-39
1364 1194 z 2558
C Manufacturing 10-33 3533 z z 3533
F Construction 41-43 400 z z 400
G to T Services 45-98 19974 z 6224 26198
TOTAL Total 25271 1194 6224 32689
1 n.e.c. represents; not elsewhere classified.
Note: Differences between totals and sums of components are due to rounding. z denotes where data is not collected, not present or unavailable for an industry or asset.
Activities of households as employers; undifferentiated
Manufacture of transport equipment Other manufacturing and repair
Electricity, gas, steam and air conditioning supply
Water supply; sewerage, waste management
Legal, accounting, management, architecture,
Public administration and defence; compulsory
Manufacture of machinery and equipment n.e.c1.
Back to contents
Manufacture of food products, beverages and tobacco Manufacture of textiles, wearing apparel and leather Manufacture of wood and paper products, and printing Manufacture of coke and refined petroleum products Manufacture of chemicals and chemical products Manufacture of basic pharmaceutical products
and pharmaceutical preparations
Manufacture of rubber and plastics products,
and other non-metallic mineral products Manufacture of basic metals and metal products Manufacture of computer, electronic & optical products Manufacture of electrical equipment
Consumption of Fixed Capital: Intangible Assets by Industry, 2012 at Current Prices
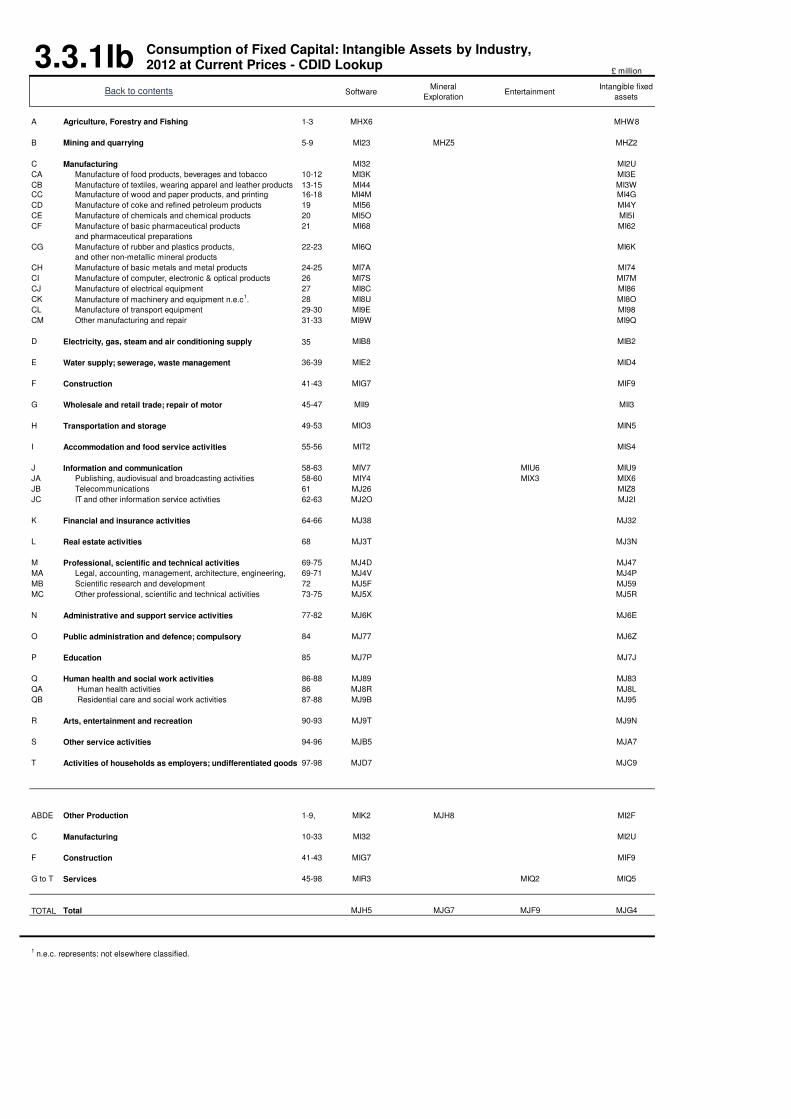
£ million
SoftwareMineral
ExplorationEntertainment
Intangible fixed
assets
A Agriculture, Forestry and Fishing 1-3 MHX6 MHW8
B Mining and quarrying 5-9 MI23 MHZ5 MHZ2
C Manufacturing MI32 MI2U
CA 10-12 MI3K MI3E
CB 13-15 MI44 MI3W
CC 16-18 MI4M MI4G
CD 19 MI56 MI4Y
CE 20 MI5O MI5I
CF 21 MI68 MI62
CG 22-23 MI6Q MI6K
CH 24-25 MI7A MI74
CI 26 MI7S MI7M
CJ 27 MI8C MI86
CK 28 MI8U MI8O
CL 29-30 MI9E MI98
CM 31-33 MI9W MI9Q
D 35 MIB8 MIB2
E 36-39 MIE2 MID4
F Construction 41-43 MIG7 MIF9
G Wholesale and retail trade; repair of motor 45-47 MII9 MII3
H Transportation and storage 49-53 MIO3 MIN5
I Accommodation and food service activities 55-56 MIT2 MIS4
J Information and communication 58-63 MIV7 MIU6 MIU9
JA Publishing, audiovisual and broadcasting activities 58-60 MIY4 MIX3 MIX6
JB Telecommunications 61 MJ26 MIZ8
JC IT and other information service activities 62-63 MJ2O MJ2I
K Financial and insurance activities 64-66 MJ38 MJ32
L Real estate activities 68 MJ3T MJ3N
M Professional, scientific and technical activities 69-75 MJ4D MJ47
MA 69-71 MJ4V MJ4P
MB Scientific research and development 72 MJ5F MJ59
MC Other professional, scientific and technical activities 73-75 MJ5X MJ5R
N Administrative and support service activities 77-82 MJ6K MJ6E
O 84 MJ77 MJ6Z
P Education 85 MJ7P MJ7J
Q Human health and social work activities 86-88 MJ89 MJ83
QA Human health activities 86 MJ8R MJ8L
QB Residential care and social work activities 87-88 MJ9B MJ95
R Arts, entertainment and recreation 90-93 MJ9T MJ9N
S Other service activities 94-96 MJB5 MJA7
T 97-98 MJD7 MJC9
ABDE Other Production 1-9, MIK2 MJH8 MI2F
C Manufacturing 10-33 MI32 MI2U
F Construction 41-43 MIG7 MIF9
G to T Services 45-98 MIR3 MIQ2 MIQ5
TOTAL Total MJH5 MJG7 MJF9 MJG4
1 n.e.c. represents; not elsewhere classified.
Public administration and defence; compulsory
Activities of households as employers; undifferentiated goods
Manufacture of machinery and equipment n.e.c1.
Manufacture of transport equipment
Other manufacturing and repair
Electricity, gas, steam and air conditioning supply
Water supply; sewerage, waste management
Legal, accounting, management, architecture, engineering,
Manufacture of electrical equipment
3.3.1IbBack to contents
Manufacture of food products, beverages and tobacco
Manufacture of textiles, wearing apparel and leather products
Manufacture of wood and paper products, and printing
Manufacture of coke and refined petroleum products
Manufacture of chemicals and chemical products
Manufacture of basic pharmaceutical products
and pharmaceutical preparations
Manufacture of rubber and plastics products,
and other non-metallic mineral products
Manufacture of basic metals and metal products
Manufacture of computer, electronic & optical products
Consumption of Fixed Capital: Intangible Assets by Industry, 2012 at Current Prices - CDID Lookup
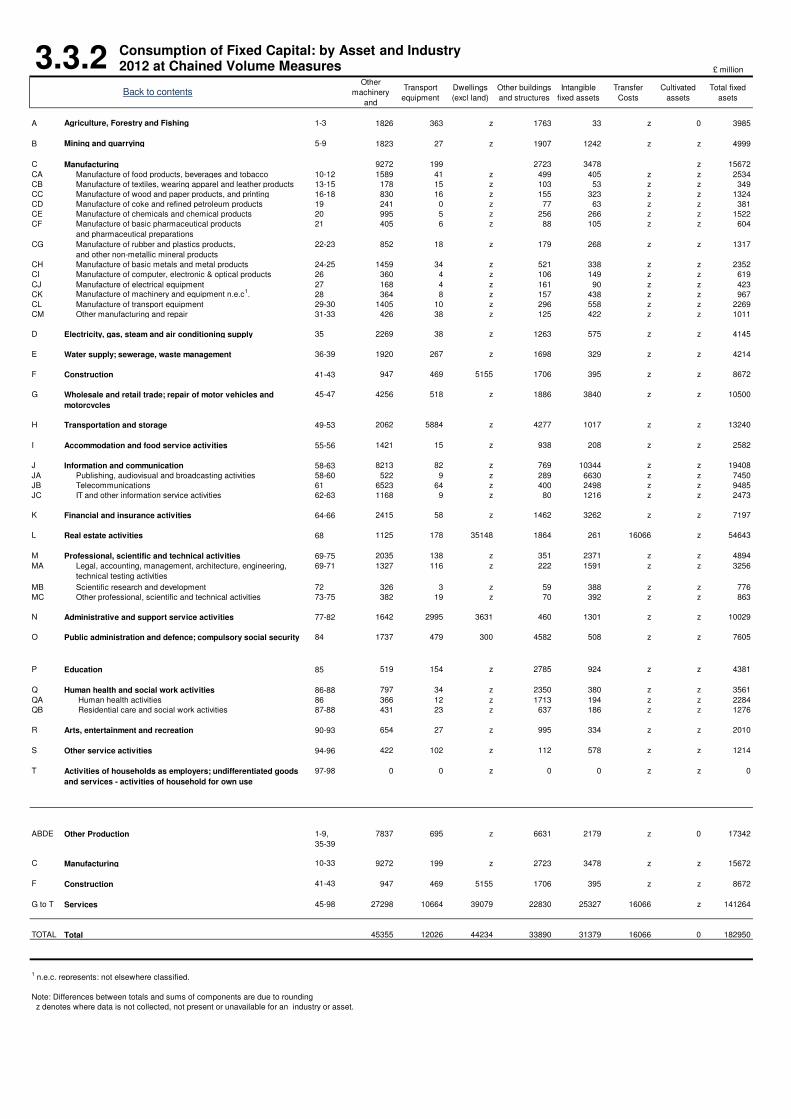
3.3.2£ million
Other
machinery
and
Transport
equipment
Dwellings
(excl land)
Other buildings
and structures
Intangible
fixed assets
Transfer
Costs
Cultivated
assets
Total fixed
asets
A Agriculture, Forestry and Fishing 1-3 1826 363 z 1763 33 z 0 3985
B Mining and quarrying 5-9 1823 27 z 1907 1242 z z 4999
C Manufacturing 9272 199 2723 3478 z 15672
CA 10-12 1589 41 z 499 405 z z 2534
CB 13-15 178 15 z 103 53 z z 349
CC 16-18 830 16 z 155 323 z z 1324
CD 19 241 0 z 77 63 z z 381
CE 20 995 5 z 256 266 z z 1522
CF 21 405 6 z 88 105 z z 604
CG 22-23 852 18 z 179 268 z z 1317
CH 24-25 1459 34 z 521 338 z z 2352
CI 26 360 4 z 106 149 z z 619
CJ 27 168 4 z 161 90 z z 423
CK 28 364 8 z 157 438 z z 967
CL 29-30 1405 10 z 296 558 z z 2269
CM 31-33 426 38 z 125 422 z z 1011
D 35 2269 38 z 1263 575 z z 4145
E 36-39 1920 267 z 1698 329 z z 4214
F Construction 41-43 947 469 5155 1706 395 z z 8672
G Wholesale and retail trade; repair of motor vehicles and
motorcycles
45-47 4256 518 z 1886 3840 z z 10500
H Transportation and storage 49-53 2062 5884 z 4277 1017 z z 13240
I Accommodation and food service activities 55-56 1421 15 z 938 208 z z 2582
J Information and communication 58-63 8213 82 z 769 10344 z z 19408
JA Publishing, audiovisual and broadcasting activities 58-60 522 9 z 289 6630 z z 7450
JB Telecommunications 61 6523 64 z 400 2498 z z 9485
JC IT and other information service activities 62-63 1168 9 z 80 1216 z z 2473
K Financial and insurance activities 64-66 2415 58 z 1462 3262 z z 7197
L Real estate activities 68 1125 178 35148 1864 261 16066 z 54643
M Professional, scientific and technical activities 69-75 2035 138 z 351 2371 z z 4894
MA 69-71 1327 116 z 222 1591 z z 3256
MB Scientific research and development 72 326 3 z 59 388 z z 776
MC Other professional, scientific and technical activities 73-75 382 19 z 70 392 z z 863
N Administrative and support service activities 77-82 1642 2995 3631 460 1301 z z 10029
O 84 1737 479 300 4582 508 z z 7605
P Education 85 519 154 z 2785 924 z z 4381
Q Human health and social work activities 86-88 797 34 z 2350 380 z z 3561
QA Human health activities 86 366 12 z 1713 194 z z 2284
QB Residential care and social work activities 87-88 431 23 z 637 186 z z 1276
R Arts, entertainment and recreation 90-93 654 27 z 995 334 z z 2010
S Other service activities 94-96 422 102 z 112 578 z z 1214
T 97-98 0 0 z 0 0 z z 0
ABDE Other Production 1-9,
35-39
7837 695 z 6631 2179 z 0 17342
C Manufacturing 10-33 9272 199 z 2723 3478 z z 15672
F Construction 41-43 947 469 5155 1706 395 z z 8672
G to T Services 45-98 27298 10664 39079 22830 25327 16066 z 141264
TOTAL Total 45355 12026 44234 33890 31379 16066 0 182950
1 n.e.c. represents; not elsewhere classified.
Note: Differences between totals and sums of components are due to rounding
z denotes where data is not collected, not present or unavailable for an industry or asset.
Activities of households as employers; undifferentiated goods
and services - activities of household for own use
Manufacture of transport equipment
Other manufacturing and repair
Electricity, gas, steam and air conditioning supply
Water supply; sewerage, waste management
Legal, accounting, management, architecture, engineering,
technical testing activities
Public administration and defence; compulsory social security
Manufacture of machinery and equipment n.e.c1.
Back to contents
Manufacture of food products, beverages and tobacco
Manufacture of textiles, wearing apparel and leather products
Manufacture of wood and paper products, and printing
Manufacture of coke and refined petroleum products
Manufacture of chemicals and chemical products
Manufacture of basic pharmaceutical products
and pharmaceutical preparations
Manufacture of rubber and plastics products,
and other non-metallic mineral products
Manufacture of basic metals and metal products
Manufacture of computer, electronic & optical products
Manufacture of electrical equipment
Consumption of Fixed Capital: by Asset and Industry 2012 at Chained Volume Measures

3.3.2bBack to contents
Other
machinery
and
equipment
Transport
equipment
Dwellings
(excl land)
Other
buildings
and
structures
Intangible
fixed assets
Transfer
Costs
Cultivated
assets
Total fixed
asets
A Agriculture, Forestry and Fishing 1-3 MK3J MK3S MK3A MK3G MK3D MK3P
B Mining and quarrying 5-9 MK46 MK4F MK3V MK3Y MK4C
C Manufacturing MK55 MK5E MK4X MK52 MK5B
CA 10-12 MK5N MK5W MK5H MK5K MK5TCB 13-15 MK67 MK6G MK5Z MK64 MK6DCC 16-18 MK6P MK6Y MK6J MK6M MK6VCD 19 MK79 MK7I MK73 MK76 MK7FCE 20 MK7R MK82 MK7L MK7O MK7X
CF 21 MK8B MK8K MK85 MK88 MK8H
CG 22-23 MK8T MK94 MK8N MK8Q MK8Z
CH 24-25 MK9D MK9M MK97 MK9A MK9JCI 26 MK9V MKA6 MK9P MK9S MKA3CJ 27 MKB7 MKC8 MKA9 MKB4 MKC5CK 28 MKD8 MKE9 MKD2 MKD5 MKE6CL 29-30 MKG2 MKH3 MKF4 MKF7 MKG8CM 31-33 MKI4 MKJ5 MKH6 MKH9 MKJ2
D 35 MKK6 MKL7 MKJ8 MKK3 MKL4
E 36-39 MKM8 MKN9 MKM2 MKM5 MKN6
F Construction 41-43 MKP5 MKQ6 MKO7 MKO4 MKP2 MKQ3
G Wholesale and retail trade; repair of motor vehicles and
motorcycles
45-47 MKR7 MKS8 MKQ9 MKR4 MKS5
H Transportation and storage 49-53 MKW9 MKY2 MKW3 MKW6 MKX7
I Accommodation and food service activities 55-56 ML2G ML2P ML2A ML2D ML2M
J Information and communication 58-63 ML33 ML3C ML2S ML2Y ML39
JA Publishing, audiovisual and broadcasting activities 58-60 ML3O ML3X ML3F ML3L ML3U
JB Telecommunications 61 ML48 ML4H ML42 ML45 ML4E
JC IT and other information service activities 62-63 ML4Q ML4Z ML4K ML4N ML4W
K Financial and insurance activities 64-66 ML5A ML5J ML54 ML57 ML5G
L Real estate activities 68 ML5V ML66 ML5P ML5M ML5S MM6I ML63
M Professional, scientific and technical activities 69-75 ML6F ML6O ML69 ML6C ML6L
MA 69-71 ML6X ML78 ML6R ML6U ML75
MB Scientific research and development 72 ML7H ML7Q ML7B ML7E ML7N
MC Other professional, scientific and technical activities 73-75 ML7Z ML8A ML7T ML7W ML87
N Administrative and support service activities 77-82 ML8M ML8V ML8G ML8D ML8J ML8S
O 84 ML99 ML9I ML93 ML8Y ML96 ML9F
P Education 85 ML9R MLA2 ML9L ML9O ML9X
Q Human health and social work activities 86-88 MLB3 MLC4 MLA5 MLA8 MLB9
QA Human health activities 86 MLD5 MLE6 MLC7 MLD2 MLE3
QB Residential care and social work activities 87-88 MLF7 MLG8 MLE9 MLF4 MLG5
R Arts, entertainment and recreation 90-93 MLH9 MLJ2 MLH3 MLH6 MLI7
S Other service activities 94-96 MLK3 MLL4 MLJ5 MLJ8 MLK9
T 97-98 MLM5 MLN6 MLL7 MLM2 MLN3
ABDE Other Production
1-9,
35-39MK4O MK4U MK4I MK4L MIL4 MK4R
C Manufacturing 10-33 MK55 MK5E MK4X MK52 MK5B
F Construction 41-43 MKP5 MKQ6 MKO7 MKO4 MKP2 MKQ3
G to T Services 45-98 MKZ9 ML27 MKY8 MKY5 MKZ6 MM6C MM74
TOTAL Total MLQ3 MLR4 MLO7 MLN9 MLP5 MM6O MLO4 CIHA
1 n.e.c represents; not elsewhere classified.
Activities of households as employers; undifferentiated goods
and services - activities of household for own use
Manufacture of rubber and plastics products, and other
non-metallic mineral products
Manufacture of basic metals and metal products Manufacture of computer, electronic & optical products Manufacture of electrical equipment Manufacture of machinery and equipment n.e.c
1.
Manufacture of transport equipment Other manufacturing and repair
Electricity, gas, steam and air conditioning supply
Water supply; sewerage, waste management
Legal, accounting, management, architecture, engineering,
technical testing activities
Public administration and defence; compulsory
Manufacture of basic pharmaceutical products and
pharmaceutical preparations
Manufacture of food products, beverages and tobacco Manufacture of textiles, wearing apparel and leather products Manufacture of wood and paper products, and printing Manufacture of coke and refined petroleum products Manufacture of chemicals and chemical products
Consumption of Fixed Capital: by Asset and Industry 2012 at Chained Volume Measures - CDID Lookup
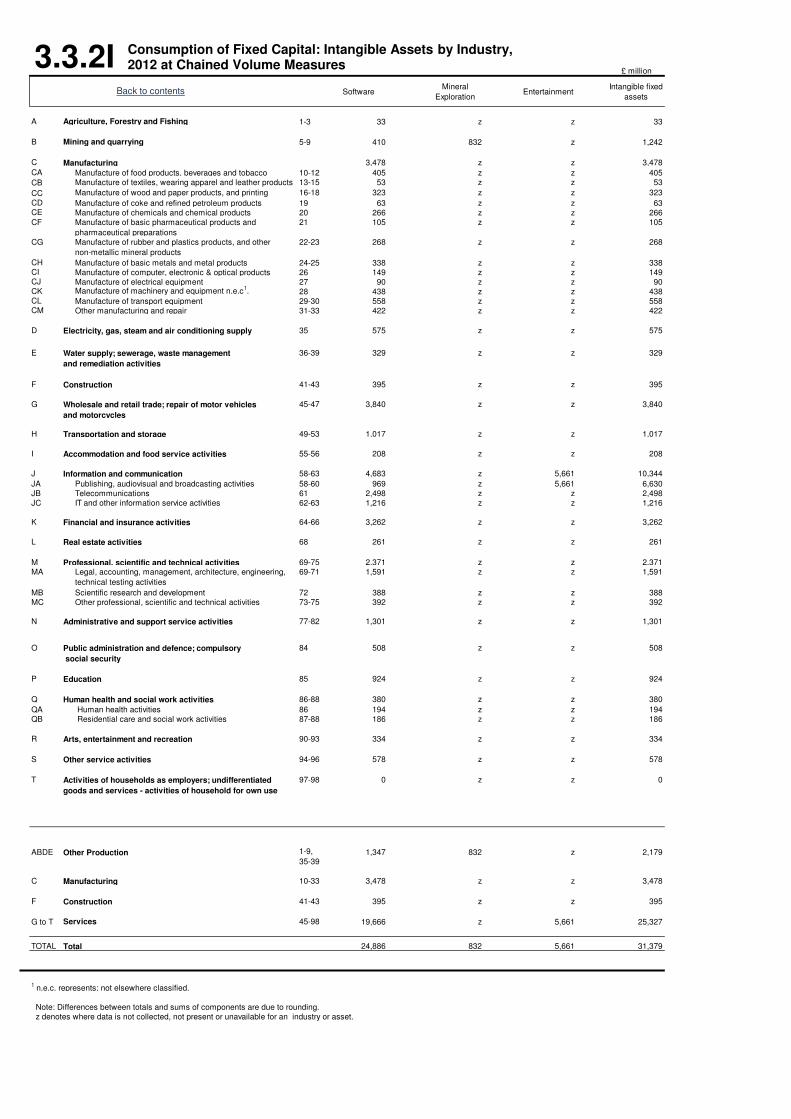
£ million
SoftwareMineral
ExplorationEntertainment
Intangible fixed
assets
A Agriculture, Forestry and Fishing 1-3 33 z z 33
B Mining and quarrying 5-9 410 832 z 1,242
C Manufacturing 3,478 z z 3,478
CA 10-12 405 z z 405
CB 13-15 53 z z 53
CC 16-18 323 z z 323
CD 19 63 z z 63CE 20 266 z z 266
CF 21 105 z z 105
CG 22-23 268 z z 268
CH 24-25 338 z z 338CI 26 149 z z 149CJ 27 90 z z 90CK 28 438 z z 438CL 29-30 558 z z 558CM 31-33 422 z z 422
D 35 575 z z 575
E 36-39 329 z z 329
F Construction 41-43 395 z z 395
G Wholesale and retail trade; repair of motor vehicles
and motorcycles
45-47 3,840 z z 3,840
H Transportation and storage 49-53 1,017 z z 1,017
I Accommodation and food service activities 55-56 208 z z 208
J Information and communication 58-63 4,683 z 5,661 10,344
JA Publishing, audiovisual and broadcasting activities 58-60 969 z 5,661 6,630
JB Telecommunications 61 2,498 z z 2,498
JC IT and other information service activities 62-63 1,216 z z 1,216
K Financial and insurance activities 64-66 3,262 z z 3,262
L Real estate activities 68 261 z z 261
M Professional, scientific and technical activities 69-75 2,371 z z 2,371
MA 69-71 1,591 z z 1,591
MB Scientific research and development 72 388 z z 388
MC Other professional, scientific and technical activities 73-75 392 z z 392
N Administrative and support service activities 77-82 1,301 z z 1,301
O 84 508 z z 508
P Education 85 924 z z 924
Q Human health and social work activities 86-88 380 z z 380
QA Human health activities 86 194 z z 194
QB Residential care and social work activities 87-88 186 z z 186
R Arts, entertainment and recreation 90-93 334 z z 334
S Other service activities 94-96 578 z z 578
T 97-98 0 z z 0
ABDE Other Production 1-9,
35-391,347 832 z 2,179
C Manufacturing 10-33 3,478 z z 3,478
F Construction 41-43 395 z z 395
G to T Services 45-98 19,666 z 5,661 25,327
z z z zTOTAL Total 24,886 832 5,661 31,379
1 n.e.c. represents; not elsewhere classified.
Note: Differences between totals and sums of components are due to rounding.
z denotes where data is not collected, not present or unavailable for an industry or asset.
Public administration and defence; compulsory
social security
Activities of households as employers; undifferentiated
goods and services - activities of household for own use
Manufacture of machinery and equipment n.e.c1.
Manufacture of transport equipment
Other manufacturing and repair
Electricity, gas, steam and air conditioning supply
Water supply; sewerage, waste management
and remediation activities
Legal, accounting, management, architecture, engineering,
technical testing activities
Manufacture of electrical equipment
3.3.2IBack to contents
Manufacture of food products, beverages and tobacco
Manufacture of textiles, wearing apparel and leather products
Manufacture of wood and paper products, and printing
Manufacture of coke and refined petroleum products
Manufacture of chemicals and chemical products
Manufacture of basic pharmaceutical products and
pharmaceutical preparations
Manufacture of rubber and plastics products, and other
non-metallic mineral products
Manufacture of basic metals and metal products
Manufacture of computer, electronic & optical products
Consumption of Fixed Capital: Intangible Assets by Industry, 2012 at Chained Volume Measures
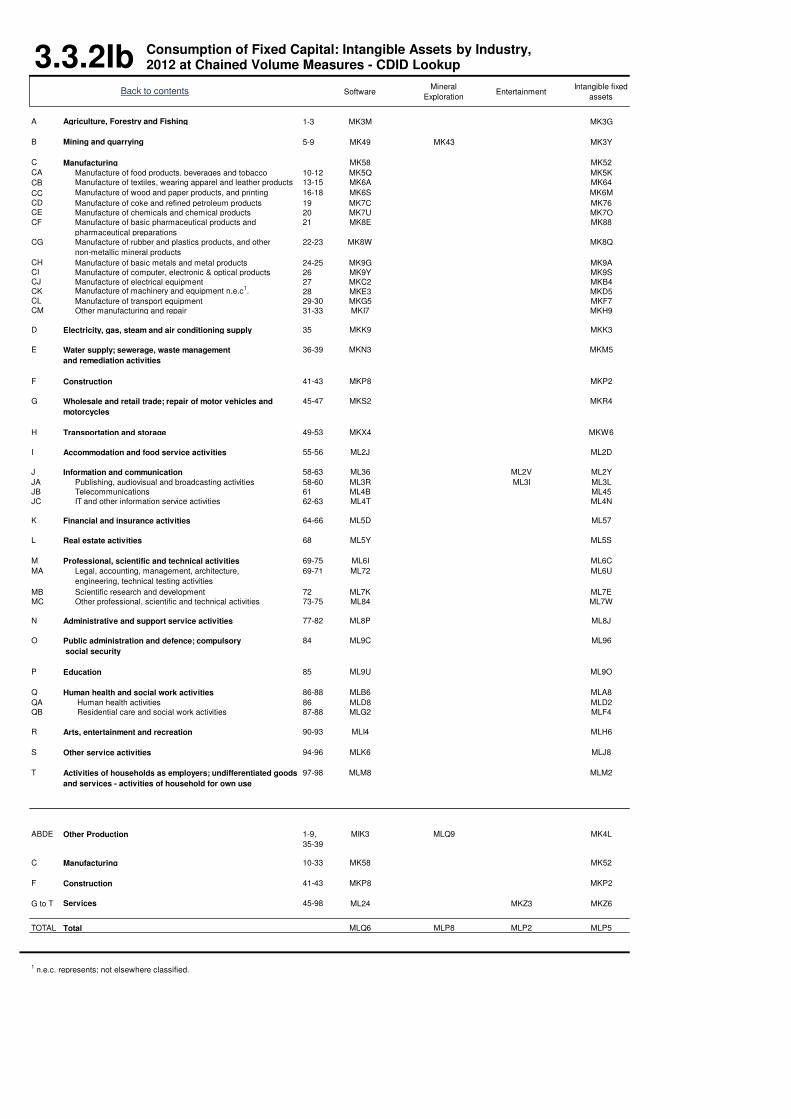
SoftwareMineral
ExplorationEntertainment
Intangible fixed
assets
A Agriculture, Forestry and Fishing 1-3 MK3M MK3G
B Mining and quarrying 5-9 MK49 MK43 MK3Y
C Manufacturing MK58 MK52
CA 10-12 MK5Q MK5K
CB 13-15 MK6A MK64
CC 16-18 MK6S MK6M
CD 19 MK7C MK76CE 20 MK7U MK7O
CF 21 MK8E MK88
CG 22-23 MK8W MK8Q
CH 24-25 MK9G MK9ACI 26 MK9Y MK9SCJ 27 MKC2 MKB4CK 28 MKE3 MKD5CL 29-30 MKG5 MKF7CM 31-33 MKI7 MKH9
D 35 MKK9 MKK3
E 36-39 MKN3 MKM5
F Construction 41-43 MKP8 MKP2
G Wholesale and retail trade; repair of motor vehicles and
motorcycles
45-47 MKS2 MKR4
H Transportation and storage 49-53 MKX4 MKW6
I Accommodation and food service activities 55-56 ML2J ML2D
J Information and communication 58-63 ML36 ML2V ML2Y
JA Publishing, audiovisual and broadcasting activities 58-60 ML3R ML3I ML3L
JB Telecommunications 61 ML4B ML45
JC IT and other information service activities 62-63 ML4T ML4N
K Financial and insurance activities 64-66 ML5D ML57
L Real estate activities 68 ML5Y ML5S
M Professional, scientific and technical activities 69-75 ML6I ML6C
MA 69-71 ML72 ML6U
MB Scientific research and development 72 ML7K ML7E
MC Other professional, scientific and technical activities 73-75 ML84 ML7W
N Administrative and support service activities 77-82 ML8P ML8J
O 84 ML9C ML96
P Education 85 ML9U ML9O
Q Human health and social work activities 86-88 MLB6 MLA8
QA Human health activities 86 MLD8 MLD2
QB Residential care and social work activities 87-88 MLG2 MLF4
R Arts, entertainment and recreation 90-93 MLI4 MLH6
S Other service activities 94-96 MLK6 MLJ8
T 97-98 MLM8 MLM2
ABDE Other Production 1-9,
35-39
MIK3 MLQ9 MK4L
C Manufacturing 10-33 MK58 MK52
F Construction 41-43 MKP8 MKP2
G to T Services 45-98 ML24 MKZ3 MKZ6
TOTAL Total MLQ6 MLP8 MLP2 MLP5
1 n.e.c. represents; not elsewhere classified.
Public administration and defence; compulsory
social security
Activities of households as employers; undifferentiated goods
and services - activities of household for own use
Manufacture of machinery and equipment n.e.c1.
Manufacture of transport equipment
Other manufacturing and repair
Electricity, gas, steam and air conditioning supply
Water supply; sewerage, waste management
and remediation activities
Legal, accounting, management, architecture,
engineering, technical testing activities
Manufacture of electrical equipment
3.3.2IbBack to contents
Manufacture of food products, beverages and tobacco
Manufacture of textiles, wearing apparel and leather products
Manufacture of wood and paper products, and printing
Manufacture of coke and refined petroleum products
Manufacture of chemicals and chemical products
Manufacture of basic pharmaceutical products and
pharmaceutical preparations
Manufacture of rubber and plastics products, and other
non-metallic mineral products
Manufacture of basic metals and metal products
Manufacture of computer, electronic & optical products
Consumption of Fixed Capital: Intangible Assets by Industry, 2012 at Chained Volume Measures - CDID Lookup
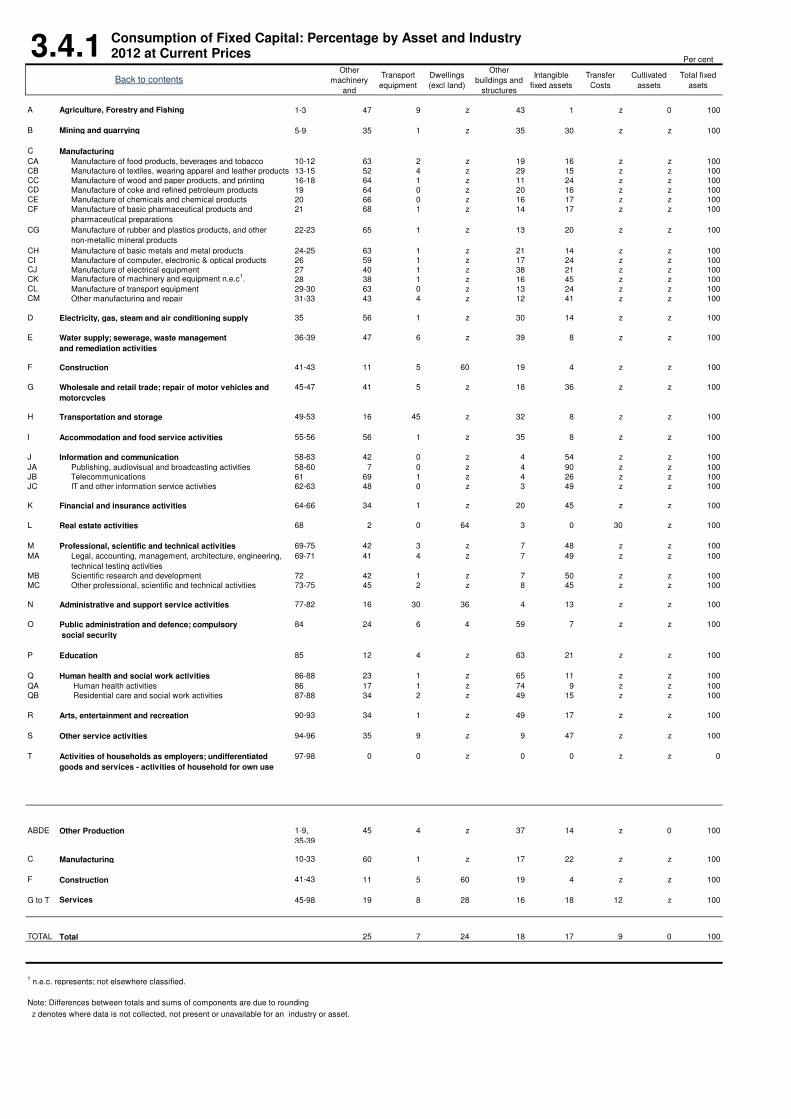
3.4.1Per cent
Other
machinery
and
Transport
equipment
Dwellings
(excl land)
Other
buildings and
structures
Intangible
fixed assets
Transfer
Costs
Cultivated
assets
Total fixed
asets
A Agriculture, Forestry and Fishing 1-3 47 9 z 43 1 z 0 100
B Mining and quarrying 5-9 35 1 z 35 30 z z 100
C Manufacturing
CA 10-12 63 2 z 19 16 z z 100
CB 13-15 52 4 z 29 15 z z 100
CC 16-18 64 1 z 11 24 z z 100CD 19 64 0 z 20 16 z z 100
CE 20 66 0 z 16 17 z z 100
CF 21 68 1 z 14 17 z z 100
CG 22-23 65 1 z 13 20 z z 100
CH 24-25 63 1 z 21 14 z z 100
CI 26 59 1 z 17 24 z z 100CJ 27 40 1 z 38 21 z z 100CK 28 38 1 z 16 45 z z 100CL 29-30 63 0 z 13 24 z z 100CM 31-33 43 4 z 12 41 z z 100
D 35 56 1 z 30 14 z z 100
E 36-39 47 6 z 39 8 z z 100
F Construction 41-43 11 5 60 19 4 z z 100
G Wholesale and retail trade; repair of motor vehicles and
motorcycles
45-47 41 5 z 18 36 z z 100
H Transportation and storage 49-53 16 45 z 32 8 z z 100
I Accommodation and food service activities 55-56 56 1 z 35 8 z z 100
J Information and communication 58-63 42 0 z 4 54 z z 100
JA Publishing, audiovisual and broadcasting activities 58-60 7 0 z 4 90 z z 100
JB Telecommunications 61 69 1 z 4 26 z z 100
JC IT and other information service activities 62-63 48 0 z 3 49 z z 100
K Financial and insurance activities 64-66 34 1 z 20 45 z z 100
L Real estate activities 68 2 0 64 3 0 30 z 100
M Professional, scientific and technical activities 69-75 42 3 z 7 48 z z 100
MA 69-71 41 4 z 7 49 z z 100
MB Scientific research and development 72 42 1 z 7 50 z z 100
MC Other professional, scientific and technical activities 73-75 45 2 z 8 45 z z 100
N Administrative and support service activities 77-82 16 30 36 4 13 z z 100
O 84 24 6 4 59 7 z z 100
P Education 85 12 4 z 63 21 z z 100
Q Human health and social work activities 86-88 23 1 z 65 11 z z 100
QA Human health activities 86 17 1 z 74 9 z z 100
QB Residential care and social work activities 87-88 34 2 z 49 15 z z 100
R Arts, entertainment and recreation 90-93 34 1 z 49 17 z z 100
S Other service activities 94-96 35 9 z 9 47 z z 100
T 97-98 0 0 z 0 0 z z 0
ABDE Other Production 1-9,
35-39
45 4 z 37 14 z 0 100
C Manufacturing 10-33 60 1 z 17 22 z z 100
F Construction 41-43 11 5 60 19 4 z z 100
G to T Services 45-98 19 8 28 16 18 12 z 100
TOTAL Total 25 7 24 18 17 9 0 100
1 n.e.c. represents; not elsewhere classified.
Note: Differences between totals and sums of components are due to rounding
z denotes where data is not collected, not present or unavailable for an industry or asset.
Activities of households as employers; undifferentiated
goods and services - activities of household for own use
Manufacture of transport equipment
Other manufacturing and repair
Electricity, gas, steam and air conditioning supply
Water supply; sewerage, waste management
and remediation activities
Legal, accounting, management, architecture, engineering,
technical testing activities
Public administration and defence; compulsory
social security
Manufacture of machinery and equipment n.e.c1.
Back to contents
Manufacture of food products, beverages and tobacco
Manufacture of textiles, wearing apparel and leather products
Manufacture of wood and paper products, and printing
Manufacture of coke and refined petroleum products
Manufacture of chemicals and chemical products
Manufacture of basic pharmaceutical products and
pharmaceutical preparations
Manufacture of rubber and plastics products, and other
non-metallic mineral products
Manufacture of basic metals and metal products
Manufacture of computer, electronic & optical products
Manufacture of electrical equipment
Consumption of Fixed Capital: Percentage by Asset and Industry 2012 at Current Prices

3.4.1bOther
machinery
and
Transport
equipment
Dwellings
(excl land)
Other
buildings and
structures
Intangible
fixed assets
Transfer
Costs
Cultivated
assets
Total fixed
asets
A Agriculture, Forestry and Fishing 1-3 MNZ7 MO2A MNY6 MNZ4 MNY9 MO25
B Mining and quarrying 5-9 MO2O MO32 MO2F MO2I MO2V
C Manufacturing MO3B MO3N MO35 MO38 MO3I
CA 10-12 MO3Y MO4C MO3S MO3V MO47
CB 13-15 MO4L MO4X MO4F MO4I MO4S
CC 16-18 MO58 MO5K MO52 MO55 MO5F
CD 19 MO5T MO67 MO5N MO5Q MO62
CE 20 MO6G MO6S MO6A MO6D MO6N
CF 21 MO73 MO7F MO6V MO6Y MO7A
CG 22-23 MO7O MO82 MO7I MO7L MO7V
CH 24-25 MO8B MO8N MO85 MO88 MO8I
CI 26 MO8W MO9A MO8Q MO8T MO95
CJ 27 MO9J MO9V MO9D MO9G MO9Q
CK 28 MOA6 MOBJ MO9Y MOA3 MOB5
CL 29-30 MOD2 MOE5 MOC4 MOC7 MOD9
CM 31-33 MOF5 MOG9 MOE8 MOF2 MOG4
D 35 MOH9 MOJ5 MOH3 MOH6 MOI8
E 36-39 MOK6 MOM2 MOJ8 MOK3 MOL5
F Construction 41-43 MON5 MOO9 MOM8 MOM5 MON2 MOO4
G Wholesale and retail trade; repair of motor vehicles and
motorcycles
45-47 MOQ4 MOR8 MOP6 MOP9 MOR3
H Transportation and storage 49-53 MOW9 MOY5 MOW3 MOW6 MOX8
I Accommodation and food service activities 55-56 MOZ8 MP2B MOZ2 MOZ5 MP26
J Information and communication 58-63 MP2P MP33 MP2G MP2M MP2W
JA Publishing, audiovisual and broadcasting activities 58-60 MP3H MP3T MP38 MP3E MP3O
JB Telecommunications 61 MP44 MP4G MP3W MP3Z MP4B
JC IT and other information service activities 62-63 MP4P MP53 MP4J MP4M MP4W
K Financial and insurance activities 64-66 MP5C MP5O MP56 MP59 MP5J
L Real estate activities 68 MP64 MP6H MP5W MP5T MP5Z MP6A MP6C
M Professional, scientific and technical activities 69-75 MP6S MP76 MP6M MP6P MP6Z
MA 69-71 MP7H MP7T MP7B MP7E MP7O
MB Scientific research and development 72 MP84 MP8G MP7W MP7Z MP8B
MC Other professional, scientific and technical activities 73-75 MP8P MP93 MP8J MP8M MP8W
N Administrative and support service activities 77-82 MP9F MP9R MP99 MP96 MP9C MP9M
O 84 MPD5 MPE9 MPC8 MPC5 MPD2 MPE4
P Education 85 MPG3 MPH7 MPF5 MPF8 MPH2
Q Human health and social work activities 86-88 MPJ2 MPK6 MPI4 MPI7 MPJ9
QA Human health activities 86 MPL8 MPN3 MPL2 MPL5 MPM7
QB Residential care and social work activities 87-88 MPO3 MPP7 MPN6 MPN9 MPP2
R Arts, entertainment and recreation 90-93 MPQ7 MPS2 MPPK MPQ4 MPR6
S Other service activities 94-96 MPT2 MPU6 MPS5 MPS8 MPT9
T 97-98 MPV5 MPW8 MPU9 MPV2 MPW3
ABDE Other Production 1-9,
35-39
MPA8 MPB8 MPA2 MPA5 MIL5 MPB3
C Manufacturing 10-33 MO3B MO3N MO35 MO38 MO3I
F Construction 41-43 MON5 MOO9 MOM8 MOM5 MON2 MOO4
G to T Services 45-98 MOT9 MOV6 MOS8 MOS5 MOT6 MOU7 MOU9
TOTAL Total MPZ3 MQ28 MPX9 MPX3 MPY6 MPZ9 MPX6 MQ23
1 n.e.c represents; not elsewhere classified.
Activities of households as employers; undifferentiated
goods and services - activities of household for own use
Manufacture of transport equipment
Other manufacturing and repair
Electricity, gas, steam and air conditioning supply
Water supply; sewerage, waste management
and remediation activities
Legal, accounting, management, architecture,
engineering, technical testing activities
Public administration and defence; compulsory social
security
Manufacture of machinery and equipment n.e.c1.
Back to contents
Manufacture of food products, beverages and tobacco
Manufacture of textiles, wearing apparel and leather
products
Manufacture of wood and paper products, and printing
Manufacture of coke and refined petroleum products
Manufacture of chemicals and chemical products
Manufacture of basic pharmaceutical products and
pharmaceutical preparations
Manufacture of rubber and plastics products, and other
non-metallic mineral products
Manufacture of basic metals and metal products
Manufacture of computer, electronic & optical products
Manufacture of electrical equipment
Consumption of Fixed Capital: Percentage by Asset and Industry 2012 at Current Prices - CDID Lookup

3.4.1IPer cent
SoftwareMineral
ExplorationEntertainment
Intangible fixed
assets
A Agriculture, Forestry and Fishing 1-3 1 z z 1
B Mining and quarrying 5-9 8 22 z 30
C Manufacturing 22 z z 22
CA 10-12 16 z z 16
CB 13-15 15 z z 15
CC 16-18 24 z z 24
CD 19 16 z z 16CE 20 17 z z 17
CF 21 17 z z 17
CG 22-23 20 z z 20
CH 24-25 14 z z 14CI 26 24 z z 24CJ 27 21 z z 21CK 28 45 z z 45CL 29-30 24 z z 24CM 31-33 41 z z 41
D 35 14 z z 14
E 36-39 8 z z 8
F Construction 41-43 4 z z 4
G Wholesale and retail trade; repair of motor vehicles and
motorcycles
45-47 36 z z 36
H Transportation and storage 49-53 8 z z 8
I Accommodation and food service activities 55-56 8 z z 8
J Information and communication 58-63 23 z 31 54
JA Publishing, audiovisual and broadcasting activities 58-60 12 z 77 90
JB Telecommunications 61 26 z z 26
JC IT and other information service activities 62-63 49 z z 49
K Financial and insurance activities 64-66 45 z z 45
L Real estate activities 68 0 z z 0
M Professional, scientific and technical activities 69-75 48 z z 48
MA 69-71 49 z z 49
MB Scientific research and development 72 50 z z 50
MC Other professional, scientific and technical activities 73-75 45 z z 45
N Administrative and support service activities 77-82 13 z z 13
O 84 7 z z 7
P Education 85 21 z z 21
Q Human health and social work activities 86-88 11 z z 11
QA Human health activities 86 9 z z 9
QB Residential care and social work activities 87-88 15 z z 15
R Arts, entertainment and recreation 90-93 17 z z 17
S Other service activities 94-96 47 z z 47
T 97-98 0 z z 0
ABDE Other Production 1-9,
35-39
8 7 z 14
C Manufacturing 10-33 22 z z 22
F Construction 41-43 4 z z 4
G to T Services 45-98 14 z 4 18
z z z zTOTAL Total 13 1 3 17
1 n.e.c. represents; not elsewhere classified.
Note: Differences between totals and sums of components are due to rounding.
z denotes where data is not collected, not present or unavailable for an industry or asset.
Activities of households as employers; undifferentiated
goods and services - activities of household for own use
Manufacture of transport equipment
Other manufacturing and repair
Electricity, gas, steam and air conditioning supply
Water supply; sewerage, waste management
and remediation activities
Legal, accounting, management, architecture,
engineering, technical testing activities
Public administration and defence; compulsory social
security
Manufacture of machinery and equipment n.e.c1.
Back to contents
Manufacture of food products, beverages and tobacco
Manufacture of textiles, wearing apparel and leather
products
Manufacture of wood and paper products, and printing
Manufacture of coke and refined petroleum products
Manufacture of chemicals and chemical products
Manufacture of basic pharmaceutical
products and pharmaceutical preparations
Manufacture of rubber and plastics products,
and other non-metallic mineral products
Manufacture of basic metals and metal products
Manufacture of computer, electronic & optical products
Manufacture of electrical equipment
Consumption of Fixed Capital: Intangible Assets Percentage by Industry, 2012 at Current Prices
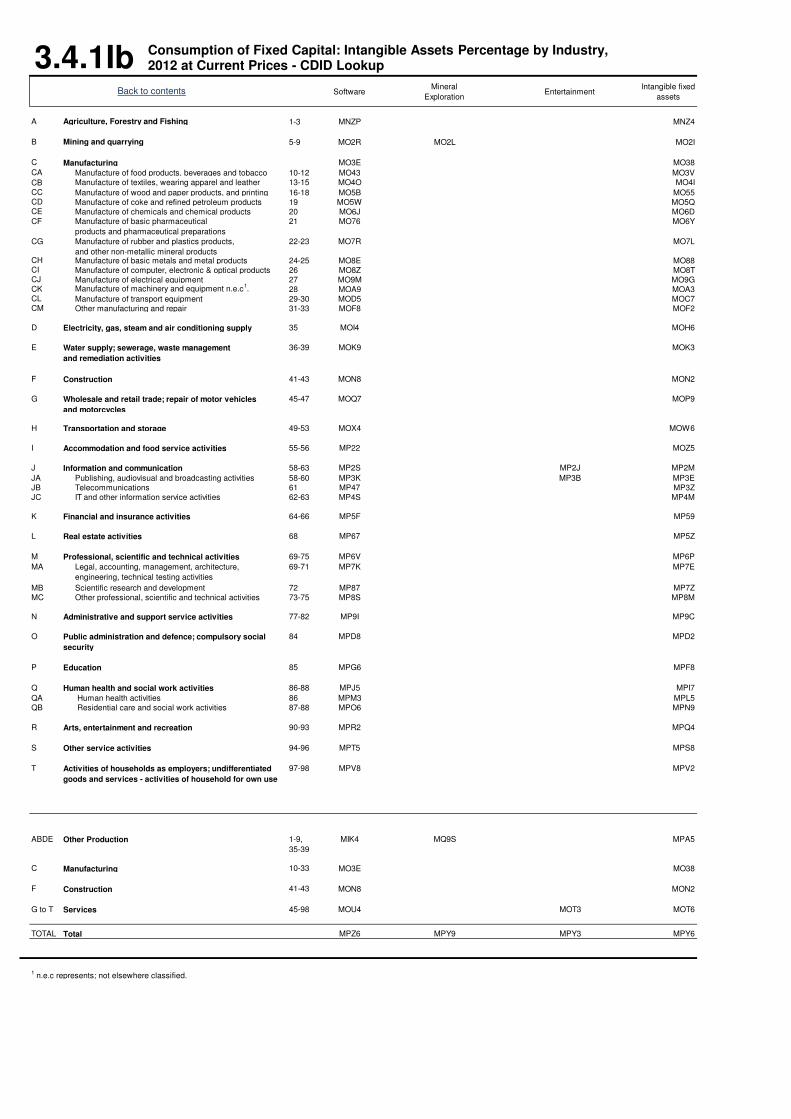
SoftwareMineral
ExplorationEntertainment
Intangible fixed
assets
A Agriculture, Forestry and Fishing 1-3 MNZP MNZ4
B Mining and quarrying 5-9 MO2R MO2L MO2I
C Manufacturing MO3E MO38
CA 10-12 MO43 MO3V
CB 13-15 MO4O MO4I
CC 16-18 MO5B MO55CD 19 MO5W MO5QCE 20 MO6J MO6D
CF 21 MO76 MO6Y
CG 22-23 MO7R MO7L
CH 24-25 MO8E MO88CI 26 MO8Z MO8TCJ 27 MO9M MO9GCK 28 MOA9 MOA3CL 29-30 MOD5 MOC7CM 31-33 MOF8 MOF2
D 35 MOI4 MOH6
E 36-39 MOK9 MOK3
F Construction 41-43 MON8 MON2
G Wholesale and retail trade; repair of motor vehicles
and motorcycles
45-47 MOQ7 MOP9
H Transportation and storage 49-53 MOX4 MOW6
I Accommodation and food service activities 55-56 MP22 MOZ5
J Information and communication 58-63 MP2S MP2J MP2M
JA Publishing, audiovisual and broadcasting activities 58-60 MP3K MP3B MP3E
JB Telecommunications 61 MP47 MP3Z
JC IT and other information service activities 62-63 MP4S MP4M
K Financial and insurance activities 64-66 MP5F MP59
L Real estate activities 68 MP67 MP5Z
M Professional, scientific and technical activities 69-75 MP6V MP6P
MA 69-71 MP7K MP7E
MB Scientific research and development 72 MP87 MP7Z
MC Other professional, scientific and technical activities 73-75 MP8S MP8M
N Administrative and support service activities 77-82 MP9I MP9C
O 84 MPD8 MPD2
P Education 85 MPG6 MPF8
Q Human health and social work activities 86-88 MPJ5 MPI7
QA Human health activities 86 MPM3 MPL5
QB Residential care and social work activities 87-88 MPO6 MPN9
R Arts, entertainment and recreation 90-93 MPR2 MPQ4
S Other service activities 94-96 MPT5 MPS8
T 97-98 MPV8 MPV2
ABDE Other Production 1-9,
35-39
MIK4 MQ9S MPA5
C Manufacturing 10-33 MO3E MO38
F Construction 41-43 MON8 MON2
G to T Services 45-98 MOU4 MOT3 MOT6
TOTAL Total MPZ6 MPY9 MPY3 MPY6
1 n.e.c represents; not elsewhere classified.
Public administration and defence; compulsory social
security
Activities of households as employers; undifferentiated
goods and services - activities of household for own use
Manufacture of machinery and equipment n.e.c1.
Manufacture of transport equipment
Other manufacturing and repair
Electricity, gas, steam and air conditioning supply
Water supply; sewerage, waste management
and remediation activities
Legal, accounting, management, architecture,
engineering, technical testing activities
Manufacture of electrical equipment
3.4.1IbBack to contents
Manufacture of food products, beverages and tobacco
Manufacture of textiles, wearing apparel and leather
Manufacture of wood and paper products, and printing
Manufacture of coke and refined petroleum products
Manufacture of chemicals and chemical products
Manufacture of basic pharmaceutical
products and pharmaceutical preparations
Manufacture of rubber and plastics products,
and other non-metallic mineral products Manufacture of basic metals and metal products
Manufacture of computer, electronic & optical products
Consumption of Fixed Capital: Intangible Assets Percentage by Industry, 2012 at Current Prices - CDID Lookup
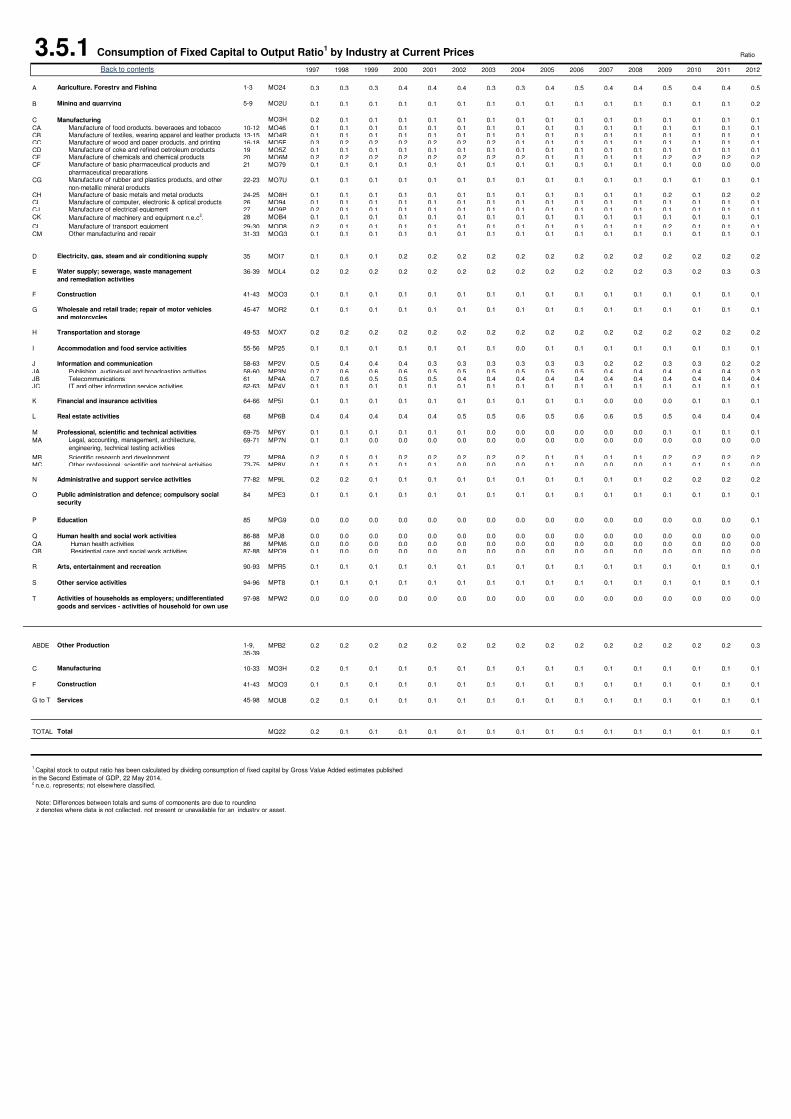
3.5.1 Consumption of Fixed Capital to Output Ratio1 by Industry at Current Prices Ratio
1997 1998 1999 2000 2001 2002 2003 2004 2005 2006 2007 2008 2009 2010 2011 2012
A Agriculture, Forestry and Fishing 1-3 MO24 0.3 0.3 0.3 0.4 0.4 0.4 0.3 0.3 0.4 0.5 0.4 0.4 0.5 0.4 0.4 0.5
B Mining and quarrying 5-9 MO2U 0.1 0.1 0.1 0.1 0.1 0.1 0.1 0.1 0.1 0.1 0.1 0.1 0.1 0.1 0.1 0.2
C Manufacturing MO3H 0.2 0.1 0.1 0.1 0.1 0.1 0.1 0.1 0.1 0.1 0.1 0.1 0.1 0.1 0.1 0.1
CA 10-12 MO46 0.1 0.1 0.1 0.1 0.1 0.1 0.1 0.1 0.1 0.1 0.1 0.1 0.1 0.1 0.1 0.1CB 13-15 MO4R 0.1 0.1 0.1 0.1 0.1 0.1 0.1 0.1 0.1 0.1 0.1 0.1 0.1 0.1 0.1 0.1CC 16-18 MO5E 0.3 0.2 0.2 0.2 0.2 0.2 0.2 0.1 0.1 0.1 0.1 0.1 0.1 0.1 0.1 0.1CD 19 MO5Z 0.1 0.1 0.1 0.1 0.1 0.1 0.1 0.1 0.1 0.1 0.1 0.1 0.1 0.1 0.1 0.1CE 20 MO6M 0.2 0.2 0.2 0.2 0.2 0.2 0.2 0.2 0.1 0.1 0.1 0.1 0.2 0.2 0.2 0.2CF 21 MO79 0.1 0.1 0.1 0.1 0.1 0.1 0.1 0.1 0.1 0.1 0.1 0.1 0.1 0.0 0.0 0.0
CG 22-23 MO7U 0.1 0.1 0.1 0.1 0.1 0.1 0.1 0.1 0.1 0.1 0.1 0.1 0.1 0.1 0.1 0.1
CH 24-25 MO8H 0.1 0.1 0.1 0.1 0.1 0.1 0.1 0.1 0.1 0.1 0.1 0.1 0.2 0.1 0.2 0.2CI 26 MO94 0.1 0.1 0.1 0.1 0.1 0.1 0.1 0.1 0.1 0.1 0.1 0.1 0.1 0.1 0.1 0.1CJ 27 MO9P 0.2 0.1 0.1 0.1 0.1 0.1 0.1 0.1 0.1 0.1 0.1 0.1 0.1 0.1 0.1 0.1CK 28 MOB4 0.1 0.1 0.1 0.1 0.1 0.1 0.1 0.1 0.1 0.1 0.1 0.1 0.1 0.1 0.1 0.1
CL 29-30 MOD8 0.2 0.1 0.1 0.1 0.1 0.1 0.1 0.1 0.1 0.1 0.1 0.1 0.2 0.1 0.1 0.1CM 31-33 MOG3 0.1 0.1 0.1 0.1 0.1 0.1 0.1 0.1 0.1 0.1 0.1 0.1 0.1 0.1 0.1 0.1
D 35 MOI7 0.1 0.1 0.1 0.2 0.2 0.2 0.2 0.2 0.2 0.2 0.2 0.2 0.2 0.2 0.2 0.2
E 36-39 MOL4 0.2 0.2 0.2 0.2 0.2 0.2 0.2 0.2 0.2 0.2 0.2 0.2 0.3 0.2 0.3 0.3
F Construction 41-43 MOO3 0.1 0.1 0.1 0.1 0.1 0.1 0.1 0.1 0.1 0.1 0.1 0.1 0.1 0.1 0.1 0.1
G Wholesale and retail trade; repair of motor vehicles
and motorcycles
45-47 MOR2 0.1 0.1 0.1 0.1 0.1 0.1 0.1 0.1 0.1 0.1 0.1 0.1 0.1 0.1 0.1 0.1
H Transportation and storage 49-53 MOX7 0.2 0.2 0.2 0.2 0.2 0.2 0.2 0.2 0.2 0.2 0.2 0.2 0.2 0.2 0.2 0.2
I Accommodation and food service activities 55-56 MP25 0.1 0.1 0.1 0.1 0.1 0.1 0.1 0.0 0.1 0.1 0.1 0.1 0.1 0.1 0.1 0.1
J Information and communication 58-63 MP2V 0.5 0.4 0.4 0.4 0.3 0.3 0.3 0.3 0.3 0.3 0.2 0.2 0.3 0.3 0.2 0.2
JA Publishing, audiovisual and broadcasting activities 58-60 MP3N 0.7 0.6 0.6 0.6 0.5 0.5 0.5 0.5 0.5 0.5 0.4 0.4 0.4 0.4 0.4 0.3JB Telecommunications 61 MP4A 0.7 0.6 0.5 0.5 0.5 0.4 0.4 0.4 0.4 0.4 0.4 0.4 0.4 0.4 0.4 0.4JC IT and other information service activities 62-63 MP4V 0.1 0.1 0.1 0.1 0.1 0.1 0.1 0.1 0.1 0.1 0.1 0.1 0.1 0.1 0.1 0.1
K Financial and insurance activities 64-66 MP5I 0.1 0.1 0.1 0.1 0.1 0.1 0.1 0.1 0.1 0.1 0.0 0.0 0.0 0.1 0.1 0.1
L Real estate activities 68 MP6B 0.4 0.4 0.4 0.4 0.4 0.5 0.5 0.6 0.5 0.6 0.6 0.5 0.5 0.4 0.4 0.4
M Professional, scientific and technical activities 69-75 MP6Y 0.1 0.1 0.1 0.1 0.1 0.1 0.0 0.0 0.0 0.0 0.0 0.0 0.1 0.1 0.1 0.1
MA 69-71 MP7N 0.1 0.1 0.0 0.0 0.0 0.0 0.0 0.0 0.0 0.0 0.0 0.0 0.0 0.0 0.0 0.0
MB Scientific research and development 72 MP8A 0.2 0.1 0.1 0.2 0.2 0.2 0.2 0.2 0.1 0.1 0.1 0.1 0.2 0.2 0.2 0.2MC Other professional, scientific and technical activities 73-75 MP8V 0.1 0.1 0.1 0.1 0.1 0.0 0.0 0.0 0.1 0.0 0.0 0.0 0.1 0.1 0.1 0.0
N Administrative and support service activities 77-82 MP9L 0.2 0.2 0.1 0.1 0.1 0.1 0.1 0.1 0.1 0.1 0.1 0.1 0.2 0.2 0.2 0.2
O 84 MPE3 0.1 0.1 0.1 0.1 0.1 0.1 0.1 0.1 0.1 0.1 0.1 0.1 0.1 0.1 0.1 0.1
P Education 85 MPG9 0.0 0.0 0.0 0.0 0.0 0.0 0.0 0.0 0.0 0.0 0.0 0.0 0.0 0.0 0.0 0.1
Q Human health and social work activities 86-88 MPJ8 0.0 0.0 0.0 0.0 0.0 0.0 0.0 0.0 0.0 0.0 0.0 0.0 0.0 0.0 0.0 0.0
QA Human health activities 86 MPM6 0.0 0.0 0.0 0.0 0.0 0.0 0.0 0.0 0.0 0.0 0.0 0.0 0.0 0.0 0.0 0.0QB Residential care and social work activities 87-88 MPO9 0.1 0.0 0.0 0.0 0.0 0.0 0.0 0.0 0.0 0.0 0.0 0.0 0.0 0.0 0.0 0.0
R Arts, entertainment and recreation 90-93 MPR5 0.1 0.1 0.1 0.1 0.1 0.1 0.1 0.1 0.1 0.1 0.1 0.1 0.1 0.1 0.1 0.1
S Other service activities 94-96 MPT8 0.1 0.1 0.1 0.1 0.1 0.1 0.1 0.1 0.1 0.1 0.1 0.1 0.1 0.1 0.1 0.1
T 97-98 MPW2 0.0 0.0 0.0 0.0 0.0 0.0 0.0 0.0 0.0 0.0 0.0 0.0 0.0 0.0 0.0 0.0
ABDE Other Production 1-9,
35-39
MPB2 0.2 0.2 0.2 0.2 0.2 0.2 0.2 0.2 0.2 0.2 0.2 0.2 0.2 0.2 0.2 0.3
C Manufacturing 10-33 MO3H 0.2 0.1 0.1 0.1 0.1 0.1 0.1 0.1 0.1 0.1 0.1 0.1 0.1 0.1 0.1 0.1
F Construction 41-43 MOO3 0.1 0.1 0.1 0.1 0.1 0.1 0.1 0.1 0.1 0.1 0.1 0.1 0.1 0.1 0.1 0.1
G to T Services 45-98 MOU8 0.2 0.1 0.1 0.1 0.1 0.1 0.1 0.1 0.1 0.1 0.1 0.1 0.1 0.1 0.1 0.1
TOTAL Total MQ22 0.2 0.1 0.1 0.1 0.1 0.1 0.1 0.1 0.1 0.1 0.1 0.1 0.1 0.1 0.1 0.1
Note: Differences between totals and sums of components are due to rounding z denotes where data is not collected, not present or unavailable for an industry or asset.
Activities of households as employers; undifferentiated
goods and services - activities of household for own use
1 Capital stock to output ratio has been calculated by dividing consumption of fixed capital by Gross Value Added estimates published
in the Second Estimate of GDP, 22 May 2014.2 n.e.c. represents; not elsewhere classified.
Manufacture of transport equipment Other manufacturing and repair
Electricity, gas, steam and air conditioning supply
Water supply; sewerage, waste management
and remediation activities
Legal, accounting, management, architecture,
engineering, technical testing activities
Public administration and defence; compulsory social
security
Manufacture of machinery and equipment n.e.c2.
Back to contents
Manufacture of food products, beverages and tobacco Manufacture of textiles, wearing apparel and leather products Manufacture of wood and paper products, and printing Manufacture of coke and refined petroleum products Manufacture of chemicals and chemical products Manufacture of basic pharmaceutical products and
pharmaceutical preparations Manufacture of rubber and plastics products, and other
non-metallic mineral products Manufacture of basic metals and metal products Manufacture of computer, electronic & optical products Manufacture of electrical equipment
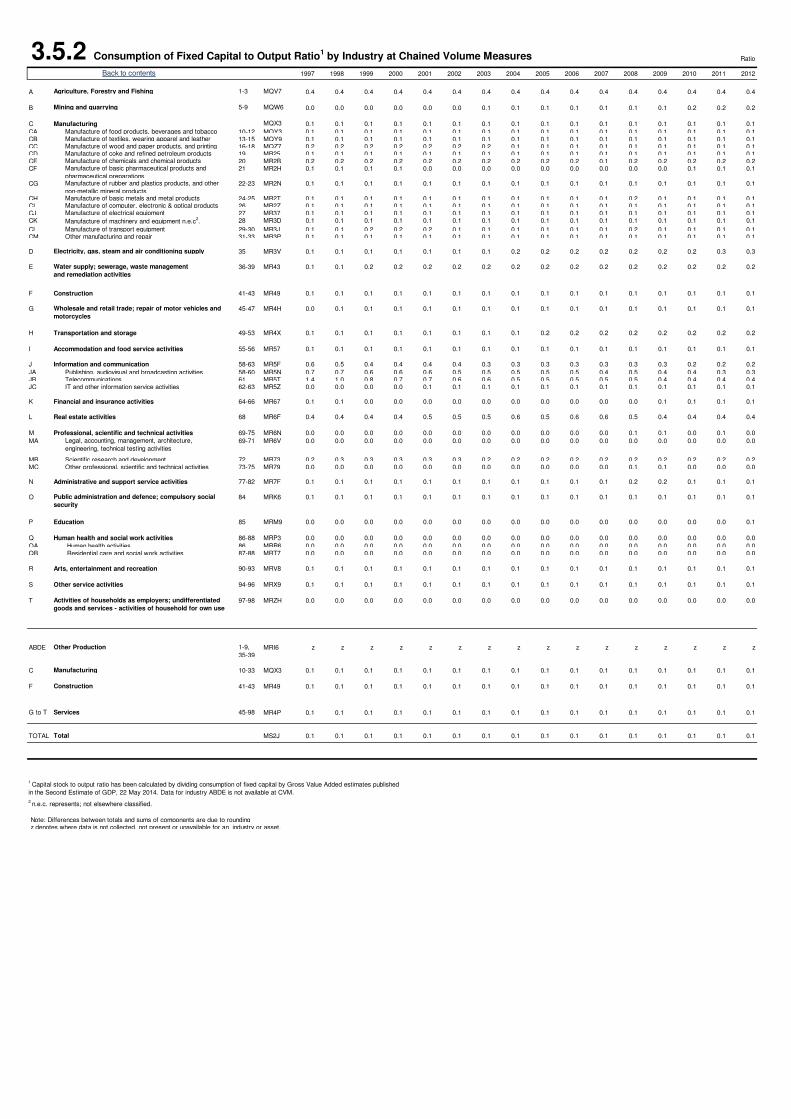
3.5.2 Consumption of Fixed Capital to Output Ratio1 by Industry at Chained Volume Measures Ratio
1997 1998 1999 2000 2001 2002 2003 2004 2005 2006 2007 2008 2009 2010 2011 2012
A Agriculture, Forestry and Fishing 1-3 MQV7 0.4 0.4 0.4 0.4 0.4 0.4 0.4 0.4 0.4 0.4 0.4 0.4 0.4 0.4 0.4 0.4
B Mining and quarrying 5-9 MQW6 0.0 0.0 0.0 0.0 0.0 0.0 0.1 0.1 0.1 0.1 0.1 0.1 0.1 0.2 0.2 0.2
C Manufacturing MQX3 0.1 0.1 0.1 0.1 0.1 0.1 0.1 0.1 0.1 0.1 0.1 0.1 0.1 0.1 0.1 0.1
CA 10-12 MQY3 0.1 0.1 0.1 0.1 0.1 0.1 0.1 0.1 0.1 0.1 0.1 0.1 0.1 0.1 0.1 0.1CB 13-15 MQY9 0.1 0.1 0.1 0.1 0.1 0.1 0.1 0.1 0.1 0.1 0.1 0.1 0.1 0.1 0.1 0.1CC 16-18 MQZ7 0.2 0.2 0.2 0.2 0.2 0.2 0.2 0.1 0.1 0.1 0.1 0.1 0.1 0.1 0.1 0.1CD 19 MR25 0.1 0.1 0.1 0.1 0.1 0.1 0.1 0.1 0.1 0.1 0.1 0.1 0.1 0.1 0.1 0.1CE 20 MR2B 0.2 0.2 0.2 0.2 0.2 0.2 0.2 0.2 0.2 0.2 0.1 0.2 0.2 0.2 0.2 0.2CF 21 MR2H 0.1 0.1 0.1 0.1 0.0 0.0 0.0 0.0 0.0 0.0 0.0 0.0 0.0 0.1 0.1 0.1
CG 22-23 MR2N 0.1 0.1 0.1 0.1 0.1 0.1 0.1 0.1 0.1 0.1 0.1 0.1 0.1 0.1 0.1 0.1
CH 24-25 MR2T 0.1 0.1 0.1 0.1 0.1 0.1 0.1 0.1 0.1 0.1 0.1 0.2 0.1 0.1 0.1 0.1CI 26 MR2Z 0.1 0.1 0.1 0.1 0.1 0.1 0.1 0.1 0.1 0.1 0.1 0.1 0.1 0.1 0.1 0.1CJ 27 MR37 0.1 0.1 0.1 0.1 0.1 0.1 0.1 0.1 0.1 0.1 0.1 0.1 0.1 0.1 0.1 0.1CK 28 MR3D 0.1 0.1 0.1 0.1 0.1 0.1 0.1 0.1 0.1 0.1 0.1 0.1 0.1 0.1 0.1 0.1
CL 29-30 MR3J 0.1 0.1 0.2 0.2 0.2 0.1 0.1 0.1 0.1 0.1 0.1 0.2 0.1 0.1 0.1 0.1CM 31-33 MR3P 0.1 0.1 0.1 0.1 0.1 0.1 0.1 0.1 0.1 0.1 0.1 0.1 0.1 0.1 0.1 0.1
D 35 MR3V 0.1 0.1 0.1 0.1 0.1 0.1 0.1 0.2 0.2 0.2 0.2 0.2 0.2 0.2 0.3 0.3
E 36-39 MR43 0.1 0.1 0.2 0.2 0.2 0.2 0.2 0.2 0.2 0.2 0.2 0.2 0.2 0.2 0.2 0.2
F Construction 41-43 MR49 0.1 0.1 0.1 0.1 0.1 0.1 0.1 0.1 0.1 0.1 0.1 0.1 0.1 0.1 0.1 0.1
G Wholesale and retail trade; repair of motor vehicles and
motorcycles
45-47 MR4H 0.0 0.1 0.1 0.1 0.1 0.1 0.1 0.1 0.1 0.1 0.1 0.1 0.1 0.1 0.1 0.1
H Transportation and storage 49-53 MR4X 0.1 0.1 0.1 0.1 0.1 0.1 0.1 0.1 0.2 0.2 0.2 0.2 0.2 0.2 0.2 0.2
I Accommodation and food service activities 55-56 MR57 0.1 0.1 0.1 0.1 0.1 0.1 0.1 0.1 0.1 0.1 0.1 0.1 0.1 0.1 0.1 0.1
J Information and communication 58-63 MR5F 0.6 0.5 0.4 0.4 0.4 0.4 0.3 0.3 0.3 0.3 0.3 0.3 0.3 0.2 0.2 0.2
JA Publishing, audiovisual and broadcasting activities 58-60 MR5N 0.7 0.7 0.6 0.6 0.6 0.5 0.5 0.5 0.5 0.5 0.4 0.5 0.4 0.4 0.3 0.3JB Telecommunications 61 MR5T 1.4 1.0 0.8 0.7 0.7 0.6 0.6 0.5 0.5 0.5 0.5 0.5 0.4 0.4 0.4 0.4JC IT and other information service activities 62-63 MR5Z 0.0 0.0 0.0 0.0 0.1 0.1 0.1 0.1 0.1 0.1 0.1 0.1 0.1 0.1 0.1 0.1
K Financial and insurance activities 64-66 MR67 0.1 0.1 0.0 0.0 0.0 0.0 0.0 0.0 0.0 0.0 0.0 0.0 0.1 0.1 0.1 0.1
L Real estate activities 68 MR6F 0.4 0.4 0.4 0.4 0.5 0.5 0.5 0.6 0.5 0.6 0.6 0.5 0.4 0.4 0.4 0.4
M Professional, scientific and technical activities 69-75 MR6N 0.0 0.0 0.0 0.0 0.0 0.0 0.0 0.0 0.0 0.0 0.0 0.1 0.1 0.0 0.1 0.0
MA 69-71 MR6V 0.0 0.0 0.0 0.0 0.0 0.0 0.0 0.0 0.0 0.0 0.0 0.0 0.0 0.0 0.0 0.0
MB Scientific research and development 72 MR73 0.2 0.3 0.3 0.3 0.3 0.3 0.2 0.2 0.2 0.2 0.2 0.2 0.2 0.2 0.2 0.2MC Other professional, scientific and technical activities 73-75 MR79 0.0 0.0 0.0 0.0 0.0 0.0 0.0 0.0 0.0 0.0 0.0 0.1 0.1 0.0 0.0 0.0
N Administrative and support service activities 77-82 MR7F 0.1 0.1 0.1 0.1 0.1 0.1 0.1 0.1 0.1 0.1 0.1 0.2 0.2 0.1 0.1 0.1
O 84 MRK6 0.1 0.1 0.1 0.1 0.1 0.1 0.1 0.1 0.1 0.1 0.1 0.1 0.1 0.1 0.1 0.1
P Education 85 MRM9 0.0 0.0 0.0 0.0 0.0 0.0 0.0 0.0 0.0 0.0 0.0 0.0 0.0 0.0 0.0 0.1
Q Human health and social work activities 86-88 MRP3 0.0 0.0 0.0 0.0 0.0 0.0 0.0 0.0 0.0 0.0 0.0 0.0 0.0 0.0 0.0 0.0
QA Human health activities 86 MRR6 0.0 0.0 0.0 0.0 0.0 0.0 0.0 0.0 0.0 0.0 0.0 0.0 0.0 0.0 0.0 0.0QB Residential care and social work activities 87-88 MRT7 0.0 0.0 0.0 0.0 0.0 0.0 0.0 0.0 0.0 0.0 0.0 0.0 0.0 0.0 0.0 0.0
R Arts, entertainment and recreation 90-93 MRV8 0.1 0.1 0.1 0.1 0.1 0.1 0.1 0.1 0.1 0.1 0.1 0.1 0.1 0.1 0.1 0.1
S Other service activities 94-96 MRX9 0.1 0.1 0.1 0.1 0.1 0.1 0.1 0.1 0.1 0.1 0.1 0.1 0.1 0.1 0.1 0.1
T 97-98 MRZH 0.0 0.0 0.0 0.0 0.0 0.0 0.0 0.0 0.0 0.0 0.0 0.0 0.0 0.0 0.0 0.0
ABDE Other Production 1-9,
35-39
MRI6 z z z z z z z z z z z z z z z z
C Manufacturing 10-33 MQX3 0.1 0.1 0.1 0.1 0.1 0.1 0.1 0.1 0.1 0.1 0.1 0.1 0.1 0.1 0.1 0.1
F Construction 41-43 MR49 0.1 0.1 0.1 0.1 0.1 0.1 0.1 0.1 0.1 0.1 0.1 0.1 0.1 0.1 0.1 0.1
G to T Services 45-98 MR4P 0.1 0.1 0.1 0.1 0.1 0.1 0.1 0.1 0.1 0.1 0.1 0.1 0.1 0.1 0.1 0.1
TOTAL Total MS2J 0.1 0.1 0.1 0.1 0.1 0.1 0.1 0.1 0.1 0.1 0.1 0.1 0.1 0.1 0.1 0.1
Note: Differences between totals and sums of components are due to rounding z denotes where data is not collected, not present or unavailable for an industry or asset.
Activities of households as employers; undifferentiated
goods and services - activities of household for own use
1 Capital stock to output ratio has been calculated by dividing consumption of fixed capital by Gross Value Added estimates published
in the Second Estimate of GDP, 22 May 2014. Data for industry ABDE is not available at CVM.
2 n.e.c. represents; not elsewhere classified.
Manufacture of transport equipment Other manufacturing and repair
Electricity, gas, steam and air conditioning supply
Water supply; sewerage, waste management
and remediation activities
Legal, accounting, management, architecture,
engineering, technical testing activities
Public administration and defence; compulsory social
security
Manufacture of machinery and equipment n.e.c2.
Back to contents
Manufacture of food products, beverages and tobacco Manufacture of textiles, wearing apparel and leather Manufacture of wood and paper products, and printing Manufacture of coke and refined petroleum products Manufacture of chemicals and chemical products Manufacture of basic pharmaceutical products and
pharmaceutical preparations Manufacture of rubber and plastics products, and other
non-metallic mineral products Manufacture of basic metals and metal products Manufacture of computer, electronic & optical products Manufacture of electrical equipment


