Embed Size (px)
Citation preview
Enhanced top soil carbon stocks underorganic farmingAndreas Gattingera,1, Adrian Mullera, Matthias Haenia,b, Colin Skinnera, Andreas Fliessbacha, Nina Buchmannb,Paul Mädera, Matthias Stolzea, Pete Smithc, Nadia El-Hage Scialabbad, and Urs Nigglia
aResearch Institute of Organic Agriculture, 5070 Frick, Switzerland; bInstitute of Agricultural Sciences, Eidgenössische Technische Hochschule Zurich, 8092Zurich, Switzerland; cInstitute of Biological and Environmental Sciences, University of Aberdeen, Aberdeen AB24 3UU, Scotland; and dNatural ResourcesManagement and Environment Department, Food and Agriculture Organization of the United Nations, 00153 Rome, Italy
Edited by William H. Schlesinger, Cary Institute of Ecosystem Studies, Millbrook, NY, and approved August 13, 2012 (received for review June 5, 2012)
It has been suggested that conversion to organic farming contrib-utes to soil carbon sequestration, but until now a comprehensivequantitative assessment has been lacking. Therefore, datasets from74 studies from pairwise comparisons of organic vs. nonorganicfarming systems were subjected to metaanalysis to identify differ-ences in soil organic carbon (SOC). We found significant differencesand higher values for organically farmed soils of 0.18± 0.06%points(mean ± 95% confidence interval) for SOC concentrations, 3.50 ±1.08Mg C ha−1 for stocks, and 0.45± 0.21Mg C ha−1 y−1 for seques-tration rates compared with nonorganic management. Metaregres-sion did not deliver clear results on drivers, but differences inexternal C inputs and crop rotations seemed important. Restrictingthe analysis to zero net input organic systems and retaining only thedatasetswith highest data quality (measured soil bulk densities andexternal C andN inputs), themeandifference in SOC stocks betweenthe farming systems was still significant (1.98 ± 1.50 Mg C ha−1),whereas the difference in sequestration rates became insignificant(0.07± 0.08Mg C ha−1 y−1). Analyzing zero net input systems for alldata without this quality requirement revealed significant, positivedifferences in SOC concentrations and stocks (0.13 ± 0.09% pointsand 2.16 ± 1.65 Mg C ha−1, respectively) and insignificant differ-ences for sequestration rates (0.27 ± 0.37 Mg C ha−1 y−1). The datamainly cover top soil and temperate zones, whereas only few datafrom tropical regions and subsoil horizons exist. Summarizing, thisstudy shows that organic farming has the potential to accumulatesoil carbon.
climate change | soil quality | agricultural systems
Soil carbon sequestration at a global scale is considered themechanism responsible for the greatest mitigation potential
within the agricultural sector, with an estimated 90% contributionto the potential of what is technically feasible (1, 2). However,global soil carbon stocks of agricultural land have decreased his-torically and continue to decline (3). Thus, improved agronomicpractices that could lead to reduced carbon losses or even in-creased soil carbon storage are highly desired. This includes im-proved crop varieties, extending crop rotations, notably those withgrass–clover or forage legume leys that allocate more carbonbelow- ground, avoiding or reducing use of bare (unplanted) fallow(4), and the application of organic fertilizer such as compost orwaste products from livestock husbandry in the form of slurry orstacked manure (5). Although these practices are not common incurrent modern agriculture, they are core practices of organicagriculture, where crop production relies in large part on closednutrient cycles by returning plant residues and manures fromlivestock back to the land and/or by integrating perennial plants,mainly grass–clover mixtures, into the system. It is therefore hy-pothesized that the adoption of organic agriculture will lead toa reduction in soil carbon losses or even to higher soil carbonconcentrations and net carbon sequestration over time (6). In-troducing organic farming is considered an interesting and sus-tainable option for greenhouse gas (GHG)mitigation in agriculture.In contrast to the adoption of single GHG mitigation practices,
organic farming as a systems approach provides many other co-benefits, such as adaptation to climate change, biodiversity andsoil conservation, and the improvement of rural livelihood at thesame time (7).Although there is some evidence that soil carbon concentrations
are higher in soils managed organically than in those from in-tegrated or conventional (nonorganic) farming (6, 8–10), otherstudies have not found such differences (11, 12). Because of theseinconsistent findings, advantages and disadvantages of the organicfarming system vs. integrated or conventional production are hotlydebated (11, 13). A drawback of existing reviews on soil organiccarbon (SOC) in organic vs. nonorganic management is that theyare either narrative (10) or based on a limited number of datasets,often do not account for data quality differences, and do notcontrol for potential confounding drivers (9, 14). Thus, there isa need for a systematic, globally explorative literature review/synthesis on soil carbon datasets from pairwise organic vs. non-organic farming system comparisons and a systematic quantitativeanalysis of SOC concentrations, stocks and sequestration rates thataccounts for data quality, and potential confounding factors suchas climatic conditions, soil characteristics, or the quantity of ex-ternal nutrient inputs.In this study, we aim to close this knowledge gap by conducting
a metaanalysis of published data on the responses of SOC toconversion from conventional (= nonorganic) to organic farmingmanagement in pairwise comparisons. The objectives were to testwhether adoption of organic farming resulted in (i) an increase inoverall SOC concentration, (ii) an increase in overall SOC stocks,and (iii) higher SOC accumulation over time (= C sequestrationrates) compared with nonorganic management. Using meta-regression, we also analyzed how climatic conditions (rainfall andtemperature), soil characteristics (clay concentration), durationof contrasting farming management, external C and N inputs, andland use type (arable, grassland, vegetable, orchard/viticulturefarming) modulated the responses of SOC to the adoption oforganic farming practices.
ResultsGeneral Results. The literature review yielded 74 eligible in-dependent studies reporting SOC concentrations, of which 29reported also SOC stocks (Table 1). Among them, 20 studies alsoreported baseline SOC data, which enabled the calculation ofSOC sequestration rates. The vast majority of studies included inthe database were published in peer-reviewed scientific journals.
Author contributions: A.G., A.M., A.F., N.B., P.M., M.S., P.S., N.E.-H.S., and U.N. designedresearch; A.G., A.M., and M.H. performed research; A.G., A.M., M.H., and C.S. analyzeddata; and A.G., A.M., N.B., and P.M. wrote the paper.
The authors declare no conflict of interest.
This article is a PNAS Direct Submission.
Freely available online through the PNAS open access option.1To whom correspondence should be addressed. E-mail: [email protected].
This article contains supporting information online at www.pnas.org/lookup/suppl/doi:10.1073/pnas.1209429109/-/DCSupplemental.
www.pnas.org/cgi/doi/10.1073/pnas.1209429109 PNAS Early Edition | 1 of 6
SUST
AINABILITY
SCIENCE
The observation period of the eligible farming system com-parisons for the total dataset was 3–70 y (mean: 14.4 y; median:10.0 y), and the soil horizon sampled encompassed the layerfrom 1.8 to 19.0 cm (median: 0–15 cm). Not all studies startedsampling from 0 cm, but depth increments and total samplingdepths were identical within comparative pairs (Table 1 providesfurther details on duration and sampling depths).SOC concentration and stock data from farming system com-
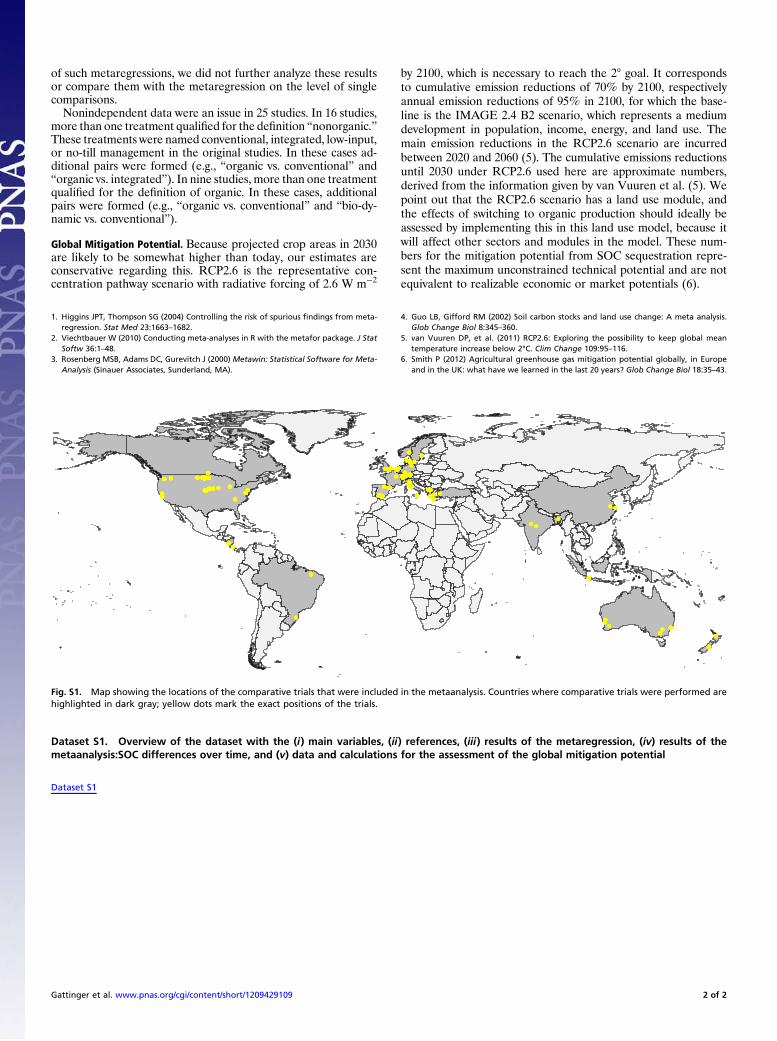
parisons existed for all investigated land use types (i.e., arable,grassland, vegetable, orchard/viticulture farming), whereas se-questration rates were only available for arable and vegetable landuse. The SOC dataset covered all climatic zones typical for agri-cultural production (Fig. S1 shows the localization of the com-parative trials). We are not aware of organic vs. nonorganicfarming management comparisons under boreal or arid climates.All three effect sizes contained data from all continents except forAfrica and Antarctica. There are ongoing field trials comparingorganic vs. nonorganic production in Kenya (vegetables), India(cotton), and Bolivia (cocoa), but published SOC datasets are notyet available (15).
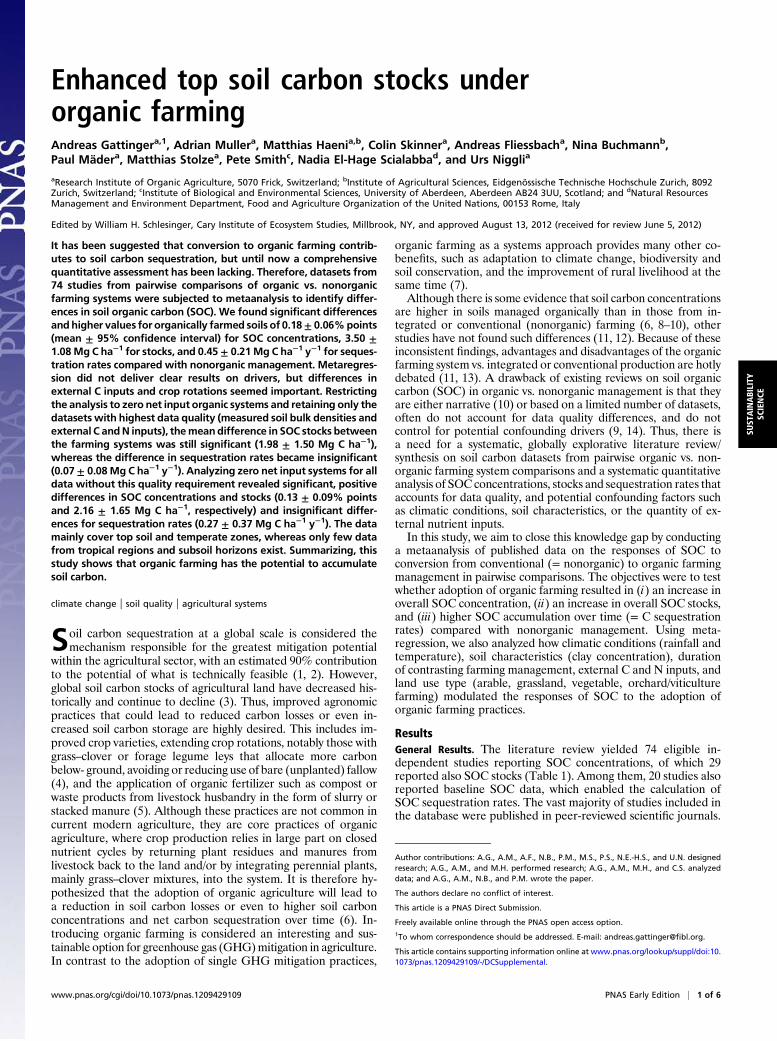
Differences Among Farming Systems. Metaanalyses of all three ef-fect sizes revealed significantly higher SOC concentrations, SOCstocks, and C sequestration rates in soils under organic comparedwith nonorganic farming management. In organically managedsoils, SOC concentrations were 0.18 ± 0.06% points (mean ± 95%confidence interval) higher (Fig. 1A; dataset category I, 200comparisons), SOC stocks were 3.50± 1.08MgC ha−1 higher (Fig.1B; dataset category I, 204 comparisons), and sequestration rateswere 0.45± 0.21Mg C ha−1 y−1 higher (Fig. 1C; dataset category I,41 comparisons) than in nonorganically managed soils. Thesedifferences were all highly significant at P< 0.0001 and were ratherconservative estimates because we removed five to nine outliersthat would have biased the differences between farming systemsconsiderably upward, although not greatly influencing significancelevels. Removing these outliers thus reduces the risk of over-estimating the effects of organic farming and provides a conser-vative analysis of the differences between systems. In all analyses,SOC stocks were derived from bulk densities and SOC concen-trations, although not all bulk density values had been measured.Thus, we analyzed differences in SOC stocks and sequestrationrates separately for a subset of studies that reportedmeasured bulkdensities. SOC stocks for this subset were 3.60 ± 1.45 Mg C ha−1
higher (P < 0.0001; Fig. 1B; dataset category III, 93 comparisons),and sequestration rates were 0.30± 0.14MgC ha−1 y−1 higher (P<0.0001; Fig. 1C; dataset category III, 32 comparisons) for organicvs. nonorganic management. Soil bulk densities were found to be
lower for the organic practice (Dataset S1), thus the observed in-crease in SOC stocks in organically managed soils resulted fromSOC enrichment and not from soil compaction.Because soil carbon sequestration is time dependent owing to
the phenomenon of “sink saturation” (16), we also performeda metaanalysis with our dataset grouped according to duration offarming system comparison (up to 10 y, 10–20 y, more than 20 y).Our results show this time dependency with the highest differencein sequestration rates for the first 10 years of organic management.Differences in sequestration rates are significant for the durationup to 10 y and 10–20 y, whereas differences in concentrations andstocks were always significant. Detailed results from these analysesare displayed in Dataset S1.Although these data clearly showed that organic management
increased SOC, it is often criticized that increased SOC stocksoriginate from massive imports of organic matter taken fromelsewhere (13, 17, 18). To examine the potential impact of im-ported organic matter, we analyzed a subset of studies represent-ing organic farming systems with zero net input separately. Theserepresentmixed livestock–crop production farmswith forage cropsin the crop rotation, such that the livestock can be fed entirelyfrom fodder produced on-farm. In such systems, no import oforganic matter occurs. On the other hand, these systems couldalso be stockless farms that import organic matter from elsewherebut to an extent that is supported by their own systems’ produc-tivity. For our analysis, the cutoff for a zero net input system wasset at an amount of organic fertilizers applied to the trials thatcorresponds to the manure amount from 1.0 (European) livestockunit (LU) ha−1. This is lower than the maximum stocking ratesthat we consider to reflect a zero net input system. Adopting thisconservative threshold, we may neglect some studies that actuallyrepresent zero net input systems, but we can be sure that we haveexcluded all organic systems with net inputs. For nontemperatezones, a conservative threshold for zero net input systems couldeven be lower. Because only one study from nontemperate zonesshowed values below 1.0 LU (it reported 0.9 LU), the use of thisthreshold is adequate for our data set. In this subset, SOC con-centrations were 0.13 ± 0.09% points higher (P < 0.001; Fig. 1A;dataset category II, 60 comparisons), SOC stocks were 2.16± 1.65Mg C ha−1 higher (P < 0.01; Fig. 1B; dataset category II, 60comparisons), and C sequestration rates were no longer signifi-cantly different from nonorganically managed soils (0.27 ± 0.37Mg C ha−1 y−1, P > 0.1; Fig. 1C; dataset category II, 19 compar-isons). Identifying whether the organic treatment in a comparisoncorresponded to a zero net input system required data on externalC and N inputs. Measured external C and N inputs had been
Table 1. Overview of the obtained publications matching the search and eligibility criteria
Criterion SOC concentration SOC stocks C sequestration
Type of publicationsScientific journals 70 publications 26 publications 18* publicationsDissertations/books chapters/proceedings 4 publications 3 publications 2* publicationsType of comparisonsPlot scale 26 publications 23 publications 19 publicationsFarm scale 48 publications 16 publications 1 publicationsCoverage of land use types Full coverage Full coverage Only arable and vegetablesCoverage of climatic zones 6 of 8 (except boreal and arid) 5 of 8 6 of 8Coverage of continents† 5 of 6 (except Africa) 5 of 6 (except Africa) 5 of 6 (except Africa)Sampling depth (top–bottom) (cm) Mean: 2.4–18.4/median: 0–15.0 Mean: 1.8–19.4/median: 0–15.0 Mean: 0.8–22.5/median: 0–20.0
For all SOC datasets Mean: 1.8–19.0/median: 0–15Experimental duration (y) Mean: 13.2/median: 8.0 Mean: 16.1/median: 10.0 Mean: 12.5/median: 11.0
For all SOC datasets Mean: 14.4/median: 10.0
SOC concentrations, stocks, and C sequestration rates are the three effect-sizes in this metaanalysis.*Of 20 publications on SOC sequestration, 11 report measured bulk densities, for the other 9 bulk densities were estimated.†Continents except Antarctica.
2 of 6 | www.pnas.org/cgi/doi/10.1073/pnas.1209429109 Gattinger et al.
reported for only a few studies. For the other studies, they werecalculated from reported rates of manure and compost usingstandard C and N concentrations. An analysis of only those zeronet input systems that reported external C and N inputs in detailshowed that SOC concentrations of organically managed soilswere 0.07 ± 0.05% points higher (P < 0.01; Fig. 1A; dataset cat-egory IV, 17 comparisons) and SOC stocks were 1.83 ± 1.44Mg Cha−1 higher (P < 0.01; Fig. 1B; dataset category IV, 17 compar-isons) compared with nonorganically managed soils. No differ-ence in C sequestration rates between both systems could bedetermined from this dataset (0.16 ± 0.25 Mg C ha−1 y−1, P > 0.1;Fig. 1C; dataset category IV, 12 comparisons). However, takingonly the subset also reporting measured bulk densities for the zeronet input system trials led to SOC stocks that were not significantlyhigher under organic management (2.36 ± 2.99 Mg C ha−1; Fig.1B; dataset category V, 32 comparisons), whereas C sequestrationrates were 0.14 ± 0.14 Mg C ha−1 y−1 higher (P < 0.05; Fig. 1C;dataset category V, 11 comparisons) compared with nonorganicmanagement. Taking all three conditions (measured inputs, mea-sured bulk densities and zero net input systems), finally, led to SOCstocks that were 1.98 ± 1.50 Mg C ha−1 higher under organic man-agement (P < 0.01; Fig. 1B; dataset category VI, 11 comparisons)and sequestration rates that were 0.07 ± 0.08 Mg C ha−1 y−1
higher (P < 0.05; Fig. 1C; dataset category V, 9 comparisons).These analyses suggest that organically managed systems havehigher SOC levels, both when using the full dataset or the varioussubsets of zero net input systems only, or when using subsets ofimproved data quality only, by exclusively retaining those com-parisons with directly measured data.
Factors Influencing Changes in Soil Organic Carbon. The organic andnonorganic farming systems covered in the trials varied consid-erably with respect to the amount of farmyard manures appliedand the composition of crop rotations, potentially influencing theobserved differences in SOC stocks and C sequestration rates.Furthermore, climatic and soil conditions as well as the land usetypes may influence the observed SOC differences. Thus, we useda metaregression to identify the importance of potential drivingvariables on observed SOC differences.On the basis of these metaregressions (detailed results are
given in Dataset S1; further details on the regressions are pro-vided in Methods), significant results were found for SOC con-centrations and stocks but not for C sequestration rates. We thusonly display the corresponding tables for SOC concentrationsand stocks (Dataset S1). The estimated parameters, their sig-nificance levels, and how those change between the differentmodels and data subsets (SI Methods, Dataset S1) suggested thatdifferences in external C inputs, clay concentrations, mean an-nual precipitation, and mean annual temperature did influencedifferences in SOC concentrations and stocks. Presence of thesame crop rotation in both systems, and land use may also beinfluential. As expected, the sign of the influence of external Cinputs is positive, and the sign of the influence of the same croprotations is negative. External N inputs and forage legumes inorganic systems seem unimportant. However, for all of thesevariables, more data are necessary before conclusive impacts canbe determined, and our findings are thus-far indicative at best.
DiscussionLimitations of the Dataset. The compiled database is to the best ofour knowledge the largest for comparing of SOC in organic vs.nonorganic farming systems. However, there are some few lim-itations concerning the significance and the transferability ofour results.A first limitation is that less than 50% of all studies that qualified
for our database reported SOC stocks or provided soil bulk den-sities to calculate stocks. This is because themajority of the farmingsystem comparisons were originally designed to investigate the
-0.1 0.0 0.1 0.2 0.3Mean difference in soil organic carbon concentrations (%)
ACategory of datasets
I
II
III
IV
V
VI
Number comparisons
200
60
17
ZNS+INP+SBD
ZNS+SBD
ZNS+INP
SBD
ZNS
ALL
-1 0 1 2 3 4 5 6 7Mean difference in soil organic carbon stocks (Mg C ha-1)
B
I
II
III
IV
V
VI
204
60
93
17
32
11 ZNS+INP+SBD
ZNS+SBD
ZNS+INP
SBD
ZNS
ALL
-0.2 0.0 0.2 0.4 0.6 0.8Mean difference in C sequestration rates (Mg C ha-1 y-1)
C
I
II
III
IV
V
VI
41
19
32
11
11
9 ZNS+INP+SBD
ZNS+SBD
ZNS+INP
SBD
ZNS
ALL
Fig. 1. Mean difference in (A) SOC concentrations, (B) SOC stocks, and (C) Csequestration rates of soils under organic vs. nonorganic management,grouped according to different dataset categories after removal of outliers.Category I: total dataset (ALL); II: dataset containing only those studies inwhich the organic treatment is ≤1.0 ELU ha−1, the threshold for zero netinput systems (ZNS); III: dataset containing only those studies reportingmeasured soil bulk densities (SBD); IV: dataset containing only those studiesin which the organic treatment is ≤1.0 ELU ha−1 and in which measured dataof external annual C inputs were reported (ZNS+INP); V: dataset containingonly those studies in which the organic treatment is ≤1.0 ELU ha−1 and inwhich measured data of soil bulk densities were reported (ZNS+SBD); VI:dataset containing only those studies in which the organic treatment is ≤1.0ELU ha−1 and in which measured data of external annual C inputs and soilbulk densities were reported (ZNS+INP+SBD). Categories III, V, and VI are notreported for SOC concentrations, because the restriction on measured bulkdensities is not relevant for the quality of the SOC concentration values.Horizontal bars show the 95% confidence interval. Numbers of comparisonsare displayed for each dataset category along the y axis.
Gattinger et al. PNAS Early Edition | 3 of 6
SUST
AINABILITY
SCIENCE
influence of agricultural management practices on agronomicperformance, such as plant dry matter production, grain yields, andother agronomic properties (13). However, SOC concentration ismore often reported in these studies, because it is considered a keyindicator for soil quality, but C concentrations alone are not suf-ficient to assess the C sink potential.Another important limitation is the lack of data from the start of
the respective experiment (baseline). However, without a properbaseline, it is impossible to determine whether a measured dif-ference in SOC between two treatments after a certain period isactually caused by the treatment or whether it has already beenpresent at the beginning. In the current database, SOC stock dataat time point zero could be obtained from only 20 studies, of whichnine only reported initial SOC concentrations but no bulk density.For these nine studies, SOC stocks were calculated on the basis ofbulk density values that were estimated according to Post andKwon (2000) (19).Moreover, the average soil sampling depth of the studies in our
database included the thickness of a typical tillage layer of 20 cmsoil depth. This soil depth covers almost the entire cultivationhorizon of an agricultural soil, but it can be assumed that a sub-stantial part of SOC will not be considered (20) and may lead tomisinterpretation of management effects (21). This is particularlysignificant in the view that in deeper soil horizons SOC may bemore conserved (22). It has been showed in farming systems ofthe DOK (bio-dynamic D, bio-organic O, and conventional K)farming systems trial in Switzerland with rotations comprising 2 yof deep rooting grass–clover leys (= forage legumes) in the croprotation, that 64% of the total SOC stocks were deposited in thehorizons at 20–80 cm soil depth (23). In our dataset, 28% of thenonorganic and 47% of the organic treatments comprised foragelegumes and thus likely produce a significant farming system ef-fect on subsoil SOC. This, however, is not reflected in the currentdataset, because subsoil samples under forage legumes in the croprotation are scarce (compare the nonsignificant results of themetaregression for this variable).Finally, our database showed a rather unbalanced coverage of
climatic regions and continents. Of the 74 studies reporting SOCfrom farming system comparisons, 60 are obtained from threedeveloped continents—North America, Europe, and Australia/New Zealand. We have found only five eligible studies from theAsian continent, and none from Africa (most recent state of thedatabase: 15.04.2012). However, for Sub-SaharanAfrica (SSA) forinstance, where soil resources are scarce and severely degraded,organic farming might be a promising approach for sustainingagricultural production. In this region a substantial reduction inprecipitation has already been observed (24), and the projectedincrease in human population between 2008 and 2050 will be from364 million to 595 million (25). The large population of resource-poor and small-size land holders can neither afford the use ofchemical fertilizers and other input, nor are they sure of their ef-fectiveness (25). For such regions, low external input systems suchas organic farming can offer a long-term solution, but it remainsunclear whether a SOC gain crucial for the build-up of soil fertilityand resilience will really result from its adoption in SSA andcomparable regions in the developing world. Therefore, data fromfield comparisons is much needed for these regions.
More Carbon in Organically Managed Soils? The metaanalysis of thethree effects sizes “SOC concentration,” “SOC stocks,” and “Csequestration rates” indicated the presence of significantly morecarbon in organically managed top soils. Our results showed thatorganic farming practice lead to SOC stocks in the upper 20 cm ofsoil over a period of ca. 14 y that are 3.50 ± 1.08 Mg C ha−1 higherin organic than in nonorganic systems. Considering those studieswith the highest precision of data quality (measured C and Ninputs and bulk densities) containing zero net input organic sys-tems only, this difference is reduced, but still significant and
positive at 1.98 ± 1.50 Mg C ha−1. No comparison of these num-bers with earlier results from review articles is possible, becausethe results presented here go beyond whatever has been publishedon SOC under organic and nonorganic management to date: inprevious narrative reviews and/or semiquantitative approaches,only SOC concentrations were considered (6, 10, 13, 14).The observed differences in SOC concentrations, stocks, and C
sequestration rates seem to be influenced by the amount of ex-ternal annual C inputs. This is indicated by the regression resultsand also by the lower differences reported for zero net input sys-tems. These C inputs are from organic fertilizer mainly in the formof stacked manure, slurry, or compost, which are either producedon the farm or imported into the farm; both are possible within theorganic regulations (e.g., European Union regulation 837/2007).On average, 0.29 Mg and 1.20 Mg external C inputs ha−1 y−1 wereapplied to nonorganically and organically managed soils, re-spectively (Dataset S1). We used the variable “external C inputs”instead of the “total C inputs” formetaregression, because we havedata on external C inputs for 57 of 74 studies, whereas only sixstudies provided data on total C inputs derived from plant residuesand organic fertilizers. For these six studies, the mean total annualC input was 4.23 and 4.86 Mg C ha−1 for nonorganic and organicfarming systems, respectively.The observed differences in external C inputs between farming
systems reflect the situation in modern agriculture whereby anincreased specialization of farming enterprises in many developedcountries led to a separation into livestock and crop production(26), with the consequence that manure (mostly as slurry fromlivestock) is disposed of rather than recycled. In contrast, organicfarms show a more pronounced integration of livestock into thefarming system (27). First, the above-ground biomass of foragelegumes in organic crop rotations feed the farm animals, whosemanure is brought back to the land; and second, the below-groundbiomass of forage legumes contributes to soil fertility build-up. Ahigher percentage of forage legumes in organic cropping than innonorganic cropping systems was also found in our dataset. Thehigher C inputs are thus system-intrinsic to organic agriculture andare not a phenomenon of a biased comparison between organicand conventional farming, as argued elsewhere (13). The analysisof the subset of zero net input farms is important in the context ofthis discussion: it shows that, also under these conditions, in-creased SOC levels are observed under organic farming.
Carbon Sequestration Within Organic Farming Systems? The pres-ence of a positive difference in SOC concentrations, stocks, and Csequestration rates between organic and nonorganic systems doesnot reveal whether this change goes along with a net carbon gaindue to conversion from conventional to organic farming orwhetherit rather reflects a reduced carbon loss if compared with the non-organic treatment. Averaging the differences between initial andfinal SOC stocks for studies in which such data were available andaccounting for the study duration led to a slight carbon gain of0.090MgC ha−1 y−1 for nonorganic and a carbon gain of 0.55MgCha−1 y−1 for organic treatments. Hence, the result of the meta-analysis for the mean differences in C sequestration, 0.45 ± 1.05Mg C ha−1 y−1, between organic and nonorganic farming can beconsidered as net sequestration in the top soil. Leifeld and Fuhrer(13) found in their review an average annual increase of the SOCconcentration in organic systems by 2.2%, whereas in conventionalsystems, SOC did not change significantly. Freibauer et al. (4) es-timated a C sequestration potential of organic farming in Europeof 0–500 kg ha−1 y−1 (more than 50% uncertainty) using calcu-lations based on the combination of single practices such asextensification, improved rotations, residue incorporation, andmanure use, but excluding zero and reduced tillage.Furthermore, the data show that carbon sequestration follows
sink saturation dynamics (compare Dataset S1). SOC concen-trations and stocks show increasing differences between farming
4 of 6 | www.pnas.org/cgi/doi/10.1073/pnas.1209429109 Gattinger et al.
systems for longer trial durations. This increase is largest in theearly years of the comparisons and then attenuates. These dy-namics also suggest that differences in sequestration rates quotedon a “per-year” basis arise from differences in trial duration. Forunbiased assessment of differences in soil carbon sequestrationbetween farming systems, stocks and concentrations at the be-ginning and the end of a trial need to be reported and expressedrelative to the trial duration.
Soil Carbon Sequestration in Organic Farming in a Wider Context.Weclose this discussion by putting our results in the wider context ofglobal climate change mitigation and life-cycle analysis. First, anestimate of the maximum technical mitigation potential from soilC sequestration by switching to organic agriculture can be gainedby applying the average difference in sequestration rates for netzero input systems (0.27 Mg C ha−1 y−1) to the current global ar-able land area, and to European or US arable area only, thusaccounting for the bias of the data for these regions (data andcalculations for this paragraph are given in Dataset S1). Thisresults in 0.37 Gt C sequestered per year globally (0.03 Gt C inEurope, 0.04 Gt C in the United States), thus offsetting 3% ofcurrent total GHG emissions (2.3% for Europe, 2.3% for theUnited States), or 25% of total current agricultural emissions(23% for Europe, 36% for the United States), and equaling ap-proximately 25% of the annual technical agricultural mitigationpotential, as identified elsewhere (2). The cumulative mitigationtill 2030 would contribute 13% to the cumulative reductions thatwould be necessary until 2030 to stay on the path to reach the two-degree goal by 2100 [56 Gt C globally from 2010 till 2030,according to the RCP2.6 scenario (28)]. We emphasize that thisestimate represents the maximum technical potential because (i)it is unclear how much conventionally farmed cropland alreadyreceives organic material, and (ii) our calculations do not accountfor economic and market aspects.Further, the estimation of carbon sequestration alone does not
equate to climate change mitigation because (i) offsetting emis-sions with sequestration only buys time and does not negate theneed for emission reduction, and (ii) soil-derived N2O emissions,production emissions of different fertilizers, and energy-relatedemissions from farm machinery and irrigation, as well as emis-sions from livestock and manure, need to be accounted for ina life-cycle analysis. We have focused on the differences in SOCsequestration between organic and conventional production.Schader et al. (29) provide a review on the relative performance oforganic agriculture regarding other aspects, such as, for example,energy use and emissions in the livestock sector.
ConclusionsMetaanalysis from the farming systems database compiled for thisstudy confirms higher SOC concentrations and stocks in top soilsunder organic farming. Second, SOC differences seemed to bemainly influenced by elements of mixed farming (livestock pluscrop production), such as organic matter recycling and foragelegumes in the crop rotation. It is therefore likely that SOC con-centrations and stocks under modern agriculture could be im-proved if these measures were adopted. These measures areintrinsic to organic agriculture but can in principle be applied inany agricultural production system. Further research is required tounderpin the observed findings for the entire soil profile and fordeveloping regions (e.g., SSA)where no data from farming systemscomparisons are available.
MethodsAdditional details on the data and methods can be found in the SI Methods.
Data Sources. We collected data from pairwise comparisons on organic andnonorganic farming systems from peer-reviewed research papers that re-ported measured data on SOC concentrations, SOC stocks, and C sequestration
rates. SOC concentrations describe the organic carbon concentration on aweight by weight basis, SOC stocks on a weight by area basis, and C seques-tration rates onweight by area and elapsed time since conversion. Themajorityof the collected research papers were published in scientific journals, but wealso included eligible studies from conference proceedings, book chapters, anddissertations to enlarge the dataset, because those contributions also undergoa peer-review process. In a few cases the authors were contacted for furtherinformation/data on their farming system comparison (Dataset S1).
All studies were based on farming system comparisons inwhich the organicpractice was exclusively defined as organic by the respective authors. Theterm nonorganic was applied in the present article to a range of modernmanagement systems that are defined as conventional or integrated, and assuch, its exact meaning varied across studies. We used the term nonorganicfor any farming system that relied on the use of synthetic nitrogen fertilizerand chemical plant protection means.
We used the following qualifying criteria to include studies: (i) the relevantorganic farming principles were applied for at least 3 consecutive years. This isin agreement with the European Union legislation on organic farming (EC) Nr.834/2007 and the organic farming directives in most countries worldwide; (ii)pairwise farming system comparisons: organic and nonorganic farming man-agement was performed under the same pedo-climatic conditions (e.g., tem-perature, precipitation, soil texture, and soil type). In the studies in which SOCconcentration but no SOC stock data were reported (because of missing bulkdensities), SOC stocks were calculated according to the formulas below to in-crease the number of studies reporting SOC stocks and C sequestration. SOCstocks (Mg C ha−1) in the corresponding soil layer were calculated as:
SOCstock =BD× SOCconc ×D: [1]
where BD is soil bulk density (Mg m−3), and D is the thickness of the soil layer(m). For nine studies, BD was not available at the beginning and the end ofthe observation period and was estimated according to Post and Kwon (19):
BD =100�
OMconc
0:244
�+�100−OMconc
1:64
�: [2]
where 0.244 is the bulk density of soil organic matter, 1.64 the bulk density ofsoil mineral matter, and OMconc the concentration of soil organic matter (%),which was estimated according to Nelson and Sommer (30):
OMconc = 1:72× SOCconc: [3]
Livestock Stocking Density as a Proxy for Organic Fertilization Intensity. Onlya few studies reported exact values on total annual C inputs, because most ofthe farming system comparisons were initiated to study the agronomicperformance rather than soil carbon dynamics. Additionally, information onwhether harvest residues were left on the field is scarce. In contrast, theexternal annual N inputs from organic fertilizer were reported more often inthe used datasets. On the basis of the external annual organic N inputs (Nfixation is excluded owing to lack of data), we calculated the animal stockingdensity as European livestock units (ELU) ha−1, assuming a dairy cow (3,000 Lmilk, without additional concentrated feedstuffs) (31) produces 77 kg N inthe form of organic compounds (32). From this, external annual C inputswere calculated using standard factors (32). This approach was used asa proxy to assess whether the amount of manure applied could have beenproduced theoretically at the respective organic farm, thus allowing foridentification of comparisons that represented zero net input organic sys-tems. We further validated our assumptions on zero net input systems byassessing yield data for the comparisons in which external inputs correspondto ≤1.0 ELU ha−1. Yield data were available for four studies of this categoryonly, but the results justify that the amount of farmyard manure applied issupported by the productivity of the relevant organic farming systems andthat those thus indeed represent zero net input systems.
Data Analysis. For each farming system comparison, the mean in SOC concen-tration, SOC stock, andC sequestration rate underorganic (xORG) andnonorganic(xnon-ORG) management was used to calculate the three effect sizes of interest,namely the mean differences (MD) in SOC as influenced by the farming system:
MD = xORG − xnon‐ORG: [4]
We extracted the mean, SD, or significance level (P value) and sample size (n)of SOC data in each experiment for weighing the response of SOC change by
Gattinger et al. PNAS Early Edition | 5 of 6
SUST
AINABILITY
SCIENCE
variation (SD) and sample sizes (n). Where we could neither extract norcalculate SD from SEs, we reassigned the SD as 1/10 of the mean (33). Thiswas the case for approximately half of the SOC concentration and for a thirdof the stock data. In fact, SD for measured SOC data were always below 1/10of the mean SOC concentrations and SOC stocks (Dataset S1). A random-effects metaanalysis was performed using the restricted maximum likeli-hood estimator using the Knapp-Hartung adjustment to account for theuncertainty in the estimate of (residual) heterogeneity (34–37). Datasetswere analyzed with R Statistical Software using the “metafor” package (37)to calculate the effect sizes and their significance levels (Dataset S1).
Metaregression. To investigate potential driver variables of the observed SOCdifferences, we used a mixed-effects metaregression. This was also run in Rusing the “metafor” package (37).
We tested a general model, whereby differences in external C and N inputsinfluence differences in SOC between the farming systems, and wherebya range of other parameters also influences these differences. These addi-tional parameters were mean annual temperature and mean annual pre-cipitation levels; differences in clay concentrations; one variable for the samecrop rotation in the organic and nonorganic trials and one for the absence offorage legumes in the conventional systemwhile being present in the organicone; the duration of the farming system comparison; and variables for landuse types (“arable,” “grassland,” “vegetables,” and “orchards,”where “arable”is the baseline for comparison).
Nonindependent Data. Eighty-seven comparisons analyzed belonged to sets ofdependent comparisons that referred to the same conventional baseline forseveral organic treatments, to the same organic treatment for several con-ventional baselines, or (e.g., in the DOK trial: bio-dynamic D, bio-organic O,and conventional K) (12) where two organic treatments (“organic” and “bio-dynamic”) are compared with two conventional baselines (“conventional
with farmyard manure” and “conventional without farmyard manure”), re-sulting in four nonindependent comparisons). We accounted for this by alsoanalyzing the data on aggregate level for these cases (i.e., by averaging overthe conventional and/or organic treatments per study), as recommended byBorenstein et al. (38). This reduced the number of observations by replacingthe 87 comparisons with 30 aggregates. The results of such aggregatedmetaanalysis without control variables exhibited largely the same signifi-cance levels as the original results, although the values of SOC differenceswere usually about 10% higher for all three effect sizes. We do not providefurther details on this aspect, because we chose to report the more conser-vative results from the analysis on the level of single comparisons.
Global Mitigation Potential. Arable land areas are taken from the FAOSTATdatabase (http://faostat.fao.org/). We focus on arable land, because se-questration rates are not available for grasslands in our dataset. Given thatthe median duration of all trials is 8 y, the average sequestration rate of 0.27Mg C ha−1 y−1 allows the cumulative mitigation from 2010 up to 2030(∼2012+2*8) from such a switch to be estimated. It should also be noted thatthe difference in sequestration rates for net zero input systems used wasnot significant.
ACKNOWLEDGMENTS. We thank the authors of the 74 studies whoseextensive field work provided the data for this metaanalysis. Many authorswere contacted and delivered additional data and information on theirfarming system comparison for our database. This work was part of theproject Carbon Credits for Sustainable Land Use Systems (CaLas) funded bythe Mercator Foundation Switzerland. We also received support from theFood and Agriculture Organization of the United Nations in the context ofthe Round Table of Organic Agriculture and Climate Change, whose expertmeetings also contributed to this study. P.S. is a Royal Society–Wolfson Re-search Merit Award holder.
1. Smith P, et al. (2007) Agriculture. Contribution of Working Group III to the FourthAssessment Report of the Intergovernmental Panel on Climate Change 2007, edsMetz B, Davidson OR, Bosch PR, Dave R, Meyer LA (Cambridge Univ Press, Cambridge,UK), pp 497–450.
2. Smith P, et al. (2008) Greenhouse gas mitigation in agriculture. Philos Trans R SocLond B Biol Sci 363:789–813.
3. Lal R (2004) Soil carbon sequestration impacts on global climate change and foodsecurity. Science 304:1623–1627.
4. Freibauer A, Rounsevell MDA, Smith P, Verhagen J (2004) Carbon sequestration in theagricultural soils of Europe. Geoderma 122:1–23.
5. Diacono M, Montemurro F (2010) Long-term effects of organic amendments on soilfertility. A review. Agron Sustain Dev 30:401–422.
6. Niggli U, Fließbach A, Hepperly P, Scialabba N (2009) Low Greenhouse Gas Agricul-ture: Mitigation and Adaptation Potential of Sustainable Farming Systems (Food andAgriculture Organization of the United Nations, Rome).
7. Muller A, et al. (2012) Reducing Global Warming and Adapting to Climate Change:The Potential of Organic Agriculture (Working Papers in Economics 526) (GöteborgUniversity, Göteborg, Sweden).
8. Marriott EE, Wander MM (2006) Total and labile soil organic matter in organic andconventional farming systems. Soil Sci Soc Am J 70:950–959.
9. Mondelaers K, Aertsens J, Van Huylenbroeck G (2009) A meta-analysis of the differ-ences in environmental impacts between organic and conventional farming. Br Food J111:1098–1119.
10. El-Hage Scialabba N, Müller-Lindenlauf M (2010) Organic agriculture and climatechange. Renew Agr Food Syst 25:158–169.
11. Kirchmann H, Bergström L, Kätterer T, Mattsson L, Gesslein S (2007) Comparison oflong-term organic and conventional crop-livestock systems on a previously nutrient-depleted soil in Sweden. Agron J 99:960–972.
12. Leifeld J, Reiser R, Oberholzer HR (2009) Consequences of conventional versus organicfarming on soil carbon: Results from a 27-year field experiment. Agron J 101:1204–1218.
13. Leifeld J, Fuhrer J (2010) Organic farming and soil carbon sequestration: What do wereally know about the benefits? Ambio 39:585–599.
14. Azeez G (2009) Soil Carbon and Organic Farming. A Review on the Relationship Be-tween Agriculture and Soil Carbon Sequestration, and How Organic Farming CanContribute to Climate Change Mitigation and Adaptation (Soil Association, Bristol,UK).
15. FiBL, Research Institute of Organic Agriculture (2012) Farming systems comparison inthe tropics. Available at: http://www.systems-comparison.fibl.org/en/scp-home.html.Accessed May 15, 2012.
16. Watson RT, et al. (2000) Land Use, Land Use Change, and Forestry (Cambridge UnivPress, Cambridge, UK).
17. Kirchmann H, Bergström L, Kätterer T, Andrén O, Andersson R (2008) Can organiccrop production feed the world?. Organic Crop Production: Ambitions and Limi-tations, eds Kirchmann H, Bergström L (Springer Science+Business Media, Dordrecht,The Netherlands), pp 39–72.
18. Powlson DS, Whitmore AP, Goulding KWT (2011) Soil carbon sequestration to miti-gate climate change: A critical re-examination to identify the true and the false. Eur JSoil Sci 62:42–55.
19. Post WM, Kwon KC (2000) Soil carbon sequestration and land-use change: Processesand potential. Glob Change Biol 6:317–327.
20. Batjes N (1996) Total carbon and nitrogen in the soils of the world. Eur J Soil Sci 47:151–163.
21. Baker JM, Ochsner TE, Venterea TR, Griffis TJ (2007) Tillage and soil carbon seques-tration—what do we really know? Agric Ecosyst Environ 118:1–5.
22. Rethemeyer J, et al. (2005) Transformation of organic matter in agricultural soils:Radiocarbon concentration versus soil depth. Geoderma 128:94–105.
23. Fliessbach A, Imhof D, Brunner T, Wüthrich C (1999) Tiefenverteilung und zeitlicheDynamik der mikrobiellen Biomasse in biologisch und konventionell bewirtschaftetenBöden. Regio Basiliensis 3:253–263.
24. Clark DB, Xue YK, Harding RJ, Valdes PJ (2001) Modeling the impact of land surfacedegradation on the climate of tropical north Africa. J Clim 14:1809–1822.
25. Lal R (2009) Soils and world food security. Soil Tillage Res 102:1–4.26. Steinfeld H, et al. (2006) Livestock’s Long Shadow: Environmental Issues and Options
(Food and Agriculture Organization of the United Nations, Rome).27. Granstedt A, Schneider T, Seuri P, Thomsson O (2008) Ecological recycling agriculture
to reduce nutrient pollution to the Baltic Sea. Biol Agric Hortic 26:279–307.28. van Vuuren DP, et al. (2011) RCP2.6: Exploring the possibility to keep global mean
temperature increase below 2°C. Clim Change 109:95–116.29. Schader C, Stolze M, Gattinger A (2012) Environmental performance of organic ag-
riculture. Green Technologies in Food Production and Processing, eds Boye J,Arcand Y (Springer, New York), pp 183–210.
30. Nelson DW, Sommer LE (1982) Total carbon, organic carbon, and organic matter.Methods of Soil Analysis, ed Page AL (American Society of Agronomy, Madison, WI),2nd Ed, pp 539–579.
31. Eurostat (2012) Glossary: Livestock unit (LSU). Available at: http://epp.eurostat.ec.europa.eu/statistics_explained/index.php/Glossary:LSU. Accessed May 15, 2012.
32. Bundesamt für Landwirtschaft (2009) Agrarforschung: Grundlagen für die Düngung imAcker- undFutterbau 2009 (GRUDAF). (Bundesamt für Landwirtschaft, Bern, Switzerland).
33. Luo YQ, Hui DF, Zhang DQ (2006) Elevated CO2 stimulates net accumulations ofcarbon and nitrogen in land ecosystems: A meta-analysis. Ecology 87:53–63.
34. Thompson SG, Sharp SJ (1999) Explaining heterogeneity in meta-analysis: A com-parison of methods. Stat Med 18:2693–2708.
35. Higgins JPT, Thompson SG (2004) Controlling the risk of spurious findings from meta-regression. Stat Med 23:1663–1682.
36. Viechtbauer W (2005) Bias and efficiency of meta-analytic variance estimators in therandom-effects model. J Educ Behav Stat 30:261–293.
37. Viechtbauer W (2010) Conducting meta-analyses in R with the metafor package. JStat Softw 36:1–48.
38. Borenstein M, Hedges LV, Rothstein HR (2009) Introduction to Meta-analysis (Wiley& Sons, West Sussex, UK).
6 of 6 | www.pnas.org/cgi/doi/10.1073/pnas.1209429109 Gattinger et al.
Supporting InformationGattinger et al. 10.1073/pnas.1209429109SI MethodsData Sources. Further selection criteria for including a study com-paring SOC in organic vs. nonorganic systems were the following:(i) availability of field comparisons (i.e., from plots managed or-ganically and conventionally in the same field or in close vicinity,thus ensuring equal external conditions besides management as faras possible); (ii) the data provided values for SOC concentrations,SOC stocks, or C sequestration rates or information that allowed usto calculate these values (SOC concentrations, measured bulk den-sity, sampling depth, and duration of farming system comparison).The data ideally also included clear, logical reference to ag-
ricultural land use types (arable, grassland, vegetable (excludinggreenhouse cultivation), horticulture/viticulture); reported pedo-climatic conditions (mean annual temperature, mean annualprecipitation, and clay concentration); reported inclusion/exclu-sion of green manures (e.g., grass–clover leys); and includedinformation on whether there have been annual external inputs(e.g., slurry or compost) and on further characteristics of theexperimental sites (e.g., regarding crop rotations) (Dataset S1).To assess differences in SOC between farming systems, ideally,
the SOC stocks at the beginning and at the end of the reportingperiod should be known. This then allows identifying differencesin SOC stocks while accounting for differences already present atthe beginning. Thus, average C sequestration rates can be derivedand compared by dividing the increase in soil carbon stocks overthe reporting period by the length of this period. Only few studiesprovided all this information, and we therefore decided to alsoassess differences in soil C stocks and concentrations from studiesin which the baseline values were not known. This providedfurther information, although we could not identify how much ofthe difference between farming systems may be due to soil carbonvalues being different right from the beginning. Thus, resultsderived from such SOC concentration and stock comparisons areless reliable, but given the fact that all data considered originatedfrom pairwise system comparisons including controlled fieldtrials, baseline differences in SOC concentrations and stocksamong the different plots of one comparison were expected to benegligible. Results from these analyses may thus not be able toprovide accurate numbers, but robust trends can still be identified.In some cases, more than one study reported SOC results from
a particular experiment. We reported only SOC data from thestudy covering the longest period but included additional in-formation concerning field activities from studies reporting on thesame experiment but for shorter periods (Dataset S1). In 11studies, information about the duration of the nonorganicfarming practice was not available. In these cases we assumedthat the duration of the nonorganic practice was the same as forthe organic management.In the present study, soil depth was not adjusted to account for
changes in bulk density with conversion to organic agricultureunless the authors of the original data had already done so. Wethink such an adjustment might be meaningful when effects inland use changes (e.g., from forest to grassland, or arable tograssland) were studied, which was not the focus of the presentarticle. In two of 209 comparisons, the sampled soil depths variedslightly within comparative pairs. SOC corrections to uniform soildepths were not performed because these two adjustments had nosignificant effect on the difference in SOC.
Data Analysis. Besides performing the random-effects meta-analysis using the restricted maximum likelihood estimator usingthe Knapp-Hartung adjustment, we also tested results with the
empirical Bayes method, which gave very similar results (1, 2). Wealso recalculated without the Knapp and Hartung adjustment. Asexpected, this resulted in smaller confidence intervals and cor-respondingly higher significance levels. Differences affectedsignificance levels for some calculations only and by at most oneorder of magnitude. Outliers were identified via their Cook’sdistance and the diagonal elements of the hat matrix (and theother criteria provided by the “influence” function of the “met-afor” package). We then asked what caused them to be outliers.Frequent causes were very high external C inputs and SOCchanges. In the full dataset, five to nine outlying comparisons outof 209 were deleted for the three effect size measures. In thesubsets, the number of outliers was lower and for some analysiseven zero.
Metaregression. Analysis was again done with the restrictedmaximum likelihood estimator with the Knapp and Hartungadjustment and also checked with the empirical Bayes estimator(with Knapp and Hartung adjustment). Results between thesemethods did not differ much, and omitting the Knapp andHartung adjustment had similar effects as described above for themetaanalysis (i.e., slightly increasing significance levels for someanalyses). Outliers were also identified as described above.Outliers were often linked to very high external C inputs or SOCchanges. This also explained why the full dataset including out-liers showed significant results for the influence of external C andN inputs on the effect sizes, whereas these effects disappearedafter having removed the few outliers. Removing these outliers isthus crucial for unbiased results.We ran the regressions for the full dataset (after having deleted
outliers), for the subset of the data representing zero net inputsystems only, for the subset of highest data quality (i.e., reportingmeasured external inputs and bulk densities), and for combina-tions of these conditions. Because of missing values in manyvariables, running the full model considerably reduced the numberof studies retained. Thus, we also ran two reduced models. In thefirst, the difference in clay concentrations was omitted, becausethis variable had many missing values, and nonmissing values weremainly zero, with some big differences reported for others. In thesecond, only external C and N inputs were retained. The changesin significance levels and values when running these restrictedmodels (compare Dataset S1) showed that conclusions shouldonly be drawn very cautiously. Additionally, when reducing thefull dataset to subsets of zero net input systems, respectivelyimproved data quality, significance levels changed considerably,often resulting in only insignificant results remaining. Because ofthese problems, we do not draw any statistical inference fromthese regressions. We only use the results as indication of whichfactors may be influential and which may rather not. This is alsoin line with our understanding of metaanalysis as a powerful toolof descriptive rather than inferential data analysis.
Nonindependent Data. Aggregation of nonindependent data leadsto a considerable loss of information (3, 4), whereas the de-pendence on the level of single comparisons mainly results insome underestimation of variances without greatly affectingmean values. This is the result of the double-counting of iden-tical treatments or baseline data, which basically leads to anoverestimation of sample sizes by also double-counting them.The metaregressions on aggregated level showed few and mainlyweakly significant results because of the reduced number ofobservations. Owing to the descriptive and indicative character
Gattinger et al. www.pnas.org/cgi/content/short/1209429109 1 of 2
of such metaregressions, we did not further analyze these resultsor compare them with the metaregression on the level of singlecomparisons.Nonindependent data were an issue in 25 studies. In 16 studies,
more than one treatment qualified for the definition “nonorganic.”These treatments were named conventional, integrated, low-input,or no-till management in the original studies. In these cases ad-ditional pairs were formed (e.g., “organic vs. conventional” and“organic vs. integrated”). In nine studies, more than one treatmentqualified for the definition of organic. In these cases, additionalpairs were formed (e.g., “organic vs. conventional” and “bio-dy-namic vs. conventional”).
Global Mitigation Potential. Because projected crop areas in 2030are likely to be somewhat higher than today, our estimates areconservative regarding this. RCP2.6 is the representative con-centration pathway scenario with radiative forcing of 2.6 W m−2
by 2100, which is necessary to reach the 2° goal. It correspondsto cumulative emission reductions of 70% by 2100, respectivelyannual emission reductions of 95% in 2100, for which the base-line is the IMAGE 2.4 B2 scenario, which represents a mediumdevelopment in population, income, energy, and land use. Themain emission reductions in the RCP2.6 scenario are incurredbetween 2020 and 2060 (5). The cumulative emissions reductionsuntil 2030 under RCP2.6 used here are approximate numbers,derived from the information given by van Vuuren et al. (5). Wepoint out that the RCP2.6 scenario has a land use module, andthe effects of switching to organic production should ideally beassessed by implementing this in this land use model, because itwill affect other sectors and modules in the model. These num-bers for the mitigation potential from SOC sequestration repre-sent the maximum unconstrained technical potential and are notequivalent to realizable economic or market potentials (6).
1. Higgins JPT, Thompson SG (2004) Controlling the risk of spurious findings from meta-regression. Stat Med 23:1663–1682.
2. Viechtbauer W (2010) Conducting meta-analyses in R with the metafor package. J StatSoftw 36:1–48.
3. Rosenberg MSB, Adams DC, Gurevitch J (2000) Metawin: Statistical Software for Meta-Analysis (Sinauer Associates, Sunderland, MA).
4. Guo LB, Gifford RM (2002) Soil carbon stocks and land use change: A meta analysis.Glob Change Biol 8:345–360.
5. van Vuuren DP, et al. (2011) RCP2.6: Exploring the possibility to keep global meantemperature increase below 2°C. Clim Change 109:95–116.
6. Smith P (2012) Agricultural greenhouse gas mitigation potential globally, in Europeand in the UK: what have we learned in the last 20 years? Glob Change Biol 18:35–43.
Fig. S1. Map showing the locations of the comparative trials that were included in the metaanalysis. Countries where comparative trials were performed arehighlighted in dark gray; yellow dots mark the exact positions of the trials.
Dataset S1. Overview of the dataset with the (i) main variables, (ii) references, (iii) results of the metaregression, (iv) results of themetaanalysis:SOC differences over time, and (v) data and calculations for the assessment of the global mitigation potential
Dataset S1
Gattinger et al. www.pnas.org/cgi/content/short/1209429109 2 of 2


