Embed Size (px)
Citation preview
Pillar 3 Regulatory Capital and Liquidity Coverage Ratio Disclosures
for the quarterly period ended March 31, 2018
Nomura Holdings, Inc.
1
CONTENTS
PART 1: NHI Consolidated Capital Ratios ................................................................................................................. 3
CHAPTER 1 DISCLOSURE ON CAPITAL ITEMS ................................................................................................. 3
CHAPTER 2 QUALITATIVE DISCLOSURE ........................................................................................................... 9
1. Scope of Consolidation .................................................................................................................................... 9
2. Overview of Risk Management ....................................................................................................................... 11
3. Overview of Assessment on Capital Adequacy ........................................................................................... 16
4. Market Risk Management ............................................................................................................................... 16
5. Securitization ................................................................................................................................................... 18
6. Credit Risk Management................................................................................................................................. 20
7. Operational Risk Management ....................................................................................................................... 22
8. Model Risk Management................................................................................................................................. 24
9. Equity Exposures in Non-trading Book ........................................................................................................ 25
10. Qualitative Disclosure with Regard to Standardized Approach (“SA”) .................................................... 26
11. Overview of Accounting Policy for Allowance and Charge-offs ................................................................ 26
12. Disclosures related to IRB Approach ............................................................................................................ 27
13. Management of Interest Rate Risk under Non-trading Activities ............................................................... 28
14. Consolidated Balance Sheet when the Regulatory Scope of Consolidation Is Applied ......................... 29
CHAPTER 3 QUANTITATIVE DISCLOSURE (for March 31, 2018) .............................................................. 30
1. Capital Ratios of Financial Institutions that Nomura Group Owns More Than 10% of their Issued
Capital and Are Subsidiaries of Nomura Group .................................................................................................. 30
2. Credit Risk ........................................................................................................................................................ 30
3. Indicators for Assessing Global Systemically Important Banks (G-SIBs) ................................................ 32
4. Quantitative Disclosure based on Annex No. 2 and No. 7 of Pillar 3 Notice ............................................ 34
CHAPTER 4 QUANTITATIVE DISCLOSURE (for March 31, 2017) .............................................................. 56
1. Consolidated Capital Adequacy Ratio .......................................................................................................... 56
2. Capital Adequacy ............................................................................................................................................. 56
3. Credit Risk (Excluding Exposures Calculated under “Funds” Rules and Securitization Exposures) .. 57
4. Credit Risk Mitigation ...................................................................................................................................... 63
5. Counterparty Credit Risk in Derivative Trades and Long Settlement Transactions ................................ 63
6. Securitization Exposures ............................................................................................................................... 64
7. Market Risk ....................................................................................................................................................... 66
8. Equity exposures relating to non-trading activities .................................................................................... 67
CHAPTER 5 TERMS AND CONDITIONS OF THE CAPITAL INSTRUMENTS ............................................... 68
2
1. Nomura Holdings, Inc. Common Stock ............................................................................................................ 68
2. Nomura Holdings, Inc. First Series of Unsecured Perpetual Subordinated Bonds with Optional
Redemption Clause and Write-down Clause ....................................................................................................... 70
3. Nomura Holdings, Inc. Second Series of Unsecured Subordinated Bonds ............................................. 72
4. Nomura Holdings, Inc. Third Series of Unsecured Subordinated Bonds ................................................. 74
5. Nomura Holdings, Inc. Fourth Series of Unsecured Subordinated Bonds ............................................... 76
6. Nomura Holdings, Inc. Fifth Series of Unsecured Subordinated Bonds .................................................. 78
7. Nomura Securities Co., Ltd. Subordinated Loan ......................................................................................... 80
8. Nomura Securities Co., Ltd. Subordinated Loan ......................................................................................... 82
9. Capital Nomura Securities Public Co., Ltd. Minority Interest ..................................................................... 84
10. Nomura Asset Management Taiwan Ltd. Minority Interest ......................................................................... 86
11. Chi-X Global Holdings LLC Minority Interest ............................................................................................... 88
12. Sugimura Warehouse Co., Ltd. Minority Interest ......................................................................................... 90
13. Shanghai Nomura Lujiazui Investment Management Co., Ltd. Minority Interest ..................................... 92
14. Wealth Square Co., Ltd. Minority Interest ..................................................................................................... 94
CHAPTER 6 DISCLOSURE ON LEVERAGE RATIO ....................................................................................... 96
PART 2: NHI Consolidated Liquidity Coverage Ratios ........................................................................................... 97
CHAPTER 1 QUANTITATIVE DISCLOSURE ......................................................................................................... 97
CHAPTER 2 QUALITATIVE DISCLOSURE ............................................................................................................ 99
1. Consolidated Liquidity Coverage Ratio Fluctuations Explained in a Chronological Order ................... 99
2. Assessment of the Levels of the Consolidated Liquidity Coverage Ratio ............................................... 99
3. Composition of the Stock of High Quality Liquid Assets ........................................................................... 99
4. Other Matters Relating to Consolidated Liquidity Coverage Ratio ........................................................... 99
CHAPTER 3 DISCLOSURE ON LIQUIDITY RISK MANAGEMENT POLICY ................................................... 100
1. Liquidity Risk Management Policy and Operation .................................................................................... 100
2. Liquidity Risk Management Framework ..................................................................................................... 100
PART 3: Disclosure Policy ....................................................................................................................................... 103
3
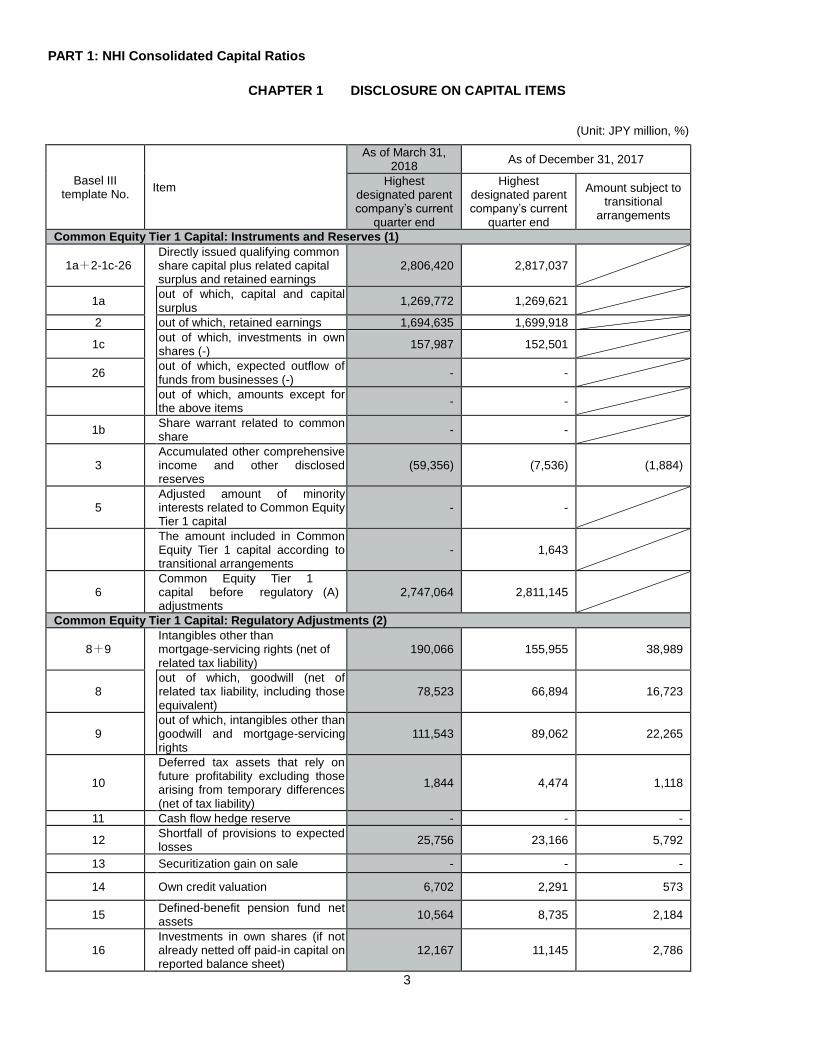
PART 1: NHI Consolidated Capital Ratios
CHAPTER 1 DISCLOSURE ON CAPITAL ITEMS
(Unit: JPY million, %)
Basel III template No.
Item
As of March 31, 2018
As of December 31, 2017
Highest designated parent company’s current
quarter end
Highest designated parent company’s current
quarter end
Amount subject to transitional
arrangements
Common Equity Tier 1 Capital: Instruments and Reserves (1)
1a+2-1c-26 Directly issued qualifying common share capital plus related capital surplus and retained earnings
2,806,420 2,817,037
1a out of which, capital and capital surplus
1,269,772 1,269,621
2 out of which, retained earnings 1,694,635 1,699,918
1c out of which, investments in own shares (-)
157,987 152,501
26 out of which, expected outflow of funds from businesses (-)
- -
out of which, amounts except for the above items
- -
1b Share warrant related to common share
- -
3 Accumulated other comprehensive income and other disclosed reserves
(59,356) (7,536) (1,884)
5 Adjusted amount of minority interests related to Common Equity Tier 1 capital
- -
The amount included in Common Equity Tier 1 capital according to transitional arrangements
- 1,643
6 Common Equity Tier 1 capital before regulatory adjustments
(A) 2,747,064 2,811,145
Common Equity Tier 1 Capital: Regulatory Adjustments (2)
8+9 Intangibles other than mortgage-servicing rights (net of related tax liability)
190,066 155,955 38,989
8 out of which, goodwill (net of related tax liability, including those equivalent)
78,523 66,894 16,723
9 out of which, intangibles other than goodwill and mortgage-servicing rights
111,543 89,062 22,265
10
Deferred tax assets that rely on future profitability excluding those arising from temporary differences (net of tax liability)
1,844 4,474 1,118
11 Cash flow hedge reserve - - -
12 Shortfall of provisions to expected losses
25,756 23,166 5,792
13 Securitization gain on sale - - -
14 Own credit valuation 6,702 2,291 573
15 Defined-benefit pension fund net assets
10,564 8,735 2,184
16 Investments in own shares (if not already netted off paid-in capital on reported balance sheet)
12,167 11,145 2,786
4
(Unit: JPY million, %)
Basel III template No.
Item
As of March 31, 2018
As of December 31, 2017
Highest designated parent company’s current
quarter end
Highest designated parent company’s current
quarter end
Amount subject to transitional
arrangements
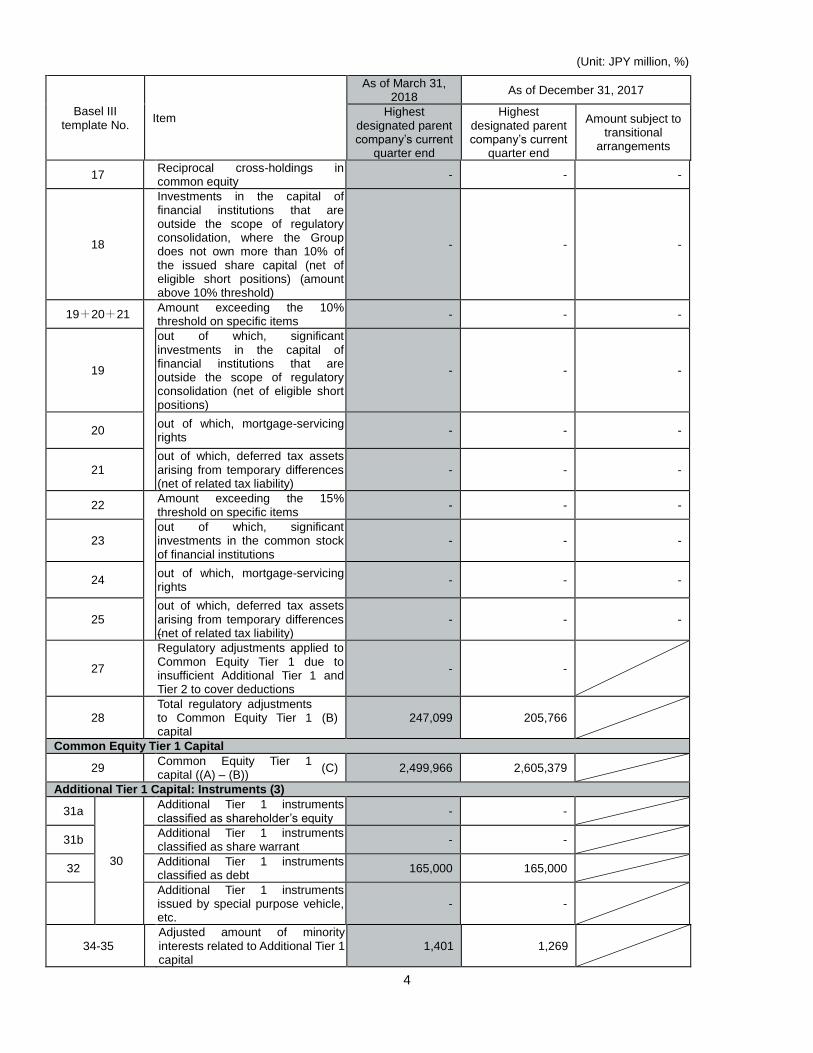
17 Reciprocal cross-holdings in common equity
- - -
18
Investments in the capital of financial institutions that are outside the scope of regulatory consolidation, where the Group does not own more than 10% of the issued share capital (net of eligible short positions) (amount above 10% threshold)
- - -
19+20+21 Amount exceeding the 10% threshold on specific items
- - -
19
out of which, significant investments in the capital of financial institutions that are outside the scope of regulatory consolidation (net of eligible short positions)
- - -
20 out of which, mortgage-servicing rights
- - -
21 out of which, deferred tax assets arising from temporary differences (net of related tax liability)
- - -
22 Amount exceeding the 15% threshold on specific items
- - -
23 out of which, significant investments in the common stock of financial institutions
- - -
24 out of which, mortgage-servicing rights
- - -
25 out of which, deferred tax assets arising from temporary differences (net of related tax liability)
- - -
27
Regulatory adjustments applied to Common Equity Tier 1 due to insufficient Additional Tier 1 and Tier 2 to cover deductions
- -
28 Total regulatory adjustments to Common Equity Tier 1 capital
(B) 247,099 205,766
Common Equity Tier 1 Capital
29 Common Equity Tier 1 capital ((A) – (B))
(C) 2,499,966 2,605,379
Additional Tier 1 Capital: Instruments (3)
31a
30
Additional Tier 1 instruments classified as shareholder’s equity
- -
31b Additional Tier 1 instruments classified as share warrant
- -
32 Additional Tier 1 instruments classified as debt
165,000 165,000
Additional Tier 1 instruments issued by special purpose vehicle, etc.
- -
34-35 Adjusted amount of minority interests related to Additional Tier 1 capital
1,401 1,269
5
(Unit: JPY million, %)
Basel III template No.
Item
As of March 31, 2018
As of December 31, 2017
Highest designated parent company’s current
quarter end
Highest designated parent company’s current
quarter end
Amount subject to transitional
arrangements
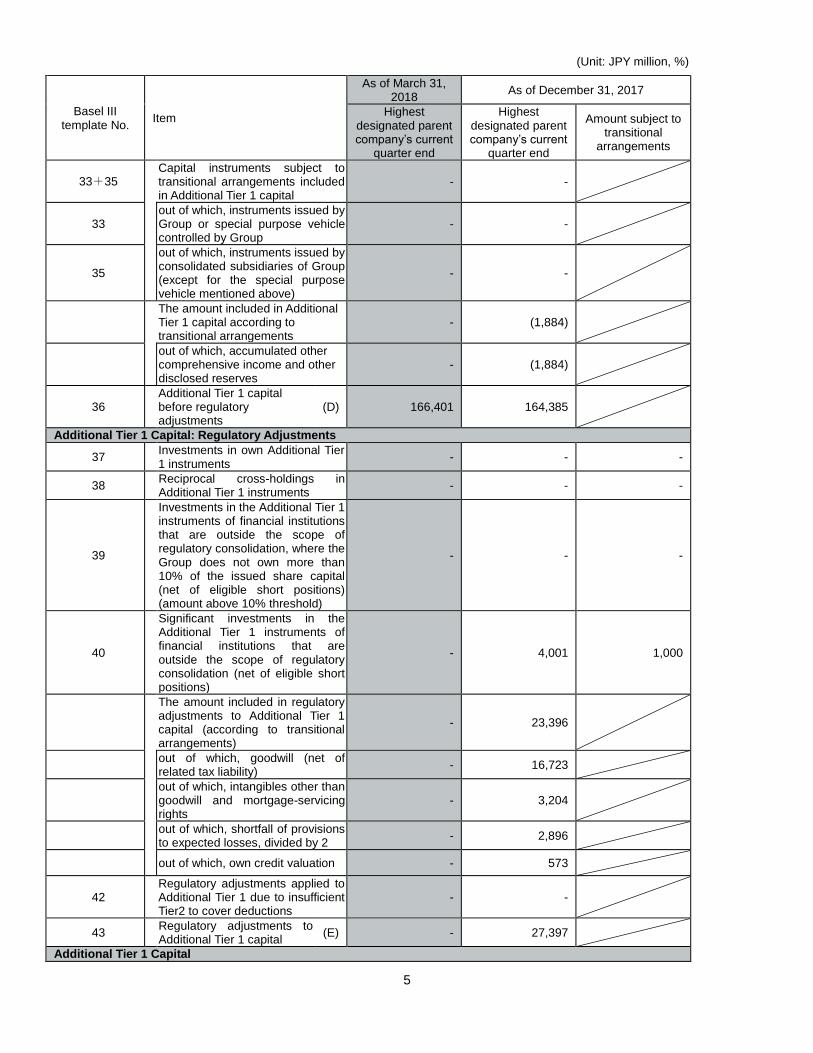
33+35 Capital instruments subject to transitional arrangements included in Additional Tier 1 capital
- -
33 out of which, instruments issued by Group or special purpose vehicle controlled by Group
- -
35
out of which, instruments issued by consolidated subsidiaries of Group (except for the special purpose vehicle mentioned above)
- -
The amount included in Additional Tier 1 capital according to transitional arrangements
- (1,884)
out of which, accumulated other comprehensive income and other disclosed reserves
- (1,884)
36 Additional Tier 1 capital before regulatory adjustments
(D) 166,401 164,385
Additional Tier 1 Capital: Regulatory Adjustments
37 Investments in own Additional Tier 1 instruments
- - -
38 Reciprocal cross-holdings in Additional Tier 1 instruments
- - -
39
Investments in the Additional Tier 1 instruments of financial institutions that are outside the scope of regulatory consolidation, where the Group does not own more than 10% of the issued share capital (net of eligible short positions) (amount above 10% threshold)
- - -
40
Significant investments in the Additional Tier 1 instruments of financial institutions that are outside the scope of regulatory consolidation (net of eligible short positions)
- 4,001 1,000
The amount included in regulatory adjustments to Additional Tier 1 capital (according to transitional arrangements)
- 23,396
out of which, goodwill (net of related tax liability)
- 16,723
out of which, intangibles other than goodwill and mortgage-servicing rights
- 3,204
out of which, shortfall of provisions to expected losses, divided by 2
- 2,896
out of which, own credit valuation - 573
42 Regulatory adjustments applied to Additional Tier 1 due to insufficient Tier2 to cover deductions
- -
43 Regulatory adjustments to Additional Tier 1 capital
(E) - 27,397
Additional Tier 1 Capital
6
(Unit: JPY million, %)
Basel III template No.
Item
As of March 31, 2018
As of December 31, 2017
Highest designated parent company’s current
quarter end
Highest designated parent company’s current
quarter end
Amount subject to transitional
arrangements
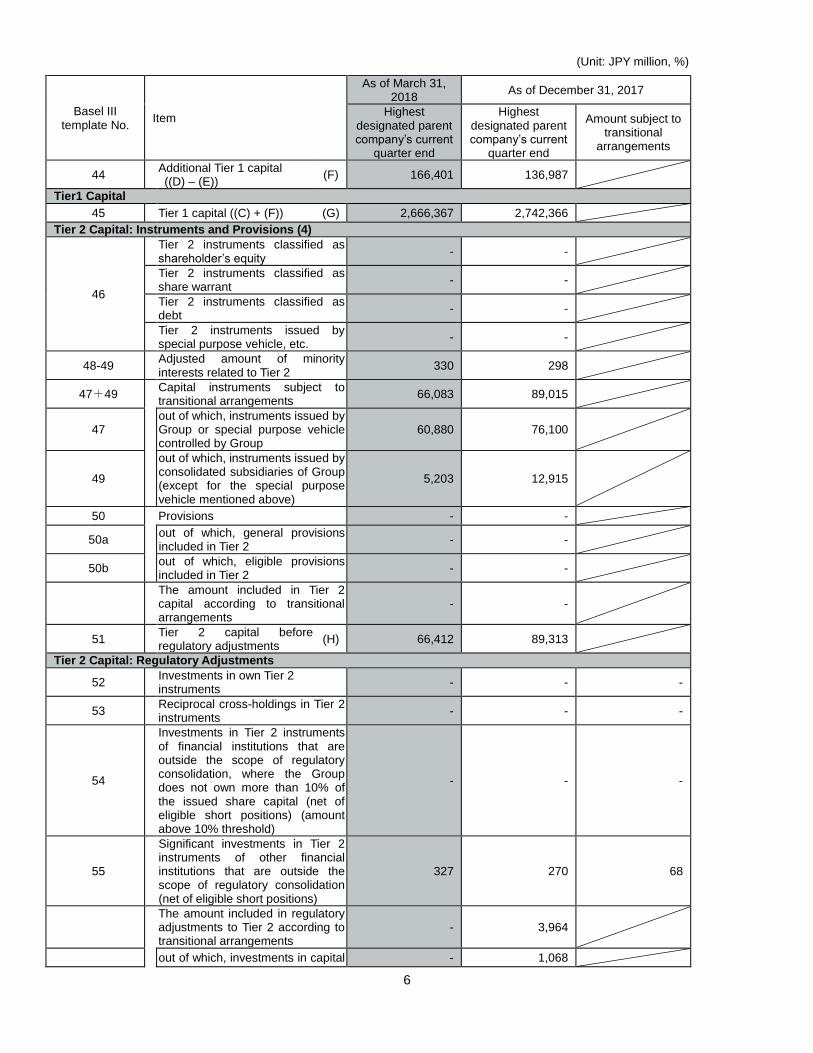
44 Additional Tier 1 capital ((D) – (E))
(F) 166,401 136,987
Tier1 Capital
45 Tier 1 capital ((C) + (F)) (G) 2,666,367 2,742,366
Tier 2 Capital: Instruments and Provisions (4)
46
Tier 2 instruments classified as shareholder’s equity
- -
Tier 2 instruments classified as share warrant
- -
Tier 2 instruments classified as debt
- -
Tier 2 instruments issued by special purpose vehicle, etc.
- -
48-49 Adjusted amount of minority interests related to Tier 2
330 298
47+49 Capital instruments subject to transitional arrangements
66,083 89,015
47
out of which, instruments issued by Group or special purpose vehicle controlled by Group
60,880 76,100
49
out of which, instruments issued by consolidated subsidiaries of Group (except for the special purpose vehicle mentioned above)
5,203 12,915
50 Provisions - -
50a
out of which, general provisions included in Tier 2
- -
50b out of which, eligible provisions included in Tier 2
- -
The amount included in Tier 2 capital according to transitional arrangements
- -
51 Tier 2 capital before regulatory adjustments
(H) 66,412 89,313
Tier 2 Capital: Regulatory Adjustments
52 Investments in own Tier 2 instruments
- - -
53 Reciprocal cross-holdings in Tier 2 instruments
- - -
54
Investments in Tier 2 instruments of financial institutions that are outside the scope of regulatory consolidation, where the Group does not own more than 10% of the issued share capital (net of eligible short positions) (amount above 10% threshold)
- - -
55
Significant investments in Tier 2 instruments of other financial institutions that are outside the scope of regulatory consolidation (net of eligible short positions)
327 270 68
The amount included in regulatory adjustments to Tier 2 according to transitional arrangements
- 3,964
out of which, investments in capital - 1,068
7
(Unit: JPY million, %)
Basel III template No.
Item
As of March 31, 2018
As of December 31, 2017
Highest designated parent company’s current
quarter end
Highest designated parent company’s current
quarter end
Amount subject to transitional
arrangements
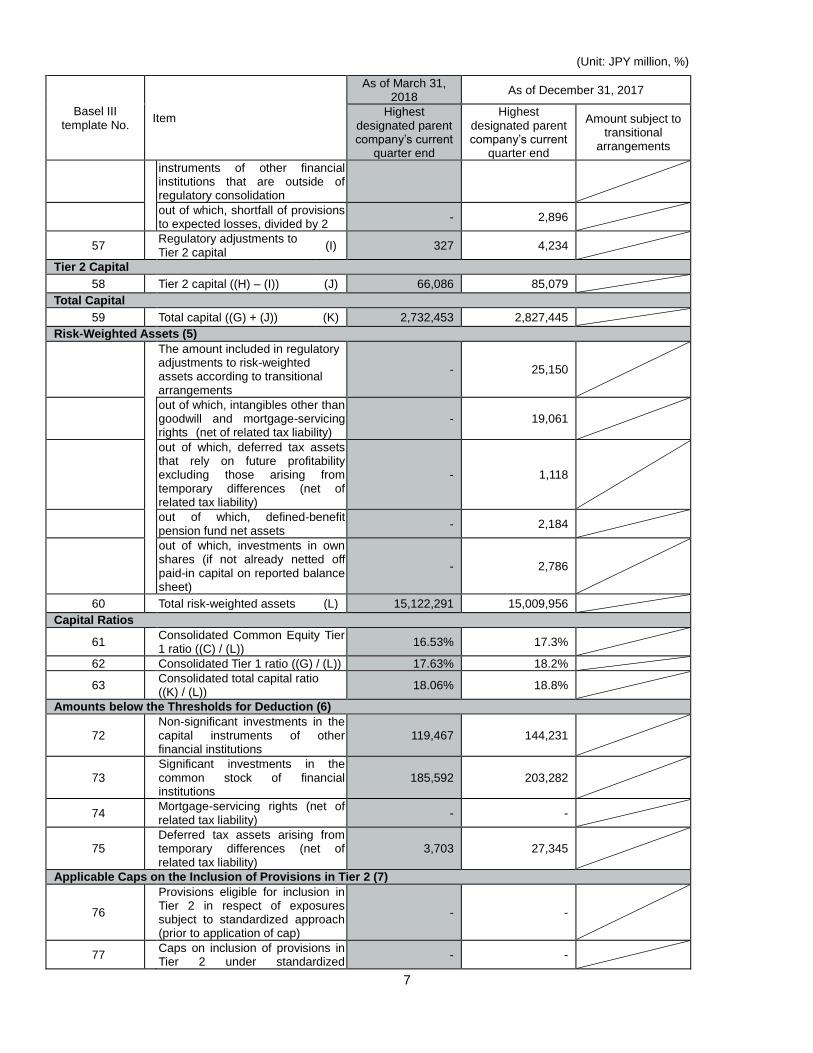
instruments of other financial institutions that are outside of regulatory consolidation
out of which, shortfall of provisions to expected losses, divided by 2
- 2,896
57 Regulatory adjustments to Tier 2 capital
(I) 327 4,234
Tier 2 Capital
58 Tier 2 capital ((H) – (I)) (J) 66,086 85,079
Total Capital
59 Total capital ((G) + (J)) (K) 2,732,453 2,827,445
Risk-Weighted Assets (5)
The amount included in regulatory adjustments to risk-weighted assets according to transitional arrangements
- 25,150
out of which, intangibles other than goodwill and mortgage-servicing rights (net of related tax liability)
- 19,061
out of which, deferred tax assets that rely on future profitability excluding those arising from temporary differences (net of related tax liability)
- 1,118
out of which, defined-benefit pension fund net assets
- 2,184
out of which, investments in own shares (if not already netted off paid-in capital on reported balance sheet)
- 2,786
60 Total risk-weighted assets (L) 15,122,291 15,009,956
Capital Ratios
61 Consolidated Common Equity Tier 1 ratio ((C) / (L))
16.53% 17.3%
62 Consolidated Tier 1 ratio ((G) / (L)) 17.63% 18.2%
63 Consolidated total capital ratio ((K) / (L))
18.06% 18.8%
Amounts below the Thresholds for Deduction (6)
72 Non-significant investments in the capital instruments of other financial institutions
119,467 144,231
73 Significant investments in the common stock of financial institutions
185,592 203,282
74 Mortgage-servicing rights (net of related tax liability)
- -
75 Deferred tax assets arising from temporary differences (net of related tax liability)
3,703 27,345
Applicable Caps on the Inclusion of Provisions in Tier 2 (7)
76
Provisions eligible for inclusion in Tier 2 in respect of exposures subject to standardized approach (prior to application of cap)
- -
77 Caps on inclusion of provisions in Tier 2 under standardized
- -
8
(Unit: JPY million, %)
Basel III template No.
Item
As of March 31, 2018
As of December 31, 2017
Highest designated parent company’s current
quarter end
Highest designated parent company’s current
quarter end
Amount subject to transitional
arrangements
approach
78
Provisions eligible for inclusion in Tier 2 in respect of exposures subject to internal ratings-based approach (prior to application of cap) (if the amount is negative, report as “nil”)
- -
79 Caps on inclusion of eligible provisions in Tier 2 under internal ratings-based approach
- -
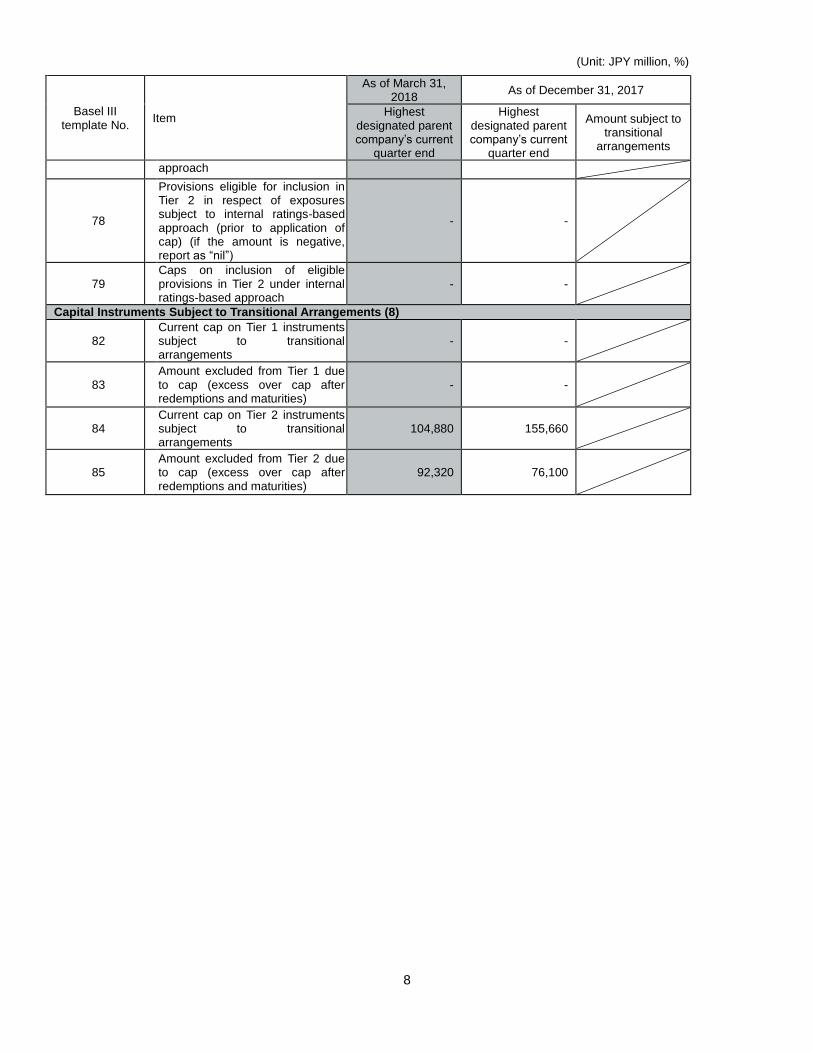
Capital Instruments Subject to Transitional Arrangements (8)
82 Current cap on Tier 1 instruments subject to transitional arrangements
- -
83 Amount excluded from Tier 1 due to cap (excess over cap after redemptions and maturities)
- -
84 Current cap on Tier 2 instruments subject to transitional arrangements
104,880 155,660
85 Amount excluded from Tier 2 due to cap (excess over cap after redemptions and maturities)
92,320 76,100
9
CHAPTER 2 QUALITATIVE DISCLOSURE
1. Scope of Consolidation
(1) Differences between those companies belonging to the corporate group (“Nomura Group”) to which the
calculation of consolidated capital adequacy ratio as stipulated in Article 2 of the Consolidated Capital Adequacy
Notice on Final Designated Parent Company (the “Capital Adequacy Notice”) published by Financial Services
Agency of Japan (“FSA”) is applicable and those companies that are included in the scope of consolidation based
on consolidation rule for preparation of consolidated financial statements (the “scope of consolidation for
accounting purposes”) and the reason for such differences.
Consolidated insurance subsidiaries are treated as unconsolidated subsidiaries as per Article 3, Paragraph
3 of the Capital Adequacy Notice.
Consolidated VIEs are treated as unconsolidated subsidiaries in calculating our capital adequacy ratio in
consideration of the economic substance. Therefore, intra-company transactions with such VIEs are not
eliminated and counterparty credit risk arising from those transactions is included in credit RWA (risk-weighted
assets) for the purpose of the calculation of our capital adequacy ratio. In addition, any investments by non-VIE
Nomura Group entities in the assets under management by such VIEs are captured in RWA for either credit or
market risk.
(2) Number of consolidated subsidiaries, and names and principal businesses of major consolidated subsidiaries of
the holding company group
There are 187 companies as of March 31st, 2018.
Nomura Securities Co., Ltd (Japan, securities business), Nomura International PLC (United Kingdom,
securities business), Nomura Securities International Inc. (U.S.A, securities business), Nomura International
(Hong Kong) Limited (Hong Kong, securities business) and Nomura Financial Products & Services, Inc. (Japan,
securities business) and others.
(3) Number of affiliated companies which engaged in financial operations which are subject to the provisions of
Articles 9 of the Capital Adequacy Notice, as well as their names, amounts of total assets and net assets shown
on the balance sheet, and principal businesses
Not applicable.
(4) Names, amounts of total assets and net assets shown on the balance sheet, and principal businesses of (i)
companies which belong to Nomura Group but are not included in the scope of consolidation for accounting
purposes and (ii) companies which do not belong to Nomura Group but are included in the scope of consolidation
for accounting purposes.
There are no such companies which fall under (i) above.
As of March 31st, 2018, the following companies fall under (ii):
Nomura Reinsurance ICC Limited, (Guernsey, insurance business, total assets of 0.05 billion yen and net
assets of 0.05 billion yen);
Nomura Reinsurance 1 IC Limited (Guernsey, insurance business, total assets of 21.0 billion yen and net
assets of 1.4 billion yen);
Nomura Reinsurance 3 IC Limited (Guernsey, insurance business, total assets of 3.8 billion yen and net
assets of 0.3 billion yen);
Nomura Reinsurance 5IC Limited (Guernsey, insurance business, total assets of 2.9 billion yen and net
10
assets of 0.8 billion yen);
US CB Reinsurance 1 IC Limited (Guernsey, insurance business, total assets of 1.2 billion yen and net
assets of 1.1 billion yen);
US CB Reinsurance 2 IC Limited (Guernsey, insurance business, total assets of 0.6 billion yen and net
assets of 0.6 billion yen);
Nomura Americas Re. Ltd. (Bermuda, insurance business, total assets of 4.6 billion yen and net assets of
3.8 billion yen);
Nomura Americas US Re Ltd. (Bermuda, insurance business, total assets of 1.7 billion yen and net assets
of 1.5 billion yen), as well as 1,084 VIEs.
(5) Outline of restrictions on transfer of funds or capital within Nomura Group.
In making decision on any transfer of funds or capital within Nomura Group, we make sure that the holding
company and subsidiaries of Nomura Group will remain compliant with relevant capital adequacy regulations and
it would neither compromise the soundness of respective companies’ operation nor cause negative impacts on
their ability to fulfill payment obligations as well as their liquidity profile and profitability.
11
2. Overview of Risk Management
Business activities of Nomura Group are exposed to various risks such as market risk, credit risk, operational risk and
other risks caused by external factors. Nomura Group has established a risk management framework to control, monitor
and report those risks in a comprehensive manner in order to maintain financial soundness and to sustain and enhance its
enterprise value.
(1) Risk Management
Nomura Group defines risks as (i) the potential erosion of Nomura Group’s capital base due to unexpected losses
arising from risks to which its business operations are exposed, such as market risk, credit risk, operational risk and model
risk, (ii) liquidity risk, the potential lack of access to funds or higher cost of funding than normal levels due to a deterioration
in Nomura Group’s creditworthiness or deterioration in market conditions, and (iii) business risk, the potential failure of
revenues to cover costs due to a deterioration in the earnings environment or a deterioration in the efficiency or
effectiveness of its business operations. A fundamental principle established by Nomura Group is that all employees shall
regard themselves as principals of risk management and appropriately manage these risks. Nomura Group seeks to
promote a culture of proactive risk management throughout all levels of the organization and to limit risks to the confines of
its risk appetite. The risk management framework that Nomura Group uses to manage these risks consists of its risk
appetite, risk management governance and oversight, the management of financial resources, the management of all risk
classes, and processes to measure and control risks. Each of these key components is explained in further detail below.
(2) Risk Appetite
Nomura Group has determined the types and maximum level of risk that it is willing to assume in pursuit of its
strategic objectives and business plan and has articulated in its Risk Appetite Statement. This document is jointly submitted
by the Chief Risk Officer (“CRO”) and the Chief Financial Officer (“CFO”) to the Executive Management Board (“EMB”) for
approval.
The Risk Appetite Statement provides an aggregated view of risk and includes capital adequacy and balance sheet
measures, liquidity risk, market and credit risk, operational risk, compliance risk and model risk, and consists of quantitative
metrics and qualitative statements. It is subject to regular monitoring and breach escalation as appropriate by the owner of
the relevant risk appetite statement.
Nomura Group’s Risk Appetite Statement is required to be reviewed annually by the EMB but is reviewed on an ad
hoc basis, and must specifically be reviewed following any significant changes in Nomura Group’s strategy. Risk appetite
underpins Nomura Group’s entire risk management framework.
12
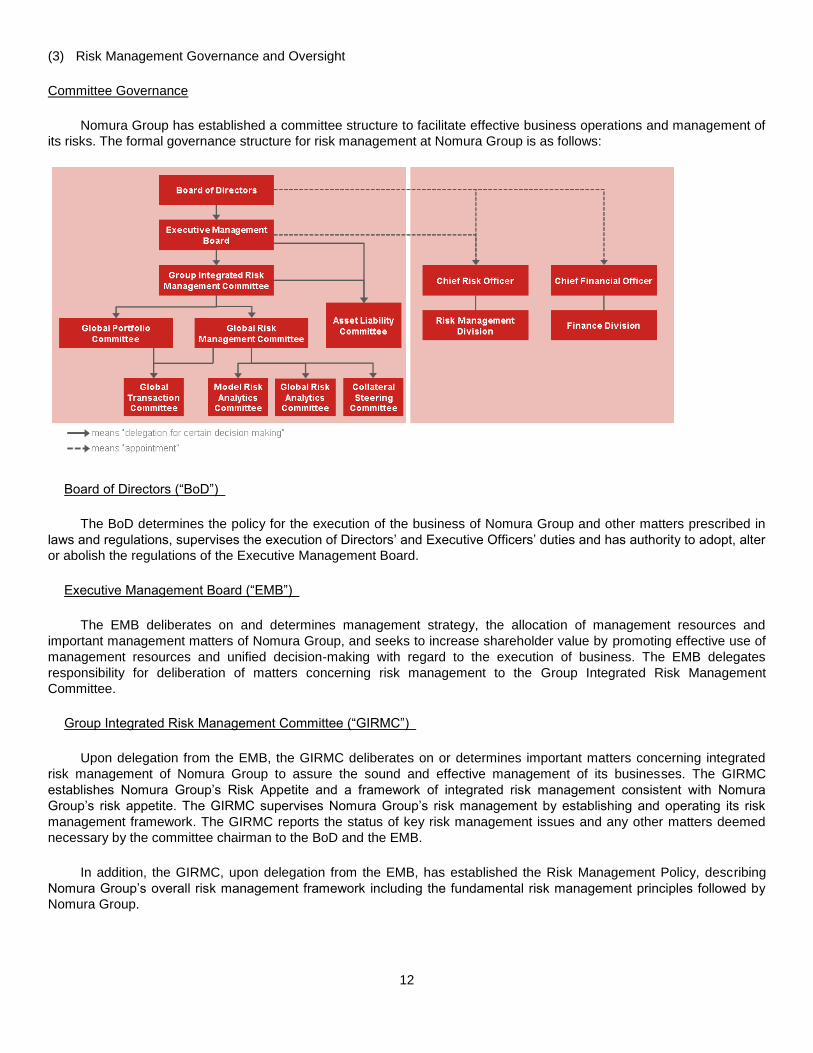
(3) Risk Management Governance and Oversight
Committee Governance
Nomura Group has established a committee structure to facilitate effective business operations and management of
its risks. The formal governance structure for risk management at Nomura Group is as follows:
Board of Directors (“BoD”)
The BoD determines the policy for the execution of the business of Nomura Group and other matters prescribed in
laws and regulations, supervises the execution of Directors’ and Executive Officers’ duties and has authority to adopt, alter
or abolish the regulations of the Executive Management Board.
Executive Management Board (“EMB”)
The EMB deliberates on and determines management strategy, the allocation of management resources and
important management matters of Nomura Group, and seeks to increase shareholder value by promoting effective use of
management resources and unified decision-making with regard to the execution of business. The EMB delegates
responsibility for deliberation of matters concerning risk management to the Group Integrated Risk Management
Committee.
Group Integrated Risk Management Committee (“GIRMC”)
Upon delegation from the EMB, the GIRMC deliberates on or determines important matters concerning integrated
risk management of Nomura Group to assure the sound and effective management of its businesses. The GIRMC
establishes Nomura Group’s Risk Appetite and a framework of integrated risk management consistent with Nomura
Group’s risk appetite. The GIRMC supervises Nomura Group’s risk management by establishing and operating its risk
management framework. The GIRMC reports the status of key risk management issues and any other matters deemed
necessary by the committee chairman to the BoD and the EMB.
In addition, the GIRMC, upon delegation from the EMB, has established the Risk Management Policy, describing
Nomura Group’s overall risk management framework including the fundamental risk management principles followed by
Nomura Group.
13
Global Risk Management Committee (“GRMC”)
Upon delegation from the GIRMC, the GRMC deliberates on or determines, based on strategic risk allocation and risk
appetite determined by the GIRMC, important matters concerning market, credit, operational risk or reputational risk
management of Nomura Group in order to assure the sound and effective management of Nomura Group’s businesses.
The GRMC reports to the GIRMC the status of discussions at its meetings and any other matters as deemed necessary by
the committee chairman.
Global Portfolio Committee (“GPC”)
Upon delegation from the GIRMC, the GPC deliberates on or determines all matters in relation to the management of
a specific portfolio, for the purpose of achieving a risk profile consistent with the risk allocation and risk appetite of Nomura.
The portfolio consists of businesses and products that fall within at least one of the three following categories: event
financing, term financing and asset-based financing.
Asset Liability Committee (“ALCO”)
Upon delegation from the EMB and the GIRMC, the ALCO deliberates on, based on Nomura Group’s risk appetite
determined by the EMB, balance sheet management, financial resource allocation, liquidity management and related
matters. The ALCO reports to the GIRMC the status of discussions at its meetings and any other matters as deemed
necessary by the committee chairman.
Global Risk Analytics Committee (“GRAC”) and Model Risk Analytics Committee (“MRAC”)
Upon delegation from the GRMC, the GRAC and the MRAC deliberate on or determine matters concerning the
development, management and strategy of risk models and valuation models, respectively. The committees’ primary
responsibility is to govern and provide oversight of model management, including the approval of new models and
significant model changes. Both committees report all significant matters and material decisions taken to the GRMC, on a
regular basis.
Global Transaction Committee (“GTC”)
Upon delegation from the GRMC and the GPC, the GTC deliberates on or determines individual transactions in line
with Nomura’s risk appetite determined by the GIRMC and thereby assures the sound and effective management of
Nomura’s businesses.
Collateral Steering Committee (“CSC”)
Upon delegation from the GRMC, the CSC deliberates on or determines Nomura’s collateral risk management,
including concentrations, liquidity, collateral re-use, limits and stress tests, provides direction on Nomura’s collateral
strategy and ensures compliance with regulatory collateral requirements.
CRO
The CRO is responsible for setting the overall strategy and direction of the Risk Management Division. The CRO is
responsible for supervising the Risk Management Division and maintaining the effectiveness of the risk management
framework independently from the business units within Nomura Group. The CRO regularly reports on the status of
Nomura Group’s risk management to the GIRMC, and reports to and seeks the approval of the GIRMC on measures
required for risk management.
CFO
The CFO is responsible for overall financial strategy of Nomura Group and, upon delegation from the EMB, has
operational authority and responsibility over Nomura’s liquidity management based on decisions made by the EMB.
14
(4) Risk Management Division
The Risk Management Division comprises various departments or units in charge of risk management established
independently from Nomura Group’s business units. The Risk Management Division is responsible for establishing and
operating risk management processes, establishing and enforcing risk management policies and regulations, verifying the
effectiveness of risk management methods, gathering reports from Nomura Group entities, reporting to Executive
Officers/Senior Managing Directors and the GIRMC and others, as well as reporting to regulatory bodies and handling
regulatory applications concerning risk management methods and other items as necessary. Important risk management
issues are closely communicated between members of the Risk Management departments and the CRO. The CRO and/or
Co-CRO regularly attend the EMB and GIRMC meetings to report specific risk issues.
(5) Risk Policy Framework
Policies and procedures are essential tools of governance used by the Risk Management Division. They define
principles, rules and standards, and the specific processes that must be adhered to in order to effectively manage risk at
Nomura Group. The Risk Management Division has established a risk policy framework to promote appropriate standards
and consistency for risk policies and procedures and to articulate the principles and procedures conducive to effective risk
management. All risk management policies and procedures are developed in line with this policy framework and a defined
process is followed for any exceptions.
(6) Monitoring, Reporting and Data Integrity
Development, consolidation, monitoring and reporting of risk management information (“risk MI”) are fundamental to
the appropriate management of risk. The aim of all risk MI is to provide a basis for sound decision-making, action and
escalation as required. The Risk Management Division and the Finance Division are responsible for producing regular risk
MI, which reflects the position of Nomura Group relative to stated risk appetite. Risk MI includes information from across
the risk classes defined in the risk management framework and reflect the use of the various risk tools used to identify and
assess those risks. The Risk Management Division is responsible for implementing appropriate controls over data integrity
for risk MI.
(7) Management of Financial Resources
Nomura Group has established a framework for management of financial resources in order to adequately manage
utilization of these resources. The EMB allocates financial resources to business units at the beginning of each financial
year. These allocations are used to set revenue forecasts for each business units. Key components are set out below:
Risk-weighted Assets (RWA)
RWA is calculated from risk amounts used for the measurement of consolidated capital adequacy ratios. The EMB
sets RWA limits for business divisions, etc. in accordance with the prudential standards on a consolidated basis for NHI
(Nomura Holdings Inc.). Finance Division is responsible for monitoring usage amounts under RWA limits and reporting
them to the EMB.
Economic Capital
Nomura Group’s internal measure of the capital required to support its business is the Nomura Capital Allocation
Target (“NCAT”), which is measured as the amount of capital required to absorb unexpected losses over a one-year time
horizon under a severely adverse scenario. For quantification purposes, a severely adverse scenario is defined as the
unexpected loss computed by risk models at the 99.95th percentile. NCAT consists of i) portfolio NCAT, which captures the
risks directly impacting the value of specific positions such as market risk, credit risk, asset liquidity risk and other risks
such as event risk to account for portfolio risks not easily covered in a historically calibrated model, and ii) non-portfolio
NCAT, which captures the risks not directly affecting the value of specific positions, such as operational risk and business
risk. Nomura Group’s NCAT limit is initially set by the EMB, and the EMB subsequently allocates it to each business
division and additional lower levels of the organization.
15
Available Funds
The CFO decides the maximum amount of available funds, provided without posting of any collateral, for allocation
within Nomura Group and the EMB approves the allocation of the funds to each business division. Global Treasury
monitors the usage by businesses and reports to the EMB.
Leverage Exposure
Leverage exposure is calculated from exposure amounts used for the measurement of consolidated leverage ratio.
The EMB sets leverage exposure limits for business divisions, etc. in accordance with the prudential standards on a
consolidated basis for NHI. Finance Division is responsible for monitoring usage amounts under leverage exposure limits
and reporting them to the EMB.
(8) Risk category and definition
Nomura Group classifies and defines risks as follows and has established departments or units to manage each risk
type.
Risk Category
Definition
Market risk Risk of loss arising from fluctuations in the value of financial assets and liabilities (including
off-balance sheet items) due to fluctuations in market risk factors (interest rates, foreign
exchange rates, prices of securities and others).
Credit risk Risk of loss arising from an obligor or counterparty’s default, insolvency or administrative
proceeding which results in the obligor’s failure to meet its contractual obligations in
accordance with agreed terms. This includes both on and off-balance sheet exposures. It is
also the risk of loss arising through a credit valuation adjustment (“CVA”) associated with
deterioration in the creditworthiness of a counterparty.
Operational risk Risk of loss resulting from inadequate or failed internal processes, people and systems or
from external events. It excludes strategic risk (the risk of loss as a result of poor strategic
business decisions), but includes the risk of breach of legal and regulatory requirements and
causing damage to Nomura Group’s reputation if caused by an operational risk.
Model Risk Risk of loss arising from model errors or incorrect or inappropriate model application with
regard to valuation models and risk models.
Funding and Liquidity risk Risk of loss arising from difficulty in securing necessary funding or from a significantly higher
cost of funding than normal levels due to deterioration in Nomura Group’s creditworthiness or
deterioration in market conditions.
Business risk Risk of failure of revenues to cover costs due to deterioration in the earnings environment or
deterioration in the efficiency or effectiveness of Nomura Group’s business operations.
Managing business risk is the responsibility of Nomura Group’s Executive Managing
Directors and Senior Managing Directors.
16
3. Overview of Assessment on Capital Adequacy
Stress testing is conducted regularly based on scenarios and assumptions which are designed to cover our portfolio
comprehensively. For example, we stress-test our current portfolio by simulating the credit crisis of 2008, in which we
measure the impact on capital and potential realized losses. We try to enhance the accuracy and relevancy of the results
by taking into consideration the characteristics of the portfolios (e.g. type of products or expected holding period), the
potential effect of hedging, and the expected time for profits and losses to be realized. In assessing capital adequacy, we
also consider other types of risk we are exposed to, not only those surrounding our portfolio, but also operational risks and
changes to fee pools under such scenarios, to incorporate overall impacts to Nomura Group.
4. Market Risk Management
Market risk is the risk of loss arising from fluctuations in the value of financial assets and liabilities (including
off-balance sheet items) due to fluctuations in market risk factors (interest rates, foreign exchange rates, prices of
securities and others).
(1) Market Risk Management Process
Effective management of market risk requires the ability to analyze a complex and evolving portfolio in a constantly
changing global market environment, identify problematic trends and ensure that appropriate action is taken in a timely
manner.
Nomura Group uses a variety of statistical risk measurement tools to assess and monitor market risk on an ongoing
basis, including, but not limited to, Value at Risk (“VaR”), Stressed VaR (“SVaR”) and Incremental Risk Charge (“IRC”). In
addition, Nomura Group uses sensitivity analysis and stress testing to measure and analyze its market risk. Sensitivities
are measures used to show the potential changes to a portfolio due to standard moves in market risk factors. They are
specific to each asset class and cannot usually be aggregated across risk factors. Stress testing enables the analysis of
portfolio risks or tail risks, including non-linear behaviors and can be aggregated across risk factors at any level of the
group hierarchy, from group level to business division, units or desk levels. Market risk is monitored against a set of
approved limits, with daily reports and other management information provided to the business units and senior
management.
(2) Value at Risk
VaR is a measure of the potential loss due to adverse movements of market factors, such as equity prices, interest
rates, credit, foreign exchange rates, and commodities with associated volatilities and correlations.
VaR Methodology Assumptions
Nomura Group uses a single VaR model which has been implemented globally in order to determine the total trading
VaR. A historical simulation is implemented, where historical market moves over a two-year window are applied to current
exposure in order to construct a profit and loss distribution. Potential losses can be estimated at required confidence levels
or probabilities. A scenario weighting scheme is employed to ensure that the VaR model responds to changing market
volatility. Nomura Group uses the same VaR model for both internal risk management purposes and for regulatory
reporting. For internal risk management purposes, VaR is calculated across Nomura Group at a 99% confidence level and
using a 1-day time horizon. For regulatory reporting purposes, Nomura Group uses the same confidence level but a 10-day
time horizon, calculated using actual 10-day historical market moves. To complement VaR under Basel 2.5 regulations,
Nomura Group assesses its own capital adequacy by monitoring the level of regulatory capital based on the Capital
Adequacy Notice and by conducting stress testing.
Nomura Group conducts the capital adequacy assessment based on regulatory capital by monitoring the
consolidated Tier 1 capital adequacy ratio stipulated in the Capital Adequacy Notice, calculated from total RWA (a sum of
total credit RWA, amount equivalent to market risk divided by 8% and amount equivalent to operational risk divided by 8%)
and Tier 1 capital, consolidated leverage ratio and other measures.
17
Nomura Group also computes SVaR, which samples from a one-year window during a period of financial stress. The SVaR
window is regularly calibrated and observations are equally weighted.
Nomura Group’s VaR model uses exact time series for each individual risk factor. However, if good quality data is not
available, a ‘proxy logic’ maps the exposure to an appropriate time series. The level of proxying taking place is carefully
monitored through internal risk management processes and there is a continual effort to source new time series to use in
the VaR calculation.
VaR Backtesting
The performance of Nomura Group’s VaR model is constantly monitored to ensure that it remains fit for purpose. The
main approach for validating VaR is to compare actual 1-day trading losses with the corresponding VaR estimate. Nomura
Group’s VaR model is backtested at different hierarchy levels. Backtesting results are reviewed on a monthly basis by
Nomura Group’s Risk Management Division. One-day trading losses exceeded the 99% VaR estimate at Nomura group
level on one occasion for the twelve months ended March 31, 2018.
Limitations and Advantages of VaR
VaR aggregates risks from different asset classes in a transparent and intuitive way. However, there are limitations.
VaR is a backward-looking measure: it implicitly assumes that distributions and correlations of recent factor moves are
adequate to represent moves in the near future. VaR is appropriate for liquid markets and is not appropriate for risk factors
that exhibit sudden jumps. Therefore, it may understate the impact of severe events. Given these limitations, Nomura
Group uses VaR only as one component of a diverse market risk management process.
(3) Incremental Risk Charge
Incremental Risk Charge (“IRC”), captures default and migration for credit sensitive positions as additional
component to VaR and S-VaR. IRC estimates the default and migration risk of unsecuritized credit products over a
one-year time horizon with 99.9% confidence level.
(4) Comprehensive Risk Measure
Comprehensive Risk Measure (the “CRM”), captures correlated default and other complex price risk for credit
correlation trading portfolio calculated with using internal model. CRM calculates estimate of default and complex price risk
of correlation trading portfolio over a one-year time horizon with 99.9% confidence level.
(5) Stress Testing
Nomura Group conducts market risk stress testing since VaR and sensitivity analysis have limited ability to capture all
portfolio risks or tail risks. Stress testing for market risk is conducted regularly, using various scenarios based upon
features of trading strategies. Nomura Group conducts stress testing not only at each desk level, but also at a Nomura
Group level with a set of common global scenarios in order to capture the impact of market fluctuations on the entire
Nomura Group.
18
5. Securitization
(1) Risk Management Policy and a Brief Description of Risk Characteristics
The risk management framework mentioned in section 4. Market Risk.is also applied to Securitized Products. As for
other products, the effective management of risks for securitization products requires the ability to analyze a complex and
constantly changing global market environment, to identify problematic trends and to ensure that appropriate action is
taken in a timely manner. A number of tools are used to help assess and manage the market risk for these products on an
ongoing basis including Value-at-Risk; stress testing and sensitivity analysis.
(2) Implementation Status and a Brief Summary of Operations
A framework is established to capture the structural and underlying collateral risk in securitization activity. Risk
management function reviews structures using various cash flow and valuation tools, and continuously monitors trading
and exposures using valuation and risk models, market activity and monthly remittance data to evaluate risks.
(3) In securitization exposures which are classified as Nomura “acts as a sponsor” as of March-end 2018, a list of special
purpose conduit involved in those transactions is as follows:
‒ AMSR 2016-SFR1 TRUST
‒ FINANCE OF AMERICA STRUCTURED SECURITIES TRUST 2017-HB1
‒ PRESTON RIDGE PARTNERS MORTGAGE TRUST
‒ PRPM 2017-3 LLC
‒ AJAX MORTGAGE LOAN TRUST 2017-D
‒ VERUS SECURITIZATION TRUST 2017-SG1
‒ ELLINGTON FINANCIAL MORTGAGE TRUST 2017-1
‒ ANGEL OAK MORTGAGE TRUST LLC
‒ NOMURA ASSET ACCEPTANCE CORP ALTERNATIVE LOAN TRUST SERIES 2006-AF2
‒ NOMURA ASSET ACCEPTANCE CORP ALTERNATIVE LOAN TRUST SERIES 2001-R1A
‒ NRTL TRUST
19
(4) A list of securitization purpose conduit to which Nomura group provides implicit support and the associated capital
impact for each of them
Nomura group does not provide implicit support to securitization purposes conduits.
(5) Accounting policy for securitized transactions
Nomura Group uses daily mark to market pricing for securitized products.
(6) Eligible rating agencies used to assign ratings for the risk weights of securitization exposures.
Nomura Group uses ratings assigned by i) Rating and Investment Information, Inc., ii) Japan Credit Rating Agency,
Ltd., iii) Moody’s Investors Services, Inc., iv) S&P Global Ratings and v) Fitch Ratings Ltd
(7) Brief description of internal assessment approach if it is used
Nomura Group does not use the internal assessment approach.
(8) Brief description of significant changes to the quantitative information
There are no significant changes in the quantitative information for securitized products.
20
6. Credit Risk Management
Credit risk is the risk of loss arising from an obligor’s default, insolvency or administrative proceeding which results in
the obligor’s failure to meet its contractual obligations in accordance with agreed terms. This includes both on and
off-balance sheet exposures. It is also the risk of loss arising through a CVA associated with deterioration in the
creditworthiness of a counterparty. Nomura Group manages credit risk on a global basis and on an individual Nomura legal
entity basis.
(1) Credit Risk Management Framework
The measurement, monitoring and management of credit risk at Nomura Group are governed by a set of global
policies and procedures. Credit Risk Management, a global function within the Risk Management Division, is responsible
for the implementation and maintenance of these policies and procedures. These policies are authorized by the GIRMC
and/or Global Risk Strategic Committee (“GRSC”), prescribe the basic principles of credit risk management and set
delegated authority limits, which enables Credit Risk Management personnel to set credit limits.
Credit risk is managed by Credit Risk Management together with various global and regional risk committees. This
ensures transparency of material credit risks and compliance with established credit limits, the approval of material
extensions of credit and the escalation of risk concentrations to appropriate senior management.
(2) Credit Risk Management Process
Credit Risk Management operates as a credit risk control function within the Risk Management Division, reporting to
the CRO. The process for managing credit risk at Nomura Group includes:
• Evaluation of likelihood that a counterparty defaults on its payments and obligations;
• Assignment of internal ratings to all active counterparties;
• Approval of extensions of credit and establishment of credit limits;
• Measurement, monitoring and management of Nomura Group’s current and potential future credit exposures;
• Setting credit terms in legal documentation; and
• Use of appropriate credit risk mitigants including netting, collateral and hedging.
The scope of credit risk management includes counterparty trading and various debt or equity instruments including
loans, private equity investments, fund investments, investment securities and any other as deemed necessary from a
credit risk management perspective. The evaluation of counterparties’ creditworthiness involves a thorough due diligence
and analysis of the business environments in which they operate, their competitive positions, management and financial
strength and flexibility. Credit analysts also take into account the corporate structure and any explicit or implicit credit
support. Credit Risk Management evaluates credit risk not only by counterparty, but also by counterparty group.
Following the credit analysis, Credit Risk Management estimates the probability of default of a given counterparty or
obligor through an alphanumeric ratings scale similar to that used by rating agencies and a corresponding numeric scale.
Credit analysts are responsible for assigning and maintaining the internal ratings, ensuring that each rating is reviewed and
approved at least annually.
Nomura Group’s internal rating system employs a range of ratings models to ensure global consistency and accuracy.
These models are developed and maintained by the Risk Methodology Group. Internal ratings represent a critical
component of Nomura Group’s approach to managing counterparty credit risk. They are used as key factors in:
• Establishing the amount of counterparty credit risk that Nomura Group is willing to take to an individual
counterparty or counterparty group (setting of credit limits);
21
• Determining the level of delegated authority for setting credit limits (including tenor);
• The frequency of credit reviews (renewal of credit limits);
• Reporting counterparty credit risk to senior management within Nomura Group; and
• Reporting counterparty credit risk to stakeholders outside of Nomura Group.
The Credit Risk Control Unit is a function within the Model Validation Group (“MVG”) which is independent of Credit
Risk Management. It ensures that Nomura Group’s internal rating system is properly reviewed and validated, reporting any
breaks or issues to senior management for timely resolution. The unit is responsible for ensuring that the system remains
accurate and predictive of risk and provides periodic reporting on the system to senior management.
For regulatory capital calculation purposes, Nomura Group has been applying the Foundation Internal Rating Based
Approach (“FIRB”) in calculating credit risk-weighted assets since the end of March 2011. The Standardized Approach is
applied to certain business units or asset types, which are considered immaterial to the calculation of credit risk-weighted
assets.
Internal ratings are mapped to the probabilities of default (PD) which in turn are used for calculating credit
risk-weighted assets. PDs are estimated annually by the Risk Methodology Group and validated by the Credit Risk Control
Unit through testing of conservativeness and backtesting of PDs used in calculations.
(3) Credit Limits and Risk Measures
Internal ratings form an integral part in the assignment of credit limits to counterparties. Nomura Group’s credit limit
framework is designed to ensure that Nomura Group takes appropriate credit risk in a manner that is consistent with its
overall risk appetite. Global Credit policies define the delegated authority matrices that establish the maximum aggregated
limit amounts and tenors that may be set for any single counterparty group based on their internal rating.
Nomura Group’s main type of counterparty credit risk exposures arise from derivatives transactions or securities
financing transactions. Credit exposures against counterparties are managed by means of setting credit limits based upon
credit analysis of individual counterparty. Credit risk is managed daily through the monitoring of credit exposure against
approved credit limits and the ongoing monitoring of the creditworthiness of Nomura Group’s counterparties. Any change in
circumstance that alters Nomura Group’s risk appetite for any particular counterparty, sector, industry or country is
reflected in changes to the internal rating and credit limit as appropriate.
Nomura Group’s global systems record all credit limits and capture credit exposures to the Nomura Group’s
counterparties allowing Credit Risk Management to measure, monitor and manage utilization of credit limits, ensure
appropriate reporting and escalation of any limit breaches.
For derivatives and securities financing transactions, Nomura Group measures credit risk primarily by way of a Monte
Carlo-based simulation model that determines a Potential Exposure (“PE”) profile at a specified confidence level. The
exposure calculation model used for counterparty credit risk management has also been used for the Internal Model
Method (“IMM”) based exposure calculation for regulatory capital reporting purposes since the end of December 2012.
Loans and lending commitments are measured and monitored on both a funded and unfunded basis.
22
(4) Wrong Way Risk
Wrong Way Risk (“WWR”) occurs when exposure to a counterparty is highly correlated with the deterioration of
creditworthiness of that counterparty. Nomura Group has established global policies that govern the management of any
WWR exposures. Stress testing is used to support the assessment of any WWR embedded within existing portfolios and
adjustments are made to credit exposures and regulatory capital, as appropriate.
(5) Stress Testing
Stress Testing is an integral part of Nomura Group’s management of credit risk. Regular stress tests are used to
support the assessment of credit risks by counterparties, sectors and regions. The stress tests include potential
concentrations that are highlighted as a result of applying shocks to risk factors, probabilities of default or rating migrations.
(6) Risk Mitigation
Nomura Group utilizes financial instruments, agreements and practices to assist in the management of credit risk.
Nomura Group enters into legal agreements, such as the International Swap and Derivatives Association, Inc (“ISDA”)
agreements or equivalent (referred to as “Master Netting Agreements”), with many of its counterparties. Master Netting
Agreements allow netting of receivables and payables and reduce losses potentially incurred as a result of a counterparty
default. Further reduction in credit risk is achieved through entering into collateral agreements that allow Nomura Group to
obtain collateral from counterparties either upfront or contingent on exposure levels, changes in credit rating or other
factors.
7. Operational Risk Management
Operational risk is the risk of loss resulting from inadequate or failed internal processes, people, and systems or from
external events. It excludes strategic risk (the risk of loss as a result of poor strategic business decisions), but includes the
risk of breach of legal and regulatory requirements and the risk of damage to Nomura Group’s reputation if caused by an
operational risk.
(1) The Three Lines of Defense
Nomura Group adopts the industry standard “Three Lines of Defense” for the management of operational risk,
comprising the following elements:
1) 1st Line of Defense: The business which owns and manages its risks
2) 2nd Line of Defense: The Operational Risk Management (“ORM”) function, which defines and co-ordinates
Nomura Group’s operational risk framework and its implementation, and provides challenge to the 1st Line of
Defense
3) 3rd Line of Defense: Internal, who provide independent assurance
(2) Operational Risk Management Framework
An Operational Risk Management Framework has been established in order to allow Nomura Group to identify,
assess, manage, monitor and report on operational risk. The GIRMC, with delegated authority from the EMB has formal
oversight over the management of operational risk.
This framework is set out below:
Infrastructure of the framework
• Policy framework: Sets standards for managing operational risk and details how to monitor adherence to these
standards.
23
• Training and awareness: Action taken by ORM to improve business understanding of operational risk.
Products and Services
• Event Reporting: This process is used to identify and report any event which resulted in or had the potential to
result in a loss or gain or other impact associated with inadequate or failed internal processes, people and
systems, or from external events.
• Risk and Control Self-Assessment (“RCSA”): This process is used to identify the Inherent Risks the Business
faces, the key controls associated with those risks and relevant actions to mitigate the residual risks. Global ORM
are responsible for developing the RCSA process and supporting the Business in its implementation.
• Key Risk Indicators (“KRI”): Metrics which allow monitoring of certain key operational risks and trigger appropriate
responses as thresholds are breached.
• Scenario Analysis: The process used to assess and quantify potential high impact, low likelihood operational risk
events. During the process actions may be identified to enhance the control environment which are then
tracked via the Operational Risk Management Framework.
Outputs
• Analysis and reporting: A key aspect of ORM’s role is to analyze, report, and challenge operational risk
information provided by business units, and work with business units to develop action plans to mitigate risks.
• Operational risk capital calculation: Calculate operational risk capital as required under applicable Basel
standards and local regulatory requirements.
(3) Regulatory Capital Calculation for Operational Risk
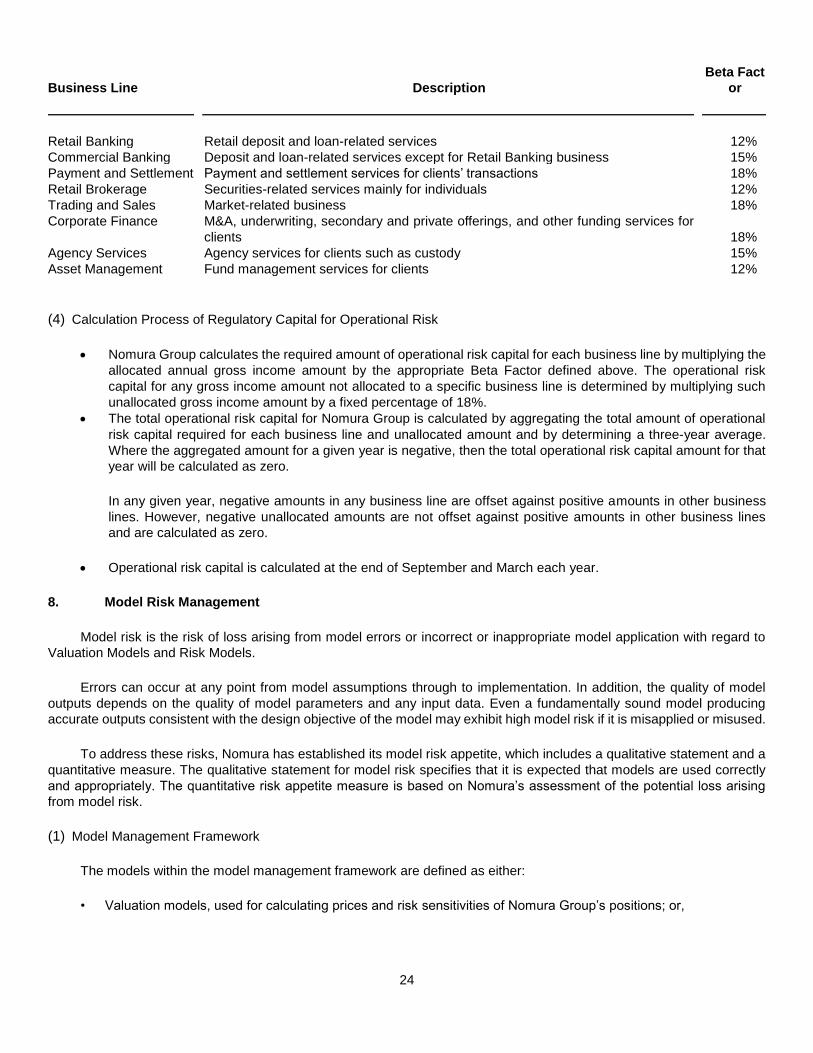
Nomura Group uses The Standardized Approach for calculating regulatory capital for operational risk. This involves
using a three-year average of gross income allocated to business lines, which is multiplied by a fixed percentage (“Beta
Factor”) determined by the FSA, to establish the amount of required operational risk capital.
Nomura Group uses consolidated net revenue as gross income, however for certain consolidated subsidiaries, gross
operating profit is used as gross income. Gross income allocation is performed by mapping the net revenue of each
business segment as defined in Nomura Group’s management accounting data to each business line defined in the
Standardized Approach as follows:
24
Business Line
Description
Beta Fact
or
Retail Banking Retail deposit and loan-related services 12%
Commercial Banking Deposit and loan-related services except for Retail Banking business 15%
Payment and Settlement Payment and settlement services for clients’ transactions 18%
Retail Brokerage Securities-related services mainly for individuals 12%
Trading and Sales Market-related business 18%
Corporate Finance M&A, underwriting, secondary and private offerings, and other funding services for
clients 18%
Agency Services Agency services for clients such as custody 15%
Asset Management Fund management services for clients 12%
(4) Calculation Process of Regulatory Capital for Operational Risk
Nomura Group calculates the required amount of operational risk capital for each business line by multiplying the
allocated annual gross income amount by the appropriate Beta Factor defined above. The operational risk
capital for any gross income amount not allocated to a specific business line is determined by multiplying such
unallocated gross income amount by a fixed percentage of 18%.
The total operational risk capital for Nomura Group is calculated by aggregating the total amount of operational
risk capital required for each business line and unallocated amount and by determining a three-year average.
Where the aggregated amount for a given year is negative, then the total operational risk capital amount for that
year will be calculated as zero.
In any given year, negative amounts in any business line are offset against positive amounts in other business
lines. However, negative unallocated amounts are not offset against positive amounts in other business lines
and are calculated as zero.
Operational risk capital is calculated at the end of September and March each year.
8. Model Risk Management
Model risk is the risk of loss arising from model errors or incorrect or inappropriate model application with regard to
Valuation Models and Risk Models.
Errors can occur at any point from model assumptions through to implementation. In addition, the quality of model
outputs depends on the quality of model parameters and any input data. Even a fundamentally sound model producing
accurate outputs consistent with the design objective of the model may exhibit high model risk if it is misapplied or misused.
To address these risks, Nomura has established its model risk appetite, which includes a qualitative statement and a
quantitative measure. The qualitative statement for model risk specifies that it is expected that models are used correctly
and appropriately. The quantitative risk appetite measure is based on Nomura’s assessment of the potential loss arising
from model risk.
(1) Model Management Framework
The models within the model management framework are defined as either:
• Valuation models, used for calculating prices and risk sensitivities of Nomura Group’s positions; or,

25
• Risk models, used for quantifying the risk of a portfolio by calculating the potential losses incurred from a specific
type of risk, and used for regulatory or economic capital calculations, margin requirement calculations for
non-centrally cleared derivative transactions, limit monitoring, trade approval and management reporting.
Before models are put into official use, the MVG is responsible for validating their integrity and comprehensiveness
independently from those who design and build them. As part of this validation process, the MVG analyzes a number of
factors to assess a model’s suitability, to quantify model risk which is then mitigated by applying model reserves and capital
adjustments. Valuation models are developed and maintained by the business units and risk models by the Risk
Methodology Group (“RMG”) within the Risk Management Division. Certain models may also be developed by third party
providers. The RMG has primary responsibility for the ongoing refinement and improvement of risk models and
methodologies within Nomura Group.
All models are also subject to an annual re-approval process by MVG to ensure they remain suitable. Upon
delegation from the GRMC, the MRAC’s and GRAC’s primary responsibility is to govern and provide oversight of model
management for valuation and risk models, respectively.
(2) Changes to Valuation and Risk Models
Nomura Group has documented policies and procedures in place, approved by the GIRMC and/or GRSC, which
define the process and validation requirements for implementing changes to valuation and risk models. In addition, a Model
Performance Monitoring process has been established to identify and assess specific events, that can indicate that a
model is not performing as it should or is potentially unsuitable and to determine what actions (for example, additional
validation work) might be necessary. For changes with an impact above certain materiality thresholds, model approval is
required. MVG defines these materiality thresholds in a formal procedure and operates a control process to identify where
the procedure is not followed. For certain material changes to risk models, backtesting of the new model, parallel running of
both models and stress-testing of the new model are required prior to the model being approved.
9. Equity Exposures in Non-trading Book
Risk generated by equity exposures in non-trading book is managed by means of initial credit analysis at the stage of
investment combined with risk monitoring after the investment. At the stage of investment, transparent approval
processes have been established and managed, as per Decision-making Policies set up by the Group or the entities within
the Group, such as the circulation of approval requests whose reviewers and approver are determined according to the
form and the amount of investment, and the deliberation and voting at the Global Risk Management Committee, chaired by
the CRO.
As for risk monitoring after the investment, the risk amount arisen from individual investments etc. is captured by way
of measuring VaR or outstanding balance, and is shared with senior management, business units, middle offices and back
offices so that the risk can be managed in a timely manner.
For Private Equity investments, the Nomura Group manages the exposures, by not only calculating the credit risk
assets periodically as per FIRB, Foundation Internal Rating Based Approach, but also by monitoring the ratio of regulatory
stipulated consolidated capital allocated to the credit risk assets for these investments.
26
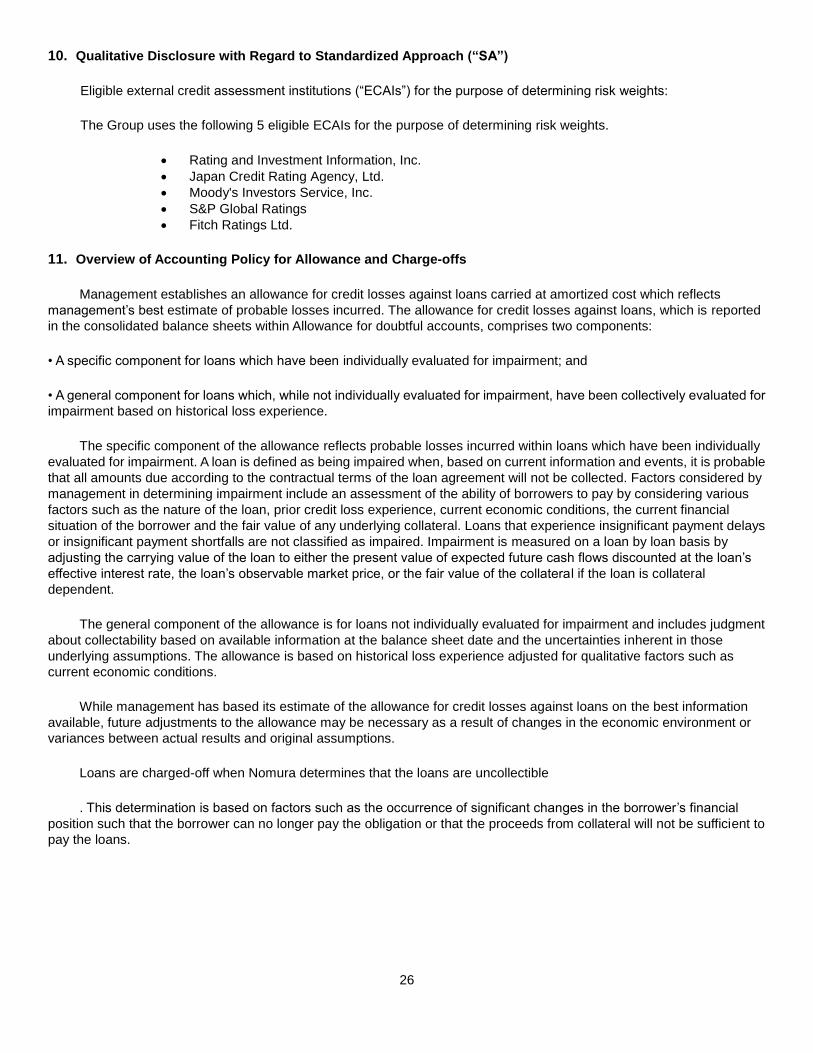
10. Qualitative Disclosure with Regard to Standardized Approach (“SA”)
Eligible external credit assessment institutions (“ECAIs”) for the purpose of determining risk weights:
The Group uses the following 5 eligible ECAIs for the purpose of determining risk weights.
11. Overview of Accounting Policy for Allowance and Charge-offs
Management establishes an allowance for credit losses against loans carried at amortized cost which reflects
management’s best estimate of probable losses incurred. The allowance for credit losses against loans, which is reported
in the consolidated balance sheets within Allowance for doubtful accounts, comprises two components:
• A specific component for loans which have been individually evaluated for impairment; and
• A general component for loans which, while not individually evaluated for impairment, have been collectively evaluated for
impairment based on historical loss experience.
The specific component of the allowance reflects probable losses incurred within loans which have been individually
evaluated for impairment. A loan is defined as being impaired when, based on current information and events, it is probable
that all amounts due according to the contractual terms of the loan agreement will not be collected. Factors considered by
management in determining impairment include an assessment of the ability of borrowers to pay by considering various
factors such as the nature of the loan, prior credit loss experience, current economic conditions, the current financial
situation of the borrower and the fair value of any underlying collateral. Loans that experience insignificant payment delays
or insignificant payment shortfalls are not classified as impaired. Impairment is measured on a loan by loan basis by
adjusting the carrying value of the loan to either the present value of expected future cash flows discounted at the loan’s
effective interest rate, the loan’s observable market price, or the fair value of the collateral if the loan is collateral
dependent.
The general component of the allowance is for loans not individually evaluated for impairment and includes judgment
about collectability based on available information at the balance sheet date and the uncertainties inherent in those
underlying assumptions. The allowance is based on historical loss experience adjusted for qualitative factors such as
current economic conditions.
While management has based its estimate of the allowance for credit losses against loans on the best information
available, future adjustments to the allowance may be necessary as a result of changes in the economic environment or
variances between actual results and original assumptions.
Loans are charged-off when Nomura determines that the loans are uncollectible
. This determination is based on factors such as the occurrence of significant changes in the borrower’s financial
position such that the borrower can no longer pay the obligation or that the proceeds from collateral will not be sufficient to
pay the loans.
Rating and Investment Information, Inc.
Japan Credit Rating Agency, Ltd.
Moody's Investors Service, Inc.
S&P Global Ratings
Fitch Ratings Ltd.
27
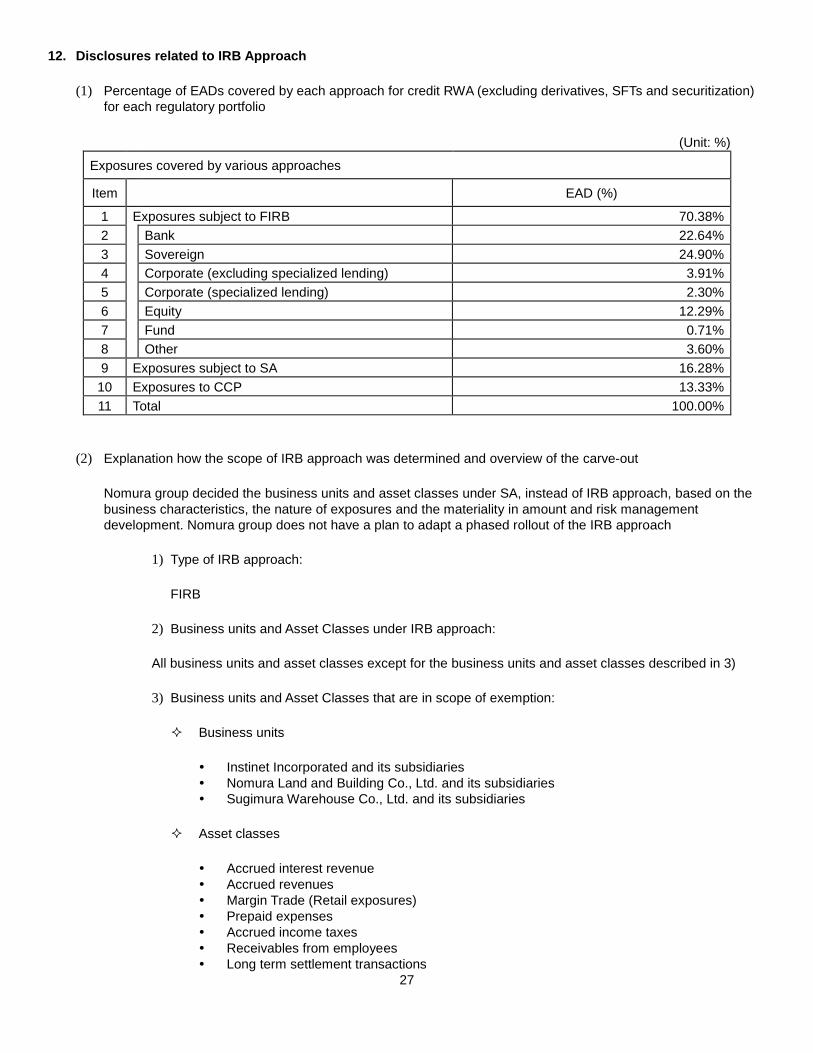
12. Disclosures related to IRB Approach
(1) Percentage of EADs covered by each approach for credit RWA (excluding derivatives, SFTs and securitization)
for each regulatory portfolio
(Unit: %)
Exposures covered by various approaches
Item EAD (%)
1 Exposures subject to FIRB 70.38%
2 Bank 22.64%
3 Sovereign 24.90%
4 Corporate (excluding specialized lending) 3.91%
5 Corporate (specialized lending) 2.30%
6 Equity 12.29%
7 Fund 0.71%
8 Other 3.60%
9 Exposures subject to SA 16.28%
10 Exposures to CCP 13.33%
11 Total 100.00%
(2) Explanation how the scope of IRB approach was determined and overview of the carve-out
Nomura group decided the business units and asset classes under SA, instead of IRB approach, based on the
business characteristics, the nature of exposures and the materiality in amount and risk management
development. Nomura group does not have a plan to adapt a phased rollout of the IRB approach
1) Type of IRB approach:
FIRB
2) Business units and Asset Classes under IRB approach:
All business units and asset classes except for the business units and asset classes described in 3)
3) Business units and Asset Classes that are in scope of exemption:
Business units
Instinet Incorporated and its subsidiaries
Nomura Land and Building Co., Ltd. and its subsidiaries
Sugimura Warehouse Co., Ltd. and its subsidiaries
Asset classes
Accrued interest revenue
Accrued revenues
Margin Trade (Retail exposures)
Prepaid expenses
Accrued income taxes
Receivables from employees
Long term settlement transactions

28
Immaterial low value exposures
13. Management of Interest Rate Risk under Non-trading Activities
Nomura Group’s non-trading book assets mostly consist of short-term assets such as deposits, and liabilities mostly
consist of borrowings and outstanding bond issuance for fund-raising purposes. These borrowings and outstanding bonds
are in most cases converted into floating rate liabilities through swap agreements, so that the materiality of interest rate risk
in the non-trading book is considerably low.
For interest rate risk as a part of market risk in the trading book, a summary of the management framework and
procedures is provided in 4.“Market Risk Management”.
29
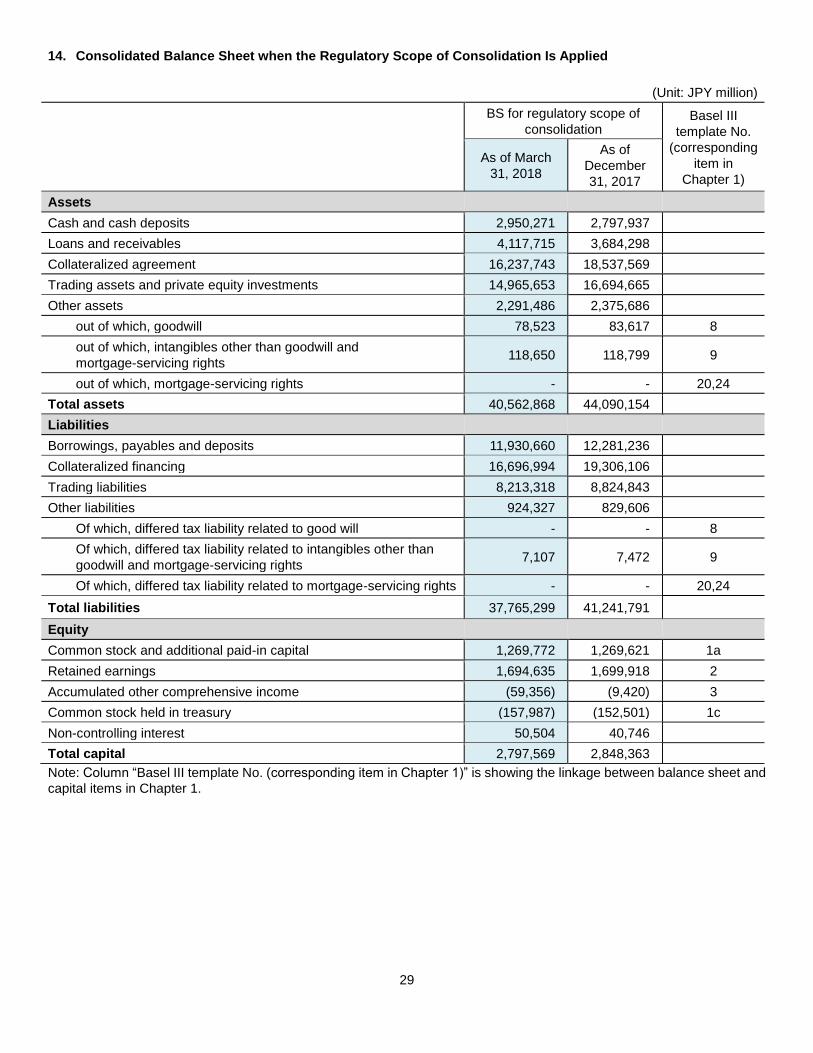
14. Consolidated Balance Sheet when the Regulatory Scope of Consolidation Is Applied
(Unit: JPY million)
BS for regulatory scope of
consolidation Basel III
template No.
(corresponding
item in
Chapter 1)
As of March
31, 2018
As of
December
31, 2017
Assets
Cash and cash deposits 2,950,271 2,797,937
Loans and receivables 4,117,715 3,684,298
Collateralized agreement 16,237,743 18,537,569
Trading assets and private equity investments 14,965,653 16,694,665
Other assets 2,291,486 2,375,686
out of which, goodwill 78,523 83,617 8
out of which, intangibles other than goodwill and
mortgage-servicing rights 118,650 118,799 9
out of which, mortgage-servicing rights - - 20,24
Total assets 40,562,868 44,090,154
Liabilities
Borrowings, payables and deposits 11,930,660 12,281,236
Collateralized financing 16,696,994 19,306,106
Trading liabilities 8,213,318 8,824,843
Other liabilities 924,327 829,606
Of which, differed tax liability related to good will - - 8
Of which, differed tax liability related to intangibles other than
goodwill and mortgage-servicing rights 7,107 7,472 9
Of which, differed tax liability related to mortgage-servicing rights - - 20,24
Total liabilities 37,765,299 41,241,791
Equity
Common stock and additional paid-in capital 1,269,772 1,269,621 1a
Retained earnings 1,694,635 1,699,918 2
Accumulated other comprehensive income (59,356) (9,420) 3
Common stock held in treasury (157,987) (152,501) 1c
Non-controlling interest 50,504 40,746
Total capital 2,797,569 2,848,363
Note: Column “Basel III template No. (corresponding item in Chapter 1)” is showing the linkage between balance sheet and
capital items in Chapter 1.
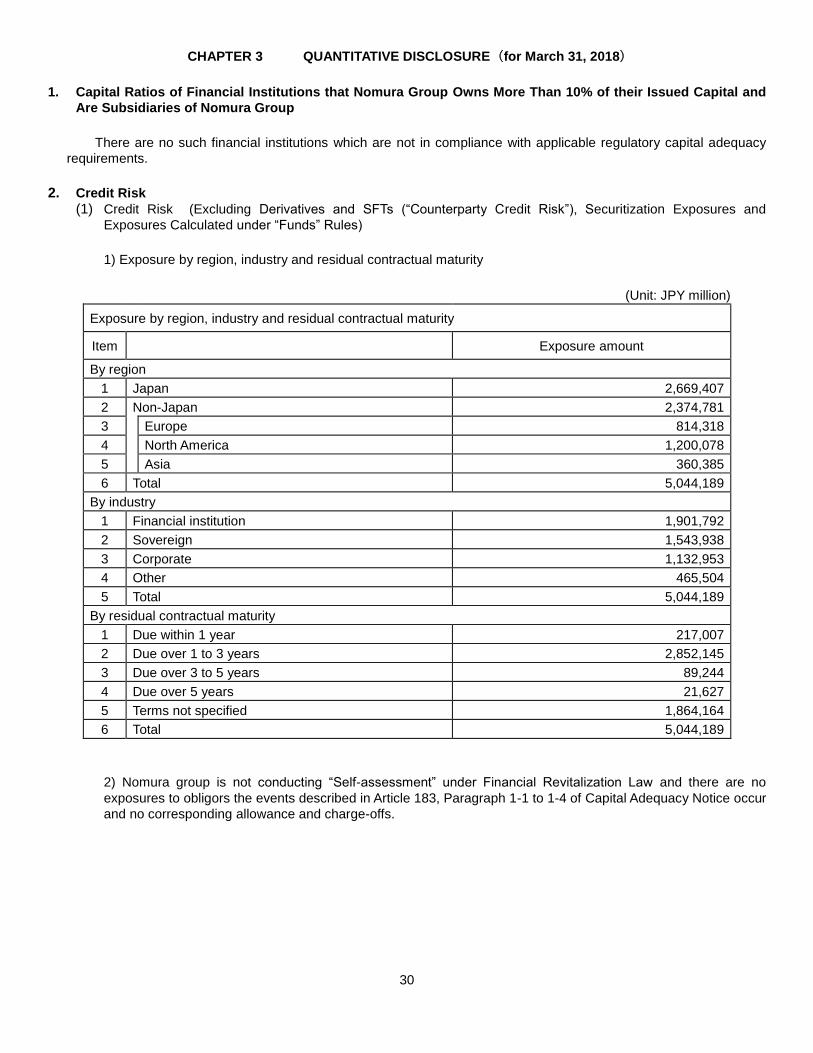
30
CHAPTER 3 QUANTITATIVE DISCLOSURE (for March 31, 2018)
1. Capital Ratios of Financial Institutions that Nomura Group Owns More Than 10% of their Issued Capital and
Are Subsidiaries of Nomura Group
There are no such financial institutions which are not in compliance with applicable regulatory capital adequacy
requirements.
2. Credit Risk
(1) Credit Risk (Excluding Derivatives and SFTs (“Counterparty Credit Risk”), Securitization Exposures and
Exposures Calculated under “Funds” Rules)
1) Exposure by region, industry and residual contractual maturity
(Unit: JPY million)
Exposure by region, industry and residual contractual maturity
Item Exposure amount
By region
1 Japan 2,669,407
2 Non-Japan 2,374,781
3 Europe 814,318
4 North America 1,200,078
5 Asia 360,385
6 Total 5,044,189
By industry
1 Financial institution 1,901,792
2 Sovereign 1,543,938
3 Corporate 1,132,953
4 Other 465,504
5 Total 5,044,189
By residual contractual maturity
1 Due within 1 year 217,007
2 Due over 1 to 3 years 2,852,145
3 Due over 3 to 5 years 89,244
4 Due over 5 years 21,627
5 Terms not specified 1,864,164
6 Total 5,044,189
2) Nomura group is not conducting “Self-assessment” under Financial Revitalization Law and there are no
exposures to obligors the events described in Article 183, Paragraph 1-1 to 1-4 of Capital Adequacy Notice occur
and no corresponding allowance and charge-offs.
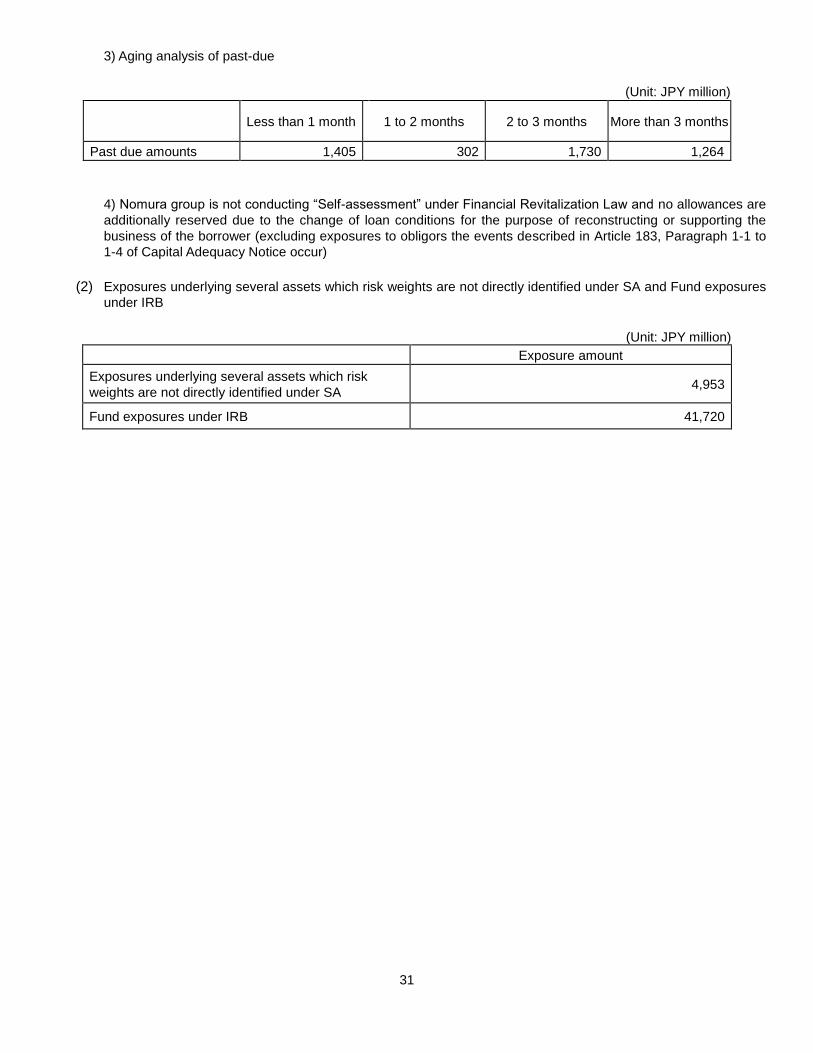
31
3) Aging analysis of past-due
(Unit: JPY million)
Less than 1 month 1 to 2 months 2 to 3 months More than 3 months
Past due amounts 1,405 302 1,730 1,264
4) Nomura group is not conducting “Self-assessment” under Financial Revitalization Law and no allowances are
additionally reserved due to the change of loan conditions for the purpose of reconstructing or supporting the
business of the borrower (excluding exposures to obligors the events described in Article 183, Paragraph 1-1 to
1-4 of Capital Adequacy Notice occur)
(2) Exposures underlying several assets which risk weights are not directly identified under SA and Fund exposures
under IRB
(Unit: JPY million)
Exposure amount
Exposures underlying several assets which risk
weights are not directly identified under SA 4,953
Fund exposures under IRB 41,720
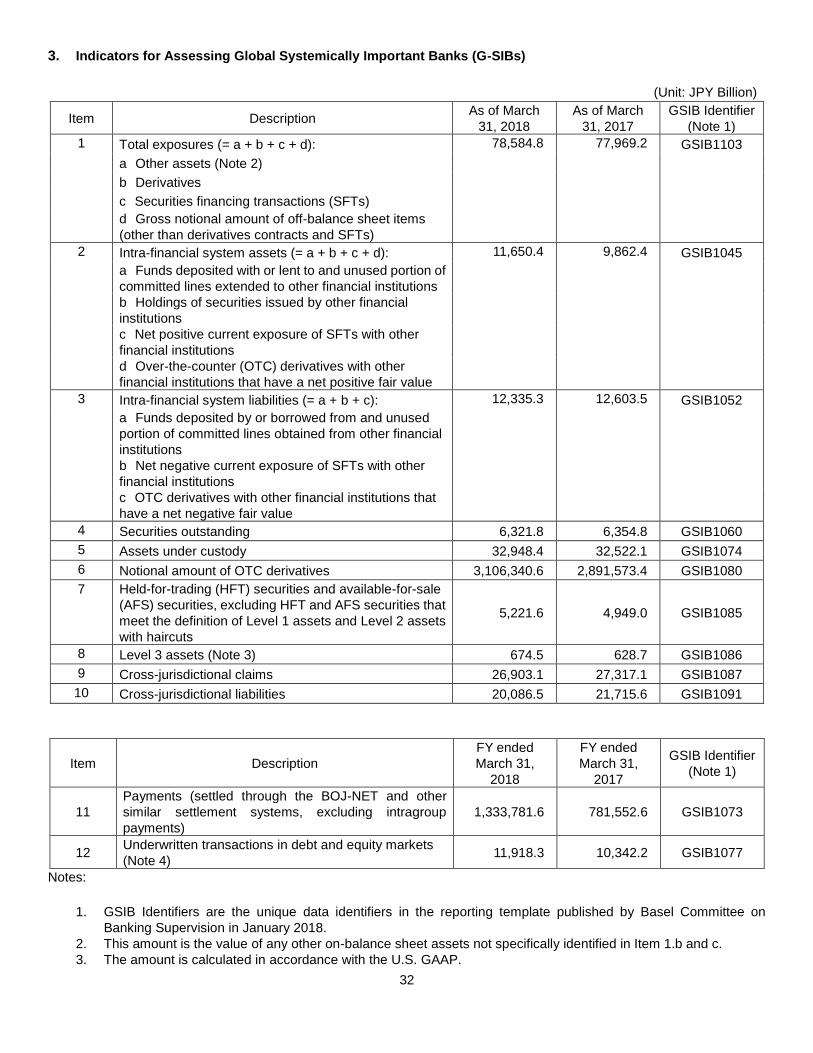
32
3. Indicators for Assessing Global Systemically Important Banks (G-SIBs)
(Unit: JPY Billion)
Item Description As of March
31, 2018
As of March
31, 2017
GSIB Identifier
(Note 1)
1 Total exposures (= a + b + c + d): 78,584.8 77,969.2 GSIB1103
a Other assets (Note 2)
b Derivatives
c Securities financing transactions (SFTs)
d Gross notional amount of off-balance sheet items
(other than derivatives contracts and SFTs)
2 Intra-financial system assets (= a + b + c + d): 11,650.4 9,862.4 GSIB1045
a Funds deposited with or lent to and unused portion of
committed lines extended to other financial institutions
b Holdings of securities issued by other financial
institutions
c Net positive current exposure of SFTs with other
financial institutions
d Over-the-counter (OTC) derivatives with other
financial institutions that have a net positive fair value
3 Intra-financial system liabilities (= a + b + c): 12,335.3 12,603.5 GSIB1052
a Funds deposited by or borrowed from and unused
portion of committed lines obtained from other financial
institutions
b Net negative current exposure of SFTs with other
financial institutions
c OTC derivatives with other financial institutions that
have a net negative fair value
4 Securities outstanding 6,321.8 6,354.8 GSIB1060
5 Assets under custody 32,948.4 32,522.1 GSIB1074
6 Notional amount of OTC derivatives 3,106,340.6 2,891,573.4 GSIB1080
7 Held-for-trading (HFT) securities and available-for-sale
(AFS) securities, excluding HFT and AFS securities that
meet the definition of Level 1 assets and Level 2 assets
with haircuts
5,221.6 4,949.0 GSIB1085
8 Level 3 assets (Note 3) 674.5 628.7 GSIB1086
9 Cross-jurisdictional claims 26,903.1 27,317.1 GSIB1087
10 Cross-jurisdictional liabilities 20,086.5 21,715.6 GSIB1091
Item Description
FY ended
March 31,
2018
FY ended
March 31,
2017
GSIB Identifier
(Note 1)
11
Payments (settled through the BOJ-NET and other
similar settlement systems, excluding intragroup
payments)
1,333,781.6 781,552.6 GSIB1073
12 Underwritten transactions in debt and equity markets
(Note 4) 11,918.3 10,342.2 GSIB1077
Notes:
1. GSIB Identifiers are the unique data identifiers in the reporting template published by Basel Committee on
Banking Supervision in January 2018.
2. This amount is the value of any other on-balance sheet assets not specifically identified in Item 1.b and c.
3. The amount is calculated in accordance with the U.S. GAAP.

33
4. This refers to underwriting of securities defined in article 2 paragraph 8 item 6 of the Financial Instruments and
Exchange Act.
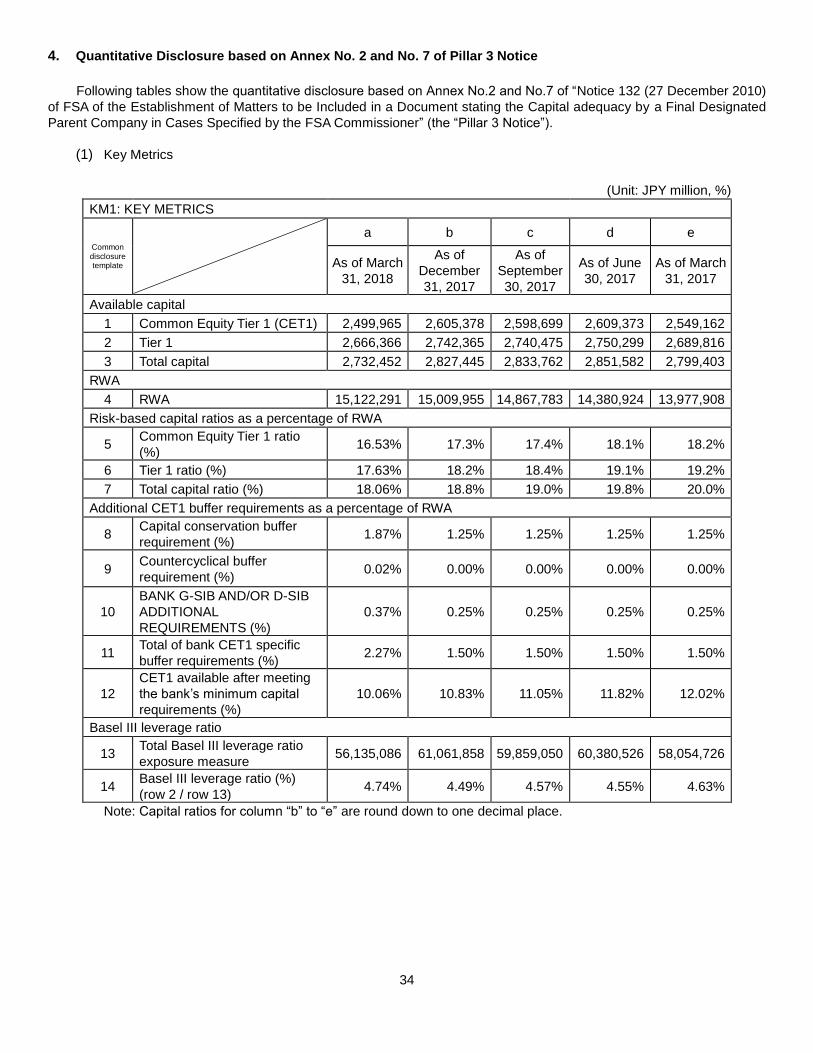
34
4. Quantitative Disclosure based on Annex No. 2 and No. 7 of Pillar 3 Notice
Following tables show the quantitative disclosure based on Annex No.2 and No.7 of “Notice 132 (27 December 2010)
of FSA of the Establishment of Matters to be Included in a Document stating the Capital adequacy by a Final Designated
Parent Company in Cases Specified by the FSA Commissioner” (the “Pillar 3 Notice”).
(1) Key Metrics
(Unit: JPY million, %)
KM1: KEY METRICS
Common disclosure template
a b c d e
As of March
31, 2018
As of
December
31, 2017
As of
September
30, 2017
As of June
30, 2017
As of March
31, 2017
Available capital
1 Common Equity Tier 1 (CET1) 2,499,965 2,605,378 2,598,699 2,609,373 2,549,162
2 Tier 1 2,666,366 2,742,365 2,740,475 2,750,299 2,689,816
3 Total capital 2,732,452 2,827,445 2,833,762 2,851,582 2,799,403
RWA
4 RWA 15,122,291 15,009,955 14,867,783 14,380,924 13,977,908
Risk-based capital ratios as a percentage of RWA
5 Common Equity Tier 1 ratio
(%) 16.53% 17.3% 17.4% 18.1% 18.2%
6 Tier 1 ratio (%) 17.63% 18.2% 18.4% 19.1% 19.2%
7 Total capital ratio (%) 18.06% 18.8% 19.0% 19.8% 20.0%
Additional CET1 buffer requirements as a percentage of RWA
8 Capital conservation buffer
requirement (%) 1.87% 1.25% 1.25% 1.25% 1.25%
9 Countercyclical buffer
requirement (%) 0.02% 0.00% 0.00% 0.00% 0.00%
10
BANK G-SIB AND/OR D-SIB
ADDITIONAL
REQUIREMENTS (%)
0.37% 0.25% 0.25% 0.25% 0.25%
11 Total of bank CET1 specific
buffer requirements (%) 2.27% 1.50% 1.50% 1.50% 1.50%
12
CET1 available after meeting
the bank’s minimum capital
requirements (%)
10.06% 10.83% 11.05% 11.82% 12.02%
Basel III leverage ratio
13 Total Basel III leverage ratio
exposure measure 56,135,086 61,061,858 59,859,050 60,380,526 58,054,726
14 Basel III leverage ratio (%)
(row 2 / row 13) 4.74% 4.49% 4.57% 4.55% 4.63%
Note: Capital ratios for column “b” to “e” are round down to one decimal place.
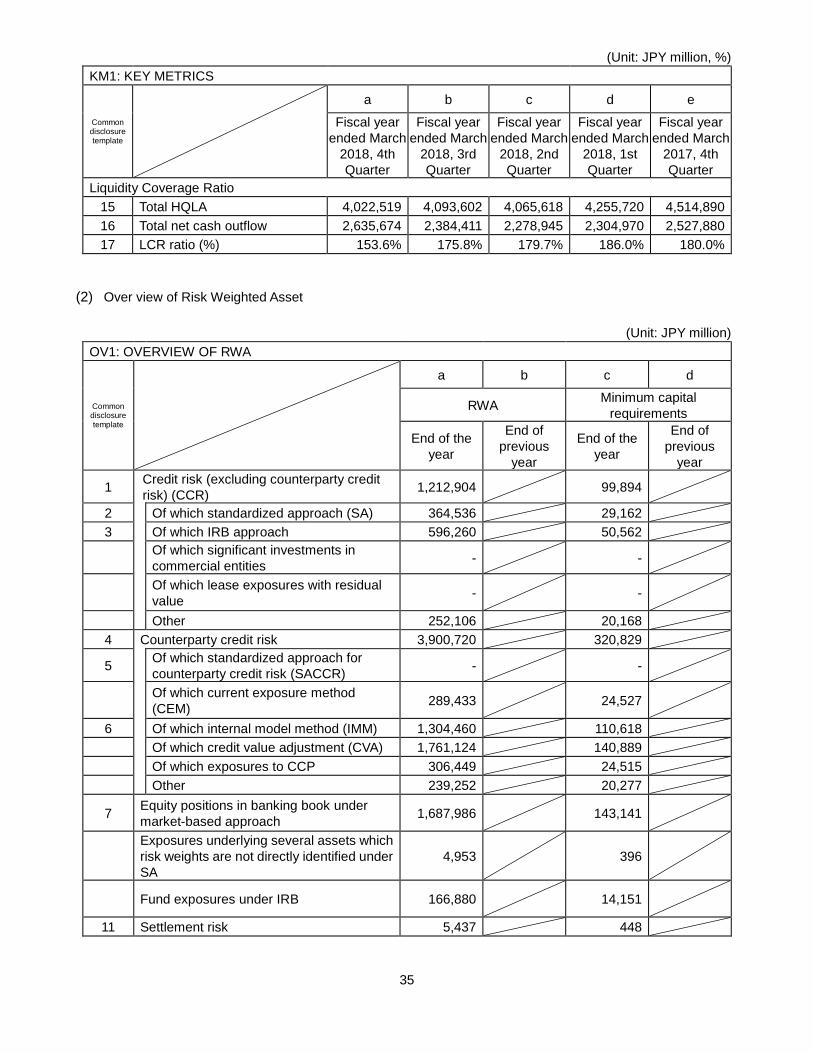
35
(Unit: JPY million, %)
KM1: KEY METRICS
Common disclosure template
a b c d e
Fiscal year
ended March
2018, 4th
Quarter
Fiscal year
ended March
2018, 3rd
Quarter
Fiscal year
ended March
2018, 2nd
Quarter
Fiscal year
ended March
2018, 1st
Quarter
Fiscal year
ended March
2017, 4th
Quarter
Liquidity Coverage Ratio
15 Total HQLA 4,022,519 4,093,602 4,065,618 4,255,720 4,514,890
16 Total net cash outflow 2,635,674 2,384,411 2,278,945 2,304,970 2,527,880
17 LCR ratio (%) 153.6% 175.8% 179.7% 186.0% 180.0%
(2) Over view of Risk Weighted Asset
(Unit: JPY million)
OV1: OVERVIEW OF RWA
Common disclosure template
a b c d
RWA Minimum capital
requirements
End of the
year
End of
previous
year
End of the
year
End of
previous
year
1 Credit risk (excluding counterparty credit
risk) (CCR) 1,212,904 99,894
2 Of which standardized approach (SA) 364,536 29,162
3 Of which IRB approach 596,260 50,562
Of which significant investments in
commercial entities - -
Of which lease exposures with residual
value - -
Other 252,106 20,168
4 Counterparty credit risk 3,900,720 320,829
5 Of which standardized approach for
counterparty credit risk (SACCR) - -
Of which current exposure method
(CEM) 289,433 24,527
6 Of which internal model method (IMM) 1,304,460 110,618
Of which credit value adjustment (CVA) 1,761,124 140,889
Of which exposures to CCP 306,449 24,515
Other 239,252 20,277
7 Equity positions in banking book under
market-based approach 1,687,986 143,141
Exposures underlying several assets which
risk weights are not directly identified under
SA
4,953 396
Fund exposures under IRB 166,880 14,151
11 Settlement risk 5,437 448
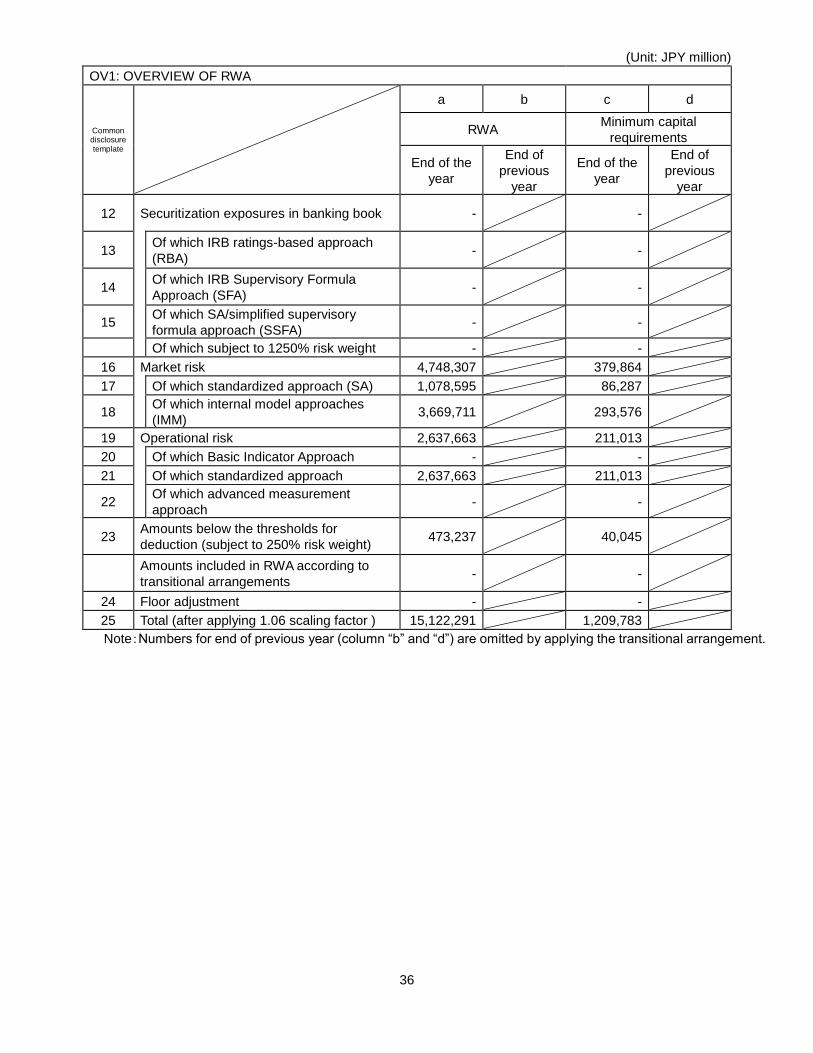
36
(Unit: JPY million)
OV1: OVERVIEW OF RWA
Common disclosure template
a b c d
RWA Minimum capital
requirements
End of the
year
End of
previous
year
End of the
year
End of
previous
year
12 Securitization exposures in banking book - -
13 Of which IRB ratings-based approach
(RBA) - -
14 Of which IRB Supervisory Formula
Approach (SFA) - -
15 Of which SA/simplified supervisory
formula approach (SSFA) - -
Of which subject to 1250% risk weight - -
16 Market risk 4,748,307 379,864
17 Of which standardized approach (SA) 1,078,595 86,287
18 Of which internal model approaches
(IMM) 3,669,711 293,576
19 Operational risk 2,637,663 211,013
20 Of which Basic Indicator Approach - -
21 Of which standardized approach 2,637,663 211,013
22 Of which advanced measurement
approach - -
23 Amounts below the thresholds for
deduction (subject to 250% risk weight) 473,237 40,045
Amounts included in RWA according to
transitional arrangements - -
24 Floor adjustment - -
25 Total (after applying 1.06 scaling factor ) 15,122,291 1,209,783
Note:Numbers for end of previous year (column “b” and “d”) are omitted by applying the transitional arrangement.
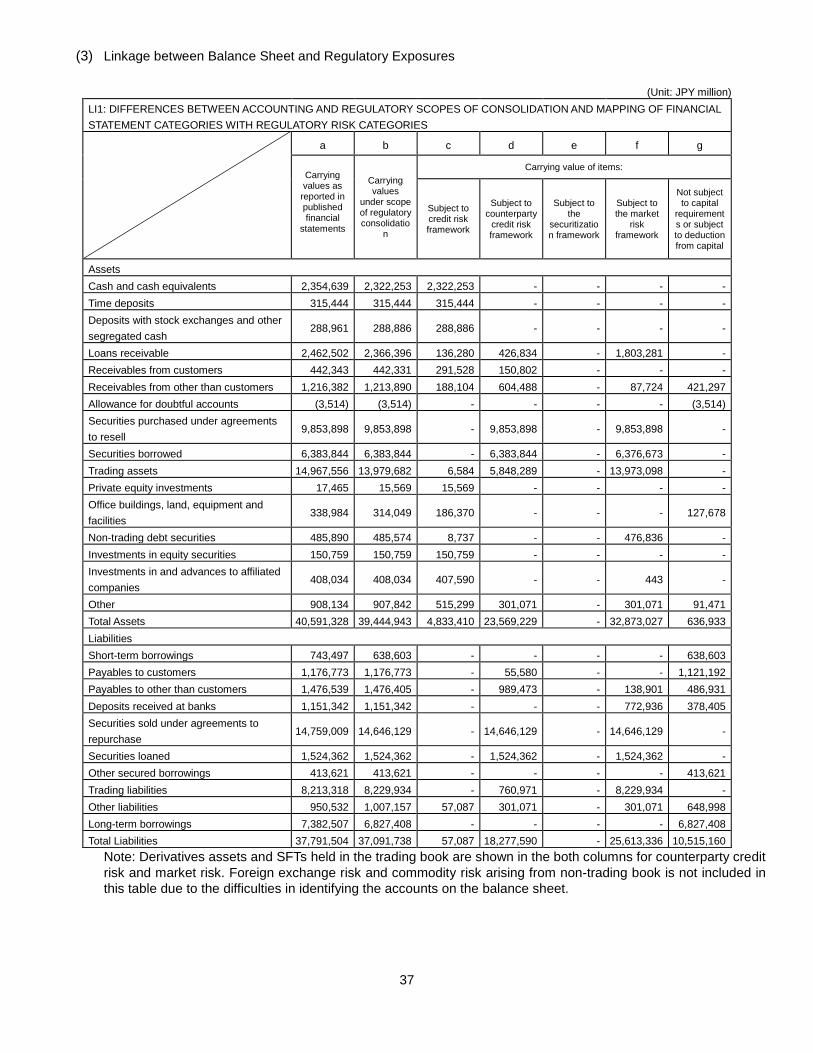
37
(3) Linkage between Balance Sheet and Regulatory Exposures
(Unit: JPY million)
LI1: DIFFERENCES BETWEEN ACCOUNTING AND REGULATORY SCOPES OF CONSOLIDATION AND MAPPING OF FINANCIAL
STATEMENT CATEGORIES WITH REGULATORY RISK CATEGORIES
a b c d e f g
Carrying values as reported in published financial
statements
Carrying values
under scope of regulatory consolidatio
n
Carrying value of items:
Subject to credit risk framework
Subject to counterparty
credit risk framework
Subject to the
securitization framework
Subject to the market
risk framework
Not subject to capital
requirements or subject to deduction from capital
Assets
Cash and cash equivalents 2,354,639 2,322,253 2,322,253 - - - -
Time deposits 315,444 315,444 315,444 - - - -
Deposits with stock exchanges and other
segregated cash 288,961 288,886 288,886 - - - -
Loans receivable 2,462,502 2,366,396 136,280 426,834 - 1,803,281 -
Receivables from customers 442,343 442,331 291,528 150,802 - - -
Receivables from other than customers 1,216,382 1,213,890 188,104 604,488 - 87,724 421,297
Allowance for doubtful accounts (3,514) (3,514) - - - - (3,514)
Securities purchased under agreements
to resell 9,853,898 9,853,898 - 9,853,898 - 9,853,898 -
Securities borrowed 6,383,844 6,383,844 - 6,383,844 - 6,376,673 -
Trading assets 14,967,556 13,979,682 6,584 5,848,289 - 13,973,098 -
Private equity investments 17,465 15,569 15,569 - - - -
Office buildings, land, equipment and
facilities 338,984 314,049 186,370 - - - 127,678
Non-trading debt securities 485,890 485,574 8,737 - - 476,836 -
Investments in equity securities 150,759 150,759 150,759 - - - -
Investments in and advances to affiliated
companies 408,034 408,034 407,590 - - 443 -
Other 908,134 907,842 515,299 301,071 - 301,071 91,471
Total Assets 40,591,328 39,444,943 4,833,410 23,569,229 - 32,873,027 636,933
Liabilities
Short-term borrowings 743,497 638,603 - - - - 638,603
Payables to customers 1,176,773 1,176,773 - 55,580 - - 1,121,192
Payables to other than customers 1,476,539 1,476,405 - 989,473 - 138,901 486,931
Deposits received at banks 1,151,342 1,151,342 - - - 772,936 378,405
Securities sold under agreements to
repurchase 14,759,009 14,646,129 - 14,646,129 - 14,646,129 -
Securities loaned 1,524,362 1,524,362 - 1,524,362 - 1,524,362 -
Other secured borrowings 413,621 413,621 - - - - 413,621
Trading liabilities 8,213,318 8,229,934 - 760,971 - 8,229,934 -
Other liabilities 950,532 1,007,157 57,087 301,071 - 301,071 648,998
Long-term borrowings 7,382,507 6,827,408 - - - - 6,827,408
Total Liabilities 37,791,504 37,091,738 57,087 18,277,590 - 25,613,336 10,515,160
Note: Derivatives assets and SFTs held in the trading book are shown in the both columns for counterparty credit
risk and market risk. Foreign exchange risk and commodity risk arising from non-trading book is not included in
this table due to the difficulties in identifying the accounts on the balance sheet.
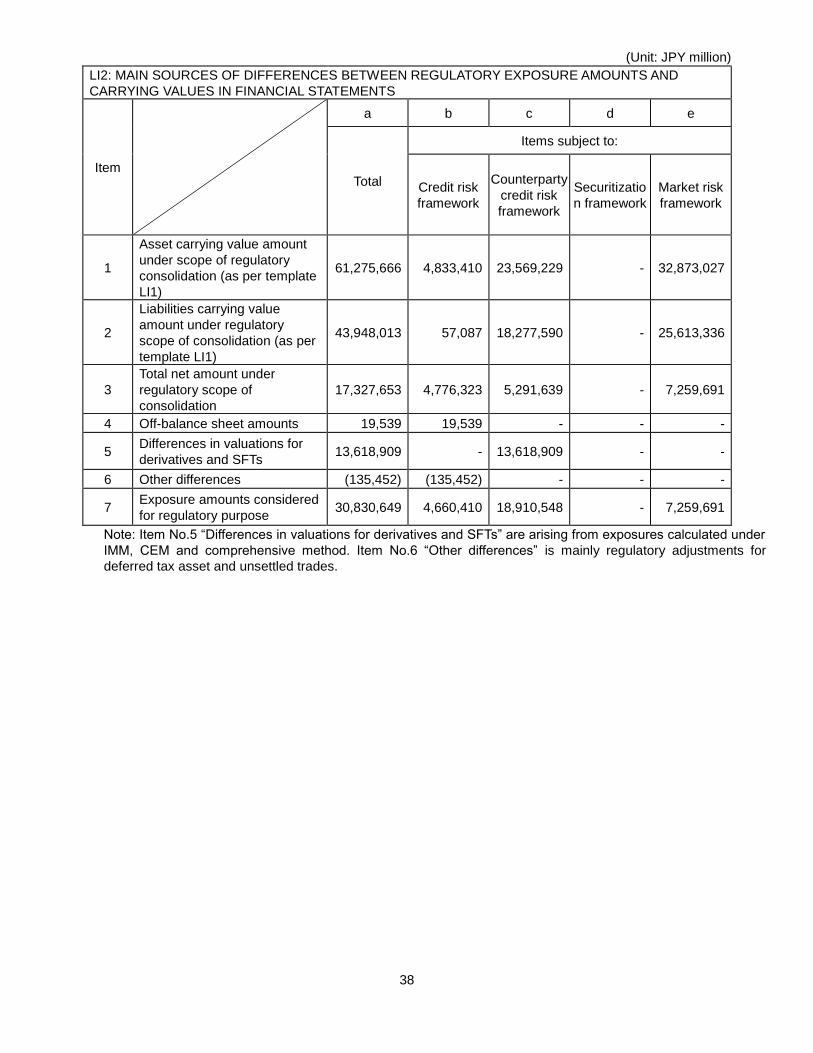
38
(Unit: JPY million)
LI2: MAIN SOURCES OF DIFFERENCES BETWEEN REGULATORY EXPOSURE AMOUNTS AND
CARRYING VALUES IN FINANCIAL STATEMENTS
Item
a b c d e
Total
Items subject to:
Credit risk
framework
Counterparty
credit risk
framework
Securitizatio
n framework
Market risk
framework
1
Asset carrying value amount
under scope of regulatory
consolidation (as per template
LI1)
61,275,666 4,833,410 23,569,229 - 32,873,027
2
Liabilities carrying value
amount under regulatory
scope of consolidation (as per
template LI1)
43,948,013 57,087 18,277,590 - 25,613,336
3
Total net amount under
regulatory scope of
consolidation
17,327,653 4,776,323 5,291,639 - 7,259,691
4 Off-balance sheet amounts 19,539 19,539 - - -
5 Differences in valuations for
derivatives and SFTs 13,618,909 - 13,618,909 - -
6 Other differences (135,452) (135,452) - - -
7 Exposure amounts considered
for regulatory purpose 30,830,649 4,660,410 18,910,548 - 7,259,691
Note: Item No.5 “Differences in valuations for derivatives and SFTs” are arising from exposures calculated under
IMM, CEM and comprehensive method. Item No.6 “Other differences” is mainly regulatory adjustments for
deferred tax asset and unsettled trades.
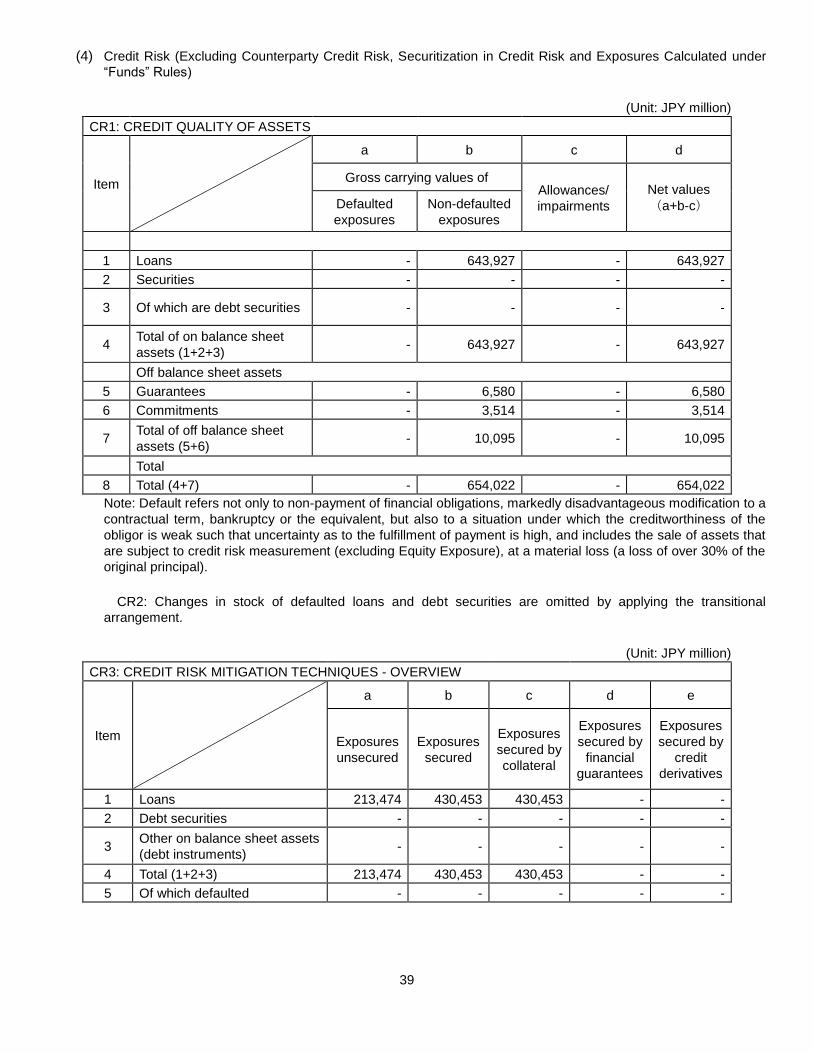
39
(4) Credit Risk (Excluding Counterparty Credit Risk, Securitization in Credit Risk and Exposures Calculated under
“Funds” Rules)
(Unit: JPY million)
CR1: CREDIT QUALITY OF ASSETS
Item
a b c d
Gross carrying values of Allowances/
impairments
Net values
(a+b-c) Defaulted
exposures
Non-defaulted
exposures
1 Loans - 643,927 - 643,927
2 Securities - - - -
3 Of which are debt securities - - - -
4 Total of on balance sheet
assets (1+2+3) - 643,927 - 643,927
Off balance sheet assets
5 Guarantees - 6,580 - 6,580
6 Commitments - 3,514 - 3,514
7 Total of off balance sheet
assets (5+6) - 10,095 - 10,095
Total
8 Total (4+7) - 654,022 - 654,022
Note: Default refers not only to non-payment of financial obligations, markedly disadvantageous modification to a
contractual term, bankruptcy or the equivalent, but also to a situation under which the creditworthiness of the
obligor is weak such that uncertainty as to the fulfillment of payment is high, and includes the sale of assets that
are subject to credit risk measurement (excluding Equity Exposure), at a material loss (a loss of over 30% of the
original principal).
CR2: Changes in stock of defaulted loans and debt securities are omitted by applying the transitional
arrangement.
(Unit: JPY million)
CR3: CREDIT RISK MITIGATION TECHNIQUES - OVERVIEW
Item
a b c d e
Exposures
unsecured
Exposures
secured
Exposures
secured by
collateral
Exposures
secured by
financial
guarantees
Exposures
secured by
credit
derivatives
1 Loans 213,474 430,453 430,453 - -
2 Debt securities - - - - -
3 Other on balance sheet assets
(debt instruments) - - - - -
4 Total (1+2+3) 213,474 430,453 430,453 - -
5 Of which defaulted - - - - -
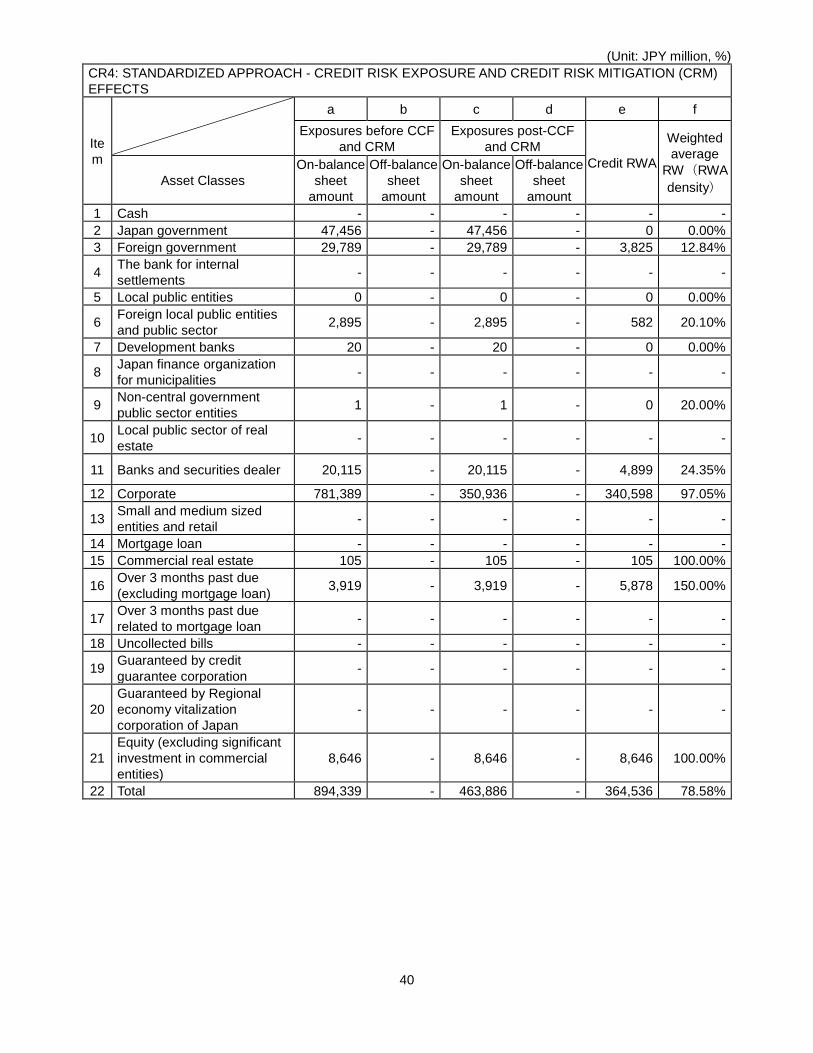
40
(Unit: JPY million, %)
CR4: STANDARDIZED APPROACH - CREDIT RISK EXPOSURE AND CREDIT RISK MITIGATION (CRM)
EFFECTS
Ite
m
a b c d e f
Exposures before CCF
and CRM
Exposures post-CCF
and CRM
Credit RWA
Weighted
average
RW(RWA
density) Asset Classes
On-balance
sheet
amount
Off-balance
sheet
amount
On-balance
sheet
amount
Off-balance
sheet
amount
1 Cash - - - - - -
2 Japan government 47,456 - 47,456 - 0 0.00%
3 Foreign government 29,789 - 29,789 - 3,825 12.84%
4 The bank for internal
settlements - - - - - -
5 Local public entities 0 - 0 - 0 0.00%
6 Foreign local public entities
and public sector 2,895 - 2,895 - 582 20.10%
7 Development banks 20 - 20 - 0 0.00%
8 Japan finance organization
for municipalities - - - - - -
9 Non-central government
public sector entities 1 - 1 - 0 20.00%
10 Local public sector of real
estate - - - - - -
11 Banks and securities dealer 20,115 - 20,115 - 4,899 24.35%
12 Corporate 781,389 - 350,936 - 340,598 97.05%
13 Small and medium sized
entities and retail - - - - - -
14 Mortgage loan - - - - - -
15 Commercial real estate 105 - 105 - 105 100.00%
16 Over 3 months past due
(excluding mortgage loan) 3,919 - 3,919 - 5,878 150.00%
17 Over 3 months past due
related to mortgage loan - - - - - -
18 Uncollected bills - - - - - -
19 Guaranteed by credit
guarantee corporation - - - - - -
20
Guaranteed by Regional
economy vitalization
corporation of Japan
- - - - - -
21
Equity (excluding significant
investment in commercial
entities)
8,646 - 8,646 - 8,646 100.00%
22 Total 894,339 - 463,886 - 364,536 78.58%
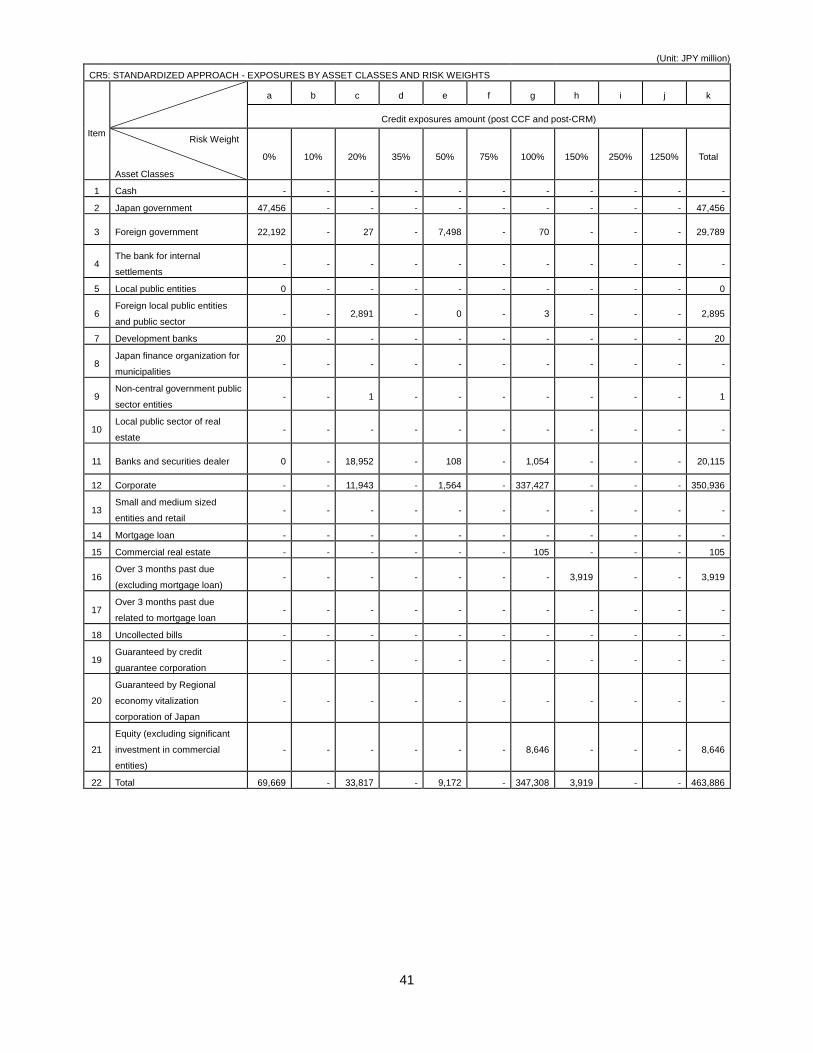
41
(Unit: JPY million)
CR5: STANDARDIZED APPROACH - EXPOSURES BY ASSET CLASSES AND RISK WEIGHTS
Item
a b c d e f g h i j k
Credit exposures amount (post CCF and post-CRM)
Risk Weight
Asset Classes
0% 10% 20% 35% 50% 75% 100% 150% 250% 1250% Total
1 Cash - - - - - - - - - - -
2 Japan government 47,456 - - - - - - - - - 47,456
3 Foreign government 22,192 - 27 - 7,498 - 70 - - - 29,789
4 The bank for internal
settlements - - - - - - - - - - -
5 Local public entities 0 - - - - - - - - - 0
6 Foreign local public entities
and public sector - - 2,891 - 0 - 3 - - - 2,895
7 Development banks 20 - - - - - - - - - 20
8 Japan finance organization for
municipalities - - - - - - - - - - -
9 Non-central government public
sector entities - - 1 - - - - - - - 1
10 Local public sector of real
estate - - - - - - - - - - -
11 Banks and securities dealer 0 - 18,952 - 108 - 1,054 - - - 20,115
12 Corporate - - 11,943 - 1,564 - 337,427 - - - 350,936
13 Small and medium sized
entities and retail - - - - - - - - - - -
14 Mortgage loan - - - - - - - - - - -
15 Commercial real estate - - - - - - 105 - - - 105
16 Over 3 months past due
(excluding mortgage loan) - - - - - - - 3,919 - - 3,919
17 Over 3 months past due
related to mortgage loan - - - - - - - - - - -
18 Uncollected bills - - - - - - - - - - -
19 Guaranteed by credit
guarantee corporation - - - - - - - - - - -
20
Guaranteed by Regional
economy vitalization
corporation of Japan
- - - - - - - - - - -
21
Equity (excluding significant
investment in commercial
entities)
- - - - - - 8,646 - - - 8,646
22 Total 69,669 - 33,817 - 9,172 - 347,308 3,919 - - 463,886
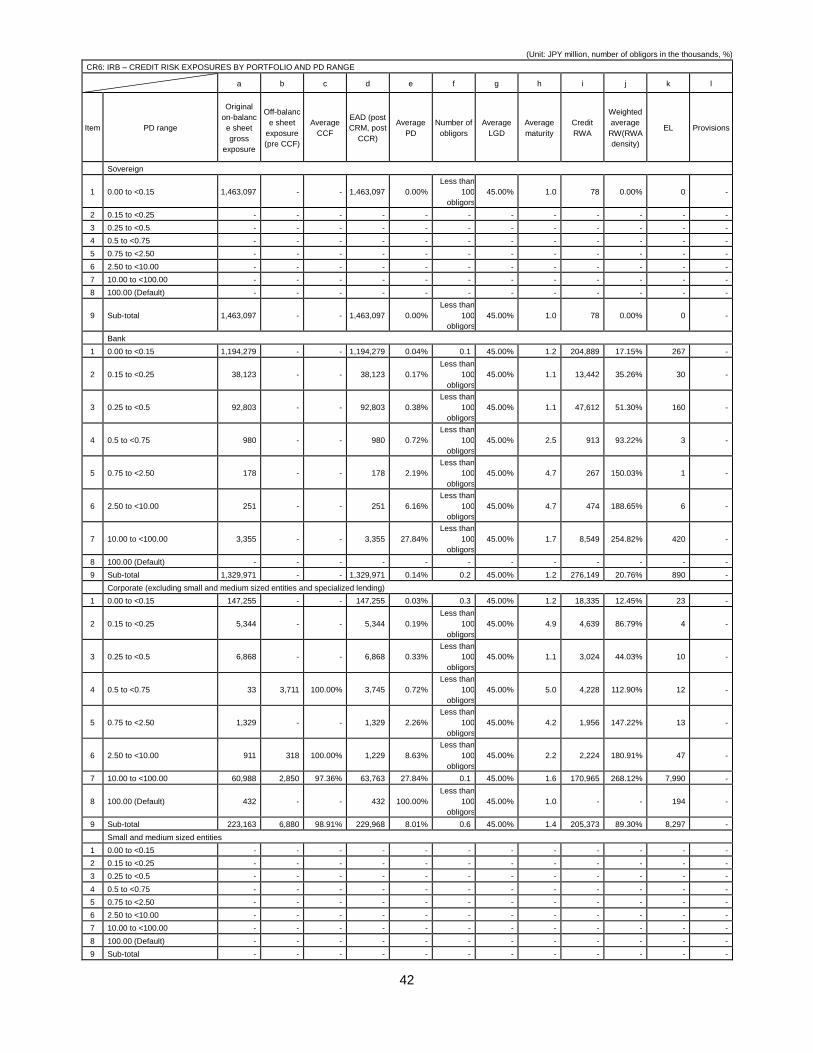
42
(Unit: JPY million, number of obligors in the thousands, %)
CR6: IRB – CREDIT RISK EXPOSURES BY PORTFOLIO AND PD RANGE
a b c d e f g h i j k l
Item PD range
Original
on-balanc
e sheet
gross
exposure
Off-balanc
e sheet
exposure
(pre CCF)
Average
CCF
EAD (post
CRM, post
CCR)
Average
PD
Number of
obligors
Average
LGD
Average
maturity
Credit
RWA
Weighted
average
RW(RWA
density)
EL Provisions
Sovereign
1 0.00 to <0.15 1,463,097 - - 1,463,097 0.00%
Less than
100
obligors
45.00% 1.0 78 0.00% 0 -
2 0.15 to <0.25 - - - - - - - - - - - -
3 0.25 to <0.5 - - - - - - - - - - - -
4 0.5 to <0.75 - - - - - - - - - - - -
5 0.75 to <2.50 - - - - - - - - - - - -
6 2.50 to <10.00 - - - - - - - - - - - -
7 10.00 to <100.00 - - - - - - - - - - - -
8 100.00 (Default) - - - - - - - - - - - -
9 Sub-total 1,463,097 - - 1,463,097 0.00%
Less than
100
obligors
45.00% 1.0 78 0.00% 0 -
Bank
1 0.00 to <0.15 1,194,279 - - 1,194,279 0.04% 0.1 45.00% 1.2 204,889 17.15% 267 -
2 0.15 to <0.25 38,123 - - 38,123 0.17%
Less than
100
obligors
45.00% 1.1 13,442 35.26% 30 -
3 0.25 to <0.5 92,803 - - 92,803 0.38%
Less than
100
obligors
45.00% 1.1 47,612 51.30% 160 -
4 0.5 to <0.75 980 - - 980 0.72%
Less than
100
obligors
45.00% 2.5 913 93.22% 3 -
5 0.75 to <2.50 178 - - 178 2.19%
Less than
100
obligors
45.00% 4.7 267 150.03% 1 -
6 2.50 to <10.00 251 - - 251 6.16%
Less than
100
obligors
45.00% 4.7 474 188.65% 6 -
7 10.00 to <100.00 3,355 - - 3,355 27.84%
Less than
100
obligors
45.00% 1.7 8,549 254.82% 420 -
8 100.00 (Default) - - - - - - - - - - - -
9 Sub-total 1,329,971 - - 1,329,971 0.14% 0.2 45.00% 1.2 276,149 20.76% 890 -
Corporate (excluding small and medium sized entities and specialized lending)
1 0.00 to <0.15 147,255 - - 147,255 0.03% 0.3 45.00% 1.2 18,335 12.45% 23 -
2 0.15 to <0.25 5,344 - - 5,344 0.19%
Less than
100
obligors
45.00% 4.9 4,639 86.79% 4 -
3 0.25 to <0.5 6,868 - - 6,868 0.33%
Less than
100
obligors
45.00% 1.1 3,024 44.03% 10 -
4 0.5 to <0.75 33 3,711 100.00% 3,745 0.72%
Less than
100
obligors
45.00% 5.0 4,228 112.90% 12 -
5 0.75 to <2.50 1,329 - - 1,329 2.26%
Less than
100
obligors
45.00% 4.2 1,956 147.22% 13 -
6 2.50 to <10.00 911 318 100.00% 1,229 8.63%
Less than
100
obligors
45.00% 2.2 2,224 180.91% 47 -
7 10.00 to <100.00 60,988 2,850 97.36% 63,763 27.84% 0.1 45.00% 1.6 170,965 268.12% 7,990 -
8 100.00 (Default) 432 - - 432 100.00%
Less than
100
obligors
45.00% 1.0 - - 194 -
9 Sub-total 223,163 6,880 98.91% 229,968 8.01% 0.6 45.00% 1.4 205,373 89.30% 8,297 -
Small and medium sized entities
1 0.00 to <0.15 - - - - - - - - - - - -
2 0.15 to <0.25 - - - - - - - - - - - -
3 0.25 to <0.5 - - - - - - - - - - - -
4 0.5 to <0.75 - - - - - - - - - - - -
5 0.75 to <2.50 - - - - - - - - - - - -
6 2.50 to <10.00 - - - - - - - - - - - -
7 10.00 to <100.00 - - - - - - - - - - - -
8 100.00 (Default) - - - - - - - - - - - -
9 Sub-total - - - - - - - - - - - -
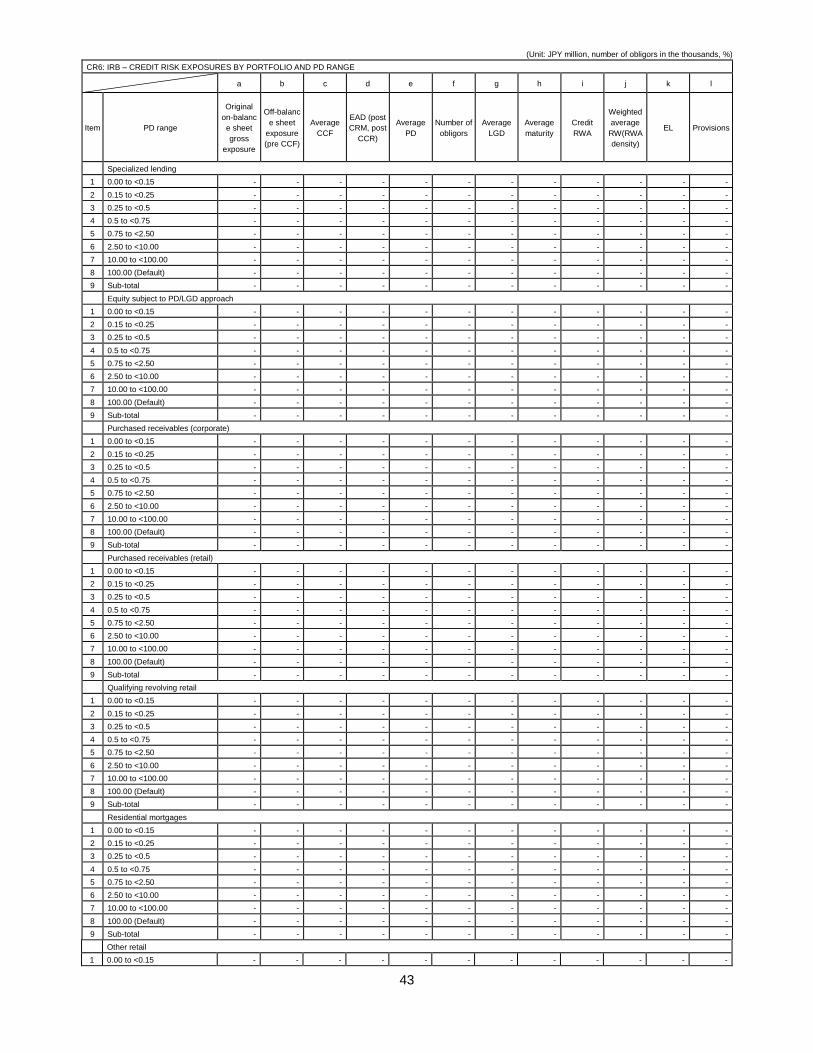
43
(Unit: JPY million, number of obligors in the thousands, %)
CR6: IRB – CREDIT RISK EXPOSURES BY PORTFOLIO AND PD RANGE
a b c d e f g h i j k l
Item PD range
Original
on-balanc
e sheet
gross
exposure
Off-balanc
e sheet
exposure
(pre CCF)
Average
CCF
EAD (post
CRM, post
CCR)
Average
PD
Number of
obligors
Average
LGD
Average
maturity
Credit
RWA
Weighted
average
RW(RWA
density)
EL Provisions
Specialized lending
1 0.00 to <0.15 - - - - - - - - - - - -
2 0.15 to <0.25 - - - - - - - - - - - -
3 0.25 to <0.5 - - - - - - - - - - - -
4 0.5 to <0.75 - - - - - - - - - - - -
5 0.75 to <2.50 - - - - - - - - - - - -
6 2.50 to <10.00 - - - - - - - - - - - -
7 10.00 to <100.00 - - - - - - - - - - - -
8 100.00 (Default) - - - - - - - - - - - -
9 Sub-total - - - - - - - - - - - -
Equity subject to PD/LGD approach
1 0.00 to <0.15 - - - - - - - - - - - -
2 0.15 to <0.25 - - - - - - - - - - - -
3 0.25 to <0.5 - - - - - - - - - - - -
4 0.5 to <0.75 - - - - - - - - - - - -
5 0.75 to <2.50 - - - - - - - - - - - -
6 2.50 to <10.00 - - - - - - - - - - - -
7 10.00 to <100.00 - - - - - - - - - - - -
8 100.00 (Default) - - - - - - - - - - - -
9 Sub-total - - - - - - - - - - - -
Purchased receivables (corporate)
1 0.00 to <0.15 - - - - - - - - - - - -
2 0.15 to <0.25 - - - - - - - - - - - -
3 0.25 to <0.5 - - - - - - - - - - - -
4 0.5 to <0.75 - - - - - - - - - - - -
5 0.75 to <2.50 - - - - - - - - - - - -
6 2.50 to <10.00 - - - - - - - - - - - -
7 10.00 to <100.00 - - - - - - - - - - - -
8 100.00 (Default) - - - - - - - - - - - -
9 Sub-total - - - - - - - - - - - -
Purchased receivables (retail)
1 0.00 to <0.15 - - - - - - - - - - - -
2 0.15 to <0.25 - - - - - - - - - - - -
3 0.25 to <0.5 - - - - - - - - - - - -
4 0.5 to <0.75 - - - - - - - - - - - -
5 0.75 to <2.50 - - - - - - - - - - - -
6 2.50 to <10.00 - - - - - - - - - - - -
7 10.00 to <100.00 - - - - - - - - - - - -
8 100.00 (Default) - - - - - - - - - - - -
9 Sub-total - - - - - - - - - - - -
Qualifying revolving retail
1 0.00 to <0.15 - - - - - - - - - - - -
2 0.15 to <0.25 - - - - - - - - - - - -
3 0.25 to <0.5 - - - - - - - - - - - -
4 0.5 to <0.75 - - - - - - - - - - - -
5 0.75 to <2.50 - - - - - - - - - - - -
6 2.50 to <10.00 - - - - - - - - - - - -
7 10.00 to <100.00 - - - - - - - - - - - -
8 100.00 (Default) - - - - - - - - - - - -
9 Sub-total - - - - - - - - - - - -
Residential mortgages
1 0.00 to <0.15 - - - - - - - - - - - -
2 0.15 to <0.25 - - - - - - - - - - - -
3 0.25 to <0.5 - - - - - - - - - - - -
4 0.5 to <0.75 - - - - - - - - - - - -
5 0.75 to <2.50 - - - - - - - - - - - -
6 2.50 to <10.00 - - - - - - - - - - - -
7 10.00 to <100.00 - - - - - - - - - - - -
8 100.00 (Default) - - - - - - - - - - - -
9 Sub-total - - - - - - - - - - - -
Other retail
1 0.00 to <0.15 - - - - - - - - - - - -
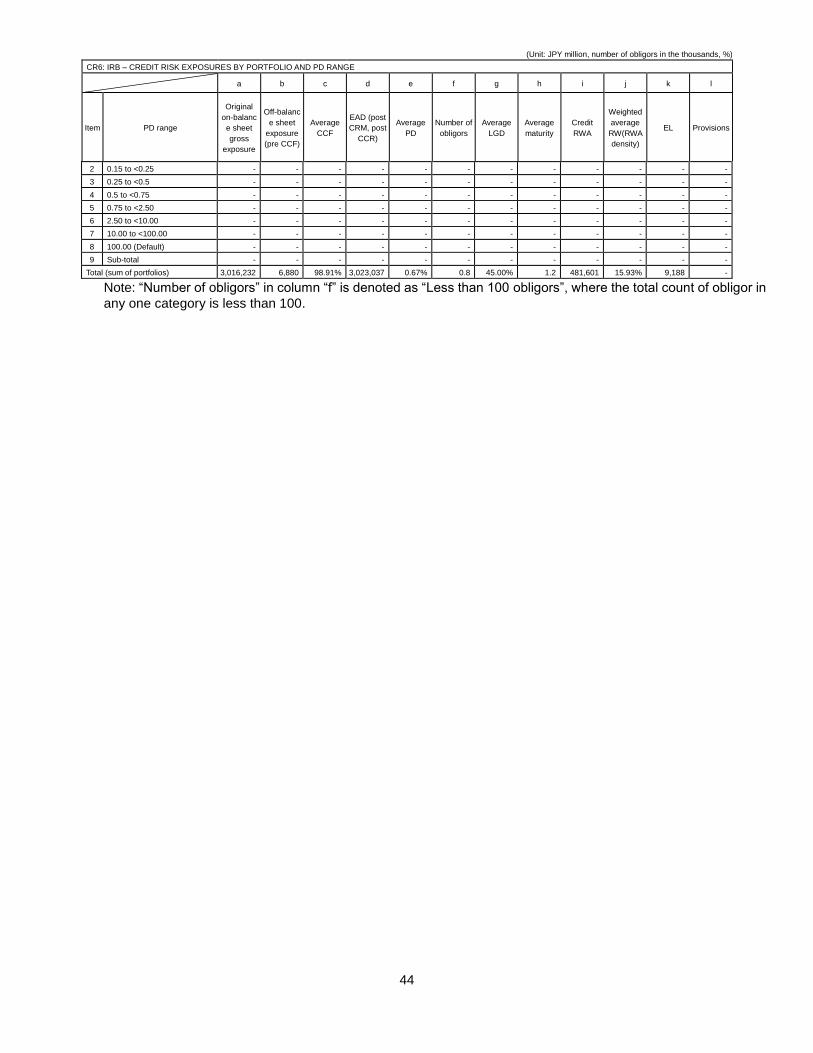
44
(Unit: JPY million, number of obligors in the thousands, %)
CR6: IRB – CREDIT RISK EXPOSURES BY PORTFOLIO AND PD RANGE
a b c d e f g h i j k l
Item PD range
Original
on-balanc
e sheet
gross
exposure
Off-balanc
e sheet
exposure
(pre CCF)
Average
CCF
EAD (post
CRM, post
CCR)
Average
PD
Number of
obligors
Average
LGD
Average
maturity
Credit
RWA
Weighted
average
RW(RWA
density)
EL Provisions
2 0.15 to <0.25 - - - - - - - - - - - -
3 0.25 to <0.5 - - - - - - - - - - - -
4 0.5 to <0.75 - - - - - - - - - - - -
5 0.75 to <2.50 - - - - - - - - - - - -
6 2.50 to <10.00 - - - - - - - - - - - -
7 10.00 to <100.00 - - - - - - - - - - - -
8 100.00 (Default) - - - - - - - - - - - -
9 Sub-total - - - - - - - - - - - -
Total (sum of portfolios) 3,016,232 6,880 98.91% 3,023,037 0.67% 0.8 45.00% 1.2 481,601 15.93% 9,188 -
Note: “Number of obligors” in column “f” is denoted as “Less than 100 obligors”, where the total count of obligor in
any one category is less than 100.
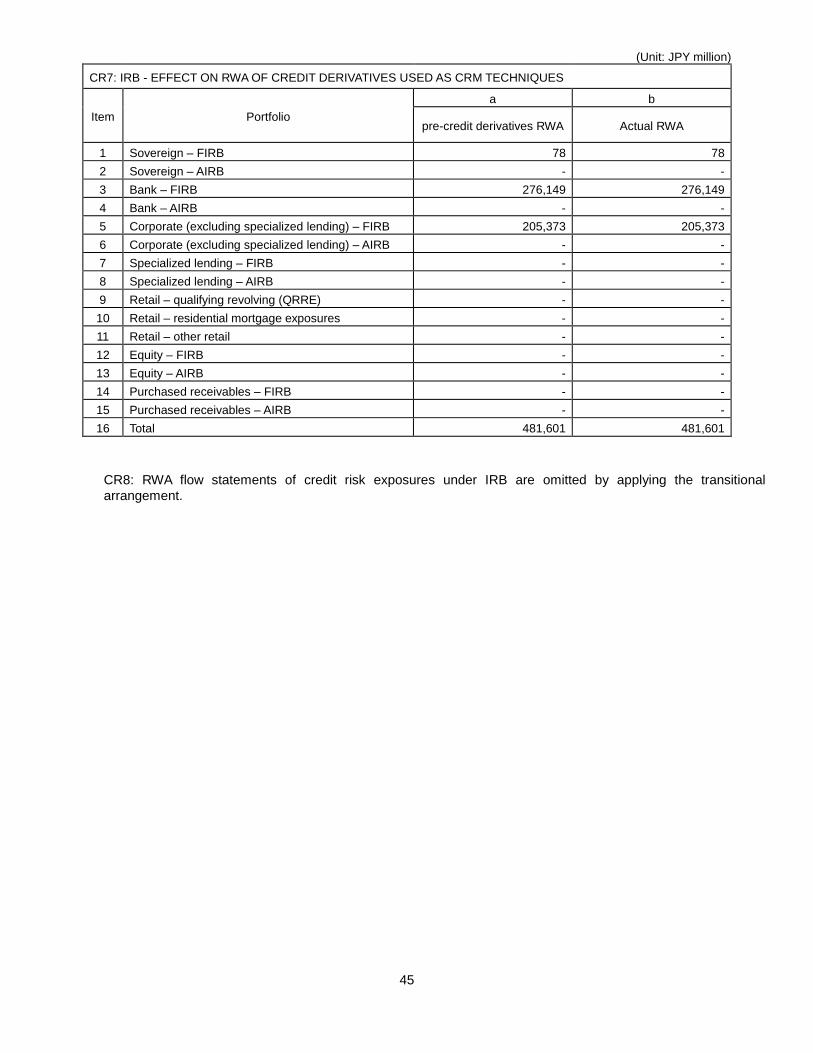
45
(Unit: JPY million)
CR7: IRB - EFFECT ON RWA OF CREDIT DERIVATIVES USED AS CRM TECHNIQUES
Item Portfolio
a b
pre-credit derivatives RWA Actual RWA
1 Sovereign – FIRB 78 78
2 Sovereign – AIRB - -
3 Bank – FIRB 276,149 276,149
4 Bank – AIRB - -
5 Corporate (excluding specialized lending) – FIRB 205,373 205,373
6 Corporate (excluding specialized lending) – AIRB - -
7 Specialized lending – FIRB - -
8 Specialized lending – AIRB - -
9 Retail – qualifying revolving (QRRE) - -
10 Retail – residential mortgage exposures - -
11 Retail – other retail - -
12 Equity – FIRB - -
13 Equity – AIRB - -
14 Purchased receivables – FIRB - -
15 Purchased receivables – AIRB - -
16 Total 481,601 481,601
CR8: RWA flow statements of credit risk exposures under IRB are omitted by applying the transitional
arrangement.
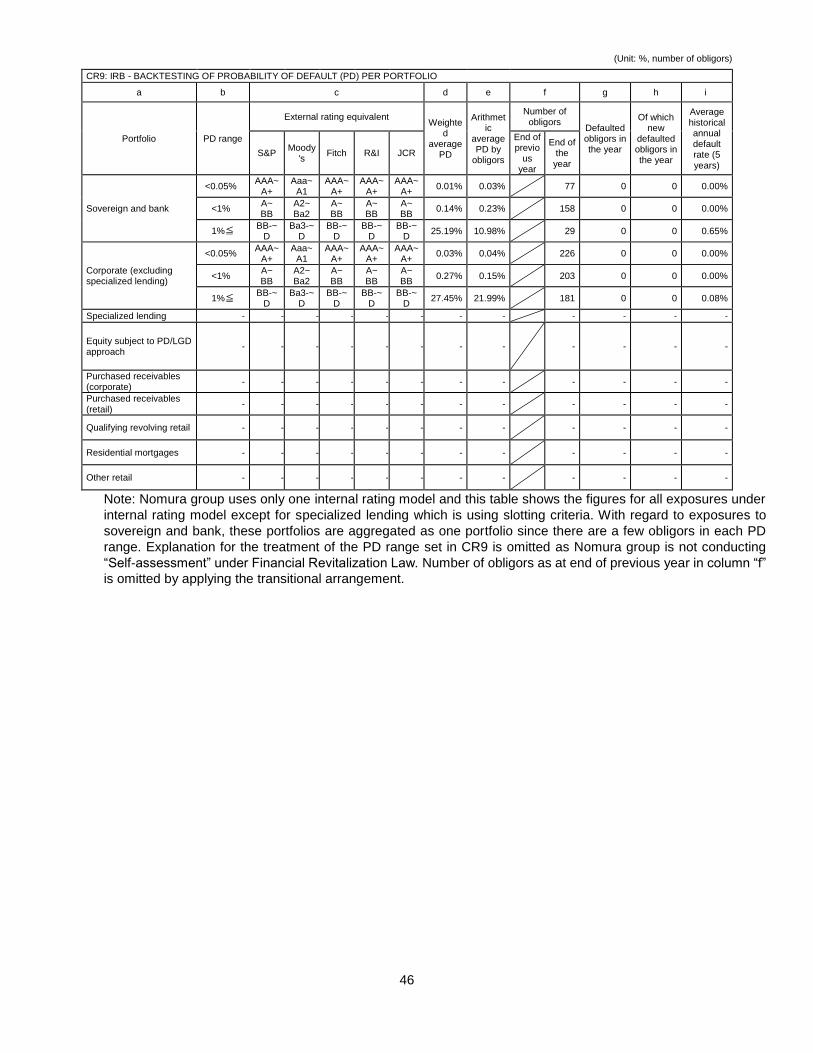
46
(Unit: %, number of obligors)
CR9: IRB - BACKTESTING OF PROBABILITY OF DEFAULT (PD) PER PORTFOLIO
a b c d e f g h i
Portfolio PD range
External rating equivalent Weighte
d average
PD
Arithmetic
average PD by
obligors
Number of obligors
Defaulted obligors in the year
Of which new
defaulted obligors in the year
Average historical annual default rate (5 years)
S&P Moody
's Fitch R&I JCR
End of previo
us year
End of the year
Sovereign and bank
<0.05% AAA~
A+ Aaa~
A1 AAA~
A+ AAA~
A+ AAA~
A+ 0.01% 0.03% 77 0 0 0.00%
<1% A~ BB
A2~ Ba2
A~ BB
A~ BB
A~ BB
0.14% 0.23% 158 0 0 0.00%
1%≦ BB-~
D Ba3-~
D BB-~
D BB-~
D BB-~
D 25.19% 10.98% 29 0 0 0.65%
Corporate (excluding specialized lending)
<0.05% AAA~
A+ Aaa~
A1 AAA~
A+ AAA~
A+ AAA~
A+ 0.03% 0.04% 226 0 0 0.00%
<1% A~ BB
A2~ Ba2
A~ BB
A~ BB
A~ BB
0.27% 0.15% 203 0 0 0.00%
1%≦ BB-~
D Ba3-~
D BB-~
D BB-~
D BB-~
D 27.45% 21.99% 181 0 0 0.08%
Specialized lending - - - - - - - - - - - -
Equity subject to PD/LGD approach
- - - - - - - - - - - -
Purchased receivables (corporate)
- - - - - - - - - - - -
Purchased receivables (retail)
- - - - - - - - - - - -
Qualifying revolving retail - - - - - - - - - - - -
Residential mortgages - - - - - - - - - - - -
Other retail - - - - - - - - - - - -
Note: Nomura group uses only one internal rating model and this table shows the figures for all exposures under
internal rating model except for specialized lending which is using slotting criteria. With regard to exposures to
sovereign and bank, these portfolios are aggregated as one portfolio since there are a few obligors in each PD
range. Explanation for the treatment of the PD range set in CR9 is omitted as Nomura group is not conducting
“Self-assessment” under Financial Revitalization Law. Number of obligors as at end of previous year in column “f”
is omitted by applying the transitional arrangement.
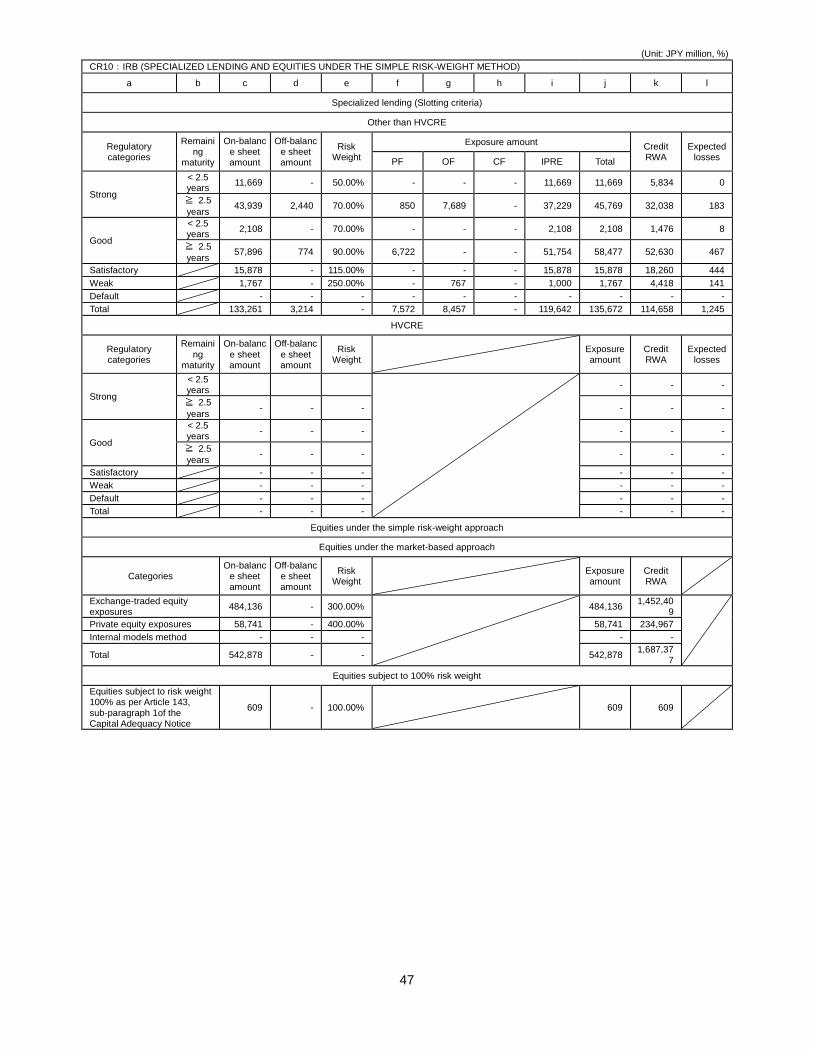
47
(Unit: JPY million, %)
CR10:IRB (SPECIALIZED LENDING AND EQUITIES UNDER THE SIMPLE RISK-WEIGHT METHOD)
a b c d e f g h i j k l
Specialized lending (Slotting criteria)
Other than HVCRE
Regulatory categories
Remaining
maturity
On-balance sheet amount
Off-balance sheet amount
Risk Weight
Exposure amount Credit RWA
Expected losses
PF OF CF IPRE Total
Strong
< 2.5 years
11,669 - 50.00% - - - 11,669 11,669 5,834 0
≧ 2.5
years 43,939 2,440 70.00% 850 7,689 - 37,229 45,769 32,038 183
Good
< 2.5 years
2,108 - 70.00% - - - 2,108 2,108 1,476 8
≧ 2.5
years 57,896 774 90.00% 6,722 - - 51,754 58,477 52,630 467
Satisfactory 15,878 - 115.00% - - - 15,878 15,878 18,260 444
Weak 1,767 - 250.00% - 767 - 1,000 1,767 4,418 141
Default - - - - - - - - - -
Total 133,261 3,214 - 7,572 8,457 - 119,642 135,672 114,658 1,245
HVCRE
Regulatory categories
Remaini
ng maturity
On-balanc
e sheet amount
Off-balanc
e sheet amount
Risk Weight
Exposure amount
Credit RWA
Expected losses
Strong
< 2.5 years
- - -
≧ 2.5
years - - - - - -
Good
< 2.5 years
- - - - - -
≧ 2.5
years - - - - - -
Satisfactory - - - - - -
Weak - - - - - -
Default - - - - - -
Total - - - - - -
Equities under the simple risk-weight approach
Equities under the market-based approach
Categories On-balanc
e sheet amount
Off-balance sheet amount
Risk Weight
Exposure amount
Credit RWA
Exchange-traded equity exposures
484,136 - 300.00%
484,136 1,452,40
9
Private equity exposures 58,741 - 400.00% 58,741 234,967
Internal models method - - - - -
Total 542,878 - - 542,878 1,687,37
7
Equities subject to 100% risk weight
Equities subject to risk weight 100% as per Article 143, sub-paragraph 1of the Capital Adequacy Notice
609 - 100.00% 609 609
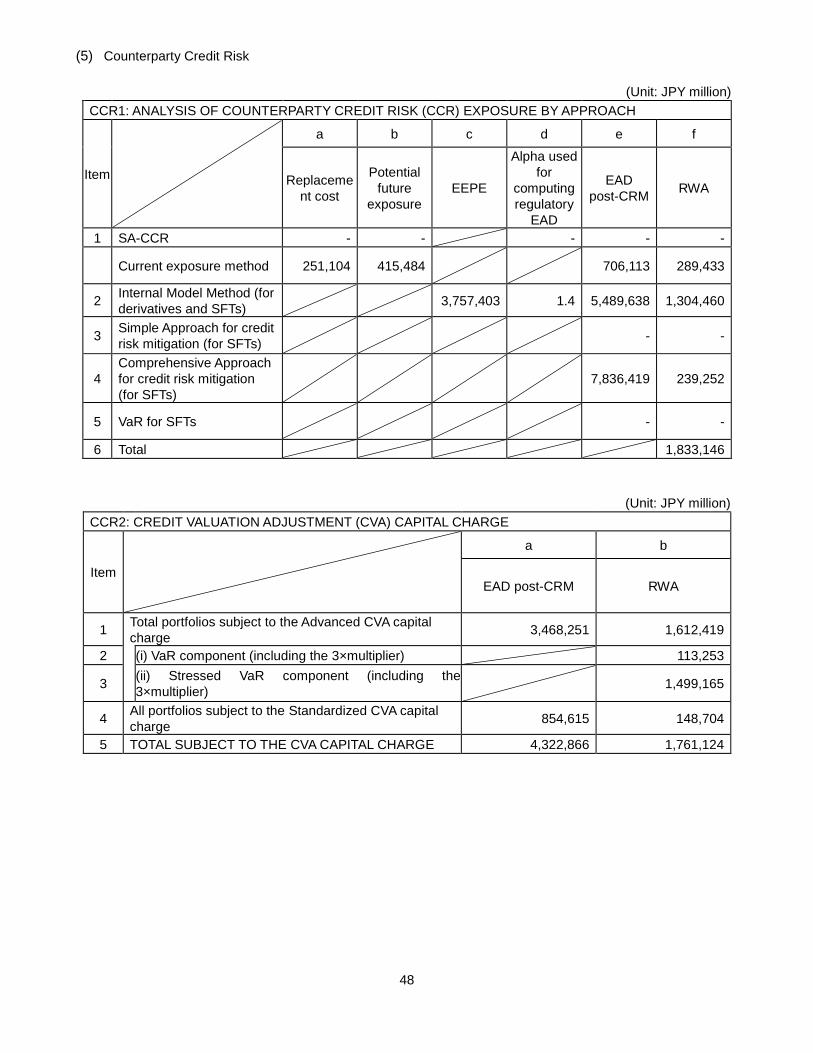
48
(5) Counterparty Credit Risk
(Unit: JPY million)
CCR1: ANALYSIS OF COUNTERPARTY CREDIT RISK (CCR) EXPOSURE BY APPROACH
Item
a b c d e f
Replaceme
nt cost
Potential
future
exposure
EEPE
Alpha used
for
computing
regulatory
EAD
EAD
post-CRM RWA
1 SA-CCR - - - - -
Current exposure method 251,104 415,484 706,113 289,433
2 Internal Model Method (for
derivatives and SFTs) 3,757,403 1.4 5,489,638 1,304,460
3 Simple Approach for credit
risk mitigation (for SFTs) - -
4
Comprehensive Approach
for credit risk mitigation
(for SFTs)
7,836,419 239,252
5 VaR for SFTs - -
6 Total 1,833,146
(Unit: JPY million)
CCR2: CREDIT VALUATION ADJUSTMENT (CVA) CAPITAL CHARGE
Item
a b
EAD post-CRM RWA
1 Total portfolios subject to the Advanced CVA capital
charge 3,468,251 1,612,419
2 (i) VaR component (including the 3×multiplier) 113,253
3 (ii) Stressed VaR component (including the
3×multiplier) 1,499,165
4 All portfolios subject to the Standardized CVA capital
charge 854,615 148,704
5 TOTAL SUBJECT TO THE CVA CAPITAL CHARGE 4,322,866 1,761,124
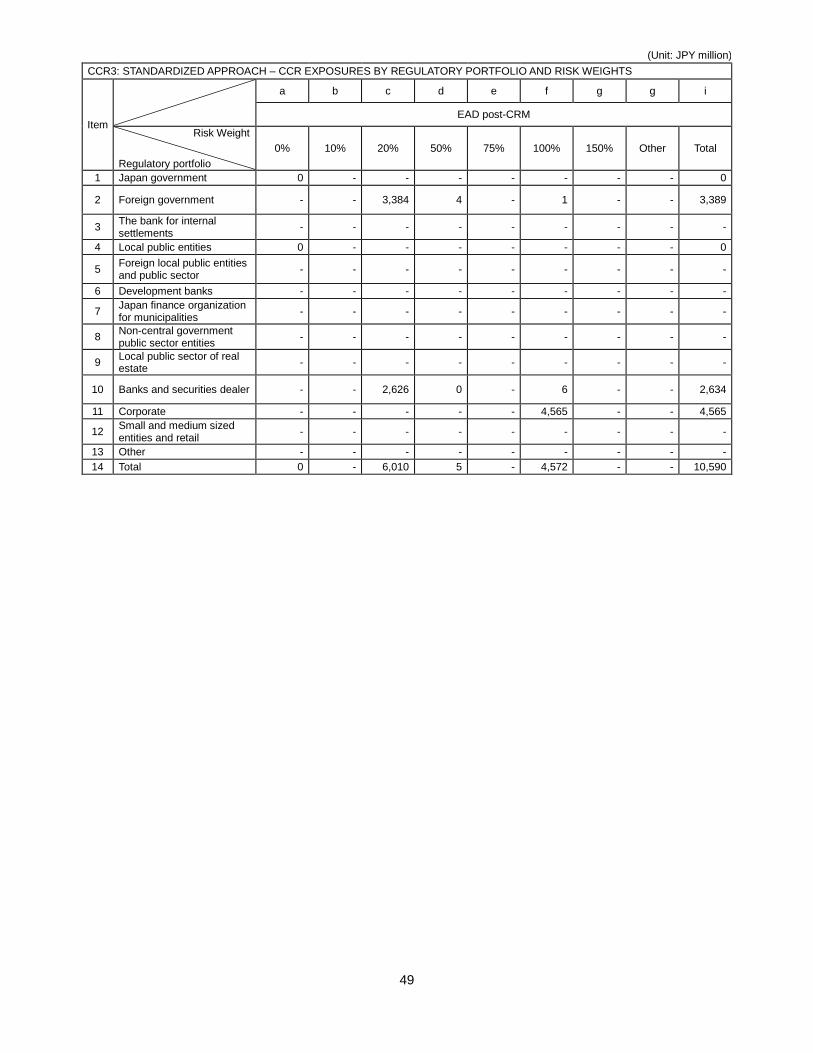
49
(Unit: JPY million)
CCR3: STANDARDIZED APPROACH – CCR EXPOSURES BY REGULATORY PORTFOLIO AND RISK WEIGHTS
Item
a b c d e f g g i
EAD post-CRM
Risk Weight
Regulatory portfolio
0% 10% 20% 50% 75% 100% 150% Other Total
1 Japan government 0 - - - - - - - 0
2 Foreign government - - 3,384 4 - 1 - - 3,389
3 The bank for internal settlements
- - - - - - - - -
4 Local public entities 0 - - - - - - - 0
5 Foreign local public entities and public sector
- - - - - - - - -
6 Development banks - - - - - - - - -
7 Japan finance organization for municipalities
- - - - - - - - -
8 Non-central government public sector entities
- - - - - - - - -
9 Local public sector of real estate
- - - - - - - - -
10 Banks and securities dealer - - 2,626 0 - 6 - - 2,634
11 Corporate - - - - - 4,565 - - 4,565
12 Small and medium sized entities and retail
- - - - - - - - -
13 Other - - - - - - - - -
14 Total 0 - 6,010 5 - 4,572 - - 10,590
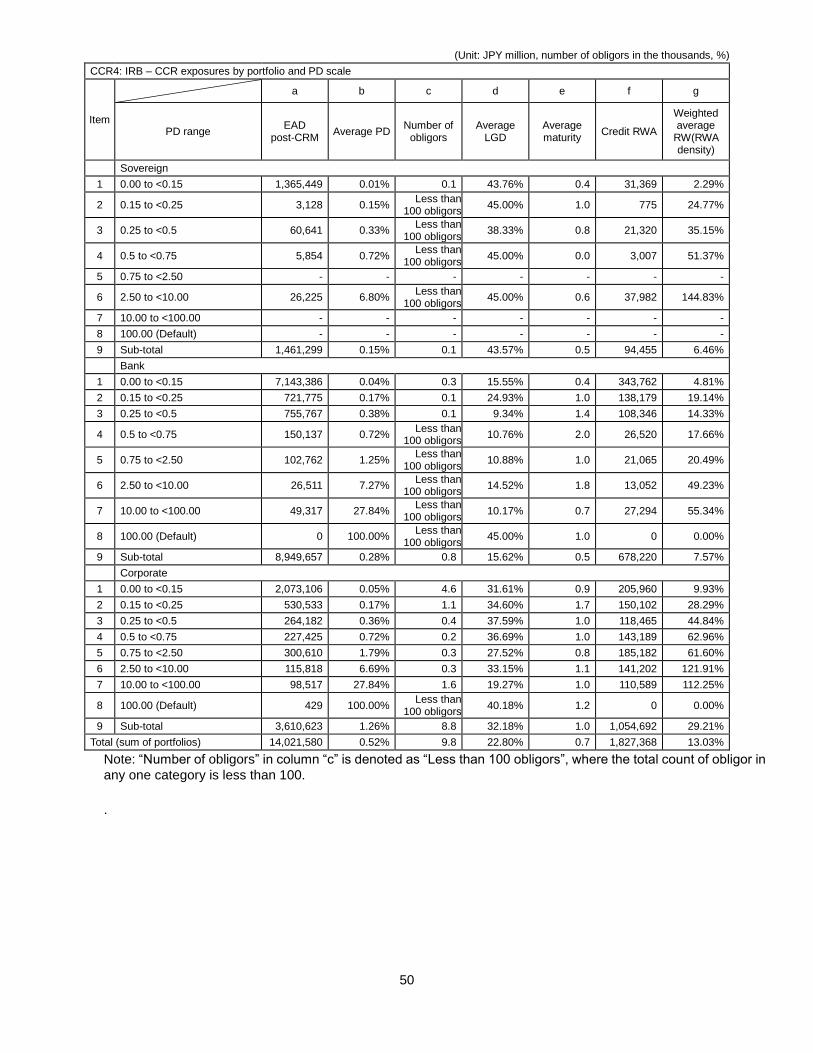
50
(Unit: JPY million, number of obligors in the thousands, %)
CCR4: IRB – CCR exposures by portfolio and PD scale
Item
a b c d e f g
PD range EAD
post-CRM Average PD
Number of obligors
Average LGD
Average maturity
Credit RWA
Weighted average
RW(RWA density)
Sovereign
1 0.00 to <0.15 1,365,449 0.01% 0.1 43.76% 0.4 31,369 2.29%
2 0.15 to <0.25 3,128 0.15% Less than
100 obligors 45.00% 1.0 775 24.77%
3 0.25 to <0.5 60,641 0.33% Less than
100 obligors 38.33% 0.8 21,320 35.15%
4 0.5 to <0.75 5,854 0.72% Less than
100 obligors 45.00% 0.0 3,007 51.37%
5 0.75 to <2.50 - - - - - - -
6 2.50 to <10.00 26,225 6.80% Less than
100 obligors 45.00% 0.6 37,982 144.83%
7 10.00 to <100.00 - - - - - - -
8 100.00 (Default) - - - - - - -
9 Sub-total 1,461,299 0.15% 0.1 43.57% 0.5 94,455 6.46%
Bank
1 0.00 to <0.15 7,143,386 0.04% 0.3 15.55% 0.4 343,762 4.81%
2 0.15 to <0.25 721,775 0.17% 0.1 24.93% 1.0 138,179 19.14%
3 0.25 to <0.5 755,767 0.38% 0.1 9.34% 1.4 108,346 14.33%
4 0.5 to <0.75 150,137 0.72% Less than
100 obligors 10.76% 2.0 26,520 17.66%
5 0.75 to <2.50 102,762 1.25% Less than
100 obligors 10.88% 1.0 21,065 20.49%
6 2.50 to <10.00 26,511 7.27% Less than
100 obligors 14.52% 1.8 13,052 49.23%
7 10.00 to <100.00 49,317 27.84% Less than
100 obligors 10.17% 0.7 27,294 55.34%
8 100.00 (Default) 0 100.00% Less than
100 obligors 45.00% 1.0 0 0.00%
9 Sub-total 8,949,657 0.28% 0.8 15.62% 0.5 678,220 7.57%
Corporate
1 0.00 to <0.15 2,073,106 0.05% 4.6 31.61% 0.9 205,960 9.93%
2 0.15 to <0.25 530,533 0.17% 1.1 34.60% 1.7 150,102 28.29%
3 0.25 to <0.5 264,182 0.36% 0.4 37.59% 1.0 118,465 44.84%
4 0.5 to <0.75 227,425 0.72% 0.2 36.69% 1.0 143,189 62.96%
5 0.75 to <2.50 300,610 1.79% 0.3 27.52% 0.8 185,182 61.60%
6 2.50 to <10.00 115,818 6.69% 0.3 33.15% 1.1 141,202 121.91%
7 10.00 to <100.00 98,517 27.84% 1.6 19.27% 1.0 110,589 112.25%
8 100.00 (Default) 429 100.00% Less than
100 obligors 40.18% 1.2 0 0.00%
9 Sub-total 3,610,623 1.26% 8.8 32.18% 1.0 1,054,692 29.21%
Total (sum of portfolios) 14,021,580 0.52% 9.8 22.80% 0.7 1,827,368 13.03%
Note: “Number of obligors” in column “c” is denoted as “Less than 100 obligors”, where the total count of obligor in
any one category is less than 100.
.
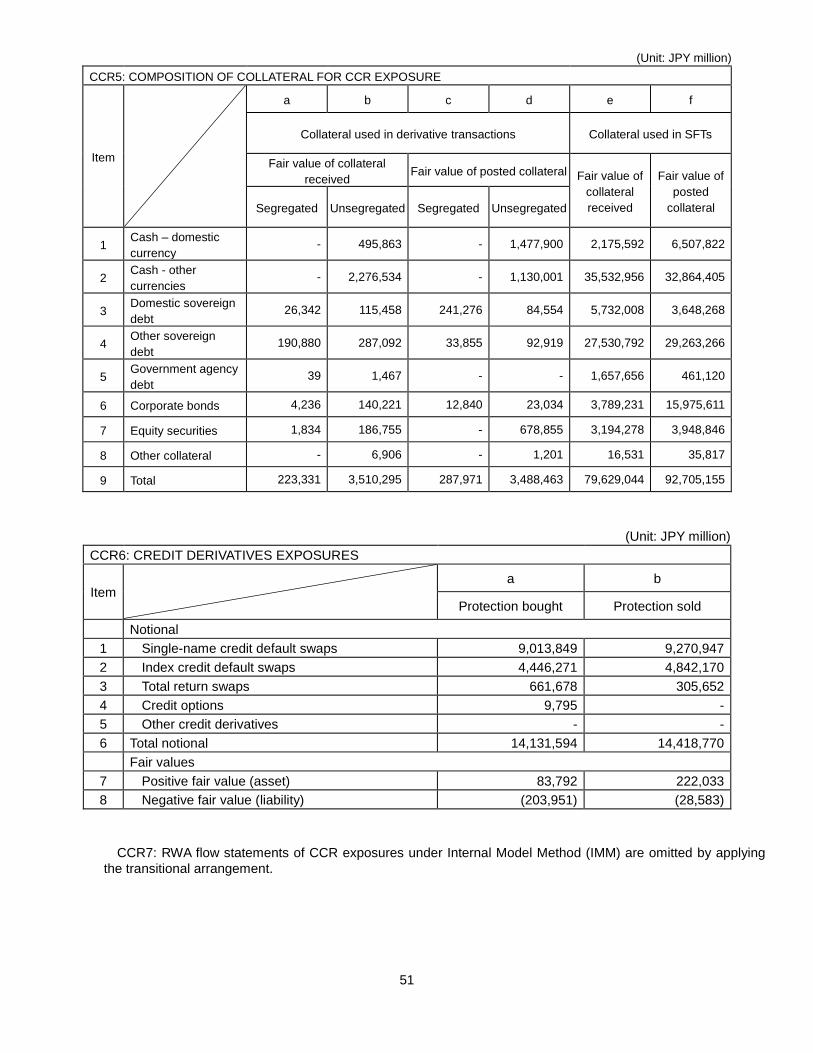
51
(Unit: JPY million)
CCR5: COMPOSITION OF COLLATERAL FOR CCR EXPOSURE
Item
a b c d e f
Collateral used in derivative transactions Collateral used in SFTs
Fair value of collateral
received Fair value of posted collateral Fair value of
collateral
received
Fair value of
posted
collateral Segregated Unsegregated Segregated Unsegregated
1 Cash – domestic
currency - 495,863 - 1,477,900 2,175,592 6,507,822
2 Cash - other
currencies - 2,276,534 - 1,130,001 35,532,956 32,864,405
3 Domestic sovereign
debt 26,342 115,458 241,276 84,554 5,732,008 3,648,268
4 Other sovereign
debt 190,880 287,092 33,855 92,919 27,530,792 29,263,266
5 Government agency
debt 39 1,467 - - 1,657,656 461,120
6 Corporate bonds 4,236 140,221 12,840 23,034 3,789,231 15,975,611
7 Equity securities 1,834 186,755 - 678,855 3,194,278 3,948,846
8 Other collateral - 6,906 - 1,201 16,531 35,817
9 Total 223,331 3,510,295 287,971 3,488,463 79,629,044 92,705,155
(Unit: JPY million)
CCR6: CREDIT DERIVATIVES EXPOSURES
Item a b
Protection bought Protection sold
Notional
1 Single-name credit default swaps 9,013,849 9,270,947
2 Index credit default swaps 4,446,271 4,842,170
3 Total return swaps 661,678 305,652
4 Credit options 9,795 -
5 Other credit derivatives - -
6 Total notional 14,131,594 14,418,770
Fair values
7 Positive fair value (asset) 83,792 222,033
8 Negative fair value (liability) (203,951) (28,583)
CCR7: RWA flow statements of CCR exposures under Internal Model Method (IMM) are omitted by applying
the transitional arrangement.
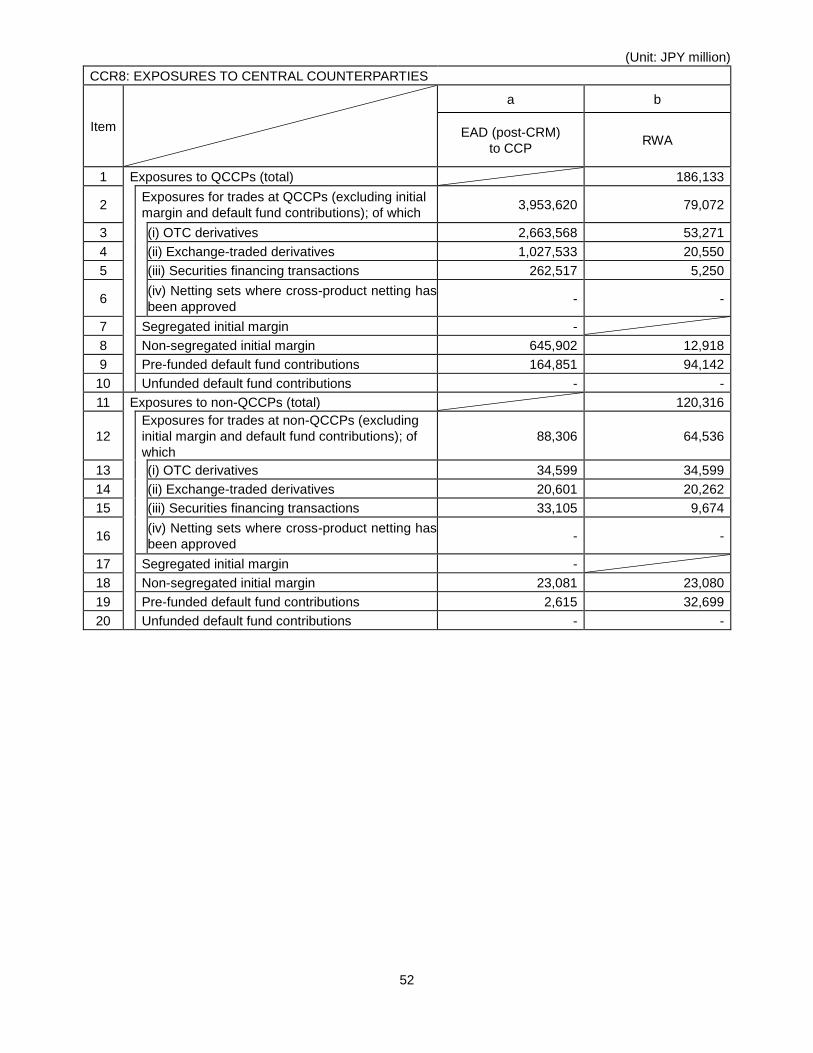
52
(Unit: JPY million)
CCR8: EXPOSURES TO CENTRAL COUNTERPARTIES
Item
a b
EAD (post-CRM)
to CCP RWA
1 Exposures to QCCPs (total) 186,133
2 Exposures for trades at QCCPs (excluding initial
margin and default fund contributions); of which 3,953,620 79,072
3 (i) OTC derivatives 2,663,568 53,271
4 (ii) Exchange-traded derivatives 1,027,533 20,550
5 (iii) Securities financing transactions 262,517 5,250
6 (iv) Netting sets where cross-product netting has
been approved - -
7 Segregated initial margin -
8 Non-segregated initial margin 645,902 12,918
9 Pre-funded default fund contributions 164,851 94,142
10 Unfunded default fund contributions - -
11 Exposures to non-QCCPs (total) 120,316
12
Exposures for trades at non-QCCPs (excluding
initial margin and default fund contributions); of
which
88,306 64,536
13 (i) OTC derivatives 34,599 34,599
14 (ii) Exchange-traded derivatives 20,601 20,262
15 (iii) Securities financing transactions 33,105 9,674
16 (iv) Netting sets where cross-product netting has
been approved - -
17 Segregated initial margin -
18 Non-segregated initial margin 23,081 23,080
19 Pre-funded default fund contributions 2,615 32,699
20 Unfunded default fund contributions - -
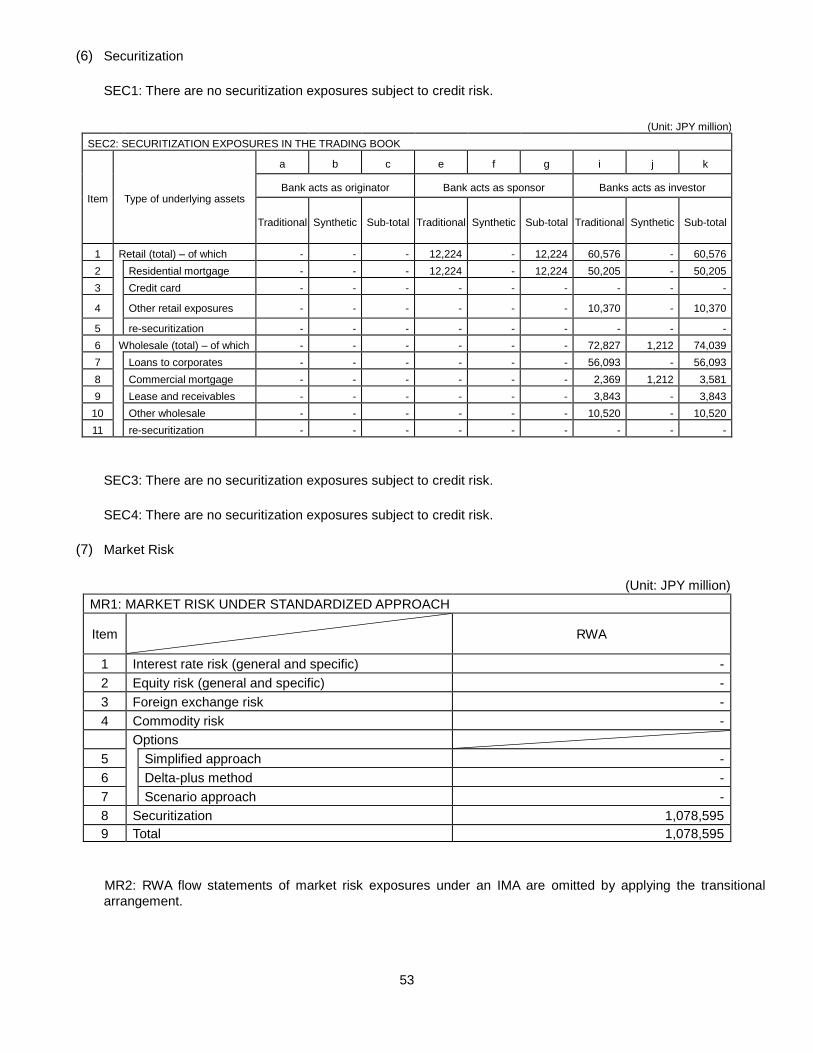
53
(6) Securitization
SEC1: There are no securitization exposures subject to credit risk.
(Unit: JPY million)
SEC2: SECURITIZATION EXPOSURES IN THE TRADING BOOK
Item Type of underlying assets
a b c e f g i j k
Bank acts as originator Bank acts as sponsor Banks acts as investor
Traditional Synthetic Sub-total Traditional Synthetic Sub-total Traditional Synthetic Sub-total
1 Retail (total) – of which - - - 12,224 - 12,224 60,576 - 60,576
2 Residential mortgage - - - 12,224 - 12,224 50,205 - 50,205
3 Credit card - - - - - - - - -
4 Other retail exposures - - - - - - 10,370 - 10,370
5 re-securitization - - - - - - - - -
6 Wholesale (total) – of which - - - - - - 72,827 1,212 74,039
7 Loans to corporates - - - - - - 56,093 - 56,093
8 Commercial mortgage - - - - - - 2,369 1,212 3,581
9 Lease and receivables - - - - - - 3,843 - 3,843
10 Other wholesale - - - - - - 10,520 - 10,520
11 re-securitization - - - - - - - - -
SEC3: There are no securitization exposures subject to credit risk.
SEC4: There are no securitization exposures subject to credit risk.
(7) Market Risk
(Unit: JPY million)
MR1: MARKET RISK UNDER STANDARDIZED APPROACH
Item RWA
1 Interest rate risk (general and specific) -
2 Equity risk (general and specific) -
3 Foreign exchange risk -
4 Commodity risk -
Options
5 Simplified approach -
6 Delta-plus method -
7 Scenario approach -
8 Securitization 1,078,595
9 Total 1,078,595
MR2: RWA flow statements of market risk exposures under an IMA are omitted by applying the transitional
arrangement.
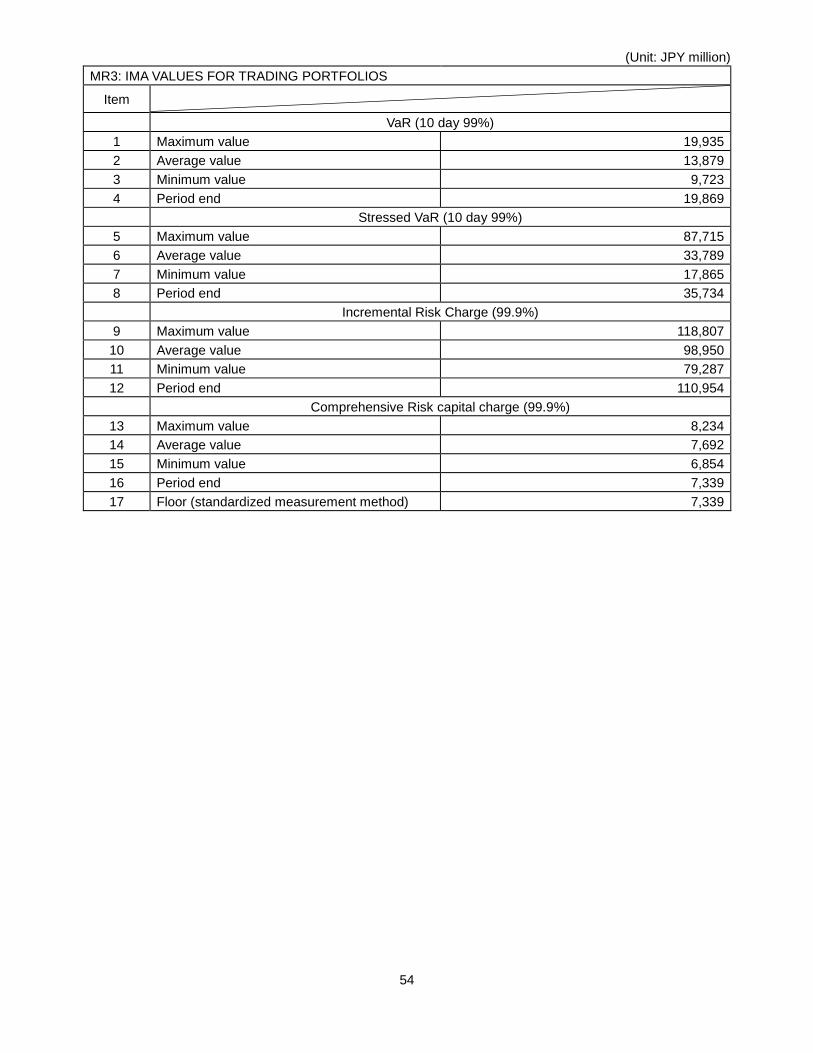
54
(Unit: JPY million)
MR3: IMA VALUES FOR TRADING PORTFOLIOS
Item
VaR (10 day 99%)
1 Maximum value 19,935
2 Average value 13,879
3 Minimum value 9,723
4 Period end 19,869
Stressed VaR (10 day 99%)
5 Maximum value 87,715
6 Average value 33,789
7 Minimum value 17,865
8 Period end 35,734
Incremental Risk Charge (99.9%)
9 Maximum value 118,807
10 Average value 98,950
11 Minimum value 79,287
12 Period end 110,954
Comprehensive Risk capital charge (99.9%)
13 Maximum value 8,234
14 Average value 7,692
15 Minimum value 6,854
16 Period end 7,339
17 Floor (standardized measurement method) 7,339
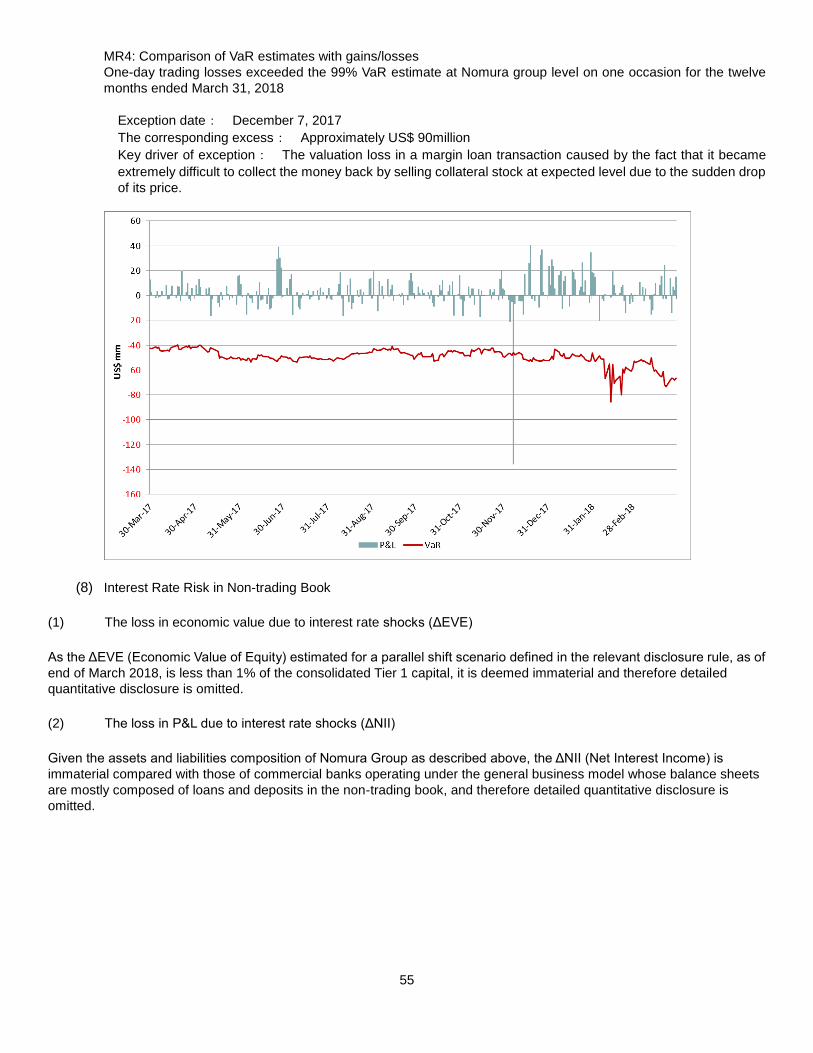
55
MR4: Comparison of VaR estimates with gains/losses
One-day trading losses exceeded the 99% VaR estimate at Nomura group level on one occasion for the twelve
months ended March 31, 2018
Exception date: December 7, 2017
The corresponding excess: Approximately US$ 90million
Key driver of exception: The valuation loss in a margin loan transaction caused by the fact that it became
extremely difficult to collect the money back by selling collateral stock at expected level due to the sudden drop
of its price.
(8) Interest Rate Risk in Non-trading Book
(1) The loss in economic value due to interest rate shocks (ΔEVE)
As the ΔEVE (Economic Value of Equity) estimated for a parallel shift scenario defined in the relevant disclosure rule, as of
end of March 2018, is less than 1% of the consolidated Tier 1 capital, it is deemed immaterial and therefore detailed
quantitative disclosure is omitted.
(2) The loss in P&L due to interest rate shocks (ΔNII)
Given the assets and liabilities composition of Nomura Group as described above, the ΔNII (Net Interest Income) is
immaterial compared with those of commercial banks operating under the general business model whose balance sheets
are mostly composed of loans and deposits in the non-trading book, and therefore detailed quantitative disclosure is
omitted.
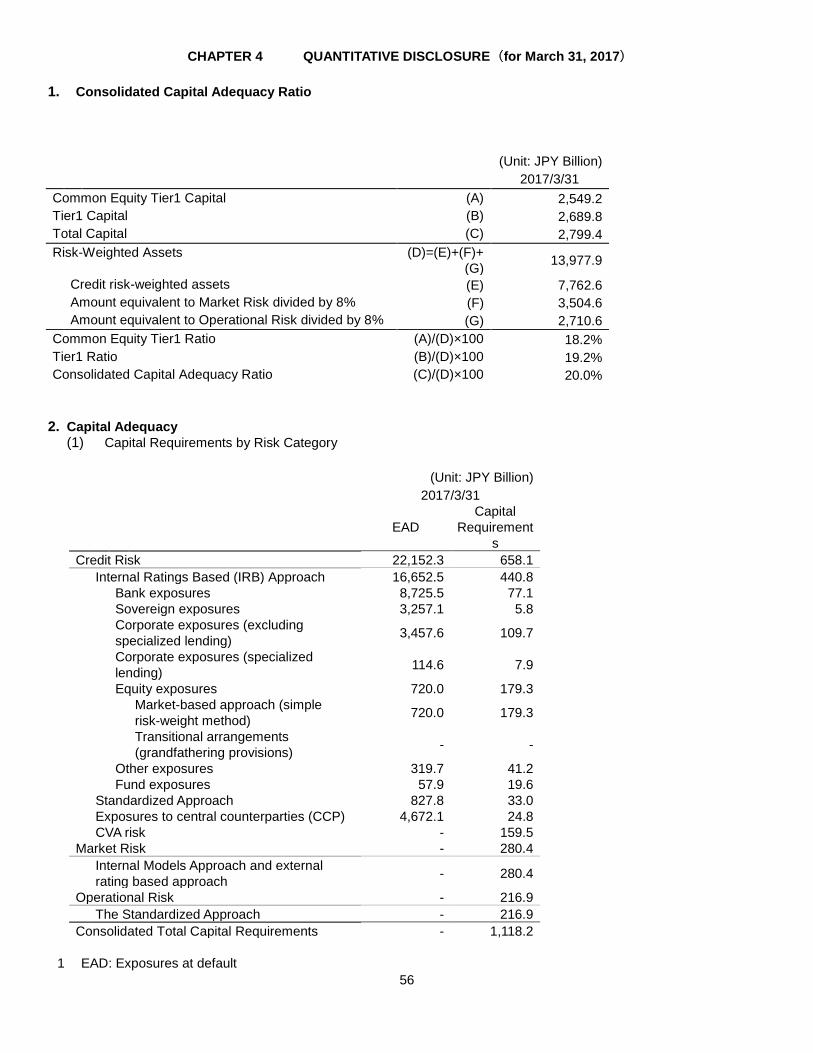
56
CHAPTER 4 QUANTITATIVE DISCLOSURE (for March 31, 2017)
1. Consolidated Capital Adequacy Ratio
(Unit: JPY Billion)
2017/3/31
Common Equity Tier1 Capital (A) 2,549.2
Tier1 Capital (B) 2,689.8
Total Capital (C) 2,799.4
Risk-Weighted Assets (D)=(E)+(F)+
(G) 13,977.9
Credit risk-weighted assets (E) 7,762.6
Amount equivalent to Market Risk divided by 8% (F) 3,504.6
Amount equivalent to Operational Risk divided by 8% (G) 2,710.6
Common Equity Tier1 Ratio (A)/(D)×100 18.2%
Tier1 Ratio (B)/(D)×100 19.2%
Consolidated Capital Adequacy Ratio (C)/(D)×100 20.0%
2. Capital Adequacy
(1) Capital Requirements by Risk Category
(Unit: JPY Billion)
2017/3/31
EAD
Capital
Requirement
s
Credit Risk 22,152.3 658.1
Internal Ratings Based (IRB) Approach 16,652.5 440.8
Bank exposures 8,725.5 77.1
Sovereign exposures 3,257.1 5.8
Corporate exposures (excluding
specialized lending) 3,457.6 109.7
Corporate exposures (specialized
lending) 114.6 7.9
Equity exposures 720.0 179.3
Market-based approach (simple
risk-weight method) 720.0 179.3
Transitional arrangements
(grandfathering provisions) - -
Other exposures 319.7 41.2
Fund exposures 57.9 19.6
Standardized Approach 827.8 33.0
Exposures to central counterparties (CCP) 4,672.1 24.8
CVA risk - 159.5
Market Risk - 280.4
Internal Models Approach and external
rating based approach - 280.4
Operational Risk - 216.9
The Standardized Approach - 216.9
Consolidated Total Capital Requirements - 1,118.2
1 EAD: Exposures at default
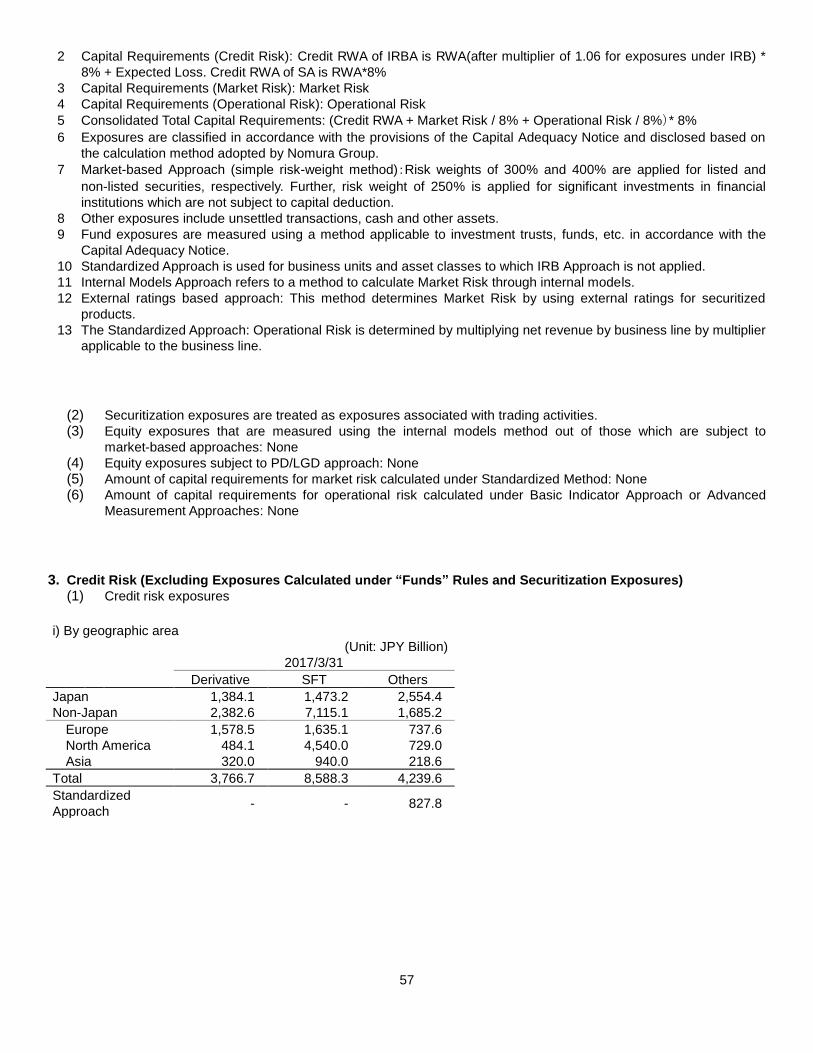
57
2 Capital Requirements (Credit Risk): Credit RWA of IRBA is RWA(after multiplier of 1.06 for exposures under IRB) *
8% + Expected Loss. Credit RWA of SA is RWA*8%
3 Capital Requirements (Market Risk): Market Risk
4 Capital Requirements (Operational Risk): Operational Risk
5 Consolidated Total Capital Requirements: (Credit RWA + Market Risk / 8% + Operational Risk / 8%)* 8%
6 Exposures are classified in accordance with the provisions of the Capital Adequacy Notice and disclosed based on
the calculation method adopted by Nomura Group.
7 Market-based Approach (simple risk-weight method):Risk weights of 300% and 400% are applied for listed and
non-listed securities, respectively. Further, risk weight of 250% is applied for significant investments in financial
institutions which are not subject to capital deduction.
8 Other exposures include unsettled transactions, cash and other assets.
9 Fund exposures are measured using a method applicable to investment trusts, funds, etc. in accordance with the
Capital Adequacy Notice.
10 Standardized Approach is used for business units and asset classes to which IRB Approach is not applied.
11 Internal Models Approach refers to a method to calculate Market Risk through internal models.
12 External ratings based approach: This method determines Market Risk by using external ratings for securitized
products.
13 The Standardized Approach: Operational Risk is determined by multiplying net revenue by business line by multiplier
applicable to the business line.
(2) Securitization exposures are treated as exposures associated with trading activities.
(3) Equity exposures that are measured using the internal models method out of those which are subject to
market-based approaches: None
(4) Equity exposures subject to PD/LGD approach: None
(5) Amount of capital requirements for market risk calculated under Standardized Method: None
(6) Amount of capital requirements for operational risk calculated under Basic Indicator Approach or Advanced
Measurement Approaches: None
3. Credit Risk (Excluding Exposures Calculated under “Funds” Rules and Securitization Exposures)
(1) Credit risk exposures
i) By geographic area
(Unit: JPY Billion)
2017/3/31
Derivative SFT Others
Japan 1,384.1 1,473.2 2,554.4
Non-Japan 2,382.6 7,115.1 1,685.2
Europe 1,578.5 1,635.1 737.6
North America 484.1 4,540.0 729.0
Asia 320.0 940.0 218.6
Total 3,766.7 8,588.3 4,239.6
Standardized
Approach - - 827.8
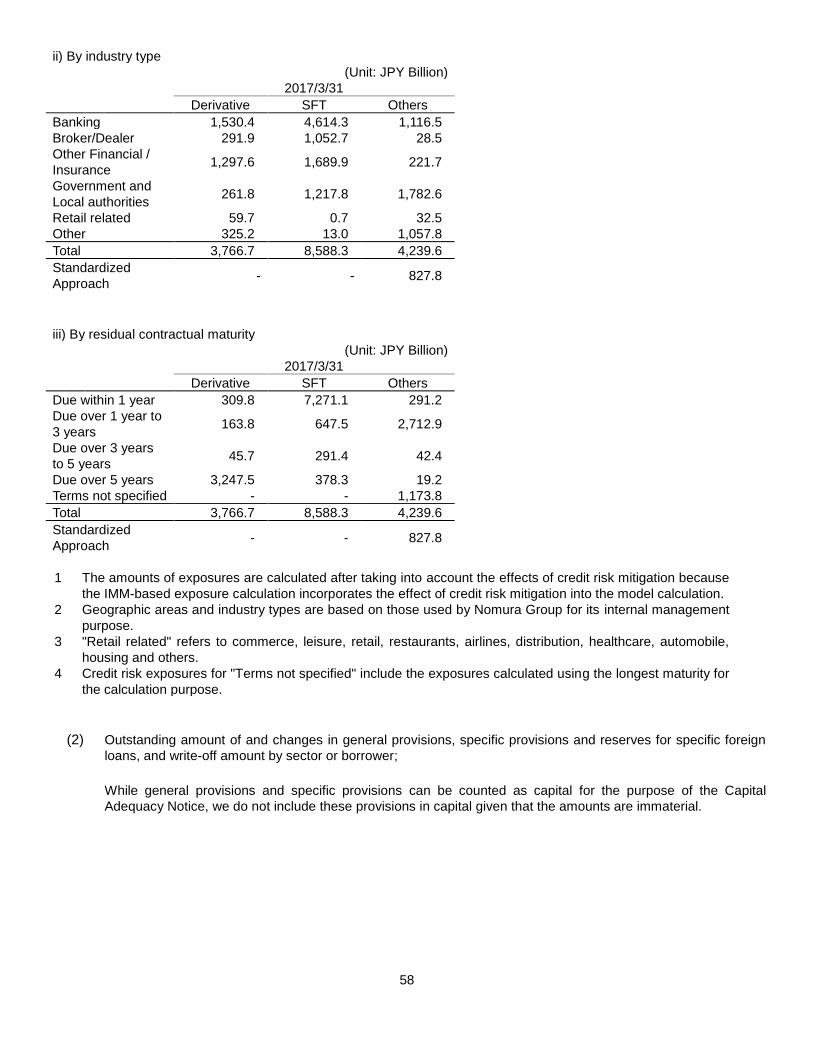
58
ii) By industry type
(Unit: JPY Billion)
2017/3/31
Derivative SFT Others
Banking 1,530.4 4,614.3 1,116.5
Broker/Dealer 291.9 1,052.7 28.5
Other Financial /
Insurance 1,297.6 1,689.9 221.7
Government and
Local authorities 261.8 1,217.8 1,782.6
Retail related 59.7 0.7 32.5
Other 325.2 13.0 1,057.8
Total 3,766.7 8,588.3 4,239.6
Standardized
Approach - - 827.8
iii) By residual contractual maturity
(Unit: JPY Billion)
2017/3/31
Derivative SFT Others
Due within 1 year 309.8 7,271.1 291.2
Due over 1 year to
3 years 163.8 647.5 2,712.9
Due over 3 years
to 5 years 45.7 291.4 42.4
Due over 5 years 3,247.5 378.3 19.2
Terms not specified - - 1,173.8
Total 3,766.7 8,588.3 4,239.6
Standardized
Approach - - 827.8
1 The amounts of exposures are calculated after taking into account the effects of credit risk mitigation because
the IMM-based exposure calculation incorporates the effect of credit risk mitigation into the model calculation.
2 Geographic areas and industry types are based on those used by Nomura Group for its internal management
purpose.
3 "Retail related" refers to commerce, leisure, retail, restaurants, airlines, distribution, healthcare, automobile,
housing and others.
4 Credit risk exposures for "Terms not specified" include the exposures calculated using the longest maturity for
the calculation purpose.
(2) Outstanding amount of and changes in general provisions, specific provisions and reserves for specific foreign
loans, and write-off amount by sector or borrower;
While general provisions and specific provisions can be counted as capital for the purpose of the Capital
Adequacy Notice, we do not include these provisions in capital given that the amounts are immaterial.
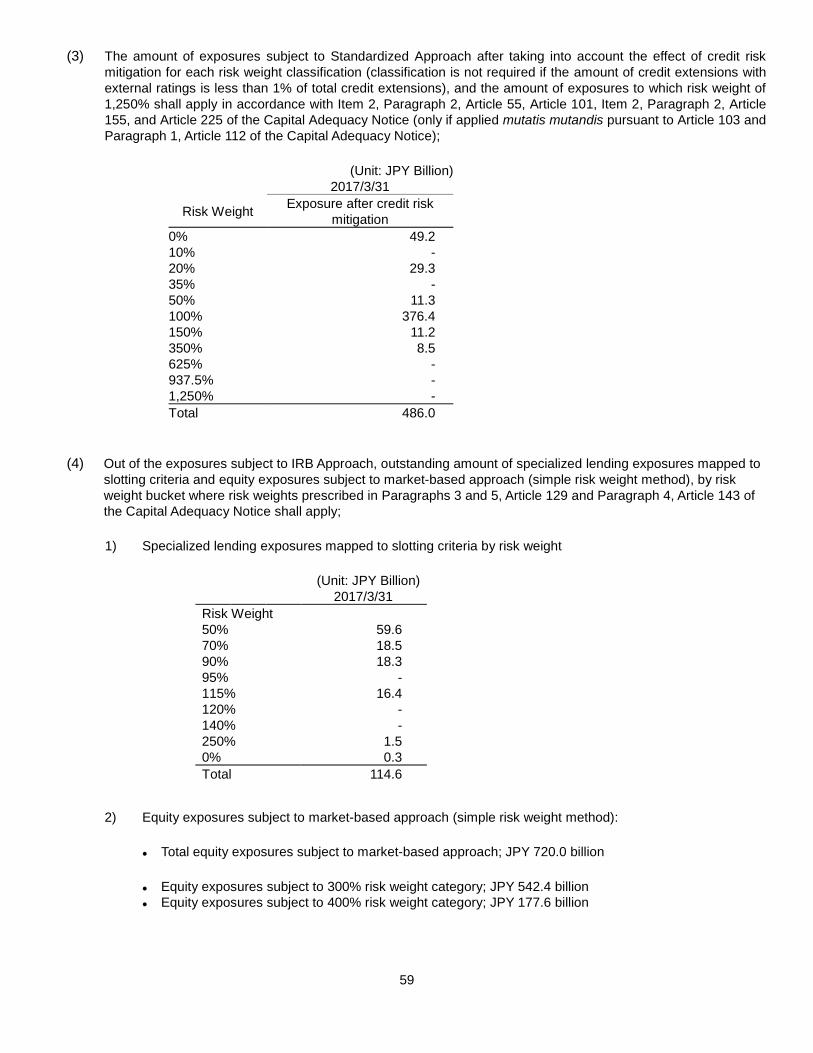
59
(3) The amount of exposures subject to Standardized Approach after taking into account the effect of credit risk
mitigation for each risk weight classification (classification is not required if the amount of credit extensions with
external ratings is less than 1% of total credit extensions), and the amount of exposures to which risk weight of
1,250% shall apply in accordance with Item 2, Paragraph 2, Article 55, Article 101, Item 2, Paragraph 2, Article
155, and Article 225 of the Capital Adequacy Notice (only if applied mutatis mutandis pursuant to Article 103 and
Paragraph 1, Article 112 of the Capital Adequacy Notice);
(Unit: JPY Billion)
2017/3/31
Risk Weight Exposure after credit risk
mitigation
0% 49.2
10% -
20% 29.3
35% -
50% 11.3
100% 376.4
150% 11.2
350% 8.5
625% -
937.5% -
1,250% -
Total 486.0
(4) Out of the exposures subject to IRB Approach, outstanding amount of specialized lending exposures mapped to
slotting criteria and equity exposures subject to market-based approach (simple risk weight method), by risk
weight bucket where risk weights prescribed in Paragraphs 3 and 5, Article 129 and Paragraph 4, Article 143 of
the Capital Adequacy Notice shall apply;
1) Specialized lending exposures mapped to slotting criteria by risk weight
(Unit: JPY Billion)
2017/3/31
Risk Weight
50% 59.6
70% 18.5
90% 18.3
95% -
115% 16.4
120% -
140% -
250% 1.5
0% 0.3
Total 114.6
2) Equity exposures subject to market-based approach (simple risk weight method):
Total equity exposures subject to market-based approach; JPY 720.0 billion
Equity exposures subject to 300% risk weight category; JPY 542.4 billion
Equity exposures subject to 400% risk weight category; JPY 177.6 billion
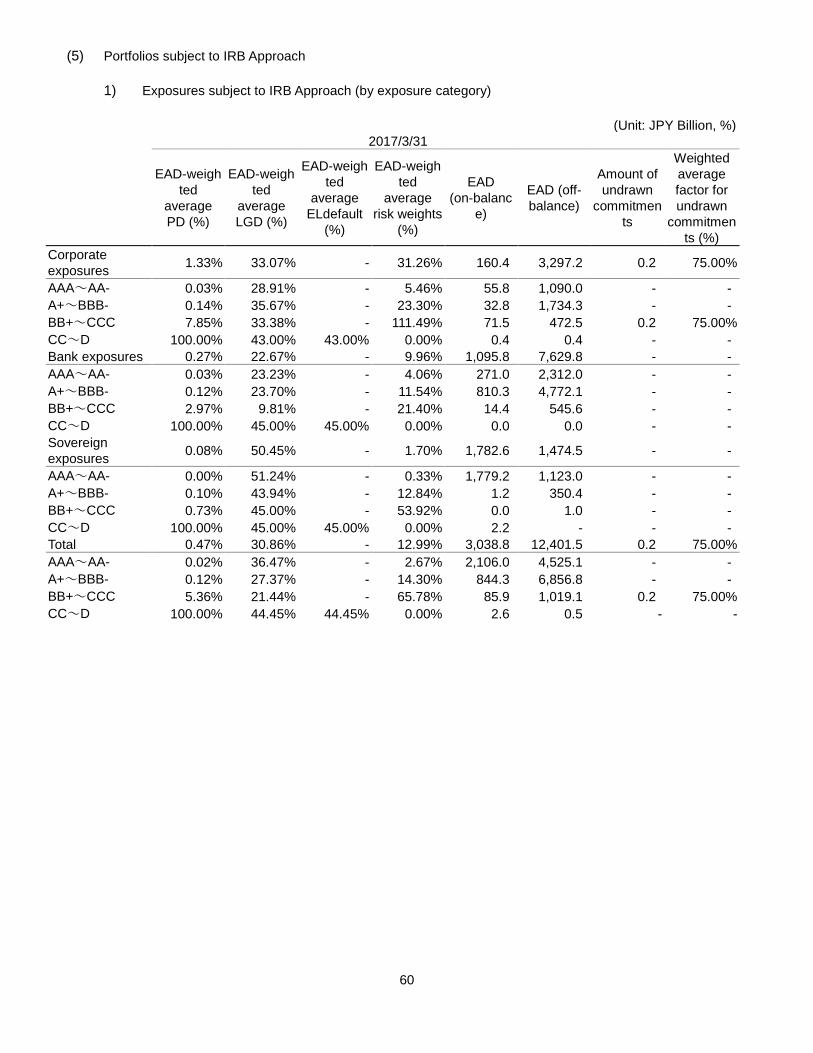
60
(5) Portfolios subject to IRB Approach
1) Exposures subject to IRB Approach (by exposure category)
(Unit: JPY Billion, %)
2017/3/31
EAD-weigh
ted
average
PD (%)
EAD-weigh
ted
average
LGD (%)
EAD-weigh
ted
average
ELdefault
(%)
EAD-weigh
ted
average
risk weights
(%)
EAD
(on-balanc
e)
EAD (off-
balance)
Amount of
undrawn
commitmen
ts
Weighted
average
factor for
undrawn
commitmen
ts (%)
Corporate
exposures 1.33% 33.07% - 31.26% 160.4 3,297.2 0.2 75.00%
AAA~AA- 0.03% 28.91% - 5.46% 55.8 1,090.0 - -
A+~BBB- 0.14% 35.67% - 23.30% 32.8 1,734.3 - -
BB+~CCC 7.85% 33.38% - 111.49% 71.5 472.5 0.2 75.00%
CC~D 100.00% 43.00% 43.00% 0.00% 0.4 0.4 - -
Bank exposures 0.27% 22.67% - 9.96% 1,095.8 7,629.8 - -
AAA~AA- 0.03% 23.23% - 4.06% 271.0 2,312.0 - -
A+~BBB- 0.12% 23.70% - 11.54% 810.3 4,772.1 - -
BB+~CCC 2.97% 9.81% - 21.40% 14.4 545.6 - -
CC~D 100.00% 45.00% 45.00% 0.00% 0.0 0.0 - -
Sovereign
exposures 0.08% 50.45% - 1.70% 1,782.6 1,474.5 - -
AAA~AA- 0.00% 51.24% - 0.33% 1,779.2 1,123.0 - -
A+~BBB- 0.10% 43.94% - 12.84% 1.2 350.4 - -
BB+~CCC 0.73% 45.00% - 53.92% 0.0 1.0 - -
CC~D 100.00% 45.00% 45.00% 0.00% 2.2 - - -
Total 0.47% 30.86% - 12.99% 3,038.8 12,401.5 0.2 75.00%
AAA~AA- 0.02% 36.47% - 2.67% 2,106.0 4,525.1 - -
A+~BBB- 0.12% 27.37% - 14.30% 844.3 6,856.8 - -
BB+~CCC 5.36% 21.44% - 65.78% 85.9 1,019.1 0.2 75.00%
CC~D 100.00% 44.45% 44.45% 0.00% 2.6 0.5 - -
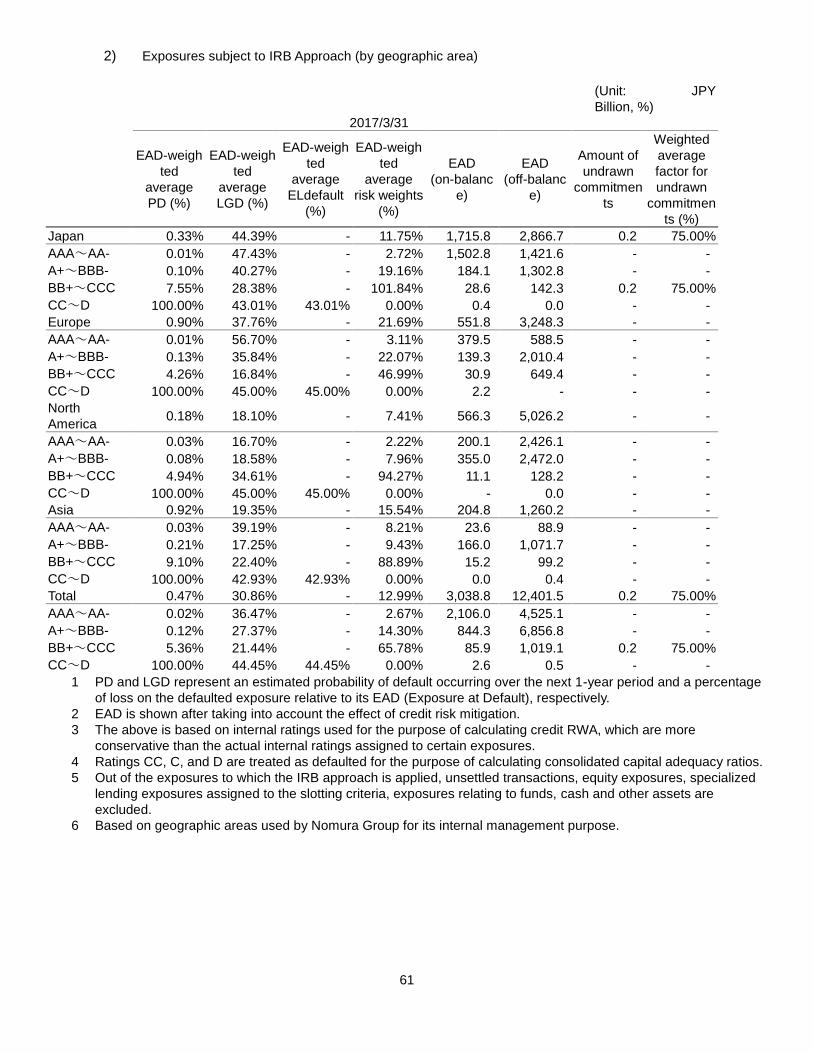
61
2) Exposures subject to IRB Approach (by geographic area)
(Unit: JPY
Billion, %)
2017/3/31
EAD-weigh
ted
average
PD (%)
EAD-weigh
ted
average
LGD (%)
EAD-weigh
ted
average
ELdefault
(%)
EAD-weigh
ted
average
risk weights
(%)
EAD
(on-balanc
e)
EAD
(off-balanc
e)
Amount of
undrawn
commitmen
ts
Weighted
average
factor for
undrawn
commitmen
ts (%)
Japan 0.33% 44.39% - 11.75% 1,715.8 2,866.7 0.2 75.00%
AAA~AA- 0.01% 47.43% - 2.72% 1,502.8 1,421.6 - -
A+~BBB- 0.10% 40.27% - 19.16% 184.1 1,302.8 - -
BB+~CCC 7.55% 28.38% - 101.84% 28.6 142.3 0.2 75.00%
CC~D 100.00% 43.01% 43.01% 0.00% 0.4 0.0 - -
Europe 0.90% 37.76% - 21.69% 551.8 3,248.3 - -
AAA~AA- 0.01% 56.70% - 3.11% 379.5 588.5 - -
A+~BBB- 0.13% 35.84% - 22.07% 139.3 2,010.4 - -
BB+~CCC 4.26% 16.84% - 46.99% 30.9 649.4 - -
CC~D 100.00% 45.00% 45.00% 0.00% 2.2 - - -
North
America 0.18% 18.10% - 7.41% 566.3 5,026.2 - -
AAA~AA- 0.03% 16.70% - 2.22% 200.1 2,426.1 - -
A+~BBB- 0.08% 18.58% - 7.96% 355.0 2,472.0 - -
BB+~CCC 4.94% 34.61% - 94.27% 11.1 128.2 - -
CC~D 100.00% 45.00% 45.00% 0.00% - 0.0 - -
Asia 0.92% 19.35% - 15.54% 204.8 1,260.2 - -
AAA~AA- 0.03% 39.19% - 8.21% 23.6 88.9 - -
A+~BBB- 0.21% 17.25% - 9.43% 166.0 1,071.7 - -
BB+~CCC 9.10% 22.40% - 88.89% 15.2 99.2 - -
CC~D 100.00% 42.93% 42.93% 0.00% 0.0 0.4 - -
Total 0.47% 30.86% - 12.99% 3,038.8 12,401.5 0.2 75.00%
AAA~AA- 0.02% 36.47% - 2.67% 2,106.0 4,525.1 - -
A+~BBB- 0.12% 27.37% - 14.30% 844.3 6,856.8 - -
BB+~CCC 5.36% 21.44% - 65.78% 85.9 1,019.1 0.2 75.00%
CC~D 100.00% 44.45% 44.45% 0.00% 2.6 0.5 - -
1 PD and LGD represent an estimated probability of default occurring over the next 1-year period and a percentage
of loss on the defaulted exposure relative to its EAD (Exposure at Default), respectively.
2 EAD is shown after taking into account the effect of credit risk mitigation.
3 The above is based on internal ratings used for the purpose of calculating credit RWA, which are more
conservative than the actual internal ratings assigned to certain exposures.
4 Ratings CC, C, and D are treated as defaulted for the purpose of calculating consolidated capital adequacy ratios.
5 Out of the exposures to which the IRB approach is applied, unsettled transactions, equity exposures, specialized
lending exposures assigned to the slotting criteria, exposures relating to funds, cash and other assets are
excluded.
6 Based on geographic areas used by Nomura Group for its internal management purpose.
62
3) For equity exposures subject to PD/LGD Approach, estimated PD, a weighted average of risk weights, and
outstanding exposure amount by obligor rating
There are no such exposures.
4) For residential real estate exposures, qualifying revolving retail exposures, and other retail exposures, one
of the following items;
i) Estimated PD, a weighted average of estimated LGD values (including ELdefault of defaulted exposures), a
weighted average of risk weights, estimated EAD of on-balance sheet asset items, estimated EAD of
off-balance sheet asset items, undrawn amounts of commitments and a weighted average of estimated
credit conversion factors applied to those undrawn amounts by pool; or
ii) An analysis of the exposures by pool with an appropriate number of EL (Expected Loss) classes
Credit RWA arising from our retail exposures is immaterial. Therefore we do not develop retail pools but
classify these exposures as either corporate exposures or exempted assets.
(6) Actual losses incurred during the most recent reporting period, a comparison of such actual losses and the
historical actual losses, and an analysis of drivers for the differences, and a comparison of estimated and actual
losses over long periods, to be shown by Corporate Exposures, Sovereign Exposures, Bank Exposures, Equity
Exposures subject to PD/LGD approach, Residential Real Estate Exposures, Qualifying Revolving Exposures
and other Retail Exposures;
It is important for Nomura Group to capture the fair values of financial assets and their price fluctuation risk
as our businesses primarily revolve around market-oriented transactions and related transactions. The
exposures subject to IRB Approach are mostly counterparty credit exposures arising from derivative transactions,
and there are many cases where losses on those counterparty credit exposures are recognized due to
revaluation of fair values (unrealized P&L) and/or as a result of the sale of positions (realized P&L). As those
losses are a mixture of credit risk factors and market risk factors, it is difficult to distinguish one from the other.
Therefore we do not collect the actual loss data attributable to credit risk only.
Our estimated PD on exposures subject to the IRB Approach has been very conservative compared to the
actual historical PD as we have experienced very few defaults over a long period of time.
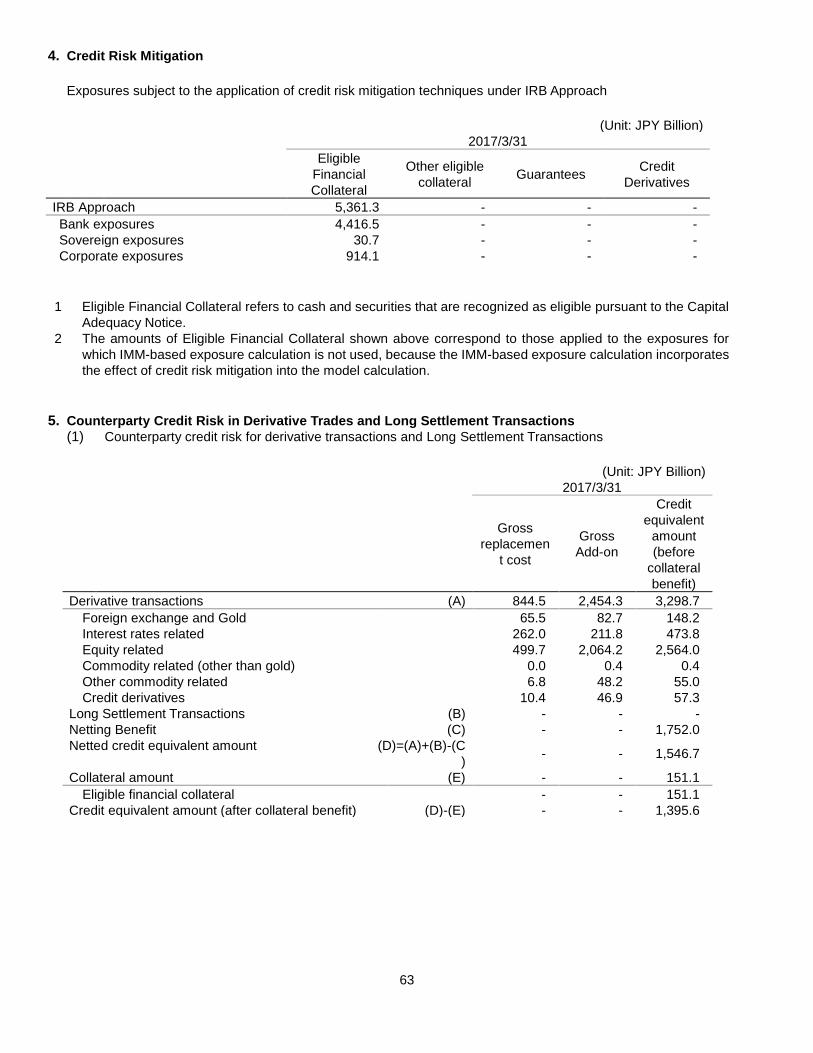
63
4. Credit Risk Mitigation
Exposures subject to the application of credit risk mitigation techniques under IRB Approach
(Unit: JPY Billion)
2017/3/31
Eligible
Financial
Collateral
Other eligible
collateral Guarantees
Credit
Derivatives
IRB Approach 5,361.3 - - -
Bank exposures 4,416.5 - - -
Sovereign exposures 30.7 - - -
Corporate exposures 914.1 - - -
1
Eligible Financial Collateral refers to cash and securities that are recognized as eligible pursuant to the Capital
Adequacy Notice.
2 The amounts of Eligible Financial Collateral shown above correspond to those applied to the exposures for
which IMM-based exposure calculation is not used, because the IMM-based exposure calculation incorporates
the effect of credit risk mitigation into the model calculation.
5. Counterparty Credit Risk in Derivative Trades and Long Settlement Transactions
(1) Counterparty credit risk for derivative transactions and Long Settlement Transactions
(Unit: JPY Billion)
2017/3/31
Gross
replacemen
t cost
Gross
Add-on
Credit
equivalent
amount
(before
collateral
benefit)
Derivative transactions (A) 844.5 2,454.3 3,298.7
Foreign exchange and Gold 65.5 82.7 148.2
Interest rates related 262.0 211.8 473.8
Equity related 499.7 2,064.2 2,564.0
Commodity related (other than gold) 0.0 0.4 0.4
Other commodity related 6.8 48.2 55.0
Credit derivatives 10.4 46.9 57.3
Long Settlement Transactions (B) - - -
Netting Benefit (C) - - 1,752.0
Netted credit equivalent amount (D)=(A)+(B)-(C
) - - 1,546.7
Collateral amount (E) - - 151.1
Eligible financial collateral - - 151.1
Credit equivalent amount (after collateral benefit) (D)-(E) - - 1,395.6
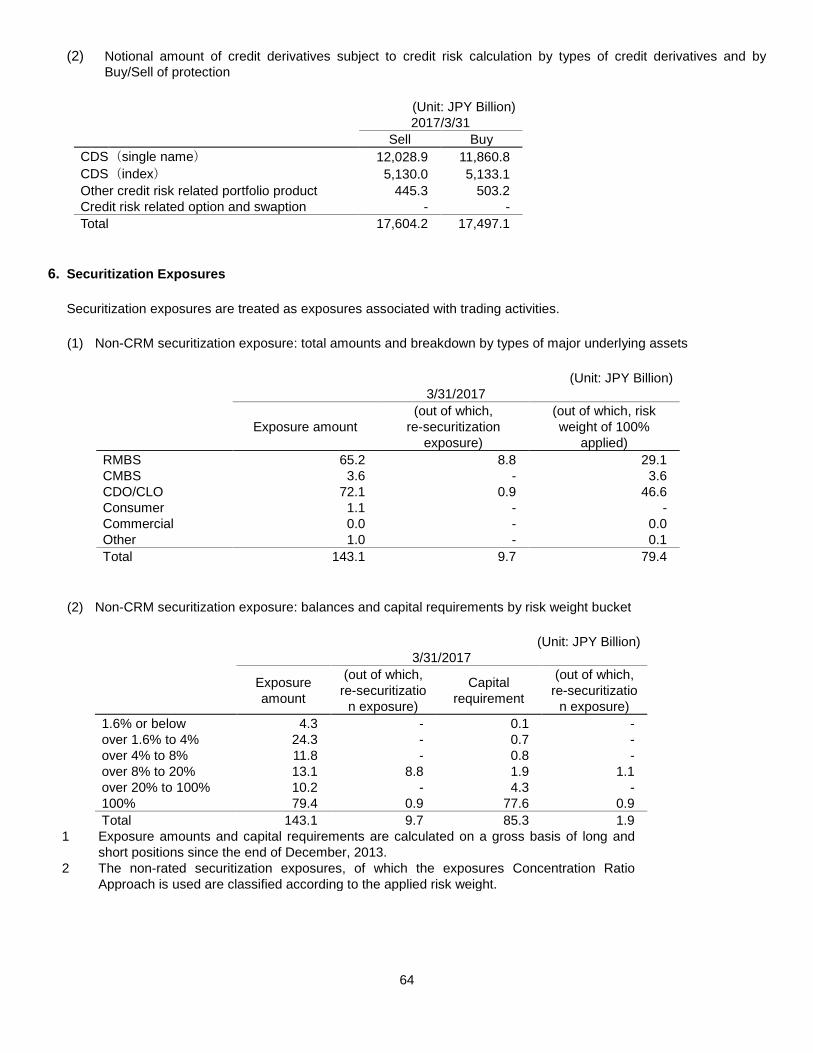
64
(2) Notional amount of credit derivatives subject to credit risk calculation by types of credit derivatives and by
Buy/Sell of protection
(Unit: JPY Billion)
2017/3/31
Sell Buy
CDS (single name) 12,028.9 11,860.8
CDS (index) 5,130.0 5,133.1
Other credit risk related portfolio product 445.3 503.2
Credit risk related option and swaption - -
Total 17,604.2 17,497.1
6. Securitization Exposures
Securitization exposures are treated as exposures associated with trading activities.
(1) Non-CRM securitization exposure: total amounts and breakdown by types of major underlying assets
(Unit: JPY Billion)
3/31/2017
Exposure amount
(out of which,
re-securitization
exposure)
(out of which, risk
weight of 100%
applied)
RMBS 65.2 8.8 29.1
CMBS 3.6 - 3.6
CDO/CLO 72.1 0.9 46.6
Consumer 1.1 - -
Commercial 0.0 - 0.0
Other 1.0 - 0.1
Total 143.1 9.7 79.4
(2) Non-CRM securitization exposure: balances and capital requirements by risk weight bucket
(Unit: JPY Billion)
3/31/2017
Exposure
amount
(out of which,
re-securitizatio
n exposure)
Capital
requirement
(out of which,
re-securitizatio
n exposure)
1.6% or below 4.3 - 0.1 -
over 1.6% to 4% 24.3 - 0.7 -
over 4% to 8% 11.8 - 0.8 -
over 8% to 20% 13.1 8.8 1.9 1.1
over 20% to 100% 10.2 - 4.3 -
100% 79.4 0.9 77.6 0.9
Total 143.1 9.7 85.3 1.9
1 Exposure amounts and capital requirements are calculated on a gross basis of long and
short positions since the end of December, 2013.
2 The non-rated securitization exposures, of which the exposures Concentration Ratio
Approach is used are classified according to the applied risk weight.
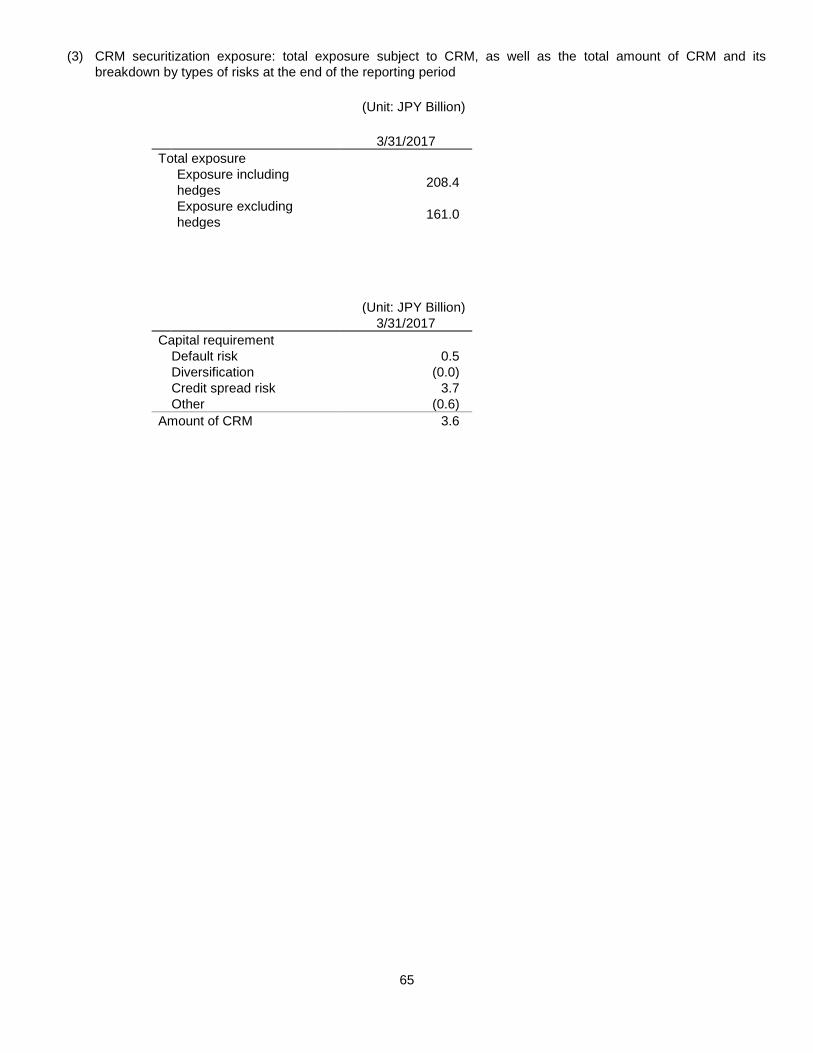
65
(3) CRM securitization exposure: total exposure subject to CRM, as well as the total amount of CRM and its
breakdown by types of risks at the end of the reporting period
1. (Unit: JPY Billion)
3/31/2017
Total exposure
Exposure including
hedges 208.4
Exposure excluding
hedges 161.0
(Unit: JPY Billion)
3/31/2017
Capital requirement
Default risk 0.5
Diversification (0.0)
Credit spread risk 3.7
Other (0.6)
Amount of CRM 3.6
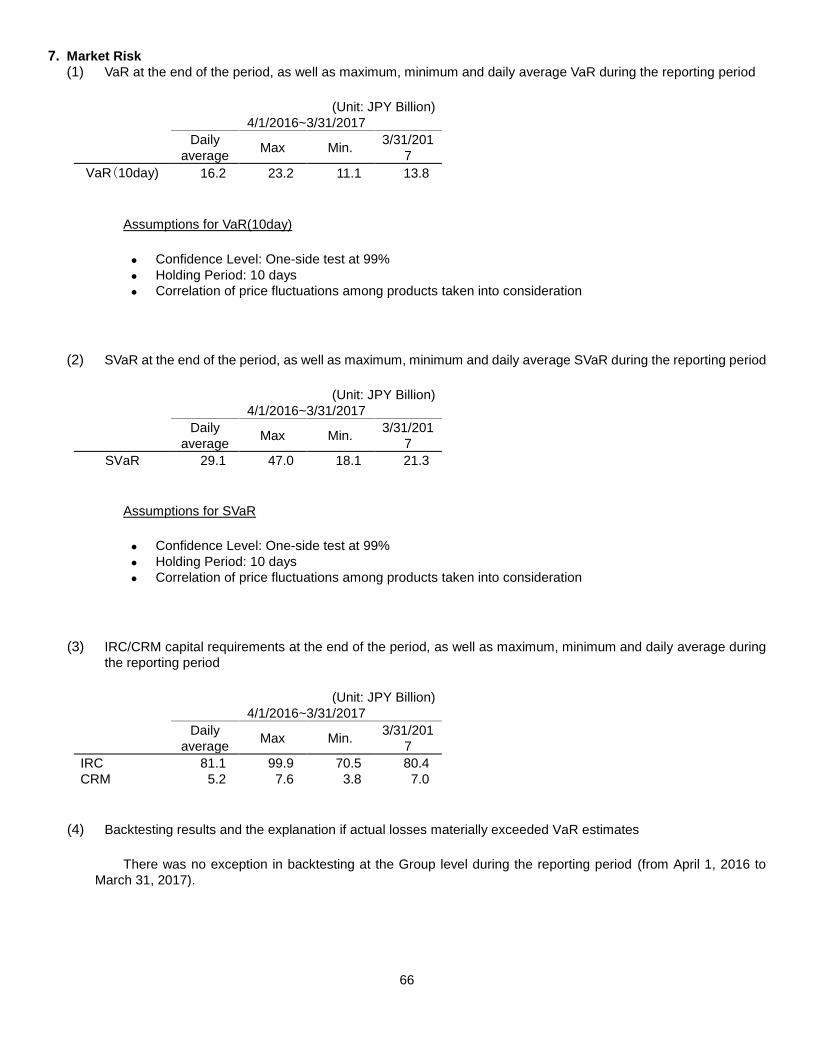
66
7. Market Risk
(1) VaR at the end of the period, as well as maximum, minimum and daily average VaR during the reporting period
(Unit: JPY Billion)
4/1/2016~3/31/2017
Daily
average Max Min.
3/31/201
7
VaR(10day) 16.2 23.2 11.1 13.8
Assumptions for VaR(10day)
Confidence Level: One-side test at 99%
Holding Period: 10 days
Correlation of price fluctuations among products taken into consideration
(2) SVaR at the end of the period, as well as maximum, minimum and daily average SVaR during the reporting period
(Unit: JPY Billion)
4/1/2016~3/31/2017
Daily
average Max Min.
3/31/201
7
SVaR 29.1 47.0 18.1 21.3
Assumptions for SVaR
Confidence Level: One-side test at 99%
Holding Period: 10 days
Correlation of price fluctuations among products taken into consideration
(3) IRC/CRM capital requirements at the end of the period, as well as maximum, minimum and daily average during
the reporting period
(Unit: JPY Billion)
4/1/2016~3/31/2017
Daily
average Max Min.
3/31/201
7
IRC 81.1 99.9 70.5 80.4
CRM 5.2 7.6 3.8 7.0
(4) Backtesting results and the explanation if actual losses materially exceeded VaR estimates
There was no exception in backtesting at the Group level during the reporting period (from April 1, 2016 to
March 31, 2017).
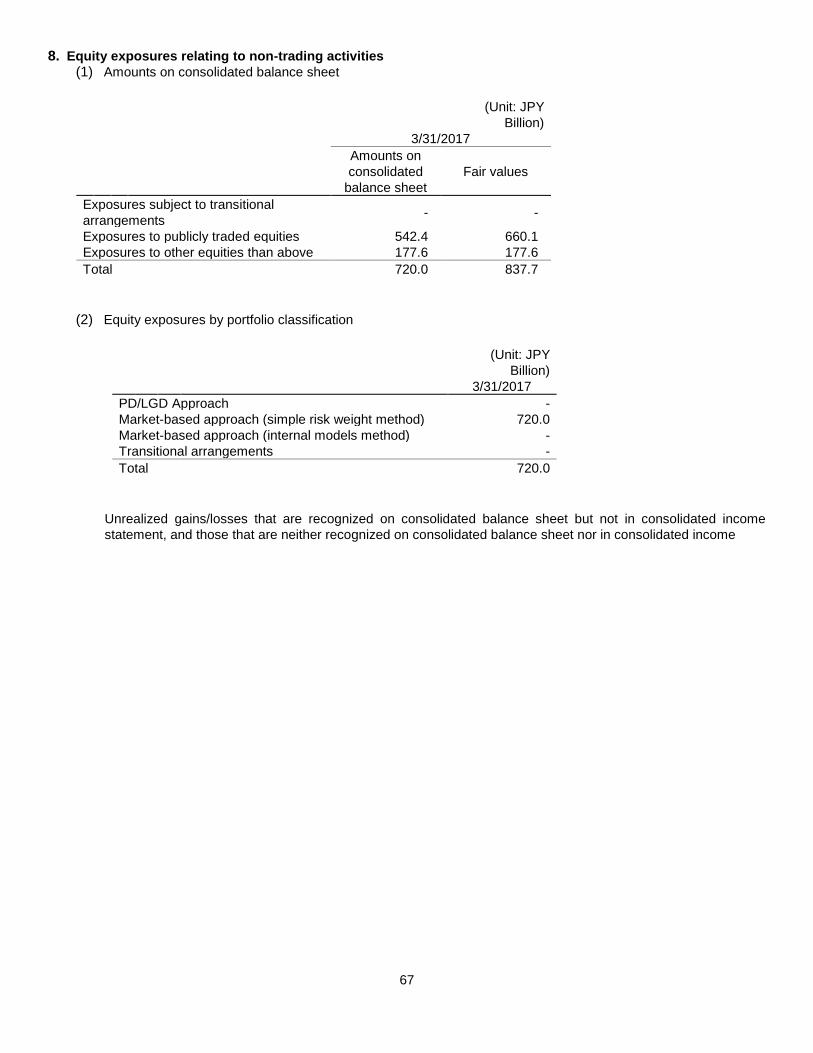
67
8. Equity exposures relating to non-trading activities
(1) Amounts on consolidated balance sheet
(Unit: JPY
Billion)
3/31/2017
Amounts on
consolidated
balance sheet
Fair values
Exposures subject to transitional
arrangements - -
Exposures to publicly traded equities 542.4 660.1
Exposures to other equities than above 177.6 177.6
Total 720.0 837.7
(2) Equity exposures by portfolio classification
(Unit: JPY
Billion)
3/31/2017
PD/LGD Approach -
Market-based approach (simple risk weight method) 720.0
Market-based approach (internal models method) -
Transitional arrangements -
Total 720.0
Unrealized gains/losses that are recognized on consolidated balance sheet but not in consolidated income
statement, and those that are neither recognized on consolidated balance sheet nor in consolidated income
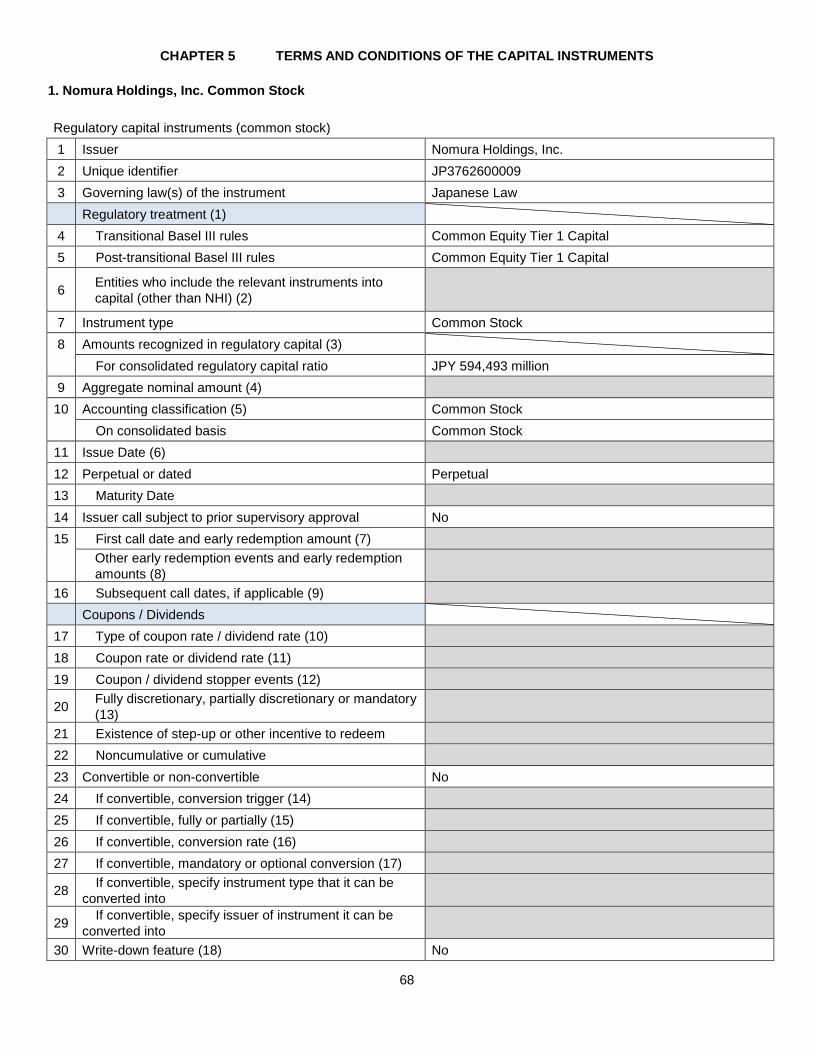
68
CHAPTER 5 TERMS AND CONDITIONS OF THE CAPITAL INSTRUMENTS
1. Nomura Holdings, Inc. Common Stock
Regulatory capital instruments (common stock)
1 Issuer Nomura Holdings, Inc.
2 Unique identifier JP3762600009
3 Governing law(s) of the instrument Japanese Law
Regulatory treatment (1)
4 Transitional Basel III rules Common Equity Tier 1 Capital
5 Post-transitional Basel III rules Common Equity Tier 1 Capital
6 Entities who include the relevant instruments into
capital (other than NHI) (2)
7 Instrument type Common Stock
8 Amounts recognized in regulatory capital (3)
For consolidated regulatory capital ratio JPY 594,493 million
9 Aggregate nominal amount (4)
10 Accounting classification (5) Common Stock
On consolidated basis Common Stock
11 Issue Date (6)
12 Perpetual or dated Perpetual
13 Maturity Date
14 Issuer call subject to prior supervisory approval No
15 First call date and early redemption amount (7)
Other early redemption events and early redemption
amounts (8)
16 Subsequent call dates, if applicable (9)
Coupons / Dividends
17 Type of coupon rate / dividend rate (10)
18 Coupon rate or dividend rate (11)
19 Coupon / dividend stopper events (12)
20 Fully discretionary, partially discretionary or mandatory
(13)
21 Existence of step-up or other incentive to redeem
22 Noncumulative or cumulative
23 Convertible or non-convertible No
24 If convertible, conversion trigger (14)
25 If convertible, fully or partially (15)
26 If convertible, conversion rate (16)
27 If convertible, mandatory or optional conversion (17)
28 If convertible, specify instrument type that it can be
converted into
29 If convertible, specify issuer of instrument it can be
converted into
30 Write-down feature (18) No
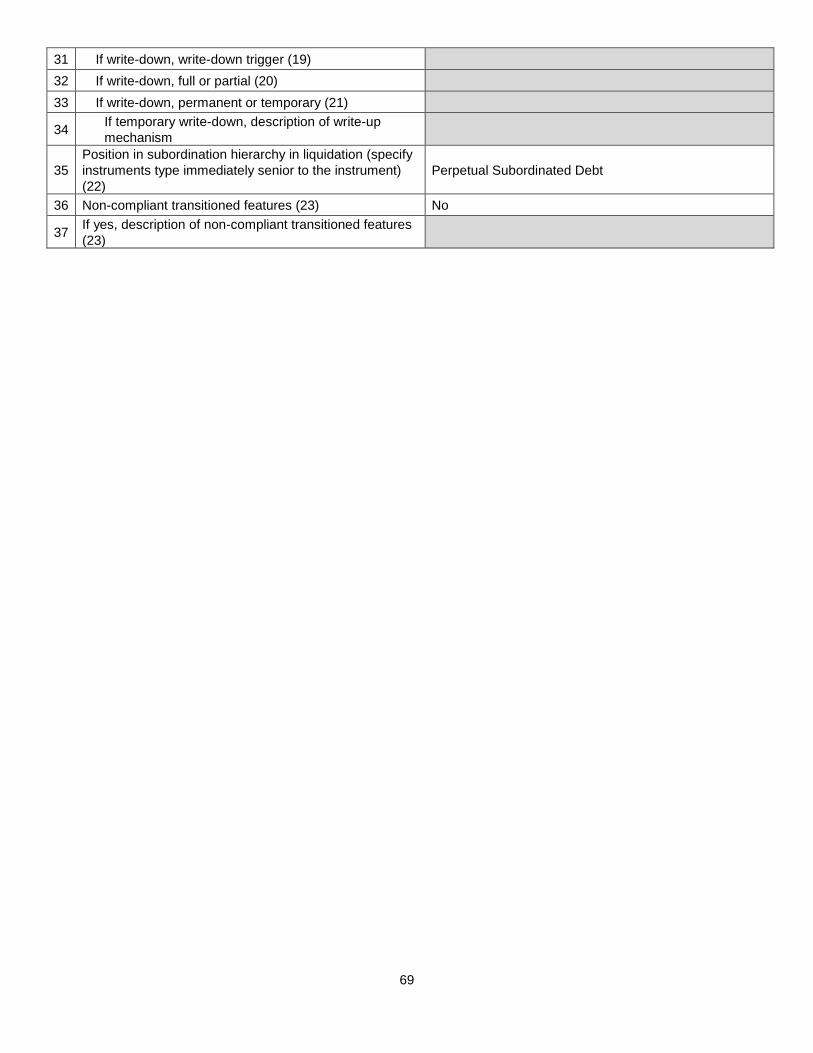
69
31 If write-down, write-down trigger (19)
32 If write-down, full or partial (20)
33 If write-down, permanent or temporary (21)
34 If temporary write-down, description of write-up
mechanism
35
Position in subordination hierarchy in liquidation (specify
instruments type immediately senior to the instrument)
(22)
Perpetual Subordinated Debt
36 Non-compliant transitioned features (23) No
37 If yes, description of non-compliant transitioned features
(23)
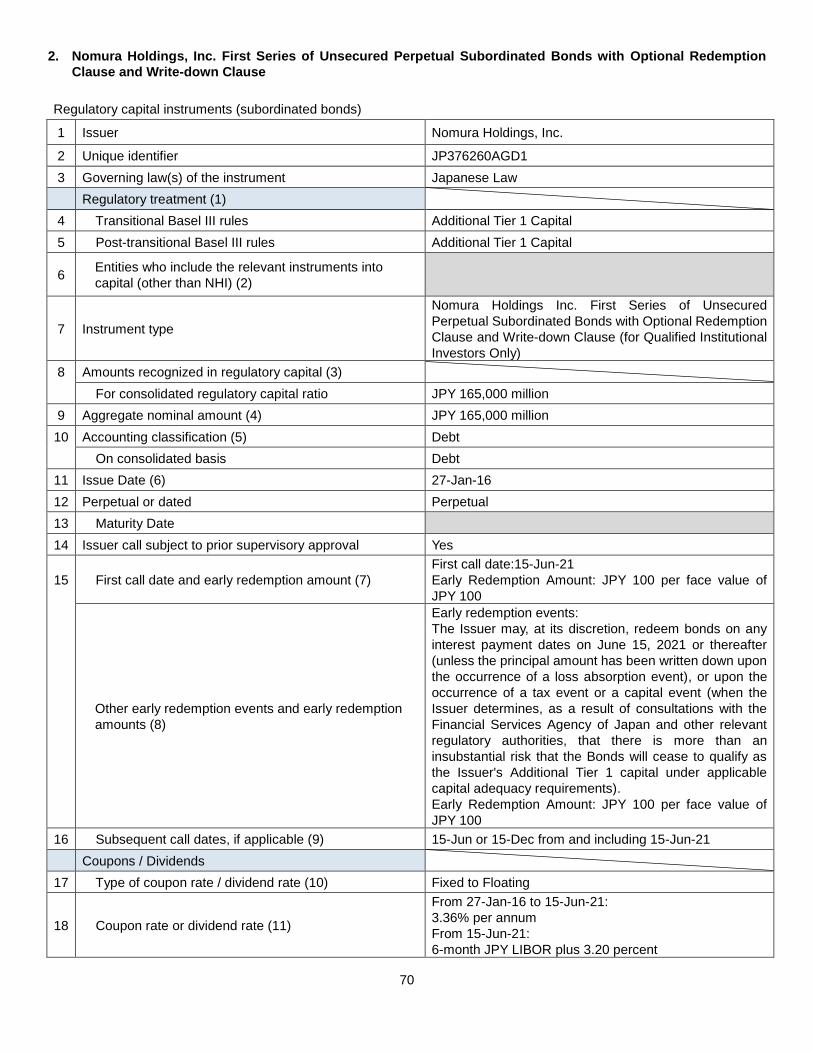
70
2. Nomura Holdings, Inc. First Series of Unsecured Perpetual Subordinated Bonds with Optional Redemption
Clause and Write-down Clause
Regulatory capital instruments (subordinated bonds)
1 Issuer Nomura Holdings, Inc.
2 Unique identifier JP376260AGD1
3 Governing law(s) of the instrument Japanese Law
Regulatory treatment (1)
4 Transitional Basel III rules Additional Tier 1 Capital
5 Post-transitional Basel III rules Additional Tier 1 Capital
6 Entities who include the relevant instruments into
capital (other than NHI) (2)
7 Instrument type
Nomura Holdings Inc. First Series of Unsecured
Perpetual Subordinated Bonds with Optional Redemption
Clause and Write-down Clause (for Qualified Institutional
Investors Only)
8 Amounts recognized in regulatory capital (3)
For consolidated regulatory capital ratio JPY 165,000 million
9 Aggregate nominal amount (4) JPY 165,000 million
10 Accounting classification (5) Debt
On consolidated basis Debt
11 Issue Date (6) 27-Jan-16
12 Perpetual or dated Perpetual
13 Maturity Date
14 Issuer call subject to prior supervisory approval Yes
15 First call date and early redemption amount (7)
First call date:15-Jun-21
Early Redemption Amount: JPY 100 per face value of
JPY 100
Other early redemption events and early redemption
amounts (8)
Early redemption events:
The Issuer may, at its discretion, redeem bonds on any
interest payment dates on June 15, 2021 or thereafter
(unless the principal amount has been written down upon
the occurrence of a loss absorption event), or upon the
occurrence of a tax event or a capital event (when the
Issuer determines, as a result of consultations with the
Financial Services Agency of Japan and other relevant
regulatory authorities, that there is more than an
insubstantial risk that the Bonds will cease to qualify as
the Issuer's Additional Tier 1 capital under applicable
capital adequacy requirements).
Early Redemption Amount: JPY 100 per face value of
JPY 100
16 Subsequent call dates, if applicable (9) 15-Jun or 15-Dec from and including 15-Jun-21
Coupons / Dividends
17 Type of coupon rate / dividend rate (10) Fixed to Floating
18 Coupon rate or dividend rate (11)
From 27-Jan-16 to 15-Jun-21:
3.36% per annum
From 15-Jun-21:
6-month JPY LIBOR plus 3.20 percent
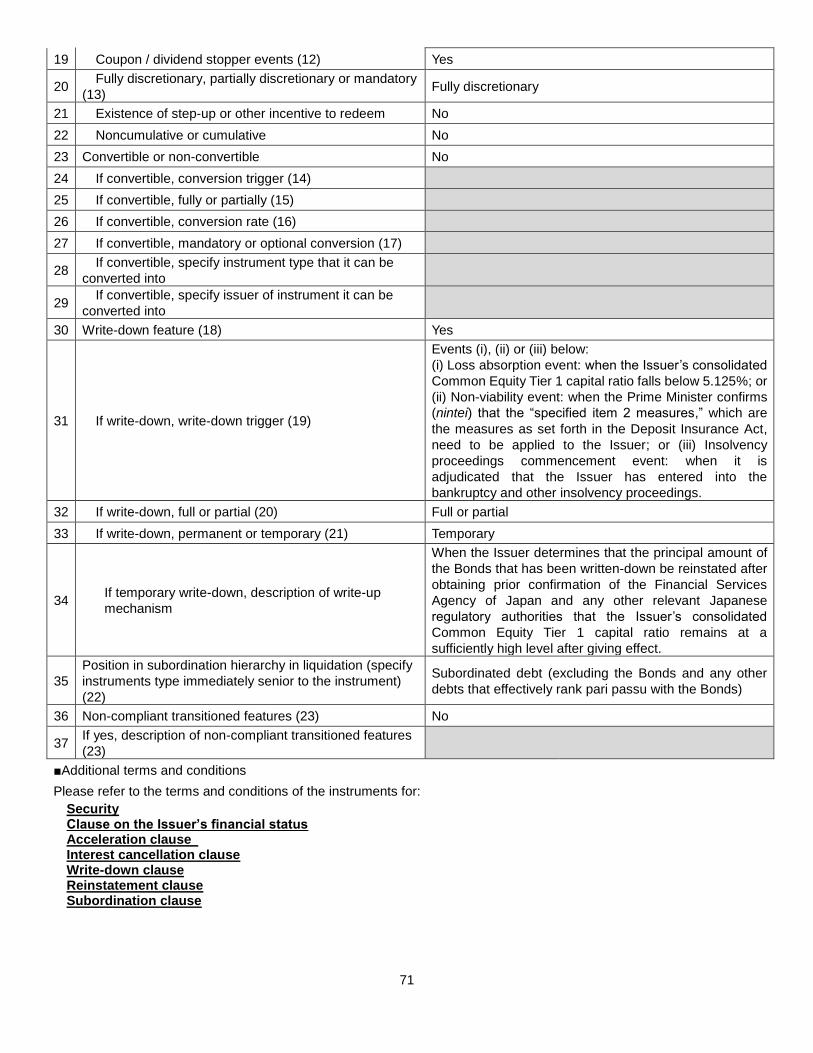
71
19 Coupon / dividend stopper events (12) Yes
20 Fully discretionary, partially discretionary or mandatory
(13) Fully discretionary
21 Existence of step-up or other incentive to redeem No
22 Noncumulative or cumulative No
23 Convertible or non-convertible No
24 If convertible, conversion trigger (14)
25 If convertible, fully or partially (15)
26 If convertible, conversion rate (16)
27 If convertible, mandatory or optional conversion (17)
28 If convertible, specify instrument type that it can be
converted into
29 If convertible, specify issuer of instrument it can be
converted into
30 Write-down feature (18) Yes
31 If write-down, write-down trigger (19)
Events (i), (ii) or (iii) below:
(i) Loss absorption event: when the Issuer’s consolidated
Common Equity Tier 1 capital ratio falls below 5.125%; or
(ii) Non-viability event: when the Prime Minister confirms
(nintei) that the “specified item 2 measures,” which are
the measures as set forth in the Deposit Insurance Act,
need to be applied to the Issuer; or (iii) Insolvency
proceedings commencement event: when it is
adjudicated that the Issuer has entered into the
bankruptcy and other insolvency proceedings.
32 If write-down, full or partial (20) Full or partial
33 If write-down, permanent or temporary (21) Temporary
34 If temporary write-down, description of write-up
mechanism
When the Issuer determines that the principal amount of
the Bonds that has been written-down be reinstated after
obtaining prior confirmation of the Financial Services
Agency of Japan and any other relevant Japanese
regulatory authorities that the Issuer’s consolidated
Common Equity Tier 1 capital ratio remains at a
sufficiently high level after giving effect.
35
Position in subordination hierarchy in liquidation (specify
instruments type immediately senior to the instrument)
(22)
Subordinated debt (excluding the Bonds and any other
debts that effectively rank pari passu with the Bonds)
36 Non-compliant transitioned features (23) No
37 If yes, description of non-compliant transitioned features
(23)
■Additional terms and conditions
Please refer to the terms and conditions of the instruments for:
Security Clause on the Issuer’s financial status Acceleration clause Interest cancellation clause Write-down clause Reinstatement clause Subordination clause
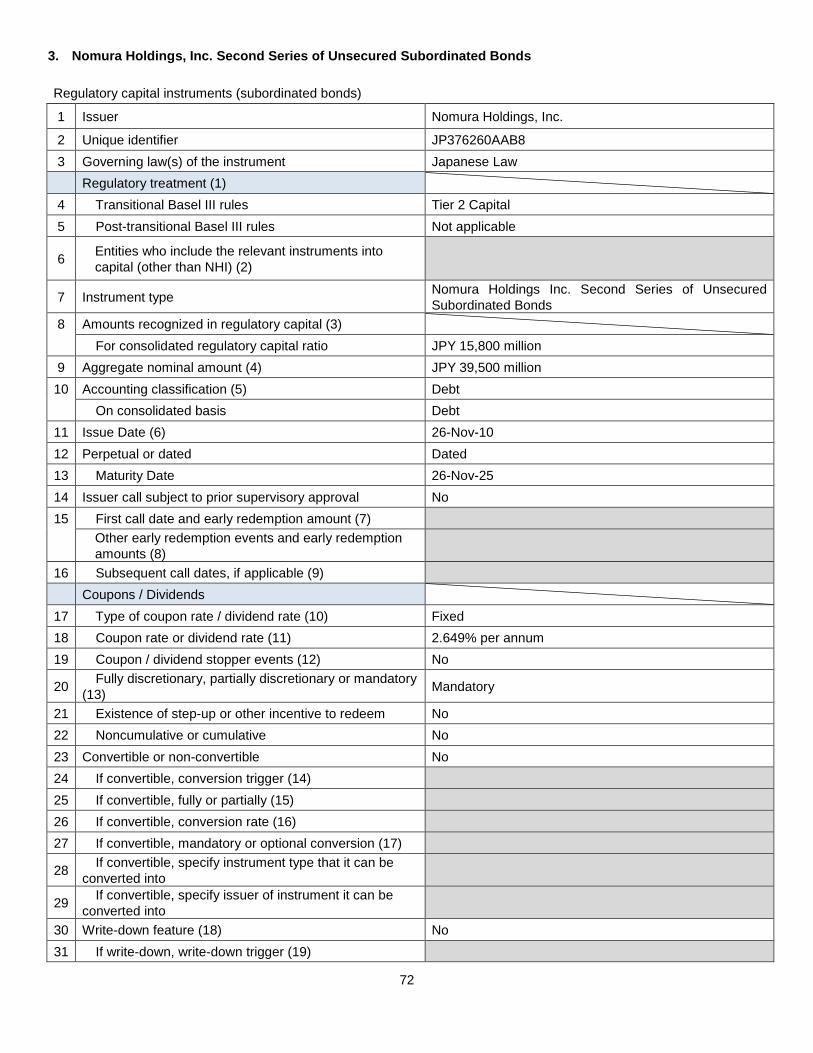
72
3. Nomura Holdings, Inc. Second Series of Unsecured Subordinated Bonds
Regulatory capital instruments (subordinated bonds)
1 Issuer Nomura Holdings, Inc.
2 Unique identifier JP376260AAB8
3 Governing law(s) of the instrument Japanese Law
Regulatory treatment (1)
4 Transitional Basel III rules Tier 2 Capital
5 Post-transitional Basel III rules Not applicable
6 Entities who include the relevant instruments into
capital (other than NHI) (2)
7 Instrument type Nomura Holdings Inc. Second Series of Unsecured
Subordinated Bonds
8 Amounts recognized in regulatory capital (3)
For consolidated regulatory capital ratio JPY 15,800 million
9 Aggregate nominal amount (4) JPY 39,500 million
10 Accounting classification (5) Debt
On consolidated basis Debt
11 Issue Date (6) 26-Nov-10
12 Perpetual or dated Dated
13 Maturity Date 26-Nov-25
14 Issuer call subject to prior supervisory approval No
15 First call date and early redemption amount (7)
Other early redemption events and early redemption
amounts (8)
16 Subsequent call dates, if applicable (9)
Coupons / Dividends
17 Type of coupon rate / dividend rate (10) Fixed
18 Coupon rate or dividend rate (11) 2.649% per annum
19 Coupon / dividend stopper events (12) No
20 Fully discretionary, partially discretionary or mandatory
(13) Mandatory
21 Existence of step-up or other incentive to redeem No
22 Noncumulative or cumulative No
23 Convertible or non-convertible No
24 If convertible, conversion trigger (14)
25 If convertible, fully or partially (15)
26 If convertible, conversion rate (16)
27 If convertible, mandatory or optional conversion (17)
28 If convertible, specify instrument type that it can be
converted into
29 If convertible, specify issuer of instrument it can be
converted into
30 Write-down feature (18) No
31 If write-down, write-down trigger (19)
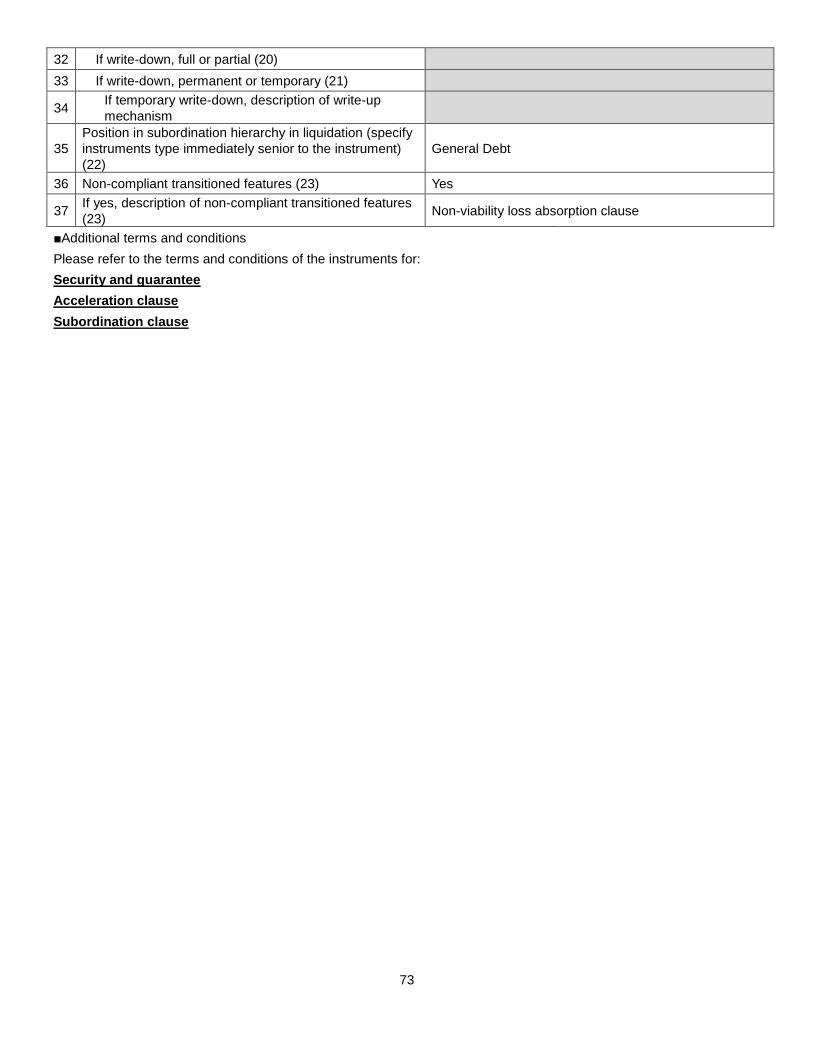
73
32 If write-down, full or partial (20)
33 If write-down, permanent or temporary (21)
34 If temporary write-down, description of write-up
mechanism
35
Position in subordination hierarchy in liquidation (specify
instruments type immediately senior to the instrument)
(22)
General Debt
36 Non-compliant transitioned features (23) Yes
37 If yes, description of non-compliant transitioned features
(23) Non-viability loss absorption clause
■Additional terms and conditions
Please refer to the terms and conditions of the instruments for:
Security and guarantee
Acceleration clause
Subordination clause
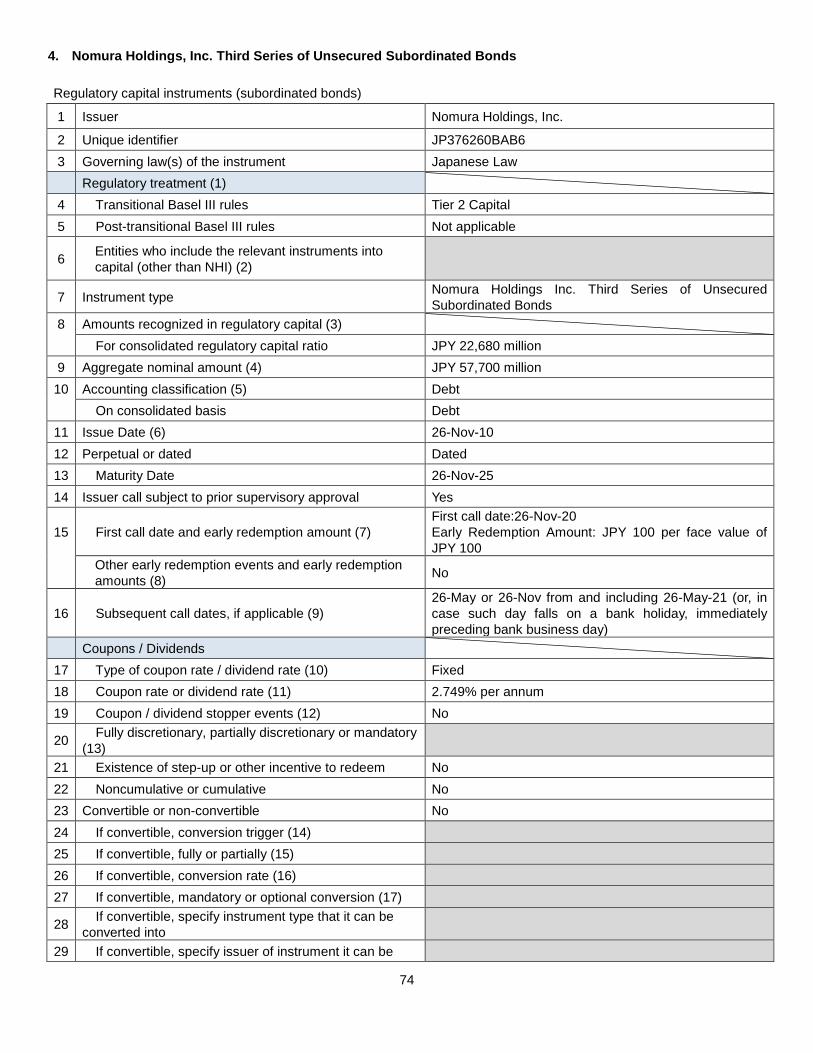
74
4. Nomura Holdings, Inc. Third Series of Unsecured Subordinated Bonds
Regulatory capital instruments (subordinated bonds)
1 Issuer Nomura Holdings, Inc.
2 Unique identifier JP376260BAB6
3 Governing law(s) of the instrument Japanese Law
Regulatory treatment (1)
4 Transitional Basel III rules Tier 2 Capital
5 Post-transitional Basel III rules Not applicable
6 Entities who include the relevant instruments into
capital (other than NHI) (2)
7 Instrument type Nomura Holdings Inc. Third Series of Unsecured
Subordinated Bonds
8 Amounts recognized in regulatory capital (3)
For consolidated regulatory capital ratio JPY 22,680 million
9 Aggregate nominal amount (4) JPY 57,700 million
10 Accounting classification (5) Debt
On consolidated basis Debt
11 Issue Date (6) 26-Nov-10
12 Perpetual or dated Dated
13 Maturity Date 26-Nov-25
14 Issuer call subject to prior supervisory approval Yes
15 First call date and early redemption amount (7)
First call date:26-Nov-20
Early Redemption Amount: JPY 100 per face value of
JPY 100
Other early redemption events and early redemption
amounts (8) No
16 Subsequent call dates, if applicable (9)
26-May or 26-Nov from and including 26-May-21 (or, in
case such day falls on a bank holiday, immediately
preceding bank business day)
Coupons / Dividends
17 Type of coupon rate / dividend rate (10) Fixed
18 Coupon rate or dividend rate (11) 2.749% per annum
19 Coupon / dividend stopper events (12) No
20 Fully discretionary, partially discretionary or mandatory
(13)
21 Existence of step-up or other incentive to redeem No
22 Noncumulative or cumulative No
23 Convertible or non-convertible No
24 If convertible, conversion trigger (14)
25 If convertible, fully or partially (15)
26 If convertible, conversion rate (16)
27 If convertible, mandatory or optional conversion (17)
28 If convertible, specify instrument type that it can be
converted into
29 If convertible, specify issuer of instrument it can be

75
converted into
30 Write-down feature (18) No
31 If write-down, write-down trigger (19)
32 If write-down, full or partial (20)
33 If write-down, permanent or temporary (21)
34 If temporary write-down, description of write-up
mechanism
35
Position in subordination hierarchy in liquidation (specify
instruments type immediately senior to the instrument)
(22)
General Debt
36 Non-compliant transitioned features (23) Yes
37 If yes, description of non-compliant transitioned features
(23) Non-viability loss absorption clause
■Additional terms and conditions
Please refer to the terms and conditions of the instruments for:
Security and guarantee
Acceleration clause
Subordination clause
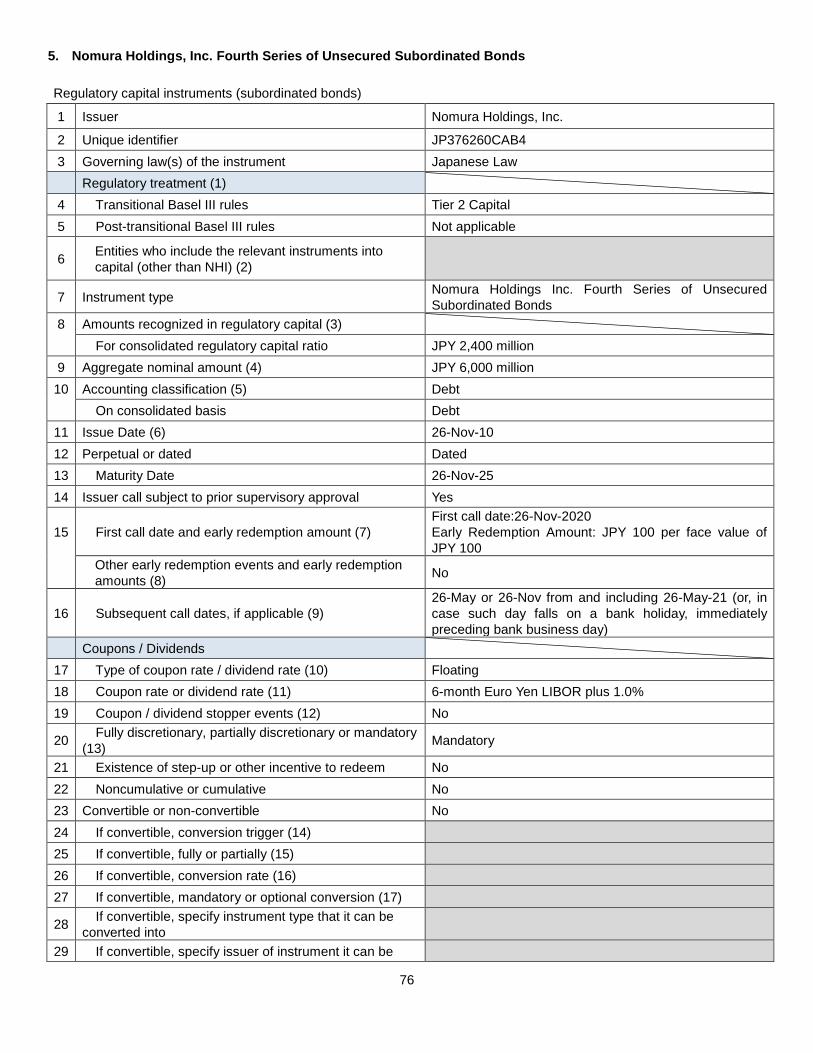
76
5. Nomura Holdings, Inc. Fourth Series of Unsecured Subordinated Bonds
Regulatory capital instruments (subordinated bonds)
1 Issuer Nomura Holdings, Inc.
2 Unique identifier JP376260CAB4
3 Governing law(s) of the instrument Japanese Law
Regulatory treatment (1)
4 Transitional Basel III rules Tier 2 Capital
5 Post-transitional Basel III rules Not applicable
6 Entities who include the relevant instruments into
capital (other than NHI) (2)
7 Instrument type Nomura Holdings Inc. Fourth Series of Unsecured
Subordinated Bonds
8 Amounts recognized in regulatory capital (3)
For consolidated regulatory capital ratio JPY 2,400 million
9 Aggregate nominal amount (4) JPY 6,000 million
10 Accounting classification (5) Debt
On consolidated basis Debt
11 Issue Date (6) 26-Nov-10
12 Perpetual or dated Dated
13 Maturity Date 26-Nov-25
14 Issuer call subject to prior supervisory approval Yes
15 First call date and early redemption amount (7)
First call date:26-Nov-2020
Early Redemption Amount: JPY 100 per face value of
JPY 100
Other early redemption events and early redemption
amounts (8) No
16 Subsequent call dates, if applicable (9)
26-May or 26-Nov from and including 26-May-21 (or, in
case such day falls on a bank holiday, immediately
preceding bank business day)
Coupons / Dividends
17 Type of coupon rate / dividend rate (10) Floating
18 Coupon rate or dividend rate (11) 6-month Euro Yen LIBOR plus 1.0%
19 Coupon / dividend stopper events (12) No
20 Fully discretionary, partially discretionary or mandatory
(13) Mandatory
21 Existence of step-up or other incentive to redeem No
22 Noncumulative or cumulative No
23 Convertible or non-convertible No
24 If convertible, conversion trigger (14)
25 If convertible, fully or partially (15)
26 If convertible, conversion rate (16)
27 If convertible, mandatory or optional conversion (17)
28 If convertible, specify instrument type that it can be
converted into
29 If convertible, specify issuer of instrument it can be
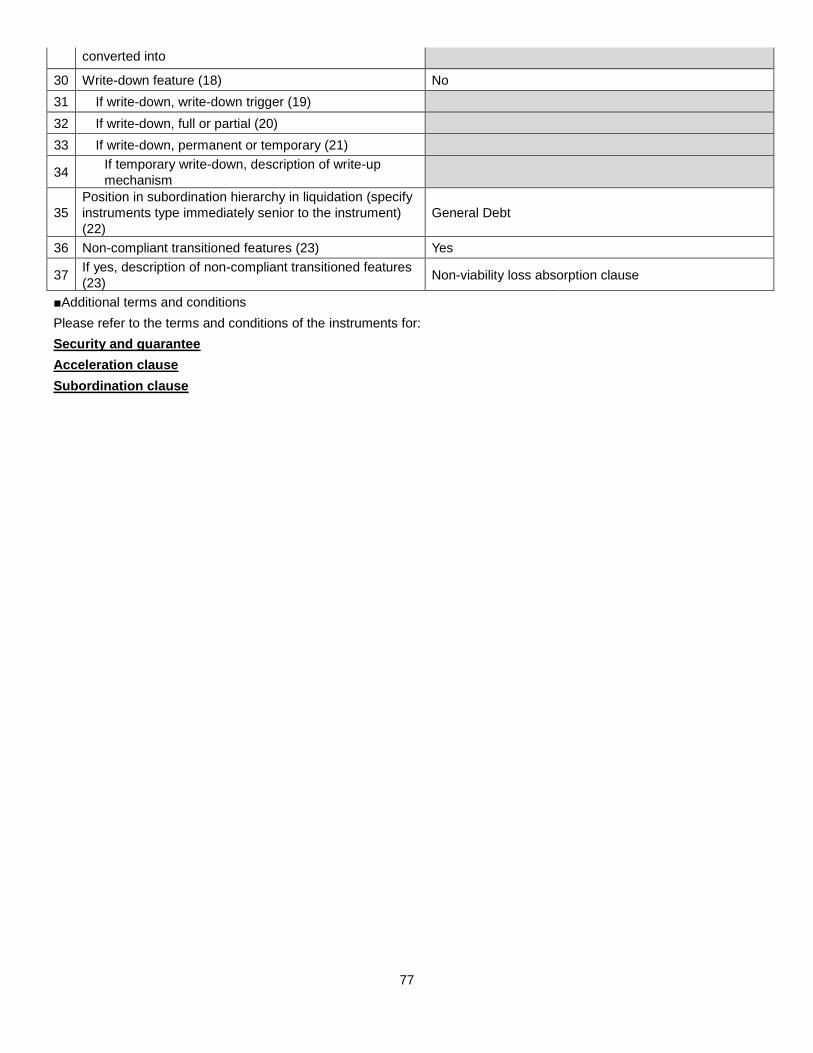
77
converted into
30 Write-down feature (18) No
31 If write-down, write-down trigger (19)
32 If write-down, full or partial (20)
33 If write-down, permanent or temporary (21)
34 If temporary write-down, description of write-up
mechanism
35
Position in subordination hierarchy in liquidation (specify
instruments type immediately senior to the instrument)
(22)
General Debt
36 Non-compliant transitioned features (23) Yes
37 If yes, description of non-compliant transitioned features
(23) Non-viability loss absorption clause
■Additional terms and conditions
Please refer to the terms and conditions of the instruments for:
Security and guarantee
Acceleration clause
Subordination clause
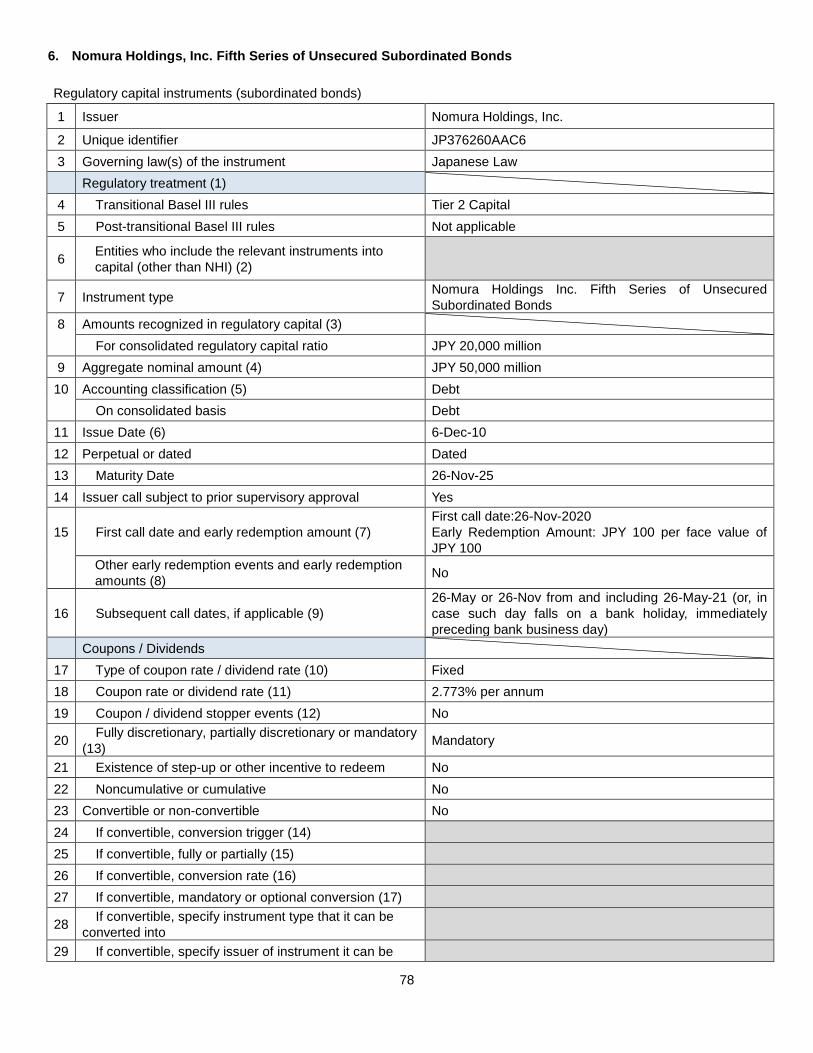
78
6. Nomura Holdings, Inc. Fifth Series of Unsecured Subordinated Bonds
Regulatory capital instruments (subordinated bonds)
1 Issuer Nomura Holdings, Inc.
2 Unique identifier JP376260AAC6
3 Governing law(s) of the instrument Japanese Law
Regulatory treatment (1)
4 Transitional Basel III rules Tier 2 Capital
5 Post-transitional Basel III rules Not applicable
6 Entities who include the relevant instruments into
capital (other than NHI) (2)
7 Instrument type Nomura Holdings Inc. Fifth Series of Unsecured
Subordinated Bonds
8 Amounts recognized in regulatory capital (3)
For consolidated regulatory capital ratio JPY 20,000 million
9 Aggregate nominal amount (4) JPY 50,000 million
10 Accounting classification (5) Debt
On consolidated basis Debt
11 Issue Date (6) 6-Dec-10
12 Perpetual or dated Dated
13 Maturity Date 26-Nov-25
14 Issuer call subject to prior supervisory approval Yes
15 First call date and early redemption amount (7)
First call date:26-Nov-2020
Early Redemption Amount: JPY 100 per face value of
JPY 100
Other early redemption events and early redemption
amounts (8) No
16 Subsequent call dates, if applicable (9)
26-May or 26-Nov from and including 26-May-21 (or, in
case such day falls on a bank holiday, immediately
preceding bank business day)
Coupons / Dividends
17 Type of coupon rate / dividend rate (10) Fixed
18 Coupon rate or dividend rate (11) 2.773% per annum
19 Coupon / dividend stopper events (12) No
20 Fully discretionary, partially discretionary or mandatory
(13) Mandatory
21 Existence of step-up or other incentive to redeem No
22 Noncumulative or cumulative No
23 Convertible or non-convertible No
24 If convertible, conversion trigger (14)
25 If convertible, fully or partially (15)
26 If convertible, conversion rate (16)
27 If convertible, mandatory or optional conversion (17)
28 If convertible, specify instrument type that it can be
converted into
29 If convertible, specify issuer of instrument it can be

79
converted into
30 Write-down feature (18) No
31 If write-down, write-down trigger (19)
32 If write-down, full or partial (20)
33 If write-down, permanent or temporary (21)
34 If temporary write-down, description of write-up
mechanism
35
Position in subordination hierarchy in liquidation (specify
instruments type immediately senior to the instrument)
(22)
General Debt
36 Non-compliant transitioned features (23) Yes
37 If yes, description of non-compliant transitioned features
(23) Non-viability loss absorption clause
■Additional terms and conditions
Please refer to the terms and conditions of the instruments for:
Security and guarantee
Acceleration clause
Subordination clause
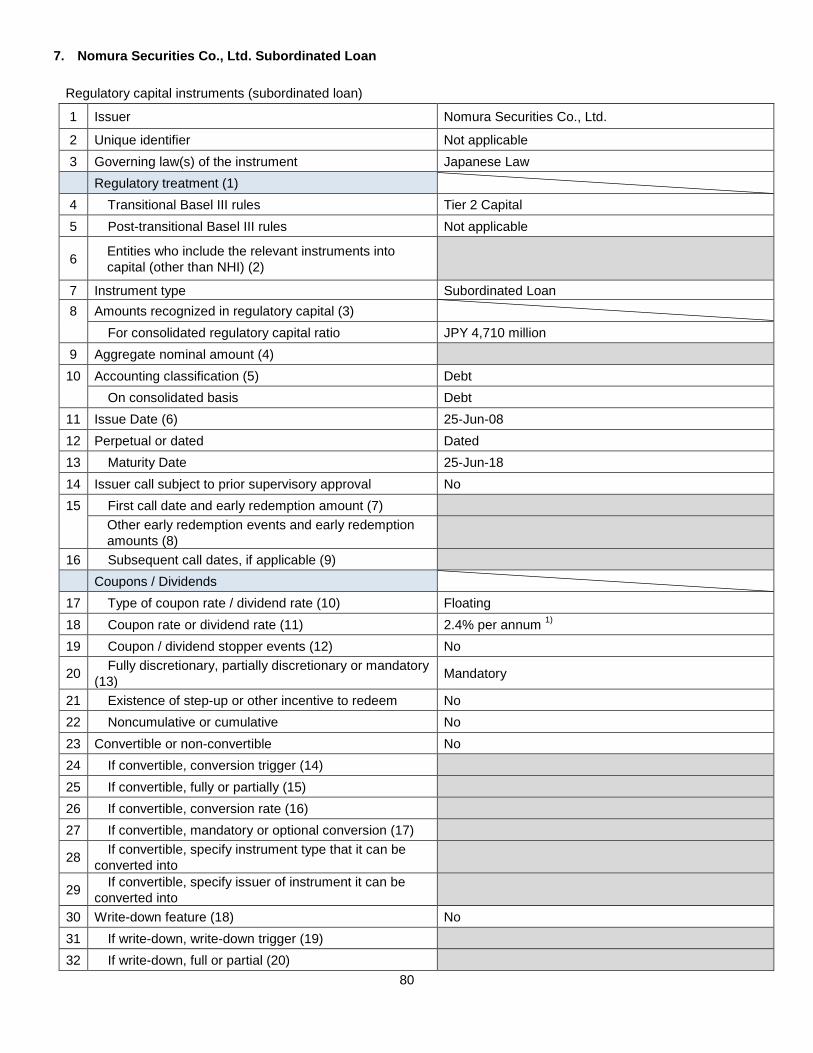
80
7. Nomura Securities Co., Ltd. Subordinated Loan
Regulatory capital instruments (subordinated loan)
1 Issuer Nomura Securities Co., Ltd.
2 Unique identifier Not applicable
3 Governing law(s) of the instrument Japanese Law
Regulatory treatment (1)
4 Transitional Basel III rules Tier 2 Capital
5 Post-transitional Basel III rules Not applicable
6 Entities who include the relevant instruments into
capital (other than NHI) (2)
7 Instrument type Subordinated Loan
8 Amounts recognized in regulatory capital (3)
For consolidated regulatory capital ratio JPY 4,710 million
9 Aggregate nominal amount (4)
10 Accounting classification (5) Debt
On consolidated basis Debt
11 Issue Date (6) 25-Jun-08
12 Perpetual or dated Dated
13 Maturity Date 25-Jun-18
14 Issuer call subject to prior supervisory approval No
15 First call date and early redemption amount (7)
Other early redemption events and early redemption
amounts (8)
16 Subsequent call dates, if applicable (9)
Coupons / Dividends
17 Type of coupon rate / dividend rate (10) Floating
18 Coupon rate or dividend rate (11) 2.4% per annum 1)
19 Coupon / dividend stopper events (12) No
20 Fully discretionary, partially discretionary or mandatory
(13) Mandatory
21 Existence of step-up or other incentive to redeem No
22 Noncumulative or cumulative No
23 Convertible or non-convertible No
24 If convertible, conversion trigger (14)
25 If convertible, fully or partially (15)
26 If convertible, conversion rate (16)
27 If convertible, mandatory or optional conversion (17)
28 If convertible, specify instrument type that it can be
converted into
29 If convertible, specify issuer of instrument it can be
converted into
30 Write-down feature (18) No
31 If write-down, write-down trigger (19)
32 If write-down, full or partial (20)
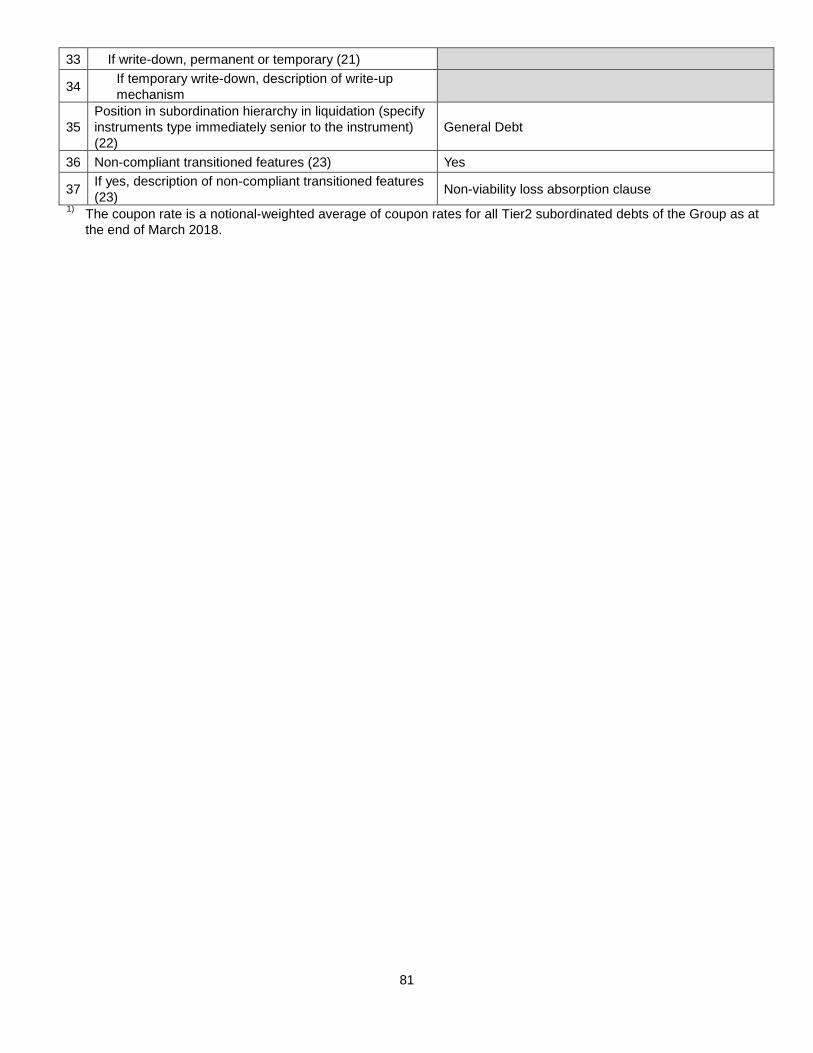
81
33 If write-down, permanent or temporary (21)
34 If temporary write-down, description of write-up
mechanism
35
Position in subordination hierarchy in liquidation (specify
instruments type immediately senior to the instrument)
(22)
General Debt
36 Non-compliant transitioned features (23) Yes
37 If yes, description of non-compliant transitioned features
(23) Non-viability loss absorption clause
1) The coupon rate is a notional-weighted average of coupon rates for all Tier2 subordinated debts of the Group as at
the end of March 2018.

82
8. Nomura Securities Co., Ltd. Subordinated Loan
Regulatory capital instruments (subordinated loan)
1 Issuer Nomura Securities Co., Ltd.
2 Unique identifier Not applicable
3 Governing law(s) of the instrument Japanese Law
Regulatory treatment (1)
4 Transitional Basel III rules Tier 2 Capital
5 Post-transitional Basel III rules Not applicable
6 Entities who include the relevant instruments into
capital (other than NHI) (2)
7 Instrument type Subordinated Loan
8 Amounts recognized in regulatory capital (3)
For consolidated regulatory capital ratio JPY 493million
9 Aggregate nominal amount (4)
10 Accounting classification (5) Debt
On consolidated basis Debt
11 Issue Date (6) 30-Jun-08
12 Perpetual or dated Dated
13 Maturity Date 29-Jun-18
14 Issuer call subject to prior supervisory approval No
15 First call date and early redemption amount (7)
Other early redemption events and early redemption
amounts (8)
16 Subsequent call dates, if applicable (9)
Coupons / Dividends
17 Type of coupon rate / dividend rate (10) Fixed
18 Coupon rate or dividend rate (11) 2.4% per annum 1)
19 Coupon / dividend stopper events (12) No
20 Fully discretionary, partially discretionary or mandatory
(13) Mandatory
21 Existence of step-up or other incentive to redeem No
22 Noncumulative or cumulative No
23 Convertible or non-convertible No
24 If convertible, conversion trigger (14)
25 If convertible, fully or partially (15)
26 If convertible, conversion rate (16)
27 If convertible, mandatory or optional conversion (17)
28 If convertible, specify instrument type that it can be
converted into
29 If convertible, specify issuer of instrument it can be
converted into
30 Write-down feature (18) No
31 If write-down, write-down trigger (19)
32 If write-down, full or partial (20)

83
33 If write-down, permanent or temporary (21)
34 If temporary write-down, description of write-up
mechanism
35
Position in subordination hierarchy in liquidation (specify
instruments type immediately senior to the instrument)
(22)
General Debt
36 Non-compliant transitioned features (23) Yes
37 If yes, description of non-compliant transitioned features
(23) Non-viability loss absorption clause
1) The coupon rate is a notional-weighted average of coupon rates for all Tier2 subordinated debts of the Group as at
the end of March 2018.
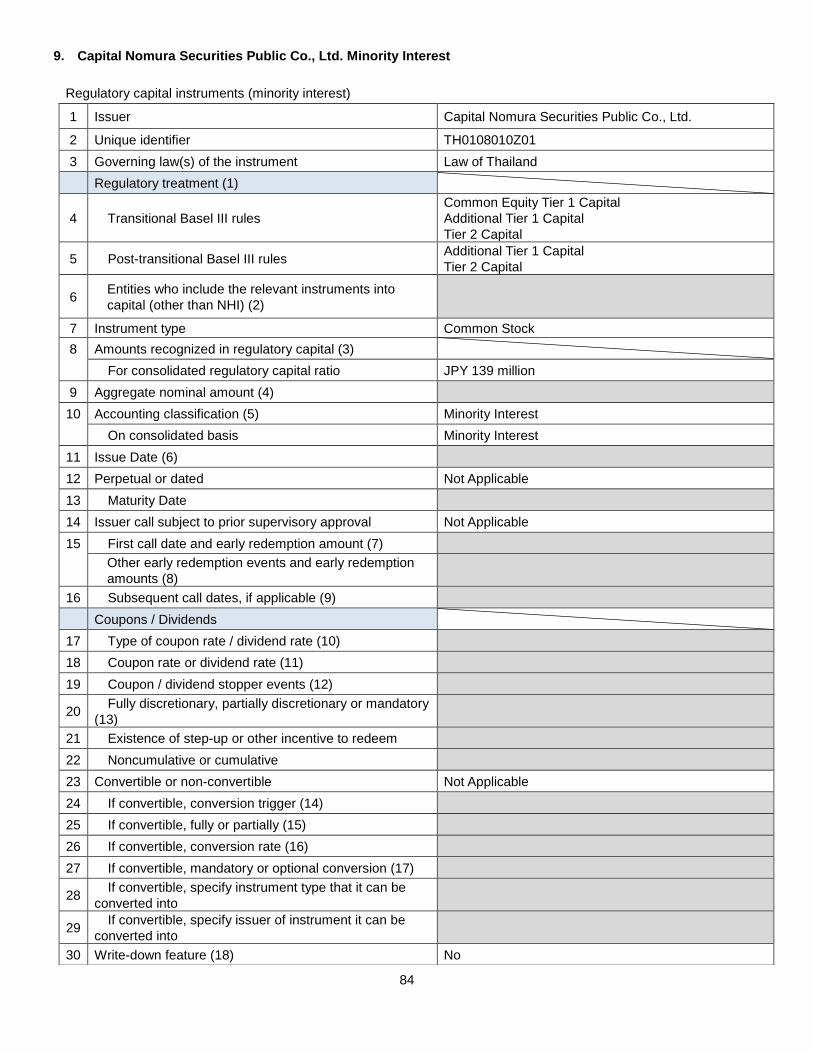
84
9. Capital Nomura Securities Public Co., Ltd. Minority Interest
Regulatory capital instruments (minority interest)
1 Issuer Capital Nomura Securities Public Co., Ltd.
2 Unique identifier TH0108010Z01
3 Governing law(s) of the instrument Law of Thailand
Regulatory treatment (1)
4 Transitional Basel III rules
Common Equity Tier 1 Capital
Additional Tier 1 Capital
Tier 2 Capital
5 Post-transitional Basel III rules Additional Tier 1 Capital
Tier 2 Capital
6 Entities who include the relevant instruments into
capital (other than NHI) (2)
7 Instrument type Common Stock
8 Amounts recognized in regulatory capital (3)
For consolidated regulatory capital ratio JPY 139 million
9 Aggregate nominal amount (4)
10 Accounting classification (5) Minority Interest
On consolidated basis Minority Interest
11 Issue Date (6)
12 Perpetual or dated Not Applicable
13 Maturity Date
14 Issuer call subject to prior supervisory approval Not Applicable
15 First call date and early redemption amount (7)
Other early redemption events and early redemption
amounts (8)
16 Subsequent call dates, if applicable (9)
Coupons / Dividends
17 Type of coupon rate / dividend rate (10)
18 Coupon rate or dividend rate (11)
19 Coupon / dividend stopper events (12)
20 Fully discretionary, partially discretionary or mandatory
(13)
21 Existence of step-up or other incentive to redeem
22 Noncumulative or cumulative
23 Convertible or non-convertible Not Applicable
24 If convertible, conversion trigger (14)
25 If convertible, fully or partially (15)
26 If convertible, conversion rate (16)
27 If convertible, mandatory or optional conversion (17)
28 If convertible, specify instrument type that it can be
converted into
29 If convertible, specify issuer of instrument it can be
converted into
30 Write-down feature (18) No
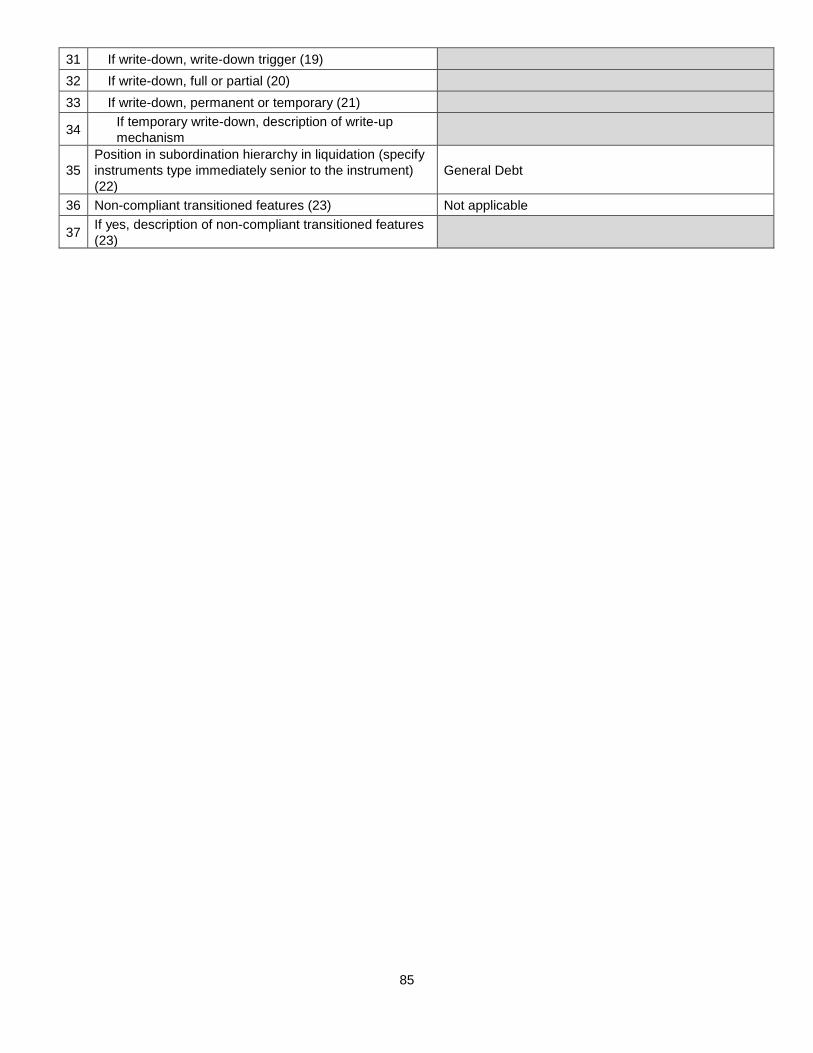
85
31 If write-down, write-down trigger (19)
32 If write-down, full or partial (20)
33 If write-down, permanent or temporary (21)
34 If temporary write-down, description of write-up
mechanism
35
Position in subordination hierarchy in liquidation (specify
instruments type immediately senior to the instrument)
(22)
General Debt
36 Non-compliant transitioned features (23) Not applicable
37 If yes, description of non-compliant transitioned features
(23)
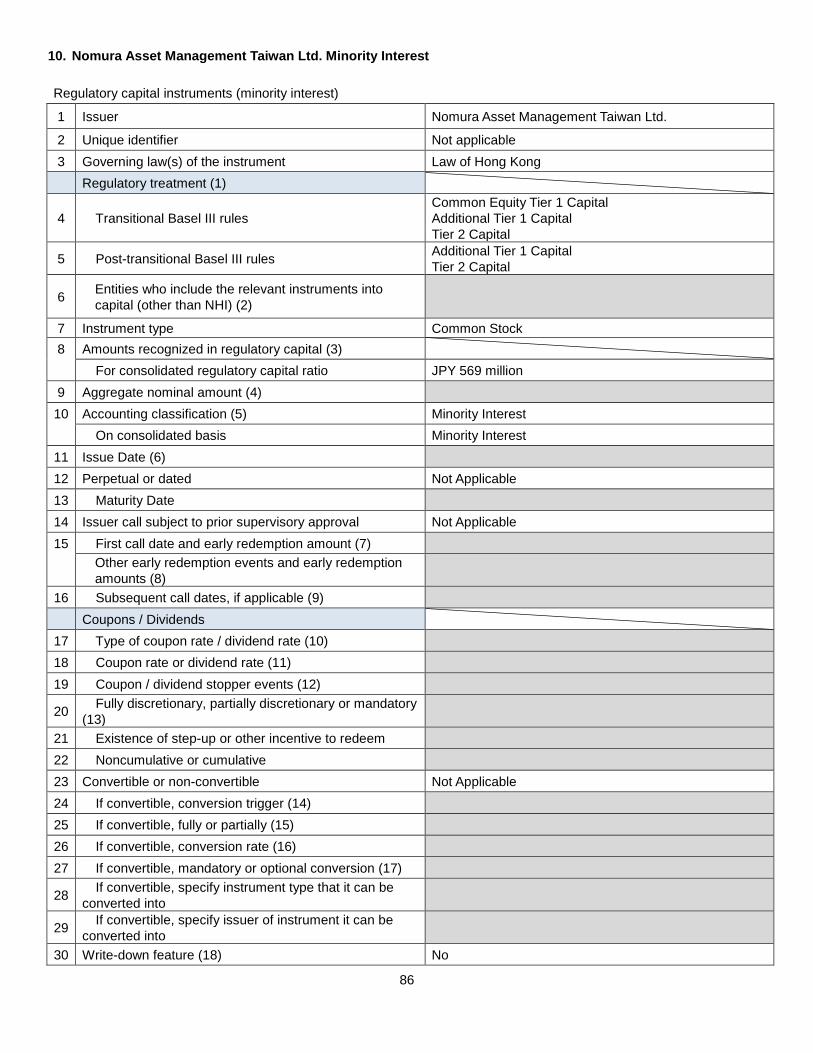
86
10. Nomura Asset Management Taiwan Ltd. Minority Interest
Regulatory capital instruments (minority interest)
1 Issuer Nomura Asset Management Taiwan Ltd.
2 Unique identifier Not applicable
3 Governing law(s) of the instrument Law of Hong Kong
Regulatory treatment (1)
4 Transitional Basel III rules
Common Equity Tier 1 Capital
Additional Tier 1 Capital
Tier 2 Capital
5 Post-transitional Basel III rules Additional Tier 1 Capital
Tier 2 Capital
6 Entities who include the relevant instruments into
capital (other than NHI) (2)
7 Instrument type Common Stock
8 Amounts recognized in regulatory capital (3)
For consolidated regulatory capital ratio JPY 569 million
9 Aggregate nominal amount (4)
10 Accounting classification (5) Minority Interest
On consolidated basis Minority Interest
11 Issue Date (6)
12 Perpetual or dated Not Applicable
13 Maturity Date
14 Issuer call subject to prior supervisory approval Not Applicable
15 First call date and early redemption amount (7)
Other early redemption events and early redemption
amounts (8)
16 Subsequent call dates, if applicable (9)
Coupons / Dividends
17 Type of coupon rate / dividend rate (10)
18 Coupon rate or dividend rate (11)
19 Coupon / dividend stopper events (12)
20 Fully discretionary, partially discretionary or mandatory
(13)
21 Existence of step-up or other incentive to redeem
22 Noncumulative or cumulative
23 Convertible or non-convertible Not Applicable
24 If convertible, conversion trigger (14)
25 If convertible, fully or partially (15)
26 If convertible, conversion rate (16)
27 If convertible, mandatory or optional conversion (17)
28 If convertible, specify instrument type that it can be
converted into
29 If convertible, specify issuer of instrument it can be
converted into
30 Write-down feature (18) No

87
31 If write-down, write-down trigger (19)
32 If write-down, full or partial (20)
33 If write-down, permanent or temporary (21)
34 If temporary write-down, description of write-up
mechanism
35
Position in subordination hierarchy in liquidation (specify
instruments type immediately senior to the instrument)
(22)
General Debt
36 Non-compliant transitioned features (23) Not applicable
37 If yes, description of non-compliant transitioned features
(23)

88
11. Chi-X Global Holdings LLC Minority Interest
Regulatory capital instruments (minority interest)
1 Issuer Chi-X Global Holdings LLC
2 Unique identifier Not applicable
3 Governing law(s) of the instrument Delaware General Corporation Law
Regulatory treatment (1)
4 Transitional Basel III rules
Common Equity Tier 1 Capital
Additional Tier 1 Capital
Tier 2 Capital
5 Post-transitional Basel III rules Additional Tier 1 Capital
Tier 2 Capital
6 Entities who include the relevant instruments into
capital (other than NHI) (2)
7 Instrument type Common Stock
8 Amounts recognized in regulatory capital (3)
For consolidated regulatory capital ratio JPY 5 million
9 Aggregate nominal amount (4)
10 Accounting classification (5) Minority Interest
On consolidated basis Minority Interest
11 Issue Date (6)
12 Perpetual or dated Not Applicable
13 Maturity Date
14 Issuer call subject to prior supervisory approval Not Applicable
15 First call date and early redemption amount (7)
Other early redemption events and early redemption
amounts (8)
16 Subsequent call dates, if applicable (9)
Coupons / Dividends
17 Type of coupon rate / dividend rate (10)
18 Coupon rate or dividend rate (11)
19 Coupon / dividend stopper events (12)
20 Fully discretionary, partially discretionary or mandatory
(13)
21 Existence of step-up or other incentive to redeem
22 Noncumulative or cumulative
23 Convertible or non-convertible Not Applicable
24 If convertible, conversion trigger (14)
25 If convertible, fully or partially (15)
26 If convertible, conversion rate (16)
27 If convertible, mandatory or optional conversion (17)
28 If convertible, specify instrument type that it can be
converted into
29 If convertible, specify issuer of instrument it can be
converted into
30 Write-down feature (18) No

89
31 If write-down, write-down trigger (19)
32 If write-down, full or partial (20)
33 If write-down, permanent or temporary (21)
34 If temporary write-down, description of write-up
mechanism
35
Position in subordination hierarchy in liquidation (specify
instruments type immediately senior to the instrument)
(22)
General Debt
36 Non-compliant transitioned features (23) Not applicable
37 If yes, description of non-compliant transitioned features
(23)
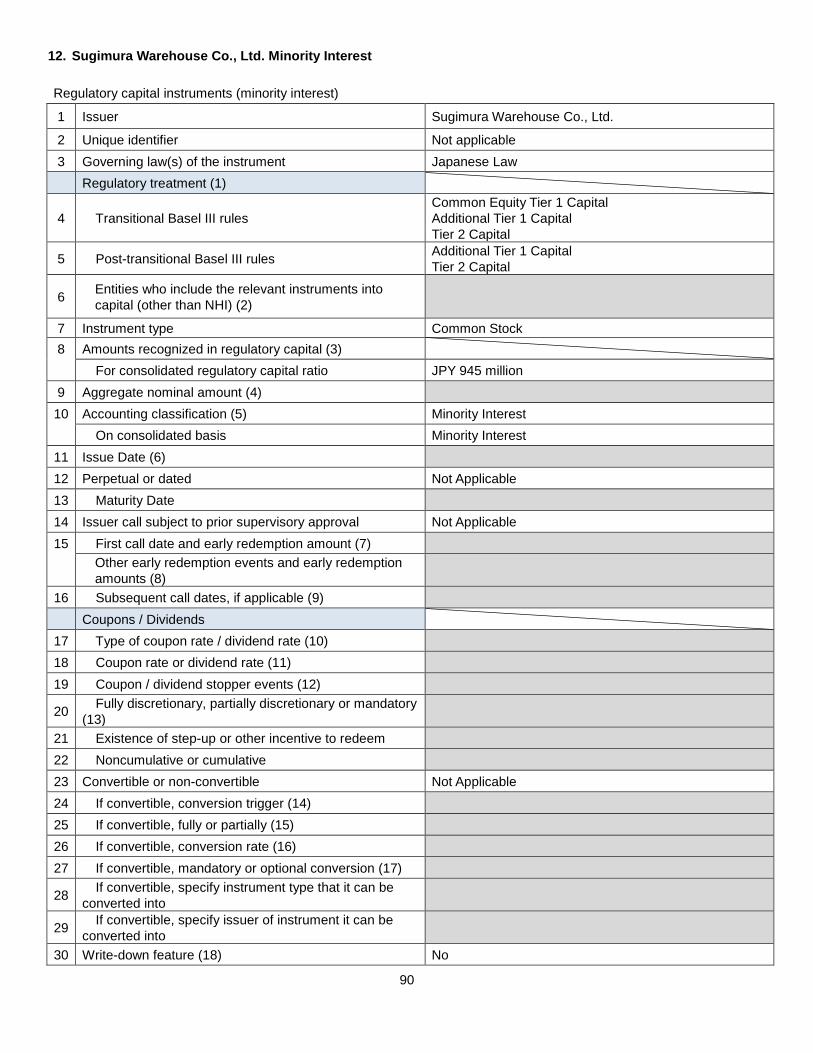
90
12. Sugimura Warehouse Co., Ltd. Minority Interest
Regulatory capital instruments (minority interest)
1 Issuer Sugimura Warehouse Co., Ltd.
2 Unique identifier Not applicable
3 Governing law(s) of the instrument Japanese Law
Regulatory treatment (1)
4 Transitional Basel III rules
Common Equity Tier 1 Capital
Additional Tier 1 Capital
Tier 2 Capital
5 Post-transitional Basel III rules Additional Tier 1 Capital
Tier 2 Capital
6 Entities who include the relevant instruments into
capital (other than NHI) (2)
7 Instrument type Common Stock
8 Amounts recognized in regulatory capital (3)
For consolidated regulatory capital ratio JPY 945 million
9 Aggregate nominal amount (4)
10 Accounting classification (5) Minority Interest
On consolidated basis Minority Interest
11 Issue Date (6)
12 Perpetual or dated Not Applicable
13 Maturity Date
14 Issuer call subject to prior supervisory approval Not Applicable
15 First call date and early redemption amount (7)
Other early redemption events and early redemption
amounts (8)
16 Subsequent call dates, if applicable (9)
Coupons / Dividends
17 Type of coupon rate / dividend rate (10)
18 Coupon rate or dividend rate (11)
19 Coupon / dividend stopper events (12)
20 Fully discretionary, partially discretionary or mandatory
(13)
21 Existence of step-up or other incentive to redeem
22 Noncumulative or cumulative
23 Convertible or non-convertible Not Applicable
24 If convertible, conversion trigger (14)
25 If convertible, fully or partially (15)
26 If convertible, conversion rate (16)
27 If convertible, mandatory or optional conversion (17)
28 If convertible, specify instrument type that it can be
converted into
29 If convertible, specify issuer of instrument it can be
converted into
30 Write-down feature (18) No
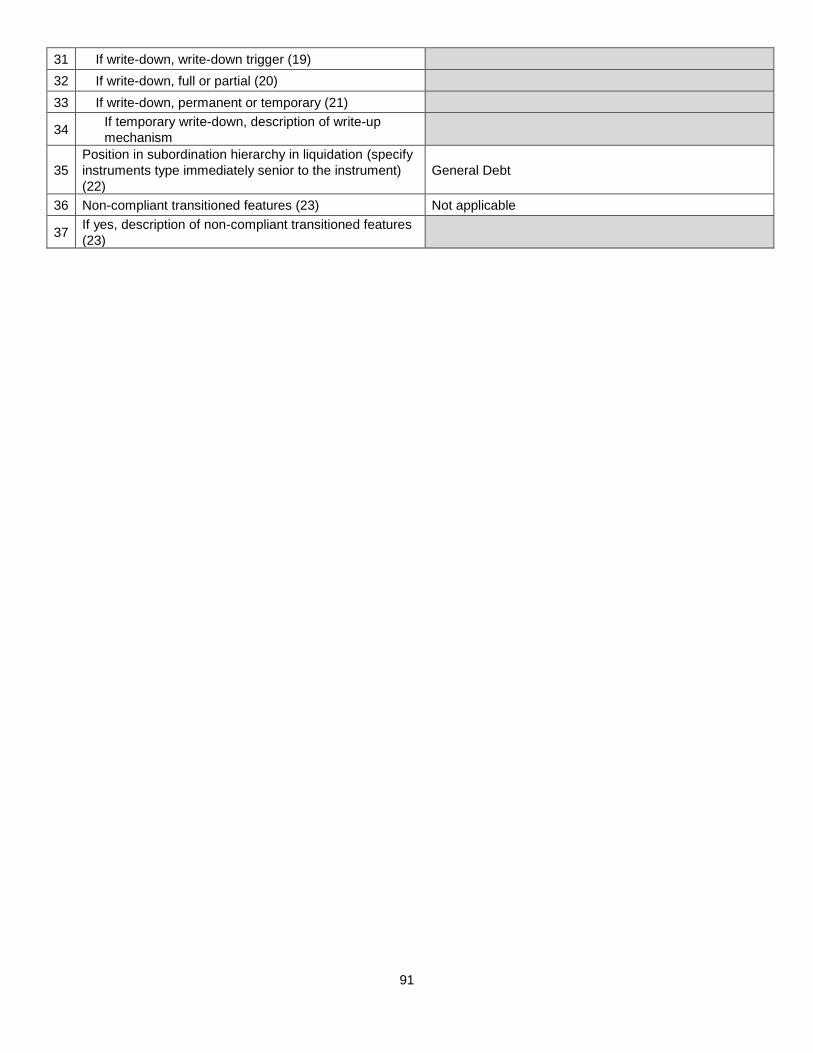
91
31 If write-down, write-down trigger (19)
32 If write-down, full or partial (20)
33 If write-down, permanent or temporary (21)
34 If temporary write-down, description of write-up
mechanism
35
Position in subordination hierarchy in liquidation (specify
instruments type immediately senior to the instrument)
(22)
General Debt
36 Non-compliant transitioned features (23) Not applicable
37 If yes, description of non-compliant transitioned features
(23)
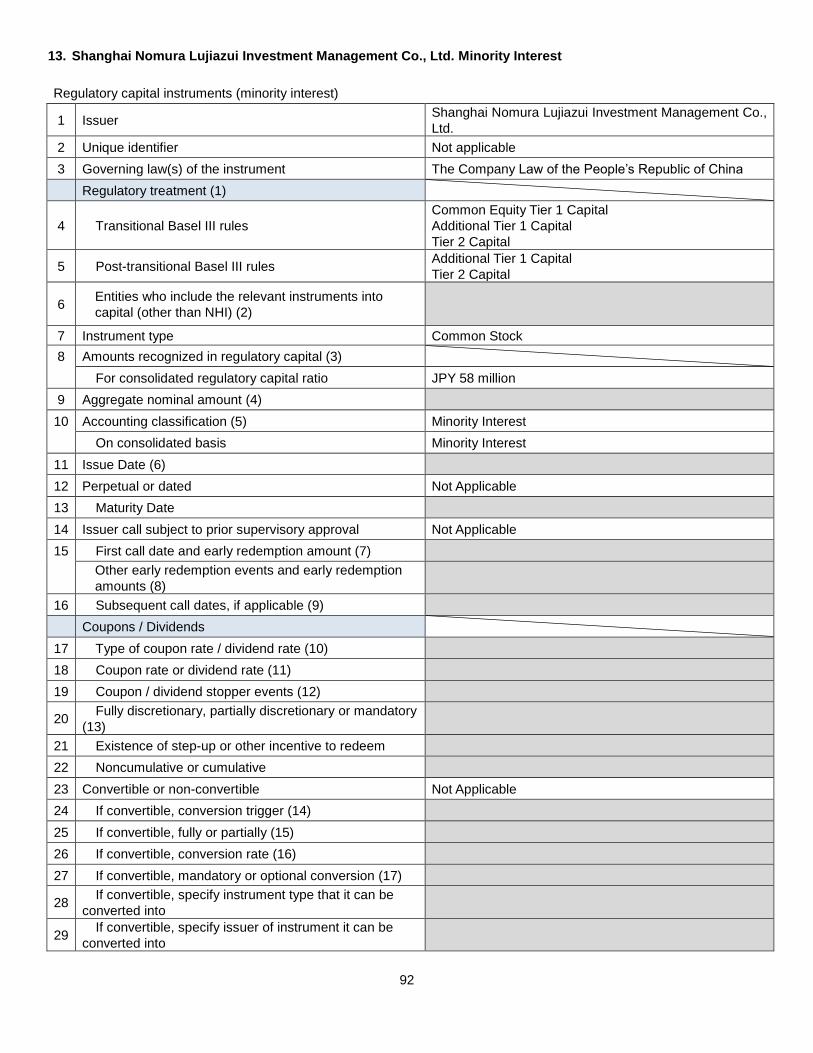
92
13. Shanghai Nomura Lujiazui Investment Management Co., Ltd. Minority Interest
Regulatory capital instruments (minority interest)
1 Issuer Shanghai Nomura Lujiazui Investment Management Co.,
Ltd.
2 Unique identifier Not applicable
3 Governing law(s) of the instrument The Company Law of the People’s Republic of China
Regulatory treatment (1)
4 Transitional Basel III rules
Common Equity Tier 1 Capital
Additional Tier 1 Capital
Tier 2 Capital
5 Post-transitional Basel III rules Additional Tier 1 Capital
Tier 2 Capital
6 Entities who include the relevant instruments into
capital (other than NHI) (2)
7 Instrument type Common Stock
8 Amounts recognized in regulatory capital (3)
For consolidated regulatory capital ratio JPY 58 million
9 Aggregate nominal amount (4)
10 Accounting classification (5) Minority Interest
On consolidated basis Minority Interest
11 Issue Date (6)
12 Perpetual or dated Not Applicable
13 Maturity Date
14 Issuer call subject to prior supervisory approval Not Applicable
15 First call date and early redemption amount (7)
Other early redemption events and early redemption
amounts (8)
16 Subsequent call dates, if applicable (9)
Coupons / Dividends
17 Type of coupon rate / dividend rate (10)
18 Coupon rate or dividend rate (11)
19 Coupon / dividend stopper events (12)
20 Fully discretionary, partially discretionary or mandatory
(13)
21 Existence of step-up or other incentive to redeem
22 Noncumulative or cumulative
23 Convertible or non-convertible Not Applicable
24 If convertible, conversion trigger (14)
25 If convertible, fully or partially (15)
26 If convertible, conversion rate (16)
27 If convertible, mandatory or optional conversion (17)
28 If convertible, specify instrument type that it can be
converted into
29 If convertible, specify issuer of instrument it can be
converted into
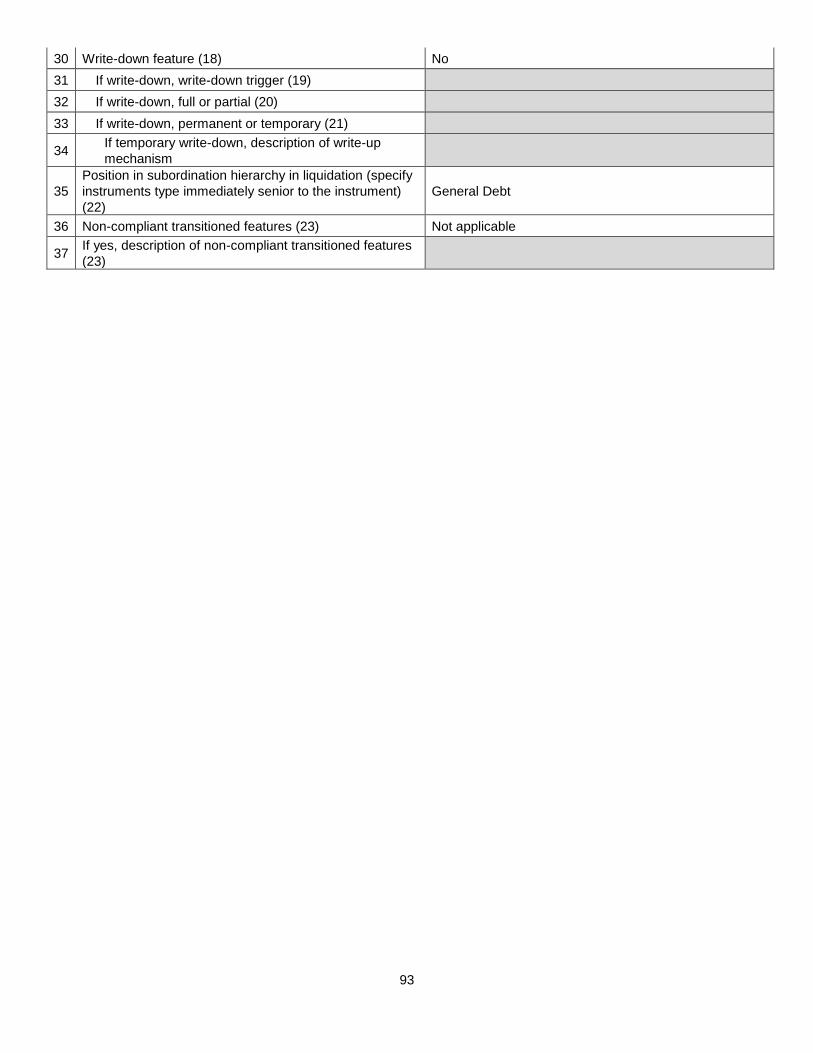
93
30 Write-down feature (18) No
31 If write-down, write-down trigger (19)
32 If write-down, full or partial (20)
33 If write-down, permanent or temporary (21)
34 If temporary write-down, description of write-up
mechanism
35
Position in subordination hierarchy in liquidation (specify
instruments type immediately senior to the instrument)
(22)
General Debt
36 Non-compliant transitioned features (23) Not applicable
37 If yes, description of non-compliant transitioned features
(23)
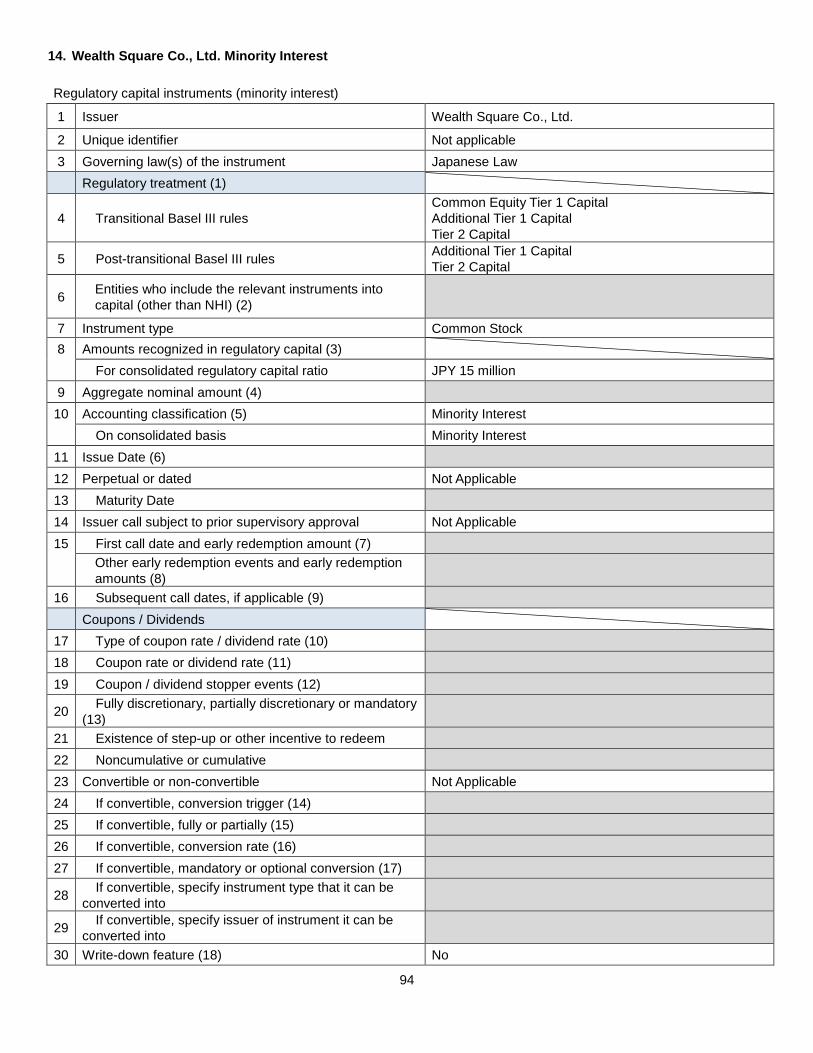
94
14. Wealth Square Co., Ltd. Minority Interest
Regulatory capital instruments (minority interest)
1 Issuer Wealth Square Co., Ltd.
2 Unique identifier Not applicable
3 Governing law(s) of the instrument Japanese Law
Regulatory treatment (1)
4 Transitional Basel III rules
Common Equity Tier 1 Capital
Additional Tier 1 Capital
Tier 2 Capital
5 Post-transitional Basel III rules Additional Tier 1 Capital
Tier 2 Capital
6 Entities who include the relevant instruments into
capital (other than NHI) (2)
7 Instrument type Common Stock
8 Amounts recognized in regulatory capital (3)
For consolidated regulatory capital ratio JPY 15 million
9 Aggregate nominal amount (4)
10 Accounting classification (5) Minority Interest
On consolidated basis Minority Interest
11 Issue Date (6)
12 Perpetual or dated Not Applicable
13 Maturity Date
14 Issuer call subject to prior supervisory approval Not Applicable
15 First call date and early redemption amount (7)
Other early redemption events and early redemption
amounts (8)
16 Subsequent call dates, if applicable (9)
Coupons / Dividends
17 Type of coupon rate / dividend rate (10)
18 Coupon rate or dividend rate (11)
19 Coupon / dividend stopper events (12)
20 Fully discretionary, partially discretionary or mandatory
(13)
21 Existence of step-up or other incentive to redeem
22 Noncumulative or cumulative
23 Convertible or non-convertible Not Applicable
24 If convertible, conversion trigger (14)
25 If convertible, fully or partially (15)
26 If convertible, conversion rate (16)
27 If convertible, mandatory or optional conversion (17)
28 If convertible, specify instrument type that it can be
converted into
29 If convertible, specify issuer of instrument it can be
converted into
30 Write-down feature (18) No

95
31 If write-down, write-down trigger (19)
32 If write-down, full or partial (20)
33 If write-down, permanent or temporary (21)
34 If temporary write-down, description of write-up
mechanism
35
Position in subordination hierarchy in liquidation (specify
instruments type immediately senior to the instrument)
(22)
General Debt
36 Non-compliant transitioned features (23) Not applicable
37 If yes, description of non-compliant transitioned features
(23)
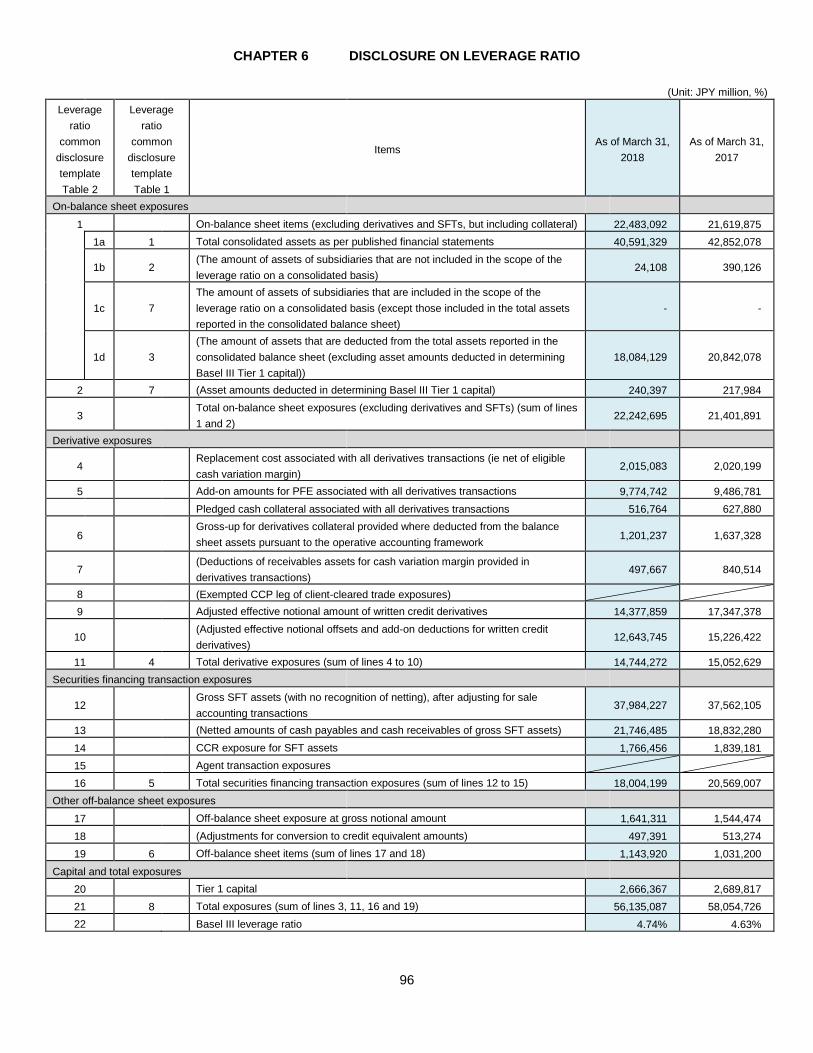
96
CHAPTER 6 DISCLOSURE ON LEVERAGE RATIO
(Unit: JPY million, %)
Leverage
ratio
common
disclosure
template
Table 2
Leverage
ratio
common
disclosure
template
Table 1
Items As of March 31,
2018
As of March 31,
2017
On-balance sheet exposures
1 On-balance sheet items (excluding derivatives and SFTs, but including collateral) 22,483,092 21,619,875
1a 1 Total consolidated assets as per published financial statements 40,591,329 42,852,078
1b 2
(The amount of assets of subsidiaries that are not included in the scope of the
leverage ratio on a consolidated basis) 24,108 390,126
1c 7
The amount of assets of subsidiaries that are included in the scope of the
leverage ratio on a consolidated basis (except those included in the total assets
reported in the consolidated balance sheet)
- -
1d 3
(The amount of assets that are deducted from the total assets reported in the
consolidated balance sheet (excluding asset amounts deducted in determining
Basel III Tier 1 capital))
18,084,129 20,842,078
2 7 (Asset amounts deducted in determining Basel III Tier 1 capital) 240,397 217,984
3 Total on-balance sheet exposures (excluding derivatives and SFTs) (sum of lines
1 and 2) 22,242,695 21,401,891
Derivative exposures
4 Replacement cost associated with all derivatives transactions (ie net of eligible
cash variation margin) 2,015,083 2,020,199
5 Add-on amounts for PFE associated with all derivatives transactions 9,774,742 9,486,781
Pledged cash collateral associated with all derivatives transactions 516,764 627,880
6 Gross-up for derivatives collateral provided where deducted from the balance
sheet assets pursuant to the operative accounting framework 1,201,237 1,637,328
7 (Deductions of receivables assets for cash variation margin provided in
derivatives transactions) 497,667 840,514
8 (Exempted CCP leg of client-cleared trade exposures)
9 Adjusted effective notional amount of written credit derivatives 14,377,859 17,347,378
10 (Adjusted effective notional offsets and add-on deductions for written credit
derivatives) 12,643,745 15,226,422
11 4 Total derivative exposures (sum of lines 4 to 10) 14,744,272 15,052,629
Securities financing transaction exposures
12 Gross SFT assets (with no recognition of netting), after adjusting for sale
accounting transactions 37,984,227 37,562,105
13 (Netted amounts of cash payables and cash receivables of gross SFT assets) 21,746,485 18,832,280
14 CCR exposure for SFT assets 1,766,456 1,839,181
15 Agent transaction exposures
16 5 Total securities financing transaction exposures (sum of lines 12 to 15) 18,004,199 20,569,007
Other off-balance sheet exposures
17 Off-balance sheet exposure at gross notional amount 1,641,311 1,544,474
18 (Adjustments for conversion to credit equivalent amounts) 497,391 513,274
19 6 Off-balance sheet items (sum of lines 17 and 18) 1,143,920 1,031,200
Capital and total exposures
20 Tier 1 capital 2,666,367 2,689,817
21 8 Total exposures (sum of lines 3, 11, 16 and 19) 56,135,087 58,054,726
22 Basel III leverage ratio 4.74% 4.63%
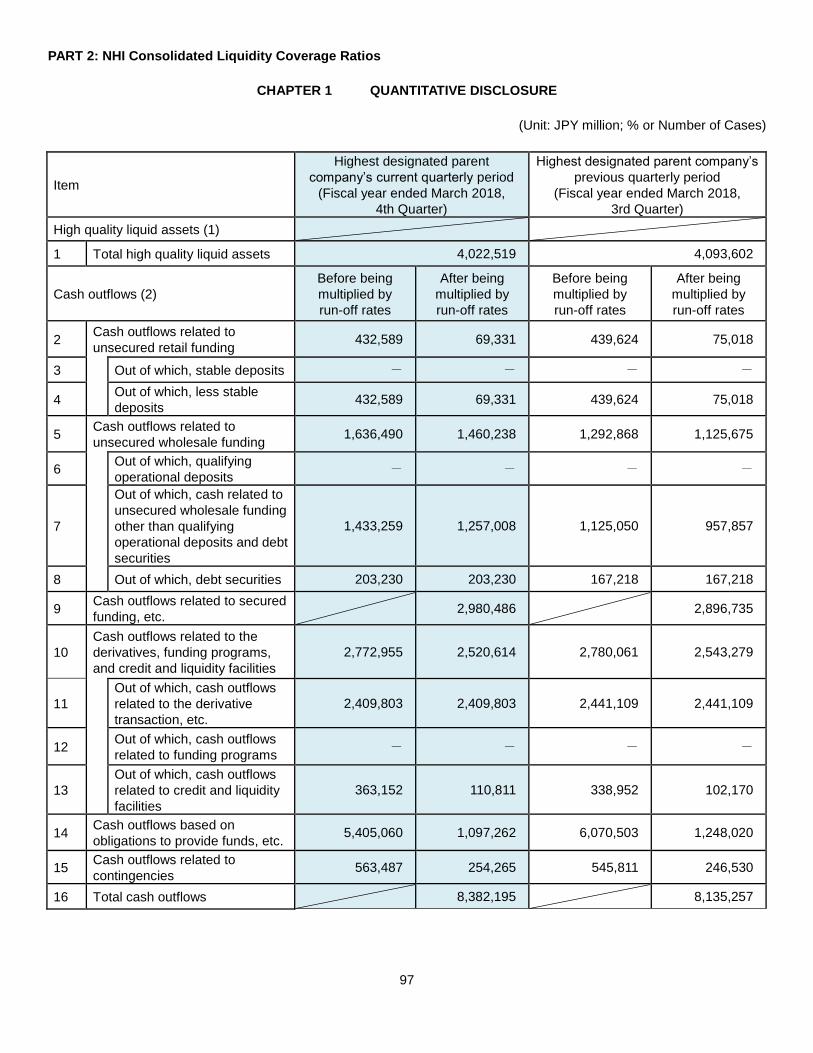
97
PART 2: NHI Consolidated Liquidity Coverage Ratios
CHAPTER 1 QUANTITATIVE DISCLOSURE
(Unit: JPY million; % or Number of Cases)
Item
Highest designated parent
company’s current quarterly period
(Fiscal year ended March 2018,
4th Quarter)
Highest designated parent company’s
previous quarterly period
(Fiscal year ended March 2018,
3rd Quarter)
High quality liquid assets (1)
1 Total high quality liquid assets 4,022,519 4,093,602
Cash outflows (2)
Before being
multiplied by
run-off rates
After being
multiplied by
run-off rates
Before being
multiplied by
run-off rates
After being
multiplied by
run-off rates
2 Cash outflows related to
unsecured retail funding 432,589 69,331 439,624 75,018
3 Out of which, stable deposits - - - -
4 Out of which, less stable
deposits 432,589 69,331 439,624 75,018
5 Cash outflows related to
unsecured wholesale funding 1,636,490 1,460,238 1,292,868 1,125,675
6 Out of which, qualifying
operational deposits - - - -
7
Out of which, cash related to
unsecured wholesale funding
other than qualifying
operational deposits and debt
securities
1,433,259 1,257,008 1,125,050 957,857
8 Out of which, debt securities 203,230 203,230 167,218 167,218
9 Cash outflows related to secured
funding, etc. 2,980,486 2,896,735
10
Cash outflows related to the
derivatives, funding programs,
and credit and liquidity facilities
2,772,955 2,520,614 2,780,061 2,543,279
11
Out of which, cash outflows
related to the derivative
transaction, etc.
2,409,803 2,409,803 2,441,109 2,441,109
12 Out of which, cash outflows
related to funding programs - - - -
13
Out of which, cash outflows
related to credit and liquidity
facilities
363,152 110,811 338,952 102,170
14 Cash outflows based on
obligations to provide funds, etc. 5,405,060 1,097,262 6,070,503 1,248,020
15 Cash outflows related to
contingencies 563,487 254,265 545,811 246,530
16 Total cash outflows 8,382,195 8,135,257
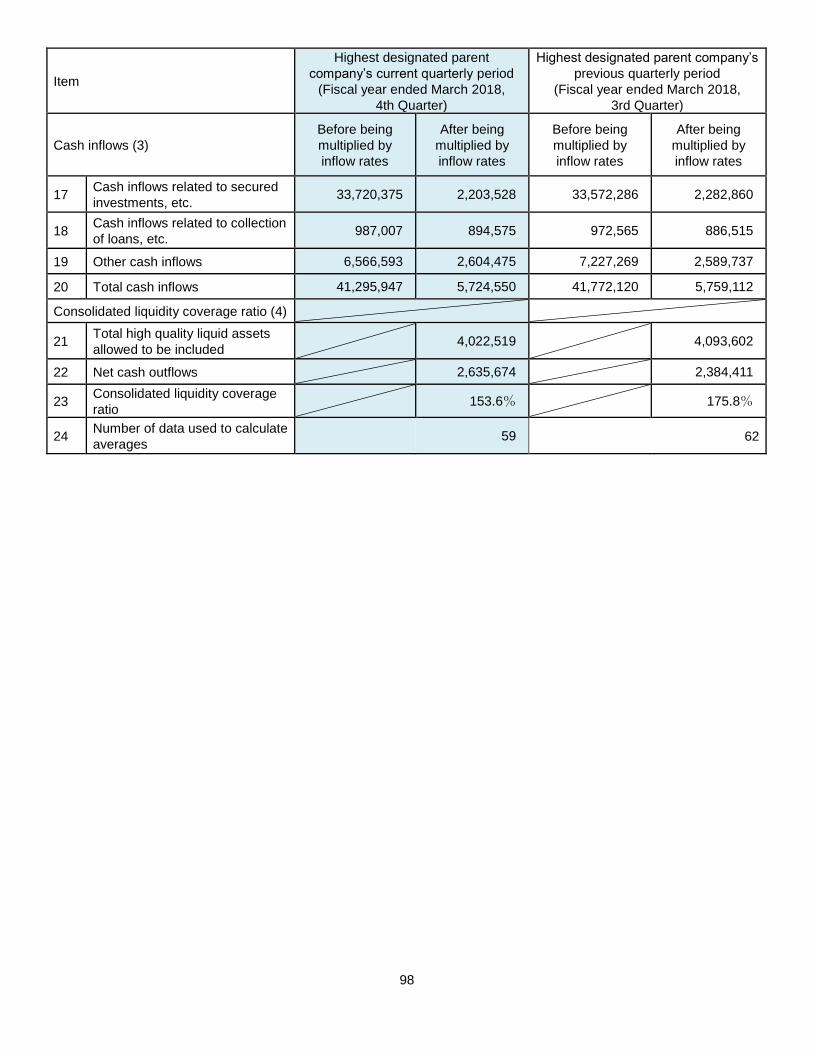
98
Item
Highest designated parent
company’s current quarterly period
(Fiscal year ended March 2018,
4th Quarter)
Highest designated parent company’s
previous quarterly period
(Fiscal year ended March 2018,
3rd Quarter)
Cash inflows (3)
Before being
multiplied by
inflow rates
After being
multiplied by
inflow rates
Before being
multiplied by
inflow rates
After being
multiplied by
inflow rates
17 Cash inflows related to secured
investments, etc. 33,720,375 2,203,528 33,572,286 2,282,860
18 Cash inflows related to collection
of loans, etc. 987,007 894,575 972,565 886,515
19 Other cash inflows 6,566,593 2,604,475 7,227,269 2,589,737
20 Total cash inflows 41,295,947 5,724,550 41,772,120 5,759,112
Consolidated liquidity coverage ratio (4)
21 Total high quality liquid assets
allowed to be included 4,022,519 4,093,602
22 Net cash outflows 2,635,674 2,384,411
23 Consolidated liquidity coverage
ratio 153.6% 175.8%
24 Number of data used to calculate
averages 59 62
99
CHAPTER 2 QUALITATIVE DISCLOSURE
1. Consolidated Liquidity Coverage Ratio Fluctuations Explained in a Chronological Order
For the fourth quarter of the year ended March 31, 2018, the daily average of Nomura Group’s total high quality
liquid assets was 4,022,519 million yen, a decrease of 71,083 million yen compared with the third quarter. For the
fourth quarter of the year ended March 31, 2018, cash outflows related to unsecured wholesale funding other than
qualifying operational deposits and debt securities were 1,257,008 million yen, an increase of 299,151 million yen
compared with the third quarter, cash outflows based on obligations to provide funds, etc. were 1,097,262 million yen,
a decrease of 150,758 million yen compared with the third quarter, and total net cash outflows were 2,635,674 million
yen, an increase of 251,263 million yen compared with the third quarter.
As a result, for the fourth quarter of the year ended March 31, 2018, the daily average of the consolidated
liquidity coverage ratio was 153.6%.
The main factors causing fluctuation in Nomura Group’s consolidated liquidity coverage ratio are changes in
trading inventory holdings and related secured financing transactions. In addition, maturity of unsecured wholesale
funding also contributes to LCR fluctuation in the fourth quarter.
2. Assessment of the Levels of the Consolidated Liquidity Coverage Ratio
The daily average of Nomura Group’s consolidated liquidity coverage ratio for the fourth quarter of the year
ended March 31, 2018, sufficiently exceeded the minimum level required by the law.
At Nomura Group, we establish the risk appetite for the consolidated liquidity coverage ratio and ensure that the
consolidated liquidity coverage ratio sufficiently exceeds the minimum level required by the law on a daily basis.
3. Composition of the Stock of High Quality Liquid Assets
There were no significant movements in the composition of the stock of high quality liquid assets.
4. Other Matters Relating to Consolidated Liquidity Coverage Ratio
There are no other matters of significance to note.
100
CHAPTER 3 DISCLOSURE ON LIQUIDITY RISK MANAGEMENT POLICY
1. Liquidity Risk Management Policy and Operation
We define liquidity risk as the risk of loss arising from difficulty in securing the necessary funding or from a
significantly higher cost of funding than normal levels due to deterioration of Nomura Group’s creditworthiness or
deterioration in market conditions. Our global liquidity risk management policy is based on liquidity risk appetite
formulated by the Executive Management Board (“EMB”). Nomura’s liquidity risk management, under market-wide
stress and in addition, under Nomura-specific stress, seeks to ensure enough continuous liquidity to meet all funding
requirements and unsecured debt obligations across one year and 30-day periods, respectively, without raising funds
through unsecured funding or through the liquidation of assets.
We have in place a number of liquidity risk management frameworks that enable us to achieve our primary
liquidity objective. These frameworks include (1) Centralized Control of Residual Cash and Maintenance of Liquidity
Portfolio; (2) Utilization of Unencumbered Assets as Part of Our Liquidity Portfolio; (3) Appropriate Funding and
Diversification of Funding Sources and Maturities Commensurate with the Composition of Assets; (4) Management of
Credit Lines to Nomura Group Entities; (5) Implementation of Liquidity Stress Tests; and (6) Contingency Funding
Plan.
Our EMB has the authority to make decisions concerning group liquidity management. The Chief Financial
Officer (“CFO”) has the operational authority and responsibility over our liquidity management based on decisions
made by the EMB.
2. Liquidity Risk Management Framework
(1) Centralized Control of Residual Cash and Maintenance of Liquidity Portfolio
We centrally control residual cash held at Nomura Group entities for effective liquidity utilization purposes. As
for the usage of funds, the CFO decides the maximum amount of available funds, provided without posting any
collateral, for allocation within Nomura and the EMB allocates the funds to each business division. Global Treasury
monitors usage by businesses and reports to the EMB.
In order to enable us to transfer funds smoothly between group entities, we limit the issuance of securities by
regulated broker-dealers or banking entities within Nomura Group and seek to raise unsecured funding primarily
through us or through unregulated subsidiaries. The primary benefits of this strategy include cost minimization, wider
investor name recognition and greater flexibility in providing funding to various subsidiaries across Nomura Group.
To meet any potential liquidity requirement, we maintain a liquidity portfolio, managed by Global Treasury
apart from other assets, in the form of cash and highly liquid, unencumbered securities that may be sold or pledged to
provide liquidity. As of March 31, 2018, our liquidity portfolio was 4,628.4 billion Yen which sufficiently met liquidity
requirements under the stress scenarios.
(2) Utilization of Unencumbered Assets as Part of Our Liquidity Portfolio
In addition to our liquidity portfolio, we had 2,167.9 billion yen of other unencumbered assets comprising mainly
of unpledged trading assets that can be used as an additional source of secured funding. Global Treasury monitors
other unencumbered assets and can, under a liquidity stress event when the contingency funding plan has been
invoked, monetize and utilize the cash generated as a result. The aggregate of our liquidity portfolio and other
unencumbered assets as of March 31, 2018 was 6,796.3 billion yen, which represented 309.8% of our total unsecured
debt maturing within one year.
101
(3) Appropriate Funding and Diversification of Funding Sources and Maturities Commensurate with the
Composition of Assets
We seek to maintain a surplus of long-term debt and equity above the cash capital requirements of our assets.
We also seek to achieve diversification of our funding by market, instrument type, investors, currency, and staggered
maturities in order to reduce unsecured refinancing risk.
(4) Management of Credit Lines to Nomura Group Entities
We maintain and expand credit lines to Nomura Group entities from other financial institutions to secure stable
funding. We ensure that the maturity dates of borrowing agreements are distributed evenly throughout the year in
order to prevent excessive maturities in any given period.
(5) Implementation of Liquidity Stress Tests
We maintain our liquidity portfolio and monitor the sufficiency of our liquidity based on an internal model which
simulates changes in cash outflow under specified stress scenarios to comply with our above mentioned liquidity
management policy.
We assess the liquidity requirements of Nomura Group under various stress scenarios with differing levels of
severity over multiple time horizons. We evaluate these requirements under Nomura-specific and broad market-wide
events, including potential credit rating downgrades at the parent and subsidiary levels that may impact us by loss of
access to unsecured capital markets, additional collateral posting requirements, limited or no access to secured
funding markets and other events. We call this risk analysis our Maximum Cumulative Outflow (“MCO”) framework.
The MCO framework is designed to incorporate the primary liquidity risks and models the relevant future cash
flows in the following two primary scenarios:
• Stressed scenario: To maintain adequate liquidity during a severe market-wide liquidity event without raising
funds through unsecured financing or through the liquidation of assets for a year; and
• Acute stress scenario: To maintain adequate liquidity during a severe market-wide liquidity event coupled with
credit concerns regarding Nomura’s liquidity position, without raising funds through unsecured funding or
through the liquidation of assets for 30 days.
We assume that Nomura will not be able to liquidate assets or adjust its business model during the time
horizons used in each of these scenarios. The MCO framework therefore defines the amount of liquidity required to be
held in order to meet our expected liquidity needs in a stress event to a level we believe appropriate based on our
liquidity risk appetite.
As of March 31, 2018, our liquidity portfolio exceeded net cash outflows under the stress scenarios described
above.
We constantly evaluate and modify our liquidity risk assumptions based on regulatory and market changes. The
model we use in order to simulate the impact of stress scenarios includes the following assumptions:
• No liquidation of assets;
• No ability to issue additional unsecured funding;
• Upcoming maturities of unsecured debt (maturities less than one year);
• Potential buybacks of our outstanding debt;
• Loss of secured funding lines particularly for less liquid assets,
• Fluctuation of funding needs under normal business circumstances;
• Cash deposits and free collateral roll-off in a stress event;
• Widening of haircuts on outstanding repo funding;
• Additional collateralization requirements of clearing banks and depositories;
102
• Drawdown on loan commitments;
• Loss of liquidity from market losses;
• Assuming a two-notch downgrade of our credit ratings, the aggregate fair value of assets that we would be
required to post as additional collateral in connection with our derivative contracts;
• Legal and regulatory requirements that can restrict the flow of funds between entities in Nomura Group.
(6) Contingency Funding Plan
We have developed a detailed contingency funding plan (“CFP”) to integrate liquidity risk control into our
comprehensive risk management strategy and to enhance the quantitative aspects of our liquidity risk control
procedures. As a part of our CFP, we have developed an approach for analyzing and quantifying the impact of any
liquidity crisis. This allows us to estimate the likely impact of both Nomura specific and market-wide events; and
specifies the immediate action to be taken to mitigate any risk. The CFP lists details of key internal and external
parties to be contacted and the processes by which information is to be disseminated. This has been developed at a
legal entity level in order to capture specific cash requirements at the local level assuming that the parent company
does not have access to cash that may be trapped at a subsidiary level due to regulatory, legal or tax constraints. We
periodically test the effectiveness of our funding plans for different Nomura-specific and market-wide events. We also
have access to central banks including, but not exclusively, the Bank of Japan, which provide financing against
various types of securities. These operations are accessed in the normal course of business and are an important tool
in mitigating contingent risk from market disruptions.
3. Other Liquidity Risk Management
There are no other matters of significance to note.
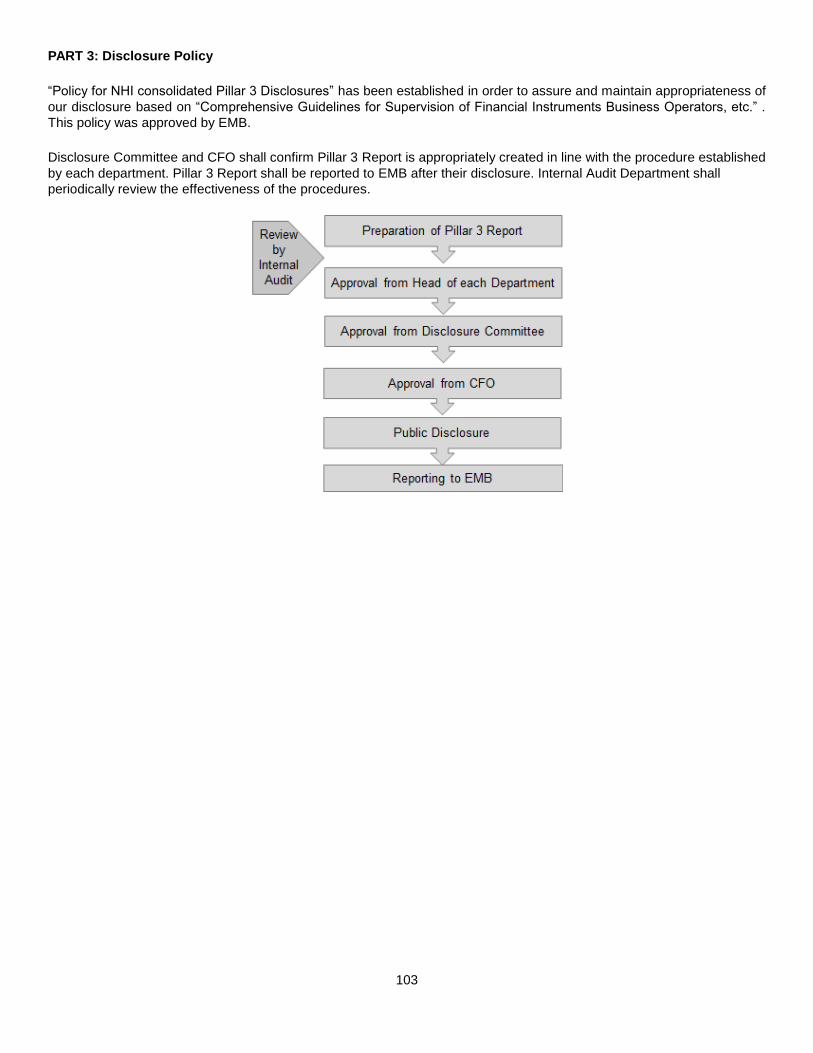
103
PART 3: Disclosure Policy
“Policy for NHI consolidated Pillar 3 Disclosures” has been established in order to assure and maintain appropriateness of
our disclosure based on “Comprehensive Guidelines for Supervision of Financial Instruments Business Operators, etc.” .
This policy was approved by EMB.
Disclosure Committee and CFO shall confirm Pillar 3 Report is appropriately created in line with the procedure established
by each department. Pillar 3 Report shall be reported to EMB after their disclosure. Internal Audit Department shall
periodically review the effectiveness of the procedures.


