Embed Size (px)
Citation preview

i
UNDERVALUING INCUMBENCY:
REGULATORY FAILURE OR REGULATORY CAPTURE
By Christo Grozev January 2013
ii
Contents
1. INTRODUCTION .......................................................................................................................... 1
2. ECONOMIC COSTS OF ORDER OF MARKET ENTRY: EMPIRICAL
EVIDENCE AND CONCEPTUAL THEORY ................ ERROR! BOOKMARK NOT DEFINED.
3. CASE STUDY: VALUATION OF DUTCH BROADCASTING SPECTRUM ......18
3.1 Background: 2003 tender ................................................................................................................. 18
3.2 New tender versus extension: policy decision 2011 ........................................................................... 20
3.3 SEO valuation model ............................................................................................................................. 22
3.4 A7 Valuation ........................................................................................................................................... 27
3.5 Empirical outcome of regulatory decisions ........................................................................................ 29
4. ECONOMIC AND LEGAL ANALYSIS OF EXTENSION OF LICENSES TO
INCUMBENTS ...............................................................................................................................................30
4.1 Abstract .................................................................................................................................................... 30
4.2 Economic analysis .................................................................................................................................. 31
4.3 Legal analysis .......................................................................................................................................... 40
4.4 Legitimate alternative approach to extension valuation .................................................................. 52
1
1. INTRODUCTION
The economic disadvantage of late market entry is significant; its structural
existence, sustainability across time, and susceptibility to quantification have been
confirmed time and again in hundreds of empirical studies spanning geographical
regions, market sectors and product taxonomies. At the same time, this source of
business “cost” traditionally has been viewed with distrust, or lack of understanding,
by adjudicators in tort disputes over economic losses--especially in Europe, where
courts and arbitrators are traditionally more conservative, lest their judgment
overspills into that characteristically American judicial instrument, the punitive
damage. This author’s review of available court records in the Netherlands, Germany,
Austria and France has uncovered not one verdict which honored a plaintiff’s
arguments for quantifiable damage caused by the delayed market entry. In fact,
econometric forensic analysis – effectively the only route to quantifying delayed-entry
damages – is rarely applied, or accepted as evidence, in European tort litigation. As
observed by Martinez-Granado and Siotis in their seminal 2006 study of damages
suffered by a telecoms operator prevented from entering the Spanish market1,
“In Europe, the use of rigorous forensic economic analysis in competition cases
is both new and rare […] To the best of our knowledge, only the EU Commission
1 “Sabotaging entry: an estimation of damages in the directory enquiry service market,” Maite Martinez-
Granado‡and Georges Sioti; 2006
2
and a few Member States (the UK among them) have accepted (or requested)
econometric analyses in competition cases.”
The European Commission itself recognizes the difficulty in substantiating
economic losses caused by exclusionary market or regulatory behavior. In its White
paper on damages actions for breach of the EC antitrust rules {SEC (2008), the
Commission notes that:
“This calculation [of the quantum of damages from exclusionary market
behavior], implying a comparison with the economic situation of the victim in
the hypothetical scenario of a competitive market, is often a very cumbersome
exercise. It can become excessively difficult or even practically impossible, if
the idea that the exact amount of the harm suffered must always be precisely
calculated is strictly applied.”
To facilitate the calculation of damages the Commission points to the need “to draw
up a framework with pragmatic, non-binding guidance for quantification of
damages in antitrust cases, e.g. by means of approximate methods of calculation or
simplified rules on estimating the loss”
The implications of the cost of delayed market entry, in the broadest sense of this
term, are most apparent in the area of determination of damages in antitrust cases, as
well as state liability and other tort cases where a party suffers economic losses due to
the exclusionary or unlawful regulatory behavior of another party. Clearly, in these
cases, the omission or incomplete determination of this cost component would lead to
3
underassessment of the total damage suffered, and in return create conditions for
recidivism and perpetuation of the unlawful market or regulator’s conduct.
The implications of the lack of conceptual understanding on this topic go much
farther than the potential for under-compensation in damage award arbitration.
Failure to understand the systemic nature of “cost of late entry,” and conversely, of the
“premium of early entry” has also far-reaching policy implications in another context
– in valuations of scarce resources, which governments allocate to parties through
tenders, comparative competitive procedures or via direct negotiation. Failure to
understand and capture, in valuation, this cost – respectively, premium--may result in
significant underpricing of resources – when (re-)allocating a resource to an
incumbent, for instance; and conversely – in significant overpricing; when empirical
data from incumbents’ economic performance is applied to resource valuations
imposed on new entrants. Such valuation failures tend to lead to allocation decisions
that distort market competition by creating entry barriers to new market entrants, or
by granting effective “state aid” to incumbents. In both cases, failures of this type lead
to inefficient use of scarce resources; a consequence that is both economically
undesirable and, in certain cases (such as in allocation of telecommunications
spectrum), contrary to special legal imperatives2.
2 The Framework Directive, as well as the other directives of the Telecommunications Package of the
European Parliament, impose an obligation on national governments to ensure efficient usage of telecommunications spectrum.
4
Given the vast empirical data substantiating the relationship between timing and
sequence of market entry, on one hand, and long-term economic performance, on the
other, it is surprising that courts, arbitrators3 and market regulators in Europe have
failed to acknowledge this factor in dispute resolutions and in scarce-resource
valuations. A likely cause to this failure is the abstract nature of the empirical findings,
which are based on aggregated empirical data from different geographies, from
(potentially) different market segments, and subject to (seemingly) other market forces
and relationships. As an example, in arguing against the inclusion of “delayed-entry”
costs in the computation of economic damage to a market participant in 2008, the
Dutch Ministry of Economic Affairs asserted that “the empirical research and
corresponding regression analysis put forward [by the claimant], which purports to
prove and quantify the impact of delayed entry, is based on data from foreign
markets and other industries and therefore cannot be used in the case at hand4.” Along
the same lines, Dutch courts have discarded claims for damages based on the abstract
computation of cost of delay as “speculative5.”
Clearly therefore, arbitrators and regulators are not easily convinced by the
overwhelming consensus among researchers of the systemic, predictable, market-
agnostic, yet quantifiable economic effects of delayed market entry. Absent a
normative rule-book for computation of damages in competitive foreclosure cases,
3 Arbitrators are used herein in the sense not only of extrajudicial arbitration tribunals, but also of dispute
resolution agencies, such as competition boards, anti-trust regulators and the like. 4 Position paper of the Dutch Ministry of Economic Affairs in negotiations over damage award for delayed
licensing award to RadioCorp BV; 2008 5 Verdict in case BJ5924, Zutphen regional court, 2007
5
such as the one the European Commission is currently pondering, it is likely that
claimants will need to resort to case-specific, in-context substantiation and
quantification of any claimed components of economic losses or gains caused by time
of entry. The fact that the burden of proof and quantification lies with the claimant
makes this task all the more formidable.
The impact of late entry would appear to be less prone to misunderstanding in cases
of regulator-side resource pricing, simply because regulators tend to resort to expert
advice by third-party professionals with sufficient knowledge in economics and
econometrics. However, failure of government regulators to grasp, on a conceptual
level, the market dynamics and specifically, the economics of order-of-entry and time-
of-entry into a market, inevitably results in perfunctory or incorrect application of such
third-party expertise. This trend may be compounded by regulator’s desire to maximize
revenues from resource allocation, especially where this may lead to political or career
gains. From a more pessimistic perspective, such failures may be non-apparent
instances of regulatory capture. One version thereof may be by regulators being
induced to consciously meander around the issue the value of incumbency in resource-
pricing to large, incumbent firms, or to overprice scarce resources for new entrants to
an extent where the regulator substitutes the proverbial monopolist in market-
exclusionary pricing practices. Another version may be regulators committing the same
market crimes unconsciously, by being motivated to not spend time and effort
understanding the value of incumbency and the cost of late entry.
6
Thus, as in the case with damage litigation, the burden of proof of erroneous
valuation rests with the disadvantaged party – be that a disadvantaged incumbent or
precluded entrant.
The remainder of this paper reviews a specific case in which the failure of a regulator
to understand (or recognize) the economics of order of entry in the radio broadcasting
market led to an improper application of an otherwise sophisticated econometric
model for resource valuation. This in turn resulted in a king-maker intervention by the
regulator, which, through value redistribution among market players, changed the
dynamics of a market in a way that, this author believes, is not permissible under EU
or national legislation. It also resulted in an excessively high reserve price for additional
spectrum offered in a tender procedure, which in turn led to failure to allocate it
altogether and, inevitably, to failure in government policy in relation to efficient usage
of scarce resources. Again, from a more pessimistic stance, these failures may be a
symptom of regulatory capture, given that the net benefit of these regulatory decisions
has been in favor of the largest incumbent firms with most extensive lobbying practices.
The case is based on the Dutch government’s decision to extend all radio
broadcasting licenses, which were set to expire in 2011, for a period of six additional
years. While the extension was desirable for political and social goals and generally
permissible under European and local legislation, extending the licenses could be
interpreted as (forbidden) state aid to the incumbents unless they were charged an
appropriate amount to offset the “aid” they were receiving. Therefore the Dutch
government commissioned a third party to produce a valuation of the fees that were to
7
be imposed on the incumbents, who accepted the extension in return for payments of
such fees. The government proceeded to use the same license valuation model also as
a basis for setting a reserve price for auctioning the only remaining unoccupied
frequency, without consideration for the mature market of incumbents in which the
newcomer was expected to enter. As a result, no applicants were willing to bid on top
of this reserved price, and the government refused to allocate the frequency to the only
candidate who was willing to pay a price lower than the set reserve price. In
consequence, the government has failed to allocate this national frequency for more
than a year.
The rest of this paper is structured as follows. The next chapter presents the
conceptual framework and empirical data substantiating the correlation between order
of market entry in and market share.
The following chapter presents the key facts of the Dutch case, including the (two)
regulatory tasks facing the regulator, and the relevant regulatory and legislative
framework. The second part of this chapter presents, directionally, the general
implications of the theory and empirical data on order of entry and market share, on
the current case.
The subsequent chapter presents the approach undertaken by the Dutch
government to address the regulatory tasks.
8
The following chapter addresses the methodological errors, committed by the Dutch
government in addressing the regulatory task, which resulted in inefficient use of
scarce resources.
The last chapter presents a correct, feasible method of valuation of the scarce
resource, and compares the outcomes of the incorrect and correct application of
empirical market data. This chapter also addresses the plausible market impact of the
regulatory failure.
9
2. ECONOMIC COSTS OF ORDER OF MARKET ENTRY: EMPIRICAL
EVIDENCE AND CONCEPTUAL THEORY
The systemic reduced capability of a late-comer to build market share (both short-
term and long-term), relative to an early entrant, is a market phenomenon which has
been widely acknowledged in economics and marketing literature and confirmed by
extensive empirical research, which has proven definitively and quantifiably the
advantages, ceteris paribus, of pioneers and early movers in a given market over late
entrants. Researchers into the relationship between market share and order of entry
have converged onto three generalizations, summarized by Kalanaryam, Robinson and
Urban in 1995.
The first generalization is that there is a negative relationship between order of
entry and long-term market share, both in the markets for consumer and industrial
products (Robinson and Fornell 19856; Robinson 19887; Parry and Bass 19908; Kerin
et al. 19929; Urban et al. 198610; Kalynaram and Urban 199211; Golder and Tellis 199312;
6 William T. Robinson; Claes Fornell, “Sources of Market Pioneer Advantages in Consumer Goods
Industries”, Journal of Marketing Research, Vol. 22, No. 3. (Aug., 1985), pp. 305-317 7 William T. Robinson, “Sources of Market Pioneer Advantages: The Case of Industrial Goods Industries”,
Journal of Marketing Research, Vol. 25, No. 1. (Feb., 1988), pp. 87-94 8 Parry, M. and F. M. Bass. "When to Lead or Follow? It Depends," Marketing Letters. 1 (November 1990), pp.
187-198. 9 Kerin. R. A., P. R. Varadarajan and R. A. Peterson, "First-Mover Advantage: A Synthesis. Conceptual
Framework and Research Propositions." Journal yf .llarkering. 56 (October 1992), pp 33-52. 10 Urban. G. L., T. Carter, S. Gaskin, and Z. Mucha, "Market Share Rewards to Pioneering Brands: An
Empirical Analysis and Strategic Implications", Marketing Science, 32 (June 1986), pp 645-659. 11 Kalyanaram, G. and G. L. Urban, "Dynamic Effects of the Order of Entry on Market Share. Trial Penetration, and Repeat Purchases for Frequently Purchased Consumer Goods," Marketing Science. I I (Summer 1992). 235-250 12 Colder. P. N. and G. J. Tellis , "Pioneer Advantage: Marketing Logic or Marketing Legend?', Journal of Marketing Research, 30 (May 1993). 158- 170
10
Kalyanaram and Wittink 199413; Berndt et al. 199414; Brown and Lattin 199415; Huff
and Robinson 199416; Glazer 198517; Lieberman 198918; Sullivan 199219; Mitchell 1991).
Later empirical studies have confirmed this generalization, both for consumer and
industrial goods (VanderWerf and Mahon 1997 20 ; Lieberman and Montgomery,
199821), and for services (Tufano 198922; Makadok 199823; Lopez and Roberts, 200224,
Fernandez and Belen Usero 200625).
The theoretical support for this empirical generalization is multi-faceted, intuitive
and plausible. Marketing science predicts that sustainable pioneer advantages arise at
nearly every level of a company’s operation, and are both endogenous and exogenous.
At the consumer level, theory assumes that pioneer’s products tend to shape
consumer tastes and preferences in their favor, a phenomenon termed protypicality by
13 Kalyanaram and D. R. Wittink, "Heterogeneity in Entry Effects Between Nondurable Consumer Product
Categories," International Journal ofResearch in Marketing, 1994 14 Berndt. E.. L. T. Bui, D. H. Reiley, and G. L. Urban, "The Roles of Marketing. Product Quality. and Price Competition in the Growth and Composition of the U.S Anti-Ulcer Drug Industry," Working Paper # 19-94 (May 1994), Sloan School, MIT 15 Brown. C. L. and J. M. Lattin. "Investigating the Relationship Between Time in the Market and Pioneering Advantage,"Management Science 40 (October 1994). I36 1- 1369 16 Huff. L. C. and W. T. Robinson , "The Impact of Leadtime and Years of Competitive Rivalry on PioneerMarket Share Advantages." Management Science. 40 (October 1994). 1370-1377 17 Glazer. A., "The Advantages of Being First," American Economic Review 75 (June 1985). 473-480. 18 Lieberman. M. B., "The Learning Curve. Technology Barriers to Entry. and Competitive Survival in the Chemical Processing Industries," Strategic Management Journal, 10 (September-October 1989), 431-447 19 Sullivan. M. W., "Brand Extensions: When to Use Them." Management Science 38 (June 1992). 793-806 20 VanderWerf, Pieter A. and John F. Mahon “Meta-Analysis of the Impact of Research Methods on Findings of
First Mover Advantage,” Management Science, 43 (Nov 1997), 1510-9. 21 Lieberman, Marvin B. and David B. Montgomery, "First Mover (Dis)Advantages: Retrospective and Link with the Resource Based View,” Strategic Management Journal, 19 (December 1998), 1111-25. 22 Tufano, P., “Financial innovation and first mover advantages”, Journal of Financial Economics 25 (1989):213-
240. 23 Makadok, Richard, “Can First-Mover and Early-Mover Advantages Be Sustained in an Industry with Low
Barriers to Entry/Imitation?”, Strategic Management Journal, 19 (7, 1998): 683-696 24 López LE, Roberts EB. “First-mover advantages in regimes of weal appropriability: the case of financial services innovations”,. J Bus Res 2002;55:997-1005. 25 Fernández Z, Usero B. “The erosion of pioneer advantage in the European mobile telecommunications industry.” Serv Bus 2007;1:195–210.
11
Carpenter and Nakamoto (1989)26. In addition, consumer risk aversion is assumed to
entrench the early entrant’s products with the consumers (Schmalensee, 1982 27 ),
similarly to the effects of consumer learning (Kardes and Kalyanaram, 1992 28 ).
Furthermore, it can be logically expected that the expected incremental benefit from a
new brand or service declines as the number of brands increases (Hauser and
Wernerfelt, 199029), and that the opportunity to serve unmet consumer needs declines
as the number of brands increases (Prescott and Visscher 197730).
The two mechanisms through which these theoretical predictions are transformed
into higher market share are (a) through higher initial trial rate and (b) through a
higher rate of repeat purchase/usage.
(a) Trial rate is higher for pioneers: Schmalensee (1982) argues that even for identical
products, the risk of an unfavorable experience motivates rational consumers to
continue buying the pioneering brand. Along similar lines, Hauser and Wernerfelt
(1990) state that, "if two brands enter the market with the same distribution of
perceived utility, the brand that enters earlier will be considered more often. If it
is considered more often, it should have a higher market share.” Kardes et al.
(1993) also find that pioneers are included more often in the consideration set by
26 Carpenter, Gregory S., and Kent Nakamoto, “Consumer Preference Formation and Pioneering Advantage,”
Journal of Marketing Research, 26, 3 (August 1989), 285-298 27 Schmalensee. R. "Product Differentiation Advantages of Pioneering Brands," Amerlcan Economic
Review 72 (June 1982). 349-365. 28 Kardes. F. R. and G. Kalyanaram (1992). "Order-of-Entry Effects on Consumer Memon and Judgment: An Information Integration Perspective," Journal of Marketing Research, 29 (August 1992). 343-357. 29 Hauser. J. R. and B. Wernerfelt, "An Evaluation Cost Model of Consideration Sets," Journal of Consumer
Research. 16 (March 1990). 393-408 30 Prescott. E. C. and M. Visscher . "Sequential Location Among Firms with Foresight," Bell Jolrrnal of Economlcs, 8, 1977, 378-393.
12
consumers. All of these forces should lead to greater consumer trial for pioneering
brands.
(b) Repeat purchase/usage is also higher for pioneering brands. One reason is that
consumers learn more about pioneering brands because of their longer time on the
market. Kardes and Kalyanaram (1992) conclude, "The learning advantage
conferred to the pioneering brand translates into more extreme and confidently
held judgments of the pioneer. Judgments held with conviction are persistent over
time and resistant to competitors' activities. Together, these judgmental processes
lead to long-run pioneering advantage" (p. 356)”
In distribution channels, pioneers are also likely to establish long-term advantages
through intensive distribution (Porter, 197431) and to dominate scarce retail shelf space
(White, 1983)32. Distribution channels in this context must be interpreted broadly as
any instruments of leverage over exposure to the end consumer; be those the traditional
physical distribution mechanisms (retail shelf space), media of distribution of
information goods (mobile spectrum, broadcasting frequencies, broadband spectrum),
or other gate-keeper capacity (such as agreements with media-buying agencies, in the
case of advertising businesses that do not sell their space directly to end consumers).
At the firm level, economies of scale and experience advantages are assumed for market
pioneers (Schere and Ross, 1990 33 ). Furthermore, Prescott and Visscher (1977) 34
31 Porter, M. E., "Consumer Behavior, Retailer Power. and Market Performance in Consumer Goods Industries." Review of Economics and Statistics, 56, 1074. 419-436 32 White. A. P., “The Dominant Firm – A Study of Market Power”, Ann Arbor.,1983. MI: UMI Research Press 33 Scherer. F. M and D. Ross , “Industrial Markets Structure and Econonlic Performance, (third Ed.. 1990),
Boston:Houghton Mifflin. 34 Prescott. E. C. and M. Visscher, "Sequential Location Among Firms with Foresight," Bell Jolrrnal of Economlcs, 8, 1977, 378-393.
13
theorize that early entrants have the option to develop a broad product line, whereas
later entrants are frequently forced to enter a market niche with a narrow product line.
Furthermore, it can be theorized that in markets which require specialized and thus
scarce human resources (specialized management skills, knowledge, talent, etc), early
entrants may be able to preempt later entrants from access to the necessary skill- or
talent-set.
The secondly generalization is that there exists a quantifiable relationship
between a market entrant’s market share and the pioneer’s market share. According to
regression results on cross-sectional empirical data, the entrant’s forecasted market
share divided by the first entrant’s market share broadly equals one divided by the
square root of the order of market entry, or expressed differently, MSi = MS1/��√� ,
where MSi is the market share of the ith entrant and MS1 is the market share of the first
entrant in that specific market. This relationship was originally derived through
regression analysis of data for markets of packaged consumer goods; but has since been
replicated, broadly to the same regression results, in many different single-sided
markets, including services markets and industrial-goods markets.35
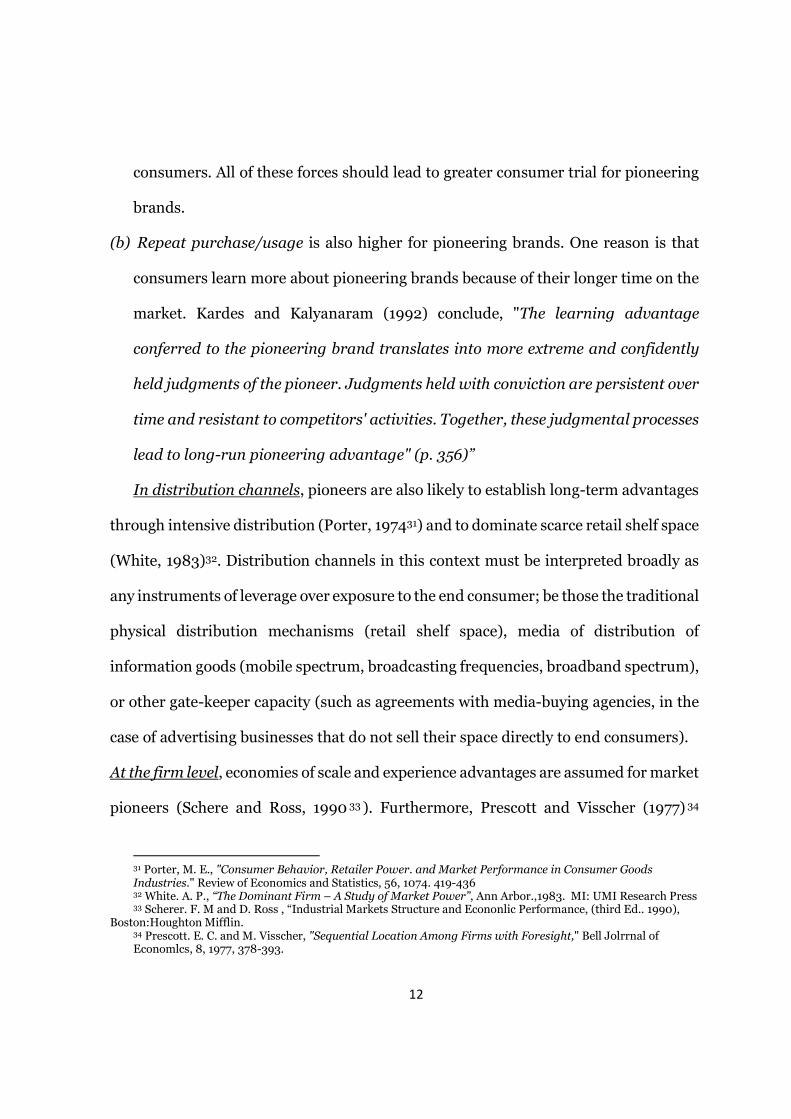
The following table, from Urban et al’s 1986’s cross-sectional meta-study involving
136 firms in 34 market sectors, exemplifies the long-term market-share expectations
for markets for consumer goods with sequential entry of up to six competitors.
35 Single-sided markets denote markets in which there is a single relationship between business and
consumer; different from two-sided markets, such as advertising based businesses that leverage one market (share) into another.
14
Table 1: Order of entry and market share for consumer products
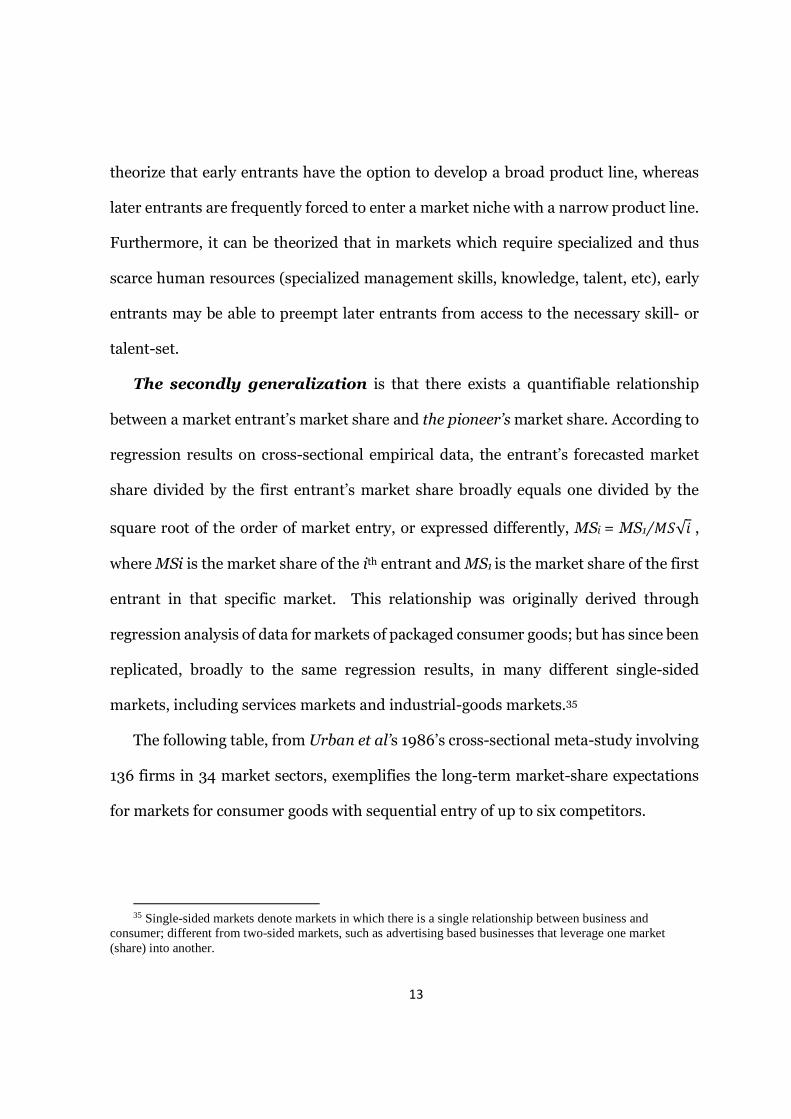
Comparative empirical studies by Robinson and Fornell (1985) and Robinson
(1988) find that markets for industrial goods conform, directionally, to the same trend,
albeit with slightly higher expected market shares for the later entrants than in
consumer goods markets (see Table 2).
Table 2: Order of entry in consumer and industrial goods markets
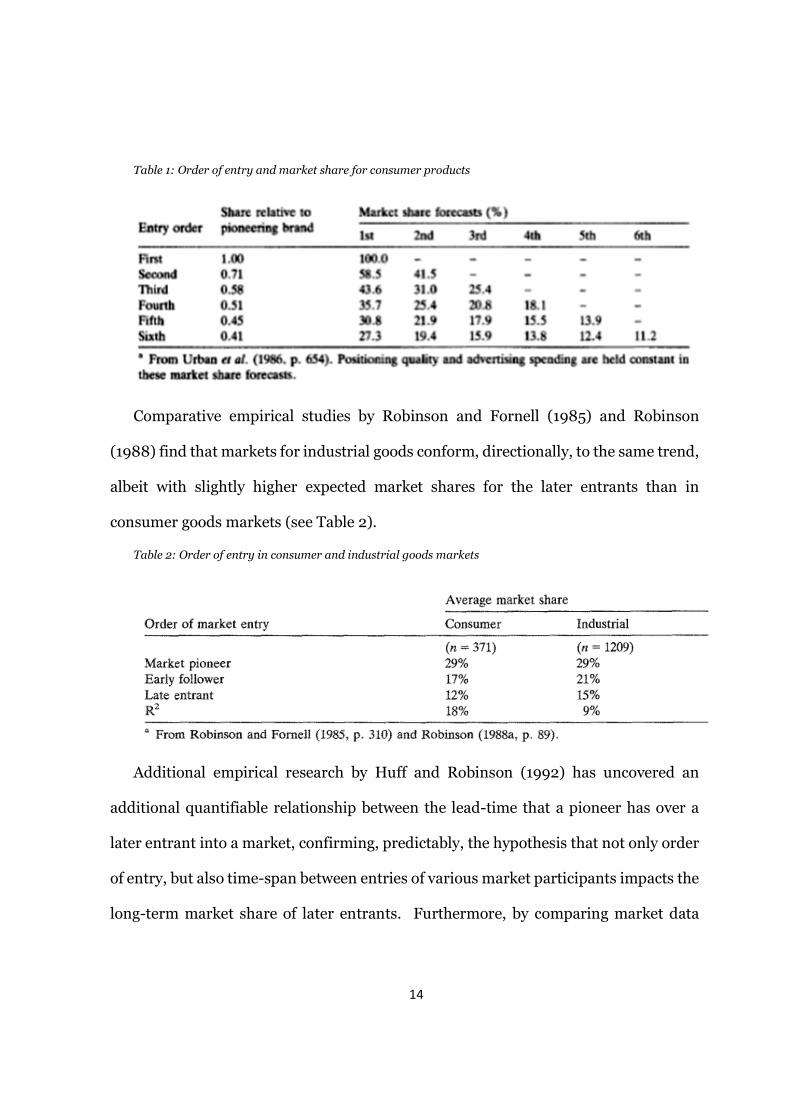
Additional empirical research by Huff and Robinson (1992) has uncovered an
additional quantifiable relationship between the lead-time that a pioneer has over a
later entrant into a market, confirming, predictably, the hypothesis that not only order
of entry, but also time-span between entries of various market participants impacts the
long-term market share of later entrants. Furthermore, by comparing market data
15
from several decades, Huff and Robinson have uncovered an accelerating trend of the
relationship bethuween delay and market-share penalty, explainable by the ever
shorter time that a product needs to reach its potential customers with its marketing
message (see Table 3).
Table 3: Change of pioneer lead time premium over time
While no theory can be specifically invoked to explain the square root phenomenon,
theory generally predicts a diminishing marginal impact for late entrants, which is
directionally consistent with the square root functional form (Kalyanaram, Robinson
and Urban, 199536). As the number of brands proliferate in a market, it becomes
increasingly difficult for a new brand to enter a consumer’s consideration set, as the
36 Kalyanaram, Gurumurthy, William T. Robinson, and Glen L. Urban (1995), “Order of
Entry: Established Empirical Generalizations, Emerging Empirical Generalizations, and
Future Research”, Marketing Science, 14,, 1995, G212-G221.
16
expected incremental benefits decline (Hauser and Wernerfelt, 1990). Further to the
decline in subjective “expectation of benefits” from new brands, the objective
opportunity to serve an unmet consumer need also declines as the number of brands
increases (Prescott and Visscher, 1977). Even with a broad product line usurped by the
pioneer, the second and third entrant often succeed in capturing the obvious niches,
while the subsequent entrants have to seek niches amongst the niches, thus leading to
ever diminishing returns in market share.
The third generalization is that in mature markets, pioneer market share
advantages decline slowly over time. Empirical evidence suggests that early market
share advantages are sustainable in the long term and “span decades” (Kalyanaram,
1994); however, these advantages decline slowly over time. This empirical result is
observed in consumer-goods markets at a significant statistical level by Brown and
Lattin (1994), Huff and Robinson (1994) and Robinson and Fornell (1985), as well as
for industrial goods (Robinson 1988). By way of example, Brown and Lattin (1994)
predict that in a three-player consumer-good market of 25 years, the pioneer would
have a 43% market share, the second entrant a 32% share, and the third entrant a 25%
share. As the market approaches infinity, these shares would converge somewhat, but
not fully, to 36%, 33% and 31% respectively. Similar findings, directionally, are
produced by a study of European mobile telephone operators in the 1995-2005 period
(Fernandez and Usero, 2006).
The theoretical substantiation of this observation can be derived, on one hand, from
theories relating to dominant and/or “old” firms. Scherer and Ross (1990) theorize
17
that after a given market share has been accumulated, it becomes more profitable for a
firm to slowly “sell off” a portion of its market share than to expend resources on
keeping every individual customer it has had. Per Geroski (1989), “dominant firms
decline when they become sleepy and thus vulerable” to innovative, sudden or simply
reckless competitive behavior of challengers. On the other hand, it can be theorized
that as later entrants reach profitable operation and potentially high profit margins,
they are more incentivized than early entrants to spend aggressively on marketing
namely in order to offset their structural late-entry disadvantage. With the passage of
time consistent marketing overspending is likely to minimize the impact of the package
of pioneering advantages.
In addition to the three generalizations, other researchers have observed
higher survival rate for pioneers than for early followers (Robinson and Min, 2002)37
and a negative relationship between the stages of entry by product life cycle and
survival rate (Agarwal and Gort, 1996, 1997)38. In addition, a meta-study by Mallik and
Sudharshtan (2002) 39 finds that market shares follow a stable Zipf-law form
distribution as a function of rank of entry into the market. This finding however does
not contradict materially the second generalization, but rather makes a further
generalization of that very generalization.
37 Robinson, William T and Sungwook Min, “Is the first to market the first to fail? Empirical evidence for
industrial goods businesses,” 2002, Journal of Marketing 38 Agarwal, R., and M. Gort, “The evolution of markets and entry, exit and survival of firms”, The Review of
Economics and Statistics, 78 (3), 1996, 489-498. 39 Riemer H Mallik S and Sudharshan D .2002. “Market Shares follow a Zipf Distribution”
http://www.business.illinois.edu/research/020125paper.pdf
18
Substantially, and certainly directionally, therefore, there appears to be consensus
among researchers in relation to a statistically significant and quantifiable relationship
between order and timing of entry into a market, and market share. The dissenting
scientific opinions have typically drawn attention to possible exaggeration of the effects
observed in the empirical data due to potential survival bias; however there does not
seem to be any body of research literature that purports to prove the null hypothesis on
this issue.
3. CASE STUDY: VALUATION OF DUTCH BROADCASTING
SPECTRUM
3.1 Background: 2003 tender
On July 1st 2003, the Dutch government re-distributed the radio broadcasting
spectrum across the Netherlands in what was termed officially “the zero-base radio
project.” It involved a completely new national plan of frequencies allocated to
commercial broadcasters, coupled with revocation of all existing radio licenses (which
had since expired and had been extended for temporary periods until the zero-base
redistribution). As a result of this major reshuffle, nine new national radio stations
were licensed for a license period of eight years, with no provision for automatic
renewal upon the expiration of such term.
Four of the national licenses were earmarked for “restriction-free” programming,
allowing their recipients to broadcast any possible mix of programming, subject to
general media and advertising laws only. These four licenses were allocated through a
closed, single-round auction. Applicants were invited to bid for the respective license,
19
having the knowledge of an additional, fixed, one-time fee that they would have to pay
upon receipt of the license.
The remaining five licenses were earmarked for specific content, including news,
serious music, Dutch-language music, alternative music, and old music. The procedure
through which these five licenses were allocated included both a financial auction of
the type described above, and a “beauty” contest based on content commitments. The
latter criterion had priority; i.e. applications which excelled in their programming offer
would be awarded the respective licenses, and only in the case of neck-to-neck
competition in content commitments would the financial bid be used as a tie-breaker.
The one-time financial fee, which de facto served as a reserve price in the auction,
was computed as a percentage (7.5%) of the cumulative net revenues that each license
was expected to generate over the license term, discounted to the date of the award. In
absolute numbers, the one-time fee ranged from €1,7 m to €5,5 m, depending on the
each license’s perceived earning potential.
The winning financial bids for each frequency exceeded significantly the one-time
fee (reserve price), with the bid range for the unrestricted licenses being between €30
m and €80 m. On average, the one-time fee represented approximately 10% of the
actual cumulative financial instrument, paid for each license.
The zero-base re-allocation project was accompanied by high publicity, both due to
the self-referential interest of the media in the issue, and as a result of high-profile
(unsuccessful) litigation by several incumbents trying to retain their licenses.
20
Additionally, the Dutch government funded a national direct-mail campaign
announcing the new radio landscape in the country to each and every Dutch resident.
On July 1st 2003, nine new radio stations (of which three had been incumbents
began broadcasting on the newly allocated frequency positions.
3.2 New tender versus extension: policy decision 2011
As the original license terms neared their expiration date in September 2011, the
Dutch government found itself under intensive lobbying by incumbent operators to
offer extensions to the existing license-holders, as opposed to hold new tenders open
to any party. Privately, this request was rationalized by the fact that in 2003, all parties
had overbid and, in retrospect, no incumbent had been able to recoup their investment
over the eight-year term. The 2008 financial crisis was put forward as a key exculpating
factor for the incumbents overbidding. Publicly, the argument for extension was
supported with public opinion surveys, evidencing that (predictably) audiences loved
their existing radio offerings and preferred to continue to listen to stations they knew
and liked. The Dutch government had internal pressures from bureaucrats in the
Ministry of Economy and technocrats in the Telecoms Agency to go for a new tender,
which would ensure (plausibly) higher revenues than an extension would and, from a
legal perspective, would be a bullet-proof regulatory decision. These proponents
argued that an extension was not provided for in the original licenses, and that
potential newcomers would object – and possibly litigate – in the event of extensions
that would lock up the market for incumbents only. On the other hand, the more
politically minded officials saw a new tender as a messy project, at that one that would
21
likely pitch the existing media operators against the government and induce them to
possibly transfer their lobbying efforts to over-the-air campaigning, as some stations
had done prior to the 2003 zero-base reallocation. Ultimately, the Minister of the
Economy (in charge of spectrum allocation policy) decided to outsource the decision to
a consortium of legal and economic experts, who were tasked with determining (a)
whether license term extensions were compatible with national and EU legislation and
(b) if so, under what financial terms such extensions must be offered to prevent possible
implications in unlawful state aid being offered to incumbents.
The consortium, including University of Amsterdam law professors and
econometrists from the economic consultancy SEO, produced a report that concluded
that a license extension was legally permissible, both under EU and national law, under
certain conditions. Key among them was the “avoidance of state aid” condition, which
meant that the incumbents would have to pay, as a license fee, essentially the full value
of the license; thus offsetting any aid that might be construed to have been granted. A
critical further question was, predictably, whether the “value of the license” should be
determined from the perspective of the incumbent or from that of a new operator –
clearly, these values would be significantly different. The consulting consortium
concluded that the valuation must be conducted from the perspective of an anonymous
newcomer. The logic was that the State would be granting to the incumbents a resource
of a certain value (which must be recouped via a license fee) which was equivalent to
quantum of the highest bid that an average efficient newcomer would be expected to
submit in a hypothetical auction. A different conceptual approach to valuation which
22
would lead to the same outcome was to establish the highest value, at which the
incumbents were likely to be able to sell their existing license to a newcomer. In other
words, this would represent the opportunity cost for an incumbent to dispose of the
license. The consortium also provided a full-fledged econometric model which
ascertained the corresponding values for each license.
A second key condition contained in the legal assessment by the consulting
consortium was that the market should not be fully locked up for new entry. Clearly,
licenses are tradable, and as such newcomers could enter the market through
acquisition. Conveniently, however, two of the nine national licenses – one unrestricted
and one restricted--had ended up being vacant, their operator having gone bankrupt in
2009. This lent the Government the opportunity to extend the seven active licenses to
their incumbents for an additional six year term, while addressing the “market lock-
up” issue through an allocation of the remaining two licenses through an auction, for
the same term.
The Dutch government opted to follow the advice of the consulting consortium and
published the consortium’s report (including both the legal conclusions and valuation
models) for public consultations in early 2011.
3.3 SEO valuation model
SEO, the Dutch economics and research consulting firm, produced the valuation
model for the one-time financial instruments to be paid by each of the incumbents. The
model was built around a macroeconomic projection of the radio advertising market
for a six-year period, econometrically derived market-share forecasts for each of the
23
license operators – under the explicit assumption that they would be operated by a
party other than the incumbent (i.e., a hypothetical new-comer), and econometrically
derived operating cost estimates for each license. The projected market share, as a
function of the forecasted market for each year, would result in the revenue projections
per year; and the projected revenue less the projected (cash-based) expenditures would
result in the expected pre-tax cash flows per year. Those would be then discounted for
taxation and for the time value of money, and the resulting net amounts would
constitute the (maximum) value of the licenses from the perspective of efficient
newcomers.
For the econometric computation of both market share (and thus revenues), and
operating costs, SEO had approached each incumbent in the radio market and had
gathered confidential data on revenues and costs by category for the years 2006,2007
and 2008. Based on these inputs and other publicly available data, SEO had produced
a series of highly-explanatory regression models, which identified a number of
independent variables for market share and for the key cost categories.
The regression modeling of market share had established that the key independent
variables, explaining 91% of variability in market share, were the following: (a)
technical reach as a percentage of the population covered by the license signal, (b)
number of years that a station has been active in the Dutch radio market, and (c)
whether or not the station has a programming restriction. Each of the program
restrictions had a different, negative impact on market share; however SEO did not
publish the corresponding coefficients due to confidentiality concerns. The remaining
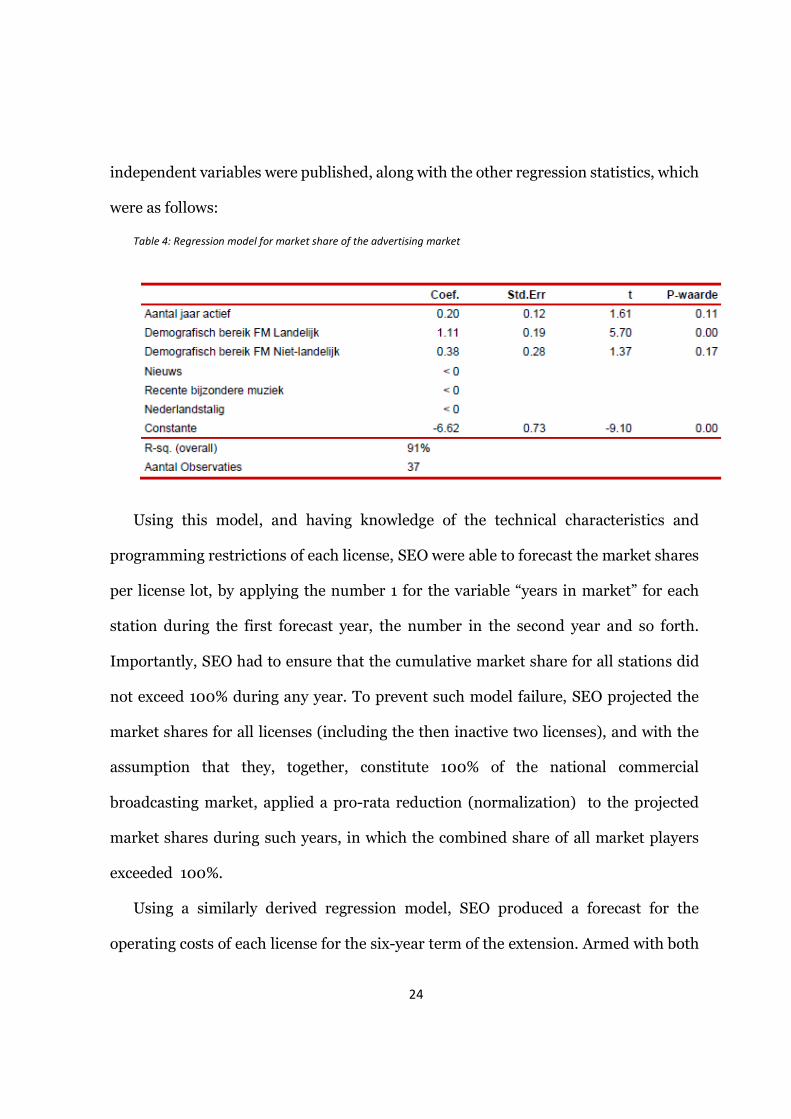
24
independent variables were published, along with the other regression statistics, which
were as follows:
Table 4: Regression model for market share of the advertising market
Using this model, and having knowledge of the technical characteristics and
programming restrictions of each license, SEO were able to forecast the market shares
per license lot, by applying the number 1 for the variable “years in market” for each
station during the first forecast year, the number in the second year and so forth.
Importantly, SEO had to ensure that the cumulative market share for all stations did
not exceed 100% during any year. To prevent such model failure, SEO projected the
market shares for all licenses (including the then inactive two licenses), and with the
assumption that they, together, constitute 100% of the national commercial
broadcasting market, applied a pro-rata reduction (normalization) to the projected
market shares during such years, in which the combined share of all market players
exceeded 100%.
Using a similarly derived regression model, SEO produced a forecast for the
operating costs of each license for the six-year term of the extension. Armed with both

25
the revenue forecasts (derived from the projected market shares multiplied by the
forecast net radio advertising market) and the cost forecast, and applying an
appropriate WACC, SEO produced and published the definitive values of each license
from the perspective of newcomers. These were as follows:
Table 5: Computed values per license (pre- and post-tax)
As can be seen from table 5, four of the five restricted-programming licenses were
assessed to have a negative (or null) value, while the remaining five licenses had values
ranging from €23m to €28 m. SEO pointed out in their report that a null value pursuant
to this model did not indicate no value to the incumbent operators who possessed
established audience shares, client bases and internalized start-up costs. It simply
meant that the licenses would have negative (or zero) value to a hypothetical newcomer
who would need to undergo all these start-up costs from scratch.
26
Similarly, SEO stated, the value of the remaining (positive-value) licenses would be
higher to the actual incumbents to which they were to be awarded through the
envisaged extensions, than to a newcomer. However, SEO maintained, the only
economically justified method of determining the intrinsic value of the scarce resource,
net of the value created by (and at the expense of) the incumbent, was to assess the
value from the perspective of a newcomer.
Following intensive lobbying by the largest incumbent radio stations and the
provision of additional confidential revenue and cost data for the period 2003-2005
(which had not been taken into account in the original SEO report), SEO revised their
regression models by to reflect the broader data set. The new regression model for
predicting advertising market shares showed that the relevance of the variable “years
active in the market” was significantly higher than originally assumed. This,
predictably, resulted in a less steep forecast revenue share (and, correspondingly,
absolute revenue) growth curve for all stations, and thus in lower valuations for all
positive-value licenses.
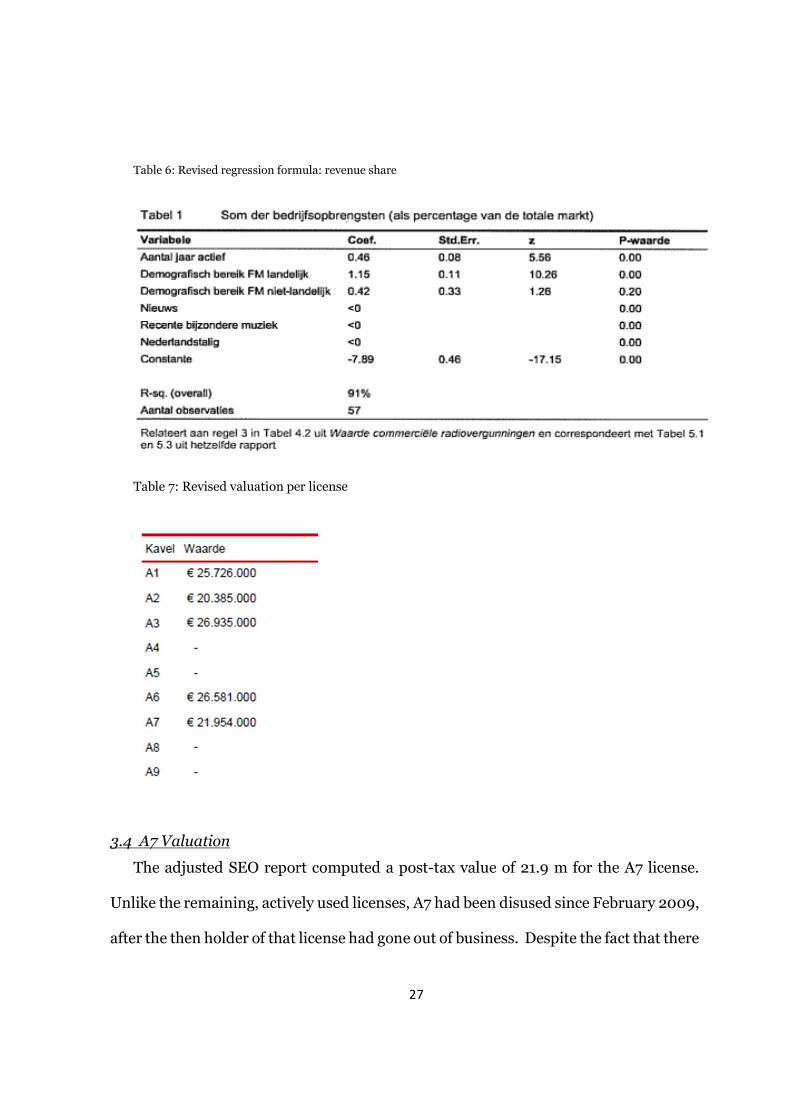
The revised regression model is presented in table 6. The revised valuations for all
national licenses are presented in table 7. The table shows that in all cases the value
was reduced for the positive-value licenses, while for the null-value ones it remained at
null.
27
Table 6: Revised regression formula: revenue share
Table 7: Revised valuation per license
3.4 A7 Valuation
The adjusted SEO report computed a post-tax value of 21.9 m for the A7 license.
Unlike the remaining, actively used licenses, A7 had been disused since February 2009,
after the then holder of that license had gone out of business. Despite the fact that there
28
could be no extension of A7 to an incumbent, the inclusion of that license in SEO’s
valuation model was necessary, as otherwise the forecast for the extended licenses
would have been based on an incomplete market – 7 versus 9 national competitors40.
The latter assumption was consistent with the expectation that as of 2011, both A7 and
A8 would be issued in new tender procedures, and thus active as of September 2011.
Failure to include A7 and A8 in the model would have resulted in inflated market share
forecasts for each of the remaining licenses, and thus possibly overcharging for the
incumbents. Furthermore, the empirical data from which the regression analysis had
been built had come from the period 2003-2008 when all nine national licenses had
been active; and thus the regression model derived from such data might not have been
robust for different market conditions with fewer players.
The Dutch government proceeded to use the valuation for A7, computed in the SEO
model, as a basis for determining the financial instrument to be paid by the successful
bidder for that license in the new tender procedure for that lot in September 2011. The
financial instrument was to be comprised of two parts – the one-time fee (set by the
Government and payable upon receipt of the license), and the financial bid, to be
offered by the applicants on top of the one-time fee. The one-time fee was to be set at
80% of the full value computed by SEO: i.e. at €17 m. The stated rationale behind this
discount was that “sufficient bidding space should be allowed on top of the one-time
fee,” in other words, the discounted one-time fee was perceived as the reserve price in
the auction, and the reserve price and the incremental bid together would represent
40 A8 was also disused since 2009, but it was a restricted (classical/jazz music) license with a negligible
audience potential with zero value, and thus is left out of the current analysis
29
the actual bid, which was expected to range anywhere between the reserve price and
the full value of €21,9 m41.
The Dutch government announced an auction for A7 in September 2011, setting
forth a requirement for a one-time license fee of €17 m and requiring a financial bid on
top of it. Furthermore, a pre-tender vetting requirement was that the applicant submits
a realistic business plan and financial forecast, evidencing their capability to exploit the
license efficiently and with a positive return during its six-year term (the latter was an
ex-lege requirement). A separate requirement set forth by the government was that
simultaneously with the application, candidates should provide a bank guarantee in the
amount of ¼ of the one-time license fee.
3.5 Empirical outcome of regulatory decisions
The decision to extend the seven active licenses at costs ranging from €0 (for three
restricted licenses) to €26 m was accepted by the incumbents, somewhat reluctantly so
by the un-restricted license-holders which were all forced to pay in excess of €20 m,
while having lobbied for even lower fees. One restricted-format incumbent, a station
with a relatively loose prescription to play “music older than 5 years,” whose license
was evaluated at €20 m, accepted the extension under protest and subsequently
litigated to have its fee reduced, a case currently in judicial proceedings.
In August 2011 the Dutch government held a tender for the A7 license with the
above-described terms. Two applicants took part, of which one was disqualified due to
41 theoretically, a higher price might also be offered; this however would mean that the applicant is more
than average efficient – for instance, has pre-existing market presence that could be leveraged into the
business case for this license
30
failure to comply with the formal pre-qualification requirements. The second applicant
made a financial bid but in its application explicitly disavowed he applicability of the
€17 m license fee, arguing that it was incorrectly computed, was based on false
economic logic, and was thus non-binding (null). In further support of this argument,
the applicant claimed that it was impossible to submit a business plan that
incorporated such license fee and at the same time complied with the requirement that
the financial result of operating the license over 6 years be positive.
The government rejected the application based on the absence of the bank
guarantee and the non-inclusion of the one-time fee into the business plan, without
considering on the merit the bidder’s arguments for the nullity of the fee regulation.
The rejected bidder appealed the rejection. The first-instance decision of the Court of
Rotterdam is pending at press-time.
In August 2012 the Government announced plans to re-auction the A7 license in
quarter four of 2012 – this time without a one-time fee, citing changed market
conditions and a shorter remaining license period. As of December 2012, no tender has
been initiated and the frequency network remains vacant.
4. Economic and legal analysis of extension of licenses to incumbents
4.1 Abstract
A key feature of the SEO model is that it determines the license extension fee on the
basis of a license (scarce resource) valuation that is agnostic of the identity of the
current license operator; of its current license fee level and programming restrictions.
31
In taking this approach, SEO achieves the stated goal of avoiding penalization of
incumbents for their empirical, firm-specific success; and thus assumes away the
subjective value of the resource. However, in so doing, the regulatory application of the
SEO model may lead to forward-looking distortion of competition, by introducing
disproportionate changes in similar circumstances, and by offering effective risk
mitigation to some operators while none (or less) is offered to others. In particular, this
valuation approach leads to increased business risk being imposed on holders of
restricted licenses, at the expense of holders of free-form ones.
Furthermore, a forward-looking DCF approach is likely to lead to actual changes of
license conditions which are larger than the objectively justified change, which may
result in a legal hypothesis of effective issuance of new licenses without the legally
required due process; as opposed to extension of existing ones.
In addition, , the “opportunity cost” approach adopted by the regulator would lead
to distortion of competition due to the fact that it would artificially assign equal
“newcomer” status to all market parties in 2011; whereas they in fact have starkly
different time-in-market backgrounds.
All of these market-interventionist effects of the terms of extension are likely to be
unlawful under EU and national legislation requiring non-discriminatory,
proportionate and non-interventionist spectrum regulation, as well as under broad
competition legal principles. More broadly, they may represent a form of regulatory
capture.
4.2 Economic analysis
32
The operator-agnostic DCF valuation model “resets” the values of all licenses as of
September 2011, reflecting their value in a hypothetical reality in which all operators
are newcomers. The theoretical framework relating to the cost of order-of-entry on
market-share predicts that such resetting would lead to structural, unavoidable cost
transfers– and thus, value--transfers between the actual market players. Market
players that have entered the market earlier will have their correspondingly lower costs
assumed away. More recent entrants will also have some of their costs assumed away,
assuming none of them will be a true newcomer in 2011; however the quantum of such
cost elimination – respectively, value subsidy – will be a function of the time in market.
Stated simply, earlier market entrants will get a higher value subsidy than more recent
entrants.
The empirical models described in the first chapter allow us to quantify, broadly,
the size of such value, or subsidy, misbalance. However, we do not need to depend on
market-agnostic empirical data to compute such misbalance. Given a large enough
time-series of market shares of radio stations in the Dutch market, we would be in a
position to regress the market-specific cost of order-of-entry onto market share, and
thus on value. In order to distill specifically the delay of entry as an explanatory
variable, we would need to identify those variables that have an exogenous impact on
market share (unrelated to time-in-market), in order to isolate their interference. To
simplify the regression model, however, a generous assumption will have to be made
that firm-quality and marketing expenditures are held constant for all periods and all
players, and thus have no (explanatory) impact on market share.
33
We had access to reliable audience-share data from public sources for 7 national
radio stations in the market for 4.5 years. In order to capture the faster dynamics of
early market share development, we chose to use semi-annual averaged market shares
as the dependent variables. Therefore the dataset amounted to 63 observations –
sufficient to produce a formula that is at the very least directionally predictive.
The next step was to identify the independent variables that were knowable for each
observation. Clearly one of the variables was the one we needed to test for significance:
rank of entry. We decided to add a second variable, which, while potentially correlated
with rank of entry, might turn out to improve the explanatory power of the regression
formula.
Other plausibly important independent variables were (a) geographical coverage of
each radio station during each time-period, expressed as a percentage of the
population, and (b) product restriction – relevant for those 5 national stations, which
could not deviate from a certain program prescription and were therefore limited to a
certain product and niche.
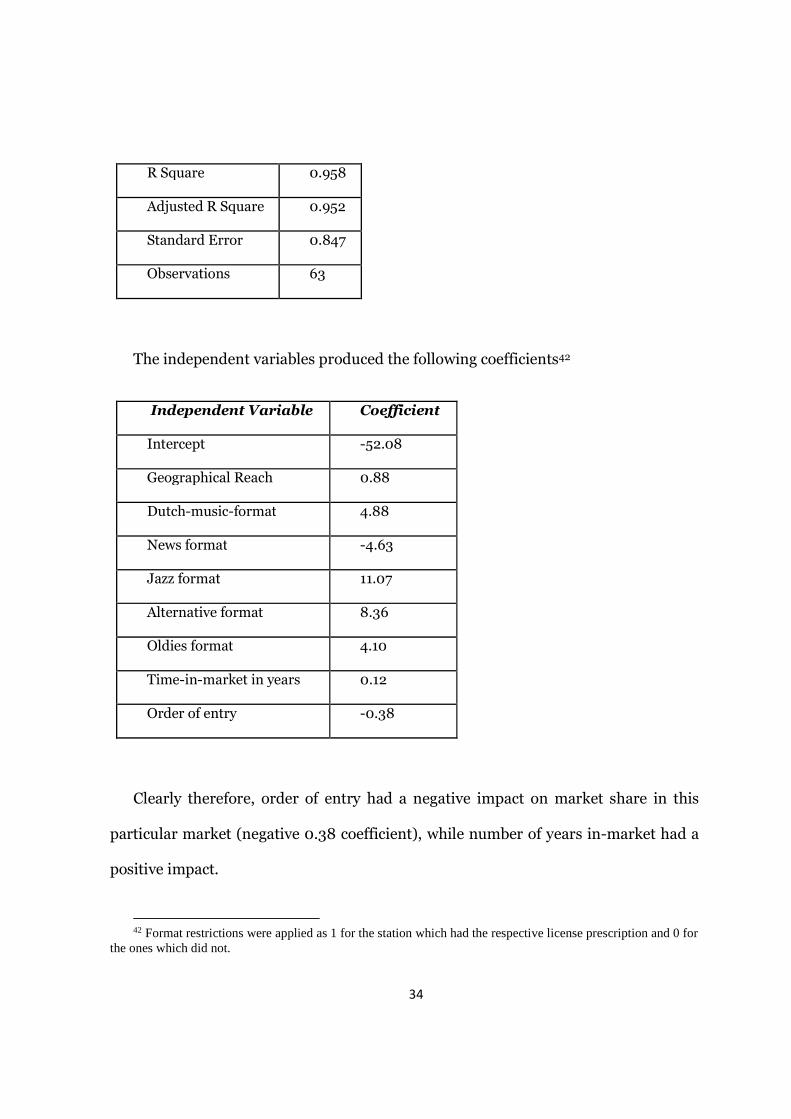
By conducting a regression analysis on these independent variables, we were able
to produce a regression model with a high explanatory power, having the following
regression statistics:
Multiple R 0.979
34
R Square 0.958
Adjusted R Square 0.952
Standard Error 0.847
Observations 63
The independent variables produced the following coefficients42
Independent Variable Coefficient
Intercept -52.08
Geographical Reach 0.88
Dutch-music-format 4.88
News format -4.63
Jazz format 11.07
Alternative format 8.36
Oldies format 4.10
Time-in-market in years 0.12
Order of entry -0.38
Clearly therefore, order of entry had a negative impact on market share in this
particular market (negative 0.38 coefficient), while number of years in-market had a
positive impact.
42 Format restrictions were applied as 1 for the station which had the respective license prescription and 0 for
the ones which did not.
35
The empirical findings in SEO’s report confirmed the same predictions for cost of
order-of-entry as the market-agnostic research studies cited in Chapter 1 and our own
regression analysis. Indeed, SEO did not isolate “order of entry” as a specific
explanatory variable, but instead captured a compound variable – number of years in
market; which combined both variables “order of entry” and “delay, in years, between
entries.” This was the result of the use of empirical data from 2003 to 2008 which
comprised both variables, expressed by the compound variable “number of years in
market.”
By applying the regression model from SEO and using two different scenarios for a
launch-year – the hypothetical and the actual one, for each market operator, we are
able to quantify, broadly43 and using a strict mutatis mutandis comparison, the value
misbalance in the two scenarios.
43 As SEO did not identify certain license-specific variables, such as the exact coefficient by which the
different license restrictions affect market shares, the model can be only be approximately reverse-engineered
by using the final values per license as published in SEO’s report. This is only possible for the “positive-value”
licenses, with a degree of +- 5%; and not feasible for the negative-value licenses.
36
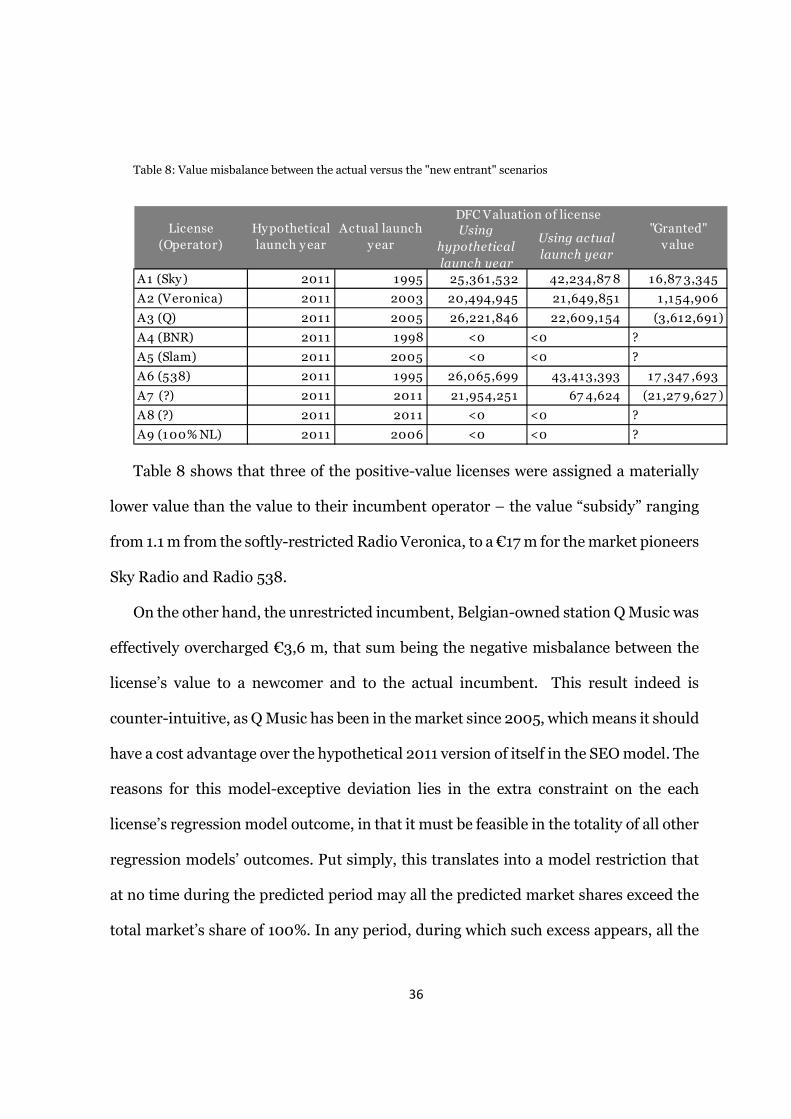
Table 8: Value misbalance between the actual versus the "new entrant" scenarios
Table 8 shows that three of the positive-value licenses were assigned a materially
lower value than the value to their incumbent operator – the value “subsidy” ranging
from 1.1 m from the softly-restricted Radio Veronica, to a €17 m for the market pioneers
Sky Radio and Radio 538.
On the other hand, the unrestricted incumbent, Belgian-owned station Q Music was
effectively overcharged €3,6 m, that sum being the negative misbalance between the
license’s value to a newcomer and to the actual incumbent. This result indeed is
counter-intuitive, as Q Music has been in the market since 2005, which means it should
have a cost advantage over the hypothetical 2011 version of itself in the SEO model. The
reasons for this model-exceptive deviation lies in the extra constraint on the each
license’s regression model outcome, in that it must be feasible in the totality of all other
regression models’ outcomes. Put simply, this translates into a model restriction that
at no time during the predicted period may all the predicted market shares exceed the
total market’s share of 100%. In any period, during which such excess appears, all the
Using
hypothetical
launch year
Using actual
launch year
A1 (Sky) 2011 1995 25,361,532 42,234,87 8 16,87 3,345
A2 (Veronica) 2011 2003 20,494,945 21 ,649,851 1 ,154,906
A3 (Q) 2011 2005 26,221,846 22,609,154 (3,612,691)
A4 (BNR) 2011 1998 <0 <0 ?
A5 (Slam) 2011 2005 <0 <0 ?
A6 (538) 2011 1995 26,065,699 43,413,393 17 ,347 ,693
A7 (?) 2011 2011 21 ,954,251 67 4,624 (21 ,27 9,627 )
A8 (?) 2011 2011 <0 <0 ?
A9 (100% NL) 2011 2006 <0 <0 ?
DFC Valuation of licenseLicense
(Operator)
Hypothetical
launch y ear
Actual launch
year
"Granted"
v alue
37
market share outcomes must be prorated down by such percentage as to comply with
the market totality of 100%. This normalization method is not only logically
indispensable, but was also explicitly identified as a necessary model step in the SEO
report.
In the case of Q Music, this constraint translated in the “dipping” of market shares
in the actual scenario, where other stations – such as Sky Radio, Radio 538 and
Veronica--had a seniority advantage over it and cornered it out of a part of its
hypothetical terminal market share, which it would have achieved in an all-newcomer
market in which no seniority advantages would have existed.
The value misbalance in the cases of the restricted, negative value licenses cannot
be precisely computed using the available coefficients from SEO’s model, but
directionally, and using Q Music as proxy, we would expect that more recent entrants
100% NL and Slam FM have a significantly lower value in the actual scenario than in
the hypothetical one.
A7 and A8 are licenses that are not operated by incumbents and thus no comparison
is possible; however A7, predictably, shows the largest divergence in values between
the “hypothetical” and “actual” scenarios, despite the fact that in both scenarios the
license would be used as of 2011. The implications of this divergence are discussed in
detail in the next sections.
This valuation comparison quantifies the very significant economic value
redistribution between market players that was the consequence of the application of
SEO’s model by the Dutch government for determining the license extension one-time
38
fees. It shows that by focusing on the (legitimate) goal to solve one economic and legal
problem – to isolate the subjective from the objective value of the license, respectively
to preclude penalization of incumbents for their prior strategy – the regulator
committed a serious market intervention, and granted effective subsidies to some
players at the expense of lesser ones – or in some cases, of taking value – from others.
In the null hypothesis for existence of regulatory capture, this market-distorting
regulatory policy may be explained by a lack of understanding of the economics behind
the cost/value implications of order-of-entry, as well as poor conceptual understanding
of the necessity to value a resource in the totality of a market, as opposed to in abstract,
market-agnostic isolation such as the one proposed in SEO’s report.
However, given the direction of the effective value transfers – away from smaller,
more recent and foreign-owned market-participants, and in favor of larger, older and
local players, there seems to be empirical evidence to suggest at least a plausible case
of regulatory capture.
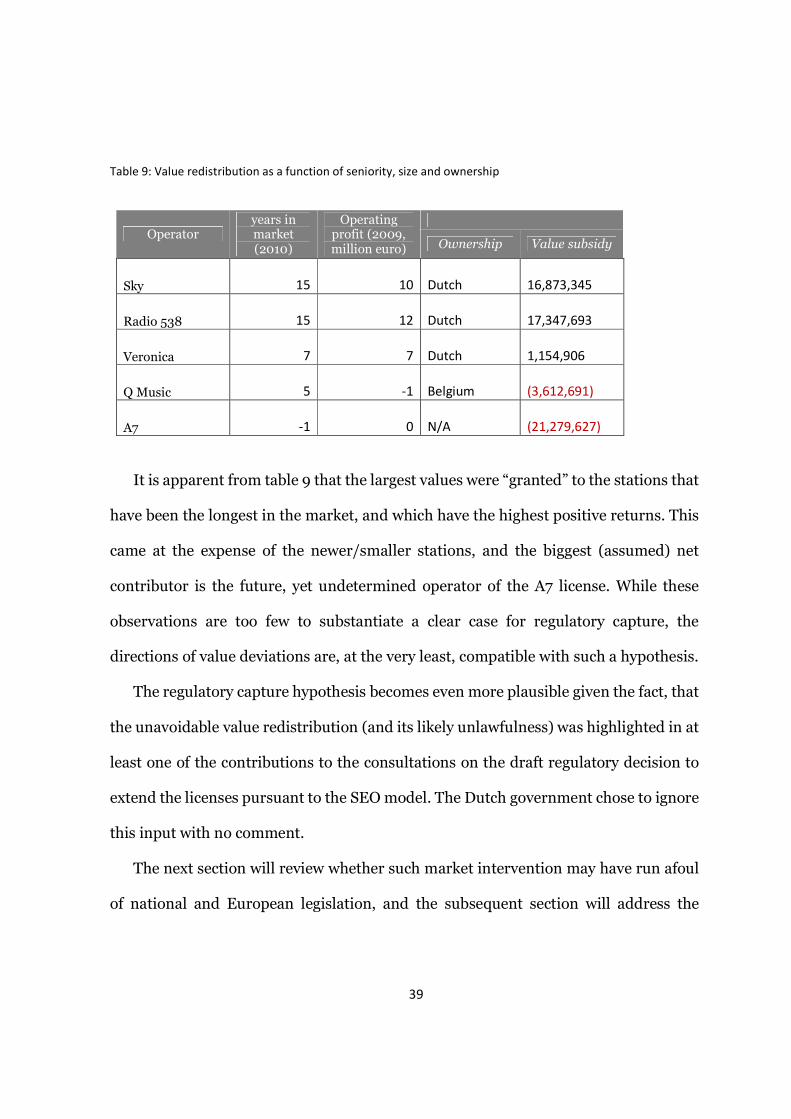
Table 9 lists the value-redistribution for the positive-value licenses, along with
time-in market, profitability and ownership data for the period immediately preceding
the license extensions.
39
Table 9: Value redistribution as a function of seniority, size and ownership
Operator years in market (2010)
Operating profit (2009, million euro)
Ownership Value subsidy
Sky 15 10 Dutch
16,873,345
Radio 538 15 12 Dutch
17,347,693
Veronica 7 7 Dutch
1,154,906
Q Music 5 -1 Belgium
(3,612,691)
A7 -1 0 N/A
(21,279,627)
It is apparent from table 9 that the largest values were “granted” to the stations that
have been the longest in the market, and which have the highest positive returns. This
came at the expense of the newer/smaller stations, and the biggest (assumed) net
contributor is the future, yet undetermined operator of the A7 license. While these
observations are too few to substantiate a clear case for regulatory capture, the
directions of value deviations are, at the very least, compatible with such a hypothesis.
The regulatory capture hypothesis becomes even more plausible given the fact, that
the unavoidable value redistribution (and its likely unlawfulness) was highlighted in at
least one of the contributions to the consultations on the draft regulatory decision to
extend the licenses pursuant to the SEO model. The Dutch government chose to ignore
this input with no comment.
The next section will review whether such market intervention may have run afoul
of national and European legislation, and the subsequent section will address the
40
question of what alternative valuation scenarios could have produced better results for
the extension-valuation regulatory task.
4.3 Legal analysis
4.3.1 Legal framework in relation to granting of licenses
1. The award of radio-broadcasting licenses must be made in accordance to art. 3.3
(4) of the Dutch Telecommunications law (Tw):
“The awarding of licenses in other than the foreseen in the second article cases
may occur:
(a) on a first–come, first-serve basis based in order of application
(b) by means of a comparative test, with or without the use of a financial bid;
(c) by means of an auction
2. Extension of licenses is permitted in accordance with art 3.3 (11) Tw:
“The license must be awarded for a specific term, to be set in the license. The license
may be extended by a term to be determined by Our Minister”
On the fees payable for the use of licenses
3. Article 3.3a of the Tw establishes the possibility for the State to charge a one-
time or periodic amount for the use of frequency space for commercial broadcasting,
exclusively “…with a goal to warrant optimal use of frequency space”
Alinea 2 of Art. 3.3a defines the possible methods of establishing such charge: either
through a DCF model based on the expected turnover or projected cash-flows,
estimated ex-ante during the year of the license award (or extension), or through the
periodic charge of a percentage of the cash-flows (or turnover) during the period of
41
exploitation of the license. In any event, the fee must be related to the expected benefits
(voordelen) of exploitation of the license.
Alinea 3 of art. 3.3a allows the State to set additional rules relating to the
determination of the benefits expected from the exploitation of licenses.
4. The clarification to the Ministerial Regulation TK 2000-2001, 27 607, nr. 3,
which set the one-time amounts used in the 2003 tenders (Regeling VEB),
explained the rationale for the introduction of a one-time fixed charge; i.e. it was
to serve as a minimum financial threshold for market-entry, which would allow
only market participants who plan to use the resources with at least minimal
efficiency to be considered in the test. Furthermore, the combination of the
financial instrument and the financial bid would, together, be a measure of the
efficiency with which applicants intend to use the resources:
“De voorgestelde wijziging brengt hier verandering in door te bepalen dat van
de vergelijkende toets ook deel uit kan maken een toets op de bereidheid van de
aanvrager een bindend financieel bod uit te brengen. Langs deze weg kan, zoals
gezegd, ook bij de vergelijkende toets het financiële instrument worden ingezet
om het optimaal gebruik van de toe te kennen frequentieruimte te waarborgen.
(...)
Voor de volledigheid zij voorts opgemerkt dat ook een combinatie van een
eenmalig of periodiek bedrag met een (vrijwillig) bod bij de vergelijkende toets
op grond van het wetsontwerp mogelijk is. (...) "
42
(...) Het inzetten van een financieel instrument kan er toe leiden dat bepaalde
potentiële aanvragers afzien van het aanvragen van een vergunning. Hierdoor
komen er wellicht andere partijen op de markt dan wanneer van de inzet van het
financiële instrument zou zijn afgezien. (...)
Rationeel handelende partijen baseren hun biedingen op hun eigen waarde-
bepalingen van de te verdelen frequenties. Op een veiling komen die
waarderingen tot uiting in het bied-gedrag van de deelnemers. Indien er een
financieel instrument wordt gehanteerd naast de veiling, zal vooraf bekend zijn
wat bij een eenmalig bedrag de hoogte van dat bedrag is (...). Deze wetenschap
zal door de aanvragers worden verdisconteerd in hun bied-gedrag.
(...)
5. In the court case LJN: BA216944, the court further clarified and confirmed the
interpretation of the one-time license fee as a threshold (drempel) having the purpose
to preclude from participation parties who are likely to make sub-optimal use of the
frequencies, and (b) that the one-time license fee and the self-imposed financial bid
collectively represent such payment which ensures optimal use of the frequency.
“9.3.3 Het College ziet evenmin aanleiding om de keuze voor een financieel
bod in strijd met een doelmatig gebruik van de frequentieruimte te oordelen.
In een situatie waarin de overige relevante omstandigheden gelijk zijn, is het
doelmatig om een vergunning voor het gebruik van frequentieruimte toe te
kennen aan degene die hiertoe het hoogste financiële bod heeft uitgebracht. In
44 College van Beroep voor het bedrijfsleven , AWB 05/811 en 06/17,

43
dit verband acht het College het aannemelijk, zoals ook door de commerciële
radio-omroepen ter zitting is onderschreven, dat in het geval van commerciële
radio-omroep het de marktpartijen zijn, die beschikken over de meeste kennis
en informatie om de economische waarde van de verschillende kavels te
kunnen inschatten. Op grond van dit gegeven, dat de bepaling van de
marktwaarde aan de marktpartijen dient te worden overgelaten omdat zij
degenen zijn die een inschatting kunnen maken van de
exploitatiemogelijkheden van een kavel, heeft het toenmalige kabinet dan ook
gekozen voor een verdelingssystematiek voor de commerciële radio-omroep
waarbij, in het belang van een doelmatige verdeling van frequentieruimte, bij
gelijk gewaardeerde aanvragen de vergunning wordt vergeven aan de
aanvrager met het hoogste financieel bod.
(...)
9.4. (…). Met name niet nu, zoals hierboven is overwogen, uit de gekozen
verdelingssystematiek volgt, dat de aanvragers worden geacht zelf de
bovengrens te kunnen bepalen van hetgeen zij bereid zijn te betalen door
vooraf de waarde van het kavel vast te stellen, inclusief de verplichting bij
verkrijging van de vergunning het eenmalig bedrag te voldoen.
9.6.2 Anders dan de commerciële radio-omroepen, is het College van
oordeel dat het eenmalig bedrag noch het financieel bod een (para-)fiscale
heffing is. Beide bedragen zijn daarentegen (financiële) instrumenten om de
44
allocatie van schaarse vergunningen efficiënt te laten verlopen. Er kan
derhalve geen sprake zijn van een verboden dubbele heffing”
6. The provisions of the Tw and the Regeling VEB must be interpreted in the
context of the relevant art. 13 of Directive 2002/20/EC (the “Authorization Directive”):
“Member States may allow the relevant authority to impose fees for the
rights of use for radio frequencies or numbers or rights to install facilities on,
over or under public or private property which reflect the need to ensure the
optimal use of these resources. Member States shall ensure that such fees shall
be objectively justified, transparent, non-discriminatory and proportionate in
relation to their intended purpose and shall take into account the objectives in
Article 8 of Directive 2002/21/EC (Framework Directive).”
7. The invocation of art. 8 of the Framework Directive imposed a competition-
promoting obligation to the imposition of license fees:
“2. The national regulatory authorities shall promote competition in the
provision of electronic communications networks, electronic communications
services and associated facilities and services by inter alia:
[…]
(b) ensuring that there is no distortion or restriction of competition in the
electronic communications sector;
[….]
3. The national regulatory authorities shall contribute to the development
of the internal market by inter alia:
45
[…]
(c) ensuring that, in similar circumstances, there is no discrimination in the
treatment of undertakings providing electronic communications networks and
services…”
Interim Conclusion 1:
The financial instrument (one-time fee) introduced by Regeling VEB represents a
minimum threshold for the value of the license. It does not represent the optimal use
of the frequency space. Only the payment of the sum of the financial instrument and
the financial bid, (along with the programming offer in the case of restricted licenses),
ensures optimal use of the frequency space.
Interim Conclusion 2:
Only the market parties themselves are able to determine the actual value of each
license. This value has been expressed, in the 2003 tender, in the form of their financial
bids (which already took into account the amount of the one-time fee), together with
their programming offers, where relevant. This license value is therefore captured in
the current license terms of the incumbents, which include the obligation to pay the
financial instrument, the financial bid and to conform to the programming offer (where
relevant).
In relation to extension and amendment of licenses
8. Art.3.3 al. 9 of the Tw states:
46
“By means of general administrative measures, and taking into account
Directive 2002/20/EC, rules shall be set in the area of granting, amending and
extending of licenses”
9. Article 14 of the Directive 2002/20/EG (Authorization Directive) states:
“1. Member States shall ensure that the rights, conditions and procedures
concerning general authorisations and rights of use or rights to install facilities
may only be amended in objectively justified cases and in a proportionate
manner.”
Interim conclusion 3:
License fees for the existing commercial radio licenses (whether during their
current term or during their extended term) may be amended only (i) in objectively
justified cases and only (ii) in a proportionate manner. Furthermore, in setting the new
license terms, (iii) distortion of competition and (iv) discriminatory treatment of
certain market parties must be precluded.
It follows that a forward-looking, player-agnostic DCF-based valuation approach to
revising the license fees would run contrary to the Authorization Directive because it
would lead to disproportionate change of conditions among market players. A DCF
approach would, as evidenced by the comparison in the previous section, result in
different levels of amelioration or deterioration of financial terms for different market
participants, relative to the current terms. This would lead to an unwarranted
distortion of competition relative to the current market.
47
The specific application of the DCF method in an “opportunity cost” approach
appears unlawful, as it distorts competition and represents discrimination of the type
“similar treatment in dissimilar circumstances”
The valuation of the licenses from a “newcomer’s perspective” as of 2011 would
effectively assign new-entrant status to all licenses. This determination, however,
would be untrue, as it concerns existing license holders. Each license would have had a
different time-in-market, and therefore a different income-earning capability in 2011
and onward. Some of the licenses would have been operated by the current holder as
of the 80’s, while others only 5 or fewer years before the extension date.
On the contrary, the time-in-market was well captured in the (self) setting of the
original license fees in 2003.
Interim conclusion 4:
To value all licenses from the point of view of a new entrant would mean to
artificially lower the license fee costs for the long-time incumbents (pioneers), thus
effectively discriminating against recent entrants.
Interim conclusion 5
The change of the license conditions must be limited only to such change which is
objectively justified. A change which is not objectively justified may, inter alia, lead to
interpretation that de facto new licenses were issued to existing market participants;
rather than that existing licenses were extended. This in turn would expose the current
licenses to a risk of withdrawal in potential judicial proceedings.
48
A DCF approach to (re-) evaluating each license fee by an external expert, not taking
into account the current license conditions is likely to lead to changes in license
conditions which are larger than objectively justified.
The only objectively justified changes would be ones directly related to (a) the
objectively changed advertising market circumstances in the new term of the licenses,
and (b) the cost of any additional, new license terms imposed; such as a new investment
obligation imposed on the licensee in relation to promotion of digital radi0. It follows
that the license conditions may be changed only to the extent necessary to account for
such objective changes.
Interim conclusion 6:
A change of the license fee based on a forward-looking DCF model which is agnostic
of the current license holder, will fail to capture the correct, comprehensive risk profile
of the respective lot, which was previously captured in the current (self-assessed)
license bids. As such, it will lead to distortion of competition and lack of
proportionality.
The combined financial and programming bids in 2003 took into account not only
the objective parameters of the frequency lots, but also the subjective parameters of the
applicants, such as their time-in-market, consolidation status, plans, access to capital,
etc. In other words, applicants evaluated what their highest bid (both financial and
programming) could be, given the properties of the lots and their own knowledge and
capabilities, and their own risk tolerance. Thus, the applicants assigned a complex risk
assessment of the lot they were applying for. This risk assessment was an important
49
component of the value assigned by each applicant to their lot, and was reflected in the
final (complex) bids. A DCF model as implemented by the Government fails to capture
this risk profile.
4.3.2 Implications from the dual nature of the 2003 comparative test
10. The procedure selected for the award of the incumbents’ original licenses was
pursuant to section (b) of art 3.3 al 4: “by means of a comparative test, with or without
making use of a financial bid.”
11. The procedure of the comparative test applied the principle of “ensuring optimal
use of scarce resources” by requiring applicants to submit only financial bids in the case
of unrestricted licenses, and combined financial and programming bids in the case of
the restricted frequency lots. The licenses were awarded to the highest (complex)
bidders in the respective categories. Thus, in the comparative test for the frequency
licenses subject to extension, the quantum of the bid of the winners (whether financial
only or programming plus financial), represented the cost ensuring most optimal use
of the frequencies. This interpretation has been explicitly confirmed in the earlier-cited
CBb verdict.
12. It must be noted that in the case of restricted frequency lots, the programming
offer and the financial bid were closely interwined, with the programming offer being
seen as having a certain, finite financial equivalent. In other words – the same
(restricted) lot could be acquired by either (a) a party making a very high programming
offer relative to the other applicants, or (b) by the highest financial bidder in case no
party made an above-average programming offer.
50
13. It follows from this that applicants in 2003 had to make a distributive choice
between the quanta of their programming offer and their financial offer. A high(er) bid
in either of these offers would mean increased business risk. In the case of a high
programming bid, the risk would be that the license-holder might achieve too small of
a market share to generate the expected returns, and in the case of a high financial offer
the risk would be that (despite potentially higher market share), the license cost might
be too high relative to the actual revenues realized in the market. In any event, it was
up to the applicants to make that choice, given the information they had at the time of
the tender procedure.
14. Given the information available at the time of the original licensing procedure,
an applicant for a restricted license who chose to offer a high programming offer,
evaluated his project risk based on the expectations for the market development and
the assumptions which could be derived from the rules of the procedure. Those
assumptions included, naturally, the assumption for financial bids to be made and paid
by all competitors. It was therefore based on all assumptions, including those for the
market’s development and for the (plausible) bids of the competitors, that such
applicant for a restricted lot decided on the quantum of its programming bid.
15. Indeed, each applicant must internalize the normal business risk that its
assumptions for the financial (or programming) bids of his competitors may deviate
from the actual bids. However, it is less defensible that the applicant may be required
to bear the risk that the financial bids are later waived, or replaced by a financial
obligation assessed by a third party which may deviate radically from the self-assessed
51
financial commitments. A radical change like this, which results in financial obligations
disproportionate to the original financial bids, may make the original programming
offer made by the applicant for a restricted lot economically unfeasible. In any event it
does and will change the risk profile of the license-holder disproportionately to those
applicants that applied for and received unrestricted licenses, or even those who
obtained restricted licenses based on the highest financial offer, rather than on the
highest programming offer.
Interim conclusion 7:
It would be impossible to amend the financial component of the license obligation
disproportionately to the original financial bids without being discriminatory against
the holders of restricted licenses and, consequently, without distorting competition.
4.3.3 Legal conclusion
For the reasons elaborated earlier in this chapter, a forward-looking, operator-
agnostic DCF model does not appear to be an appropriate, or lawful, approach to
determining the license terms for an extended term of an existing radio license,
originally awarded in a comparative test with a financial bid component. Such
approach appears to be in conflict with the (principles underlying) the EU
Authorizations Directive and their respective transpositions into national law.
To be compliant with the constraints of EU and national legislation, any approach
would have to conform to at least the following requirements:
52
(i) Any change of license fees must be proportionate among all parties in the
market, and must take into regard the current competitive situation, which
may not be distorted.
(ii) Any change of license fees must specifically use as a point of departure the
current license conditions, of which the financial bid is a key formative
component.
(iii) Not only the cost and revenue profile, but the full risk profile of each lot must
be captured in the new license fee. The full risk profile is already captured in
the original, self-assessed license fee.
(iv) Last, the change in license fee must be limited to only such change which can
be objectively justified; otherwise the extension of existing licenses may be
construable as issuance of new licenses. Such construction may in fact
endanger the legal status of the licenses following the extension.
4.4 Legitimate alternative approach to extension valuation
An economically legitimate and lawful alternative to setting the extension fee using
the DFC model proposed by SEO, would be to change the financial component of the
license conditions (i.e. the original license fee) proportionately, pro-rata for all parties,
taking the current license fee (i.e. the combined financial instrument and financial bid)
as a base.
This could be achieved in one of two ways:
(1) Either by the following process:
53
(a) Determining, by using a DCF model, the total projected size of the market,
respectively the total projected expected return of the radio market for the period of the
extension;
(b) Assessing a portion of that cumulative “return” which could be reasonably
charged as an aggregate license fee for the whole market; where a reasonable
benchmark for such portion may be the ratio between the original cumulative license
fees and the projected return of the market based on aggregating the original business
plans of the market participants (as submitted in the original tender procedure);
(c) Allocating such “aggregate license fee” among the market participants pro
rata to their current, self-imposed fee obligations.
(2) Alternatively, by adjusting the original (financial component of the) license fees
to reflect only the divergence between the market development expected for the period
of the original term of the license (for example, as used in the forecasting of the relevant
advertising market for the setting of the one-time financial instrument in 2003; or by
taking the average market projection contained in the incumbents original business
plans), and the expected market development in the period 2011-2017; thus resulting
in a proportionate change of the current license fees by the percentage of such
divergence.
Either of these alternative approaches would have achieved a more effective balance
among the mandatory regulatory policy goals of (1) optimal use of scarce resources (2)
ensuring market viability, (3) proportionality and non-discrimination among market
participants, in particular in relation to operators of restricted licenses, (3)
54
preservation of the competitive balance with minimal market-maker intervention by
the regulator, and (4) limitations of the change of license terms only to such change
which is objectively justified.
That said, neither of these alternative methods of setting the extension fee would
address fully the underlying issue of whether state aid is in fact granted to the
incumbents. However, this issue remains as salient, if not more so, in the actual
approach proposed by SEO and instituted by the Dutch government. Despite its claim
to resolve the state-aid issue, the SEO approach does not fully recoup, or recapture,
state aid. To do so, it would have to go as far as to recoup the subjective (operator-
specific), as opposed to the objective (operator-agnostic) value of the license. To do so
in turn would have meant that the incumbents would have been indifferent, from an
economic perspective, to accepting or rejecting the extension, as it would have brought
no return over the null hypothesis – discontinuing operations. The state aid issue is
thus inherent to any extension that is economically desirable by the incumbent.
Considering, however, that there are explicit provisions for possible license extension
under EU and national legislation, it appears that the particular form of state aid in the
context of license extension is, by exception, tolerated in the interest of optimal use of
scarce resources.
55
5. CONCLUSION
The regulatory policy and choices observed in the presented case highlight the need to
account for the value of incumbency, conversely the inherent costs of late entry, in
valuation of scarce resources in a regulatory setting. Failure to do so will invariably
result value redistribution and market distortion, which are incompatible with the
functions of a regulator. Even more concerning is the observed tendency that such
failures are likely to benefit the largest, most mature incumbents, thus perpetuating
market dominance, limiting effective competition and precluding new market entry.
All of these observations suggest that unless specific, maybe even normative, allowance
is made for the “value of incumbency” or “cost of order of entry” in scarce resource
regulation, individual policy applications are likely to fall prey to regulatory capture,
whether intentional or not. A possible normative solution to this risk might be an
amendment to the relevant European legislation, requiring such costs/values to be
explicitly accounted for in resource valuations. The only alternative to such normative
approach appears to be sufficient litigious activism on the part of affected parties –
such as disadvantaged market participants or precluded entrants. Such activism may
ultimately result in a sufficient volume of court-enforced regulatory reversals and
economic damage awards, to ensure that regulators pay more than skimming
consideration to topics that they would have traditionally discarded as areas of abstract
economics.
56
BIBLIOOGRAPHY
Journal Articles
Agarwal, R., and M. Gort, “The evolution of markets and entry, exit and survival of
firms”, The Review of Economics and Statistics, 78 (3), 1996
Berndt. E., L. T. Bui, D. H. Reiley, and G. L. Urban, "The Roles of Marketing. Product
Quality and Price Competition in the Growth and Composition of the U.S Anti-Ulcer
Drug Industry," Working Paper # 19-94, Sloan School, MIT, May 1994
Brown. C. L. and J. M. Lattin. "Investigating the Relationship between Time in the
Market and Pioneering Advantage,"Management Science 40 (October 1994).
Carpenter, Gregory S., and Kent Nakamoto, “Consumer Preference Formation and
Pioneering Advantage,” Journal of Marketing Research, 26, 3, August 1989
Colder. P. N. and G. J. Tellis, "Pioneer Advantage: Marketing Logic or Marketing
Legend?', Journal of Marketing Research, 30, May 1993
Fernández Z, Usero B. “The erosion of pioneer advantage in the European mobile
telecommunications industry.” Serv Bus, 2007
Glazer. A., "The Advantages of Being First," American Economic Review 75, June
1985
Hauser. J. R. and B. Wernerfelt, "An Evaluation Cost Model of Consideration Sets,"
Journal of Consumer Research, 16, March 1990
57
Huff. L. C. and W. T. Robinson, "The Impact of Leadtime and Years of Competitive
Rivalry on PioneerMarket Share Advantages." Management Science. 40, October
1994
Kalyanaram and D. R. Wittink, "Heterogeneity in Entry Effects between Nondurable
Consumer Product Categories," International Journal ofResearch in Marketing, 1994
Kalyanaram, G. and G. L. Urban, "Dynamic Effects of the Order of Entry on Market
Share. Trial Penetration, and Repeat Purchases for Frequently Purchased Consumer
Goods," Marketing Science, summer edition, 1992
Kalyanaram, Gurumurthy, William T. Robinson, and Glen L. Urban, “Order of Entry:
Established Empirical Generalizations, Emerging Empirical Generalizations, and
Future Research”, Marketing Science, 14, 1995
Kardes. F. R. and G. Kalyanaram (1992). "Order-of-Entry Effects on Consumer
Memon and Judgment: An Information Integration Perspective," Journal of
Marketing Research, 29, August, 1992
Kerin. R. A., P. R. Varadarajan and R. A. Peterson, "First-Mover Advantage: A
Synthesis. Conceptual Framework and Research Propositions." Journal yf .llarkering.
56, October, 1992
Lieberman, Marvin B. and David B. Montgomery, "First Mover (Dis)Advantages:
Retrospective and Link with the Resource Based View,” Strategic Management
Journal, 19, December, 1998
58
Lieberman. M. B., "The Learning Curve. Technology Barriers to Entry and
Competitive Survival in the Chemical Processing Industries," Strategic Management
Journal, 10, September-October, 1989
López LE, Roberts EB, “First-mover advantages in regimes of weal appropriability:
the case of financial services innovations”, Bus Res, 2002
Maite Martinez-Granado‡and Georges Sioti, “Sabotaging entry: an Estimation of
Damages in the Directory Enquiry Service Market,” Review of Law & Economics, vol.
6, issue 1, 2006
Makadok, Richard, “Can First-Mover and Early-Mover Advantages Be Sustained in an
Industry with Low Barriers to Entry/Imitation?” Strategic Management Journal, 19,7,
1998
Parry, M. and F. M. Bass. "When to Lead or Follow? It Depends," Marketing Letters.
1, November, 1990
Porter, M. E., "Consumer Behavior, Retailer Power and Market Performance in
Consumer Goods Industries." Review of Economics and Statistics, 56, 1974
Prescott. E. C. and M. Visscher, "Sequential Location among Firms with Foresight,"
Bell Journal of Economics, 8, 1977
Robinson, William T and Sungwook Min, “Is the first to market the first to fail?
Empirical evidence for industrial goods businesses,” Journal of Marketing, 2002
59
Schmalensee. R. "Product Differentiation Advantages of Pioneering Brands,"
Amerlcan Economic Review 72, June, 1982
Sullivan. M. W., "Brand Extensions: When to Use Them." Management Science 38,
June, 1992
Tufano, P., “Financial innovation and first mover advantages”, Journal of Financial
Economics 25, 1989
Urban. G. L., T. Carter, S. Gaskin, and Z. Mucha, "Market Share Rewards to
Pioneering Brands: An Empirical Analysis and Strategic Implications", Marketing
Science, 32, June, 1986
VanderWerf, Pieter A. and John F. Mahon, “Meta-Analysis of the Impact of Research
Methods on Findings of First Mover Advantage,” Management Science, 43,
November, 1997
William T. Robinson, “Sources of Market Pioneer Advantages: The Case of Industrial
Goods Industries”, Journal of Marketing Research, Vol. 25, No. 1. 1988
William T. Robinson; Claes Fornell, “Sources of Market Pioneer Advantages in
Consumer Goods Industries”, Journal of Marketing Research, Vol. 22, No. 3. 1985
Books
Scherer. F. M and D. Ross, “Industrial Markets Structure and Economic Performance,
(third Ed.) Boston: Houghton Mifflin, 1990

60
White. A. P., “The Dominant Firm – A Study of Market Power”, Ann Arbor., MI: UMI
Research Press, 1983
Reports
European Commission, “White paper on damages actions for breach of the EC
antitrust rules”, 2008, accessed 21 November 2012), available from: http://eur-
lex.europa.eu/LexUriServ/LexUriServ.do?uri=CELEX:52008DC0165:EN:NOT;
Ministry of Economic Affairs and Agriculture of the Netherlands, “Position Paper” in
Negotiations over Damage Award for Delayed Licensing Award to RadioCorp BV;
September 2008
SEO Economisch Onderzoek and TNO Informatie-en communicatietechnologie,
“Waarde commerciële radiovergunningen”, SEO-rapport nr. 2010-06 ISBN 978-90-
6733-541-6, 2010
SEO Economisch Onderzoek and TNO Informatie-en communicatietechnologie,
“Addendum Waarde commerciële radiovergunningen”, SEO-rapport nr. 2011-09.
ISBN 978-90-6733-595-9, 2011
Working Papers
Riemer H Mallik S and Sudharshan D .2002. “Market Shares follow a Zipf
Distribution”, http://www.business.illinois.edu/research/020125paper.pdf,