Embed Size (px)
Citation preview
Military-Madrasa-Mullah Complex 343
India Quarterly, 66, 2 (2010): 133–149
A Global Threat 343Article
Managing Working Capital Efficiency in Capital Goods Sector in India
Harsh Vineet Kaur Sukhdev Singh
AbstractEfficient management of working capital is an important indicator of sound health of an organization. It means management of various components of working capital in such a way that an adequate amount of working capital is maintained for smooth running of a firm and for fulfillment of twin objectives of liquidity and profitability. The present study aims to examine the efficiency of working capital manage-ment practices of 14 companies in capital goods sector (as per BSE 200 companies) from the year 2000–2001 to 2009–2010. The analysis is based on Performance Index, Utilization Index and Efficiency Index of Working Capital Management. The study shows that number of firm’s efficiently managing working capital varies from 35 per cent to 78 per cent over the span of time period under study. The study also proposes to evaluate the ability of individual firms in reaching the target level of efficiency, i.e., average performance of industry. The revelations made by the study if followed are bound to gene- rate increased profits and profitability of leading corporate of India. The study also attempts to study the degree of the relationship between the Efficiency Index and Profitability measured by Income to Current Assets and Income to Average Total Assets.
KeywordsBeta, correlation, Efficiency Index of Working Capital, Performance Index of Working Capital, Utilization Index of Working Capital
Introduction
Working Capital is the life giving force to an economic entity. Efficient management of working capital means management of various components of working capital in such a way that an adequate amount of working capital is maintained for smooth running of a firm and for fulfillment of twin objectives of liquidity and profitability.
While inadequate amount of working capital impairs the firm’s liquidity, holding of excess working capital results in the reduction of the profitability. But the proper estimation of required working capital
Harsh Vineet Kaur is a Ph.D Research Scholar at Punjab Technical University, Jallandhar, Punjab, India.E-mail: [email protected] Singh is Professor at Department of Business Administration, Guru Nanak Dev Engineering College, Ludhiana, Punjab, India. E-mail: [email protected]
Global Business Review 14(2) 343–355
© 2013 IMISAGE Publications
Los Angeles, London,New Delhi, Singapore,
Washington DCDOI: 10.1177/0972150913477526
http://gbr.sagepub.com
at PENNSYLVANIA STATE UNIV on September 19, 2016gbr.sagepub.comDownloaded from
Global Business Review, 14, 2 (2013): 343–355
344 Harsh Vineet Kaur and Sukhdev Singh
is a difficult task for the management because the amount of working capital varies across firms over the periods depending upon the nature of business, scale of operation, production cycle, credit policy, avail-ability of raw materials, etc. For this, significant amount of funds is necessary to be invested permanently in the form of various current assets. For instance, due to time lag between sale of goods and their actual realization in cash, adequate amount of working capital is always required to be made available for maintaining the desired level of sales. Empirical results show that ineffective management of working capital is one of the important factors causing industrial sickness (Yadav, 1986). Modern financial man-agement aims at reducing the level of current assets without ignoring the risk of stock outs (Bhattacharya, 1997). Efficient management of working capital is, thus, an important indicator of sound health of an organization which requires reduction of unnecessary blocking of capital in order to bring down the cost of financing. However, short-term assets and liabilities are important components of total assets and need to be carefully analyzed. Management of these short-term assets and liabilities warrants a careful investigation since the working capital management plays an important role for the firm’s profitability and risk as well as its value (Smith, 1980). The optimal level of working capital is determined to a large extent by the methods adopted for the management of current assets and liabilities.
A vibrant capital goods industry is a pre-requisite to propel the growth of the manufacturing activity in any country. India produces wide range capital goods and some of the prominent capital goods pro-duced in India include heavy electrical machinery, textile machinery, machine tools, earthmoving and construction equipment, food processing and packaging machinery, etc. Capacity creation in the Indian capital goods industry has been growing, since liberalization, and in tune with the growth in industry. The Capital Goods sector in India is characterized by highly cost competitive labour market. With the dismantling of various price controls on key inputs, Indian Capital Goods manufacturers now procure raw materials at market prices which move in line with international prices. The raw material price indices have risen faster than the machinery price index. It is difficult for the Indian Capital Goods manufacturers to pass on the rise in prices to the customers, thereby impacting their profitability.
Indian Capital Goods firms present a full spectrum of technological capabilities—while there are few firms close to the international frontier in terms of product design capability and process technology, technological capabilities of most players are extremely limited. The quality of infrastructure (trans- port, communication and power) is poor, thus affecting competitive delivery schedules and increasing operating costs.
Indian Capital Goods industry derives some degree of comparative advantage from cauterization in certain segments like foundry, electronics, etc., while engineering consulting services has exhibited com-petitive advantages relating to the accumulation of knowledge assets and advanced tools.
The annual sales of the capital goods industry was about ` 110,000 crores during 2008–2009. But the Indian market is more than ` 300,000 crores and rest of 60 per cent –70 per cent of equipment across all categories are being imported (EXIM Bank, 2008). Because of the drastic fall in customs duty and the inherent disadvantages faced by domestic manufacturers thereby making them cost uncompetitive and reducing them to be traders and assemblers, instead of manufacturers. Its contribution to the exchequer has been in excess of ` 20,000 crores in terms of customs, sales tax and excise collections and which will be higher if corporate taxes are added. The capital investments made in this sector have registered a healthy CAGR of close to 10 per cent for the period from 1995 to 2005. The industry currently employs six million skilled and semi-skilled workers. It needs to be highlighted that this sector generates the much needed employment for less educated persons like fitters, welders, machine operators and ITI graduates and employs all collared people (Exim Bank, 2008).
at PENNSYLVANIA STATE UNIV on September 19, 2016gbr.sagepub.comDownloaded from
Global Business Review, 14, 2 (2013): 343–355
Working Capital Efficiency in Capital Goods Sector in India 345
Indian Capital Goods manufacturers have working capital requirements as high as 45 per cent of net sales (against global benchmark of 15 per cent) (Price Water House Coopers, n.d.). Thereby the study of Working capital of Capital Goods sector in India is important.
In the light of the above, an attempt is made in this study to look into the working capital management of companies in Capital Goods sector in India.
Organization of this Article
The second section, deals with a brief review of literature on the management of working capital. The third section covers the objectives, database and methodology adopted in this study; the empirical analyses are presented in the fourth section and conclusions are reported in the last section.
Review of Literature
A significant portion of financial research is concerned with the management of working capital. This issue has been extensively investigated at both conceptual and empirical levels. Some of the brief reviews are presented in the following:
Dr D. Mukhopadhyay conducted a research study to examine working capital management practices and the problems faced by the firms in working capital management process particularly in heavy engi-neering industries. A sick engineering firm named ‘M/S Heavy Engineering Company Limited’ had been selected and data from 1993–1994 to 2002–2003 had been analyzed. He suggested that the company needed to revalue real estate including land and other assets and dispose off idle assets and selling off certain percentage of company goodwill can enable the company infuse fresh blood in the form of work-ing capital to run the show.
N.K. Aggarwal in his study on ‘Management of Working Capital of India’ in 1976 studied 34 selected large manufacturing and trading public limited companies in both the sectors—private and public. He has made an attempt to throw light on the utilization of current assets, resource-pattern of financing the working capital being followed by these companies, and how far different companies have been successful in collecting their receivables in time. The study emphasizes the fact that the manner of administration of working capital largely determines the success or failures of overall operations of an enterprise.
Carpenter and Johnson (1983) provided empirical evidence that no linear relationship is there between the level of current assets and revenue and systematic risk of US firms; however, some indications of a possible non-linear relationship were found which were not highly statistically significant.
A research study was undertaken by Dr Santanu Kumar Ghosh and Santi Gopal Maji to examine the efficiency of working capital management practices of 20 large cement companies during 1992–1993 to 2001–2002. For measuring the efficiency of working capital management, three index values were based on a model developed by Prof. Hrishikesh Bhattacharya (1997). Using industry norm as target–efficiency level of the individual firms, this article also tests the speed of achieving that target level of efficiency by an individual firm during the period of study. Finding of the study indicates that the Indian Cement industry as a whole did not perform remarkably well during this period.
at PENNSYLVANIA STATE UNIV on September 19, 2016gbr.sagepub.comDownloaded from
Global Business Review, 14, 2 (2013): 343–355
346 Harsh Vineet Kaur and Sukhdev Singh
A study on working capital management of horticulture industry in Himachal Pradesh by Joginder Singh Dulta (2001) observed the size of current assets and current liabilities registered a slight increase. But due to inefficient use of the various components of working capital the current liabilities increased proportionately at a faster rate than current assets and net working capital position worsened continuously.
P. Saravanan (2001) had undertaken a research on working capital management in non-banking finance companies. Data from 1987–1988 to 1996–1997 for 10 non-banking finance companies had been analyzed. He observed that medium and large size non-banking companies have efficiently made use of bank credit to finance their working capital requirements.
A research study on working capital management of paper industries in India was conducted by R. Sivarama Prasad (2001). The sample consisted of 21 selected paper mills, including nine large, five medium and seven small scales for the period from 1983–1984 to 1992–1993. He reported that the chief executives properly recognized the role of efficient use of working capital in liquidity and profitability but in practice they could not achieve it. Again they reported a clear reveal of a suboptimum utilization of working capital in paper industry.
Rehman (2006) investigated the impact of working capital management on the accounting returns of 94 Pakistani firms listed at Islamabad Stock Exchange (ISE) for a period of 1999–2004. He studied the impact of the different variables of working capital management including Average Collection Period, Inventory Turnover in Days, Average Payment Period and Cash Conversion Cycle on the Net Operating Profitability of firms. He concluded that there is a significant negative relationship among above working capital ratios and returns of firms. Furthermore, managers can create a positive value for the shareholders by reducing the cash conversion cycle up to an optimal level.
Jain et al. (2007) studied Working capital management practices of public sector enterprises in India. The study was based on an analysis of 13-year period data from 1991 to 2003 of 137 public sector enterprises, and stated that a business organization has to be conscious that inadequate working capital leading to illiquidity can disrupt its operations. At the same time excessive working capital is also not desirable since it adversely affects profitability.
Vishnani and Shah (2007) had taken an empirical study on ‘Impact of Working Capital Management Policies on Corporate Performance’ by examining coefficient of correlation and regression analysis between profitability ratios and some key working capital policy indicator ratios of 23 Indian Consumer Electronics companies during the period 1994–1995 to 2004–2005. They concluded that no established relationship between liquidity and profitability exists for the industry as a whole. The various companies of the industry depicted different type of relationship between liquidity and profitability, although major-ity of them revealed positive association between liquidity and profitability. But working capital man-agement policies and practices have profound impact on a company’s profit performance.
A study on liquidity management of TISCO Ltd. had been taken by Ghosh (2008) in which data from 1996 to 2000–2001 had been analyzed. He indicated that although the degree of association between liquidity and profitability of the company was positive, the degree of influence of liquidity on its profitability was low and insignificant.
Sen and Oruc (2009) aimed to determine the relationship between efficiency level of firms being traded in ISE (Istanbul Stock Exchange) in working capital management and their return on total assets. The authors tried to explain the relationship between different indicators relating to efficiency in work-ing capital management and their return on total assets and found that in all the firms and sectors (under
at PENNSYLVANIA STATE UNIV on September 19, 2016gbr.sagepub.comDownloaded from
Global Business Review, 14, 2 (2013): 343–355
Working Capital Efficiency in Capital Goods Sector in India 347
study) there is a significance negative relationship between cash conversion cycle, net working capital level, current ratio, accounts receivable period, inventory period and return on total assets.
Haq et al. (2011) empirically examined the relationship between working capital management and profitability by using data of 14 companies in cement industry in the Khyber Pakhtonkhuwa Province (KPK) of Pakistan. The study was based on secondary data for the period of six years from 2004–2009 collected from financial reports which are listed in the Karachi Stock Exchange. Using correlation coefficient and multiple regression analysis the result concluded that there is a moderate relationship between working capital management and profitability.
Objectives
1. To examine the efficiency of working capital management practices of companies in capital goods sector.
2. To test how quickly the firms under study have been able to improve their respective level of efficiency in working capital management with respect to target level (industry average).
3. To test the relationship between working capital efficiency and profitability of the companies.
Methodology
The methodology of this article is focused on the measurement of:
1. Overall efficiency2. Efficiency in achieving targeted level of efficiency3. Relationship between efficiency and profitability
Overall Efficiency
For measuring the overall efficiency of working capital the following three indices and the tools are used as suggested by Bhattacharya (1997).
(a) Performance Index of Working Capital Management
Performance index of Working Capital Management represents average performance index of the various components of current assets. A firm may be said to have managed its working capital efficiently if the proportionate rise in sales is more than the proportionate rise in current assets during a particular period. Numerically overall performance index more than one indicates efficient management of working capital.
n
s i ( t 1) iti 1
I W /W−=∑
PI (WCM ) = ––––––––––––––––––– N
at PENNSYLVANIA STATE UNIV on September 19, 2016gbr.sagepub.comDownloaded from
Global Business Review, 14, 2 (2013): 343–355
348 Harsh Vineet Kaur and Sukhdev Singh
Where: IS = Sales Index St/St–1 Wi = individual group of current assets N = number of current asset group i = 1, 2, 3,…………… N
Total current assets has components—raw material inventory; work-in-progress inventory; finished goods inventory; stores and spares inventory; receivables; cash; loans and advances; other current assets.
(b) Working Capital Utilization Index
While performance index represents the average overall performance in managing the components of current assets, utilization index indicates the ability of the firm in utilizing its current assets as a whole for the purpose of generating sales. If an increase in total current assets is coupled with more than pro-portionate rise in sales, the degree of utilization of these assets with respect to sales is said to have improved and vice versa. This ultimately reflects the operating cycle of the firm which can be shortened by means of increasing the degree of utilization. Thus, a value of utilization index greater than one is desired.
A (t–i) UI (WCM) = ––––– A t
where A = Current Assets/Sales
(c) Efficiency Index of Working Capital
Efficiency index is a measure of performance which reflects the combined effects of both the Performance index and the Utilization index.
EI (WCM) = PI (WCM) * UI(WCM )
(d) Efficiency in Achieving Targeted Level of Efficiency
In order to measure the firm’s efficiency in achieving the targeted level of efficiency during the study period, the following regression equation has been used:
Yi = α + β Xi + ei
Where, Yi = Zt – Z t–1
Xi= Z*t – Z t–1
Zt = Index at time ‘t’ for the firm and Z*t = Average index of the industry at t – 1
at PENNSYLVANIA STATE UNIV on September 19, 2016gbr.sagepub.comDownloaded from
Global Business Review, 14, 2 (2013): 343–355
Working Capital Efficiency in Capital Goods Sector in India 349
The estimated beta value (b) represents the speed of the individual firm in improving its efficiency in achieving the industry norms in this regard. β = 1 indicates that the degree of firm’s efficiency in the matter of managing working capital is equal to average efficiency level of the industry as a whole. β < 1 signifies that the firm needs improvement for better managing its working capital. Efficiency Index is compared with industry norm for finding out performance. Average value has been taken as the target industry norms for the present study and this is based on the technique followed by Robert Morris Associates’ Annual statement studies (1975) and Dun & Bradstreet’s Key Business Ratio (1975).
(e) Relationship between Efficiency and Profitability
For testing the relationship between efficiency of working capital management and profitability, Pearson Correlation has been computed between the Efficiency Index of Working Capital and Profitability meas-ured by Income to Sales and Income to Assets. R2 has also been calculated. The significance of the ratio has been tested at 5 per cent and 0.05 per cent level of significance.
Sample Size
The study is based on 14 companies (included in BSE 200 index) of the capital goods sector, in respect of which data for 10 years, i.e., from the year 2000–2001 to 2009–2010 has been taken. The capital goods sector is an important constituent of BSE 200 Index. To test the significance of the Sample ‘t test’ has been used. The calculated value (0.360) of t (based on adjustment factors used for calculating BSE 200 index; and ignoring the companies in financial services in BSE 200 index) was found to be statisti-cally significant at 0.50 per cent level of significance.
Source of Data
The data has been taken from the PROWESS database of Centre for Monitoring Indian Economy. The analysis has been done by using SPSS17.0 software package.
Empirical Analysis
Measuring Overall Efficiency of Working Capital
(a) Performance Index of Working Capital Management
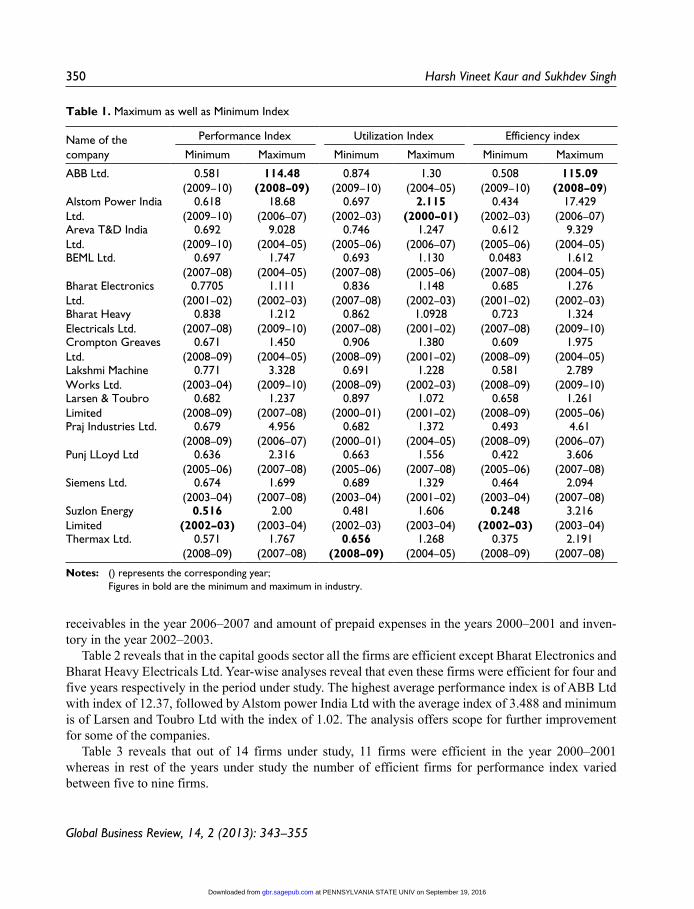
The index measures the average performance of all components of working capital. Table 1 reveals the maximum as well as minimum values of the index of the firms under study. The table also reveals that ABB Ltd has the maximum performance index of 114.48 in 2008–2009, whereas Suzlon Energy Ltd has the minimum value of 0.516 in the year 2002–2003. High performance index of ABB Ltd is due to large variation in the prepaid expenses in 2008–2009 and 2009–2010. Even in the case of Alstom Power India Ltd there is a big variation between maximum and minimum value mainly due to huge variations in
at PENNSYLVANIA STATE UNIV on September 19, 2016gbr.sagepub.comDownloaded from
Global Business Review, 14, 2 (2013): 343–355
350 Harsh Vineet Kaur and Sukhdev Singh
receivables in the year 2006–2007 and amount of prepaid expenses in the years 2000–2001 and inven-tory in the year 2002–2003.
Table 2 reveals that in the capital goods sector all the firms are efficient except Bharat Electronics and Bharat Heavy Electricals Ltd. Year-wise analyses reveal that even these firms were efficient for four and five years respectively in the period under study. The highest average performance index is of ABB Ltd with index of 12.37, followed by Alstom power India Ltd with the average index of 3.488 and minimum is of Larsen and Toubro Ltd with the index of 1.02. The analysis offers scope for further improvement for some of the companies.
Table 3 reveals that out of 14 firms under study, 11 firms were efficient in the year 2000–2001 whereas in rest of the years under study the number of efficient firms for performance index varied between five to nine firms.
Table 1. Maximum as well as Minimum Index
Name of the company
Performance Index Utilization Index Efficiency index
Minimum Maximum Minimum Maximum Minimum Maximum
ABB Ltd. 0.581(2009–10)
114.48(2008–09)
0.874(2009–10)
1.30(2004–05)
0.508(2009–10)
115.09(2008–09)
Alstom Power India Ltd.
0.618(2009–10)
18.68(2006–07)
0.697(2002–03)
2.115(2000–01)
0.434(2002–03)
17.429(2006–07)
Areva T&D India Ltd.
0.692(2009–10)
9.028(2004–05)
0.746(2005–06)
1.247(2006–07)
0.612(2005–06)
9.329(2004–05)
BEML Ltd. 0.697(2007–08)
1.747(2004–05)
0.693(2007–08)
1.130(2005–06)
0.0483(2007–08)
1.612(2004–05)
Bharat Electronics Ltd.
0.7705(2001–02)
1.111(2002–03)
0.836(2007–08)
1.148(2002–03)
0.685(2001–02)
1.276(2002–03)
Bharat Heavy Electricals Ltd.
0.838(2007–08)
1.212(2009–10)
0.862(2007–08)
1.0928 (2001–02)
0.723(2007–08)
1.324(2009–10)
Crompton Greaves Ltd.
0.671(2008–09)
1.450(2004–05)
0.906(2008–09)
1.380(2001–02)
0.609(2008–09)
1.975(2004–05)
Lakshmi Machine Works Ltd.
0.771(2003–04)
3.328(2009–10)
0.691(2008–09)
1.228(2002–03)
0.581(2008–09)
2.789(2009–10)
Larsen & Toubro Limited
0.682(2008–09)
1.237(2007–08)
0.897(2000–01)
1.072(2001–02)
0.658(2008–09)
1.261(2005–06)
Praj Industries Ltd. 0.679(2008–09)
4.956(2006–07)
0.682(2000–01)
1.372(2004–05)
0.493(2008–09)
4.61(2006–07)
Punj LLoyd Ltd 0.636(2005–06)
2.316(2007–08)
0.663(2005–06)
1.556(2007–08)
0.422(2005–06)
3.606(2007–08)
Siemens Ltd. 0.674(2003–04)
1.699(2007–08)
0.689(2003–04)
1.329(2001–02)
0.464(2003–04)
2.094(2007–08)
Suzlon Energy Limited
0.516(2002–03)
2.00(2003–04)
0.481(2002–03)
1.606(2003–04)
0.248(2002–03)
3.216(2003–04)
Thermax Ltd. 0.571(2008–09)
1.767(2007–08)
0.656(2008–09)
1.268(2004–05)
0.375(2008–09)
2.191(2007–08)
Notes: () represents the corresponding year; Figures in bold are the minimum and maximum in industry.
at PENNSYLVANIA STATE UNIV on September 19, 2016gbr.sagepub.comDownloaded from
Global Business Review, 14, 2 (2013): 343–355
Working Capital Efficiency in Capital Goods Sector in India 351
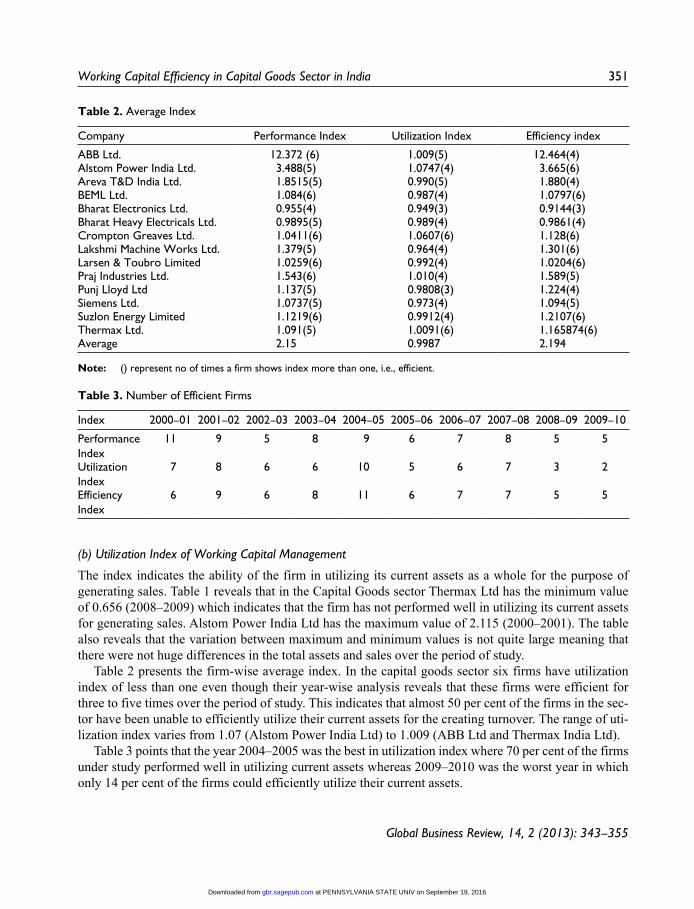
(b) Utilization Index of Working Capital Management
The index indicates the ability of the firm in utilizing its current assets as a whole for the purpose of generating sales. Table 1 reveals that in the Capital Goods sector Thermax Ltd has the minimum value of 0.656 (2008–2009) which indicates that the firm has not performed well in utilizing its current assets for generating sales. Alstom Power India Ltd has the maximum value of 2.115 (2000–2001). The table also reveals that the variation between maximum and minimum values is not quite large meaning that there were not huge differences in the total assets and sales over the period of study.
Table 2 presents the firm-wise average index. In the capital goods sector six firms have utilization index of less than one even though their year-wise analysis reveals that these firms were efficient for three to five times over the period of study. This indicates that almost 50 per cent of the firms in the sec-tor have been unable to efficiently utilize their current assets for the creating turnover. The range of uti-lization index varies from 1.07 (Alstom Power India Ltd) to 1.009 (ABB Ltd and Thermax India Ltd).
Table 3 points that the year 2004–2005 was the best in utilization index where 70 per cent of the firms under study performed well in utilizing current assets whereas 2009–2010 was the worst year in which only 14 per cent of the firms could efficiently utilize their current assets.
Table 2. Average Index
Company Performance Index Utilization Index Efficiency index
ABB Ltd. 12.372 (6) 1.009(5) 12.464(4)Alstom Power India Ltd. 3.488(5) 1.0747(4) 3.665(6)Areva T&D India Ltd. 1.8515(5) 0.990(5) 1.880(4)BEML Ltd. 1.084(6) 0.987(4) 1.0797(6)Bharat Electronics Ltd. 0.955(4) 0.949(3) 0.9144(3)Bharat Heavy Electricals Ltd. 0.9895(5) 0.989(4) 0.9861(4)Crompton Greaves Ltd. 1.0411(6) 1.0607(6) 1.128(6)Lakshmi Machine Works Ltd. 1.379(5) 0.964(4) 1.301(6)Larsen & Toubro Limited 1.0259(6) 0.992(4) 1.0204(6)Praj Industries Ltd. 1.543(6) 1.010(4) 1.589(5)Punj Lloyd Ltd 1.137(5) 0.9808(3) 1.224(4)Siemens Ltd. 1.0737(5) 0.973(4) 1.094(5)Suzlon Energy Limited 1.1219(6) 0.9912(4) 1.2107(6)Thermax Ltd. 1.091(5) 1.0091(6) 1.165874(6)Average 2.15 0.9987 2.194
Note: () represent no of times a firm shows index more than one, i.e., efficient.
Table 3. Number of Efficient Firms
Index 2000–01 2001–02 2002–03 2003–04 2004–05 2005–06 2006–07 2007–08 2008–09 2009–10
Performance Index
11 9 5 8 9 6 7 8 5 5
Utilization Index
7 8 6 6 10 5 6 7 3 2
Efficiency Index
6 9 6 8 11 6 7 7 5 5
at PENNSYLVANIA STATE UNIV on September 19, 2016gbr.sagepub.comDownloaded from
Global Business Review, 14, 2 (2013): 343–355
352 Harsh Vineet Kaur and Sukhdev Singh
(c) Efficiency Index of Working Capital Performance
This is the product of the performance index and the utilization index and measures the overall efficiency in working capital management of a firm. Table 1 reveals that in the Capital Goods sector, ABB Ltd has the maximum value of 115.09 (2008–2009). This high value of efficiency index is due to exceptional value of performance index in the same year. Suzlon Energy Ltd has the minimum value of 0.248 (2002–2003).
Table 2 shows that in the capital goods sector, ABB Ltd has the maximum index of 12.464 while Larsen and Toubro Ltd has the lowest index of 1.0204. All the firms have an efficiency index above one except Bharat Heavy Electricals Ltd and Bharat Electronics Ltd.
Table 3 shows that in the year 2004–2005, 78 per cent of the firms under study were efficient in man-aging their working capital. The number of efficient firms in managing working capital varies from 35 per cent to 78 per cent over the span of time period under study.
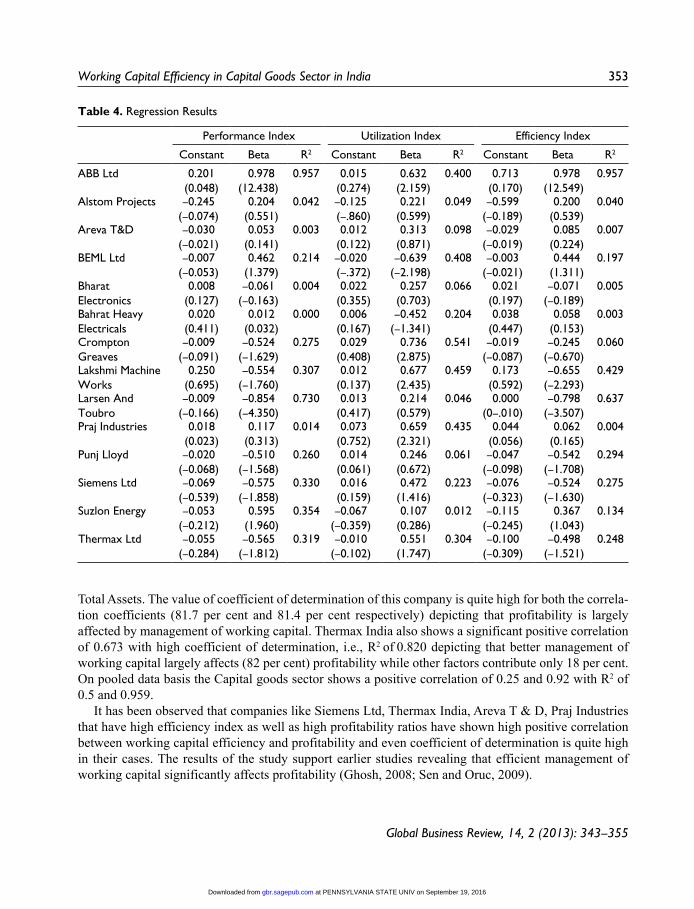
Industry Norms as Target Level of Efficiency
In financial analysis, the average performance of an industry is considered as one of the yardstick for performance evaluation of the firms belonging to that industry group. For calculating industry norm, any measure of central tendency, e.g., mean or median can be used. Based on the technique followed by Robert Morris Associates and Dun & Bradstreet, mean values of each of the three indexes have been used as the industry norms for this study. One main advantage of using mean as the industry norm is that the existence of any extreme value cannot affect the industry average.
Table 4 reveals that in the capital goods sector, ABB Ltd has the highest beta value of 0.978 which is much higher than the rest of the firms in the industry. Even though the firm was the best in management of current assets as well as in the overall efficiency index (β = 0.978) but in utilization of current assets for sales it ranks fourth. In utilization issue Crompton Greaves Ltd (β = 0.736) followed by Lakshmi Machine Works Ltd (β = 0.677) depict maximum efficiency to achieve the industry target.
Thus, on the whole, there is scope for improvement in the matter of managing either the individual components of current assets or the current assets as a whole for generating increased sales revenue, profits and profitability. A careful attention to this would help the firms in enhancing their efficiency in working capital management. In the context of the present highly competitive market situation, these scopes should be properly utilized.
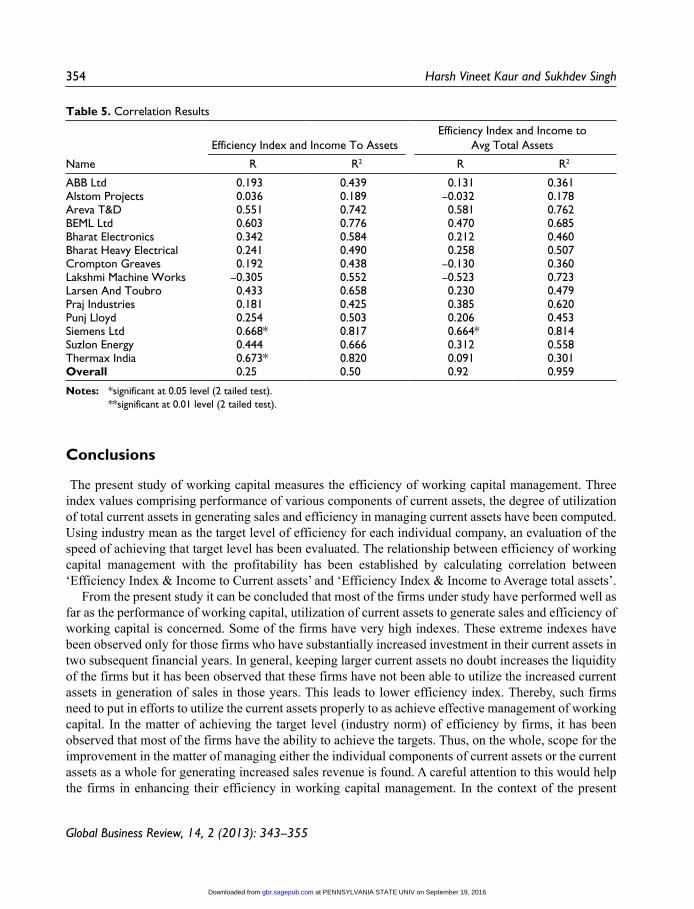
Relationships between Efficiency and Profitability
The efficient WCM is the most crucial factor in maintaining survival, liquidity, solvency and profit- ability of the concerned business organization. WCM efficiency has a special relevance and a thorough investigation regarding WC practice in the industries is of utmost importance. If efficient working capital management increases profitability, one should expect a positive relationship between Efficiency Index of Working capital and Profitability Variable.
Table 5 shows that in the Capital Goods sector, Siemens India Ltd shows a significant positive cor-relation of 0.668 and 0.664 in both the parameters, i.e., Income to Current Assets and Income to Average
at PENNSYLVANIA STATE UNIV on September 19, 2016gbr.sagepub.comDownloaded from
Global Business Review, 14, 2 (2013): 343–355
Working Capital Efficiency in Capital Goods Sector in India 353
Total Assets. The value of coefficient of determination of this company is quite high for both the correla-tion coefficients (81.7 per cent and 81.4 per cent respectively) depicting that profitability is largely affected by management of working capital. Thermax India also shows a significant positive correlation of 0.673 with high coefficient of determination, i.e., R2 of 0.820 depicting that better management of working capital largely affects (82 per cent) profitability while other factors contribute only 18 per cent. On pooled data basis the Capital goods sector shows a positive correlation of 0.25 and 0.92 with R2 of 0.5 and 0.959.
It has been observed that companies like Siemens Ltd, Thermax India, Areva T & D, Praj Industries that have high efficiency index as well as high profitability ratios have shown high positive correlation between working capital efficiency and profitability and even coefficient of determination is quite high in their cases. The results of the study support earlier studies revealing that efficient management of working capital significantly affects profitability (Ghosh, 2008; Sen and Oruc, 2009).
Table 4. Regression Results
Performance Index Utilization Index Efficiency Index
Constant Beta R2 Constant Beta R2 Constant Beta R2
ABB Ltd 0.201(0.048)
0.978(12.438)
0.957 0.015(0.274)
0.632(2.159)
0.400 0.713(0.170)
0.978(12.549)
0.957
Alstom Projects –0.245(–0.074)
0.204(0.551)
0.042 –0.125(–.860)
0.221 (0.599)
0.049 –0.599(–0.189)
0.200(0.539)
0.040
Areva T&D –0.030(–0.021)
0.053(0.141)
0.003 0.012(0.122)
0.313(0.871)
0.098 –0.029(–0.019)
0.085(0.224)
0.007
BEML Ltd –0.007(–0.053)
0.462(1.379)
0.214 –0.020(–.372)
–0.639(–2.198)
0.408 –0.003(–0.021)
0.444(1.311)
0.197
Bharat Electronics
0.008(0.127)
–0.061(–0.163)
0.004 0.022(0.355)
0.257(0.703)
0.066 0.021(0.197)
–0.071(–0.189)
0.005
Bahrat Heavy Electricals
0.020(0.411)
0.012(0.032)
0.000 0.006(0.167)
–0.452(–1.341)
0.204 0.038(0.447)
0.058(0.153)
0.003
Crompton Greaves
–0.009(–0.091)
–0.524(–1.629)
0.275 0.029(0.408)
0.736(2.875)
0.541 –0.019(–0.087)
–0.245(–0.670)
0.060
Lakshmi Machine Works
0.250(0.695)
–0.554(–1.760)
0.307 0.012(0.137)
0.677(2.435)
0.459 0.173(0.592)
–0.655(–2.293)
0.429
Larsen And Toubro
–0.009(–0.166)
–0.854(–4.350)
0.730 0.013(0.417)
0.214(0.579)
0.046 0.000(0–.010)
–0.798(–3.507)
0.637
Praj Industries 0.018(0.023)
0.117(0.313)
0.014 0.073(0.752)
0.659(2.321)
0.435 0.044(0.056)
0.062(0.165)
0.004
Punj Lloyd –0.020(–0.068)
–0.510(–1.568)
0.260 0.014 (0.061)
0.246(0.672)
0.061 –0.047(–0.098)
–0.542(–1.708)
0.294
Siemens Ltd –0.069(–0.539)
–0.575(–1.858)
0.330 0.016(0.159)
0.472(1.416)
0.223 –0.076(–0.323)
–0.524(–1.630)
0.275
Suzlon Energy –0.053(–0.212)
0.595(1.960)
0.354 –0.067(–0.359)
0.107(0.286)
0.012 –0.115(–0.245)
0.367(1.043)
0.134
Thermax Ltd –0.055(–0.284)
–0.565(–1.812)
0.319 –0.010(–0.102)
0.551(1.747)
0.304 –0.100(–0.309)
–0.498(–1.521)
0.248
at PENNSYLVANIA STATE UNIV on September 19, 2016gbr.sagepub.comDownloaded from
Global Business Review, 14, 2 (2013): 343–355
354 Harsh Vineet Kaur and Sukhdev Singh
Conclusions
The present study of working capital measures the efficiency of working capital management. Three index values comprising performance of various components of current assets, the degree of utilization of total current assets in generating sales and efficiency in managing current assets have been computed. Using industry mean as the target level of efficiency for each individual company, an evaluation of the speed of achieving that target level has been evaluated. The relationship between efficiency of working capital management with the profitability has been established by calculating correlation between ‘Efficiency Index & Income to Current assets’ and ‘Efficiency Index & Income to Average total assets’.
From the present study it can be concluded that most of the firms under study have performed well as far as the performance of working capital, utilization of current assets to generate sales and efficiency of working capital is concerned. Some of the firms have very high indexes. These extreme indexes have been observed only for those firms who have substantially increased investment in their current assets in two subsequent financial years. In general, keeping larger current assets no doubt increases the liquidity of the firms but it has been observed that these firms have not been able to utilize the increased current assets in generation of sales in those years. This leads to lower efficiency index. Thereby, such firms need to put in efforts to utilize the current assets properly to as achieve effective management of working capital. In the matter of achieving the target level (industry norm) of efficiency by firms, it has been observed that most of the firms have the ability to achieve the targets. Thus, on the whole, scope for the improvement in the matter of managing either the individual components of current assets or the current assets as a whole for generating increased sales revenue is found. A careful attention to this would help the firms in enhancing their efficiency in working capital management. In the context of the present
Table 5. Correlation Results
Name
Efficiency Index and Income To AssetsEfficiency Index and Income to
Avg Total Assets
R R2 R R2
ABB Ltd 0.193 0.439 0.131 0.361Alstom Projects 0.036 0.189 –0.032 0.178Areva T&D 0.551 0.742 0.581 0.762BEML Ltd 0.603 0.776 0.470 0.685Bharat Electronics 0.342 0.584 0.212 0.460Bharat Heavy Electrical 0.241 0.490 0.258 0.507Crompton Greaves 0.192 0.438 –0.130 0.360Lakshmi Machine Works –0.305 0.552 –0.523 0.723Larsen And Toubro 0.433 0.658 0.230 0.479Praj Industries 0.181 0.425 0.385 0.620Punj Lloyd 0.254 0.503 0.206 0.453Siemens Ltd 0.668* 0.817 0.664* 0.814Suzlon Energy 0.444 0.666 0.312 0.558Thermax India 0.673* 0.820 0.091 0.301Overall 0.25 0.50 0.92 0.959
Notes: *significant at 0.05 level (2 tailed test). **significant at 0.01 level (2 tailed test).
at PENNSYLVANIA STATE UNIV on September 19, 2016gbr.sagepub.comDownloaded from
Global Business Review, 14, 2 (2013): 343–355
Working Capital Efficiency in Capital Goods Sector in India 355
highly competitive market situation, these scopes should be properly utilized. Alternatively some of the firms may focus on reducing the investment in working capital considerably.
References
Bhattacharya, H. (1997). Total management by ratios. New Delhi: SAGE.Carpenter, M.D., & Johnson, K.H. (1983). The association between working capital policy and operating risk.
The Financial Review, 18(3), 106–106.Dulta, Jogendra Singh (2001). Working capital management of horticulture industry in HP—A case study of HPMC.
Finance India, XV(2), 644–657.Export-Import Bank of India (2008). Indian capital goods industry: A sector study. Occasional Paper No. 124.Ghosh, Sudipta (2008). Liquidity management: A case study of TISCO Ltd. The Management Accountant, 43(2).Ghosh, S.K., & Maji, S.G. (2004). Working capital management efficiency: A study on the Indian cement industry.
The Management Accountant, 39(5), 363–372.Haq, Ikram ul, Sohail, Muhammad, Zaman, Khalid, Zaheer, Alam (2011). The relationship between working capital
management and profitability: A case study of cement industry in Pakistan. Mediterranean Journal of Social Sciences, 2(2), 365–372.
Jain, P.K., & Yadav, Surendra S. (2007). Working capital management practices: A study of public sector enterprises in India. Management & Change, 11(2), 5–9.
Mukhopadhyay, D. (2004). Working capital management in heavy engineering firms—A case study. The Management Accountant, 39(4), 317–323. Available at http://Myicwai.Com/Knowledgebank/Fm48.Pdf
Prasad, R. Sivarama (2001). Working capital management in paper industry. Finance India, XV(1), 185–188.Price Water House Coopers, Global competitiveness of Indian capital goods industry.Rehman, A. (2006). Working capital management and profitability: Case of Pakistani firms. Unpublished
Dissertation. Islamabad, Pakistan: COMSATS Institute of Information Technology.Saravanan, P. (2001). A study on working capital management in non-banking finance companies. Finance India,
XV(3), 987–994.Sen, Mehmat, & Oruc, Eda (2009). Relationship between efficiency level of working capital management and return
on total assets in ISE. International Journal of Business and Management, 4(10), 109–114.Smith, K. (1980). Profitability versus liquidity tradeoffs in working capital management. Readings on the manage-
ment of working capital. New York: St. Paul, West Publishing Company.Yadav, R.A. (1986). Working capital management: A parametric approach. The Chartered Accountant, May,
952–955.
at PENNSYLVANIA STATE UNIV on September 19, 2016gbr.sagepub.comDownloaded from

at PENNSYLVANIA STATE UNIV on September 19, 2016gbr.sagepub.comDownloaded from