Embed Size (px)
Citation preview
EFFECTS OF CAPITAL STRUCTURE ON THE FINANCIAL
PERFORMANCE OF FIRMS LISTED AT THE NAIROBI
SECURITIES EXCHANGE
BY
LEWIS MUGAMBI MUTEGI
A RESEARCH PROJECT SUBMITTED IN PARTIAL
FULFILLMENT OF THE REQUIREMENTS FOR THE AWARD OF
THE DEGREE OF MASTER OF SCIENCE IN FINANCE, SCHOOL
OF BUSINESS, UNIVERSITY OF NAIROBI
OCTOBER, 2016
ii
DECLARATION
I declare that this research project is my original work and has never been submitted
elsewhere for award of a degree or diploma at the University of Nairobi or any other
educational institution.
Signed: _______________________ Date: ___________________________
Lewis Mugambi Mutegi
Reg No. D63/79415/2016
This research project has been submitted for examination with our approval as the
university supervisors
Signed: _______________________ Date: __________________________
Mr. Dominic Murage
Department of Finance and accounting
School of Business, University of Nairobi
Signed: _______________________ Date: __________________________
Dr. Mirie Mwangi
Department of Finance and accounting
School of Business, University of Nairobi

iii
ACKNOWLEDGEMENT
I give gratitude to the Almighty God for the sufficient grace and strength throughout this
journey of this project. Secondly, I greatly remain indebted to my supervisors, Mr.
Dominic Murage, Dr. Mirie Mwangi and my moderator Dr. Elly who devoted a lot of
their time to supervise the writing of this project; it is through their guidance,
encouragement and constructive criticism and appraisal that I was able to complete this
onerous undertaking.

iv
DEDICATION
I dedicate this research project to my family members and those who cherish knowledge
acquisition.
v
TABLE OF CONTENTS
DECLARATION......................................................................................................... ii
ACKNOWLEDGEMENT ......................................................................................... iii
DEDICATION............................................................................................................ iv
LIST OF TABLES ................................................................................................... viii
LIST OF FIGURES .................................................................................................. ix
LIST OF THE ABBREVIATIONS ............................................................................x
ABSTRACT ................................................................................................................ xi
CHAPTER ONE: INTRODUCTION ........................................................................1
1.1 Background of the Study .........................................................................................1
1.1.1 Capital Structure ............................................................................................2
1.1.2 Firm Financial Performance ..........................................................................3
1.1.3 Capital Structure and Firm Financial Performance .......................................5
1.1.4 Firms Listed at Nairobi Securities Exchange ................................................6
1.2 Research Problem ....................................................................................................7
1.3 Research Objective ................................................................................................10
1.4 Value of the Study .................................................................................................10
CHAPTER TWO: LITERATURE REVIEW .........................................................11
2.1 Introduction ............................................................................................................11
2.2 Theoretical Review ................................................................................................11
2.2.1 Pecking Order Theory .................................................................................11
2.2.2 Trade-Off Theory ........................................................................................12
2.2.3 Market Timing Theory ................................................................................13
2.2.4 Agency Theory ............................................................................................15
2.3 Determinants of Financial Performance ................................................................16
2.3.1 Firm’s Capital Structure ..............................................................................16

vi
2.3.2 Tangibility of Fixed Assets..........................................................................17
2.3.3 Firm Liquidity Level ...................................................................................18
2.4 Empirical Review...................................................................................................19
2.5 Conceptual Framework ..........................................................................................21
2.6 Summary of Literature Review ..............................................................................22
CHAPTER THREE: RESEARCH METHODOLOGY ........................................24
3.1 Introduction ............................................................................................................24
3.2 Research Design.....................................................................................................24
3.3 Study Population ....................................................................................................24
3.4 Data Collection ......................................................................................................25
3.5 Data Analysis .........................................................................................................25
3.5.1 Test of Significances ...................................................................................27
CHAPTER FOUR: DATA ANALYSIS AND RESEARCH FINDINGS .............28
4.1 Introduction ............................................................................................................28
4.2 Descriptive Statistics ..............................................................................................28
4.3 Inferential Statistics ...............................................................................................29
4.3.1 Correlation Analysis ....................................................................................30
4.3.2 Regression Analysis ....................................................................................30
4.3.3 Analysis of Variance ...................................................................................32
4.4 Interpretations of Findings .....................................................................................34
CHAPTER FIVE: SUMMARY, CONCLUSIONS AND RECOMMENDATIONS
......................................................................................................................................36
5.1 Introduction ............................................................................................................36
5.2 Summary ................................................................................................................36
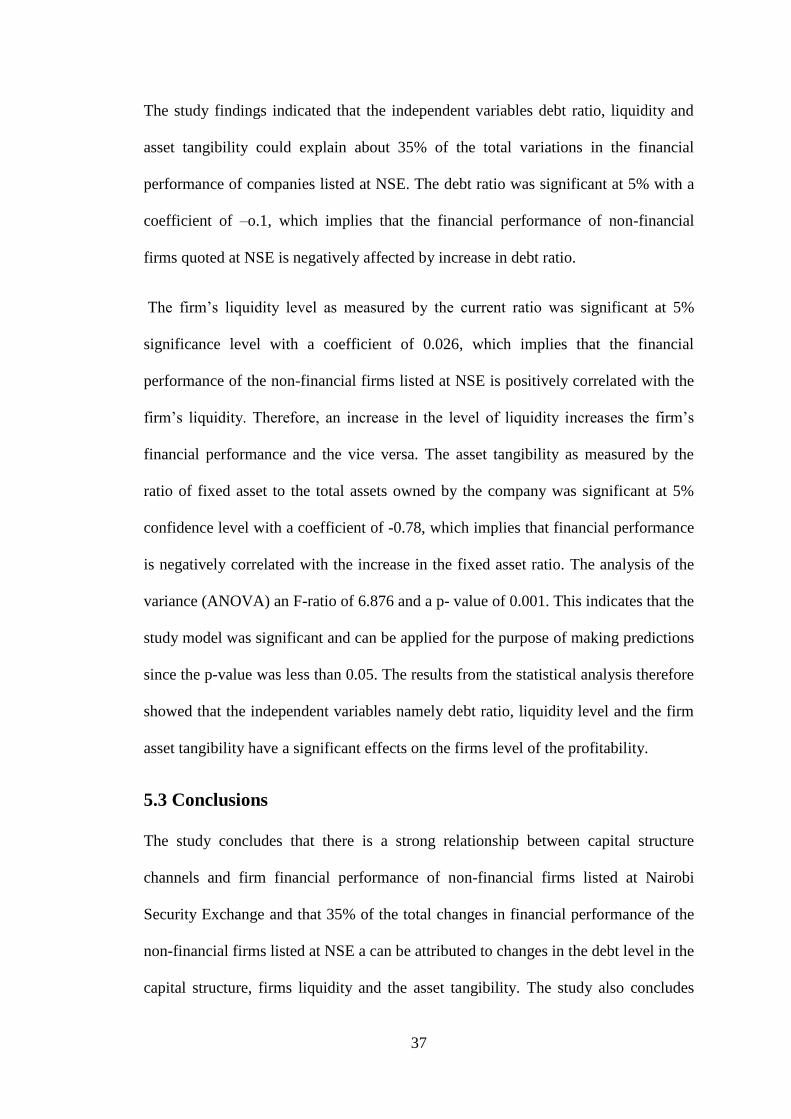
5.3 Conclusions ............................................................................................................37
5.4 Recommendations ..................................................................................................38

vii
5.5 Limitations of the Study.........................................................................................39
5.6 Suggestion for the Future Research .......................................................................40
REFERENCES ...........................................................................................................41
APPENDICES ............................................................................................................47
APPENDIX I: LIST OF COMPANIES LISTED AT NSE ....................................47

viii
LIST OF TABLES
Table 4.1 Descriptive Statistics ....................................................................................29
Table 4.2 Correlation matrix ........................................................................................30
Table 4.3 Regression Model Summary ........................................................................31
Table 4.4 Analysis of Variance ....................................................................................32
Table 4.5 Regression Coefficients ...............................................................................33

ix
LIST OF FIGURES
Figure 2.1 Conceptual Framework ..............................................................................22
Figure 4.1 Response rate ..............................................................................................28

x
LIST OF THE ABBREVIATIONS
ANOVA ANALYSIS OF VARIANCE
CMA CAPITAL MARKET AUTHORITY
EBIT EARNING BEFORE INTEREST AND TAXES
GDP GROSS DOMESTIC PRODUCT
NASI NSE ALL SHARE INDEX
NSE NAIROBI STOCK EXCHANGE
ROA RETURN ON CAPITAL
ROE RETURN ON EQUITY
SPSS STATISTICAL PACKAGE FOR SOCIAL SCIENCE
xi
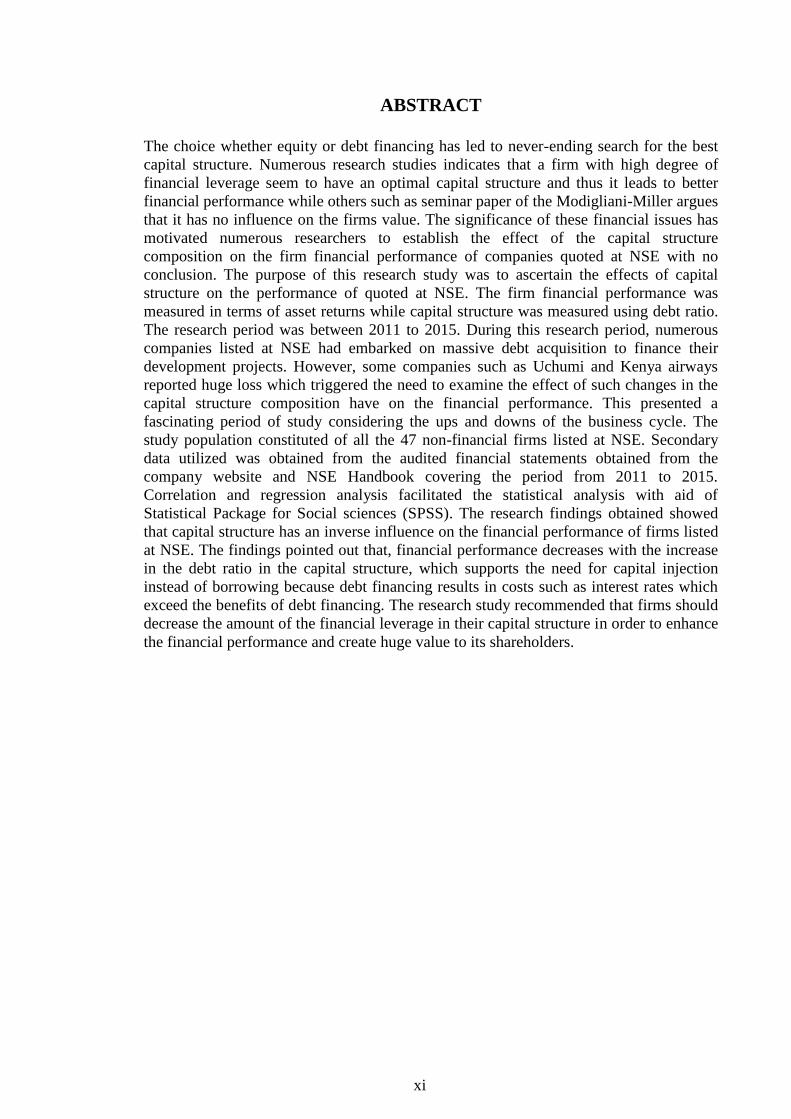
ABSTRACT
The choice whether equity or debt financing has led to never-ending search for the best
capital structure. Numerous research studies indicates that a firm with high degree of
financial leverage seem to have an optimal capital structure and thus it leads to better
financial performance while others such as seminar paper of the Modigliani-Miller argues
that it has no influence on the firms value. The significance of these financial issues has
motivated numerous researchers to establish the effect of the capital structure
composition on the firm financial performance of companies quoted at NSE with no
conclusion. The purpose of this research study was to ascertain the effects of capital
structure on the performance of quoted at NSE. The firm financial performance was
measured in terms of asset returns while capital structure was measured using debt ratio.
The research period was between 2011 to 2015. During this research period, numerous
companies listed at NSE had embarked on massive debt acquisition to finance their
development projects. However, some companies such as Uchumi and Kenya airways
reported huge loss which triggered the need to examine the effect of such changes in the
capital structure composition have on the financial performance. This presented a
fascinating period of study considering the ups and downs of the business cycle. The
study population constituted of all the 47 non-financial firms listed at NSE. Secondary
data utilized was obtained from the audited financial statements obtained from the
company website and NSE Handbook covering the period from 2011 to 2015.
Correlation and regression analysis facilitated the statistical analysis with aid of
Statistical Package for Social sciences (SPSS). The research findings obtained showed
that capital structure has an inverse influence on the financial performance of firms listed
at NSE. The findings pointed out that, financial performance decreases with the increase
in the debt ratio in the capital structure, which supports the need for capital injection
instead of borrowing because debt financing results in costs such as interest rates which
exceed the benefits of debt financing. The research study recommended that firms should
decrease the amount of the financial leverage in their capital structure in order to enhance
the financial performance and create huge value to its shareholders.
1
CHAPTER ONE: INTRODUCTION
1.1 Background of the Study
Whenever a Corporation requires funds to support their operations and other capital
expenditures, the financial decisions to trade-off debt and equity (capital structure) should
be put into consideration. The capital structure describes the way the firm raises finances
for its operations by use of debt capital or equity capital or an equal blend of both debt
and equity capital (Myers, 2001). In one manner or another, business activities must be
funded. Without funds to support working capital requirement and fixed assets, business
might not exist. Almost in every aspects of fixed asset investment decision, capital
structure decision is very important one because it affects the profitability of the
company. Proper attention and care require should then be given consideration while
making the decision of capital structure in order to enhance firms performance and
maximize shareholders wealth (Mwangi et al, 2014).
Capital structure theories and their relationship with firms profitability and firms value
have been a puzzling issue since the seminar paper of Modigliani and Miller (1958)
where he stated that, in absence of corporate taxes, information asymmetry, bankruptcy
cost, transaction costs and in an efficient market, the value of the firm is immaterial to the
financing decision adopted (Jermias, 2008). Debt capital can decrease the tax paid, so the
optimal capital structure of company should be totally be made up of debt capital. Since
then, numerous theories have come up to explain capital of a firm, which includes the
Pecking order theory, the Trade-off theory and the theory of agency cost. The decision
about where source of capital comes from is vital and affects competitiveness with other
peers in the same industry. Therefore, company should choose the right financial mix that
maximizes the financial performance (Abor, 2007).
2
The issuance of debt finance through the capital market in Kenya is becoming more and
more common. Listed companies at NSE are accumulating massive debts in their capital
structure as a way of raising fresh finance to funds operations and execute development
projects through capital market (Anyanzwa, 2015). For instance, centum investment Ltd
and regional beer maker East African Breweries Ltd (EABL) have established the
foundation for debt financing by borrowing millions of dollars from the debt market.
Several firms use debt to leverage on their capital in order to enhance profit levels.
However, ability of debt finance to improve performance or enhance profits varies from
one firm to another depending on prevailing economic conditions (Maher & Andersson,
1999). Companies like Housing Finance Ltd issued medium-term notes of $220 million
that CMA accepted in November 2013 while Shelter Afrique issued medium-term notes
of $88 million for habitat and housing in Africa and was accepted in August 2013
(Anyanzwa, 2015). It is evident that listed firms are increasing debt capital in their capital
structure and the need to investigate whether debt financing has an effect on the
performance motivated this study. Moreover, lack of unified theory, which explains the
effects composition of capital structure have on the financial performance, motivated this
research study.
1.1.1 Capital Structure
Capital structure has been described as a mixture of equity finance and debt finance and
is usually regarded as the one of the most significant financial variable because it is
linked to the capacity of the company to meet the requirements of all its stakeholders
such as employees, community, shareholders, among others (Jensen, 1986). Equity
finance refers to the finance contributed by the business owners and this is the most risk
bearing form of finance. The shareholders are entitled share of the company profit usually
referred to as dividend in accordance to the number of shares held. However, it is not
3
compulsory to make dividend payment every time since the company can hold some part
of the profits for supporting future expansion of its business operations. The shareholders
also share business risks and they are last to obtain benefit in case a company is
liquidated after settlement of all debt (Brockington, 1990).
Debt finance is created by borrowing from the external financing sources like financial
banks or issuing bonds. The financier does not control the operations of the firm but
instead, he is paid a fixed annual return as compensation for the use of his funds. On the
other hand, the borrower (firm) is legally obligated to repay the principal amount plus the
accrued interest regardless of whether the firm makes the profit or not. The inability to
meet such financial commitments can lead to loss of the collateralized asset, the collapse
of the business or even bankruptcy (Bichsel & Blum, 2005). Debt finance has both the
advantages and disadvantages in the growth of companies and expansion of the economy.
Debt finance results to benefits such as tax shield and the diminution of free cash flow
problems by enhancing managerial behavior while the expenses of debt financing include
agency expenses and bankruptcy cost which results from the conflicts between
shareholders and debt holders (Fama & French, 2002). Managers therefore, should try to
balance these costs and benefits of debt when making debt capital decisions in order to
improve performance (Kraus & Litzenberger, 1973). Capital structure is measured using
debt ratios. The debt ratios make comparison of the total debt with the total assets owned
by the company. A low ratio indicates that a company depends less on debt while a high
percentage indicates that a firm rely more on debt finance.
1.1.2 Firm Financial Performance
Financial performance has been defined as a measure of how well a firm uses its
available resources in the generation of revenues. It provides a guideline that gives a way
4
for future decisions relating to business developments, assets acquisitions and managerial
control (Tehrani & Rahnama, 2006). It reflects what has been achieved by the
management in monetary terms over a specific duration and can be utilized in making
comparison of like firms in the one industry. According to Ongeri (2014), financial
performance provides an avenue for the evaluation of business activities in objective
monetary terms. It shows how better a shareholder is at the end of an accounting period
than he was at the beginning and this can be ascertained by utilizing financial ratios
derived from financial statements or using data on market share prices. The main
objective of the firm is to maximize the wealth of the shareholders and therefore
performance measurement helps to evaluate how richer the shareholder becomes as a
result of the investment decisions over a given period (Berger & Patti, 2002).
The financial performance is measured using many different absolute and relative
indicators such revenues, expenses, the net income levels, earnings before interest and tax
(EBIT), return on asset, return on equity. However, most frequently used accounting-
based measures of performance include ROE and ROA (Reese & Cool, 1978). ROE
measures return on the shareholders capital and is computed by dividing Net profit after
Taxes by Total Equity capital. It also shows the profitability level of a company in
relation to the total sum of the shareholders capital invested. On the other hand, ROA
indicates the return on all assets of the company and is frequently used by firms as an
overall index of financial performance. It is computed by dividing Net Income after
Taxes divided by Total Assets (Khrawish, 2011). As a result, ROA will be applied in
measuring financial performance of listed companies.
5
1.1.3 Capital Structure and Firm Financial Performance
The effect of capital structure on the financial performance of firms is essential and
regularly discussed matter in managerial finance. However, this role remains a debatable
topic, which has attracted the attention of many researchers since the study of Modigliani
and Miller 1958, where he stated that firm value is independent of the financing choice
adopted. Therefore, the real assets but not the financing mode determines firm’s value.
Indeed, scholarly researchers attempts to analyze capital structure and ascertain whether
an optimal capital structure exists or it does not. Optimal capital structure refers to the
level, which minimizes the cost of capital for the company and maximizes the
performance of the firm. According to prior studies, capital structure has an effect on the
cost of capital, which ultimately influences financial performance of the firm and share
prices (Miller, 1977). The use of debt finance offers an opportunity to the firm to increase
the scale of its operations and consequently increase its performance over time. However,
debt finance has such effects on performance, if the return on the assets is greater than the
cost of debt (Watkins, 2002).
According to Jensen & Meckling (1984), debt has an influence on the quality of the
investment opportunities that are undertaken by the management by forcing managers to
invest in the projects, which add value to the shareholders. This in return minimizes
agency and other related costs hence enhancing financial performance of the firms. The
effect of the capital structure on the firm’s financial performance has for long time been
investigated by different researchers and seen to have an effect on the financial
performance of firms. For instance, Eldomiaty & Azim (2008) carried out a research on
the effects of capital structure on the firm’s financial performance and established that
capital structure is positively related to the financial performance of the firms. Hadlock &
James (2002) also support the argument. To the contrary, Fama & French (2008)
6
established that capital structure is negatively related to the firm financial performance.
The contradicting findings on the effect of capital structure on the firm financial
performance can be attributed to several factors, which include different companies,
different countries, different sectors, different periods, different measures of profitability,
different debt ratios and different methodologies in establishing the correlation between
capital structure and firm performance (Muchugia, 2013).
1.1.4 Firms Listed at Nairobi Securities Exchange
The Nairobi security exchange is a public market for trading securities of public listed
firms in Kenya. In 1954, it was started as a voluntary association of brokers under society
act and it was responsible for development of security market and regulation of trading
activities. NSE has undergone numerous changes since its commencement, which
includes enactment of trading rules, Central depository system, automation of the market
and demutualization from mutual company-to-company ltd by shares (NSE, 2016). It is
the fourth biggest stock exchange in terms of number of share traded and fifth in terms of
market capitalization as a percentage of GDP (Iraya & Musyoki, 2013).
NSE is currently licensed, monitored and supervised by the Capital Markets Authority
(CMA) which, is the security market regulatory body in Kenya. The capital market
authority has a responsibility of ensuring good corporate governance practices among
listed companies and development of efficient market (NSE, 2016). Currently, the 64
listed companies in the Nairobi securities exchange are distributed among various
industries such as, growth market enterprise segment, manufacturing & allied,
Agricultural, Telecommunication &Technology, Insurance, Banking, Construction and
allied, Commercial & services, Petroleum & energy, Investment, Investment services &
Automobile and accessories. Since 1964, NSE 20-share has always been used by the
7
Nairobi stock exchange in measuring the performance of 20 blue- chip companies.
However, in 2008, Nairobi stock exchange changed its performance measure to NSE all
share index (NASI) which measures the general market performance incorporating all
traded shares of each day (NSE, 2016).
Listed companies at the Nairobi Security Exchange are gradually increasing debt
financing on their capital structure as they look for more capital to fund business
operations and put into practice determined development projects. The reports from the
capital market authority (CMA) indicate that a sum of 988 million was raised by the
companies listed in the Nairobi stock exchange between 2004 and 2014 through right
issue (Anyanzwa, 2015). Large listed firms seem to raise the debt to equity ratios while
for the small firms they fell (Wagacha, 2001). The decision whether to take debt finance
or equity financing has remained within the confines of boards of directors but financial
analysts have argued in support and considers debt finance as appropriate for increasing
firm value provided they are acquired at appropriate market rate and proceeds utilized in
a good way (Anyanzwa, 2015). This study seeks to find out the whether such debt
financing has any effect on the performance of the companies listed at NSE. Banks and
Insurance companies will be excluded from the analysis because they are highly
controlled on matters relating to liquidity and minimum capital base by the central bank
of Kenya and the Insurance regulatory authority respectively.
1.2 Research Problem
Capital structure plays an important role in firms financial performance provided it is
utilized efficiently and in an effective manner at its optimal level. However, the question
of what constitute an optimal capital structure remains unanswered and the most
controversial issue in the finance circles (Kajola, 2010). There is no agreement on the
8
nature of effects of capital structure on the profitability from both the theoretical and
different empirical studies. The information asymmetry proposition of Myers & Majluf
(1984) proposes a negative correlation because companies regardless of their market
position would rely on the retained earnings for expansion instead of costly external
finance. On the other hand, MM’s tax/ interest shield proposition predicts a positive
relationship since at higher income level, corporation would want to utilize more debt
finance in their capital structure in order to shield their profits from taxation. Jensen &
Meckling (1986) also support that view and consider debt as disciplining tool that forces
managers to invest in projects, which add value to shareholders hence enhancing firm’s
performance. These conflicting theories created the need for further studies, which
motivated this research.
Numerous companies listed in the NSE have embarked on massive use of debt in their
capital structure with expectation of improving their financial performance. Debt finance
offers an opportunity for the firm increase its performance by facilitating acquisition of
the productive assets (Anyanzwa, 2015). Financial analyst have argued in the support of
debt use and considers debt finance as good in enhancing firms performance provided its
acquired at the favorable rate and its proceeds utilized in a good way. However, in the
recent past companies with huge debts in their capital structure such as Kenya Airways,
Home Africa, Uchumi Supermarkets, ARM cement, Mumias Sugar Company and
Transcentury have reported huge losses and found themselves in serious debt crises
owing creditors more than their net worth (Juma, 2016). These developments coupled
with the lack of universal theory triggered the need for further research to look into the
effects of composition of capital on the firm financial performance, which motivated this
research study.
9
Moreover, many studies have for long been conducted globally and locally on the capital
structure decisions. Abor (2005) did a research study on the effects of firms capital
structure on the profitability of companies quoted on the Ghana Stock Exchange and he
established that both short-term liabilities and long-term debt obligations have a
significant positive relationship with firm profitability. Saeedi & Mahmoodi (2011) did
the study on the effects of capital structure on performance of firms in the Tehran Stock
Exchange and concluded that capital structure has no effects on the performance of firms.
Baum et al. (2007) assessed the impact debt on the profitability of American industrial
companies. The study used firm size to analyze the behavior of the French firms and
concluded that debt capital has no effect on the firm’s financial performance regardless of
firm sizes. Zeltun & Tian (2007) did a study on the effects of capital structure on the firm
financial performance and concluded that there is a negative correlation among capital
structure and firm’s financial performance.
Locally, Chepkemoi (2013) did a research study on the effect of capital structure on firm
financial performance of SMEs and indicated that capital structure is negatively related
with the profitability of the firm although it has positive effect on growth of sales.
Karanja, (2014) assessed the effect of capital structure on the profitability of the SMEs in
dairy in Kiambu and determined that capital structure is negatively related with firm
financial performance of SMEs. Kuria (2013) carried a research study on effect of capital
structure on the profitability of commercial banks listed in the Nairobi security exchange
and concluded that capital structure is positively correlated with the firm financial
performance though the relationship was not statistically significant. Mwangi (2010) did
a research study on the effect of capital structure on the profitability of companies quoted
at the NSE and discovered that, firm financial leverage has a significant negative effect
on the profitability. The review of prior studies in Kenyan context on this topic have
10
produced mixed and conflicting results, which justifies the need for further studies. This
research study therefore, seeks to contribute to the existing literature by addressing the
following question: what is the effect of capital structure on the financial performance of
firms quoted at the Nairobi Security Exchange?
1.3 Research Objective
To examine the effect of capital structure on financial performance of companies quoted
at the Nairobi Security Exchange.
1.4 Value of the Study
To the firm’s shareholders and management, this study will enlighten them on the effect
of capital structure on their firm’s value thus help them make informed financing
decisions about debt capital that would enhance their firm’s financial performance. It will
also provide corporate financial managers with information that will help them establish a
financing policy on how the firm should finance their assets to maximize its value.
To the government and other regulators and policy makers, the findings of this study will
be useful in regard to advising and formulation of policies and guidelines that would not
just govern the firms but also enhance their performance which in turn will improve the
performance of the economy. The study will also assist company policy makers in
determining the optimal capital structure to maintain in their capital structure in order to
maximize the company value by minimizing financing costs
To the investors and other financiers, the study seeks to enlighten them on how capital
structure affect the financial performance of firms thus help them make informed
investment and lending decisions that will ensure they get a return on their investment.
To academicians and future researchers, the study will form a basis for future research by
providing additional information on this particular topic.
11
CHAPTER TWO: LITERATURE REVIEW
2.1 Introduction
This section contains the review of the literature that informs the study on the effects
of capital structure on the financial performance. Theoretical and empirical literature
is also reviewed to provide new knowledge. This will be followed by the literature
summary.
2.2 Theoretical Review
This section covers theories that help explain the effect of capital structure on
financial performance of the firm. These theories includes; the Pecking Order Theory,
Trade-Off Theory, Agency theory and the Market Timing theory.
2.2.1 Pecking Order Theory
Myers & Majluf (1984) came up with this theory. According to this theory, there is
no predefined optimal capital structure but instead asserts that, firms displays
different preference for utilizing internal funds or retained earnings over external
capital. It is the one of the most significant theories of company leverage and goes
against the firm’s idea of having distinctive combination of equity and debt finance,
which minimizes the corporation costs of funds. It suggests that the firm should
follow a well-specified order of priority with respect to financing sources to minimize
its information asymmetry costs, first choosing retained earnings, then debt and
finally raising equity as a last option. It advocates for retained earnings to be used
first in funding long-term projects and when they are exhausted or not available, then
debt is issued; and when it is insufficient or not available, equity is issued. The theory
argues that, as firms becomes more profitable, the lesser they seeks external funds
12
since they would have enough internal funds to support their investment projects
(Myers, 1984).
The explanation of the pecking order stems from the existence of the information
asymmetry where managers are assumed to know more about their company risk,
prospects and project value than external investors including capital markets.
According to Myers & Majluf (1984), investors places low value on the company
stock because of the inability of managers to convey information on the company
prospects including the new investment opportunities identified. This in return makes
managers who are believed to be at the core of company information to finance their
project using readily available retained earnings. If the retained earnings are
insufficient, managers will choose debt capital in the preference to issuing equity
shares since they are undervalued in the capital markets. The asymmetric information
effect therefore favors use of debt over equity and shows management confidence that
the newly identified investment opportunity is profitable and the current share price is
underpriced (Myers & Majluf, 1984).
2.2.2 Trade-Off Theory
This theory was proposed by Myers (1984). The theory holds that, there exists an
optimal capital structure for every firm, which can be determined by balancing the
costs and benefits of equity. As a result, a firm decides on how much debt capital and
how much equity capital to include in their capital structure by balancing on the costs
and benefits of each source. Debt capital results to benefits such as tax shied though
high debt levels in the capital structure can result to bankruptcy and agency expenses.
Agency expenses results from divergence of interest among the different firm
stakeholders and because information asymmetry (Jensen & Meckling, 1976).
13
Thus, including cost of agency into the trade-off theory signifies that a corporation
ascertains its optimal financial structure by balancing the benefit of debt (the tax
advantage of debt) against expenses of excessive debt (financial distress) and the
resultant equity agency expenses against debt agency costs. The theory further assert
that, as firm increases debt in their capital structure, the marginal cost associated with
debt increases while the marginal benefits associated with debt decreases until an
optimal point is reached. Beyond that point, the marginal costs of debt exceed the
marginal benefits resulting to reduced firm value. In this regard, the firm should set
an optimal financial structure in order to enhance its performance.
According to Myers (1984), firms with more tangible assets should have high debt
ratios while firms with more intangible assets should depend more on equity capital
because they are subject to lose of value in case of liquidation. Under this theory,
firms should evaluate the various costs and benefits of each debt level and determine
an optimal debt structure that balances the incremental costs and incremental benefits
(debt tax shields against costs of bankruptcy). This further explains why firms are
partly financed by equity and also partly financed by debt in their capital structure.
2.2.3 Market Timing Theory
The theory was developed by Baker & Wurgler (2002). The theory views firms’
capital structure as an outcome of the frequent attempts to time equity market,
whereby companies issue equity shares to create finance when the market prices are
high when compared to their book value or historic market prizes and then buys back
these shares when market prizes are low for firm. According to this theory, specified
optimal capital structure does not exist and the various attempts by financial
managers to time equity market over the time accumulate into a capital structure
14
outcome. Consequently, changes in share prices affect company capital structures.
Therefore, capital structure comes because of the market timing of when to issue debt
or equity depending on the performance of the market (Boudry, Kallberg & Liu
2010). The theory further assert that financial managers should consider which source
of finance is cheapest at any time through evaluation of the equity costs relative to the
cost of other means of raising funds. As a result, financing structure of the firm is
because of the different visit made to the market and the prevailing market conditions
(Graham & Harvey, 2001).
The theory assert that timing of equity market has an effects on financing structure
and describes low leverage firms as those firms which seek funds when the market
prizes are high while the high leverage firms as those which seek funds when the
market prizes are low. The theory was developed with the intentions of enabling
financial managers to take advantage of the short-term fluctuation in the cost of
equity finance relative to other forms of capital. This theory supports the idea that
companies choose equity finance when the relative equity cost is low, and choose
debt finance when the relative equity cost is high. This change in share price affects
capital structure and explains why firms at the same moment in time, firms have
distinct proportion of debt and equity in their financing structure. Equity should be
issued when relative cost is low while debt should be chosen when equity cost is high
(Kwast & Rose, 1982). Firms therefore chooses the form of financing which at the
moment in time seem to be more valued by the financial markets by paying attention
to the market conditions. The financing structure adopted by the firm at any given
time can be described as an outcome of the repeated trials to time equity market
(Baker & Wurgler, 2002).
15
2.2.4 Agency Theory
This theory relates to the relationship that exists among the shareholders as the
principal and the company agent (company’s managers). An agency association
comes into existence when one or many persons, referred to as principals, employ one
or many other persons, known as agents, to carry out some service and then give them
authority to make decision on his behalf. Jensen & Meckling (1976) suggests that, the
best capital structure can be attained by minimizing agency costs which emanates
from the conflicting managerial interests with those of debt holders and company
owners. They argue that managerial ownership in the company ought to be increased
to align managerial interests with the interests of the shareholders or employ debt use
to limit managers’ opportunistic behavior by reducing free cash flows. Jensen (1986)
demonstrated the agency problem, which is linked with free-cash flows. He pointed
out that the problem of free cash flow can be in one way or another be managed by
increasing managerial stake in the company or by increasing debt use in the
corporation capital structure, therefore limiting the sum of “free” cash that is at the
disposal of managers. Thus, corporations which mostly seeks debt finances gives
managers less discretionary power over how they can use free cash flows than those
financed by equity, and as a results, debt finance acts as a control tool, in which the
lenders and the company owners becomes the principals in the structure of corporate
governance.
Debt finance forces corporate managers to be controlled by the public capital. If
investors have negative opinion about the competence of management, they will
require high payment of interests on the amount lend to the company or they will put
on restrictive debt covenants to limit management degree of freedom. Debt finance
outstanding restricts management’s ability to lower the value of company through
16
incompetence dealings. They argue further that corporations with high debt levels can
provide benefits in the vibrant sense that companies with debt levels can respond very
quickly to development of adverse performance than firms with minimal debt level.
The choice to have high debt levels during regular business operations appears to
stimulate the company to take action operationally and financially after an adversity
within little period of time, helping to avoid extended periods of losses without a
response. Debt capital existence in financial structure can thus assist to protect the
value of company going concern (Jensen, 1986).
2.3 Determinants of Financial Performance
Profit is one of the chief goals of business organization. The ability to earn profit is a
good measure of the performance and distinguishes performing business organization
from non-performing entities. Most business activities and corporate strategies are
performed and designed to achieve this grand objective. Performance of the
organization is affected by many factors which are broadly classified as micro factors
and macro factors. Micro factors are firms specific and affects individual firm while
macro factors affects all the firms and sectors.
2.3.1 Firm’s Capital Structure
Capital structure describes how an organization raises the finances to support their
operations. It comprises of the mix of debt and equity and the decision to choose
either source of funds is based on weighing the resultant cost associated with them
because they have an implication on performance of a firm. Debt results to tax and
monitoring benefits. However, use of excessive debt exposes a firm to bankruptcy
risks and reduces the value of the firm. The appropriate use of the optimal capital
structure in the financing acquisition of assets is important in maximization of the
17
return to all stakeholders and enhances the ability of the firm to compete by
minimizing the cost of the capital (Su & Vo, 2010).
Capital structure of the firm is an important managerial decision because it influences
the shareholders risks and returns (Mwangi et al, 2014). Financial managers should
always make an effort to build up an optimal capital structure that would be
advantageous to the equity shareholders in specific and also to other stakeholders
such as creditors, employees, customers and the society at large. Corporations
therefore, have a chance to adjust their cost of capital and the market value by
changing the firm’s capital structure (Abor, 2007).
2.3.2 Tangibility of Fixed Assets
Asset tangibility refers to the ratio of fixed assets to the total firm’s assets. The fixed
assets play a vital role in determining firms debt level, turnover and finally firms
profitability. Fixed assets of the firm have bigger economic value than intangible
asset, which tend to lose value quickly in case of bankruptcy and have minimal
informational asymmetries. The tangible assets are usually used as guarantee and
collateral for firm’s creditors in case a firm requires external financing. Therefore,
companies with high amount of tangible assets are expected to have high debt level in
the capital structure than a firm with fewer tangible assets. These external finances in
turn lead to high turnover and enhance the firm’s performance if efficiently utilized
(Rajan, & Zingales, 1995).
The tangible assets of the company comprises of all assets owned by the company
that have continuing physical existence and are purposely acquired for operational
use. These assets are not meant for sale to the customers and include land, buildings,
18
plant and machinery, equipments and other fixed assets. The tangible assets are very
important to the firm and enables corporate managers to evaluate the asset position of
the firm without using the obsolete values of intangible assets. Lenders demand these
assets as collaterals and consider them as explicit promise for debt payment. The
theory of agency argues that these collateralized assets acts as monitoring devices for
manager’s behavior and hinders the transfer of the wealth from the debt holders to the
shareholders. Therefore, debt level in the capital structure is expected to have a
positive correlation with the assets tangibility (Niu, 2008).
2.3.3 Firm Liquidity Level
Liquidity refers to the extent by which company meets its immediate obligations in
full and in a timely way. Excessive liquidity lead to building up of idle resources that
does not create any profits for the firm while low levels of liquidity on the other hand,
lead to damage of company goodwill, reduce credit standings and it can also lead to
compulsory liquidation of company’s assets. It cannot be doubted that every firm
desires to maximize profitability by maintaining appropriate level of liquidity.
However, magnifying profits at the expense of liquidity can cause serious trouble to
the company, which can lead to financial insolvency as well. As a result, firm should
properly manage their liquidity in order to maximize their profitability (Vieira, 2010).
Assets are said to be liquid if such assets can be swiftly be changed into cash.
Whether a firm has or is coming up with readily available capital base to facilitate its
operation, is a critical performance concern in relation to the firm’s liquidity.
Liquidity of the firm is measured using liquidity ratios such as cash ratios, current
ratios, quick ratios and the changes in the working capital of the firm (Brealey et al,
2001). The capability of the firm to pay its maturing obligations on a timely way is of
19
vital importance and is closely related to firm’s performance and existence. The
inability of the firm to maintain sufficient liquidity level can make the company
insolvent and jeopardize its operations (Gitman, 2003).
2.4 Empirical Review
Abor (2005) did a study investigating the connection between profitability and the
capital structure for firms quoted in Ghana Stock Exchange for the period starting
1998-2002. He concluded that short-term debt has a positive relationship with
profitability because of low interest rates. He also established that positive
relationship exist between total debt and profitability because total debt comprises
largely of short-term financing. However, long-term financing was found to have
negative relationship with the performance because they are more expensive in the
capital market.
Adekunle (2009) did a research study on the impact of financial structure on the
firm’s profitability in Nigeria for the period 2001-2007. He sampled 30 non-financial
companies quoted in Nigerian stock exchange and collected secondary data from
company’s financial statements. The study used debt ratios as the independent
variables and ROA and ROE as the dependent variable. The study employed ordinary
least square estimation approach and established that debt ratio has a significant
negative relationship with the performance of the firms.
Onaolapo & Kajola (2010) did a research on the effects of capital structure on the
profitability of firms quoted on Nigeria Stock Exchange. The research used a sample
of thirty non-financial firms for the period 2001-2007. The findings indicated that a
negative effect exist between capital structure and firm level of profitability. The
study used (ROE and ROA) of these companies. Rajan & Zingales (1995)
20
investigated the capital structure determinant of common corporations in seven big
countries in the world such as Japan, America, Germany, Italy, France, Canada and
Britain for the period 1987-1991. The research study used a sample of 4557 drawn
from the seven countries and the study results indicated that leverage has a negative
correlation with the firm profitability. However, the study showed a positive
correlation of leverage with the size of the firm and tangible assets value.
Langat et al. (2014) assessed the effect of debt financing on the profitability the Tea
Development Authority processing factories in Kenya. The study used ROE and
ROA to measure firm performance. The study found both long-term debt and total
debt have a positive effects on firm’s performance at 1% and 5% respectively. Short-
term debt on the other hand was found to have a negative relationship with the firm
profitability. The study then concluded that sourcing finances through short-term
debts by tea processing factories does not lead to profitability.
Pouraghajan and Malekian (2012) who did a research study to establish the effects of
capital structure on financial performance of firms listed in the Tehran Stock
Exchange in Iran. The results indicated that there is a negative correlation between
debt finance and profitability of companies.
Muchugia (2013) examined the effects of debt financing on the firm performance of
commercial banks in Kenya. The study employed a quantitative research design and
multiple regression analysis. He used return on equity as the dependent variable while
total debt, long term debt, firm size and short term liabilities as independent variables.
The research study concluded that short-term financing has a positive relationship
with the profitability of the firm. However, study also established that long-term
liabilities have a negative on the firm’s profitability.
21
Masiega et al (2013) did a study investigating the effects of capital structure on the
financial performance of listed companies at NSE. 30 listed companies at NSE were
sampled and data collected for period of five years starting from 2007 to 2011. The
study concluded that there is a significant positive correlation between long-term debt
and total company assets. The long-term debt has a positive effect on the financial
performance although the nature of the effects was weak and insignificant.
Kaumbuthu (2011) did a research study to determine the effects of capital structure
on financial performance of allied and industrial sectors in the NSE for period starting
from 2004-2008. Financial performance was measured using ROE while capital
structure was measured by ratio of debt to equity. Regression analysis was used and
concluded that a negative correlation exist between capital structure and the financial
performance.
Chepkemoi (2013) did a research study on the effect of capital structure on financial
performance of SMEs. The study was comprised of 295 SMEs located at Nakuru
town and employed multiple regression approach and descriptive statistics for
analysis. The results indicated that capital structure has a negative effect on
profitability of the firm although it has a positive effect on growth of sales.
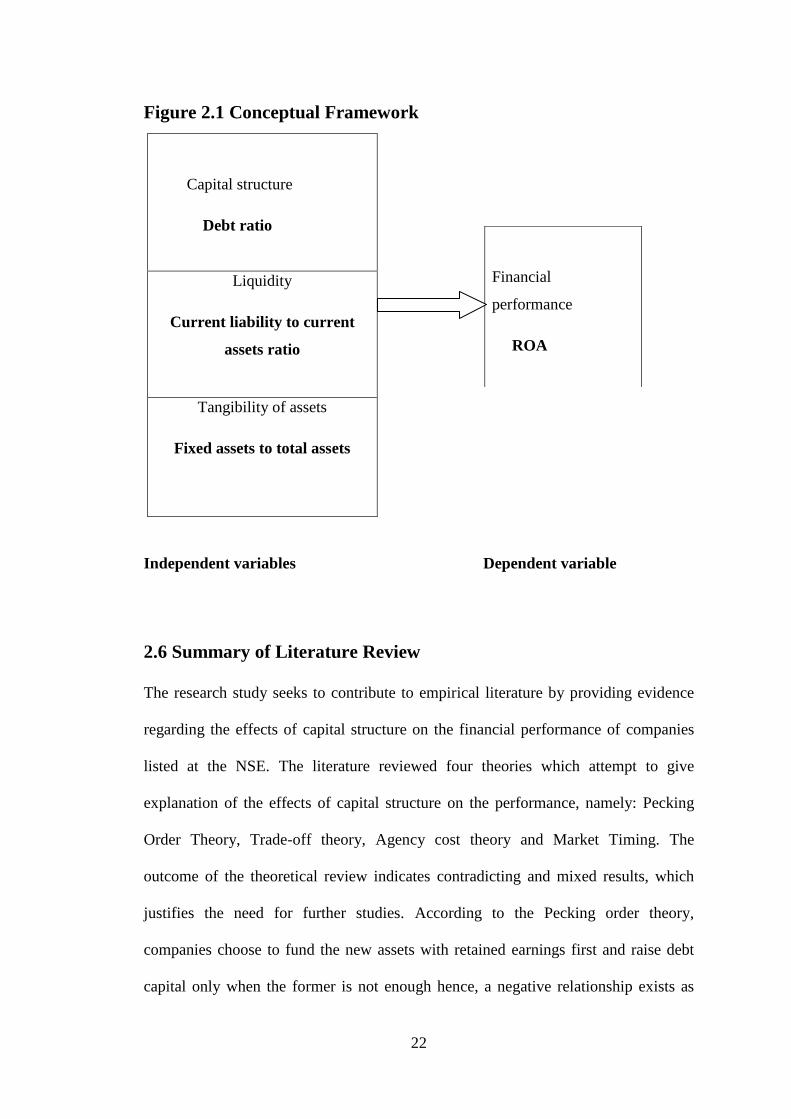
2.5 Conceptual Framework
The conceptual framework shows the relationship between the independent and the
dependent variables. It shows how capital structure interacts with other variables to
determine the financial performance of the firm.
22
Figure 2.1 Conceptual Framework
Capital structure
Debt ratio
Liquidity
Current liability to current
assets ratio
Tangibility of assets
Fixed assets to total assets
Independent variables Dependent variable
2.6 Summary of Literature Review
The research study seeks to contribute to empirical literature by providing evidence
regarding the effects of capital structure on the financial performance of companies
listed at the NSE. The literature reviewed four theories which attempt to give
explanation of the effects of capital structure on the performance, namely: Pecking
Order Theory, Trade-off theory, Agency cost theory and Market Timing. The
outcome of the theoretical review indicates contradicting and mixed results, which
justifies the need for further studies. According to the Pecking order theory,
companies choose to fund the new assets with retained earnings first and raise debt
capital only when the former is not enough hence, a negative relationship exists as
Financial
performance
ROA
23
retained earnings rely on the level of the profitability. MM’s tax/ interest shield
proposition predicts a positive relationship since at higher income level, corporation
would want to use more debt in their capital structure in order to shield their profits
from taxation. Jensen & Meckling (1986) also support that view and consider debt as
disciplining tool that forces managers to invest in projects, which add value to
shareholders hence enhancing firm’s performance.
Several empirical studies conducted on the effects of capital structure on the financial
performance of the firms also indicate mixed and contradicting results. For instance
Adekunle (2009), Onaolapo & Kajola (2010), Pouraghajan & Malekian (2012),
Kaumbuthu (2011) supports a negative correlation between the capital structure and
financial performance while Chepkemoi (2013), Masiega et al (2013), Kuria, (2013)
argues that capital structure has a positive effect on the financial performance of
companies. The disagreement in both theoretical and different empirical research
justifies the need for further studies, which motivated this study. This research study
therefore, seeks to contribute to the existing literature by providing evidence on the
effects of capital structure on the financial performance of listed firms at NSE.
24
CHAPTER THREE: RESEARCH METHODOLOGY
3.1 Introduction
This section covers the research methodology that was used in this research study.
Research methodology provides a brief description of all the steps and procedures
that are used in completing a study. The chapter discusses the research design, study
population, data collection, data analysis, analytical model and test of significance.
3.2 Research Design
According to Ghauri and Gronhaug (2005), research design involves establishing a
plan or a specified framework for collecting data for the study and its subsequent
analysis, which contains the research approach and the priorities of the great interest
to the researcher. It is an important program and directs the researcher in the process
of gathering, analyzing and deriving meaning from the data. This research study will
employ descriptive research design in order to establish the effects of capital structure
on financial performance. Descriptive research design is a powerful type of
quantitative analysis (Kothari, 2004). The descriptive design is chosen because it
enables the researcher describe research area, establish the relationship and explain
the data collected in order to examine the similarities and differences with our frame
of reference within a specific period of time. The aim of this research project is to
determine the associative relationship between debt capital as the predictor variable
and the financial performance as the dependent variable. Therefore, descriptive
research approach is well-suited design for this study.
3.3 Study Population
The population under this study was comprised of forty seven non-financial listed
firms quoted in the Nairobi security exchange. The financial firms were excluded
25
from the analysis since their operations are regulated by the financial regulators such
as the central bank of Kenya and insurance regulatory authority concerning the
amount of capital and liquidity they should maintain. Since the target population of
this study is small, the study was a census where all the members of the population
were considered. NSE register marked the population frame.
3.4 Data Collection
The study employed secondary data. The data for all the research variables as
captured in the study model was collected from audited financial statements obtained
from the company website and NSE Handbook covering the period from 2011 to
2015. Data will be extracted from the statement of comprehensive income and
financial position. Data was collected on the key variables including short-term debt,
fixed assets, total assets, net profit after tax, total debt and current assets.
3.5 Data Analysis
Data analysis refers to the application of statistical techniques in seeking answers to
research questions through evaluation and subsequent interpretation of collected data
(Shamoo & Resnik, 2003). The collected data was then sorted, edited and verified for
accuracy in preparation for analysis. Statistical Package for Social Sciences software
and Microsoft’s Excel was used to analyze quantitative secondary data using
descriptive statistics to show measures of tendencies such as means, tables,
percentages and standard deviations. Correlation analysis and regression analysis was
also be used to establish the relationship between debt capital and the performance.
Also, ANOVA analysis and the t-test will also be performed to establish the
relationship that exists between the variables of the study.
26
The study findings were presented in the form of tables and graphs to indicate the
trend of the variables over the study period. ROA was used in measuring performance
while the capital structure was measured using debt ratios. Debt ratio shows the size
of the debt in accordance to total assets owned. Firm’s liquidity was measured using
ratio of current liabilities to current assets while the assets tangibility was measured
using fixed assets owned to total assets ratio. To ascertain the effects of capital
structure on the financial performance of non-financial firms quoted at NSE,
regression analysis was conducted using the following analytical model.
Y= a+B1X1+B2X2+B3X3+ ε
Where:
Y = Financial performance measured by ROA
a defines the value of performance without the inclusion of the independent variables
X1 to X3 represent the independent variables of the study.
X 1= Debt ratio (Total debt to total capital ratio)
X2 = Liquidity (Current assets to current liabilities)
X3 = Tangibility of assets (Fixed assets to total assets)
ε = Stochastic error term
B1 to B3 Shows the coefficients of the model and defines the amount by which
dependent variable (Y) is changed for a unit change in the value of independent
variable (X).
27
3.5.1 Test of Significances
To test the statistical significance of the regression analysis between capital structure
and financial performance, all statistical calculations was done at 95% confidence
interval with a p-value of 0.05 or less being considered sufficient for a statistically
significant correlation. The goodness of fitness of the regression model was tested
using Analysis of Variance (ANOVA). F critical value and a p-value of 0.05 or less
will be used as indicators of the regression model’s reliability.
.
28
CHAPTER FOUR: DATA ANALYSIS AND RESEARCH
FINDINGS
4.1 Introduction
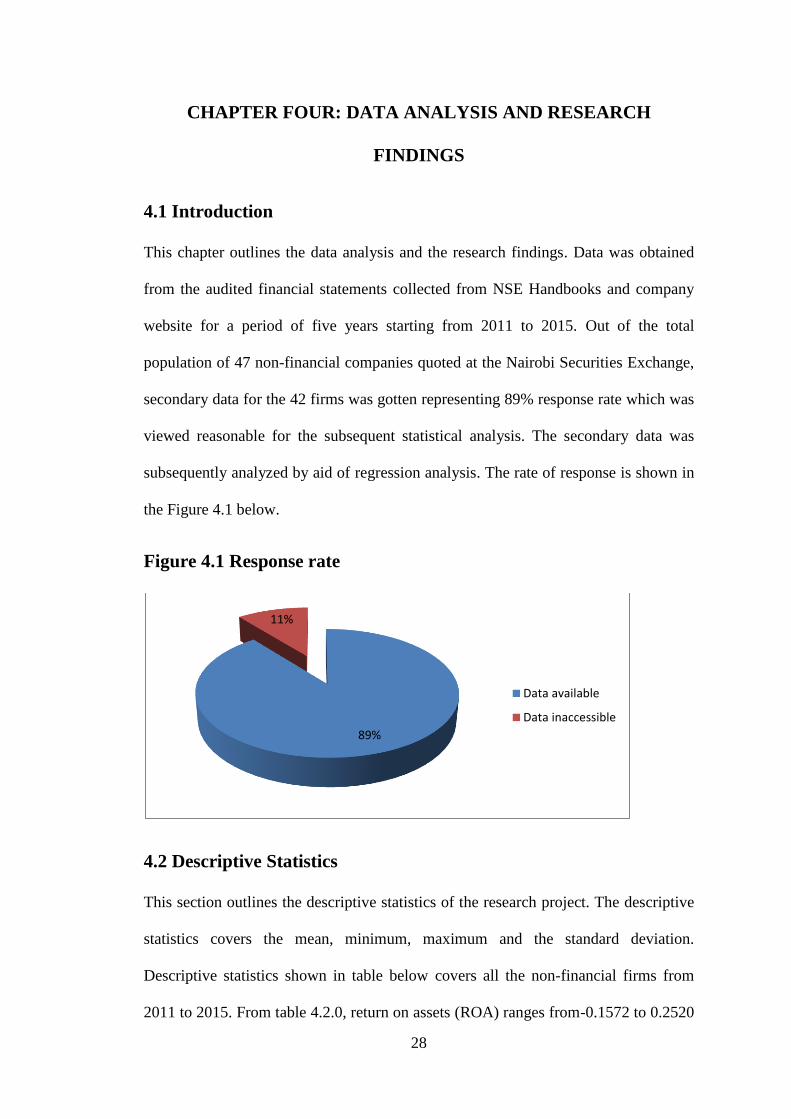
This chapter outlines the data analysis and the research findings. Data was obtained
from the audited financial statements collected from NSE Handbooks and company
website for a period of five years starting from 2011 to 2015. Out of the total
population of 47 non-financial companies quoted at the Nairobi Securities Exchange,
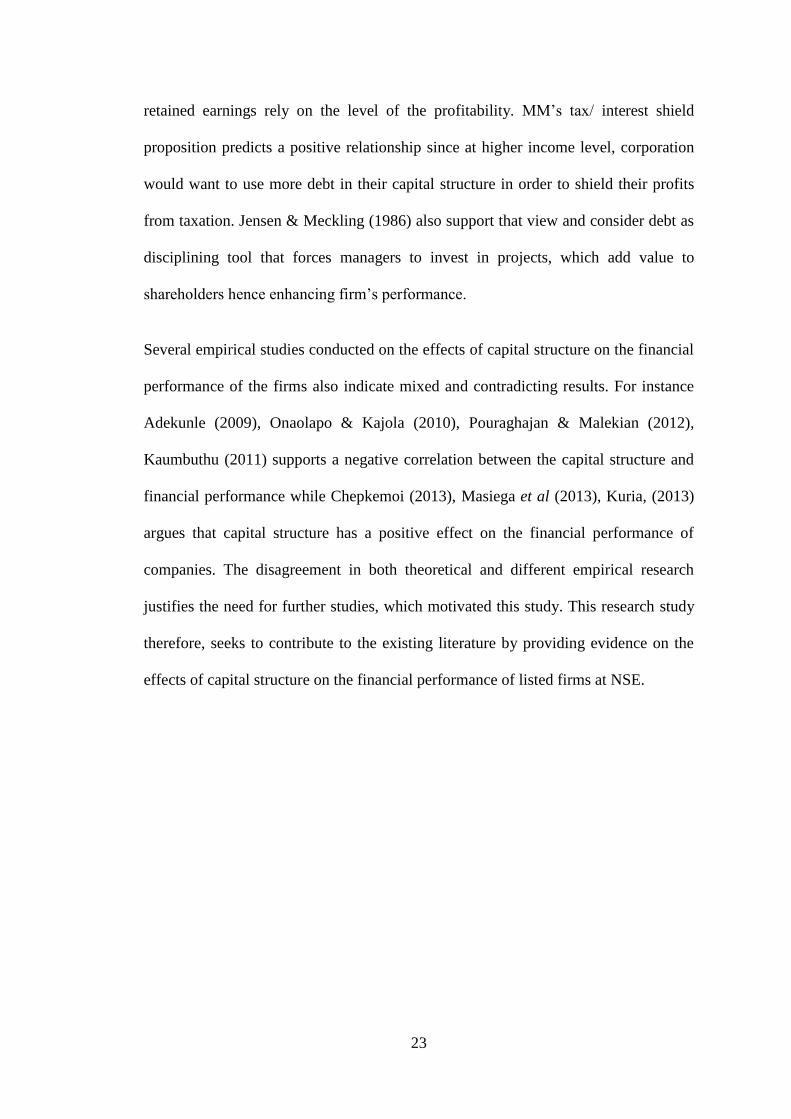
secondary data for the 42 firms was gotten representing 89% response rate which was
viewed reasonable for the subsequent statistical analysis. The secondary data was
subsequently analyzed by aid of regression analysis. The rate of response is shown in
the Figure 4.1 below.
Figure 4.1 Response rate
4.2 Descriptive Statistics
This section outlines the descriptive statistics of the research project. The descriptive
statistics covers the mean, minimum, maximum and the standard deviation.
Descriptive statistics shown in table below covers all the non-financial firms from
2011 to 2015. From table 4.2.0, return on assets (ROA) ranges from-0.1572 to 0.2520
89%
11%
Data available
Data inaccessible
29
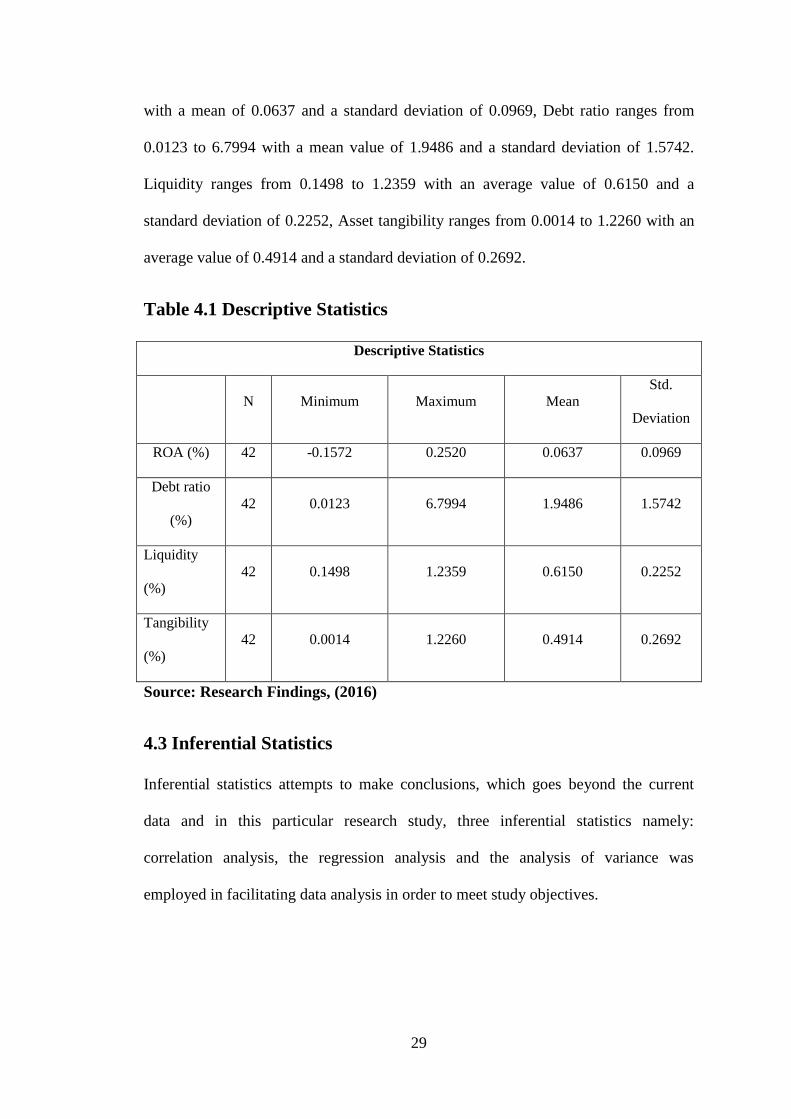
with a mean of 0.0637 and a standard deviation of 0.0969, Debt ratio ranges from
0.0123 to 6.7994 with a mean value of 1.9486 and a standard deviation of 1.5742.
Liquidity ranges from 0.1498 to 1.2359 with an average value of 0.6150 and a
standard deviation of 0.2252, Asset tangibility ranges from 0.0014 to 1.2260 with an
average value of 0.4914 and a standard deviation of 0.2692.
Table 4.1 Descriptive Statistics
Descriptive Statistics
N Minimum Maximum Mean
Std.
Deviation
ROA (%) 42 -0.1572 0.2520 0.0637 0.0969
Debt ratio
(%)
42 0.0123 6.7994 1.9486 1.5742
Liquidity
(%)
42 0.1498 1.2359 0.6150 0.2252
Tangibility
(%)
42 0.0014 1.2260 0.4914 0.2692
Source: Research Findings, (2016)
4.3 Inferential Statistics
Inferential statistics attempts to make conclusions, which goes beyond the current
data and in this particular research study, three inferential statistics namely:
correlation analysis, the regression analysis and the analysis of variance was
employed in facilitating data analysis in order to meet study objectives.
30
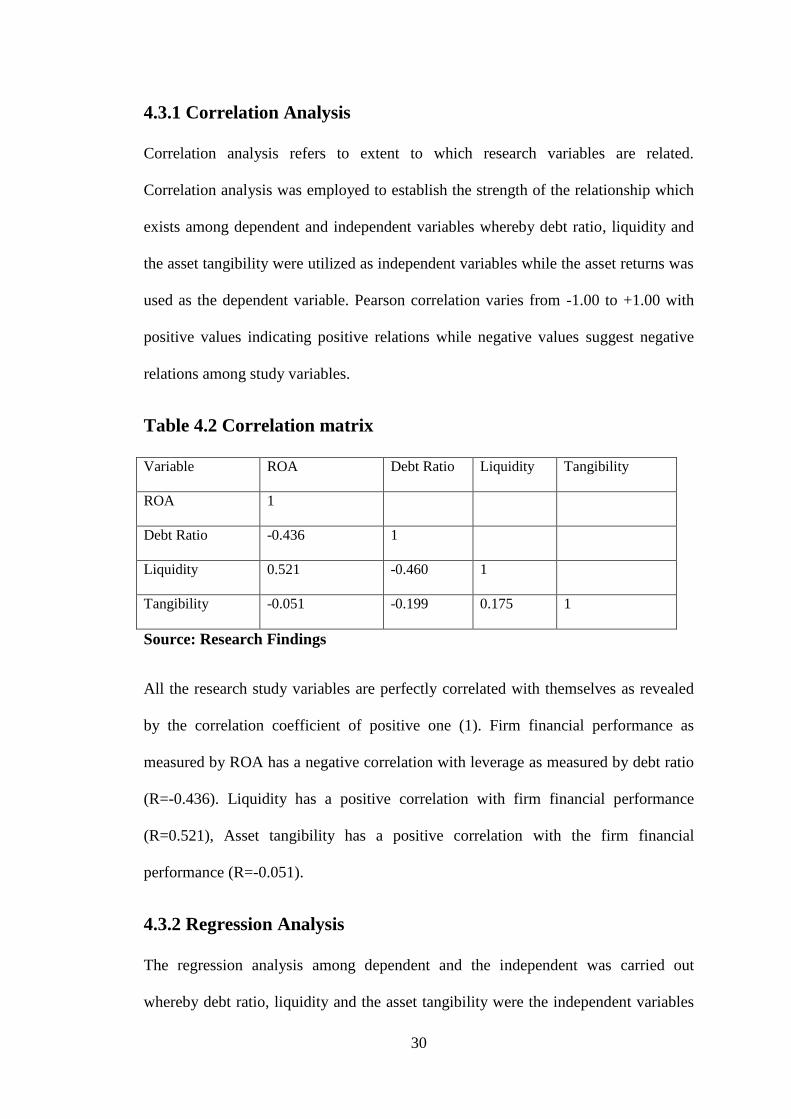
4.3.1 Correlation Analysis
Correlation analysis refers to extent to which research variables are related.
Correlation analysis was employed to establish the strength of the relationship which
exists among dependent and independent variables whereby debt ratio, liquidity and
the asset tangibility were utilized as independent variables while the asset returns was
used as the dependent variable. Pearson correlation varies from -1.00 to +1.00 with
positive values indicating positive relations while negative values suggest negative
relations among study variables.
Table 4.2 Correlation matrix
Variable ROA Debt Ratio Liquidity Tangibility
ROA 1
Debt Ratio -0.436 1
Liquidity 0.521 -0.460 1
Tangibility -0.051 -0.199 0.175 1
Source: Research Findings
All the research study variables are perfectly correlated with themselves as revealed
by the correlation coefficient of positive one (1). Firm financial performance as
measured by ROA has a negative correlation with leverage as measured by debt ratio
(R=-0.436). Liquidity has a positive correlation with firm financial performance
(R=0.521), Asset tangibility has a positive correlation with the firm financial
performance (R=-0.051).
4.3.2 Regression Analysis
The regression analysis among dependent and the independent was carried out
whereby debt ratio, liquidity and the asset tangibility were the independent variables
31
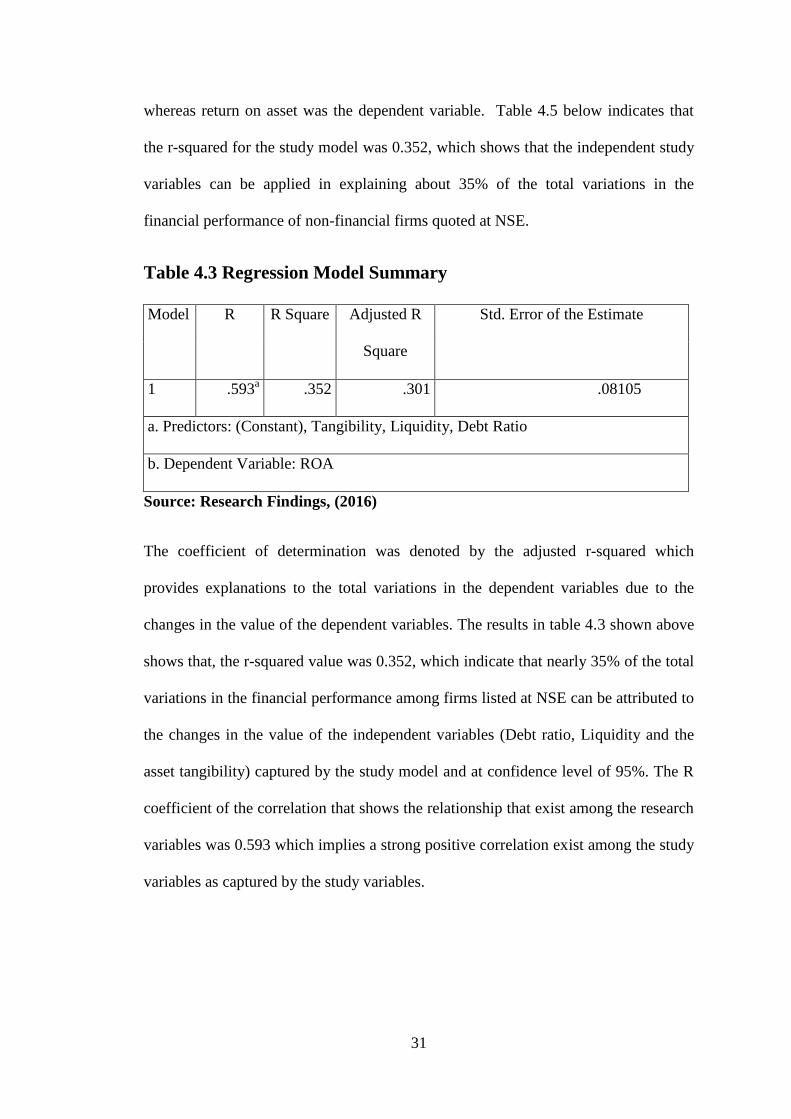
whereas return on asset was the dependent variable. Table 4.5 below indicates that
the r-squared for the study model was 0.352, which shows that the independent study
variables can be applied in explaining about 35% of the total variations in the
financial performance of non-financial firms quoted at NSE.
Table 4.3 Regression Model Summary
Model R R Square Adjusted R
Square
Std. Error of the Estimate
1 .593a .352 .301 .08105
a. Predictors: (Constant), Tangibility, Liquidity, Debt Ratio
b. Dependent Variable: ROA
Source: Research Findings, (2016)
The coefficient of determination was denoted by the adjusted r-squared which
provides explanations to the total variations in the dependent variables due to the
changes in the value of the dependent variables. The results in table 4.3 shown above
shows that, the r-squared value was 0.352, which indicate that nearly 35% of the total
variations in the financial performance among firms listed at NSE can be attributed to
the changes in the value of the independent variables (Debt ratio, Liquidity and the
asset tangibility) captured by the study model and at confidence level of 95%. The R
coefficient of the correlation that shows the relationship that exist among the research
variables was 0.593 which implies a strong positive correlation exist among the study
variables as captured by the study variables.
32
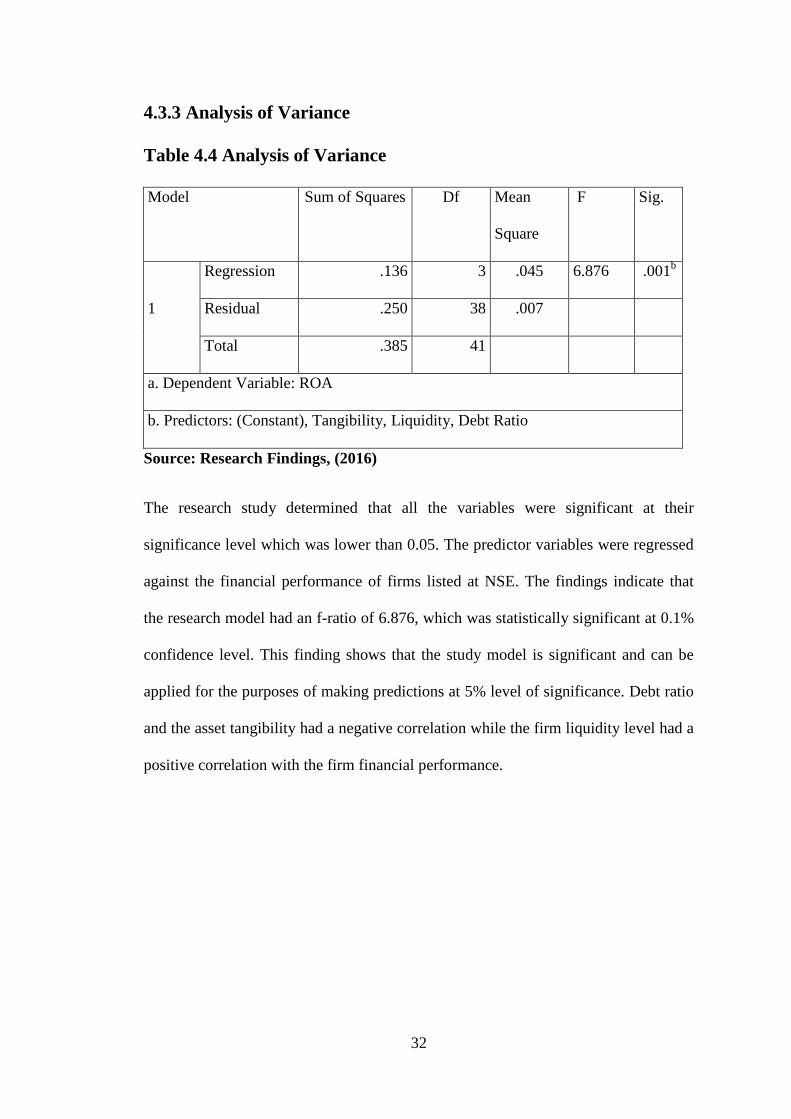
4.3.3 Analysis of Variance
Table 4.4 Analysis of Variance
Model Sum of Squares Df Mean
Square
F Sig.
1
Regression .136 3 .045 6.876 .001b
Residual .250 38 .007
Total .385 41
a. Dependent Variable: ROA
b. Predictors: (Constant), Tangibility, Liquidity, Debt Ratio
Source: Research Findings, (2016)
The research study determined that all the variables were significant at their
significance level which was lower than 0.05. The predictor variables were regressed
against the financial performance of firms listed at NSE. The findings indicate that
the research model had an f-ratio of 6.876, which was statistically significant at 0.1%
confidence level. This finding shows that the study model is significant and can be
applied for the purposes of making predictions at 5% level of significance. Debt ratio
and the asset tangibility had a negative correlation while the firm liquidity level had a
positive correlation with the firm financial performance.
33
Table 4.5 Regression Coefficients
Source: Research Findings, (2016)
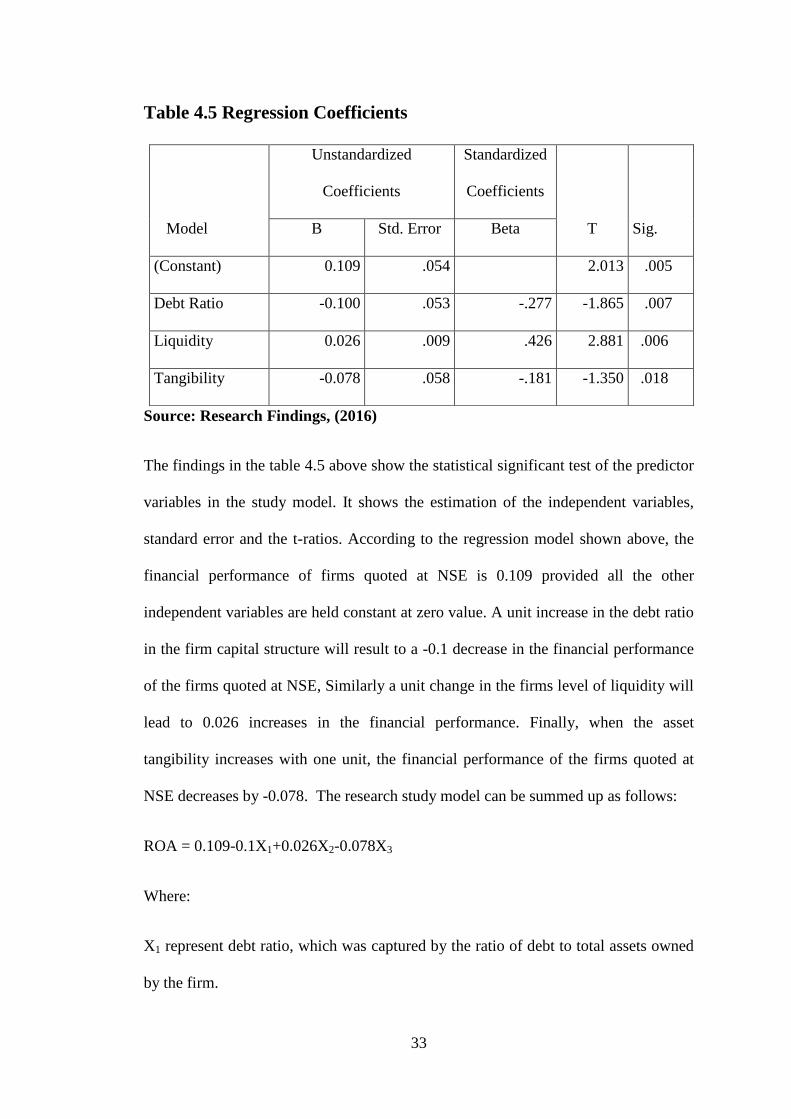
The findings in the table 4.5 above show the statistical significant test of the predictor
variables in the study model. It shows the estimation of the independent variables,
standard error and the t-ratios. According to the regression model shown above, the
financial performance of firms quoted at NSE is 0.109 provided all the other
independent variables are held constant at zero value. A unit increase in the debt ratio
in the firm capital structure will result to a -0.1 decrease in the financial performance
of the firms quoted at NSE, Similarly a unit change in the firms level of liquidity will
lead to 0.026 increases in the financial performance. Finally, when the asset
tangibility increases with one unit, the financial performance of the firms quoted at
NSE decreases by -0.078. The research study model can be summed up as follows:
ROA = 0.109-0.1X1+0.026X2-0.078X3
Where:
X1 represent debt ratio, which was captured by the ratio of debt to total assets owned
by the firm.
Model
Unstandardized
Coefficients
Standardized
Coefficients
T Sig. B Std. Error Beta
(Constant) 0.109 .054 2.013 .005
Debt Ratio -0.100 .053 -.277 -1.865 .007
Liquidity 0.026 .009 .426 2.881 .006
Tangibility -0.078 .058 -.181 -1.350 .018
34
X2 represent the firm’s liquidity level, which was captured by the ratio of current
assets to the current liabilities.
X3 represent asset tangibility, which was captured by the ratio of fixed assets to the
total asset owned by the firm.
E is a stochastic error term which denotes the unexplained variations (65%) indicating
the existence of other variables which can make the model better.
4.4 Interpretations of Findings
The objective of this research was to determine the effects the effects of capital
structure composition on the financial performance of firms listed at Nairobi security
Exchange. The firm’s financial performance was measured using return on asset ratio
while the capital structure was measured by use of debt ratio. The firm’s liquidity
level and the asset tangibility were used as the control variables for liquidity and asset
tangibility respectively. The chapter conducted inferential statistics to find out the
effects of capital structure on the financial performance. The results from the
statistical analysis indicated that, there is a strong (R= 0.593) association between the
capital structure and the financial performance of firms listed at Nairobi Security
Exchange. The study findings revealed that the independent variables debt ratio,
liquidity and asset tangibility explains and can be applied in making predictions of the
financial performance of non-financial firms quoted at NSE. These independent
variables namely debt ratio, liquidity and the asset tangibility could explain about
35% of the total variations of the financial performance of non-financial firms quoted
at NSE.
35
The debt ratio has a negative effect on the financial performance. Firm’s liquidity was
found to have a positive relationship with the financial performance while the asset
tangibility has a negative effect on the firm value. The level of standard error was
0.08105, which represent the unexplained percentage of the study model indicating
that there exist other factors, which can make the model better for prediction
purposes. The significance value of .001 from the ANOVA results of the study shows
that the model was significant at 5% significance level with an F-ratio of 6.876. The
model ANOVA analysis thus indicates the capability of the independent variables in
providing explanations of about 35% of total variations in the financial performance.
The study further established that capital structure affects financial performances
negatively and in a statistically significant way.
Similar findings was found by Adekunle (2009) who did a research study on the
impact of financial structure on the firm’s profitability in Nigeria for the period 2001-
2007. He sampled 30 non-financial companies quoted in Nigerian stock exchange and
collected secondary data from company’s financial statements. The study used debt
ratios as the independent variables and ROA and ROE as the dependent variable. The
study employed ordinary least square estimation approach and established that debt
ratio has a significant negative relationship with the performance of the firms.
Kaumbuthu (2011) did a research study to determine the effects of capital structure
on financial performance of allied and industrial sectors in the NSE for period starting
from 2004-2008. Financial performance was measured using ROE while capital
structure was measured by ratio of debt to equity. Regression analysis was used and
concluded that a negative correlation exist between capital structure and the financial
performance.
36
CHAPTER FIVE: SUMMARY, CONCLUSIONS AND
RECOMMENDATIONS
5.1 Introduction
This chapter shows the summary of the results of the prior chapters, the conclusions
drawn from the study findings and the encountered shortcomings during the course of
the study. The chapter makes also policy recommendations, which can be executed to
attain high financial performance and firm’s worth. Finally, the chapter shows
suggestions for future research studies, which can be helpful to future scholars.
5.2 Summary
The main purpose of the research study was to ascertain the effect of capital structure
on the financial performance of firms quoted at Nairobi Security Exchange for the
period 2011-2015. The study sampled the 42 non-financial firms which had a
response rate of 89%. This response rate was considered good for facilitating
statistical analysis and completion of this study. The independent variable for the
study was capital structure and the dependent variable was firm’s financial
performance while the control variables included liquidity and asset tangibility.
Analysis was done with the help of Statistical Package for Social Science (SPSS)
version 21 and Microsoft’s Excel. Descriptive statistics such as means and standard
deviations were used to analyze the effects of capital structure on the financial
performance. The findings from the descriptive analysis indicated that, the mean debt
ratio was 1.9486 and standard deviation of 1.5742, the average liquidity ratio was
0.2252 and standard deviation of 0.2252 while the average tangibility of the fixed
asset was 0.4914 and had the standard deviation of 0.2692
37
The study findings indicated that the independent variables debt ratio, liquidity and
asset tangibility could explain about 35% of the total variations in the financial
performance of companies listed at NSE. The debt ratio was significant at 5% with a
coefficient of –o.1, which implies that the financial performance of non-financial
firms quoted at NSE is negatively affected by increase in debt ratio.
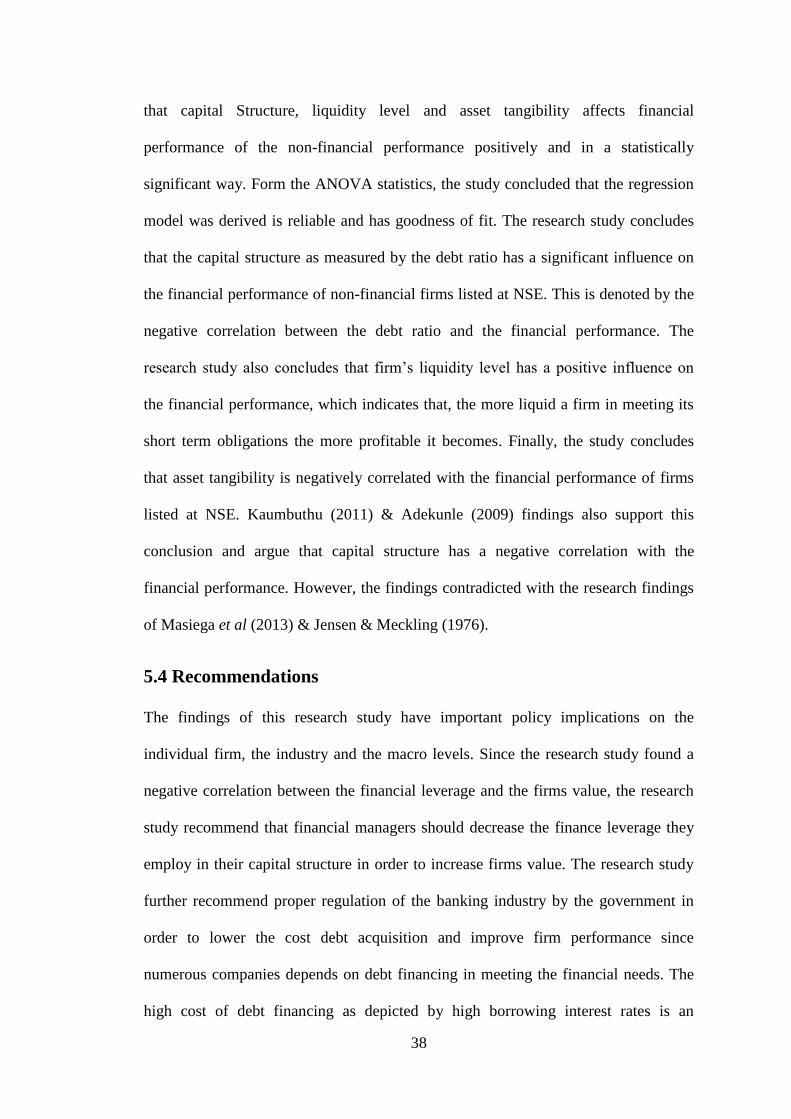
The firm’s liquidity level as measured by the current ratio was significant at 5%
significance level with a coefficient of 0.026, which implies that the financial
performance of the non-financial firms listed at NSE is positively correlated with the
firm’s liquidity. Therefore, an increase in the level of liquidity increases the firm’s
financial performance and the vice versa. The asset tangibility as measured by the
ratio of fixed asset to the total assets owned by the company was significant at 5%
confidence level with a coefficient of -0.78, which implies that financial performance
is negatively correlated with the increase in the fixed asset ratio. The analysis of the
variance (ANOVA) an F-ratio of 6.876 and a p- value of 0.001. This indicates that the
study model was significant and can be applied for the purpose of making predictions
since the p-value was less than 0.05. The results from the statistical analysis therefore
showed that the independent variables namely debt ratio, liquidity level and the firm
asset tangibility have a significant effects on the firms level of the profitability.
5.3 Conclusions
The study concludes that there is a strong relationship between capital structure
channels and firm financial performance of non-financial firms listed at Nairobi
Security Exchange and that 35% of the total changes in financial performance of the
non-financial firms listed at NSE a can be attributed to changes in the debt level in the
capital structure, firms liquidity and the asset tangibility. The study also concludes
38
that capital Structure, liquidity level and asset tangibility affects financial
performance of the non-financial performance positively and in a statistically
significant way. Form the ANOVA statistics, the study concluded that the regression
model was derived is reliable and has goodness of fit. The research study concludes
that the capital structure as measured by the debt ratio has a significant influence on
the financial performance of non-financial firms listed at NSE. This is denoted by the
negative correlation between the debt ratio and the financial performance. The
research study also concludes that firm’s liquidity level has a positive influence on
the financial performance, which indicates that, the more liquid a firm in meeting its
short term obligations the more profitable it becomes. Finally, the study concludes
that asset tangibility is negatively correlated with the financial performance of firms
listed at NSE. Kaumbuthu (2011) & Adekunle (2009) findings also support this
conclusion and argue that capital structure has a negative correlation with the
financial performance. However, the findings contradicted with the research findings
of Masiega et al (2013) & Jensen & Meckling (1976).
5.4 Recommendations
The findings of this research study have important policy implications on the
individual firm, the industry and the macro levels. Since the research study found a
negative correlation between the financial leverage and the firms value, the research
study recommend that financial managers should decrease the finance leverage they
employ in their capital structure in order to increase firms value. The research study
further recommend proper regulation of the banking industry by the government in
order to lower the cost debt acquisition and improve firm performance since
numerous companies depends on debt financing in meeting the financial needs. The
high cost of debt financing as depicted by high borrowing interest rates is an
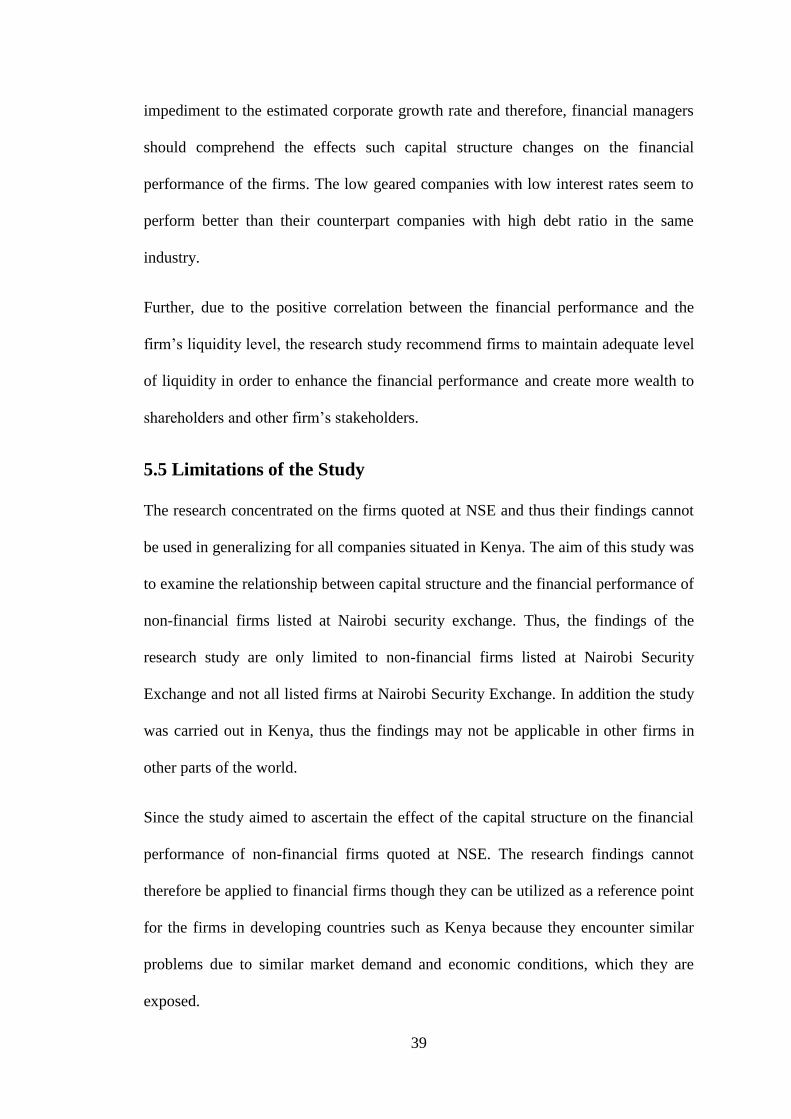
39
impediment to the estimated corporate growth rate and therefore, financial managers
should comprehend the effects such capital structure changes on the financial
performance of the firms. The low geared companies with low interest rates seem to
perform better than their counterpart companies with high debt ratio in the same
industry.
Further, due to the positive correlation between the financial performance and the
firm’s liquidity level, the research study recommend firms to maintain adequate level
of liquidity in order to enhance the financial performance and create more wealth to
shareholders and other firm’s stakeholders.
5.5 Limitations of the Study
The research concentrated on the firms quoted at NSE and thus their findings cannot
be used in generalizing for all companies situated in Kenya. The aim of this study was
to examine the relationship between capital structure and the financial performance of
non-financial firms listed at Nairobi security exchange. Thus, the findings of the
research study are only limited to non-financial firms listed at Nairobi Security
Exchange and not all listed firms at Nairobi Security Exchange. In addition the study
was carried out in Kenya, thus the findings may not be applicable in other firms in
other parts of the world.
Since the study aimed to ascertain the effect of the capital structure on the financial
performance of non-financial firms quoted at NSE. The research findings cannot
therefore be applied to financial firms though they can be utilized as a reference point
for the firms in developing countries such as Kenya because they encounter similar
problems due to similar market demand and economic conditions, which they are
exposed.
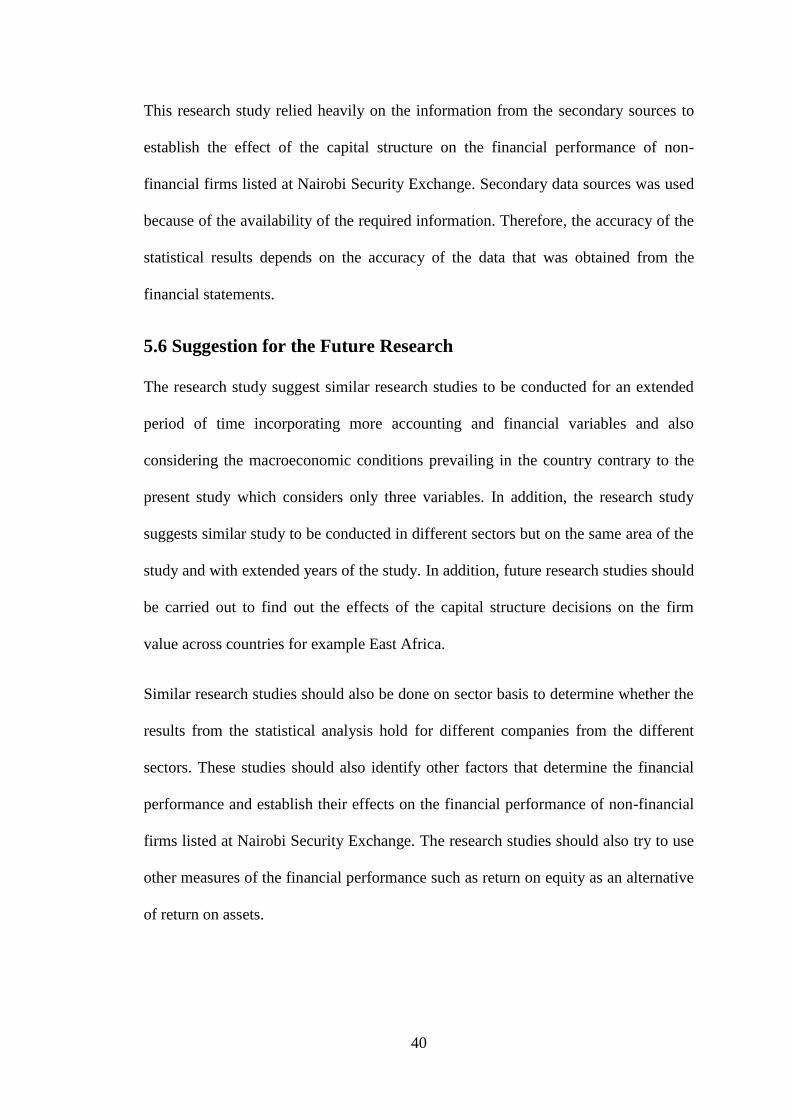
40
This research study relied heavily on the information from the secondary sources to
establish the effect of the capital structure on the financial performance of non-
financial firms listed at Nairobi Security Exchange. Secondary data sources was used
because of the availability of the required information. Therefore, the accuracy of the
statistical results depends on the accuracy of the data that was obtained from the
financial statements.
5.6 Suggestion for the Future Research
The research study suggest similar research studies to be conducted for an extended
period of time incorporating more accounting and financial variables and also
considering the macroeconomic conditions prevailing in the country contrary to the
present study which considers only three variables. In addition, the research study
suggests similar study to be conducted in different sectors but on the same area of the
study and with extended years of the study. In addition, future research studies should
be carried out to find out the effects of the capital structure decisions on the firm
value across countries for example East Africa.
Similar research studies should also be done on sector basis to determine whether the
results from the statistical analysis hold for different companies from the different
sectors. These studies should also identify other factors that determine the financial
performance and establish their effects on the financial performance of non-financial
firms listed at Nairobi Security Exchange. The research studies should also try to use
other measures of the financial performance such as return on equity as an alternative
of return on assets.
41
REFERENCES
Abor, J. (2005). The Effect of Capital Structure on Profitability: An Empirical
analysis of Listed Firms in Ghana, The Journal of Risk Finance, 6 (5), 438-47
Abor, J. (2007). How do we explain the capital structure of SMEs in sub-Saharan
Africa? Evidence from Ghana, Journal of Economics Studies, 8(4), 364-379.
Adekunle, A. O. & Sunday, O. K. (2010). Capital Structure and Firm Performance:
Evidence from Nigeria, European Journal of Economics, Finance and
Administrative Sciences, 25, 71-80.
Anyanzwa, J. (2015). Nairobi listed firms turn to debt financing to raise capital. The
East African, posted 14th
March 2015. Retrieved from
http://www.theeastafrican.co.ke/business/Nairobi-listed-firms-turn-to-debt-
financing-to-raise-capital/-/2560/2653420/-/7c6vtaz/-/index.html
Baker, M. & Wurgler, J. (2002). Market Timing and Capital Structure, Journal of
Finance, 57(1), 1–32.
Bichsel, G. & Blum, N. (2005). Capital Structure and Financing of SMEs: Australian.
Boudry, W, Kallberg, J & Liu, C (2010). An analysis of REIT security issuance
decisions, Real Estate Economic, 38(1), 91–120.
Brockington, R. (1990). Financial Management. (1992 Edition). London, ELBS.
Chepkemoi, N. (2013). An analysis of the effect of capital structure of SMEs on
financial performance: A Case of Nakuru town, Unpublished research project
of Kabarak University
42
Dang, Uyen. (2011). The CAMEL Rating System in Banking Supervision: A Case
Study of Arcada University of Applied Sciences, International Business
journal.
Fama, E., & Fench, K. (2002). Testing Trade-Off Theory and Pecking Order
Predictions about Dividends and Debt, Review of Financial Studies.
Ghauri, P., Gronhaug, K., (2005). Research Methods in Business Studies. 3rded. UK:
Prentice Hall.
Gitman, L. (2003). Basic Managerial Finance. 2nd
edition. New York: Harper &
Row
Graham, J. R., and Harvey, C., (2001). The Theory and Practice of Corporate
Finance: Evidence from the field, Journal of Financial Economics, 60, 187-
24.
Iraya, C. & Musyoki, L. N. (2013). Performance of Socially Screened Portfolio at the
Nairobi Securities Exchange. International Journal of Humanities and Social
Science, 3 (6).
Jensen & Meckling, (1976). Theory of the Firm: Managerial Behavior, Agency Cost
and Capital Structure, Journal of Financial Economics, 4(3), 60-305.
Jensen, C. M. (1986). Agency Costs of Free Cash Flows, Corporate Finance and
Takeovers, American Economic Review, 76(2), 323-329.
Jermias J. (2008). The Relative Influence of Competitive Intensity and Business
Strategy on the Relationship between Financial Leverage and Performance,
British Accounting Review, 3(40), 71-86.
43
Juma, V. (2016). Six NSE companies in survival dogfight as massive debt hurts. The
business daily posted 22RD
February 2016. Retrieved from
http://www.businessdailyafrica.com/image/view//3087492/medRes/1263757/-
/chws6j/-/NSE.jpg.
Karanja, M. G. (2014). The Effects of Capital Structure on the Performance of Small
and Medium Enterprises in Dairy Sector in Kiambu. Unpublished MSC
project, University of Nairobi
Kaumbuthu, M. (2011), Relationship between Capital Structure and Return on Equity
for Industrial and Allied Sectors in the Nairobi Securities Exchange.
Unpublished MBA project, University of Nairobi
Kharwish, H. A. (2011). Determinants of Commercial Banks Performance: Evidence
from Jordan, International Research Journal of Finance and Economics,
Zarqa University, 5(5), 19-45.
Kothari, C. R (2004). Research Methodology: Methods and Techniques (2nd
Rev.
ed.). New Age International
Kraus, A. & Litzenberger, R. H. (1973). A State-Preference Model of Optimal
Financial Leverage. Journal of Finance, 28(4), 911–922.
Kuria, F. B. (2013). The Effects of Capital Structure on the Performance of the
Commercial Banks in Kenya. Unpublished MBA project, University of
Nairobi.
44
Kwast, Mayron L. and John T. Rose (1982). Pricing, Operating Efficiency, and
Profitability among Large Commercial Banks, Journal of Banking and
Finance, 6(2), 233-254.
Langat, C. P., Chepkoech L., Shavulimo M. P., Wachira, M., & Thuo D. (2014). The
Effect of Debt Financing on the Profitability of Kenya Tea Development
Authority Processing Factories. Retrieved May 1, 2015, from
http://eserver.kabarak.ac.ke/OCS/index.php/conf05/conf05/paper/view/182
Modigliani, F. & Miller, M. (1958). The Cost of Capital, Corporation Finance and the
Theory of Finance, American Economic Review, 48(3), 291 – 297.
Musiega, M. G et al (2013). Capital Structure and Performance: Evidence from Listed
Non-Financial Firms on Nairobi Securities Exchange (NSE), Kenya.
International Journal for Management Science and Technology, 1(2).
Mwangi, L. W. Muathe, S. K. and Kosimbei, G. (2014). Relationship between Capital
Structure and Performance of Non-Financial Companies Listed in the Nairobi
Securities Exchange, Kenya. Global Journal of Contemporary Research in
Accounting, Auditing and Business Ethics, 1(2), 72-90.
Myers, S. C. & Majluf, N., (1984). Corporate Financing and Investment Decisions
when firms have information investors do not have. Journal of Financial
Economics, 13, 187-221.
Myers, S. C. (1984). The Capital Structure Puzzle, Journal of Finance, 39(6), 575-
592.
45
Myers, S. C. (2001). The Theory of the Capital Structure, Journal of Economic
perspectives, 15(2), 81-102.
Myers. S. C. (1977). Determinants of Corporate Borrowings, Journal of Financial
Economics, 5 (1977), 147-175.
Nairobi Security Exchange, (2016). History of Organization, Nairobi Security
Exchange Handbook, various editions, NSE.
Niu, X. (2008). Theoretical and Practical Review of Capital Structure and its
Determinants, International Journal of Business and Management, 3(3), 133-
139
Onaolapo, A. A. and Kajola, S. O. (2010). Capital Structure and Firm Performance:
Evidence from Nigeria, European Journal of Economics, Finance and
Administrative Science, 25, 70-82
Ongeri, G. M. (2014). The Effects of Macroeconomic Variables on the Financial
Performance of Non-Financial Institutions in Kenya, Unpublished MSC
project, University of Nairobi
Rajan, R. G. & Zingales, L. (1995). What do we know about Capital Structure? Some
Evidence from International Data, Journal of Finance, 50(14), 1421-60.
Reese, James S. & Cool, William R.,(1978). Measuring Investment Center
Performance, Harvard Business Review, 56, 28-46.
Saeedi, A. & Mahmoodi, I. (2011). Capital Structure and Firm Performance:
Evidence from Iranian Companies, International Research Journal of Finance
and Economics, 70(7), 20-29.
46
Shamoo, A. E., Resnik, B. R. (2003). Responsible Conduct of Research. Oxford
University Press.
Su, G. & Vo, H. T. (2010). The Relationship between Corporate Strategy, Capital
Structure and Firm Performance: An empirical study of the Listed Companies
in Vietnam, International Research Journal of Finance and Economics.
Vieira, R. S. (2010). The Relationship between Liquidity and the Profitability: An
Exploratory Study of Airline Companies between 2005 and 2008.
Zeitun, R. & Tian, G. (2007). Capital Structure and Corporate Performance: Evidence
from Jordan, Australasian Accounting Business and Finance Journal, 1(7),
40-53.
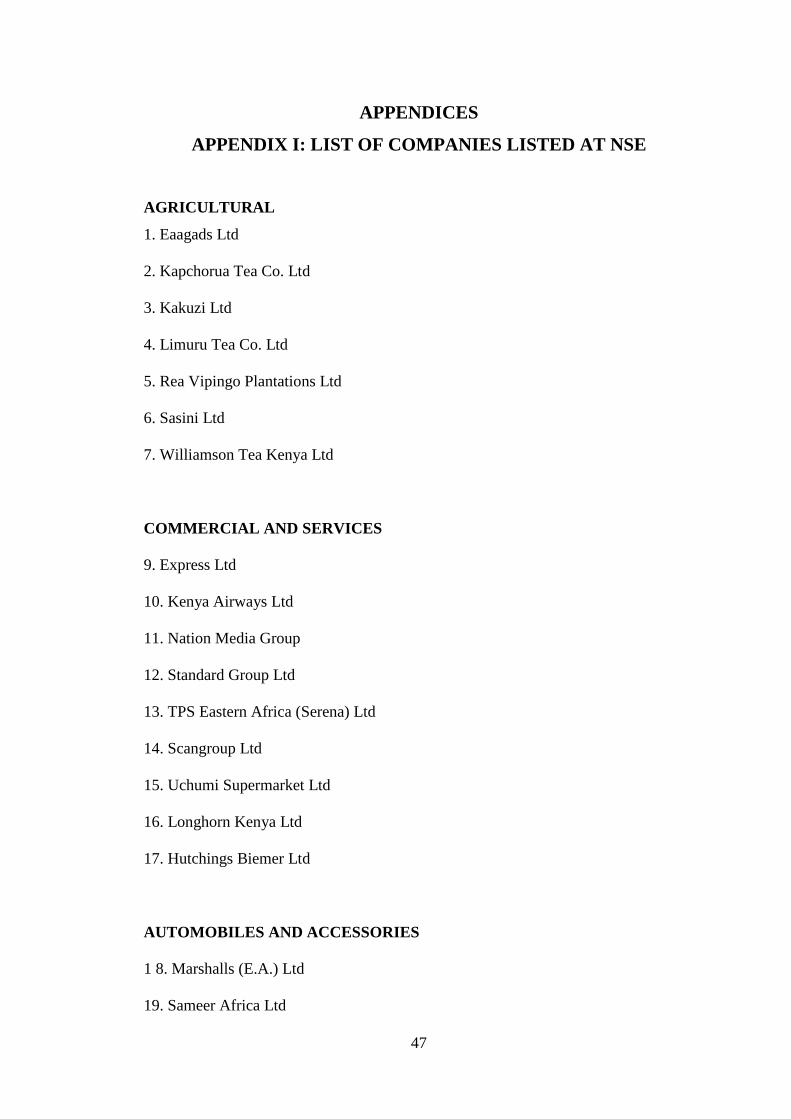
47
APPENDICES
APPENDIX I: LIST OF COMPANIES LISTED AT NSE
AGRICULTURAL
1. Eaagads Ltd
2. Kapchorua Tea Co. Ltd
3. Kakuzi Ltd
4. Limuru Tea Co. Ltd
5. Rea Vipingo Plantations Ltd
6. Sasini Ltd
7. Williamson Tea Kenya Ltd
COMMERCIAL AND SERVICES
9. Express Ltd
10. Kenya Airways Ltd
11. Nation Media Group
12. Standard Group Ltd
13. TPS Eastern Africa (Serena) Ltd
14. Scangroup Ltd
15. Uchumi Supermarket Ltd
16. Longhorn Kenya Ltd
17. Hutchings Biemer Ltd
AUTOMOBILES AND ACCESSORIES
1 8. Marshalls (E.A.) Ltd
19. Sameer Africa Ltd
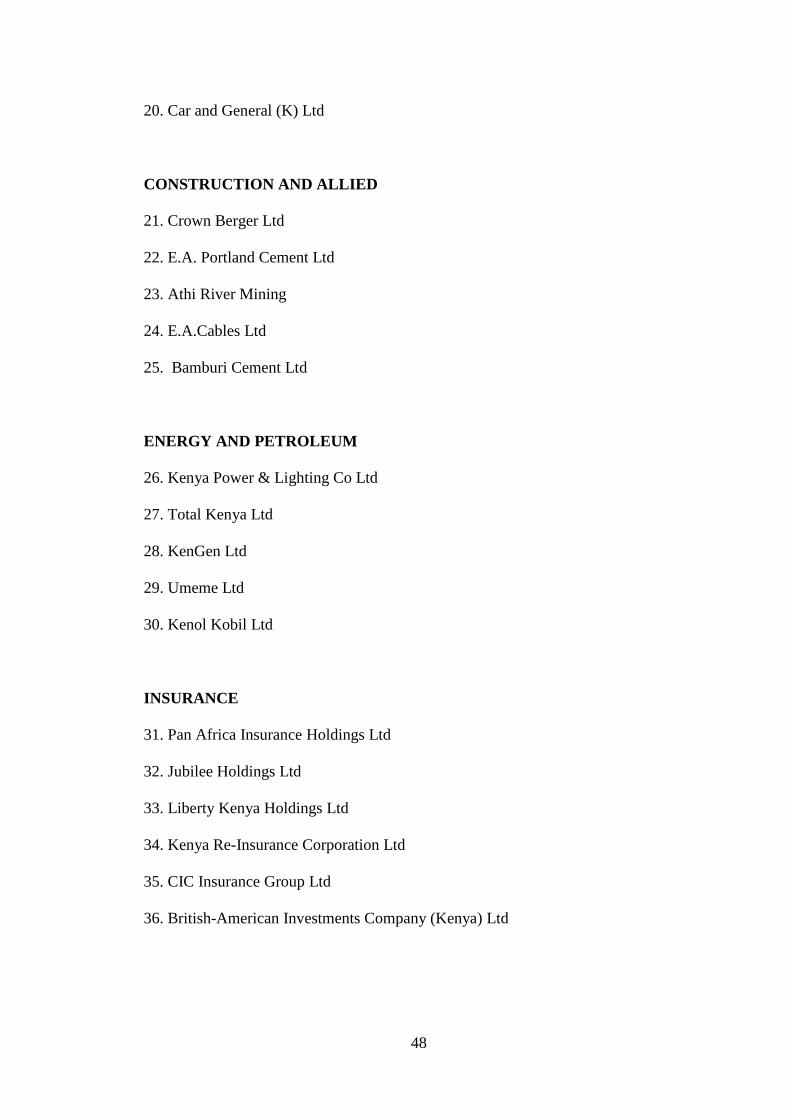
48
20. Car and General (K) Ltd
CONSTRUCTION AND ALLIED
21. Crown Berger Ltd
22. E.A. Portland Cement Ltd
23. Athi River Mining
24. E.A.Cables Ltd
25. Bamburi Cement Ltd
ENERGY AND PETROLEUM
26. Kenya Power & Lighting Co Ltd
27. Total Kenya Ltd
28. KenGen Ltd
29. Umeme Ltd
30. Kenol Kobil Ltd
INSURANCE
31. Pan Africa Insurance Holdings Ltd
32. Jubilee Holdings Ltd
33. Liberty Kenya Holdings Ltd
34. Kenya Re-Insurance Corporation Ltd
35. CIC Insurance Group Ltd
36. British-American Investments Company (Kenya) Ltd
49
INVESTMENT
37. Trans-Century Ltd
38. Centum Investment Co Ltd
39. Olympia Capital Holdings ltd
INVESTMENT SERVICES
40. Nairobi Securities Exchange
MANUFACTURING AND ALLIED
41. B.O.C Kenya Ltd
42. British American Tobacco Kenya Ltd
43. Carbacid Investments Ltd
44. East African Breweries Ltd
45. Mumias Sugar Co. Ltd
46. Unga Group Ltd
47. Eveready East Africa Ltd
48. Kenya Orchards Ltd
TELECOMMUNICATION AND TECHNOLOGY
49. Safaricom Ltd
GROWTH ENTERPRISE MARKET SEGMENT
50. Home Afrika Ltd
51. Kurwitu Ventures Limited
52. Flame Tree Group Holdings Limited
50
BANKING
53. Barclays bank
54. CFC Stanbic Holdings Limitted
55. Diamond Trust Bank Kenya Ltd
56. HF Group Ltd
57.KCB Group Ltd
58. National Bank of Kenya Ltd
59. NIC Bank Ltd
60. Standard Chartered Bank Ltd
61. Equity Group Ltd
62. The Cooperative Bank of Kenya Ltd
63. I &M Holdings Ltd
REAL ESTATE INVESTMENT TRUST
64. Stanlib Fahari I-REIT


