Embed Size (px)
Citation preview

INTRANUCLEAR TERMINAL DEOXYRIBONUCLEOTIDYL
TRANSFERASE (TdT) EXPRESSION IN ACUTE
LYMPHOBLASTIC LEUKEMIA: A FLOW CYTOMETRIC
ANALYSIS IN BONE MARROW ASPIRATE FIXED-
PERMEABILIZED CELLS.''
A dissertation submitted ir. part fulfillment for the award of the degree of Master of Medicine in Human Pathology.
By Dr.^Gachau, Giitwa Albert. MB; ChB. (Nairooi)
Depart m e n t of H u m an Pathology,
University of Nairobi.
University of NAIROBI Library
■ 1 10324905 9
DECLARATION
I certify that this dissertation is my original work and has not, to the best of my knowledge,
been submitted for a degree in any university.
Signed Date..
Dr. Gachau Giitwa Albert. MB; ChB.
Investigator and candidate
This dissertation has been submitted for examination with our approval as University
supervisors.
S i g n e d ....... D a te ...7 |p ^ j
Dr.Githanga, Jessie. MB; ChB., Mmed.
Senior lecturer
Department of Hematology and Blood Transfusion, University of Nairobi.
1

DEDICATION
To my parents Mr. and Mrs. John Earnest Gachau, my siblings Mucheru, Wangari, Makenye
and Kabue, my wife Josephine Wanja and my daughter Njeri for the support, inspiration,
patience and guidance.
11

ACKNOWLEDGEMENTS
This project dissertation could not have come to a successful conclusion had the following
individuals and the institutions they represent not shown interest and support.
The project supervisors Drs. Githang’a and Anzala for the guidance, constructive criticism
and moral concern during the entire period of its preparation and presentation.
Prof. Kigondu, Drs. Mwanda, Jane Mwangi. E.Njagi and J. Rajab for their ideas and
willingness to correct me whenever approached for their expertise.
The chairman dept, of Medical Microbiology-University of Nairobi, Dr. Walter Jaoko, for
allowing me access to KAVI laboratories and making available for use the FACSCalibur flow
cytometer and other relevant laboratory equipment and staff from which TdT related
parameters were oerived.
Mr. Peter Kimani and Raphael Gikera-technical staff from the department of Haematology
and blood transfusion
Mr. Julius Oyugi-then Senior Technologist and his colleagues Bashir Farah and Simon
Ogolla at KAVI, for training me on crucial aspects of flow cytometry anc' monoclonal
antibody staining.
Dr Thomas Scheidtweiler and Fr.Tom McDonald on behalf of KAAD-Africa for making
available a handsome financial researcn grant for the entire project.
Mr. Tobias Buluma and Bernard Muchoki for always being available at hand to assist in
computer technological aspects of publishing this manuscript. In the same vein, Mr. Samson
Mbuthia formerly of CARE international for making available SPSS for windows statistics
software.
Finally, to all others who knowingly or unknowingly contributed in kind towards the
completion of this dissertation anc who I have regrettably not mentioned.
I give thanks tc all.
iii
TABLE OF CONTENTS
DECLARATION............................................................................................................................. i
DEDICATION................................................................................................................................. ii
ACKNOWLEDGEMENTS.......................................................................................................... in
TABLE OF CONTENTS............................................................................................................. iv
LIST OF ABBREVIATIONS.......................................................................................................vii
LIST OF FIGURES........................................................................... ix
LIST OF TABLES......................................................................................................................... x
LIST OF APPENDICES.............................................................................................................. xi
ABSTRACT.................................................................................................................................... 1
1.0 INTRODUCTION AND LITERATURE REVIEW...........................................................3
1.1 Epidemiology......................................................................................................................3
1.2 Diagnosis of A L L ...............................................................................................................5
1.2.1 Morphology............................................................................................................... 5
1.2.3 Immunological analysis (immunophenotyping)..................................................... 7
%1.2.3.1 Principles of Flow Cytometry...........................................................................9
1.2.3.2 Terminal deoxyribonucleotidyl transferase (TdT)....................................... 13
y1.2.4 Cytogenetics............................................................................................................. 16
i v
2.0 JUSTIFICATION OF THE STUDY 17
2.2 Objectives of the study.................................................................................................20
2.2.1 Main objective:.........................................................................................................20
2.2.2 Specific objectives................................................................................................... 20
3.0 METHODOLOGY................................................................................................................ 21
3.1 Study design and data collection.................................................................................21
3.2 Study areas and population.......................................................................................... 21
3.3 Sampling of study subjects............................................................................................22
3.3.1 Criteria for inclusion into the study........................................................................22
3.3.2 Criteria for exclusion irom the study.....................................................................23
3.3.3 Selection of control cases......................................................................................23
3.3.4 Sample s ize..............................................................................................................24
3.3.5 Patient evaluation, specimen collection and processing...................................25
(i) History taking and physical examination.............................................................. 25
(ii) Specimen collection................................................................................................25*
(iii) Specimen analysis.................................................................................................. 26
3.4 Quality assurance (QA) for flow cytometry................................................................. 28
3.5 Statistical analysis...........................................................................................................29
4.0 ETHICAL CONSIDERATIONS.......................................................................................... 30
v

5.0 RESULTS............................................................................................................................ ..
6.0 DISCUSSION........................................................................................................................
7.0 CONCLUSION.................................................................................................................... ..
8.0 CONSTRAINTS ENCOUNTERED.................................................................................. 50
9.0 RECOMMENDATIONS..................................................................................................... ..
REFERENCES:......................................................................................................................... 53
vi

LIST OF ABBREVIATIONS
TdT Terminal deoxyribonucleotidyl Transferase
ALL Acute Lymphoblastic Leukemia
AML Acute Myeloid Leukemia
AUL Acute Undifferentiated leukemia
BMAs Bone marrow aspirates
D Dalton
DNA Deoxyribonucleic acid
EDTA Ethylenediamine tetra-acetic acid
FAB French American British co-operative group
FACS Fluorescence activated cell sorter
FCM FIowcytometric measurements/analysis
FSC Forward Scatter
KAVI Kenya AIDS Vaccine Initiative
KD Kilo Dalton
KNH Kenyatta National Hospital
Mabs Monoclonal antibodies
MIC Morphology, Immunophenotype, Cytogenetic
MRD Minimal residual disease
Vll

PAS Periodic Acid Schifr
PBMCs Peripheral blood mononuclear cells
SSC Side Scatter

LIST OF FIGURES
Figure 1
Figure 2
Figure 3
Figure 4
Figure 5
Distribution of acquired BMAs events as seer on a dot scatter plot 12
Dot plot showing positive and negative events in a TdT positive ALL 27
Morphological categories of 32 BMAs analyzed 32
Age distributions in patients with ALL 33
Distribution of blasts% counts in patients with ALL 35
IX

LIST OF TABLES
Table 1
Table 2
Table 3
Table 4
Number of cases admitted to the KNH during years 2000-2002
Peripheral blood parameters in seven patients on treatment for ALL 34
Clusters of cases and their TdT status 36
Mean values of gated TdT positive events in both isotype and anti-TdT
antibody for both cases and controls 36
Table 5 Con elation between indices for values obtained in the blast window 38
Table 6 Comparison of some characteristics in patients with ALL in three
previous studies. 41

LIST OF APPENDICES
Appendix 1 Consent form 59
Appendix 2 Data collection sheet 61
Appendix 3 Formula for calculation of sample size 6o
Appendix 4 Procedure for obtaining and handling BMAs and peripheral blood 64
Appendix 5 Procedure for TdT immunophenotyping 66
Appendix 6 Summary on findings of BMAs analyzed 68
Appendix 7 Study approval from KNH-Ethics and Research Committee 70
X I

ABSTRACT
BACKGROUND. Despite advances in the understanding of the biology and characterization
of acute lymphoblastic leukemia (ALL), evidence of utility of novel diagnostic techniques
oased on these developments is lacking in our setup. This is against a background of
increased case reporting and rising incidence of this disease.
OBJECTIVE. The aim of this study was to qualitatively and quantitatively detect the
presence and level of TdT expression in cell isolates obtained from bone marrow aspirates
in patients with ALL.
DESIGN. This was a cross sectional descriptive study that was carried out for three months
between June and August 2003. Consecutive cases of qualifying patients were recruited.
They were stratified into cases (for those with ALL) and controls for other diagnostic entities.
SETTING. This was a laboratory-based study carried out in the departments of
Haematology and Blood Transfusion and KAVI laboratories at the University of Nairobi’s
Faculty of Medicine. Patients were recruited from the selected nealth care oelivery points
within the KNH. Two cases were recruited from two private hospitals (one case each) within
Nairobi.
SUBJECTS. Thirty-two patients (eleven AlL and twenty one controls) were recruited over
the study period.
INTERVENTIONS. Peripheral blood and a bone marrow aspirate were obtained from each
patient selected to participate in the study. These were used for the morphological diagnosis
or ALL and other pathologies. BMAs were further used for flow cytometric analysis of TdT.
1
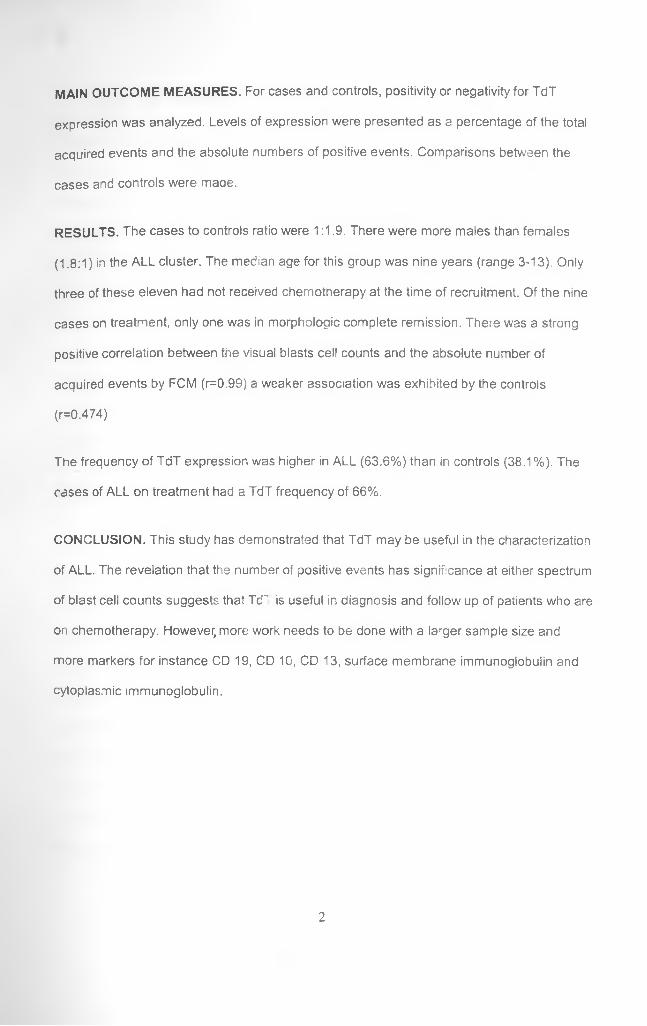
MAIN OUTCOME MEASURES. For cases and controls, positivity or negativity for TdT
expression was analyzed. Levels of expression were presented as a percentage of the total
acquired events and the absolute numbers of positive events. Comparisons between the
cases and controls were made.
RESULTS. The cases to controls ratio were 1:1.9. There were more males than females
(1.8:1) in the ALL cluster. The median age for this group was nine years (range 3-13). Only
three of these eleven had not received chemotnerapy at the time of recruitment. Of the nine
cases on treatment, only one was in morphologic complete remission. There was a strong
positive correlation between the visual blasts cel! counts and the absolute number of
acquired events by FCM (r=0.99) a weaker association was exhibited by the controls
(r=0.474)
The frequency of TdT expression was higher in ALL (63.6%) than in controls (38.1%). The
cases of ALL on treatment had a TdT frequency of 66%.
CONCLUSION. This study has demonstrated that TdT may be useful in the characterization
of ALL. The revelation that the number of positive events has significance at either spectrum
of blast cell counts suggests that Tc’~ is useful in diagnosis and follow up of patients who are
on chemotherapy. However, more work needs to be done with a larger sample size and
more markers for instance CD 19, CD 10, CD 13, surface membrane immunoglobulin and
cytoplasmic immunoglobulin.
2

1.0 INTRODUCTION AND LITERATURE REVIEW
The acute leukemias are defined pathologically as blast cell malignancies of immature
haemopoietic cells which exhibit clonal proliferation of eithe- the lymphoid or myeioid
lineage; hence the division into two main groups, acute myeloid leukemia (AML) and acute
lymphoblastic leukemia (ALL). In most cases, these have definable morphologic, cytogenetic
and immunological characteristics (1 , 2 ).
In ALL, abnormalities of lymohoid cell differentiation, proliferation or both lead to excessive
infiltration of leukemic lymphoblasts in multiple organs with resultant organomegally and
bone marrow failure. Its biological heterogeneity is linked to tne fact that the leukemogenic-
transforming event may develop at any point of the multistage iymphoid cell differentiation
and will consist of an expanding clone of neoplastic cells that are frozen at an otherwise
transient level of differentiation (2, 3, 4).
1.1 Epidemiology
Acute lymphoblastic leukemia is a worldwide entity that is commoner in cnildren than in
adults. In the United States of America (U.S.A), three thousand to four thousand new cases
are diagnosed annually. Two thirds of these cases are in children making it the commonest
childhood cancer (3). The annual incidence of ALL in children aged fifteen years and
younger is 29.4 cases per one million population in whites and 13.~ cases per million among
the blacks (2). Melvyn and Kasili have provided comparable statistics for age-matched
population in Europe and U.S.A, and Kenya respectively (5, 6).
The peak age prevalence of ALL in developed countries occurs between 1 and 5 years with
a median of 4.9 years and is commoner by twenty tc thirty percent in males than in females
•n all age groups and immunophenotypes. Macharia, in a referral-hospital based study in
Kenya, and Kasili documented a wide interval of peak age prevalence ranging between 2 to
3

10 years, (89.3 % of the cases studied fell within this age range) with a median age of 6
years (6,7). Twenty three and a half percent of the cases studied were below 5 years of age.
The age-adjusted incidence of ALL in adults (over fifteen years of age) was seven cases per
one million population. No obvious peak incidence of ALL was observed during adulthood.
However, it has been documented that the incidence decreases with increasing age.
ALL accounts tor between 65 and 80% of childhood leukemia in the U.S.A while in African
children it accounts for about 40-60% (1,2, 3, 5, 8). In Kenya Leukemia is the second
commonest childhood neoplasia after Lymphoma with a relative frequency of 21.3% (7).
Macharia in 1996 reviewed data on cancer related admissions between 1990-1995 at the
KNH pediatric units and the pediatric cancer ward from where he documented that 67% of
acute leukemias found in children less than twelve years of age were ALL (7). Data obtained
from a national survey in 1979 showed that ALL accounted for 3.7% and 4% of all cases
admitted in both medical and pediatric wards respectively (6,9). Recent data obtained from
the medical recorcs department of the KNH showed a sharp contrast from these previous
findings (table 1). It can be hypothesized that the downgrading of these rates is probably
due to increased admissions occasioned by HIV related morbidity most of whose
pathologies have higher prevalence rates than ALL.
There is documented evidence that ALL has shown a rising trend in annual admissions over
the years. There has been an increase of an average of 12 cases for the period 1975-1981
to 16 cases between 1990 and 1995 (7). Figures obtained from the medical records
department of KNH showed even higher patient attendance as shown in the following table.
4
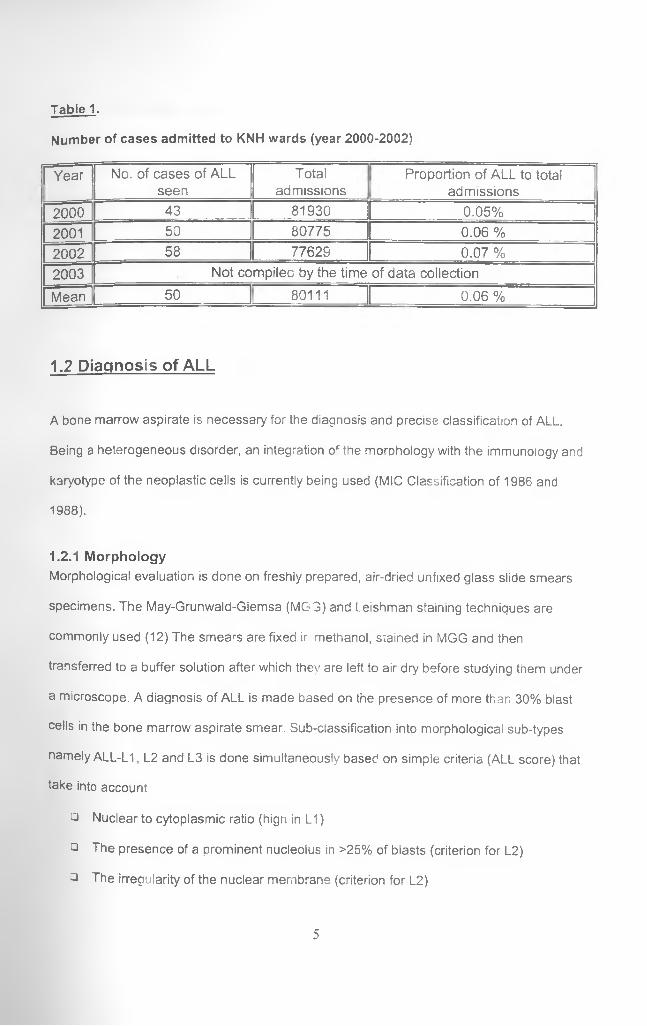
Table 1.
Number of cases admitted to KNH wards (year 2000-2002)
| Year No. of cases of ALL seen
Totaladmissions
Proportion of ALL to total admissions
2000 43 81930 0.05%2001 50 80775 0.06 %2002 58 77629 0.07 %2003 Not compileo by the time of data collection
Mean 50 80111 0.06 %
1.2 Diagnosis of ALL
A bone marrow aspirate is necessary for the diagnosis and precise classification of ALL.
Being a heterogeneous disorder, an integration of the morphology with the immunology and
karyotype of the neoplastic cells is currently being used (MIC Classification of 1986 and
1988).
1.2.1 MorphologyMorphological evaluation is done on freshly prepared, air-dried unfixed glass slide smears
specimens. The May-Grunwald-Giemsa (MG 3) and Leishman staining techniques are
commonly used (12) The smears are fixed ir methanol, siained in MGG and then
transferred to a buffer solution after which they are left to air dry before studying them under
a microscope. A diagnosis of ALL is made based on the presence of more than 30% blast
cells in the bone marrow aspirate smear. Sub-classification into morphological sub-types
namely ALL-L1 , L2 and L3 is done simultaneously based on simple criteria (ALL score) that
take into account:
□ Nuclear to cytoplasmic ratio (hign in L1 )
□ The presence of a prominent nucleolus in >25% of blasts (criterion for L2)
3 The irregularity of the nuclear membrane (criterion for L2)
5
□ Cell size (if more than 50% of blast are large, L2 is indicated)
The sum of the score, positive for L1 (0 to 2) and negative for L2 (-1 to -3 ) facilitates the
diagnosis of L1 or L2 and it forms the basis for the French-American Co-operative Group
(FAB) criteria for ALL.
Blasts cells of ALL-L3 when compared to those of L1 are homogenous and larger, they bear
a loose arrangement of nuclear chromatin with an inconspicuous nucleolus and they have a
deeply stained basophilic cytoplasm that is often vacuolated.
The diagnosis of acute leukemia at KNH is morphological in most cases. Where cases are
not clearly defined this way, cytochemical evaluation of the blast cells is undertaken as an
ancillary procedure.
Between the period of January and August 2000 and June and December of 2001 the
Department of Hematology and Blood Transfusion (KNH) processed 34 and 22 samples
respectively, of bone marrow aspirate smears (BMAs) for cytological diagnosis (using
morphology) of ALL translating to an average of three to four cases per month. Between
January and May 2003, thirty-nine BMAs from patients with ALL were evaluated. However,
these included both initial and re-evaluation marrows aspirates to monitor disease
responsiveness to treatment initiated (10 ,1 1 ).
On basis of morphology alone, leukemic lymphoblasts may be indistinguishable from
immature normal lymphoid cells. Attempts to differentiate leukemic lymphoblasts on basis of
size, nuclear-cytoplasmic ratio, presence of cytoplasmic granules among otner features
have been largely unsuccessful (2). A morphologic classification devised by the French
American British cooperative group (FAB) has gained wide acceptance. Following the
criterion, ALL has been divided into three subtypes namely L1, L2 and L3.
Based on Western statistics for these ALL subtypes. L1 accounts for about 90% of the
childhood cases, L2 between 5 and 15% while L3 accounts for less than 10%. In adults
however, L2 accounts for most of the cases. In contrast to AML, which can be readily
6
identified in most instances by morphologic features such as the presence of Auer rods,
cytochemically by staining positive for myeloperoxidase or Sudan B Black or monocyte
associated esterases, leukemic lymphoblasts may lack specific morphologic or cytochemica!
features. Furtner evaluation for assurance of the final diagnosis of ALL depends on
immunophenotyping (3,12).
1.2.2 Leukocyte cytochemistry
Leukocyte cytochemistry encompasses the techniques used to identify diagnostically useful
enzymes or other substances in the cytoplasm of haemopoietic cells.
The most important application of cytochemistry is in the separation of ALL from AML. This
is particularly important in some cases of AML (M1, M2, M3 and M4) tnat may be diagnosed
as ALL. These always show some decree of positivity with Sudan-Black stain unlike ALL,
which is negative. There is a minority of cases, particularly AML Mo, which are negative for
most cytochemica! stains for AML. Although up to 40% of the AML Mo cases may be TdT
positive, they lack reactivity with any of the specific Mabs for B- or T-lineage ALL though
they react with specific anti-myeloid Mabs.
The use of cytochemistry to characterize lymphoproliferative disorders has been largely
superseded by immunological tecnniques (12). The results of cytochemical tests should
always be interpreted in relation to Romanowsky stains and immunological tests.
1.2.3 Immunological analysis (immunophenotyping)
Application o monoclonal antibodies and other biologic probes in the analysis of leukemic
lymphoblasts and their normal counterparts have greatly improved the precision with which
particular cell types can be identified, isolated and characterized hence supplementing
morphological rindings in making the final diagnosis (13).
7
A panel of monospecific antibodies combined with fluorescent microscopy, or more
commonly, flow cytometric (FCM) analysis makes possible the identification of specific
antigens and/or enzymes on the membrane and/or in the cytoplasm or the nucleus. These
help to identify the blast cells to be of lymphoid or myeloid lineage. In regard to ALL this
allows a separation between B and T lineage ALL
The advent of FCM techniques, which allows simultaneous demonstration of cytoplasmic,
membrane and nuclear antigens, has significantly improved the diagnostic potential of
Mabs. Differences in surface membrane, cytoplasmic or intracellular antigenic components
of lymphocytes can be assessed to identify and classify lymphoproliferative disease as to
their cell of origin and stage of maturation. This provides information useful in the
reproducible diagnosis and classification of acute leukemias (2,13,15)
For both ALL and AML these markers show that the blast cells resemble very closely rare
cells in the normal bone marrow, or, for T-ALL, the thymus from which the leukemia appear
to be derived by clonal expansion. In ALL, and lymphoid progenitors, TdT occurs on early
non-differentiated cells and is routinely demonstrated in the nucleus of B- and T- lineage
lymphoblasts.
During ontogeny, lymphocytic progenitors undergo clonal expansion and diversification. This
process is achieved by a complex sequence of alteration in their cellular DNA and it invc ves
enzyme mediated recombination events, deletions and somatic mutations to produce
functional immunoglobulins or T cell receptor genes (5).
The modern diagnosis and further classification beyond the FAB criteria of all forms of ALL
is by immunophenotyping (13). Monoclonal antibodies directed against various specific
lymphoid cell antigens help detect lineage specificity in these cells and further reveal
restriction of maturation as well. It is important to understand the antigenic patterns of
8
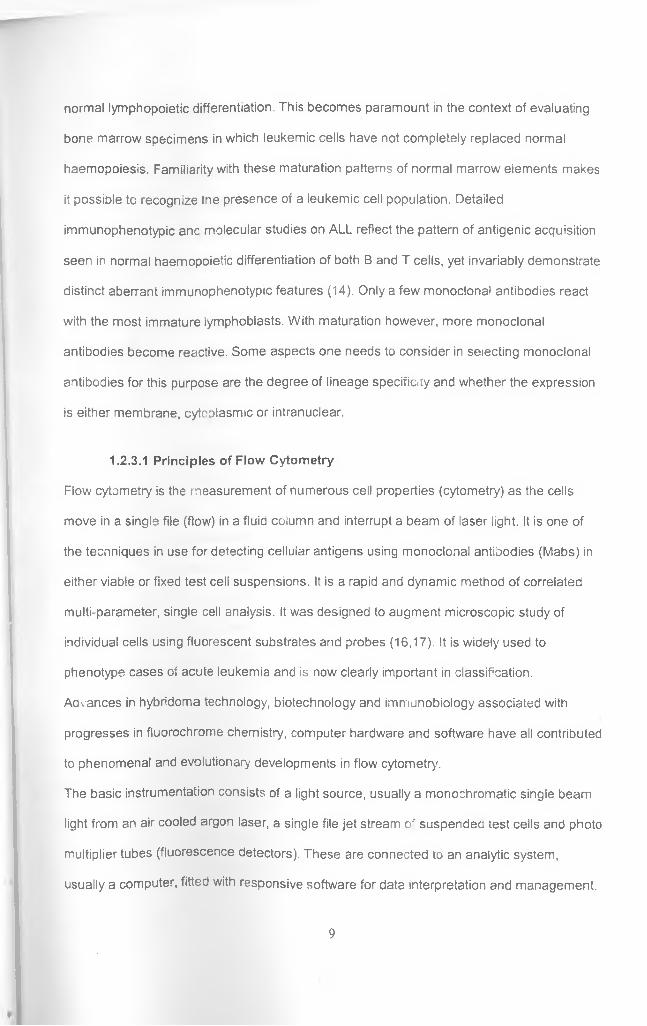
normal lymphopoietic differentiation. This becomes paramount in the context of evaluating
bone marrow specimens in which leukemic cells have not completely replaced normal
haemopoiesis. Familiarity with these maturation patterns of normal marrow elements makes
it possible to recognize tne presence of a leukemic cell population. Detailed
immunophenotypic and molecular studies on ALL reflect the pattern of antigenic acquisition
seen in normal haemopoietic differentiation of both B and T cells, yet invariably demonstrate
distinct aberrant immunophenotypic features (14). Only a few monoclonal antibodies react
with the most immature lymphoblasts. With maturation however, more monoclonal
antibodies become reactive. Some aspects one needs to consider in selecting monoclonal
antibodies for this purpose are the degree of lineage specificiiy and whether the expression
is either membrane, cytcolasmic or intranuclear.
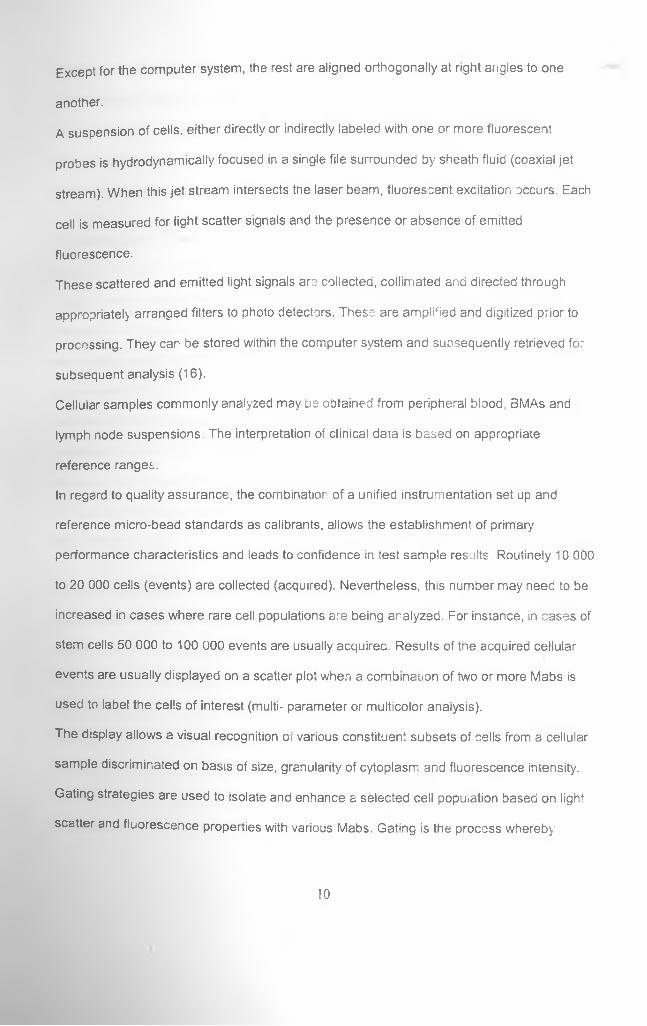
1.2.3.1 Principles of Flow Cytometry
Flow cytometry is the measurement of numerous cell properties (cytometry) as the cells
move in a single file (flow) in a fluid column and interrupt a beam of laser iight. It is one of
the techniques in use for detecting cellular antigens using monoclonal antibodies (Mabs) in
either viable or fixed test cell suspensions. It is a rapid and dynamic method of correlated
multi-parameter, single cell analysis. It was designed to augment microscopic study of
individual cells using fluorescent substrates and probes (16,17). It is widely used to
phenotype cases of acute leukemia and is now clearly important in classification.
Advances in hybridoma technology, biotechnology and immunobiology associated with
progresses in fluorochrome chemistry, computer hardware and software have all contributed
to phenomenal and evolutionary developments in flow cytometry.
The basic instrumentation consists of a light source, usually a monochromatic single beam
light from an air cooled argon laser, a single file jet stream or suspendea test cells and photo
multiplier tubes (fluorescence detectors). These are connected to an analytic system,
usually a computer, fitted with responsive software for data interpretation and management.
9
Except for the computer system, the rest are aligned orthogonally at right angles to one
another.
A suspension of cells, either directly or indirectly labeled with one or more fluorescent
probes is hydrodynamically focused in a single file surrounded by sheath fluid (coaxial jet
stream). When this jet stream intersects the laser beam, fluorescent excitation occurs. Each
cell is measured for light scatter signals and the presence or absence of emitted
fluorescence.
These scattered and emitted light signals are collected, collimated and directed through
appropriately arranged filters to photo detectors. These are amplified and digitized prior to
processing. They can be stored within the computer system and suosequently retrieved for
subsequent analysis (16).
Cellular samples commonly analyzed may be obtained from peripheral blood, BMAs and
lymph node suspensions. The interpretation of clinical data is based on appropriate
reference ranges.
In regard to quality assurance, the combination of a unified instrumentation set up and
reference micro-bead standards as calibrants, allows the establishment of primary
performance characteristics and leads to confidence in test sample results. Routinely 10 000
to 20 000 cells (events) are collected (acquired). Nevertheless, this number may need to be
increased in cases where rare cell populations are being analyzed. For instance, in cases of
stem cells 50 000 to 100 000 events are usually acquired. Results of the acquired cellular
events are usually displayed on a scatter plot when a combinauon of two or more Mabs is
used to label the cells of interest (multi- parameter or multicolor analysis).
The display allows a visual recognition of various constituent subsets of cells from a cellular
sample discriminated on basis of size, granularity of cytoplasm and fluorescence intensity.
Gating strategies are used to isolate and enhance a selected cell population based on light
scatter and fluorescence properties with various Mabs. Gating is the process whereby
10

subsets of interest for instance blasts in acute leukemia or lymphocytes for CD 4 analysis,
are selected by the cytometer operator for analysis while excluding those events noi of
interest during the analysis. A gate region (a.k.a gate) is the area in the scatter plot
delineated and “fenced o ff’ for this purpose. All events within the gate are recognized by the
data processing unit of the cytometer while those outside it are omitted.
C*—The use of gating regents to further ascertain the integrity of the scatter-based lymphocyte
Aand blast cell gate has been developed. Use of anti-CD 45 Mab (the common leukocyte
antigen) has elucidated this concept owing to the fluorescent properties of the cells that stain
positive for it. The combination of anti-CD 45 intensity and right angle light scatter (RALS),
also called side scatter (SSC) distinguishes leukemic cells from their mature normal
counterparts (17,18). CD 45 is expressed at different intensities on the surface of variojs
cell populations of haemopoietic origin. When combined with SCC, the pattern of CD 45
expression reveals several distinct clusters of events, each representing a constituent
population of the bone marrow cells. In multicolor analysis, combinations of fluorescent
conjugated antibodies allows further characterization of cell populations isolated on CD45/
SCC display.
This gating procedure has been found tc be more useful, superior and informative compared
to the traditional forward angle scatter (FSC) versus RALS (14). It is usually easier to
separate the blast population from residual mature granulocytes and monocytes owing to a
comparably minimal events overlap. On this display, leukemic cells occupy a unique olast
region characterized by intermediate CD45 density and low RALS. This is called the “blast
window1 and is normally or nearly empty in both norma! peripheral blood and BMAs
respectively. Even small increases in blasts will appear as a distinct cluster of events within
the blast window' By establishing analysis gates on the CD 45 versus SCC display, the
combination of CD45 (with TdT in this case) produces a more detailed lineage specific and
11

maturation dependent immunophenotypic data. Analysis gates established on this blast
window will form the basis for lymphoblasts analysis in subsequent chaptefof this
dissertation.
Figure 1.
Distribution of acquired BMAs events as seen on a dot scatter plot Plots a and c am
FSC/SCC while b and d are CD45/SCC plots. The light zone with a thick arrow in b and d is
the blast zone. Analysis window was set around the zone during acquisition Note the
increased number of events corresponding to blasts in d (ALL) as opposed to those in b (normal BMAs)
FSC-Hetght
rSC-Height800 1000
12
Although flow cytometry is a valuable tool in the diagnostic evaluation of patients with
haemo-lymphoid malignancies when applied in isolation, it is most effective as an ancillary
technique in a combined modality approach (14). Immunophenotypic studies have the
advantage of alleviating the limitations of light microscopy in classifying borderline
ecological changes. These include observer subjectivity, sub-ociimal quantifications owing
to the small amounts of test samples usually used, relatively few cells quantified and the
tiresome nature of the processes involved. Flowcytometry in cont-ast to light microscopy is
more objective, provides both qualitative and quantitative results and a permanent record of
the data as well (19).
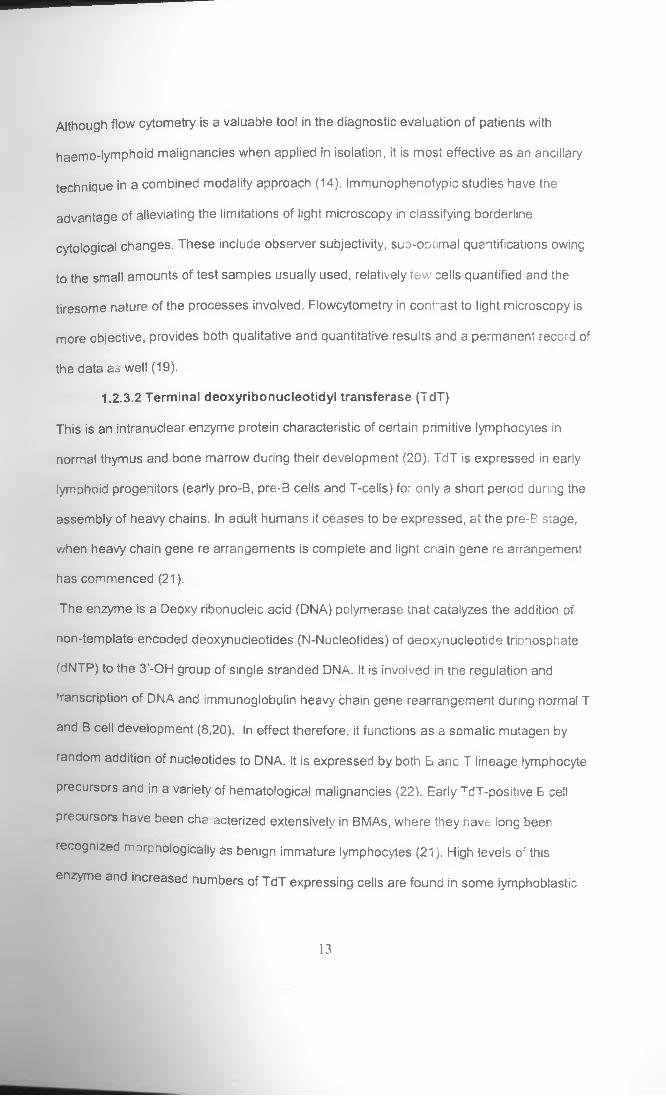
1.2.3.2 Terminal deoxyribonucleotidyl transferase (TdT)
This is an intranuclear enzyme protein characteristic of certain primitive lymphocytes in
normal thymus and bone marrow during their development (20). TdT is expressed in early
lymphoid progenitors (early pro-B, pre-B cells and T-cells) for only a short period during the
assembly of heavy chains. In adult humans it ceases to be expressed, at the pre-B stage,
when heavy chain gene re arrangements is complete and light cnain gene re arrangement
has commenced (2 1 ).
The enzyme is a Deoxy ribonucleic acid (DNA) polymerase tnat catalyzes the addition of
non-template encoded deoxynucleotides (N-Nucleotides) of deoxynucleotide triDhosphate
(dNTP) to the 3’-OH group of single stranded DNA. It is involved in tne regulation and
transcription of DNA and immunoglobulin heavy chain gene rearrangement during normal T
and B cell development (8,20). In effect therefore, it functions as a somatic mutagen by
random addition of nucleotides to DNA. It is expressed by both B anc T lineage lymphocyte
precursors and in a variety of hematological malignancies (22). Early TdT-positive B cell
precursors have been cha acterized extensively in BMAs, where they have long been
recognized rrorpnologically as benign immature lymphocytes (21). High levels of this
enzyme and increased numbers of TdT expressing cells are found in some lymphoblastic
13
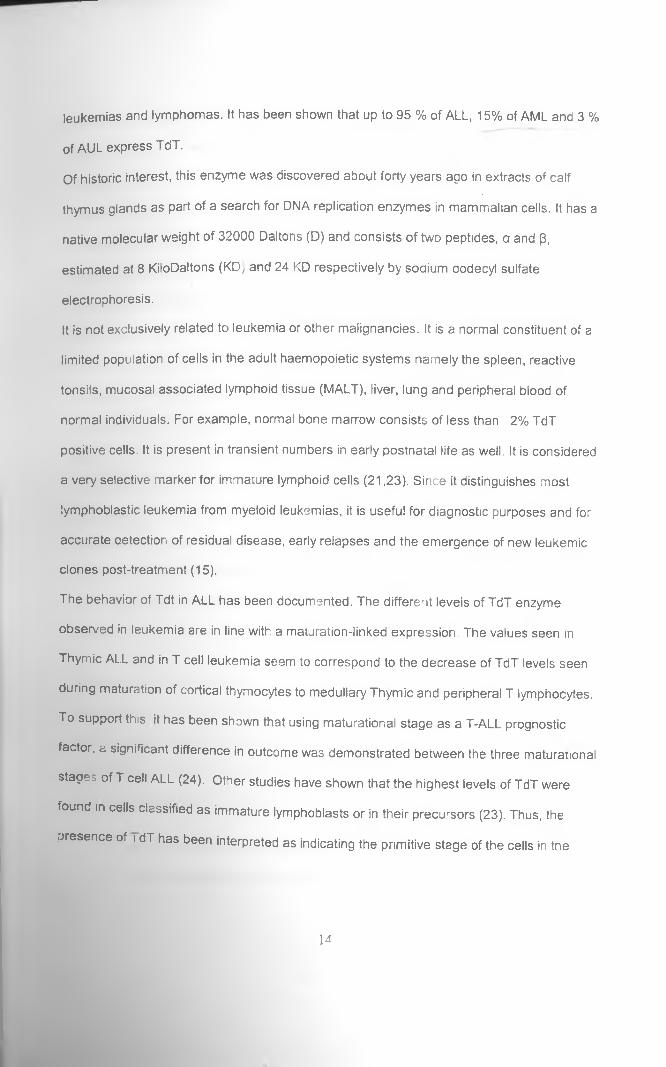
leukemias and lymphomas. It has been shown that up to 95 % of ALL, 15% of AML and 3 %
of AUL express TdT.
Of historic interest, this enzyme was discovered about forty years ago in extracts of calf
thymus glands as part of a search for DNA replication enzymes in mammalian cells. It has a
native molecular weight of 32000 Daltons (D) and consists of two peptides, a and 3,
estimated at 8 KiloDaltons (KD, and 24 KD respectively by soaium aodecyl sulfate
electrophoresis.
It is not exclusively related to leukemia or other malignancies. It is a normal constituent of a
limited population of cells in the adult haemopoietic systems namely the spleen, reactive
tonsils, mucosal associated lymphoid tissue (MALT), liver, lung and peripheral blood of
normal individuals. For example, normal bone marrow consists of less than 2% TdT
positive cells. It is present in transient numbers in early postnatal life as well. It is considered
a very selective marker for immature lymphoid cells (21,23). Since it distinguishes most
lymphoblastic leukemia from myeloid leukemias, it is useful for diagnostic purposes and for
accurate detection of residual disease, early relapses and the emergence of new leukemic
clones post-treatment (15).
The behavior of Tdt in ALL has been documented. The different leveis of TdT enzyme
observed in leukemia are in line with a maturation-linked expression. The values seen in
Thymic ALL and in T cell leukemia seem to correspond to the decrease of TdT levels seen
during maturation of cortical thymocytes to medullary Thymic and peripheral T lymphocytes.
To support this it has been shown that using maturational stage as a T-ALL prognostic
factor, a significant difference in outcome was demonstrated between the three maturational
stages of T cell ALL (24). Other studies have shown that the highest levels of TdT were
found in cells classified as immature lymphoblasts or in their precursors (23). Thus, the
presence of i dT has been interpreted as indicating the primitive stage of the cells in tne
14
differentiation sequence, with no respect to cell lineage and hence a role as a useful
differential marker in those leukemias not categorized by morphology alone (25,26).
As reqards the response of TdT to chemotherapy, it has been observed that the qualitative
attributes of this enzyme do not change. As long as there are leukemic cells present in the
specimen, TdT will be detected. Quantitatively however, the detectable levels of expression
will diminish with successful therapy as demonstrated by reducing blast cell counts (17).
The sensitivity of FCM in detecting malignant cells is appreciably high. The technique can
detect as low as 20 events as demonstrated in mixing experiments. Indeed, this feature has
formed the basis for evaluation of minimal residual disease (MRD) in cases of ALL (B and T)
whereby the sensitivity matches that of polymerase chain reaction (the commonly used
technique tor ALL-associated MRD) whose sensitivity has been documented as 1:103-1:10s
cells.
The intensity of staining with TdT also vanes with the treatment phase. For example, ALL
blasts have a lower TdT fluorescence intensity than those o, normal bone marrow B-cell
precursors. Common-ALL (c ALL) blasts have low TdT and high CD10 and CD 19
expression in contrast with normal B-cells precursors that in contrast have high TdT and low
CD 10 and CD 19. This difference can heip to distinguish normal from ieukemic cells after
remission.
Following the recommendations of the US-Canadian consensus conference on the use of
flow cytometry immunophenotyping in leukemia and lymphoma in 1997, the need for
homegrown solution to antibody panel selection was expressed. No final recommendations
were however made as to which monoclonal antibody combination ~onstitutes the ideal
panei. As regards ALL a minimum panel employed should at the least
□ Discriminate between tne myeloid and the lymphoid cells,
□ Establish the maturity stage of the abnormal cells, and
15

□ Identify the major category of the leukemia phenotype as either B or T cell (13).
1.2.4 CytogeneticsThis relates to the study of chromosomal abnormalities in different types of leukemias and
lymphomas (1, 12) Its main purpose is to determine whether the chromosomal maKe-up
(karyotype) of the affected cells is abnormal and, if so, in what ways. Clonal abnormalities
are found in up to 90% of patients with ALL. Cytogenetic findings in ALL are important for:
□ Diagnosis and classification of the disorder. The MIC classification of ALL is based
on the demonstration of hignly specific chromosome translocations in cases defined
by both morphology and monoclonal antibody cell marKers.
□ Evaluation of prognosis. In acute leukemias, the karyotype may heLan important may
be an important and independent prognostic factor in predicting both remission
achievement and the length of remission, and in distinguishing potential log-term
survivors from those likely to fail on standard therapy.
□ Drediction of transformation. Cytogenetic evaluation during the course of an indolent
leukemia may be used to predict transformation to a more aggressive phase.
There are a number of factors that make cytogenetic stucies in ALL particularly difficult. For
instance, BMAs may have low cell counts. In some cases, the leukemic blasts are inert in
culture while in others chromosomal morphology and response to band staining are poor.
16
2.0 JUSTIFICATION OF THE STUDY
Leukemia in Kenya is now a prevalent problem than previously thought. The number of
cases being attended to has been rising annually (table 1; page &). Two decades ago, Kasili
had estimated that the Kenyan overall national crude incidence was 0.5 cases per 100,000
people in a population and that the maximum tribe specific incidence was 1.2 cases per
100,000, (6). Since then, no comprehensive review of the epidemiology, neither national nor
regional, has been carried except for a hospital-based study by Macharia in 1996 (7) where
he assessed the contribution of childhood malignancies including ALL, to the admissions
load at the KNH. Between the years 2000 and 2002, the total number of cases of ALL seen
at KNH rose from 43 to 58. These numbers accounted for 0.05% and 0.06% of the total
annual admissions at the hospital. Part of the increase in the incidence of leukemia is now
thought to be because of improved diagnosis that currently exists.
In the western setting, the disease has a peak occurrence in the first decade of life and a
good remission induction rate of 90% for the childhood variety (2). In addition, it is
associated with a low mortality rate compared to Acute Myeloblastic Leukemia (AML) and
ALL in adults. This therefore underscores the importance of prompt, early and accurate
diagnosis To stress this point, about four decades ago the disease was uniformly fatal and
the extra-ordinary achievements in cure rates resulted from a series of studies that helped to
clarify its pathobiology (2 ).
Although routine cytological and histological examinations are cheap and reliable for the
diagnosis of pre-malignant and malignant conditions, morphology alone is an imperfect
reflection of biologic potential (19). The FAB system criteria for instance, often fails to
discriminate reproducibly between the various immunologic subtypes of leukemia arising
from the same haemopoietic lineage, and at times even between leukemias of different
17
lineages (14). Use of TdT therefore has an advantage over morphology alone owing to its
higher sensitivity in detecting abnormal cells. It is still useful even in absence of secondary
monoclonal antibodies in discriminating between ALL and other lymphoproiiferative
disorders and AML Its use alone in this study was carefully considered as it gave an
indication on the potential use of FCM in this setting in future.
The technique of flow-cytometric analysis (FCM) of leukemias is not at present available in
our country. It is a user friendly, reliable and reproducible technique in diagnosis and
management of leukemia in our setting. The main limitation in setting up the system would
be the initial costs. The flow-cytometers are expensive machines to purchase and
specialized training of technical personnel is not locally available. However, technical service
back up and reagents sourcing are accessible locally and are reasonably priced.
This study aimed to determine the potential role and practicality of FCM as ancillarv
diagnosis and in clinical-laboratory management of ALL. Early response to therapy is one of
the most important prognostic indicators in acute leukemia. Studies to asses complete
morphological remission against markers of minimal residual disease have also shown that
certain markers for instance CD10, CD 7<- or myeloid cell surface antigen (CD 45) are
associated with post intervention outcomes; namely event free survival. However, the.
independent prognostic importance of these markers is less well established. (17, 27, 28).
Although similar studies have been done elsewhere there is none that has been carried out
in our set up. Therefore, this study will set pace for such evaluations studies in future.
Standardization, validation and improvement of reproducibility in diagnostic techniques are
essential in laboratory practice. In addition, the understanding of leukemia cell biology and
clinical risk factors have made it possible to recognize a spectrum of ALL subtypes and to
predict treatment outcome with greater orecision.
18

With the changing disease structure owing to improving healthcare, which provides
accessibility to early detection of cases and successful control of communicable diseases
the importance of chronic diseases, cancer and leukemia inclusive cannot be ignored.
Despite the scarcity of literature in regard to local and regional epidemiology of leukemia,
the changing environmental patterns characterized by an increase in the use of agricultural
chemicals, pesticides, therapeutic irradiation amongst others can by extrapolation, be said to
contribute to the morbidity (1, 5, 6).
Research questions;
□ Does the level o TdT expression by ALL correlate well with morpnologic blast cells
counts?
□ If so, can patterns of TdT expression be utilized to asses treatment response in
ALL?
Hypothesis
TdT is useful in diagnosis and follow-up of patients with ALL.
19
2.2 Objectives of the study
2.2.1 Main objective:
The main objective of the study was to qualitatively and quantitatively detect and establish
the levels of TdT expression in ALL using FCM in order to evaluate its role in the diagnosis
and eventual follow up of patients with this disease in our setup.
2.2.2 Specific objectives
1. To determine the proportion of TdT positive ALL in the BMAs of the study
population.
2. To compare patterns of TdT expression between the different stages of ALL cases
on treatment and control BMAs.
3. To determine the correlation between microscopic percentage blast cell counts and
TdT expressing events.
4. To find out the rate of TdT phenotype expression in morphologically unclassifiable
acute leukemia (AUL).
5. To make recommendations based on the study findings.
20

3.0 METHODOLOGY
3 1 gtMHy design and data collection
This study was a descriptive cross sectional study carried out between the months of June
and August 2003. Data was obtained from the recruited cases using a directly administered
pre-designed data collection form. Clinical and laboratory-based data relevant to the study
was entered as guided.
3.2 Study areas and population
The study was conducted at the KNH hematology laboratory from where sixty-two patients
initially enrolled into the study had their BMAs assed for pathology. They were categorized
into untreated ALL, treated ALL and control cases. KNH is located within the City of Nairobi;'
Kenya and is a teaching and a National referral health care facility. Most cases of childhood
and adult cancers are referred from all parts of the country for confirmation of diagnosis and
/or treatment. In this regard, the hospital has become a focal point and a relevant entry point
nto clinical and epidemiological studies that have been widely publisned.
The subjects were recruited from the hospital’s medical and pediatric wards, pediatric and
adult hematology clinics and the oncology wards. These units serve as treatment and
diagnostic workup points for cases referred from other units within the hospital and from
other hospitals as well. Other hospitals within and around Nairobi Province had been
considered as additional recruitment areas. Nevertheless, owing to logistics failure, only two
cases each from The Nairobi Hospital and Gertrude’s Garden Children’s Hospital were
ed outside KNH. Patients recruitment followed investigation consultations (laboratory
requests from treatment points for ALL workup) to the Department of Haematology and
21
Blood Transfusion. This served as a convenient focal point for case identification and thus
optimized their selection as they presented. This is the only laboratory within the KNH that
handles hematological work. In addition, the haematologic pathologists working in the
hospiial are stationed within this unit.
Once the specimens were obtained from the subject patients, they were processed and
examined for morphology and cytochemistry within the Department of Hematology and
Blood Transfusion’s laboratory while FCM was carried out at the Kenya AIDS Vaccine
Initiative’s (KAVI) Laboratory located within KNH.
3.3 Sampling of study subjects
This was by stratified sampling. Consecutive cases were selected from the Haematology
laboratory upon reception of consuliation request forms for ALL work-up. Those that showed
morphological features of ALL were recruited. They were stratified into two groups that were
designated as pei the treatment phase category thus, untreated and treatment phases. For
each of these groups consecutive cases were selected as study subjects
3.3.1 Criteria for inclusion into the study
Patients who fulfilled tne following criteria were selected for participation in the study.
i . Newly diagnosed cases of acute lymphoblastic leukemia according to cell
morphology and expression of more than 30% lymphoblasts in the bone marrow
specimen.
hose cases previously diagnosed as ALL and who were on treatment during the
study period irrespective of the level of blast cell expression in their bone marrow
specimens
22
3 Cases reported as undifferentiated acute leukemia whose histogenesis was
uncertain using morphological examination alone.
4 Those who by own self or by legal proxy (that is parent/guardian) gave informed
consent to be included in the study as per the official consent form (see appendix 1 )
5 Those whose BMAs were considered suitable and satisfactory for morphological
evaluation.
6. Cases that were selected as controls (see below).
3.3.2 Criteria for exclusion from the study
P a t ie n ts who had any one of the following criterions were excluded altogether from
p a r t ic ip a tin g in this study.
1.
2.
3.
New cases of suspected acute lymphoblastic leukemia not yet on treatment and who
exhibited less than 30% lymphoblasts in their bone marrow aspirates using
morphological examination.
Failure to consent to inclusion into the study.
Poor quality BMAs unsuitable for a conclusive diagnosis.
3.3.3 Selection of control cases
These consisted of a group of patients who’s BMAs showed morphological features otner
tha-, those of acute lymphoblastic leukemia, for instance, megaloblastic anemia, iron
deficiency anemia, and reactive marrow among others. A singie case of AML was recruited
as well.
ose who consented to inclusion into the study had their BMAs processed in line with the
/ da d operating procedure (part 4.3.4 Delow). In addition, only BMAs considered
Hable and satisfactory for morphological evaluation were included in the study.
23

3 .3.4 Sample size
The known epidemiological and hospital prevalence of ALL is low. It is less than 1% in both
situations (table 1). Whereas the expected outcome of TdT expression is predictable (it
approaches 100% on well preserved lymphoblasts), use of formulae based on the above
prevalence yielded a smaller sample size compared to consecutive case recruitment
(appendix 3). A calculated minimum sample size of eight was obtained using the mean
hospital prevalence of 0.06%, which was higher than the published community prevalence
obtained from western literature which has documented 29.4 and 13.4 cases per million
people among the white and black children respectively (section 1.1). A confidence interval
of 95% was assumed.
To determine an optimal working sample size for the three months working period, two
retrospective surveys were carried out by the investigator. Data on BMAs received and
processed in the Department of Haematology and Blood Transfusion was obtained from the
laboratory register. The number of ALL cases reported and signed out per month was
obtainea and three month moving averages calculated (10, 11). A survey by the investigator
covering the five months preceding this study showed a total ALL load of 39 cases (adult
and pediatric) with a fluctuating three month moving average of 11,8.66 and 11 (11). This
however included, besides new cases, marrows on re-evaluation for among other things
remission status, relapses and inadeouate previous aspirates. In addition, summary data on
annual hospital admissions for three years preceding the study was used (table 1 )
This being a pilot study that was evaluating a long used diagnostic procedure and its
potential pitfalls, the author found it prudent to recruit all patients presenting during tne study
period in order to optimize the sample size.
24
3.3.5 Patient evaluation, specimen collection and processing
The following steps were taker
(i) History taking and physical examination
History was taken and a complete physical examination performed on patients who met the
requirements for inclusion in to the stuoy Biographic information was also obtained.
(ii) Specimen collection
The procedure for specimen collection and processing are given in detail in appendices 4
and 5.
In summary however, five milliliters of venous blood were aspirated by the investigator or a
trained phlebctomist from each patient via a peripheral vein, preserved in EDTA, and
t'ansported to the laboratory where blood films were made on glass slides. These were left
to air dry before staining.
In the same setting the investigator or the house officer aspirated two .......ters of bone
marrow from each patient. Bedside smears on clean glass slides were immediately preparec
and allowed to air dry. These were the transported to the laboratory
done alongside that of the blood films.where staining was
he sample remaining in the syringe was transported to the laboratory in 0.25ml of EDTA for phenotypic studies.
25
(iii) Specimen analysis
All peripheral blood and bone marrow smears made were stained using May Grunwald
Giemsa technique. These were reported by the hematologist on duty. The findings were
transcribed to the data collection sheet and subsequently analyzed statistically.
Those exhibiting features of ALL were further subjected to phenotypic evaluation for TdT
using flow cytometry. Mononuclear cells containing the blasts fraction were obtaining using
Ficcol Histopaque ®- 1077 (Sigma diagnostics Inc) separation technique. These were
washed twice in PBS and stained using anti-TdT and anti CD-45 monoclonal antibodies.
The labeled cells were analyzed by use of a FACSCalibur flow cytometer (model E4583; BD
I mm u nocytometry systems USA). The data obtained was analyzed alongside that of the
peripheral blood films and BMAs smears. All immunophenotypic studies were done within
72 hours of collecting the peripheral blood and bone marrow aspirates. Tnose specimens
that could not be analyzed within 24 hours were refrigerated at 2-4°c.
A dot plot was used for events acquisition while analysis quadrants were used for estimation
of reactive events. All events to the right of a blank control threshold for the same sample
were considered TdT positive while those that fell to the left were taken as negative. TdT
positivity exhibits a log fluorescence of 10' to 10 '. Fluorescence below this range was
considered negative. Positive events were further classified into diffuse and clustered
depending on how close they were to each other. Each of these was sub classified into
a Dim; implying those events over.apping the threshold gate (borderline
positivity).
a Bright, implying those distinctly clustered positive events away from
threshold gate. These mainly corresponded to 102 intensity threshold for
fluorescence.
26
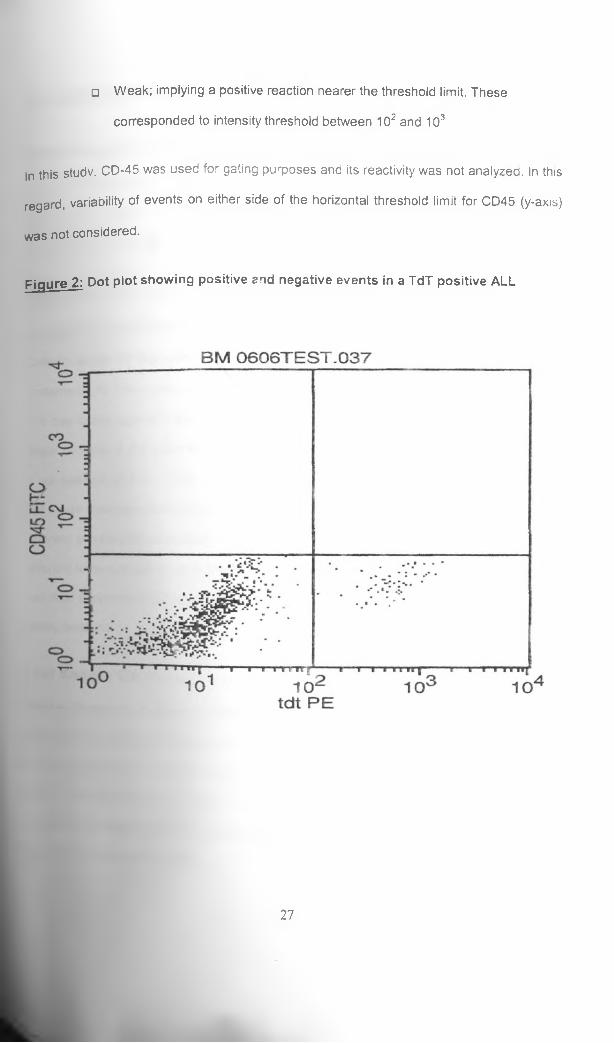
□ Weak; implying a positive reaction nearer the threshold limit. These
corresponded to intensity threshold between 102 and 103
In this studv. CD-45 was used for gating purposes and its reactivity was not anaiyzea. In this
regard, variability of events on either side of the horizontal threshold limit for CD45 (y-axis)
was not considered.
Figure 2: Dot plot showing positive end negative events in a TdT positive ALL
27

3 a Quality assurance (QA) for flow cytometry
Morphologic QA: A cytospin preparation was obtained from tne mononuclear cell
suspension from each of the bone marrow and peripheral blood samples. A cell count was
performed to ensure there was no significant loss of the cell of interest. However, cell
viability studies were not undertaken
Instrument QA: Samples were analyzed on a FACSCalibur four-coiour flow cytometer
(model E4583; BD Immunocytometry systems USA). The instrument was set up daily with
Calibrite beads (BD Biosciences, USA) and FACSComp 4.2 software (BD Immunocytometry
systems USA). The system was ready for use when time-delayed calibration was passed.
The day-to-day stability of the set up was verified. Over the time of this study, there were no
major changes in the optics of our instrument, so there was little day-to-day change needed
in our settings, and the cluster of events generally occupied very similar positions over time.
List mode data were analyzed with CellQuest software (Becton Dickinson, USA). Several
different combinations of scatter were used in attempt to maximize the separation among
different leukocyte populations. The CD 45-SSC-fluorescence display was used for gating,
and dual parameter (TdT PE VS CD 45 FITC) graphs of the gated population were used
during analysis.
Test sample QA: No test cells or calibrants for TdT positivity have been developed yet,
(Becton Dickinson). In this study, blasts that reacted positive with the anti- TdT Mab were
taken as truly positive. CD-45 single antibody stain (witnout anti TdT co-stain) was used to
label peripheral blood cells from normal individuals suspended in phosphate buffered saline
(PBS). This was treated as the TdT antiboay blank. This was in reference to section 4.3.
e All samples in this study were gauged against the reactivity of this peripheral blood
blank for positivity and negativity.
28

3.5 Statistical analyses
Statistical analyses were performed with the use of SPSS for Windows™ version 11 0 The
analysis in both the and control groups were done using descriptive statistics. Non-
parametric tests were used to compare two sets of data and inferences were thereby made.
To test for significance and correlation respectively, Fischer's Exact Test, Chi square and
Pearson's correlation were selected wnere appropriate. All significance tests were two-tailed
with the confidence level (a) of 0.05.
29
4.0 ETHICAL CONSIDERATIONS
The study commenced following approval by the KNH-Ethics and Research Committee
(Appendix 7).
Samples from the patients were collected following informed consent from the patients, their
parents or guardians (Appendix 1).
To minimize patients discomfort owing to the traumatic and invasive nature of phlebotomy
and bone marrow aspiration, each recruited case was subjected to the procedure only once
in the course of the study and this was determined purely by the clinical indications.
Preoetermined volumes of the aspirates were used as the bedside benchmarks of the
specimen adequacy (Appendix 4). Repeat aspirates prompted by uniterpretable smears for
any reason were at the behest of the attending clinician. In such circumstances, another
experienced clinician was sought to perform the procedure or recommend alternatives in
regard to further worthwhile work up.
New cases clinically suspected to be suffering from ALL and whose diagnosis was yet to be7
established were recruited and evaluation performed as above. (See section 4.3.4). Only >
when the morphologic tests revealed ALL were immunophenotypmg studies carried out and
the data obtained used for the purpose of the study.
The turn-around time for hematological tests was not negatively affected by the study. The
results of preliminary hematological tests obtained were communicated promptly to tne
House Officer on duty for the timely and continued management of the patients.
Although the study questionnaire bore the patients names and hospital unit number, these
sed for clinical purposes where eventual fouow up was necessitated by the study
30

findings. These patient identity factors were concealed at the time of publishing these study
findings. Strict confidentiality of the patients' identity was maintained
Relevant information gained about the TdT positivity that may have impactec on the
diagnosis or follow-up of the patients was given to the attending clinicians.
31
5.0 RESULTS
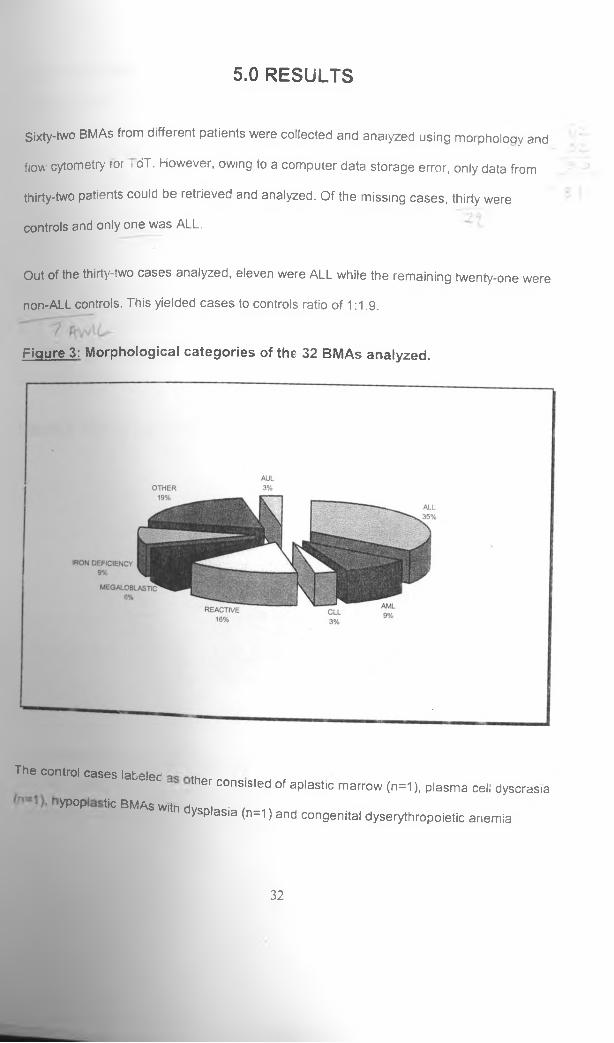
Sixty-two BMAs from different patients were collected and analyzed using morpholoqy and
flow cytometry tor i dT. However, owing to a computer data storage error, only data from
thirty-two patients could be retrieved and analyzed. Of the missing cases, thirty were
controls and only one was ALL.
Out of the thirty-two cases analyzed, eleven were ALL while the remaining twenty-one were
n o n - A L L controls. This yielded cases to controls ratio of 1:1.9.
Figure 3: Morphological categories of the 32 BMAs analyzed.
The control cases labeledther consisted of aplastic marrow (n=1 ), plasma cell dyscrasia
yP°P ^ BMAS Wltn dysplasia (n=1 ) and congenital dyserythropoietic anemia
32

(n=1). A single case each from a morphologically normal BMAs and peripheral bio*\
included as well.
Since the study was aimed at assessing the flow-cytometric reactivity of TdT in A,L
controls were used purely in setting up the assay and for comparison of TdT reac:(.
between the two categories of BMAs. Therefore, descriptive inferences in tneir ress
be alluded to only where significant.
Of the eleven cases of ALL, seven were male white four were females The male tot\ratio was 1.8:1. Sex differences in various parameters were not evaluated owing to, S
numbers of cases involved. The median age at recruitment was 9 years with a ran5e *!i
three to thirteen years.
Figure 4: Age distribution in ALL patients studied.
Age distribution in patients with ALL2.5 ---
Patient's age
In reference to the trpstmor«+ treatrr)ent category for A_L, ni
two were newly confirmednine cases were on chemotherapy
cases and Lad not been started on chemotherapy at therecruitment. Of the ninp
©nts on treatment, three exhibited morphologic complete
33

remission while the rest were cases in impending remission. Some of the hematological
attributes are as shown below.
Table 2
Table showing the means of peripheral blood parameters in patients with ALL
Parameter Treated Untreated P-
values
Hemoglobin (g/dl) 11.7 7.7 0.041
WBC x̂10y/l) 7.2 10.1 0.639
Neutrophils (x10y/l) 1.7 2.6 0.162
Lymphocytes (x10y/l) 1.8 1.4 0.06
Monocytes (x10a/l) 0.4 0.8 0.1
Plateiels (x10M/l) 262 45 0.181
Blasts % 17.2 93 0.035
A comparison of means of some peripheral blood parameters between the treated ALL and
the two untreated ALLs showed a significantly lower Hemoglobin level (p=0.04 i The mean
BMAs blasts percentage counts for the latter disease category was significantly ,\igher
(p-0.035). Other parameters showed observable differences between the inaividual cases
but did not show statistical significance.
A single case of AUL was identified by morphological evaluation. It was not possible to
classify its lineage using cytochemistry. TdT reactivity was positive.
34
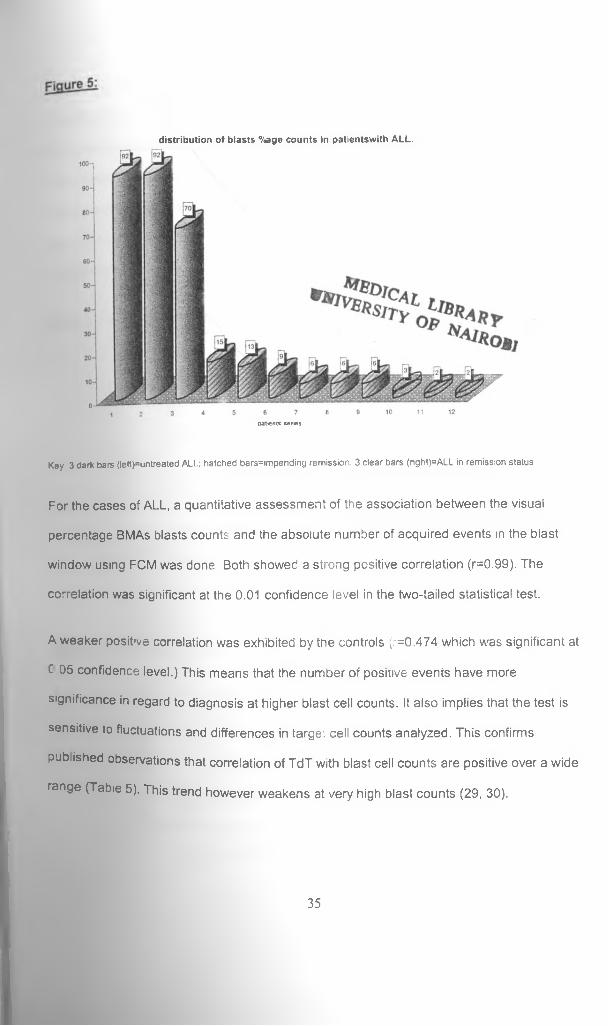
d is tr ib u tio n o f b lasts %age counts in pa tientsw ith ALL.
patients series.
Key 3 dark bars (left)=untreated ALL; hatched bars=impending remission, 3 clear bars (right)=ALL in remission status
For the cases of ALL, a quantitative assessment of the association between the visual
percentage BMAs blasts counts and the absolute number of acquired events in the blast
window using FCM was done Both showed a strong positive correlation (r=0.99). The
correlation was significant at the 0.01 confidence level in the two-tailed statistical test.
A weaker posit've correlation was exhibited by tne controls (r=0.474 which was significant at
C 05 confidence level.) This means that the number of positive events have more
significance in regard to diagnosis at higher blast cell counts. It also implies that the test is
sensitive to fluctuations and differences in targe: cell counts analyzed. This confirms
published observations that correlation of TdT with blast cell counts are positive over a wide
range (Tabie 5). This trend however weakens at very high blast counts (29, 30).
35
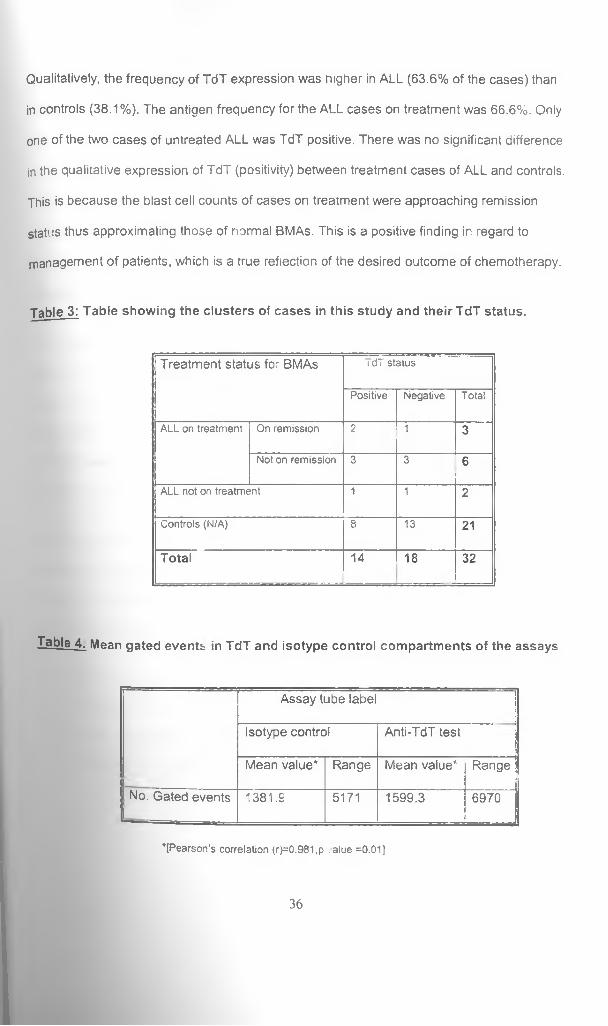
Qualitatively, the frequency of TdT expression was higher in ALL (63.6% of the cases) than
in controls (38.1%). The antigen frequency for the ALL cases on treatment was 66.6%. Only
one of the two cases of untreated ALL was TdT positive. There was no significant difference
in the qualitative expression of TdT (positivity) between treatment cases of ALL and controls.
This is because the blast cell counts of cases on treatment were approaching remission
status thus approximating those of normal BMAs. This is a positive finding in regard to
management of patients, which is a true reflection of the desired outcome of chemotherapy.
Table 3: Table showing the clusters of cases in this study and their TdT status.
Treatment status for- BMAs idT status
Positive Negative Total
ALL on treatment On remission 2 n 3
Not on remission 3 3 6
ALL not on treatment 1 1 2
Controls (N/A) 8 13 21
Total 14 18 32
Table 4. Mean gated events in TdT and isotype control compartments of the assays
Assay tube label
Isotype control Anti-TdT test
Mean value* Range Mean value* Range
No. Gated events 1381.9 5171 1599.3 6970
’ [Pearson’s correlation (r)=0.981,p . alue =0.01]
36
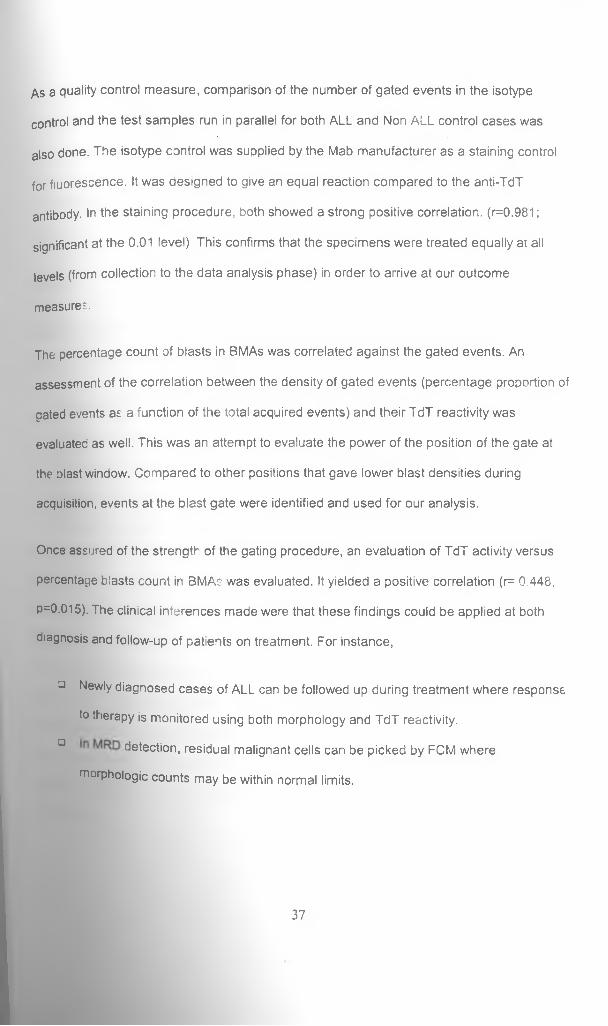
As a quality control measure, comparison of the number of gated events in the isotype
control and the test samples run in parallel for both ALL and Non ALL control cases was
also done. The isotype control was supplied by the Mab manufacturer as a staining control
for fluorescence. It was designed to give an equal reaction compared to the anti-TdT
antibody. In the staining procedure, both showed a strong positive correlation. (r=0.981;
significant at the 0.01 level) This confirms that the specimens were treated equally at all
levels (from collection to the data analysis phase) in order to arrive at our outcome
measures.
The percentage count of blasts in BMAs was correlated against the gated events. An
assessment of the correlation between the density of gated events (percentage proportion of
gated events as a function of the total acquired events) and their TdT reactivity was
evaluated as well. This was an attempt to evaluate the power of the position of the gate at
the olast window. Compared to other positions that gave lower blast densities during
acquisition, events at the blast gate were identified and used for our analysis.
Once assured of the strength of the gating procedure, an evaluation of TdT activity versus
percentage blasts count in BMAs was evaluated. It yielded a positive correlation (r= 0.448,
p=0.015). The clinical inferences made were that these findings could be applied at both
diagnosis and follow-up of patients on treatment. For instance,
u Newly diagnosed cases of ALL can be followed up during treatment where response
to therapy is monitored using both morphology and TdT reactivity.
0 detection, residual malignant cells can be picked by FCM where
•morphologic counts may be within normal limits.
37

Suspected relapses can be detected early before tney become manifest
morphologically. This can be aided through making comparisons with levels of Tdt
recorded at attainment of remission status.
All these measurements of association gave positive correlations as shown in the tabie
below.
Table 5
Tabie of correlation between various indices and parameters assessed in the blast
window by flow cytometry.
P a ra m e te r P e a rs o n c o r re la t io n (r) P v a lu e
G ated events density Vs.% blasts in BM As 0 .6 1 0 0 .0 01
G ated events density Vs. TdT activity 0 .6 9 3 0 .001
% B lasts in B M A s Vs. TdT activity 0 .4 4 8 0 .0 1 5
An assessment of the fluorescence intensity for TdT in both cases and controls was
assessed and classified. There was a variable expression of fluorescence intensity between
the cases of ALL. Majority showed borderline (dim) fluorescence. Qualitative comparisons of
floor-, scence intensity were made between dim events against the distinctly positive (bright
and weak). Indeed none of the cases on chemotherapy showed bright positivity. A
comparison of fluorescence intensity oetween cases and controls showed significant
differences in fluorescence intensity (p=0.007). It would have been desirable to perform
quan ative studies (fluorescence definitions) on our sampies. However, the investigator and
nical team were not conversant with these settings of the f'ow cytometer at the time of this study.
38

The discrimination of fluorescence intensity between bright events versus the others was
comparably stronger compared to that between dim positivity against distinctly positive and
intermediate and bright TdT (p=1.00 vs p=0.125). Of interest to note was that all non-
ieukemia controls showed a dim TdT positivity (p<0.05) unlike the mixed picture in AML and
ALL (p=0.467). The features of the latter may signify heterogeneity of phenotypes of variable
biological behavior in the malignant clones as opposed to their benign counterparts.
39
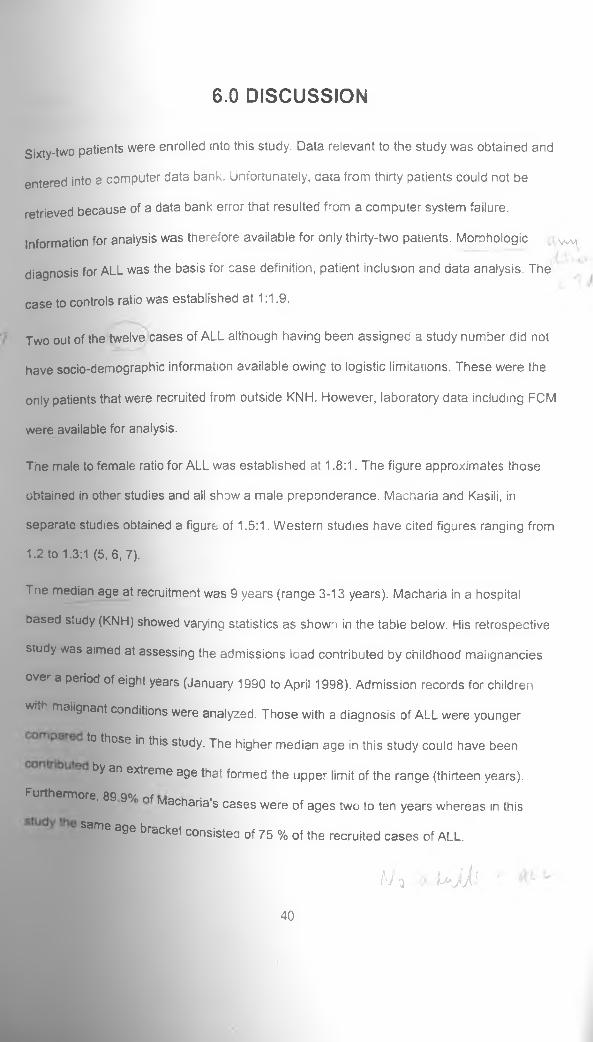
6.0 DISCUSSION
Sixty-two patients were enrolled into this study. Data relevant to the study was obtained and
entered into a computer data bank. Unfortunately, data from thirty patients could not be
retrieved because of a data bank error that resulted from a computer system failure,
information for analysis was therefore available for only thirty-two patients. Morohologic ^
diagnosis for ALL was the basis for case definition, patient inclusion and data analysis. The
case to controls ratio was established at 1:1.9.
Two out of the twelve cases of ALL although having been assigned a study number did not
have socio-demographic information available owing to logistic limitations. These were the
only patients that were recruited from outside KNH. However, laboratory data including FCM
were available for analysis.
The male to female ratio for ALL was established at 1.8:1. The figure approximates those
obtained in other studies and all show a male preponderance. Macharia and Kasili, in
separate studies obtained a figure of 1.5:1. Western studies have cited figures ranging from
1.2 to 1.3:1 (5, 6, 7).
Tne median age at recruitment was 9 years (range 3-13 years). Macharia in a hospital
based study (KNH) showed varying statistics as shown in the table below. His retrospective
study was aimed at assessing the admissions load contributed by childhood malignancies
over a period of eight years (January 1990 to April 1998). Admission records for children
with malignant conditions were analyzed. Those with a diagnosis of ALL were younger
to those in this study. The higher median age in this study could have been
by an extreme age that formed the upper limit of the range (thirteen years).
Furthermore, 89 9% nf • .iviacnaria s cases were of ages two to ten years whereas in this
*anr'® age bracket consisted of 75 % of the recruited cases of ALL.
Ay o IaJJj C40
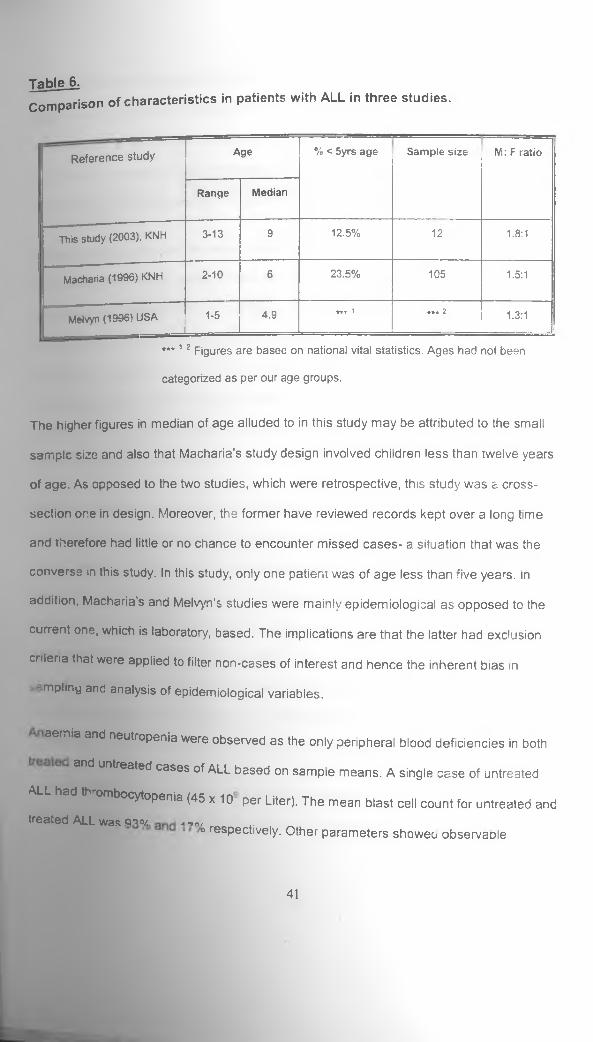
TableJLComparison of characteristics in patients with ALL in three studies.
R eferen ce study Age % < 5yrs age S am ple size M: F ratio
Range M edian
This study (2003), KNH 3-13 9 12.5% 12 1.8:1
Macharia (1996) KNH 2-10 6 23.5% 105 1.5:1
Melvyn (1996) USAJ
1-5 4.9 *★ * 1 *•* 2 1.3:1
* * * 12 Figures are based on national vital statistics. Ages had not been
categorized as per our age groups.
The higher figures in median of age alluded to in this study may be attributed to the small
sample size and also that Macharia’s study design involved children less than twelve years
of age. As opposed to the two studies, which were retrospective, this study was a cross-
section one in design. Moreover, the former have reviewed records kept over a long time
and therefore had little or no chance to encounter missed cases- a situation that was the
converse in this study. In this study, only one patient was of age less than five years, in
addition, Macharia’s and Melvyn’s studies were mainly epidemiological as opposed to the
current one, which is laboratory, based. The implications are that the latter had exclusion
criteria that were appiied to filter non-cases of interest and hence the inherent bias in
mplmy and analysis of epidemiological variables.
aemiaand neutropenia were observed as the only peripheral blood deficiencies in both
tfld untreated cases of ALL based on sample means. A single case of untreated
^ B S ^ ^ B j^ ^ O fto p e n ia (45 x 10 per Liter). The mean blast cell count for untreated andtreated ALL was gno/ a -m/
o respectively. Other parameters showee observaole
41
differences between the individual cases but did not show statistical significance. Three
patients amongst those on treatment were in morphological remission at the time of
recruitment. The rest of the cases showed marrow morphologic features of impending
remission, henceforth it was imprudent to compare the two clusters since only two cases of
untreated ALL were included in this study and only one of them was TdT positive.
A Quality Assurance measure aimed at eliminating bias and improve consistency during
FCM was instituted. The isotvpe control and TdT test sample were set in two different test
tubes and run in parallel. pnor to analysis a visual inspection on the power of the position of
the gate was performed. The position yielding the highest concentration of events was
selected. An evaluation of the number of gated events for both samples during acquisition
and analysis wet compared using Pearson's correlation coefficient. The correlation was
significant (p<0.05). which confirmed that the two samples were treated equally at the
staining stage and subseqUent|y
All BMA s obtained from cases and controls were evaluated for expression of TdT. Seven
(63.6/o) of the eleven cases of ALL reacted positive while only 38.1% of the control BMAs
turned positive. Studies from u-,e west have shown case expression rates of up to 92% for
newly diagnosed untreat^riQ cases of AJl. (20). The differences between the two studies are
probably due to treatment »status and the study design. Most of these larger studies are
collaborative multicenter rwMI°jects, a situation that is a comolete departure from this study.
Moreover, Western reseatLners have phenotyDically sub-classified the ALLs prevalent in
their set up whereby mature De o-cell ALL (a TdT negative entity) accounts for a small
proportion of ALL. In our setup FCM studies on hematological malignancies are not done.
A single case of ALL was inentified by morphological evaluation. It was not possible to
classify its lineage using Cytchemistry. However, it turned out to be a TdT-positive entity.
42

differences between the individual cases but did not show statistical significance. Three
patients amongst those on treatment were in morphological remission at the time of
recruitment. The rest of the cases showed marrow morphologic features of impending
remission. Henceforth it was imprudent to compare the two clusters since only two cases of
untreated ALL were included in this study and only one of them was TdT positive.
A Quality Assurance measure aimed at eliminating bias and improve consistency during
FCM was instituted. The isotvpe control and TdT test sample were set in two different test
tubes and run in parallel. Prior to analysis a visual inspection on the power of the position of
the gate was performed. The position yielding the highest concentration of events was
selected. An evaluation of the number of gated events for both samples during acquisition
and analysis was compared using Pearson’s correlation coefficient. The correlation was
significant (p<0 05), which confirmed that the two samples were treated equally at the
stair ng stage and subsequently.
All BMA s obtained from cases and controls were evaluated for expression of TdT. Seven
(63.6%) o' the eleven cases of ALL reacted positive while only 38.1% of the control BMAs
turned positive. Studies from the west have shown case expression rates of up to 92% for
newly diagnosed untreated cases of ALL (20). The differences between the two studies are
probably due to treatment status and the study design. Most of these larger studies are
co aborative multicenter projects, a situation that is a complete departure from this study,
ver. Western researchers have phenotyDically sub-classified the ALLs prevalent in
up whereby mature B-cell ALL (a TdT negative entity) accounts for a small
proportion of ALL inn1 our set UP PCM studies on hematological malignancies are not done.
A single case of ALu was 'aentified by morphological evaluation. It was not possible to
classify its lineage usinn h9 cytochemistry. However, it turned out to be a TdT-positive entity.
7 /
42
Immunophenotyping helped in this case which was thought to be a likely ALL based on the
Knowledge of distribution patterns of TdT.
TdT positivity by controls was contributed by BMAs exhibiting features of megaloblastic
hanges (n=1). AML (n=1), reactive changes (n=3), iron deficiency (n=2), and a single case
of a normal BMA. The BMAs with marrow aplasia and the normal peripheral blood sample
analyZecj exhibited no TdT activity. All the positives cited had scattered events upon
inspection of the respective blast windows in the acquisition dot plots and analysis
quadrants This finding is in keeping with earlier observations that TdT is a marker of
lymphoid cell immaturity that is not restricted to malignant cells. That most of these marrows
exhibited variable degrees of lymphoid cell proliferation was evident during morphological
evaluation. Correlations in this regard however were not part of the study objectives despite
this being a notable observation. Past publications have shown that TdT activity parallels
that of HLA-DR, which is another proven marker of cell immaturity. Studies correlating
morphological features with TdT positive cells in both BMAs and peripheral blood
mononuclear cells (PBMCs) have shown that the positive cells are morphologically benign
immature lymphoid cells. This feature is the immunological replica of precursor cells during
their maturation (21,29). In this respect, TdT expression is transient and it ceases when
heavy chain gene rearrangements are complete and light chain gene rearrangements have
commenced. Normal BMAs also express TdT in small amounts (15).
Our recruitment of controls was not structured to exclude any cisease categories, except,
ALL. The blind” combinations of BMAs with variable TdT reactivity may have contributed to
©insignificant disparity when compared with cases of ALL or, chemotherapy (p>0.05).
owever, the strong positive correlations between blast cell count and TdT activity in this
yadds power to the discriminative abiuty of FCM when used quantitatively. Bhatavdei.ar
Welte, using an enzymatic technique on peripheral blood had explored this feature (30,
43
31) They showed that peripheral blood exhibits TdT activity of less than 0.2U per 108
PBMCs Patients with as low as ten percent blasts in blood had significantly higher levels of
TdT when compared with blast negative patients. Nidal in a separate review cited that FCM
can detect as few as two percent blasts in mixing experiments (20). This has found
applications in evaluating patients for minimal residual disease A positive correlation was
also demonstrated between gated events and the absolute counts of TdT expressing events
within the gate.
A comparison o' visual blast counts against TdT percentage expression in the gated cells of
treated ALL showed a strong positive correlation (r=0.99, p<0.05). The relationship was
linear for both cases and controls. Borowitz had equally demonstrated that the correlation
between morphologic blast cell counts anc FCM estimates was positive and stronger at
narrow ranges of counts (17). This concept may oe refined in future when proposed analysis
of antigen densities and knowleoge-based software are developed (32).
in most studies cited, including this one, isolation of leukemic cells from BMAs has used
density gradient separated mononuclear cells for phenotyping. This enriches for leukemia
cells. However, it fails to account for relative compositions of BMAs unlike erythrocyte lysing
techniques. Borowitz in a study performed a post recovery differential count following
erythrocyte lysis technique (33). He reported a generally lower percentage of abnormal cells
than morphologic counts of such cells had revealed prior to separation. However, these
were correlated over a wide range. Significant discrepancies between morphologic counts
and FCM estimates were related most often to poor aspirates o- selective loss of cells
during sample processing.
An obvious omission in this study was failure to pe-form a pre-analytic and a post-cell
recovery BMAs automated differentia, count owing protocols for machine use in KAV.
44
laboratories. However, a technique for this procedure has been described (34, 35).
Nevertheless, during the assay set up, serial morphological cell recovery assessments were
done on each specimen after cell separation. Acceptable recovery rates were demonstratec
in BMAs specimens as old as 84 hours. In this study, analysis of TdT was done within 72
hours of collecting the BMAs specimens from the recruited patients.
Flow cytometry is used widely to phenotype cases of acute leukemia and is now clearly
important in classification (17, 36, 37). Although many laboratories have considerable
experience with this technology there is no single accepted method for analyzing,
interpreting or reporting data (17). When peripheral blood or bone marrow is replaced largely
by blasts, it is generally no problem to determine the phenotype of the leukemic cells;
however, cases in which leukemic and normal cells are present, routine methods of analysis
make it difficult to interpret phenotypic information. This is particularly true if data are
reported as percentage of cells marking with a particular antibody. This aspect was
demonstrated by specimens analyzed in this study. None consisted purely of blasts, majority
of the leukemic cases were impending morphological remission and some of the controls
showed lymphoid cell hyperplasia of variable degrees. In FCM, such ceils have individua
variable characteristics that facilitate them to occupy variable positions in the scatter plots.
Compounded by absence of a secondary cell marker, it became difficult to control the
location of the gate to maximize on the position of blasts and exclude most of the outliers.
Despite the low percentage positives displayed by the selected cases, our findings have
been reinforced by the stronger correlations of cells gated around the blast window unlike in
other positions.
Previous reports have indicated arbitrary thresholds for positivity at 20% of the isolated cells
as opposed to our study where recommendations were that proportions of positivity be
gauged against gated events. Moreover, the investigator used an antibody blank to set
45

threshold limits. Any degree of positivity against the blank was considered as so. An attempt
was made to quantify numerically the absolute numbers of positives, which were then
converted to a percentage. Both values were used during the data analysis.
ySingle marker studies are not inviolate from limitations. For instance, one case of AML by
m o r p h o l o g y was TdT positive (see appendix 6, case no. BMA 0605) but its true phenotype
could not be established. Similarly, a few ALL cases failed to express the 1 dT phenotype.
This limits the probabilities of observations in small studies. Phenotypic anc genotypic re
arrangements may alter the specificity of the Mab. In leukemia biology, gene
rearrangements owing to mutations, deletions and recombinant events are central
pathobiologic events. (1,2, 5, 13, 14). In their studies Adriansen and Drasch respectively
showed that fifteen (13%) and ten (19%) of AMLs in their series exhibited an aberrant
expression of ALL antigens namely TdT and/or CD 13 (38,39).
Lack of a standardization criterion for data interpretation is a common finding that
introduces disturbing variability (40). Different analysis kits, procedures and instrumentation
from as varied manufactures and commercial agents yield incomparable results This
predicament has been confirmed in several different reports on externai quality assessment
programmes on immunophenotyping procedures (41,42, 43, 44). Such situations have lec
to enormous efforts by several groups to obtain specific consensus protocols for leukemia
immunophenotyping and common criteria for data interpretation and reporting. These
however have only been partially successful owing to the continued application of
morphology as the standard reference for immunophenotypic characterization of ieukemia.
which according to Paietta should be considered a relic of the past (45).
To overcome these pitfalls, multiparametric analysis has been recommended. This refers tc
the simultaneous measurements and display of four or f,ve different parameters of scatter
46
v
and fluorescence. With appropriate combinations of antibodies, it is frequently Poss'ble
distinguish between normal and neoplastic cells and particularly when fluorescent
measurements are combined with information from light scatter (46). Multiparametric Fqn*1 of
minimal residual disease in ALL is a valuable tool for relapse prediction and for the
identification of a cohort of patients with very poor prognosis. (47) The technology bas
illustrated the complexity of differentiation pathways taken by leukemic cells and has
highlighted the uniqueness of the phenotype of a particular neoplasm (48, 49). However,
these are difficult to use in a routine clinical set up (35).
The lack of a significant difference in TdT percentage expression by cases and controls
suggest that morpnology and immunological aspects are independent of each other anb
morphology is an imperfect marker of biologic potential (26,49,50). This is because it is
difficult to determine accurately the maturation stage of the biologically immature cells byr
morphological criteria. This observation strengthens the resolve that immunologic3' tes* aC:t
as ancillary adjuncts to morphological assessment of malignancies-an observation shared
by Weir and Borowitz(14, 17).
The usefulness of TdT in differentiating between leukemic marrow samples from those of
benign cases has been documented. Indeed, this concept forms the basis for pan3' m a rke ^
in acute leukemia and not for benign conditions (1,2, 12.48). This study has demonstrated ^
significant difference in the expression of TdT between acute leukemia (ALL & Ak/lh wben
analyzed together) and Non leukemia controls (p=0.025)Jmplications are that it is unusual
for a benign haemopoietic condition to express significantly high levels of TdT and at bn9ht
fluorescence. Simultaneous studies of TdT and HLA-DR have implicated the two as rTiar 8 J
of cell immaturity in the differentiation sequence with no reference to cell lineage (23'
.In addition, ancillary tests using TdT should be judiciously selected on established ^
patterns rather than on whims.
47
This study has re-affirmed that bright fluorescence is undoubtedly significant compared to
borderline and weakly positive fluorescence. However, in as much as qualitative features of
positivity are important, emphasis is shifting to descriptions of fluorescence intensity in
aodition to simply positive or negative. (16, 32). This has been referred to as fluorescence
definition. It allows for detection of aberrant antigen co-expression and the analysis for
heterogeneity and clonality of malignant cells in leukemia and lymphomas (32).
Fluorescence definition may provide a better descriptor of antigen distribution on leuKemic
cells than percentage positives. More over it is a more powerful predictor of events free
survival than either qualitative dichotomous discrimination of positives and negatives.
Studies by Borowitz et al, demonstrated that fluorescence intensity of CD45 and CD 20 was
significantly associated with events free survival in B-precursor ALl , while other markers
showed no significant correlation (27). This implies that the fluorescence definition for CD45
and CD20 provides prognostic information not availaole from simple considerations of
antigen expressions- as positive or negative- and adds to that obtained from traditional
clinical and biologic risk factors (27, 28). Lack of this installation in many flow cytometers
has hampered the use of relative fluorescence to compare studies performed over a time.

7.0 CONCLUSION
In summary, this study has indirectly evaluated the practical aspects of setting up an
immunophenotypic assessment of ieukemia in our clinical setting. Some observations on the
clinical utility of a single Mab (Tdt) in ALL were made. It was observed that;
□ Morphologic assessment of ALL could be complemented by TdT.
□ If it can be considered part of the test pane! TdT may have a role in the follow-up of
patients with ALL who are undergoing chemotherapy.
□ Although there was no significant difference in TdT reactivity between the various
categories of ALL on treatment, there was a positive correlation between the blast
counts and Tdt activity.
□ It was not possible to deduce the proportion of ToT positive ALL in our set-up owing
to an insufficient sample size of new cases of ALL. The same case applied to AUL
as only one case was recruited in to the study.
49
8.0 CONSTRAINTS ENCOUNTERED.
In the course of data collection and analysis, the following were some of the limitations
encounterea.
Sample size
Leukem as being rare outcomes predispose investigators to small sample sizes and
especially so in studies of short duration. Our three-month study period exposed the
investigation to this probability. The small number of patients recruited made it difficult to
observe any significant trends. A wider catchment study area and an extension of the study
period would have realized a reasonable number of cases.
On the other hand, there were several instances when potential cases, either previously
diagnosed or newly presenting, were excluded from recruitment. These missed opportunities
were attributed eithe-:
□ Tc small volumes o:' 3MAs samples obtained and therefore not amenable to
flow cytometry.
□ Some samples were received in the laboratory clotted in the specimen
bottles prior to analysis.
□ The investigator was not informed of some cases of ALL due for BMAs
examination.
In all instances, the diagnosis (of ALL or other pathology) was made on bone marrow slides.
Owing to ethical bonds, we couldn’t reach out to re-aspirate such patient purely for study
purposes.
50
Technical aspects.
This being a pioneer study in Kenya there was some but not enough technical expertise
locally in the field of Leukemias. However, attempts to seek reference standaras and control
material abroad were fruitless owing to a paucity of contacts in this field. Only one of the
approached authorities responded by sending a methodology used in their laboratory and
was not compatible with our resources. The methodology was therefore not considered.
The study had been designed to quantify the fluorescence intensity as well. We were
however unsuccessful in setting up to this function in the flow cytometer. This was meant to
express fluorescence definition in mean equivalents of soluble fluorochrome (MESF).
Publications
It is difficult to obtain literature locally. Literature citing epidemiological and or
clinicopatnologic features of patients with ALL against TdT were obtained mainly from older
publications. Methods of TdT analysis differed from the one used in this study.Most of the
newer publications dealt with panel leukemia markers with TdT oniy being mentioned. This
study however is in line with the recommended protocols for immunological diagnosis of
lymphoid malignancies.
9.0 RECOMMENDATIONS
The outcomes of this pioneer study point to a promising utility of flow cytometric studies in
patient care. The investigator recommends the following as the way forward
1. That the clinical applications of TdT phenotyping in diagnosis and monitoring of ALL
chemotherapy be instituted in our clinical setting.
2. That the use of more immunological markers of disease (MAbs) alongside other
ancillary studies like cytochemistry and cytogenetics should be considered in our
leukemia patients work-up.
3. That more studies with a wider participation of institutions and encompassing other
diseases amenable to FCfy, evaluation are carried out in our set-up.
4. The significance of fluorescence intensity in TdT phenotype assays ought to be
investigated.
5. Training of laboratory personnel in FCM and other novel diagnostic techniques in
haematoloaic oncology needs to be instituted.
52
REFERENCES:
1. Catovsky, D.t Hoffbrand, A.V. Acute Leukemia: in Hoffbrand, A.V., Lewis, S.M.
(ed) Postgraduate Hematology 4U' Edition, Tuddenham, E.G.D. Butterworth
Heinemann. 373-404.
2. Rivera, G.K., Crist, W.M in Handin R.l ed. Blood: Principles and Practice of
Hematology (1995); J.B Lippincott Company. 743.
3. Pui, C; Evans, W.E. Acute Lymphoblastic Leukemia. NEJM (1998); 339(9):
605-615.
4. Hirt, A, Antic, V; Wang, E.et al. Acute Lymphoblastic Leukemia in Childhood
Cell Proliferation without Rest. British Journal of hematology. (1997); 96:366.
5. Melvyn, F.G., Li.C.Chan. Is Spontaneous Mutations the Major ‘Cause’ of
Childhood Acute Lymphoblastic Leukemia? British Journal of Hematology
(1996) 64: 1-13.
6. Kasili, E.G.; Leukemia in Kenya (1979) Nairobi.MD Thesis,
7. Macharia, W.M; Childhood Cancers in a Referral Hospital in Kenya: A
Review. EAMJ (1996); 73:647-650.
8. Sasaki, R; Yuasa, A; Masuyama et al. Production of a Specific Monoclonal
Antibody to Tdt and the extensive studies of TdT in patients with
hematological malignancies. Haematologia (Budap) (1993); 25:223.
9. Kasili, E.G Childhood Leukemia: Is it a Problem in Tropical Africa?
Leukemia and Lymphoma (1990); 1:187-193,
10. Department of Hematology & Blood Transfusion. Archived laboratory reports
January-August 2000 and June-December 2001 (unpublished).r\
11. Department of Hematology & Blood Transfusion. Archived laboratory reports
January-May 2003 (unpublished)
53
12. Lewis, S.M; Bain, B.J; Bates, I; (eds) Dacie and Lewis Practical Hematology
(2001). Ninth edition, Churchill Livingstone, <l,
13. Ngunyen, D.T; Diagnostic Hematology: A Pattern Approach (2000)^Butter
worth Heinemann;
14 Weir, E.G; Borowitz M.J; Flow Cytometry in the Diagnosis of Acute
Leukemia. Seminars in Hematology (2001); 38(2) 124-138.
15. Bollum. F. J. Terminal Deoxyribionucleotidyl Transferase as a Haemopoietic
Cell Marker. BLOOD (1979); 54 (6): 1203-1215.
16. Marti, G. E; Stetlar-Stevenson, M; Fleischer, B; and Fleischer, T.A; Introduction
to Flow Cytometry. Seminars in Hematology (2001) 38(2); 93-98.
17. Borowitz M, J; Guenther, K, L; Shults, K.E; Seltzer G, T; Immunophenotyping
of Acute Leukemia by Flow Cytometric Analysis. Use of CD45 and Right
Angle Light Scatter to Gate on Leukemic Blasts in Three-color Analysis.
American Journal of Clinical Pathology (1993); 100 (5) 534-540.
18. Jackso, P; Pajor, L. Advantages of CD45 vs. Sioe Scatter Based Gating in
the Course of Flow Cytometric Immunophenotyping in Malignant
Hematological Diseases .Orv Hetil (1998) 139 (42) 2509-13.
19. Bibbo, M; Comprehensive Cytopatnology. (1997) Second Edition. W.B
Saunders Company. 997-1023.
20. Nidal, M; Almassi, M.D; Jose, A. et al. Flow Cytometric Analysis o' TdT.
American Journal of Clinical Pathology (1991); 95:376-380.
21. Janeway C.A., Travers P., Walport M. Immunobiology. The Immune System
in Health and Disease, 4th ed. Current Biology Publications, Garland Publishing
and Churchill Livingstone. New York, 1999.
22. Pullen, J; Shuster, J.J; Link M; et al. Significance of Commonly Used
Prognostic Factors Differs For Children With T Cell Acute Lymphoblastic
54
Leukemia (ALL), as Compared To Those With B Precursor ALL. A Pediatric
Oncology Group Study. Leukemia (1999); 13(11); 1696-1707.
23. Bombardieri, E; Campagnari, F; De Braud, F; et al Analysis of The Enzyme
TdT in Lymphoma and Leukemia Cells. Acta Biomed Ateneo Parmese (1984);
55 (1): 15-23,
24. Shaw M.T; Dwyer J.M; Allauden H.S; et al. TdT Activity in B-cell Acute
Lymphocytic Leukemia. Blooc. '1978): 51(2): 181-187.
25. Janossy, G; Hoffbrand, A.V; Greaves, M.F; et al. Terminal Transferase
Enzyme Assay and Immunologic Membrane Markers in the Diagnoses of
Leukemia: a multi parameter Analysis of 300 Cases. British Journal of
Haematology (1980); 44:221-234.
26. Loeb, S. Clinical Laboratory Tests: Values and Implications (1991)
Springhouse Corporation. /
27. Behm, F.G; Raimondi, S.C; Scell, M.J; et al; Lack of CD 45 Antigen on Blast
Cells in Childnood ALL With Chromosomal Hyperdiploidy and Other
Favorable Prognostic Features. Blood (1992): 79: 1011,
28. Caldwell, C.W; Patterson, W .P; Hakami, N; CD-45 Expression and Prognosis
in ALL. Blood 81; 562,1993
29. Farahat, N., Lens, D., Zomas A., et al. Quantitative Flow Cytometry can
Distinguish between Normal and B-cell Precursors. British Journal of
Haematology, 1995; 91:640-646.
30. Bhatavdekar JM, Trivedi SN, Vora HH Shukra SN. Usefulness of Terminal
Deoxynucieotidyl Transferase as Prognosticator in Leukemia Patients.
International Journal of Biological Markers. 1993,8:77-80.
55

31. Welte K, Ebener U, Hinderfeld L, et a!. Implications of Terminal
Deoxynucleotidyl Transferase Activity in Various Forms of Childhood
Leukemia. Klin padiatr 1981; 193:165-171
32. Rothe, G; Schmitz, G. Consensus Protocol for the Flow Cytometric
Immunophenotyping of Haemopoietic Malignancies. Working Group on
Flow Cytometry and Image Analysis. Leukemia (1996 May) Vol 10(5) 877-95.
33. Borowitz, M J; Pullen D, J; Shuster, J.J et al: Minimal Residual Disease
Detection in Childhood-Precursors-B-Cell ALL: Relation to Other Risk
Factors. A Children’s Oncology Group Study. Leukemia (2003) Aug, 17(8)
1566-72.
34. Terstapen, L.W: Johnson, D; Mickaels R, A; et al. Multidimensional Flow
Cytometric Blood Cell Differentiation without Erythrocyte Lysis. Blood cells
(1991); 17:585-602
35. Terstapen, L.W; Loken M.R; Five Dimensional Flow Cytometry as a New
Approach for Blood and Bone Marrow Differentials. Cytometry (1988); 9:548-
556
36. Foon, K.A; Todd, R.F; Immunological Classification of Leukemia ana
Lymphoma. Blood (1986); 68: 1-31.
37. Browman, G.P; Neame, P.B; Soamboonsrup, P. The Contribution of
Cytochemistry and Immunophenotyping to the Reproducibility of the FAB
Classification in Acute Leukemia. Blood (1986); 68: 900-905.
38. Adriaansen, H.J; Jacobs, B.C; Kappers-Klunne et al: Detection of Residual
Disease in AML patients by use of Double immunological Markers Analysis
for TdT and Myeloid Markers. Leukemia 7: 472, 1993
56
39. Drach, J; Drach, D; Glassl, H. Flow Cytometric Determination of Atypical
Antigen Expression in Acute Leukemia for the Study of Minimal Residual
Disease. Cytometry (1992) 13 893.
40. Orfao A, Schmitz G, Brando B et al. Clinically Useful Information Provided by
the Flow Cytometric Immunophenotyping of Hematological Malignancies:
Current Status and Future Directions. Clinical Chemistry. 1999; 45: 1708-
1717.
41. Hassett J, Parker J. Laboratory Practices in Reporting Flow Cytometry
Phenotyping Results for Leukemia/lymphoma Specimens Results of a
Survey. Cytometry 1995; 22:264-281
42. Homburge; HA, RosenstockW, Paxton H, Paton ML, Landay AL. Assessment
of interlaboratory Variability of Immunophenotyping: Results of the
College of American Pathologists Flowcytometry Survey. Ann N Y acad Sci
1993; 677:43-49
43. Kluin-Nelemans J C, van Wenng ER, van’t Veer MB et a!. Pitfalls in the
Immunophenotyping of Leukemias and Leukemic Lymphomas: Survey of
Nine Years of Quality Control in the Netherlands. British Journal of
Hematology 1996; 95:692-699
44. Van’t Veer MB, Kluin-Nelemans J C, van der Schoot CE et al. Quality
Assessment of Immunological Marker Analysis and the Immunological
Diagnosis in Leukemia and Lymphoma: a Multicenter Study. British Journal
of Haematology 1992; 80:458-465.
45. Paietta E, Andersen J, Wiernik P. A New Approach to Analyzing the Utility of
Immunophenotyping for Predicting Clinical Outcome in Acute i_eukemia.
Leukemia 1996: 10:1-4.
57

46. Terstapen, L.W; Konemann S; Safford M; et al. Flow Cytometric
Characterization of AML: part I. Significance of Light Scattering Properties.
Leukemia (1991); 5:315-321.
47. Cuttner, J; Serementi S; Najfeld V; et al. TdT-Dositive Acute Leukemia with
Monocytoid Characteristics: Ciinical, Cy ocnemical, Cytogenetic and
Immunological Findings. Blood (1984). 64(1): 237-243.
48. William, J.W; Coyle, T.E; et al. Williams Hematology 1996. Fifth editionAs
McGraw-Hill.
49. Vidriales, M .B; Perez, J.J; Lopez-Berges, M.C. et al: Minimal Residual
Disease in Adolescent (older than 14 yrs) and Adult ALL.. Early
Immunophenotypic Evaluation has High Clinical Value. Blood (2003),
101(12)4695-4700.
50. Ciudad J, San Miguel J F, Lopez-Berges MC et al. Prognostic Value of
Immunophenotypic Detection of Minima! Residual Disease in ALL. Journal
of Clinical Oncology 1998,16(12) 3774-81.
58
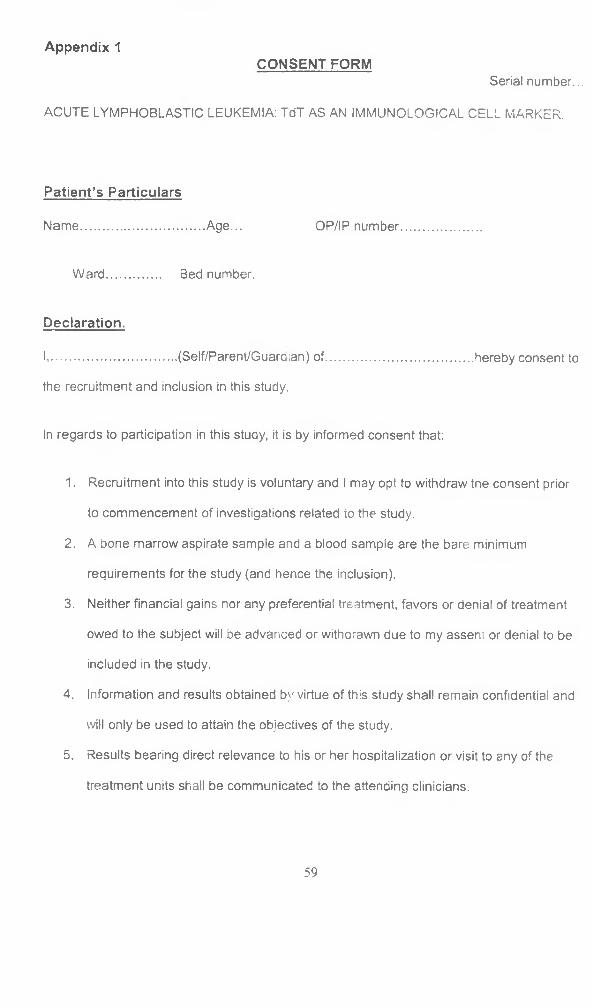
Appendix 1CONSENT FORM
Serial number...
ACUTE LYMPHOBLASTIC LEUKEMIA: TdT AS AN IMMUNOLOGICAL CELL MARKER.
Patient’s Particulars
Name................................... Age... OP/IP number
Ward............... Bed number.
Declaration.
I..................................... (Self/Parent/Guaraian) of...........................................hereby consent to
the recruitment and inclusion in this study.
In regards to participation in this study, it is by informed consent that:
1. Recruitment into this study is voluntary and I may opt to withdraw tne consent prior
to commencement of investigations related to the study.
2. A bone marrow aspirate sample and a blood sample are the bare minimum
requirements for the study (and hence the inclusion).
3. Neither financial gains nor any preferential treatment, favors or denial of treatment
owed to the subject will be advanced or withorawn due to my asseni or denial to be
included in the study.
4. Information and results obtained by virtue of this study shall remain confidential and
will only be used to attain the objectives of the study.
5. Results bearing direct relevance to his or her hospitalization or visit to any of the
treatment units shall be communicated to the attending clinicians.
59

Name............
Signature/Thumb print
Name and signature of witness.
Date of consenting...d. ■
Designation.
60
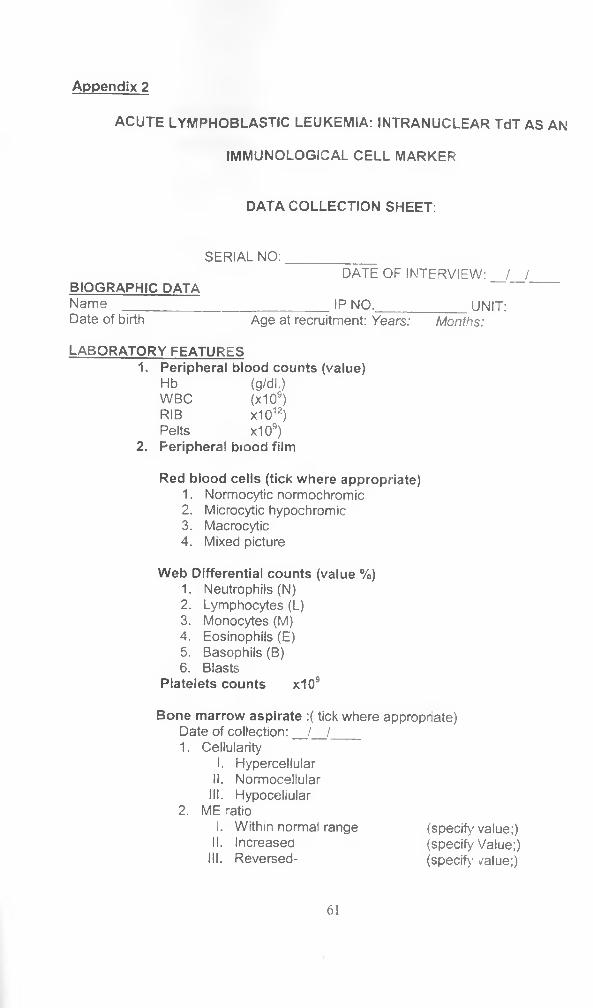
ACUTE LYMPHOBLASTIC LEUKEMIA: INTRANUCLEAR TdT AS AN
IMMUNOLOGICAL CELL MARKER
Appendix 2
DATA COLLECTION SHEET:
SERIAL N O :_____________DATE OF INTERVIEW: / /
BIOGRAPHIC DATAName ______________________________ IP NO.____________ _U N IT :Date of birth Age at recruitment: Years: Months:
LABORATORY FEATURES1. Peripheral blood counts (value)
Hb (g/dl.)WBC (x109)RIB x1012)Pelts x109)
2. Peripheral biood film
Red blood cells (tick where appropriate)1. Normocytic normochromic2. Microcytic hypochromic3. Macrocytic4. Mixed picture
Web Differential counts (value %)1. Neutrophils (N)2. Lymphocytes (L)3. Monocytes (M)4. Eosinophils (E)5. Basophils (B)6. Blasts
Platelets counts x109
Bone marrow aspirate : ( tick where appropriate)Date of collection: / /1. Cellularity
I. HypercellularII. Normocellular
III. Hypoceliular2. ME ratio
I. Within normal range (specify value;)II. Increaseo (specify Value;)
III. Reversed- (specify value;)
61
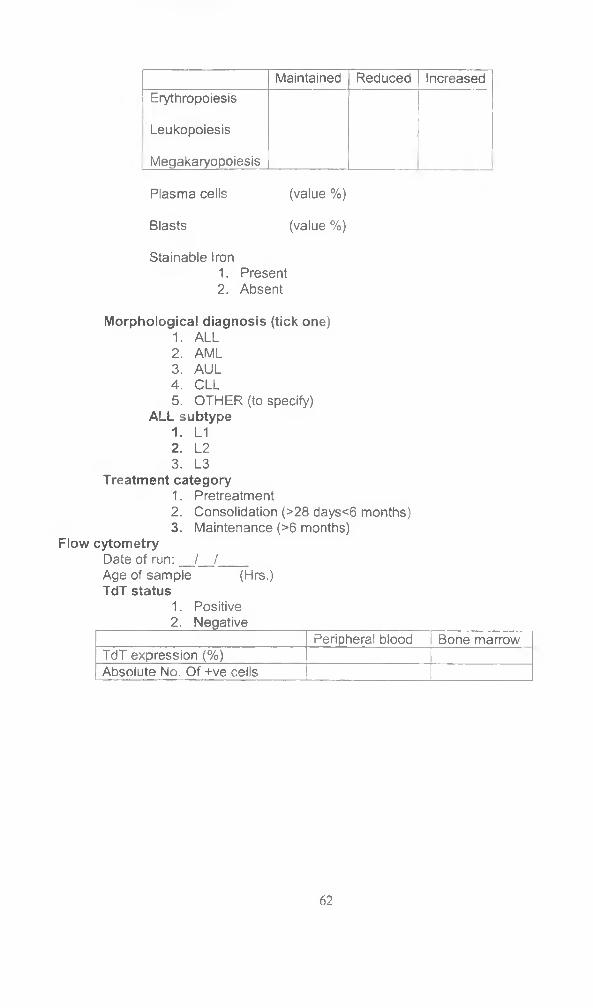
Maintained Reduced IncreasedErythropoiesis
Leukopoiesis
Megakaryopoiesis
Plasma cells (value %)
Blasts (value %)
Stainable Iron1. Present2. Absent
Morphological diagnosis (tick one)1. ALL2. AML3. AUL4. CLL5. OTHER (to specify)
ALL subtype1. L12. L23. L3
Treatment category1. Pretreatment2. Consolidation (>28 days<6 months)3. Maintenance (>6 months)
Flow cytometryDate of run: / /Age of sample (Hrs.)TdT status
1. Positive2. Negative
Peripheral blood Bone marrowTdT expression (%)Absolute No. Of +ve cells
62

Appendix 3
FORMULA FOR CALCULATION OF SAMPLE SIZE
Step 1 (where population is >10,000)
S s = [ Z 2 ~ ( P ) * ( 1 - P ) ] / G 2
Where
Z= Z value (1.96 for 95% confidence level)
P=percentage picking a choice, expressed as decimal
C=confidence interval, expressed as decimal
Step 2 (where population is < 10,000)
N f = n / [ 1 - H ( n / M > ]
Where
Nf= new sample size for populations < 10,000
n= sample size if population > 10000(ss in step 1 above)
N= current population size (no Less tnan 10,000)
6 3

Appendix 4
PROCEDURE FOR OBTAINING PERIPHERAL BLOOD AND BONE
MARROW SPECIMENS
To avoid faults in specimen collection, storage and transport to the laboratory and to ensure
reproducibility of results, a standard procedure for collecting and handling blood and bone(4/^0
marrow specimens is be as follows
A) PERIPHERAL BLOOD:
i. Reassure the patient and the guardian prior to beginning uie procedure.
ii. Identify a suitable peripheral vein. The antecubital veins are preferable but if not
accessible, the dorsal veins of the hand will be a suitable alternative.
iii. Apply a tourniquet around the upper third of the humerus to enhance the
prominence of the distally located veins.
iv. Clean the skin overlying the identified vein using 70% alcohol and allow to air dry.
v. Using a gauge 21 needle for the adults and bigger children or gauge 23 for the
smaller ones access the lumen of the vein gently and steadily. By means of an
evacuated container (vacutainers), draw an amount of blood to the level
determined for the anticoagulant in the tube.
vi. Gently rock the vacutainer to mix the collected blood with the anticoagulant.
vii. The biood is then transported to the laboratory for further processing.
viii. Withdraw the vacutainers needle from the vein apply gentle pressure over the
puncture site using an alcohol soaked cotton swab until bleeding stops and then
fix adhesive dressing over the site.
6 4

B) BONE MARROW ASPIRATION:
Biopsy of the bone marrow is an indispensable adjunct to the study of diseases of the blood.
A simple and safe procedure seldom fails to provide important information in patients who
have a blood disease. In children, the posterior superior iliac spine punctures are preferable
to other site owing to their higher marrow yielo and relative safety compared to other
possible sampling sites.
In this study, reusable sterile bone marrow puncture needles were used for each patient.
The procedure, for which asepsis was maintained, w'as as follows;
i. Reassure the patient as to the nature of the procedure.
ii. Clean the skin overlying the site of biopsy using 70% alcohol.
iii. Infiltrate the skin, subcutaneous tissue and the periosteum with five-ml. of 2%
lignocaine for local anesthesia.
iv. By boring movements, penetrate the marrow cavity perpendicularly and once it
has been reached, withdraw the stylet of the biopsy needle and attach a ten-ml.
syringe to suck up the contents.
v. Prepare marrow films from the aspirated material immediately to avoid clotting of
the specimen.
vi. The remainder of the marrow specimen will be transferred in preservative free
heparin to the laboratory for further processing.
vii. In cases of re-aspiration owing to specimen inadequacy, a different site from the
previous one will be seed to avoid nemodilution.V o
65
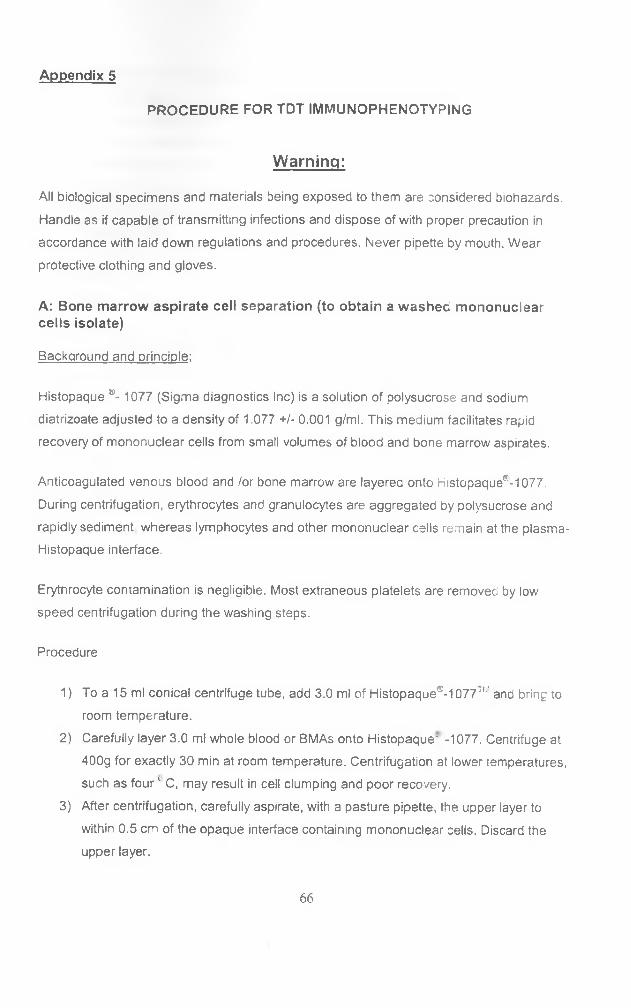
Appendix 5
PROCEDURE FOR TDT IMMUNOPHENOTYPING
Warning:
All biological specimens and materials being exposed to them are considered biohazards.
Handle as if capable of transmitting infections and dispose of with proper precaution in
accordance with laid down regulations and procedures. Never pipette by mouth. Wear
protective clothing and gloves.
A: Bone marrow aspirate cell separation (to obtain a washed mononuclear cells isolate)
Background and principle:
Histopaque ®- 1077 (Sigma diagnostics Inc) is a solution of polysucrose and sodium
diatrizoate adjusted to a density of 1.077 +/- 0.001 g/ml. This medium facilitates rapid
recovery of mononuclear cells from small volumes of blood and bone marrow aspirates.
Anticoagulated venous blood and /or bone marrow are layerea onto histopaque(R-1077.
During centrifugation, erythrocytes and granulocytes are aggregated by polysucrose and
rapidly sediment whereas lymphocytes and other mononuclear cells remain at the plasma-
Histopaque interface.
Erythrocyte contamination is negligible. Most extraneous platelets are removed by low
speed centrifugation during the washing steps.
Procedure
1) To a 15 ml conical centrifuge tube, add 3.0 ml of Histopaque@-10777f'' and bring to
room temperature.
2) Carefully layer 3.0 ml whole blood or BMAs onto Histopaque' -1077. Centrifuge at
400g for exactly 30 min at room temperature. Centrifugation at lower temperatures,
such as fou rL C, may result in cell clumping and poor recovery.
3) After centrifugation, carefully aspirate, with a pasture pipette, the upper layer to
within 0.5 cm of the opaque interface containing mononuclear cells. Discard the
upper layer.
6 6
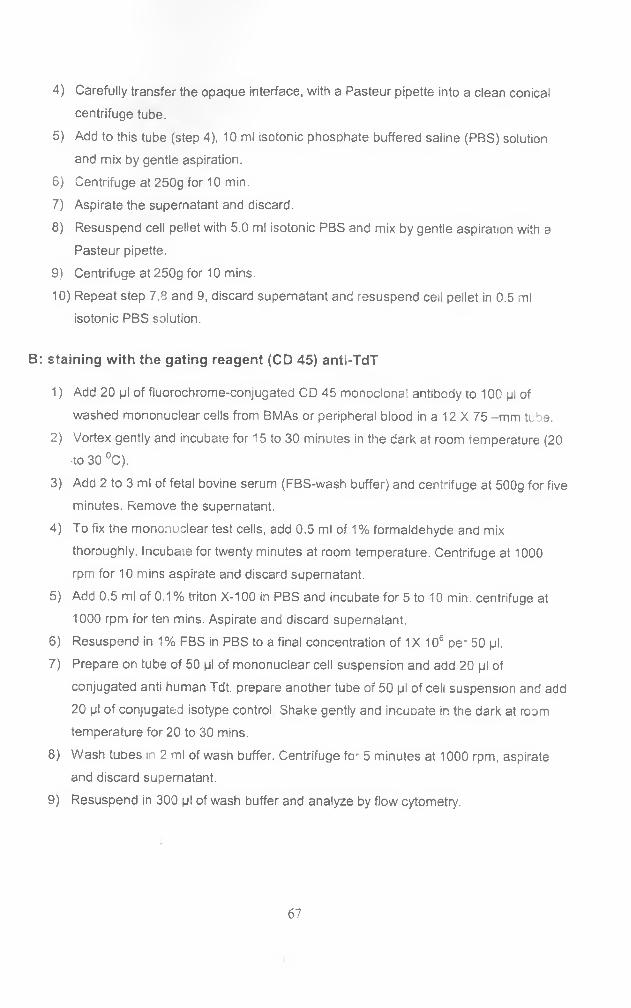
4) Carefully transfer the opaque interface, with a Pasteur pipette into a clean conical
centrifuge tube.
5) Add to this tube (step 4), 10 ml isotonic phosphate buffered saline (PBS) solution
and mix by gentle aspiration.
6) Centrifuge at 250g for 10 min.
7) Aspirate the supernatant and discard.
8) Resuspend cell pellet with 5.0 ml isotonic PBS and mix by gentle aspiration with a
Pasteur pipette.
9) Centrifuge at 250g for 10 mins.
10) Repeat step 7.8 and 9, discard supernatant and resuspend ceil pellet in 0.5 ml
isotonic PBS solution.
B: staining with the gating reagent (CD 45) anti-TdT
1) Add 20 pi of fluorochrome-conjugated CD 45 monoclonal antibody to 100 pi of
washed mononuclear cells from BMAs or peripheral blood in a 12 X 75 -mm tube.
2) Vortex gently and incubate for 15 to 30 minutes in the dark at room temperature (20
-to 30 °C).
3) Add 2 to 3 ml of fetal bovine serum (FBS-wash buffer) and centrifuge at 500g for five
minutes. Remove the supernatant.
4) To fix the mononuclear test cells, add 0.5 ml of 1% formaldehyde and mix
thoroughly. Incubate for twenty minutes at room temperature. Centrifuge at 1000
rpm for 10 mins aspirate and discard supernatant.
5) Add 0.5 ml of 0.1% triton X-100 in PBS and incubate for 5 to 10 min. centrifuge at
1000 rpm for ten mins. Aspirate and discard supernatant.
6) Resuspend in 1% FBS in PBS to a final concentration of 1X 10⁶ per 50 pi.
7) Prepare on tube of 50 pi of mononuclear cell suspension and add 20 pi of
conjugated anti human Tdt. prepare another tube of 50 pi of cell suspension and add
20 pi of conjugated isotype control Shake gently and incuoate in the dark at room
temperature for 20 to 30 mins.
8) Wash tubes in 2 ml of wash buffer. Centrifuge for 5 minutes at 1000 rpm, aspirate
and discard supernatant.
9) Resuspend in 300 pi of wash buffer and analyze by flow cytometry.
67
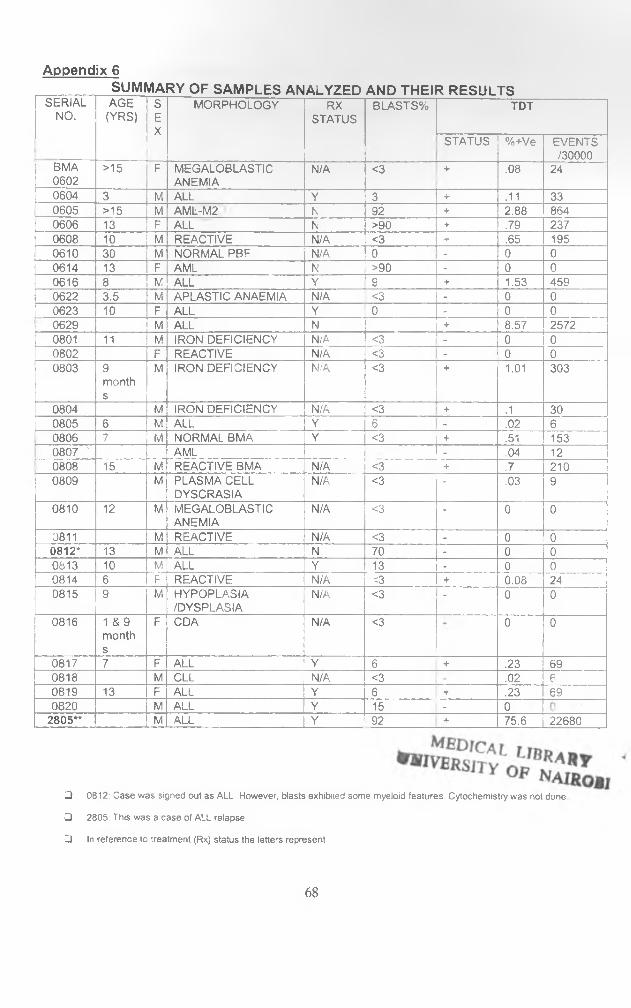
Appendix 6SUMMA RY OF SAMPLES AN ALYZED AND THEI RRESULTS
SERIAL AGE S MORPHOLOGY RX BLASTS% TDTNO. (YRS) E
XSTATUS
STATUS %+Ve EVENTS/30000
BMA >15 F MEGALOBLASTIC N/A <3 +------------ .08 240602 ANEMIA0604 3 M ALL Y 3 + .11 330605 >15 M AML-M2 N 92 + 2.88 8640606 13 F ALL N >90 + .79 2370608 10 M REACTIVE N/A <3 i- .65 1950610 30 M NORMAL PBF N/A 0 - 0 00614 13 F AML N >90 - 0 00616 8 M ALL Y '9 + 1.53 4590622 3.5 M APLASTIC ANAEMIA N/A <3 - 0 00623 10 F ALL Y 0 - 0 00629 M ALL N + 8.57 I 25720801 11 M IRON DEFICIENCY N/A <3 - 0 00802 F REACTIVE N/A <3 - o 00803 9
months
M IRON DEFICIENCY N/A <3 + 1.01 303
0804 M IRON DEFICIENCY N/A <3 + .1 300805 6 M ALL Y 6 - .02 60806 7 M NORMAL BMA Y <3 + .51 1530807 ' IAML - .04 120808 15 M REACTIVE BMA N/A <3 + .7 2100809 M PLASMA CELL
DYSCRASIAN/A <3 - .03 9
0810 12 M MEGALOBLASTICANEMIA
N/A <3 - 0 0
0811 M REACTIVE N/A <3 - 0 00812* 13 M ALL N 70 - 0 00813 10 M ALL Y 13 - 0 00814 6 F REACTIVE n/a <3 + 0.08 240815 9 M HYPOPLASIA
/DYSPLASIAN/A <3 - 0 0
0816 1 & 9 months
F CDA N/A <3 0 0
0817 7 F ALL Y 6 + .23 690818 M CLL N/A <3 .02 60819 13 F ALL Y 6 + .23 6 90820 M ALL Y 15 - 0
2805** M ALL Y 92 + 75.6 22680
□ 0812: Case was signed out as ALL However, blasts exhibited some myeloid features. Cytochemistry was not done
□ 2805: This was a case of ALL relapse
□ In reference to treatment (Rx) status the letters represent
6 8

> Y = on chemotherapy
V N = pretreatment cases of acute leukemia
> N/A =chemotherapy not applicable; doesn't preclude appropriate treatment for the diagnosis
69
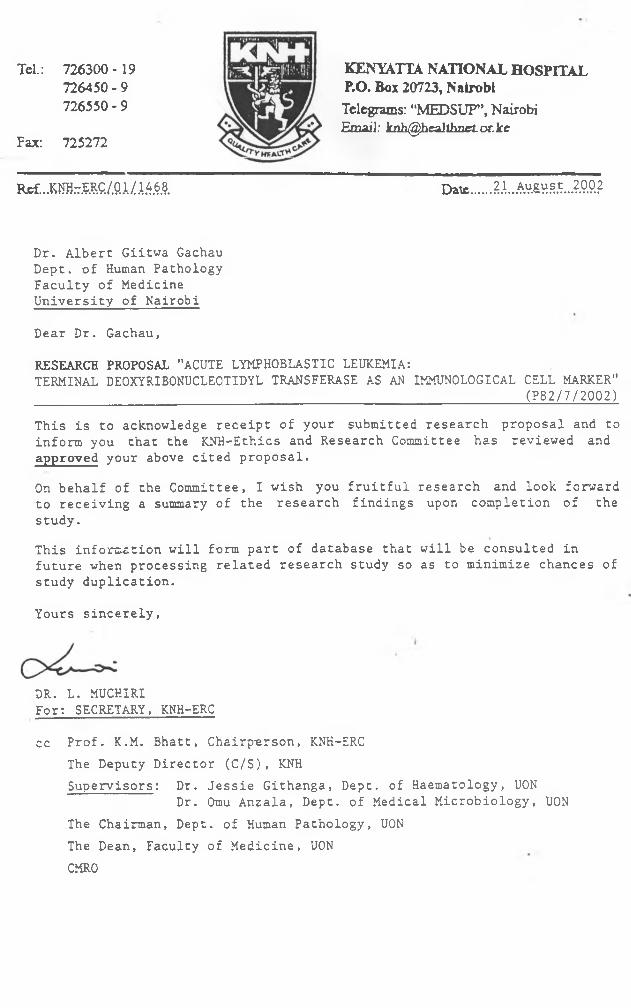
Tel.: 726300- 19726450 - 9 726550 - 9
Fax: 725272
KENYATTA NATIONAL HOSPITAL P.O. Box 20723, N airobiTelegrams: “MEDSUP”, Nairobi Email; [email protected]
Ref. ..KMt.ERC / 01 /1468 Date 21. Augus t 200 2
Dr. Albert Giitwa Gachau Dept, of Human Pathology Faculty of Medicine University of Nairobi
Dear Dr. Gachau,
RESEARCH PROPOSAL "ACUTE LYMPHOBLASTIC LEUKEMIA:TERMINAL DE0XYRIB0NUCLE0TIDYL TRANSFERASE AS AN IMMUNOLOGICAL CELL MARKER" _______________ __ ______________________________________________ (P82/7/2002)
This is to acknowledge receipt of your submitted research proposal and to inform you that the KNH-Ethics and Research Committee has reviewed and ap p ro v ed your above cited proposal.
On behalf of the Committee, I wish you fruitful research and look forward to receiving a summary of the research findings upon completion of the study.
This information will form part of database that will be consulted in future when processing related research study so as to minimize chances of study duplication.
Yours sincerely,
DR. L. MUCHIRIFor: SECRETARY, KNH-ERC
cc Prof. K.M. Bhatt, Chairp-erson, KNH-ERC The Deputy Director (C/S) , KNHSupervisors: Dr. Jessie Githanga, Dept, of Haematology, U0N
Dr. Omu Anzala, Dept, of Medical Microbiology, UONThe Chairman, Dept, of Human Pathology, UONThe Dean, Faculty of Medicine, UONCMRO


