Embed Size (px)
Citation preview
EFFECT OF WORKING CAPITAL FINANCING POLICY ON
FINANCIAL PERFORMANCE OF FIRMS LISTED AT THE
NAIROBI SECURITIES EXCHANGE
CHRISTINE SYOKAU MAKAU
2019
ii
DECLARATION
I, the undersigned hereby affirm that this work is my original research project report and it
has never been presented in part or in totality to any other institution of learning for the
award of any degree or examination.
Signature:……………………….. Date:………………………….
Christine Makau
D61/5307/2017
This research has been submitted1with1my1approval1as1the1University1Supervisor
Signature:……………………….. Date:………………………….
Dr. Kennedy Okiro
Department1of1Finance1and1Accounting
School1of1Business1-1University1of1Nairobi
iii
ACKNOWLEDGEMENTS
I want to thank the lord for the endowment of life and the opportunity to come this far.
I wish to acknowledge the support of individuals who made it possible for a successful
completion of this work. I sincerely thank my supervisor, Dr. Kennedy Okiro for his
support, encouragement and guidance all through the entire research process. Thank you
for your patience and availability and for believing in me. I also acknowledge the
University of Nairobi MBA coordination office for their administrative support and more
so lecturers for equipping me with knowledge to undertake this research.
iv
1DEDICATION1
This project is dedicated to my parents Philip Makau and Esther Mwende the great
promoters of education, who are my number one cheer leaders and have motivated me to
reach this far. I also dedicate it to my daughter Shantelle Mwende who was at one time my
companion in the journey and motivated me to push further till the end and to my husband
Benard Kyalo for his support, patience and understanding
v
1TABLE OF CONTENTS1
1DECLARATION...................................................................................................................... ii
1ACKNOWLEDGEMENTS.. ................................................................................................. iii
1DEDICATION......................................................................................................................... iv
1LIST OF!TABLES!.. ............................................................................................................ viii
1LIST OF!FIGURES! .............................................................................................................. ix
1ABBREVIATIONS.. ................................................................................................................ x
1ABSTRACT.. ........................................................................................................................... xi
1CHAPTER ONE: 1INTRODUCTION1.. .............................................................................. 1
11.11Background of the Study! ................................................................................................ 11
11.1.11Working Capital Financing Policy1 ......................................................................... 2
21.1.21Financial Performance .............................................................................................. 3
31.1.31Working Capital !Financing Policy and Financial Performance .............................. 5
41.1.41Firms listed at the 1Nairobi Securities Exchange .................................................... 6
51.21Research Problem1.. ........................................................................................................... 7
61.31Research Objective ............................................................................................................. 9
81.41Value of the Study1 ............................................................................................................ 9
9CHAPTER TWO:1!LITERATURE REVIEW .................................................................. 11
92.1 Introduction1.. ................................................................................................................... 11
92.2 Theoretical Review1.. ....................................................................................................... 11
92.2.1 Working Capital Cycle Theory ................................................................................. 11
92.2.2 Transactions Cost Theory ......................................................................................... 12
92.2.3 The Tradeoff Theory ................................................................................................. 14
92.3 Determinants of Financial Performance ............................................................................ 15
22.3.1 Financial Leverage .................................................................................................... 15
92.3.2 Company Size ........................................................................................................... 16
92.3.3 Liquidity .................................................................................................................... 17
92.4 Empirical Review1.. .......................................................................................................... 17
92.5 Conceptual Framework1.. ................................................................................................. 20
92.6 Summary of Literature Review1.. ..................................................................................... 21
vi
1CHAPTER THREE:!1RESEARCH METHODOLOGY .................................................. 22
13.11Introduction1.. .................................................................................................................. 22
13.21Research Design1.. ........................................................................................................... 22
13.31Population......................................................................................................................... 22
13.41Data Collection1 ............................................................................................................... 23
13.51Diagnostic Test1 ............................................................................................................... 23
13.61Data Analysis1 ................................................................................................................. 23
23.6.11Analytical Method1 ................................................................................................ 24
23.6.21Test of Significance1 .............................................................................................. 24
CHAPTER FOUR:1 DATA ANALYSIS, RESULTS AND INTERPRETATION1 ......... 25
4.1 Introduction1 ....................................................................................................................... 25
34.2 Descriptive Statistics1 ....................................................................................................... 25
44.3 Diagnostic Tests1.. ............................................................................................................ 26
!54.3.1 Multicollinearity Test1 .............................................................................................. 26
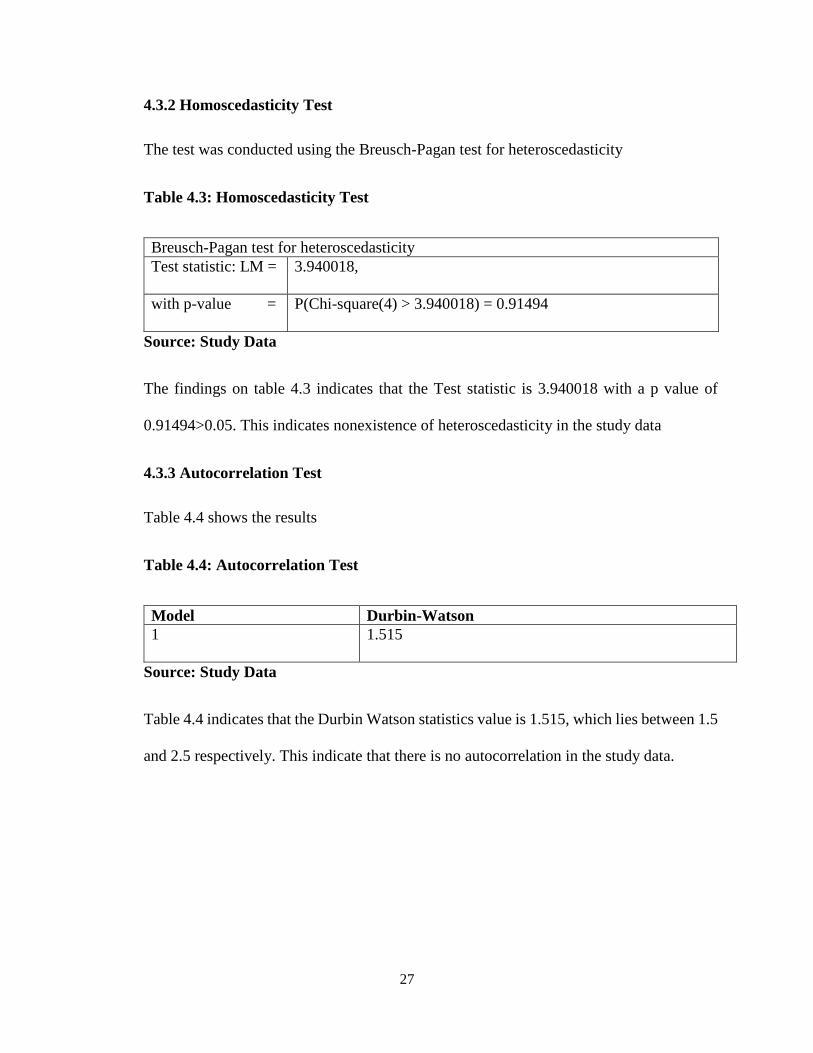
!54.3.2 Homoscedasticity Test1 ............................................................................................ 27
154.3.3 Autocorrelation Test1 ............................................................................................... 27
!54.4.4 Linearity Test1 .......................................................................................................... 28
!54.4.5 Normality Test1 ........................................................................................................ 29
64.4!Correlation Analysis1 ....................................................................................................... 29
64.51Regression Analysis1! ...................................................................................................... 30
64.5.1 Model Summary1...................................................................................................... 30
64.5.2 Analysis of Variance ................................................................................................. 31
64.5.3 Regression Coefficients ............................................................................................ 31
14.6 1Interpretation of the Findings .......................................................................................... 32
1CHAPTER FIVE: !SUMMARY, 1CONCLUSION AND 1RECOMMENDATIONS! .. 34
45.1 1Introduction ..................................................................................................................... 34
55.2 1Summary ......................................................................................................................... 34
65.3 1Conclusionv ..................................................................................................................... 35
75.4 !Recommendations1 .......................................................................................................... 36
85.5 !Limitations of the Study1................................................................................................. 37
95.6 !Suggestion for Further Research1.. .................................................................................. 37

vii
1REFERENCES! .. .................................................................................................................. 39
1APPENDICES! .. .................................................................................................................... 46
4Appendix! I: Listed Non-Financial Firms.. ............................................................................. 46
1Appendix II: Data Collection Sheet.. ...................................................................................... 47
viii
LIST OF TABLES
8Table 4.1: Descriptive Statistics1.. ............................................................................................. 25
8Table 4.2: Multicollinearity Test ................................................................................................ 26
9Table 4.3: Homoscedasticity Test ............................................................................................... 27
9Table 4.4: Autocorrelation Test .................................................................................................. 27
7Table 4.5: Normality Test ........................................................................................................... 29
5Table 4.6: Correlation Matrix1 ................................................................................................... 29
8Table 4.7: Model Summary ........................................................................................................ 30
7Table 4.8: Analysis of 1Variance................................................................................................ 31
8Table 4.9: Regression 1Coefficients ........................................................................................... 31

ix
1LIST OF FIGURES1
1Figure 2.1: Conceptual Framework ............................................................................................ 21
1Figure 4.1: P-P Plot ..................................................................................................................... 28
x
ABBREVIATIONS
APP - Average Payables Period
CCC - Cash Conversion Cycle
CEOs - Chief Executive Officers
DW - Durbin Watson
FGLS - Feasible Generalised Least Square
GMM - Generalized Method of Moments
ITO - 1Inventory Turnover Period
NSE - 1Nairobi Securities Exchange
ROA - 1Return on Assets
ROE - 1Return on Equity
SPSS - 1Statistical Package of Social Sciences
VIF - 1Variance Inflation Factors
WCM - 1Working Capital Management
xi
ABSTRACT
Working capital management is a significant constituent in business finance as it directly
affects the company's profitability and liquidity. However, majority of financial managers
attach great premium to other financial commitments, notably capital budgeting and
financing decisions. In addition, most CEOs pay less attention to WC financing in carrying
out the company's day-to-day business and delegate most decisions on working capital to
low-ranking staff whose decisions are rarely implemented by the senior management.
Thus, this study explored the 1effect of working capital 1financing policy on financial
performance of firms listed at the Nairobi Securities Exchange. The research was grounded
on working capital cycle theory, the transaction costs theory and the trade of theory of
working capital. The study employed a descriptive study design and the population was
made up of 45 non-financial corporations quoted at NSE as at 31st December 2018. The
research entirely used secondary data, which was retrieved by use of data collection sheet
for a time-period of five years from 2014 to 2018. The collected data was sorted and keyed
into the SPSS then analyzed using descriptive statistical tools like the mean, standard
deviation, maximum and minimum values and the regression technique to establish the link
between the dependent and explanatory variables. The results revealed a negative and
significant relationship between aggressive financing policy (AFP) and ROA while the
relationship between leverage and ROA was also negative and statically significant
respectively. The results further established that the relationship between company size and
ROA was positive but statistically insignificant but the association between liquidity (CR)
and ROA was 1negative and 1significant respectively. The study concluded that the
aggressive financing policy (AFP), leverage and liquidity significantly affects the
financial1performance1of firms listed a1NSE.1The study thus recommended that the
management of listed firm should minimize the use of short term financing sources since
they reduce the firms’ profitability levels and 1that the 1management of firms listed at NSE
should hold optimal liquidity since too much liquidity adversely affects the firms’ profit
levels.
1
CHAPTER ONE: INTRODUCTION
1.1 Background of the Study
Working capital management is considered as a key element in determining organizations
financial performance (Niresh, 2012, Taani, 2012). Working capital financing is a
significant facet in retaining the corporation's liquidness, survival, profitability and
solvency (Raheman et al., 2010; Yahaya & Bala, 2015). Performance of working capital
thus provides a vital view of the firm's financial position. As a significant indicator of
financial soundness, the availability of working capital is one of the first points that the
creditor or investor will consider in the financial position statement (Konak & Güner,
2016). Companies reduce risk and enhance profitability through the assessment of the
working capital determinants (Nazir & Afza, 2009, Thakur & Muktadir, 2017). Therefore,
investing in working capital is fundamental to make the right financing decisions, as short
and long-term financing modes have benefits and drawbacks that significantly affect the
firm’s profitability (Mahmood et al., 2019).
This study is pegged on the working capital policy theory, the transaction cost theory and
the tradeoff theory of working capital. The working capital policy theory states that
managing of working capital influences business performance and that the company needs
to change working capital over time, depending on the level of money generation and
holding high level of stock and receivables result to a decrease in firms’ profit levels
(Aminu & Zainudin, 2015). Transaction cost theory supports the fact that most companies
in each area of working capital have a lower return on capital than other likely uses and
that these companies have very little to invest in working capital (Bei & Wijewardana,
2012). The tradeoff theory of working capital supports that firms management have to
2
assess the trade-off between anticipated profitability and risk, where each tradeoff
represents the opportunity cost of the other before establishing the optimal working capital
investment (Niresh, 2012).
In Kenya, the Nairobi securities exchange is imperative that it offers an appropriate market
for investors who intend to purchase and the investors who intent to sell of their securities
hence creating liquid financial instruments (Kamuti & Omwenga, 2017). The exchange
distributes valuable statistical data in aggregated form to different institutions for beneficial
usage (Nyabuti & Alala, 2014). NSE is a choice market for local and international investors
seeking to enter East African markets (Omondi & Muturi, 2013). Although most NSE
companies have improved their performance, a number of companies in the last decade
have recorded a decline in profitability and while others being delisted from the exchange.
Significant determinations to turn around or even liquidate such companies have focused
mainly on financial restructuring (Lalah, 2018).
1.1.1 Working Capital Financing Policy
Working capital financing policy entails the determination of optimal funding strategy of
investments in short term assets like cash, inventories, receivables, marketable assets and
the firm current liabilities (Muhammad, Jan & Ullah, 2012). Effective working capital
financing comprises of managing and forecasting short-range obligations and assets in a
manner that reduces the possibility of being unable to settle outstanding obligations and
avoids too much holding of short term assets (Taani, 2012). In specific, the two key
approaches for financing working1capital are1the1aggressive1and1the1conservative
working capital financing policies (Thakur & Muktadir, 2017).
3
An aggressive working capital financing plan utilizes greater quantity of current liabilities
and a smaller amount of non-current liabilities (Nazir & Afza, 2009). An aggressive
funding strategy uses higher short term finances and less long-term finances. Although an
aggressive strategy reduces the cost of capital, it enhances the likelihood of short-range
liquidity difficulties (Temtime, 2016). An aggressive plan is mainly aimed at reducing high
levels of liquidity to meet current needs (Panigrahi, 2014). Aggressive financing strategy
arises when there is large percentage of short-term funds in WCF. The proportion of short-
term liabilities in relation to aggregate assets is usually used to proxy the extent of
aggressiveness, where a lower ratio represents a moderately aggressive policy (Thakur &
Muktadir, 2017).
A conservative working capital financing strategy uses leverage and capital that is more
non-current and a smaller amount of current funds (Nazir & Afza, 2009). The conservative
strategy of financing working capital is a low-risk policy that ensures investments in assets
is covered by long-term financing. Most managers are satisfied with this strategy, due to
the lower possibility of inability to meet liabilities when they due (Bei & Wijewardana,
2012). According to the conservative approach, long-term funding should cover the
estimated total funding needs and the use of short-range finances ought to be limited to
emergencies or unexpected outflows (Panigrahi, 2014). In a more conservative strategy, a
larger share of capital is invested in cash, but a degree of profitability is sacrificed (Thakur
& Muktadir, 2017).
1.1.2 Financial Performance
Financial performance is generally an indicator of a company's comprehensive financial
strength over time and is used to compare related companies in a similar industrial sector
4
or to equate segments or industries as a whole (Nazir & Afza, 2009). Financial performance
largely reveals the outcomes and results of the commercial sector, which as a whole,
illustrates the financial health of the sector and illustrates how effective a firm employs its
assets to capitalize on stockholders wealth (Naz, Ijaz & Naqvi, 2016). Corporation’s
financial performance is a key measure, which defines competitiveness, the capabilities of
an entity and economic interests of firm’s management and the reliability of existing or
future suppliers (Sichigea, Ganea & Tupangiu, 2011).
Financial performance provide shareholders and stakeholders with comprehensive
information that helps in decision-making (Aliona, 2016). The reason behind financial
performance measurement is to get useful information in terms of cash flow, resource
utilization, efficiency and effectiveness (Batchimeg, 2017). A company's higher financial
performance shows how it utilizes its assets efficiently and efficiently and contributes to
macro economies (Matar & Eneizan, 2018). Investors always take into account the
financial performance of companies to identify the required investment opportunities.
Good company performance is a factor that stimulates shareholders to invest their money
in a particular firm, which would ultimately increases shareholder wealth and value of the
firm (Ahmadabadi, Mehrabi & Yazdi, 2013).
Financial performance is analysed using nonfinancial and financial indicators. Non-
financial indicators encompass information provided by marketing, production and human
resource departments and usually assesses the company's activities without taking into
consideration account accounting principles (Aliona, 2016). Financial indicators include
the accounting ratios among them the return on shareholders’ equity, return on assets and
the Tobin q. ROA is the ratio of annual after tax earnings to aggregate assets while ROE is
5
an internal profitability proxy for stockholder’s value (Sichigea, Ganea & Tupangiu, 2011).
Tobin’s q equates the firm’s worth as provided by the securities exchange with the par
value of the firm’s assets (Nazir & Afza, 2009).
1.1.3 Working Capital Financing Policy and Financial Performance
Working 1capital financing policy entails the instituting of an optimal way to finance an
entities inventory and receivables requirement, cash and payable in manner than minimizes
costs (Temtime, 2016). The tradeoff theory states that efficient working capital has to strike
an equilibrium between taking too high or little liquidity to achieve an optimal profitability
level thus an entity’s firm liquidity should be neither excessive nor inadequate (Niresh,
2012). According to the working capital cycle theory, companies are expected to invest
working capital in appropriate manner, finance WC and monitor the elements influencing
working capital effectively to enhance profitability (Temtime, 2016).
Yogendrarajah and Sangeetha (2014) studied how managing working capital affects
profitability and revealed that huge investment receivables and inventories was associated
with minimal financial performance. Miloş and Miloş (2014) study on working capital and
corporate productivity in Romania concluded that working capital financing had weak and
an inverse association with performance. Konak and Güner (2016) examined funding of
working capital and SMEs profitability and revealed an indirect association between ROA
and short-term WC financing.
Further, Onsongo and Onyiego (2018) examined WCM practices and profitability of
cooking oil-producing firms in Kenya revealed that debtor’s days, payables period, stock
turnover significantly affects firm performance. Bagh, et al (2016) study on WCM on
6
manufacturing firms’ performance in Pakistan established that CCC, ITO and APP had an
inverse but significant impact on ROA. In the Puntland State of Somalia, Hassan, Maturi
and Mberia (2017) investigated WC requirements and profitability and revealed that
creditor’s period (APP) had an insignificant impact on firm performance.
1.1.4 Firms listed at the Nairobi Securities Exchange
Nairobi 1Securities 1Exchange (NSE) is a main securities 1exchange in 1Kenya and
provides a computerized platform for trading and quoting of stocks. NSE is among the
robust securities markets in Africa, which has attracted investors from all over the world
(Omondi & Muturi, 2013). The NSE is publicly-traded and is the second listed securities
exchange in Africa (Orayo & Ombaba, 2017). NSE is an associate of African Stock
Exchanges Association and also the East African Stock Markets Association and a full
affiliate of the futures markets association, World Federation of Securities Markets and the
exchange of partners of the UN Sustainable Stock Exchange initiative (Kamuti &
Omwenga, 2017).
The NSE is a standout amongst the most significant securities trades in Africa to a great
extent because of its comparative size in the landmass and its remarkable introduction
toward the East-African locale (Shimenga & Miroga, 2019). The NSE has 64 quoted
companies classified into 11 areas which include agriculture, automobile, banking, energy
and petroleum, commercials and service, construction and associated, insurance,
manufacturing, telecommunications and technology and the growing enterprise market
sector (Onsongo & Onyiego, 2018). NSE has 1undergone a number of 1changes in the past
to improve its efficiency and adjust to the economic environment variations, investor
interest and technological changes (Nyabuti & Alala, 2014).
7
The NSE supports, develops, promotes and operates the securities exchange and carries
out all the functions of the Kenya securities market (Omondi & Muturi, 2013). However,
performance of companies quoted at NSE have been dwindling over the years. Poor
profitability of the quoted firms at the NSE has affected shareholders negatively through
the loss in market value of shares and non-declaration of dividends (Lalah, 2018). In
addition, short-term assets represent more than 50% of the aggregate assets of most firms
listed at the NSEs. Lalah (2018) posits that most manufacturing firmed listed at NSE use
the less aggressive investment policy, which adversely affected the firms’ profitability.
1.2 Research Problem
Working capital management is a significant constituent in business finance as it directly
affects the company's profitability and liquidity (Yogendrarajah & Sangeetha, 2014). The
tradeoff theory supports that the tradeoff between liquidity and profitability is important
since companies are likely to fail and go bankrupt if financing of working capital is not
properly considered (Raheman et al., 2010). Majority of financial managers however attach
great premium to other financial commitments, notably capital budgeting and financing
decisions (Thakur & Muktadir, 2017). Yahaya and Bala (2015) posits that most CEOs pay
less attention to WC financing in carrying out the company's day-to-day business and
delegate most decisions on working capital to low-ranking staff whose decisions are rarely
implemented by the senior management.
The NSE in Kenya has always provided a well-regulated, robust and world-class platform
for equity securities and bond trading (Nyamweno & Olweny, 2014). However, several
listed firms have failed to meet their financial targets and have ended up giving profit
warnings. Examples include, the Standard Group, Bamburi cement, Sanlam, Housing
8
finance, Express Kenya, Sameer Africa and Kenya power in 2019 (NSE, 2019). A number
of listed companies are experiencing declining performance and currently Kenya Airways,
Express Kenya and Longhorn publishers are topping the list of other firms that have turned
to selling assets to shore up their medium term performance (Orayo & Ombaba, 2017). In
addition, several companies, including Uchumi supermarkets and Mumius Sugar listed at
the NSE have had liquidity problems in the last few years and have failed to settle their
short-term financial liabilities upon maturity (Mwangi, Makau & Kosimbei, 2014).
Numerous studies have assessed the association between companies’ performance and
WCM. In Bangladesh, Thakur and Muktadir (2017) examined working capital financing
and manufacturing firms’ profitability found an adverse influence of WC financing on
performance though the study dwelled on manufacturing entities. Nazir and Afza (2009)
assessed WCM policies and corporations’ profitability and concluded that executives
enhance value through the adoption of a conservative working capital financing strategy
but the study focused on conservative financing policy. Further, Raheman et al. (2010)
explored WCM and Pakistan firms’ profitability and revealed that CCC, operating cycle
and inventory period significantly affected profitability but the study focused on WCM
practices.
Several studies have also been carried out in Kenya among them Wanguu and Kipkirui
(2015) on WCM on profitability of cement manufacturing companies which revealed that
inventory days, receivables and payables period significantly influence performance
though the study focused on cement manufacturing firms. Nyabuti and Alala (2014)
assessed WCM policy and performance listed firm and found a significant association
between WCM policy and performance though the study focused on traditional WCM
9
practices. In addition, Kiptoo, Kariuki and Kimani (2017) assessed WCM practices and
performance of Kenyan tea firms revealing that inventory and payables management
significantly affected performance but the context was tea processing firms and the study
dwelled on WCM practices and not working capital financing.
Empirically, WCM and companies performance literature has received significant devotion
in finance and accounting literature globally and in Kenya. However, much attention is
given to the traditional WCM practices comprising inventory, debtors and payables
management. In addition, the studies have been carried out in different sectors with most
of them focusing on the manufacturing sector. Most of the WCM studies in Kenya also
focus on the various sectors at the NSE and concentrate more on the WCM practices as
opposed to working capital financing. This investigation thus endeavors to provide
answers to the question, what is the impact of working capital financing policy on financial
performance of companies quoted at the NSE?
1.3 Research Objective
To explore the “effect of working capital financing 1policy on 1financial 1performance of
firms 1listed at the 1Nairobi 1Securities 1Exchange.”
1.4 Value of the Study
The results will provide practical insights that will help the management of quoted
companies to adopt effective working capital financing and management policies to
enhance greater productivity and business performance. The management of the quoted
firms can use the study recommendations and conclusions to formulate appropriate policies
on enhancing their firms’ profitability.
10
The research findings shall be significant to different policy making and regulatory entities
may use the study conclusions and recommendations to develop strategic policies to
enhance working capital financing and listed firms’ performance. The findings of this
research would be of help to prospective researchers and will complement the current
empirical literature on fiscal performance, and theoretical literature on WC cycle theory,
the transaction costs hypothesis and the tradeoff theory of working capital.
11
CHAPTER TWO: LITERATURE REVIEW
2.1 Introduction
The part reviews a number of theories guiding the study under the theoretical review, the
various factors that affect listed firms financial performance and the review of related
studies under empirical review. The chapter also presents the study’s conceptual diagram
and finally a 1summary of 1the reviewed studies.
2.2 Theoretical Review
The research was grounded on working capital cycle theory, the transaction costs theory
and the trade of theory of working capital.
2.2.1 Working Capital Cycle Theory
The working capital cycle theory originated from Sagan (1955) and was further advanced
by Walker (1964) and emanated from the conventional model of the cash conversion cycle
(CCC). The working capital cycle principle expounds the manner in which working capital
ought to be managed and highlights the paybacks in relation to liquidness, productivity,
solvency, cost-effectiveness, and maximizing the value of shareholders resulting from the
appropriate management of WC (Temtime, 2016). The theory assumes that the primary
role of a WC executive is to make available funding when needed and to temporarily spend
extra resources in relation to the specific security and liquidity requirements by observing
returns and corresponding risks of the available investments (Atseye, Ugwu & Takon,
2015).
The working capital cycle theory emphasizes that at the very minimum, working capital
influences and supports other finance function like financing, dividend and capital
12
budgeting decisions since working capital cash flows are incorporated into the overall cash
flows of the business (Altaf & Ahmad, 2019). The theory indicates that managing WC
follows a cycle that depends on the type of entity being analysed (Bei & Wijewardana,
2012). With such a cycle, a company can always determine the WC needs. The theory thus
defines the WC cycle as the time that a company has to transfer cash to commodities or
finished products until it receives money from its debtors (Aminu & Zainudin, 2015).
The theory presupposes that working capital policy is dependent on the risks and rewards
associated with alternative strategies (Temtime, 2016). Higher investment returns and risk
as well as financing approaches are deemed aggressive whereas low risk and lower returns
approaches are considered relative or moderate. The lowermost risk and the lowest return
is deemed a conservative strategy (Bei & Wijewardana, 2012). The theory postulates that
working capital management seeks to ensure that efficiency requirements are met so that
investments in working capital components are not too low or too high (Aminu & Zainudin,
2015). The working capital cycle theory in this study highlights the need to manage WC
accounts and informs that this might significantly influence the company's financial
strength.
2.2.2 Transactions Cost Theory
The transaction cost theory was authored by Coase (1937) and explains that there exists
various overheads for undertaking transactions at the market. Therefore, the company
would prefer to organize intra-company transactions if charges were lower than the cost of
making the market transactions. Given that the additional cost of in-house transactions
exceeds the cost of executing market transactions, companies seek to reduce costs
associated with transaction through vertical integration (Mroczek, 2014). The proponents
13
of the theory claim that overall costs of a business are basically divided into twofold parts
entailing (1) production and (2) transaction costs (Li et al., 2014). The central claim of the
theory is that transactions are designed to minimize the costs associated with their
implementation (Williamson, 2009).
This theory expounds why companies exist, grow or outsource activities to an exterior
environ while trying to reduce resource-sharing costs with the environment and minimize
routine exchange costs within the enterprise. If internal routine costs are lower than
external transaction expenses, the company will develop (Bei & Wijewardana, 2012). The
dominant preposition of the model is that transactions are handled to minimize the costs
associated with their implementation. In this case, the goods are related to working capital
management (Williamson, 2009). In managing working capital, the four main elements of
cash, debtors, stocks and creditors, whose management requires consistent resource
planning (Foss, 2008).
The transaction cost theory in relation to working capital management states that debt
management can reduce transaction costs for paying bills (Foss, 2008). Instead of paying
for every product delivery, the company can collect and pay liabilities monthly or quarterly.
The client can therefore distinguish the compensation process from the planning agreement
(Williamson, 2009). According to the theory, an enterprise could need to build large stocks
of loans, but this could be combined with additional stocking and funding costs, to ensure
a continuous product cycle. Managers should therefore establish a cost-minimized and
competitive strategy.
14
2.2.3 The Tradeoff Theory
Hirigoyen (1985) and Eljelly (2004) advanced the tradeoff theory of working capital,
which suggests that business seek to maintain optimum liquidity levels to ensure
equilibrium between the costs and benefit of cash holdings. The theory argues that the
value of cash is neither destroyed nor created under ideal capital market assumptions
(Niresh, 2012). The theory states that day-to-day liquidity maintenance is fundamental in
managing working capital and guarantees a sound functioning of the organization and its
responsibilities. Therefore, it’s vital to monitor the company's liquidity status since without
it the firm cannot survive (Panigrah, Namita & Chaitrali, 2018).
The theory also states that the WC investment levels and investment funding at a given
production level is accompanied by a compromise between risk and returns. 1In 1general,
the 1greater the 1risk, the greater the return that management and shareholders require to
finance WC investments (Raheman et al., 2010). According to the theory, WC
requirements have an impact on the corporation's liquidness and profit levels, hence
influencing funding and capital budgeting decisions. Smaller WC needs translate into
lower funding requirements and lower capital costs, leading to more cash for shareholders
(Nishanthini & Meerajancy, 2015).
The tradeoff theory suggests that the major concern of corporates is the effective managing
of the everyday actions in a smooth manner while increasing the shareholder’s profitability
(Nishanthini & Meerajancy, 2015). From the viewpoint of this study, the model emphasizes
that the manager in charge of finance should manage their current assets and liabilities
prudently. Minimization of funds tied in the current assets implies that the freed up funds
can be invested hence improving the entities financial performance. In the same way, cash,
15
stocks (inventory) and receivables must be adequate to prevent business having challenges
with their daily operations.
2.3 Determinants of Financial Performance
This section will discuss financial leverage, company size and liquidity as the main
determinants of listed firms’ financial performance.
2.3.1 Financial Leverage
Leverage denotes to the share of borrowed fund to equity in the company's structure of
financing. Financing or leverage decisions are important management decisions because
they affect the return and risk of shareholders and the market value of an entity (Omondi
& Muturi, 2013). Financial leverage is a key parameter in terms of financial economics as
it relates to the company's proficiency to address different stakeholders needs (Li et al.,
2014). Both the long-term and the short-term lender are interested in the corporate debt
level as it reduces the company's risk of paying for debt services that is interest and
repayment of principal. A heavily indebted company offers creditors less protection in the
event of bankruptcy (Batchimeg, 2017).
Financial leverage is seen as a positive signal for corporate value, and management
companies have committed to creditors to generate interest and principal cash flows
(Atseye, Ugwu & Takon, 2015). Companies with higher debt are likely to report negative
results due to default risk. If a company fails to pay off its liabilities, it would be difficult
for the entity to borrow additional funds from financiers (Batchimeg, 2017). The debt ratio
shows what percentage of corporate fund which comes from financiers or creditors. A
16
greater level of debt share shows that more credit (borrowings) are being used compared
to equity financing (Atseye, Ugwu & Takon, 2015).
2.3.2 Company Size
The size of the business plays an imperative function in the nature of the corporate
affiliations it maintains within and outside its operating environment, and hence in
profitability (Li et al., 2014). The size of an entity is associated with the firm’s profitability
such that as the size of the business expands so does ROA and vice versa (Wanguu &
Kipkirui, 2015). Particularly, small companies are at a disadvantage because they try to
cover the high operating costs of industry and diversify their products to compete with
larger firms (King'ori, Kioko & Shikumo, 2017).
Large companies tend to increase their negotiating power by using size as an advantage,
and have different preferred supply strategies to attain economies of scale (Li et al., 2014).
Larger companies are more competitive than smaller companies in using economies of
scale and generating higher profits (Omondi & Muturi, 2013). Larger enterprises have
enhanced access to debt capital and thus have the flexibility to plan their investments,
leading to a positive relationship with company performance (Atseye, Ugwu & Takon,
2015). Different indicators including assets, value, market capitalization, asset value,
turnover and market capitalization are employed to measure size of the firm (King'ori,
Kioko & Shikumo, 2017). Company size is calculated as a log of the company's overall
assets.
17
2.3.3 Liquidity
Liquidity refers to available cash for the anticipated future taking into account the financial
commitments corresponding to that period (Omondi & Muturi, 2013). Liquidity denotes
the ability of firms to address their pending obligations in the short term with the cash and
cash equivalents at their disposal (Sichigea, Ganea & Tupangiu, 2011). Effective liquidity
management is also expected to include the forecasting and managing of WC, reducing the
possibility not paying current debt and preventing unnecessary investment in short-term
assets. A company's success is usually based on earnings and liquidity prospects (Li et al.,
2014).
Liquidity is a prerequisite for companies to settle their current commitments, and their
continued survival can be secured through a gainful business (Yogendra Rajah &
Sangeetha, 2014). Companies use liquid funds to fund their undertakings and investments
when borrowings are inaccessible. Increased liquidity can enable the company to cope with
unexpected unforeseen events and meet low-income commitments (Omondi & Muturi,
2013). Effective management of liquidity beyond survival aids firms to increase their
profitability by reducing their input needs. It also offers strategic advantages in
economically challenging times (Batchimeg, 2017). Current ratio is the ultimate indicator
of a company’s liquidness.
2.4 Empirical Review
Tingbani et al. (2018) explored how WCM affects profitability of quoted companies at
London Securities Market. The study collected unbalanced panel data from 802 firms
between 2004 and 2014 and a dynamic panel method for analysis. The outcomes showed
18
that a number of contingency factors including environmental management, assets, and
competences significantly affected the link between profit 1levels and 1WCM. The
investigation additionally found that WCM significantly affected company's profitability.
Mweta and Kipronoh (2018) in Kenya studied how WC requirements affects performance
of quoted construction and allied corporations. The authors adopted an explanatory study
design and collected archival data from 2012 to 2016 with the regression method being
used for analysis. The outcomes documented a non-significant relation amongst inventory
days, debtors days, period of payables, CCC and ROE and ROA. However, the results
showed a significant association between inventory days, payables period, debtors’ days,
CCC and gross profit margin.
Muia, Banafa and Mwanzia (2016) surveyed the influence of WCM on profitability of
enterprises quoted at the NSE. The research employed a descriptive survey and retrieved
data from the nine quoted industrial companies between 2011 and 2015 with multiple
regression method being used for analysis. The fallouts documented a significant and
indirect relation between receivables period, leverage and firm profit levels.
Mwangi, Makau and Kosimbei (2014) explored how WCM affects performance of NSE
quoted non-financial corporations. The researchers’ used an explanatory research design
and collected secondary data from 42 non-financial firms from 2006 to 2012 where the
FGLS technique (Feasible Generalized Least Square) being used for data analysis. The
authors documented that aggressive financing strategies significantly and positively
influenced the entities ROA and ROE, while a conservative funding policy had a direct
influence on ROE.
19
Olweny and Nyamweno (2014) explored how WCM influenced ROA of companies
quoted at the NSE. The authors selected 27 firms and collected secondary data from 2003
to 2012, which was analysed using the GMM estimation technique. The findings showed
that debtors’ days and the CCC had adversely affected the quoted corporations’
profitability, while the payables and inventory days positively and significantly influenced
the entities profitability.
Ahmadabadi, Mehrabi and Yazdi (2013) examined how WCM affects performance of
quoted corporations in Iran. The research collected secondary data between 2006 and 2010
and used the regression method for data analysis. The findings revealed an insignificant
link between managing of WC and firm performance though individual measures of WC
including ACP, APP and CCC significantly affect performance of listed firms.
Jagongo and Makori (2013) assessed WCM influence on Kenyan listed companies’
financial performance from 2003 - 2012 through a balanced panel data collected from
quoted construction and manufacturing companies. Using the regression method, the
research revealed an inverse relation between ROA and debtors’ period and the CCC, but
a direct relation between ROA and inventory and payables period. The study also found
that the leverage, liquidity and the entity size significantly affects the entities profitability.
Taani (2012) assessed WCM influence on financial leverage on performance of Jordanian
corporations. The research collected panel data from 45 industrial firms and used the
multiple regression method for data analysis. The findings revealed that a company’s
WCM strategy and size significantly affected the net profit margin. The study also revealed
that WC practices had an insignificant influence on firm performance.
20
Muhammad, Jan and Ullah (2012) explored the relation between ROA and WCM of quoted
textile corporations in Pakistan. The authors collected archival data from 2001 to 2006 and
panel data methodology for data analysis. The results showed a robust and direct
association between ROA and cash, receivables and stock period, but an inverse
association between payables period and profitability.
Niresh (2012) investigated how performance of Sri Lankan quoted manufacturing
corporations was affected by WCM policies and practices. The study selected thirty
companies, collected secondary data from 2008 to 2011, and used the regression method
to analyze data. The results showed an insignificant relation between CCC and financial
performance. The research also found that conservative financing policy was the most
preferred by Sri Lankan manufacturing firms.
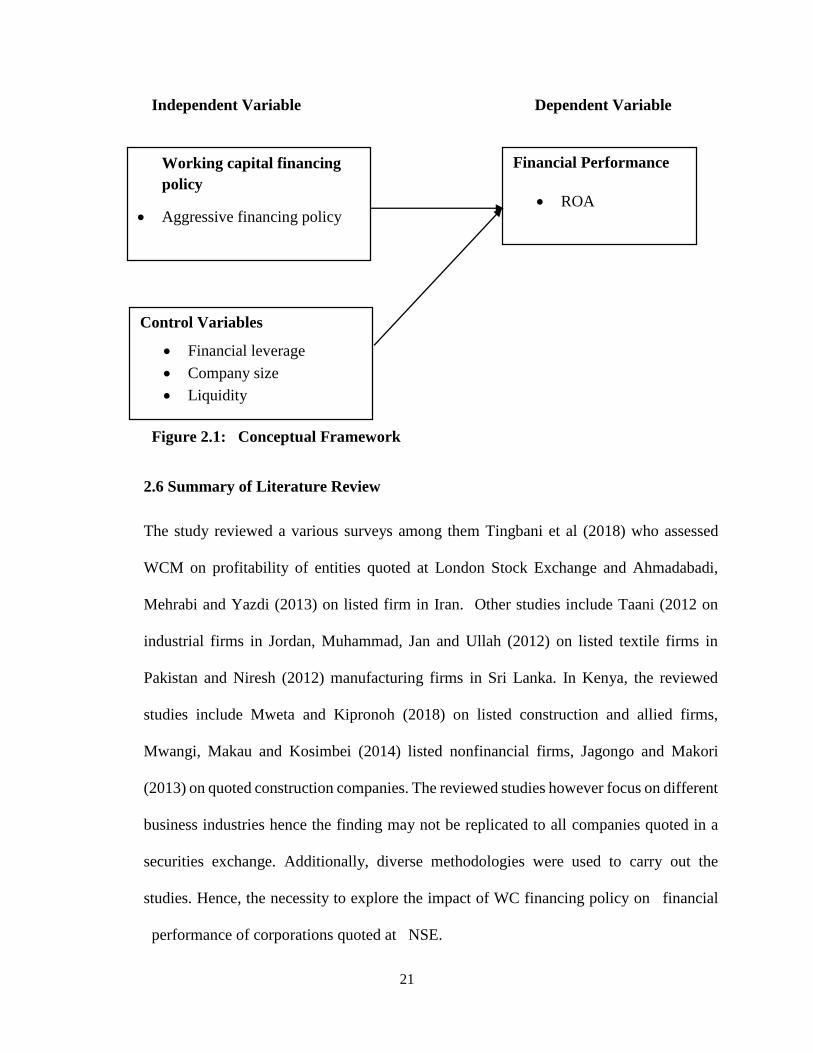
2.5 Conceptual Framework
The conceptual framework for the study includes working capital financing policy as the
explanatory variable and its indicators will include aggressive and conservative financing
policies. The dependent variable will be firms’ financial performance proxied by ROE and
control variables will include leverage, company size and liquidity as indicated by 1figure
2.1
21
1Independent Variable1 1Dependent Variable1
1Figure 2.1: 1Conceptual Framework
2.6 Summary of Literature Review
The study reviewed a various surveys among them Tingbani et al (2018) who assessed
WCM on profitability of entities quoted at London Stock Exchange and Ahmadabadi,
Mehrabi and Yazdi (2013) on listed firm in Iran. Other studies include Taani (2012 on
industrial firms in Jordan, Muhammad, Jan and Ullah (2012) on listed textile firms in
Pakistan and Niresh (2012) manufacturing firms in Sri Lanka. In Kenya, the reviewed
studies include Mweta and Kipronoh (2018) on listed construction and allied firms,
Mwangi, Makau and Kosimbei (2014) listed nonfinancial firms, Jagongo and Makori
(2013) on quoted construction companies. The reviewed studies however focus on different
business industries hence the finding may not be replicated to all companies quoted in a
securities exchange. Additionally, diverse methodologies were used to carry out the
studies. Hence, the necessity to explore the impact of WC financing policy on 1financial
1performance of corporations quoted at 1NSE.
Working capital financing
policy
Aggressive financing policy
Control Variables
Financial leverage
Company size
Liquidity
Financial Performance
ROA
22
CHAPTER THREE: RESEARCH METHODOLOGY
3.1 Introduction1
The methodology part discussed the study design, targeted population and the tools and
process of collecting data. The section further discussed the test of assumption under
diagnostic tests, techniques and tools of data analysis and the adopted analytical model.
3.2 Research Design
A study design is denotes the strategy according to which research participants are chosen,
data is collected and analyzed (Coopers & Schindler, 2009). A study design refer to the
arrangement by which the researcher answers the research problem and entails the tools of
collecting data and the techniques of data analysis a researcher intends to use (Kothari,
2009). This study employed a descriptive study design. The descriptive design tries to
define or outline a topic and often creates a group of issues, people or events, collects data,
and catalogs frequencies in search variables or their interactions (Kombo & Tromp, 2006).
A descriptive research design is useful in a study in which a researcher is interested in a
state that already exists in the industry and no variables manipulation.
3.3 Population
Population as defined by Kombo and Tromp (2006) is an entire collection of persons,
events or items that possess common features. Population represents the entire set of units
of analysis or the total assortment of components on which conclusion is to be made. The
population of this study was made up of 45 non-financial corporations quoted at NSE as at
31st December 2018. The study excluded financial firms since the nature of their business
23
is different and WCM plays a minimal role in their operations. Hence, the study therefore
undertook a census of the 45 non-financial listed firms.
3.4 Data Collection
Data collection entails the strategies adopted in a study to ensure that reliable, valid and
reliable data is obtained to inform research results (Coopers & Schindler, 2009). This
research entirely used secondary data, which was retrieved by use of data collection sheet
for a time-period of five years from 2014 to 2018. The secondary data was retrieved from
the firms’ financial reports and annual reports, which was obtained from the CMA and the
individual firms’ websites.
3.5 Diagnostic Test
This research conducted a number of diagnostic test among them multicollinearity test,
homoscedasticity test, autocorrelation test, normality and linearity test. Multicollinearity
will be assessed using the Variance Inflation Factors (VIF) and the correlation matrix and
to assess for homoscedasticity the Breusch-Pagan/Cook-Weisberg test was used. The
Durbin Watson (DW) was employed to assess for serial correlation where a DW statistic,
which lies between 1.5 and 2.5, was an indication of absence of autocorrelation while
Normality in this study was assessed using the Shapiro Wilk test whereas the linearity test
was assessed through the plotting of normal p-p plot.
3.6 Data Analysis
The data gathered was sorted and keyed into the SPSS then analyzed using descriptive
statistical tools like the mean, standard deviation, maximum and minimum values and the
24
regression technique to1establish the1link 1between the1dependent and explanatory
variables.
3.6.1 Analytical Method
The study adopted the multiple linear regression method as the main analytical tool. The
regression equation was formulated as follows
Where,
𝑌 - Financial performance measured using return on equity
𝑋1 - Aggressive financing policy measured using short-term finances to aggregate
assets
𝑋2 - Financial leverage proxied using ratio of 1debt1to1assets
𝑋3 – Company size proxied using the1natural log1of 1total assets
𝑋4 – Liquidity proxied using the current ratio
𝛽1 - 𝛽4 – Beta coefficients of the regression 1equation
𝛽0 & 𝜀 = Constant and the error term
3.6.2 Test of Significance
Assessment of the analytical model significance was done through the F test statistics
where a significant F value showed that the overall model was significant. The t test
statistics on the other hand was used to assess explanatory and control variables
significance where a significance t value indicated the individual variable was significant.
25
CHAPTER FOUR: DATA ANALYSIS, RESULTS AND
INTERPRETATIONS
4.1 Introduction
This 1chapter presents the results of the analyzed study data which entails the 1descriptive
and inferential statistics. 1The chapter also present an interpretation of results.
4.2 Descriptive Statistics
The population of this study was made up of 45 non-financial corporations quoted at NSE
as at 31st December 2018. The study however managed to collect data from 40 firms thus
a response rate of 88.9%. The collected data was summarized under table 4.1
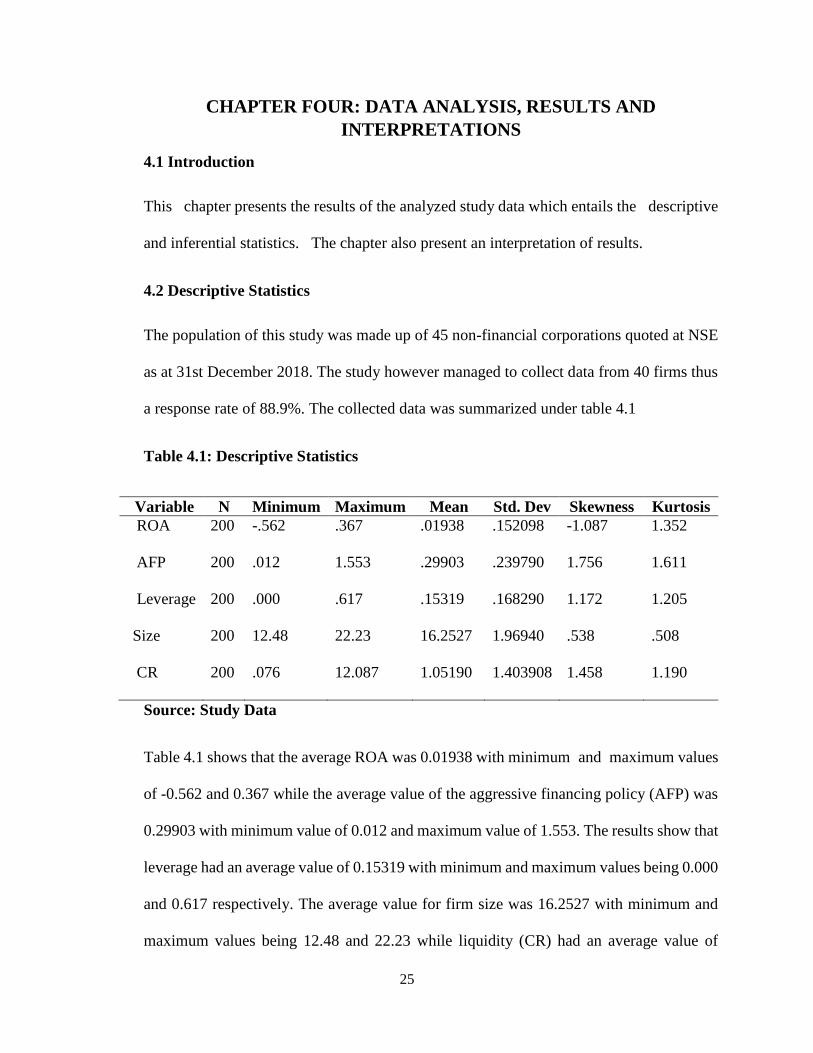
Table 4.1: Descriptive Statistics
Variable N Minimum Maximum Mean Std. Dev Skewness Kurtosis
ROA 200 -.562 .367 .01938 .152098 -1.087 1.352
AFP 200 .012 1.553 .29903 .239790 1.756 1.611
Leverage 200 .000 .617 .15319 .168290 1.172 1.205
Size 200 12.48 22.23 16.2527 1.96940 .538 .508
CR 200 .076 12.087 1.05190 1.403908 1.458 1.190
Source: Study Data
Table 4.1 shows that the average ROA was 0.01938 with minimum1and1maximum values
of -0.562 and 0.367 while the average value of the aggressive financing policy (AFP) was
0.29903 with minimum value of 0.012 and maximum value of 1.553. The results show that
leverage had an average value of 0.15319 with minimum and maximum values being 0.000
and 0.617 respectively. The average value for firm size was 16.2527 with minimum and
maximum values being 12.48 and 22.23 while liquidity (CR) had an average value of
26
1.05190 with minimum and maximum values being 0.076 and 12.087 1respectively. The
kurtosis1and1skewness value range within -2 and +2 which indicates that the data is
normally distributed.
4.3 Diagnostic Tests
The study conducted the multicollinearity test, homoscedasticity test, autocorrelation test,
normality and linearity test.
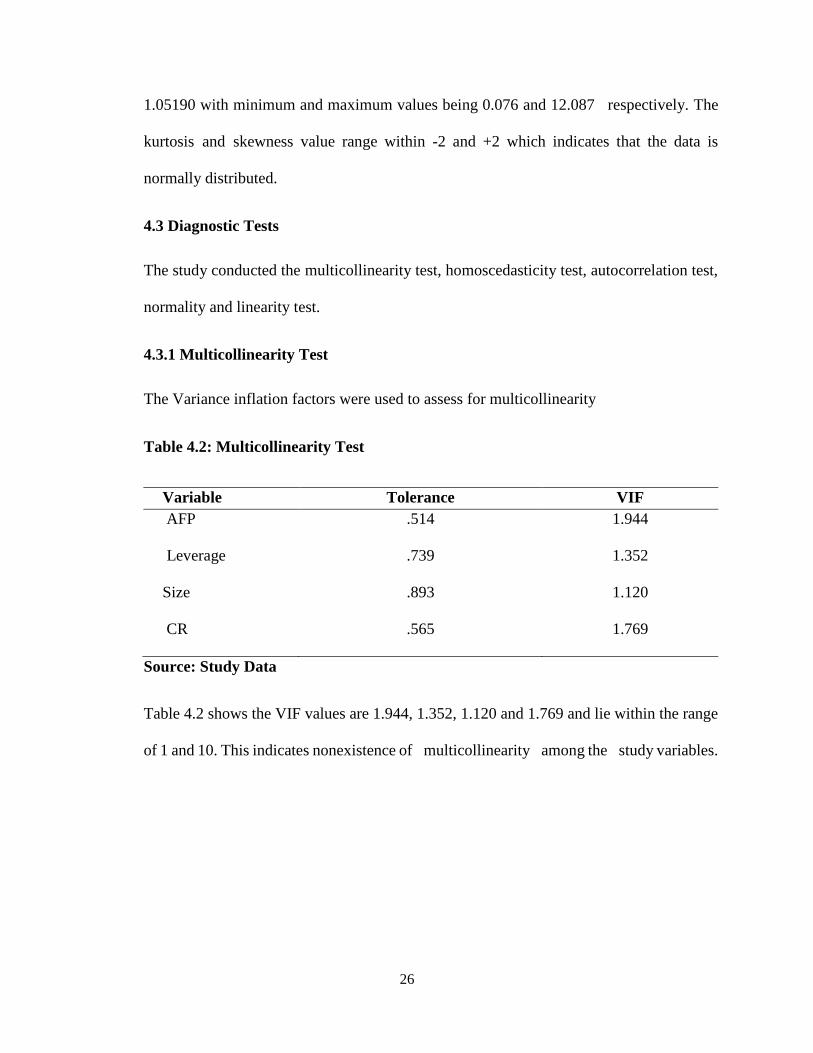
4.3.1 Multicollinearity Test
The Variance inflation factors were used to assess for multicollinearity
Table 4.2: Multicollinearity Test
Variable Tolerance VIF
AFP .514 1.944
Leverage .739 1.352
Size .893 1.120
CR .565 1.769
Source: Study Data
Table 4.2 shows the VIF values are 1.944, 1.352, 1.120 and 1.769 and lie within the range
of 1 and 10. This indicates nonexistence of 1multicollinearity 1among the 1study variables.
27
4.3.2 Homoscedasticity Test
The test was conducted using the Breusch-Pagan test for heteroscedasticity
Table 4.3: Homoscedasticity Test
Breusch-Pagan test for heteroscedasticity
Test statistic: LM = 3.940018,
with p-value = P(Chi-square(4) > 3.940018) = 0.91494
Source: Study Data
The findings on table 4.3 indicates that the Test statistic is 3.940018 with a p value of
0.91494>0.05. This indicates nonexistence of heteroscedasticity in the study data
4.3.3 Autocorrelation Test
Table 4.4 shows the results
Table 4.4: Autocorrelation Test
Model Durbin-Watson
1 1.515
Source: Study Data
Table 4.4 indicates that the Durbin Watson statistics value is 1.515, which lies between 1.5
and 2.5 respectively. This indicate that there is no autocorrelation in the study data.
28
4.4.4 Linearity Test
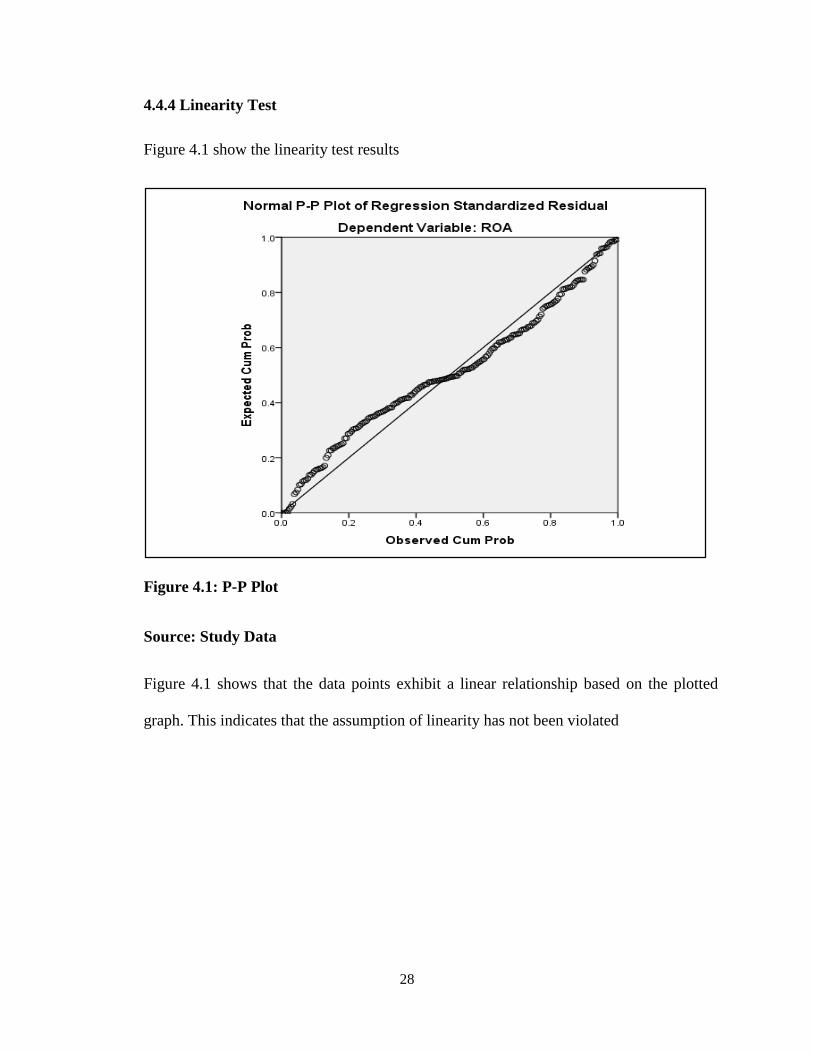
Figure 4.1 show the linearity test results
Figure 4.1: P-P Plot
Source: Study Data
Figure 4.1 shows that the data points exhibit a linear relationship based on the plotted
graph. This indicates that the assumption of linearity has not been violated
29
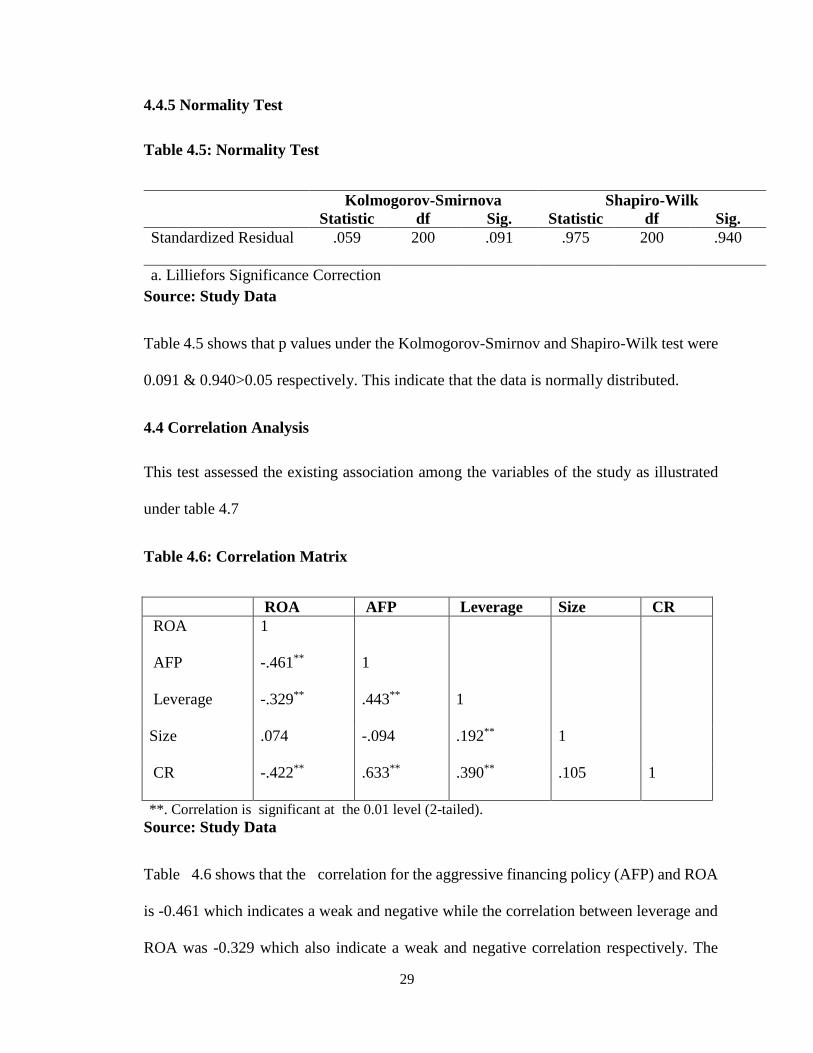
4.4.5 Normality Test
Table 4.5: Normality Test
Kolmogorov-Smirnova Shapiro-Wilk
Statistic df Sig. Statistic df Sig.
Standardized Residual .059 200 .091 .975 200 .940
a. Lilliefors Significance Correction
Source: Study Data
Table 4.5 shows that p values under the Kolmogorov-Smirnov and Shapiro-Wilk test were
0.091 & 0.940>0.05 respectively. This indicate that the data is normally distributed.
4.4 Correlation Analysis
This test assessed the existing association among the variables of the study as illustrated
under table 4.7
Table 4.6: Correlation Matrix
ROA AFP Leverage Size CR
ROA 1
AFP -.461** 1
Leverage -.329** .443** 1
Size .074 -.094 .192** 1
CR -.422** .633** .390** .105 1
**. Correlation is1significant at1the 0.01 level (2-tailed).
Source: Study Data
Table1 4.6 shows that the 1correlation for the aggressive financing policy (AFP) and ROA
is -0.461 which indicates a weak and negative while the correlation between leverage and
ROA was -0.329 which also indicate a weak and negative correlation respectively. The
30
correlations between size and ROA was 0.074 hence an indication of a positive and weak
correlation while the correlation between liquidity (CR) and ROA was -0.422 hence an
indication of a negative and weak correlations respectively.
4.5 Regression Analysis
Regression assessed the link between share returns the study’s independent variables.
Regression results were as follows
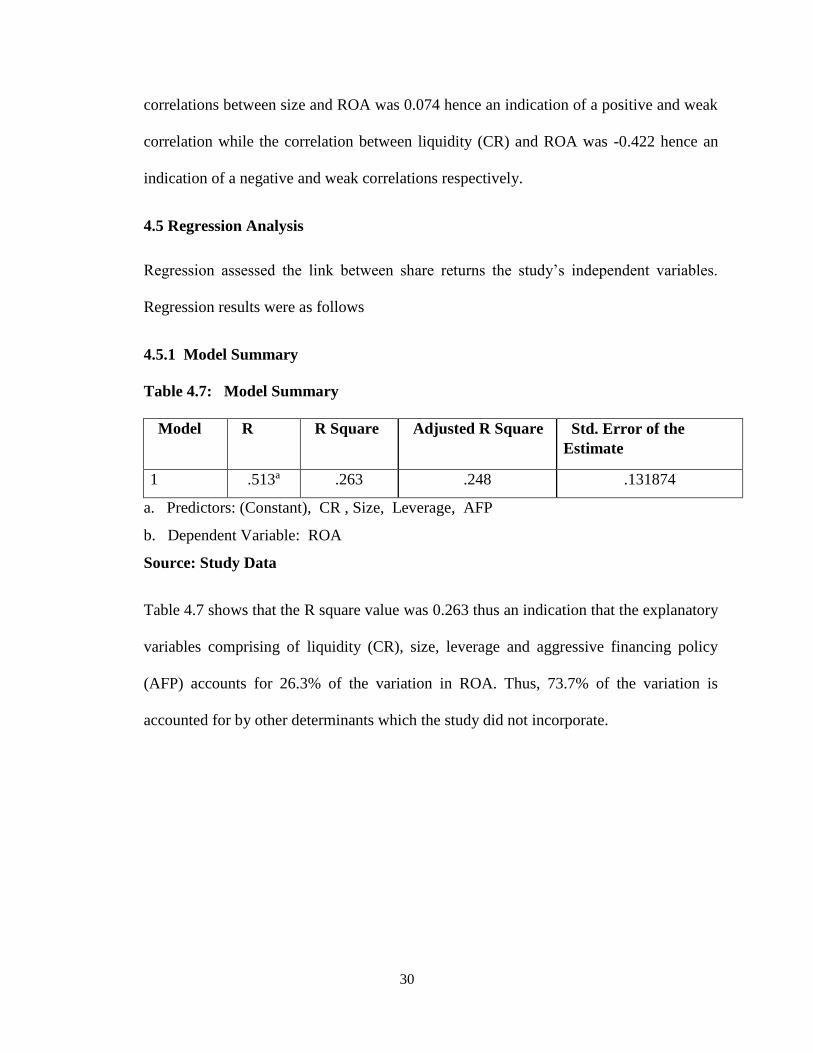
4.5.11Model Summary
Table 4.7: 1Model Summary
1Model 1R 1R Square 1Adjusted R Square 1Std. Error of the
Estimate
1 .513a .263 .248 .131874
a. 1Predictors: (Constant), CR , Size, Leverage, AFP
b. 1Dependent Variable: ROA
Source: Study Data
Table 4.7 shows that the R square value was 0.263 thus an indication that the explanatory
variables comprising of liquidity (CR), size, leverage and aggressive financing policy
(AFP) accounts for 26.3% of the variation in ROA. Thus, 73.7% of the variation is
accounted for by other determinants which the study did not incorporate.
31
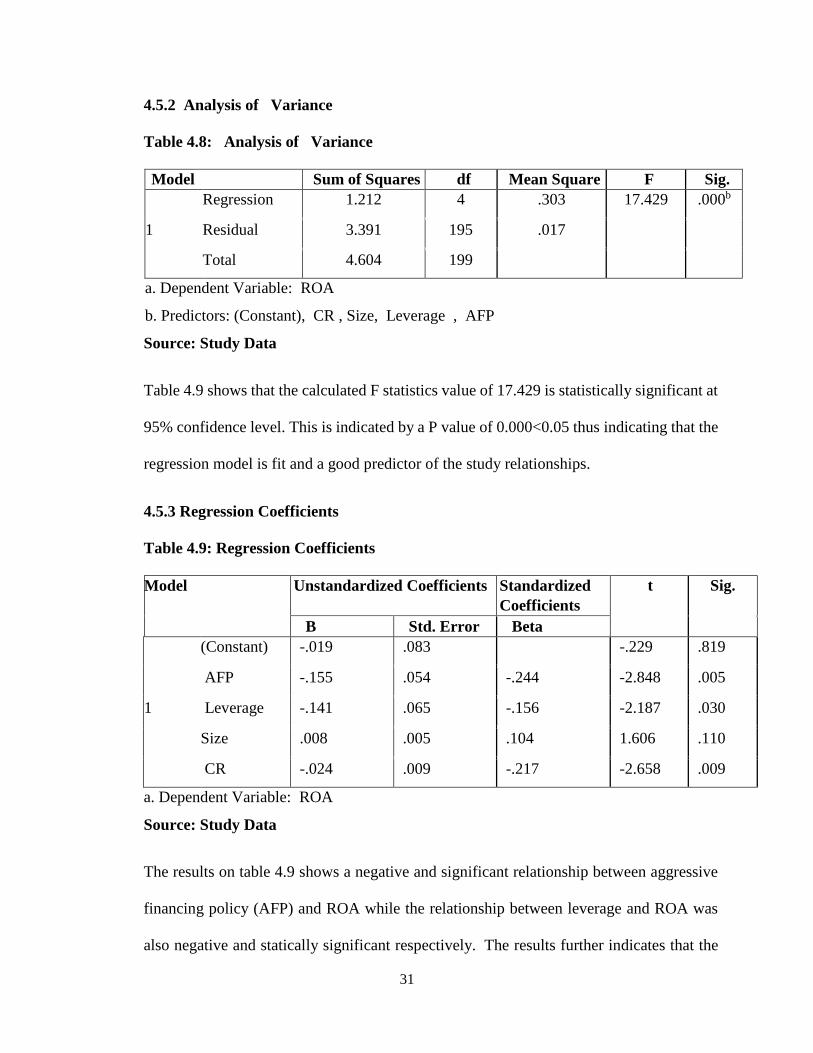
4.5.21Analysis of 1Variance
Table 4.8: 1Analysis of 1Variance
Model Sum of Squares df Mean Square F Sig.
1
Regression 1.212 4 .303 17.429 .000b
Residual 3.391 195 .017
Total 4.604 199
a. Dependent Variable: ROA
b. Predictors: (Constant), CR , Size, Leverage , AFP
Source: Study Data
Table 4.9 shows that the calculated F statistics value of 17.429 is statistically significant at
95% confidence level. This is indicated by a P value of 0.000<0.05 thus indicating that the
regression model is fit and a good predictor of the study relationships.
4.5.3 Regression Coefficients
Table 4.9: Regression Coefficients
Model Unstandardized Coefficients Standardized
Coefficients
t Sig.
B Std. Error Beta
1
(Constant) -.019 .083 -.229 .819
AFP -.155 .054 -.244 -2.848 .005
Leverage -.141 .065 -.156 -2.187 .030
Size .008 .005 .104 1.606 .110
CR -.024 .009 -.217 -2.658 .009
a. Dependent Variable: ROA
Source: Study Data
The results on table 4.9 shows a negative and significant relationship between aggressive
financing policy (AFP) and ROA while the relationship between leverage and ROA was
also negative and statically significant respectively.1The results further indicates that the
32
relationship between company size and ROA was positive but statistically insignificant but
the association between liquidity (CR) and ROA was negative and significant respectively.
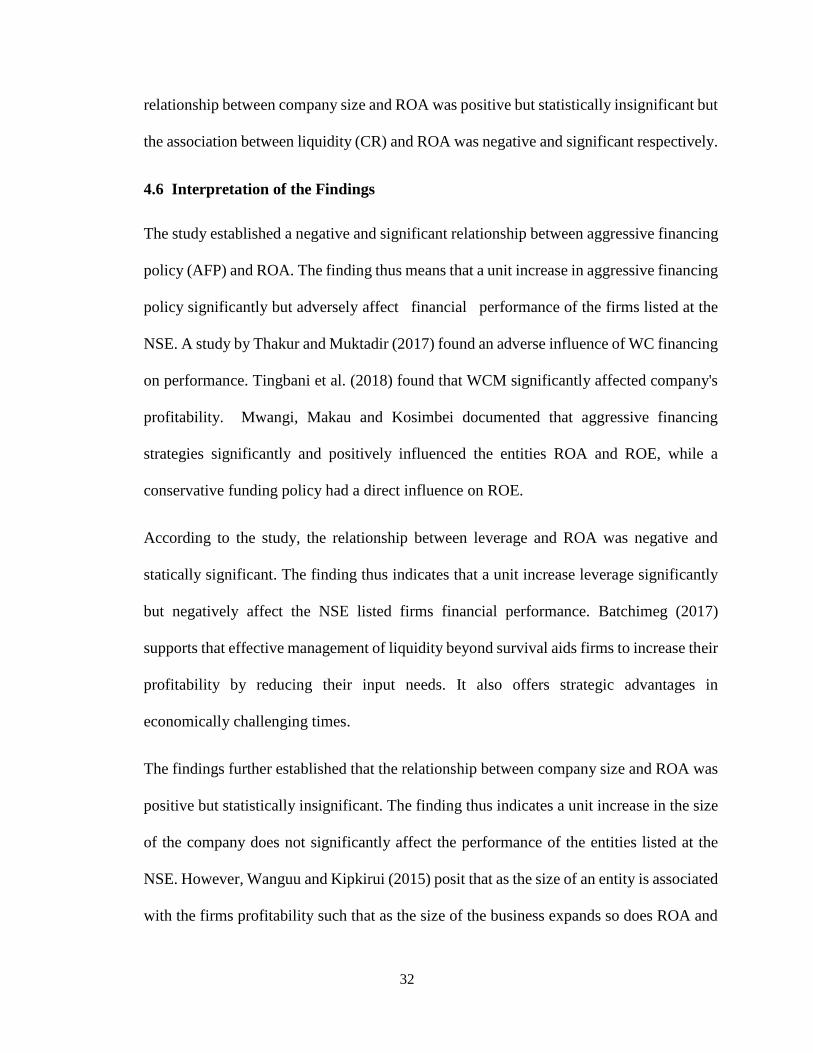
4.61Interpretation of the Findings
The study established a negative and significant relationship between aggressive financing
policy (AFP) and ROA. The finding thus means that a unit increase in aggressive financing
policy significantly but adversely affect 1financial 1performance of the firms listed at the
NSE. A study by Thakur and Muktadir (2017) found an adverse influence of WC financing
on performance. Tingbani et al. (2018) found that WCM significantly affected company's
profitability. Mwangi, Makau and Kosimbei documented that aggressive financing
strategies significantly and positively influenced the entities ROA and ROE, while a
conservative funding policy had a direct influence on ROE.
According to the study, the relationship between leverage and ROA was negative and
statically significant. The finding thus indicates that a unit increase leverage significantly
but negatively affect the NSE listed firms financial performance. Batchimeg (2017)
supports that effective management of liquidity beyond survival aids firms to increase their
profitability by reducing their input needs. It also offers strategic advantages in
economically challenging times.
The findings further established that the relationship between company size and ROA was
positive but statistically insignificant. The finding thus indicates a unit increase in the size
of the company does not significantly affect the performance of the entities listed at the
NSE. However, Wanguu and Kipkirui (2015) posit that as the size of an entity is associated
with the firms profitability such that as the size of the business expands so does ROA and
33
vice versa. Omondi and Muturi (2013) states that larger companies are more competitive
than smaller companies in using economies of scale and generating higher profits.
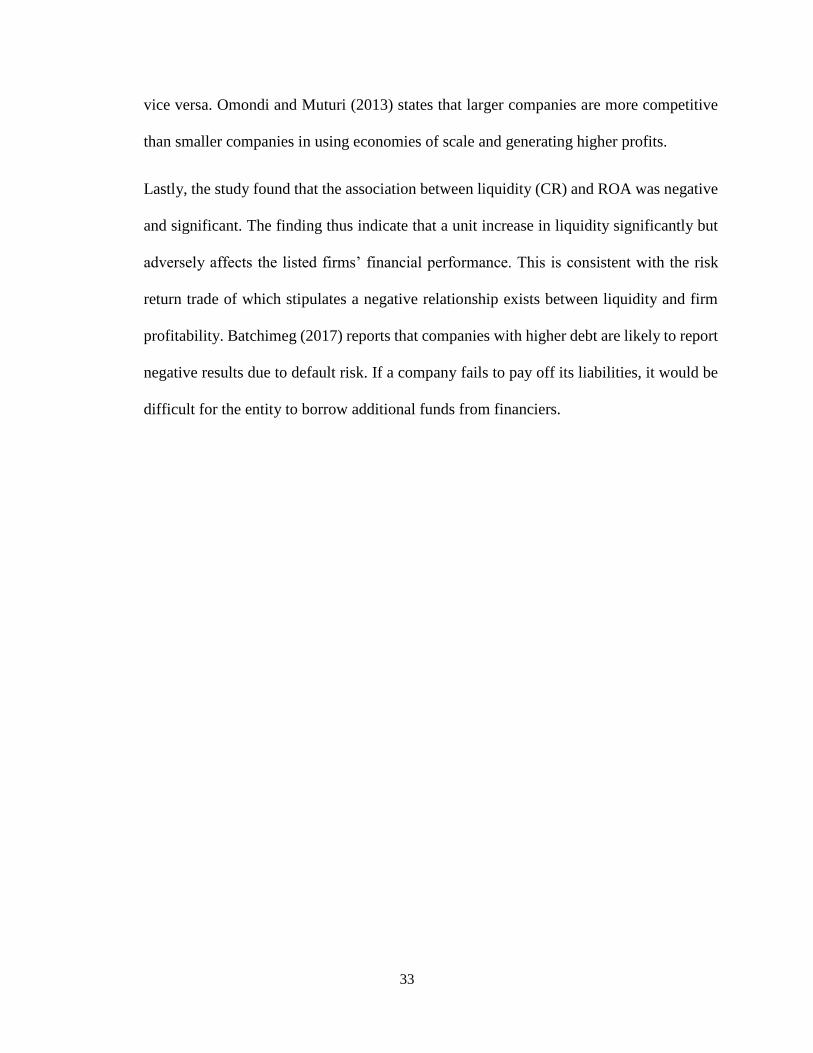
Lastly, the study found that the association between liquidity (CR) and ROA was negative
and significant. The finding thus indicate that a unit increase in liquidity significantly but
adversely affects the listed firms’ financial performance. This is consistent with the risk
return trade of which stipulates a negative relationship exists between liquidity and firm
profitability. Batchimeg (2017) reports that companies with higher debt are likely to report
negative results due to default risk. If a company fails to pay off its liabilities, it would be
difficult for the entity to borrow additional funds from financiers.
34
CHAPTER FIVE: SUMMARY, CONCLUSION AND
RECOMMENDATIONS
5.1 Introduction
This chapter entails a summary of the study findings, conclusions as well as the study
recommendations. The chapter further highlights the study limitations and areas that
require additional research.
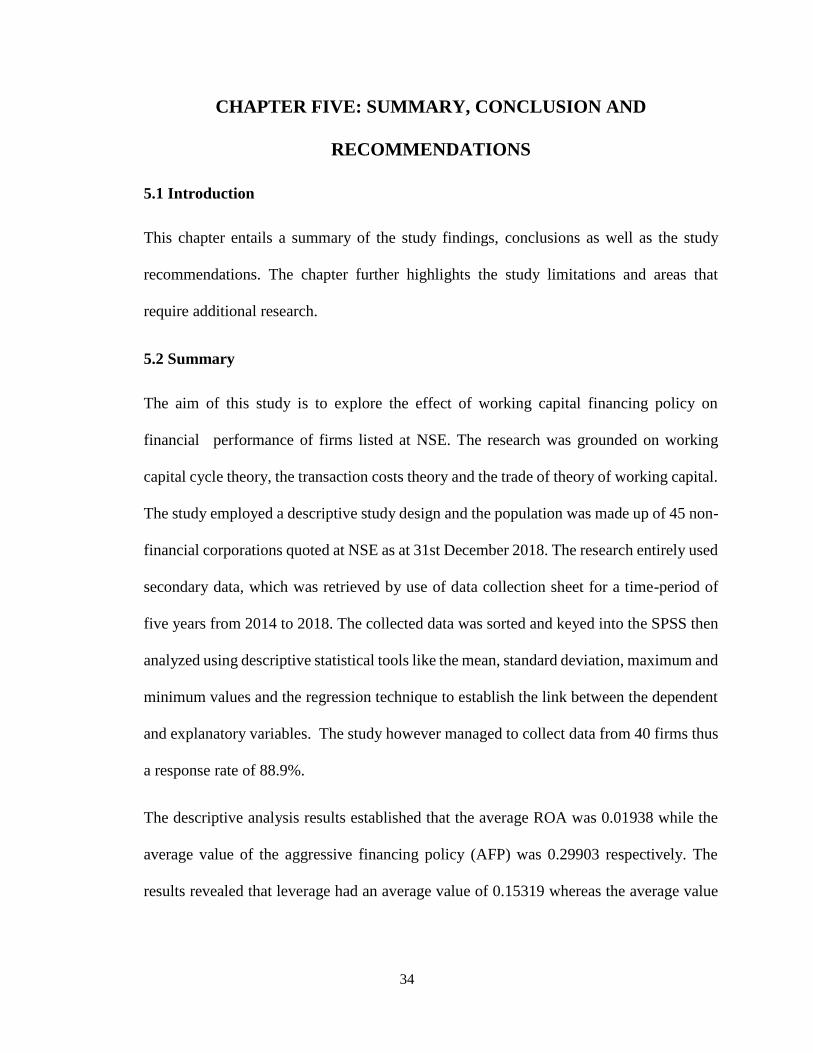
5.2 Summary
The aim of this study is to explore the effect of working capital financing policy on
financial 1performance of firms listed at NSE. The research was grounded on working
capital cycle theory, the transaction costs theory and the trade of theory of working capital.
The study employed a descriptive study design and the population was made up of 45 non-
financial corporations quoted at NSE as at 31st December 2018. The research entirely used
secondary data, which was retrieved by use of data collection sheet for a time-period of
five years from 2014 to 2018. The collected data was sorted and keyed into the SPSS then
analyzed using descriptive statistical tools like the mean, standard deviation, maximum and
minimum values and the regression technique to establish the link between the dependent
and explanatory variables. The study however managed to collect data from 40 firms thus
a response rate of 88.9%.
The descriptive analysis results established that the average ROA was 0.01938 while the
average value of the aggressive financing policy (AFP) was 0.29903 respectively. The
results revealed that leverage had an average value of 0.15319 whereas the average value
35
for firm size was 16.2527 while liquidity (CR) had an average value of
1.05190respectively.
The correlation results revealed that the correlation for the aggressive financing policy
(AFP) and ROA was weak and negative while the correlation between leverage and ROA
was also weak and negative correlation respectively. 1The study found1 that the correlation
between size and ROA was positive and weak correlation while the correlation between
liquidity (CR) and ROA was negative and weak correlations respectively.
The regression results revealed a negative and significant relationship between aggressive
financing policy (AFP) and ROA while the relationship between leverage and ROA was
also negative and statically significant respectively. The results further established that the
relationship between company size and ROA was positive but statistically insignificant but
the association between liquidity (CR) and ROA was negative and significant respectively.
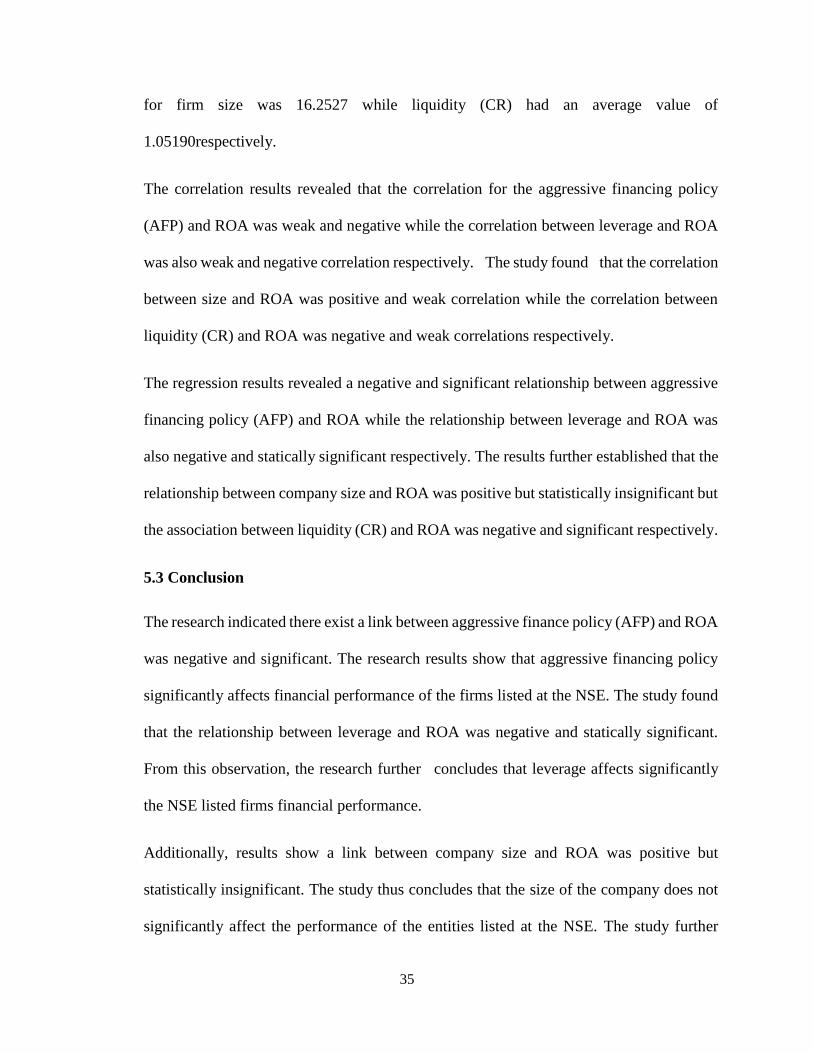
5.3 Conclusion
The research indicated there exist a link between aggressive finance policy (AFP) and ROA
was negative and significant. The research results show that aggressive financing policy
significantly affects financial performance of the firms listed at the NSE. The study found
that the relationship between leverage and ROA was negative and statically significant.
From this observation, the research further 1concludes that leverage affects significantly
the NSE listed firms financial performance.
Additionally, results show a link between company size and ROA was positive but
statistically insignificant. The study thus concludes that the size of the company does not
significantly affect the performance of the entities listed at the NSE. The study further
36
found that the link between liquidity and ROA was negative and significant. The study thus
concluded that liquidity significantly affects the listed firms’ financial performance.
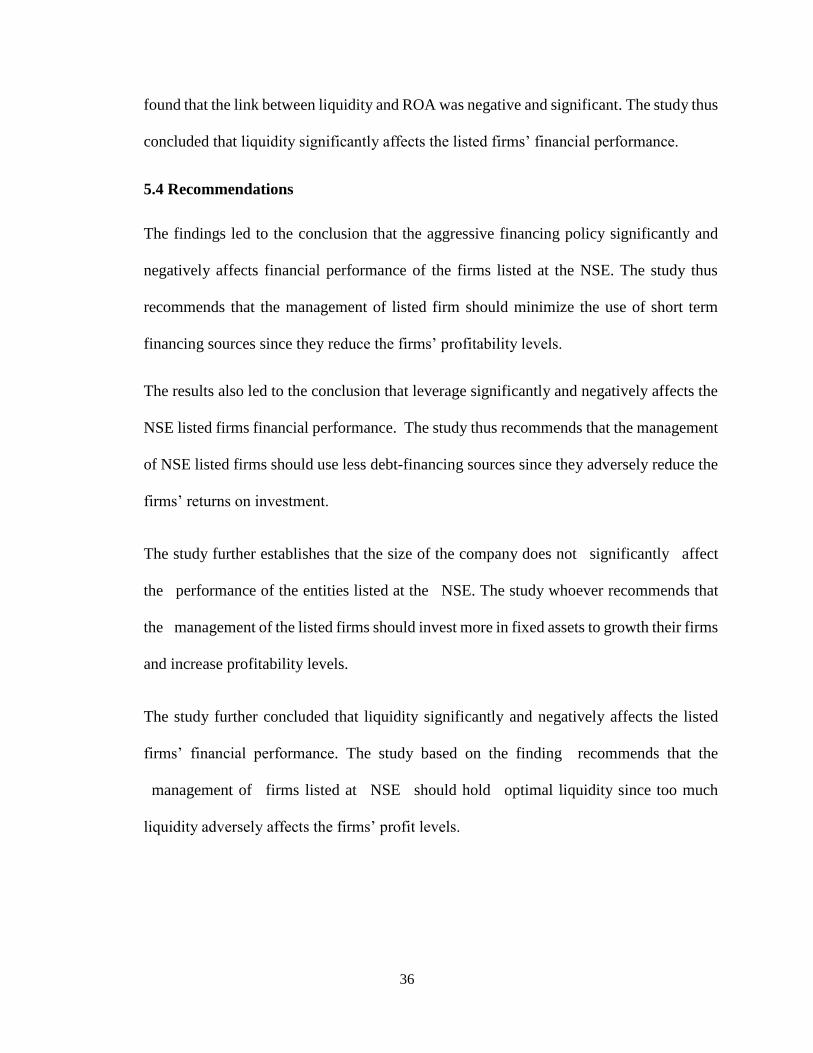
5.4 Recommendations
The findings led to the conclusion that the aggressive financing policy significantly and
negatively affects financial performance of the firms listed at the NSE. The study thus
recommends that the management of listed firm should minimize the use of short term
financing sources since they reduce the firms’ profitability levels.
The results also led to the conclusion that leverage significantly and negatively affects the
NSE listed firms financial performance. The study thus recommends that the management
of NSE listed firms should use less debt-financing sources since they adversely reduce the
firms’ returns on investment.
The study further establishes that the size of the company does not 1significantly 1affect
the 1performance of the entities listed at the 1NSE. The study whoever recommends that
the 1management of the listed firms should invest more in fixed assets to growth their firms
and increase profitability levels.
The study further concluded that liquidity significantly and negatively affects the listed
firms’ financial performance. The study based on the finding 1recommends that the
1management of 1firms listed at 1NSE 1should hold 1optimal liquidity since too much
liquidity adversely affects the firms’ profit levels.
37
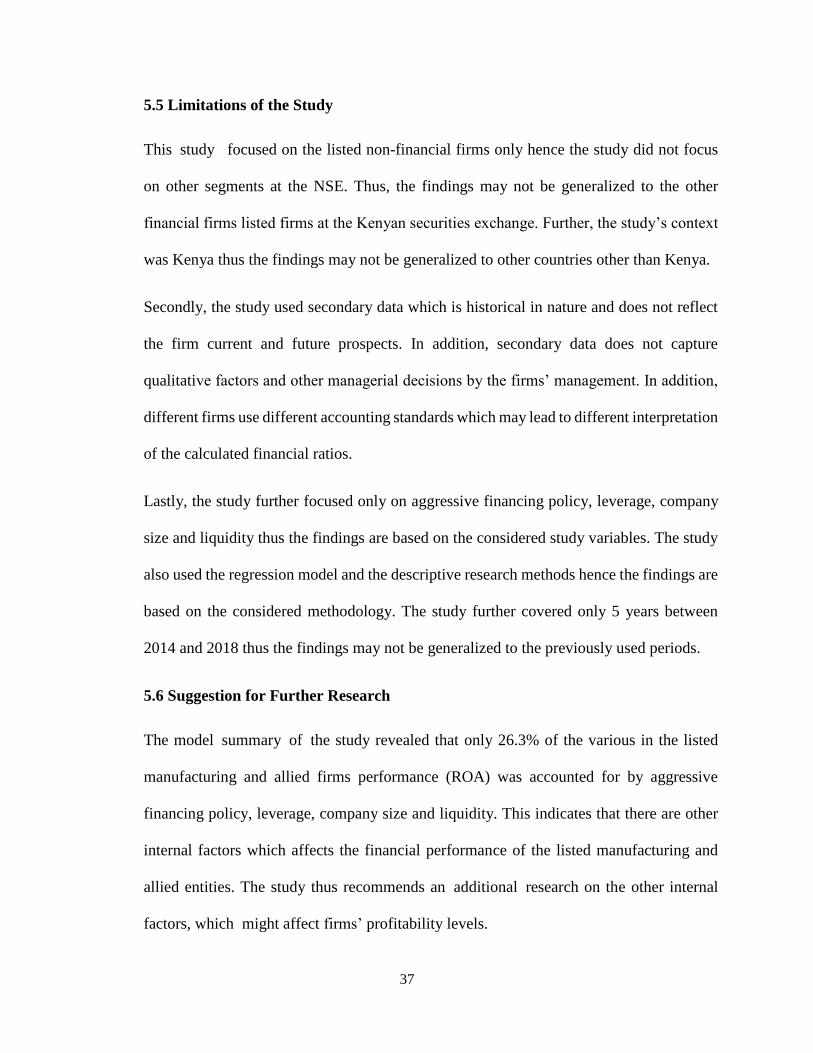
5.5 Limitations of the Study
This1study 1focused on the listed non-financial firms only hence the study did not focus
on other segments at the NSE. Thus, the findings may not be generalized to the other
financial firms listed firms at the Kenyan securities exchange. Further, the study’s context
was Kenya thus the findings may not be generalized to other countries other than Kenya.
Secondly, the study used secondary data which is historical in nature and does not reflect
the firm current and future prospects. In addition, secondary data does not capture
qualitative factors and other managerial decisions by the firms’ management. In addition,
different firms use different accounting standards which may lead to different interpretation
of the calculated financial ratios.
Lastly, the study further focused only on aggressive financing policy, leverage, company
size and liquidity thus the findings are based on the considered study variables. The study
also used the regression model and the descriptive research methods hence the findings are
based on the considered methodology. The study further covered only 5 years between
2014 and 2018 thus the findings may not be generalized to the previously used periods.
5.6 Suggestion for Further Research
The model1summary1of1the study revealed that only 26.3% of the various in the listed
manufacturing and allied firms performance (ROA) was accounted for by aggressive
financing policy, leverage, company size and liquidity. This indicates that there are other
internal factors which affects the financial performance of the listed manufacturing and
allied entities. The study thus recommends an1additional1research on the other internal
factors, which1might affect firms’ profitability levels.
38
The study also did not assess the various factor that might affect working capital financing
on different organization. The study thus recommends an additional research on the
determinants of working1capital1financing. The study only focused on aggressive
financing policy but there is also aggressive investment policy. The study thus gives
suggestion on how aggressive investment policy affects firms financial performance.
39
REFERENCES
Ahmadabadi, M. R., Mehrabi, E., & Yazdi, A. F. (2013). Impact of working capital
management on the performance of the firms listed on the Tehran Stock Exchange.
International Journal of Academic Research in Accounting, Finance and
Management Sciences, 3(3), 352-364.
Aliona, B. (2016). Financial performances measurement. Annals-Economy Series, 3, 169-
173.
Altaf, N., & Ahmad, F. (2019). Working capital financing, firm performance and financial
constraints. International Journal of Managerial Finance, 19, 1-15
Atseye, F. A., Ugwu, J. I., & Takon, S. M. (2015). Determinants of working capital
management. International Journal of Economics, Commerce and Management,
3(2), 1-11.
Bagh, T., Nazir, M. I., Khan, M. A., Khan, M. A., & Razzaq, S. (2016). The impact of
working capital management on firms’ financial performance: Evidence from
Pakistan. International Journal of Economics and Financial Issues, 6(3), 1097-
1105.
Batchimeg, B. (2017). Financial performance determinants of organizations: The case of
Mongolian Companies. Journal of Competitiveness, 9(3), 22-33.
Bei, Z., & Wijewardana, W. P. (2012). Working capital policy practice: Evidence from Sri
Lankan companies. Procedia-Social and Behavioral Sciences, 40, 695-700.
Eljelly, A. M. (2004). Liquidity‐profitability tradeoff: An empirical investigation in an
emerging market. International Journal of Commerce and Management, 14(2), 48-
61.
40
Foss, N. J. (2008). Human capital and transaction cost economics. Center for Strategic
Management and Globalization, Copenhagen Business School
Hassan, U., Maturi, W., & Mberia, H. (2017). Effect of working capital management on
firm's financial performance: a survey of water processing firms in Puntland.
Journal of Economics and Sustainable Development, 8(2), 10-20.
Kamuti, J. M. & Omwenga, J. (2017). Factors influencing investment decisions in Nairobi
Securities Exchange: A case of Dyer & Blair Investment Bank Limited.
International Academic Journal of Economics and Finance, 2 (3), 1-15
King’ori, S., Kioko, W., & Shikumo, H. (2017). Determinants of financial performance of
microfinance banks in Kenya. Research Journal of Finance and Accounting, 8(16),
1-8.
Kiptoo, I. K., Kariuki, S. & Kimani, E. M. (2017). Working capital management practices
and financial performance of tea processing firms in Kenya. International
Academic Journal of Economics and Finance, 2(3), 92-111
Konak, F., & Güner, E. N. (2016). The impact of working capital management on firm
performance: An empirical evidence from the BIST SME industrial index.
International Journal of Trade, Economics and Finance, 7(2), 38-43.
Lalah, A. A. (2018). Effects of working capital management on financial performance of
manufacturing companies listed at the Nairobi securities exchange, Kenya.
Unpublished MBA Project, Moi University
Li, C. G., Dong, H. M., Chen, S., & Yang, Y. (2014). Working capital management,
corporate performance, and strategic choices of the wholesale and retail industry in
China. The Scientific World Journal, 14, 1-15
41
Makori, D. M., & Jagongo, A. (2013). Working capital management and firm profitability:
Empirical evidence from manufacturing and construction firms listed on Nairobi
securities exchange, Kenya. International Journal of Accounting and Taxation,
1(1), 1-14.
Miloş, L. R., & Miloş, M. C. (2014). Management of the working capital and firm
performance in the Romanian pharmaceutical sector. Annals of the" Constantin
Brâncuşi" University of Târgu Jiu, Economy Series, 6, 125-130.
Mroczek, K. (2014). Transaction cost theory-explaining entry mode choices. Poznan
University of Economics Review, 14(1), 48-62
Muhammad, M., Jan, W. U., & Ullah, K. (2012). Working capital management and
profitability. Journal of Managerial Sciences, 6(2), 155-165
Muia, V. M., Banafa, A. A. & Mwanzia M. S. (2017). Effect of working capital
management on financial performance: A case study of listed manufacturing firms
at NSE, Kenya. International Journal of Management and Commerce Innovations,
4(2), 881-888
Mwangi, L. W., Makau, M. S., & Kosimbei, G. (2014). Effects of working capital
management on performance of non-financial companies listed in NSE, Kenya.
European Journal of Business and Management, 6(11), 195-205.
Mweta, T., & Kipronoh, P. (2018). Effect of working capital management on the financial
performance: evidence of construction and allied sector firms listed at Nairobi
Securities Exchange. Research Journal of Finance and Accounting, 9(5), 38-49
Naz, F., Ijaz, F., & Naqvi, F. (2016). Financial Performance of Firms: Evidence from
Pakistan Cement Industry. Journal of Teaching and Education, 5(01), 81-94.
42
Nazir, M. S., & Afza, T. (2009). Impact of aggressive working capital management policy
on firms' profitability. IUP Journal of Applied Finance, 15(8), 19-30
Niresh, J. A. (2012). Trade-off between liquidity & profitability: A study of selected
manufacturing firms in Sri Lanka. Researchers World, 3(4), 34-41
Niresh, J. A. (2012). Working capital management & financial performance of
manufacturing sector in Sri Lanka. European Journal of Business and
Management, 4(15), 23-30.
Nishanthini, A., & Meerajancy, J. (2015). Trade-Off between liquidity and profitability: A
comparative study between state banks and private banks in Sri Lanka. Research
on Humanities and Social Sciences, 5(7), 78-85
Nyabuti, W. M., & Alala, O. B. (2014). The relationship between working capital
management policy and financial performance of companies quoted at NSE,
Kenya. International Journal of Economics, Finance and Management Sciences,
2(3), 212-219.
Nyamweno, C. N., & Olweny, T. (2014). Effect of working capital management on
performance of firms listed at the NSE. Economics and Finance Review, 3(11), 01-
14.
Omondi, M. M., & Muturi, W. (2013). Factors affecting the financial performance of listed
companies at the Nairobi Securities Exchange in Kenya. Research Journal of
Finance and Accounting, 4(15), 99-104.
Onsongo, G. N. & Onyiego, G. (2018). Effects of working capital management practices
on financial performance of edible oil producing companies in Kenya. Strategic
Journal of Business & Change Management, 5(2), 335 – 354
43
Orayo, J. A. & Ombaba, K. M. (2017). Empirical analysis on financial performance of
listed firms in commercial and service sector in Kenya: Corporate boards, do they
matter? Africa International Journal of Management, Education and Governance,
2(2), 10-29
Panigrahi, D. (2014). Understanding the working capital financing strategy (A case study
of Lupin limited). Journal of Management Research & Analysis, 1(1), 108-120
Panigrahi, D., Namita, R. & Chaitrali, G. (2018). Liquidity and profitability trade-off: A
study of Indian pharmaceutical companies. Journal of Economics and Public
Policy, 3(1), 42-56
Raheman, A., Afza, T., Qayyum, A., & Bodla, M. A. (2010). Working capital management
and corporate performance of manufacturing sector in Pakistan. International
Research Journal of Finance and Economics, 47(1), 156-169.
Shimenga, M. A., & Miroga, J. (2019). Influence of financial leverage and liquidity on
financial performance of manufacturing firms listed at the Nairobi Securities
Exchange. Strategic Journal of Business & Change Management, 6 (2), 799 - 814
Sichigea, D. F., Ganea, M., & Tupangiu, L. (2011). Financial performance indicators–
instruments in lending decision-making. Finante-Provocarile Viitorului, 1(13),
168-174.
Taani, K. (2012). Impact of working capital management policy and financial leverage on
financial performance: Empirical evidence from Amman Stock Exchange–listed
companies. International Journal of Management Sciences and Business Research,
1(8), 10-17
44
Temtime, Z. T. (2016). Working capital management policies and profitability of small
manufacturing firms. Unpublished Doctoral Thesis, Walden University
Thakur, O. A., & Muktadir-Al-Mukit, D. (2017). Working Capital Financing Policy and
Profitability: Empirical Study on Bangladeshi Listed Firms. British Journal of
Economics, Management & Trade, 17(1), 1-6.
Tingbani, I., Tauringana, V., Damoah, I. S., & Sha'ven, W. B. (2018). Working Capital
Management and Financial Performance of UK Listed Firms: A Contingency
Approach. International Journal of Banking, Accounting and Finance, 7 (4), 1-39
Wanguu, K. C., & Kipkirui, S. E. (2015). The Effect of Working Capital Management on
Profitability of Cement Manufacturing Companies in Kenya. IOSR Journal of
Economics and Finance, 6(6), 53-61.
Williamson, O. E. (2007). Transaction cost economics: An introduction. Economics
Discussion Paper, (2007-3). University of California, Berkeley
Williamson, O. E. (2009). Pragmatic methodology: A sketch, with applications to
transaction cost economics. Journal of Economic Methodology, 16(2), 145-157.
Yahaya, A., & Bala, H. (2015). Working capital management and financial performance
of deposit money banks in Nigeria. Research Journal of Finance and Accounting,
6(16), 57-72.
Yegon, C. K., Kiprono, K. J., & Willy, C. (2014). Working capital management and
corporate financial performance: Evidence from panel data analysis of selected
quoted tea companies in Kenya. Research Journal of Finance and Accounting, 5(5),
53-62.
45
Yogendrarajah, R. & Sangeetha, R. Y. (2014). Working capital management and its impact
on financial performance: An analysis of trading firms. Presentation in the
International Conference at Rajarata University – 2014
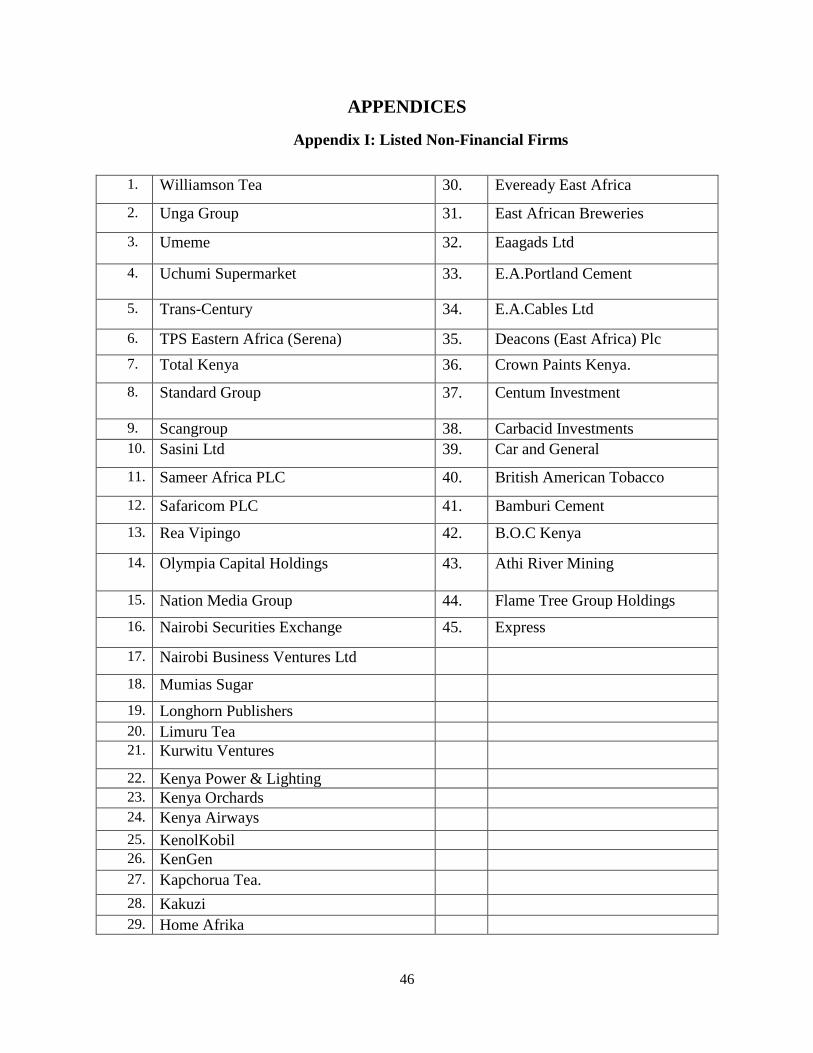
46
APPENDICES
Appendix I: Listed Non-Financial Firms
1. Williamson Tea 30. Eveready East Africa
2. Unga Group 31. East African Breweries
3. Umeme 32. Eaagads Ltd
4. Uchumi Supermarket 33. E.A.Portland Cement
5. Trans-Century 34. E.A.Cables Ltd
6. TPS Eastern Africa (Serena) 35. Deacons (East Africa) Plc
7. Total Kenya 36. Crown Paints Kenya.
8. Standard Group 37. Centum Investment
9. Scangroup 38. Carbacid Investments
10. Sasini Ltd 39. Car and General
11. Sameer Africa PLC 40. British American Tobacco
12. Safaricom PLC 41. Bamburi Cement
13. Rea Vipingo 42. B.O.C Kenya
14. Olympia Capital Holdings 43. Athi River Mining
15. Nation Media Group 44. Flame Tree Group Holdings
16. Nairobi Securities Exchange 45. Express
17. Nairobi Business Ventures Ltd
18. Mumias Sugar
19. Longhorn Publishers
20. Limuru Tea 21. Kurwitu Ventures
22. Kenya Power & Lighting 23. Kenya Orchards
24. Kenya Airways
25. KenolKobil 26. KenGen
27. Kapchorua Tea.
28. Kakuzi
29. Home Afrika

47
Appendix II: Data Collection Sheet
2014
2015 2016 2017 2018
Net income
Total assets
Short-term
finances
Total debt
Current assets