Embed Size (px)
Citation preview

Q U A N T I T A T I V E M E T H O D S I N S O C I A L P R O T E C T I O N S E R I E S
Financing social protectionDesigning social protection systems that are effective andequitable, and fiscally, financially and economically efficient,has been a challenge for many countries as well as a source ofsubstantive debate the world over. Formal social protectionsystems (through transfers in cash and in kind) redistributebetween 5 per cent (in developing countries) and 35 per cent(in OECD countries) of their gross domestic product. Oneof the first volumes of its kind, this book addresses thesechallenges by offering a comprehensive overview of the manyfinancing options available, while also providing a thoroughanalysis of their advantages and disadvantages and theirfinancial and economic implications.
The most important task of social protection systems is toalleviate and prevent poverty – with this in mind, the bookpresents a “methodological toolbox” from which socialprotection planners, managers and social policy analysts canwork. Written by practitioners for practitioners, the bookdiscusses the design and maintenance of national socialprotection systems that ensure an effective and efficient useof available resources at the community, national andinternational levels, while supporting long-term economicdevelopment. Each chapter includes stylized real-lifeexamples that deal with the theory, as well as practical policyquestions. The book also guides readers through the policy process that determines the affordable levels of, andscope of, social protection in a given country.
INTERNATIONAL LABOUR OFFICE • GENEVA
INTERNATIONAL SOCIAL SECURITY ASSOCIATION
Price:100 Swiss francs9 789221 151227
ISBN 92-2-115122-0
FinancingsocialprotectionMichael CichonWolfgang ScholzArthur van de MeerendonkKrzysztof HagemejerFabio BertranouPierre Plamondon
International SocialSecurity Association
International Labour OfficeGeneva
Financing social protection
Q U A N T I T A T I V E M E T H O D S I N S O C I A L P R O T E C T I O N S E R I E S
Financing Cover 5/19/04 10:02 AM Page 1

Financingsocialprotection
Financing prelims copy 5/19/04 10:36 AM Page i

QUANTITATIVE METHODS IN SOCIAL PROTECTION SERIESA series on financial, actuarial and statistical aspects of social security preparedjointly by the International Social Security Association and the Social SecurityDepartment of the International Labour Office
Modelling in health care finance: A compendium of quantitative techniques for health care financingby Michael Cichon, William Newbrander, Hiroshi Yamabana, Axel Weber, Charles Normand, David Dror and Alexander PrekerISBN 92-2-110862-7 1999
Actuarial mathematics of social security pensionsby Subramaniam IyerISBN 92-2-110866-X 1999
Social budgetingby Wolfgang Scholz, Krzysztof Hagemejer and Michael CichonISBN 92-2-110861-9 2000
Actuarial practice in social securityby Pierre Plamondon, Anne Drouin, et.al.ISBN 92-2-110863-5 2002
Forthcoming Social security statistics (in preparation)
Financing prelims copy 5/19/04 10:36 AM Page ii

FinancingsocialprotectionMichael CichonWolfgang ScholzArthur van de MeerendonkKrzysztof HagemejerFabio BertranouPierre Plamondon
A joint technical publication of theInternational Labour Office (ILO) and theInternational Social Security Association (ISSA)
Q U A N T I T A T I V E M E T H O D S I N S O C I A L P R O T E C T I O N S E R I E S
International Labour Office • Geneva
Financing prelims copy 5/19/04 10:36 AM Page iii

Copyright # International Labour Organization 2004First published 2004
Publications of the International Labour Office enjoy copyright under Protocol 2 of the UniversalCopyright Convention. Nevertheless, short excerpts from them may be reproduced withoutauthorization, on condition that the source is indicated. For rights of reproduction or translation,application should be made to the Publications Bureau (Rights and Permissions), InternationalLabour Office, CH-1211 Geneva 22, Switzerland. The International Labour Office welcomes suchapplications.
Libraries, institutions and other users registered in the United Kingdom with the CopyrightLicensing Agency, 90 Tottenham Court Road, London W1P 4LP [Fax: (+44) (0) 20 7 631 5500;email: [email protected]], in the United States with the Copyright Clearance Center, 222 RosewoodDrive, Danvers, MA 01923 [Fax: (+1) (978) 750 4470; email: [email protected]], or in othercountries with associated Reproduction Rights Organizations, may make photocopies inaccordance with the licences issued to them for this purpose.
The designations employed in ILO publications, which are in conformity with United Nationspractice, and the presentation of material therein do not imply the expression of any opinionwhatsoever on the part of the International Labour Office concerning the legal status of anycountry, area or territory or of its authorities, or concerning the delimitation of its frontiers.
The responsibility for opinions expressed in signed articles, studies and other contributions restssolely with their authors, and publication does not constitute an endorsement by the InternationalLabour Office of the opinions expressed in them.
Reference to names of firms and commercial products and processes does not imply theirendorsement by the International Labour Office, and any failure to mention a particular firm,commercial product or process is not a sign of disapproval.
ILO publications can be obtained through major booksellers or ILO local offices in manycountries, or direct from ILO Publications, International Labour Office, CH-1211 Geneva 22,Switzerland. Catalogues or lists of new publications are available free of charge from the aboveaddress or by email: [email protected].
Visit our website: www.ilo.org/publns
Printed in Europe by the Alden Group, Oxford
Cichon, M.; Scholz, W.; van de Meerendonk, A.; Hagemejer, K.; Bertranou, F.;Plamondon, P.Financing social protectionQuantitative Methods in Social Protection SeriesGeneva, International Labour Office/International Social Security Association, 2004Social security financing, method of financing, social expenditure, social protection,developed country, developing country. 02.13.1
ISBN 92-2-115122-0ILO Cataloguing in Publication Data

FOREWORD
Social protection systems are pivotal elements in national governance. Theyembody the social values of any society. Social protection systems have threemain objectives: to guarantee access to essential goods and services for allmembers of a society, to promote active socio-economic security, and toadvance individual and social potential for poverty reduction and societaldevelopment.1 Social protection is an investment in the social and economicdevelopment of societies and individuals. It thus not only helps people to copewith risks and reduces inequalities, but also enables them to develop fullpotential for personal growth and meaningful contributions to their societiesthroughout their life.
At the same time, social protection systems are huge redistributive mech-anisms in most economies, often exceeding 30 per cent of gross domesticproduct (GDP). Transfers of this magnitude require sound governance andmanagement, in particular financial governance and economic management.Indeed, the potential contribution of social protection to individual and societaldevelopment cannot be realized if the resources that a society entrusts to itssocial protection system are not managed with utmost care and responsibility.Too many social protection schemes – albeit well designed – have failedbecause their governance and management failed.
Recognizing this fact, five years ago the Social Protection Sector of theInternational Labour Office (ILO) and the International Social SecurityAssociation (ISSA) embarked jointly on a pioneering endeavour: they set outto bring together and publish for the first time in the form of a comprehensiveseries of technical textbooks – the Quantitative Methods in Social ProtectionSeries – the skills and techniques that are crucial for the sound financialmanagement and governance of social protection systems and individualschemes (ranging from short-term benefit schemes to health care and pensions,as well as social assistance, anti-poverty benefits, universal benefits andcommunity-based schemes).
1 Bonilla Garcia and Gruat (2003).
v

This volume is the fifth in the series. The four already published are:
. Actuarial mathematics of social security pensions (1999)
. Modelling in health care finance: A compendium of quantitative techniquesfor health care financing (1999)
. Social budgeting (2000)
. Actuarial practice in social security (2002)
A sixth volume, dealing with social security statistics, is in preparation.The present volume occupies a central place in the series. It is an
overarching compendium that incorporates salient elements of the othervolumes and deals with economic, fiscal, financing, financial market andfinancial governance aspects of alternative policy choices for the financing ofsocial protection. Each society develops its own overall concept of socialprotection, determined by its value system and its economic and fiscalcapacities. This book shows how resources can be found and managed tofinance transfers that can help to alleviate income insecurity and poverty in thecontext of a national concept of social protection. It assists the reader to analysethe economic, fiscal and financial consequences of alternative social protectionfinancing systems. Unlike the other volumes, which were written chiefly forquantitative specialists (actuaries, financial analysts and quantitative econo-mists), this book is also meant for a wider audience of social protection policyanalysts and planners. The ILO and ISSA are convinced that a basicunderstanding of sound financial governance and planning must be part ofthe professional education of all social protection planners.
Financing social protection is thus a compromise between a textbook foranalysts and a compendium of concepts for policy planners and decision-makers.It abstains from giving policy advice and passing judgement on alternativefinancing options; rather, it sets out the technical characteristics of alternativefinancing systems and their potential fiscal and economic effects. It also spells outfinancial governance prerequisites for effective and efficient benefit delivery. As atextbook, it offers the reader active involvement in the form of practicalassignments that review and consolidate the essential concepts discussed.
ILO and ISSA believe that books like this one always remain works inprogress. We therefore encourage readers to contribute to the development ofknowledge in the field of social protection financing by providing us withcomments and suggestions for further work. We can thus develop together ourknowledge base in social protection financing.
Assane DiopExecutive DirectorSocial Protection SectorInternational Labour OfficeGeneva, Switzerland
Dalmer D. HoskinsSecretary General
International Social SecurityAssociation
Geneva, Switzerland
Foreword
vi

CONTENTS
Foreword v
Acknowledgements xxiii
About the authors xxv
List of abbreviations and acronyms xxix
Introduction 1
Definitional context and limitations 1
Objective 4
Method 5
Audience and level of technicality 6
The place of this volume in the Quantitative Methods inSocial Protection Series 6
Outline 7
1 Basic concepts: Social protection and social transfers 11
1.1 Social protection through social transfers 12
1.2 Informal transfer systems 17
1.3 Formal transfer systems 19
1.3.1 Defining formal social protection, its functions,institutions and sources of finance 19
1.3.2 Financial architecture of national social protection systems 22
1.4 Income effects of national social transfer systems 25
1.4.1 Measures of inequality, poverty and transfer efficiency 26
1.4.1.1 Measuring income inequality 26
1.4.1.2 Measuring poverty 32
1.4.1.3 Measuring transfer efficiency 34
1.4.2 Factual evidence on the redistributive effects of social transfers 37
1.5 Estimating overall normal transfer levels 41
1.6 Estimating minimum levels of formal social protection 46
1.7 Normal transfer levels and the affordability debate 50
1.8 Summary 51
Annex 1-A1 Defining the term ‘‘social protection’’ 54
vii

2 The size of the welfare state: Trends, patterns anddeterminants of social expenditure 59
2.1 Social expenditure ratio: A basic measure and its limitations 60
2.2 Expenditure trends and patterns 61
2.2.1 Observed regional expenditure trends 62
2.2.1.1 Industrialized countries 62
2.2.1.2 Developing countries 65
2.2.2 Developmental patterns 69
2.2.3 Structural patterns 70
2.3 Future prospects 72
2.3.1 Methodology and assumptions 75
2.3.2 Projection results 78
2.4 Factor analysis of the determinants of national social expenditure 82
2.4.1 Impact of the demographic environment 83
2.4.2 Impact of governance 89
2.4.3 Impact of the economic environment 96
2.4.4 Weighting the factors 99
2.5 Summary 99
Statistical Annex 2-A1 103
3 Social protection and the economy 106
3.1 Economic taxonomies of national social protection systems 109
3.2 Exploring the theory: Do extensive welfare states affect economicperformance? 111
3.2.1 Do extensive welfare states have a negative impact oneconomic performance? 112
3.2.2 Do extensive welfare states have a positive impact oneconomic performance? 119
3.2.3 Preliminary theoretical conclusion 121
3.3 Looking at the evidence: The mechanisms of interaction betweenthe welfare state and economic performance 121
3.3.1 The welfare state and labour market outcomes 126
3.3.2 Institutional fine print: Tax/benefit systems and low-paidlabour 130
3.3.3 Institutional fine print: Retirement schemes and other exitsfrom the labour force 139
3.3.4 Total social expenditure revisited: Input or outcome measure 141
3.3.5 Welfare outcomes of different types of welfare states 143
3.3.5.1 Income transfers and the dynamics of poverty 143
3.3.5.2 Adequacy of pensions 145
3.3.6 Putting theory and evidence together: The puzzle remains 148
3.4 Economic instruments in the governance of social transfers 150
3.4.1 Theoretical background 151
viii
Contents

3.4.1.1 Information economics 151
3.4.1.2 New institutional economics 153
3.4.2 Public versus private provision of social protection 156
3.4.2.1 Market and government failures 156
3.4.2.2 Governance choices 159
3.4.2.3 Conclusions 163
3.5 Will we be able to afford the welfare state in the future? 163
3.5.1 The demographic challenge 164
3.5.2 The challenge of internationalization 168
3.5.3 Summing up 172
3.6 Summary 173
4 The public finance nexus and resource mobilization strategies 178
4.1 Social protection in national and government accounts 178
4.2 Financial links between social protection schemes andgovernment accounts 181
4.2.1 Financial flows from social security schemes to governmentaccounts 182
4.2.2 Flows and links between government accounts and socialprotection schemes 186
4.2.3 Indirect subsidies and contingent liabilities 191
4.3 Effect of social protection financing on public deficits and debt 193
4.3.1 Explicit debt 193
4.3.2 Implicit debt 194
4.4 Social protection financing and public financing strategies 198
4.5 Mobilizing resources for the social protection sector 202
4.5.1 Basic choices 202
4.5.2 Developing a national resource mobilization strategy 207
4.6 Summary 215
5 Financing techniques 219
5.1 Financing systems: Definition, parameters and main applications 220
5.1.1 The principal objective of financing systems 220
5.1.2 Parameters of financing systems 223
5.1.2.1 The size of the covered group 223
5.1.2.2 Financing rules 225
5.1.2.3 Actuarial equilibrium and the level of funding 227
5.1.2.4 Sources of financing 232
5.1.3 Application of the different types of financing systems 240
5.2 Financing health care benefits 240
5.2.1 National health care financing systems 245
5.2.2 Community-based schemes for the informal sector 249
5.2.3 Private insurance and mixed financing systems 257
ix
Contents

5.3 Financing social security pensions 261
5.3.1 Typical expenditure life cycle of pension schemes 261
5.3.2 Incidence of contributions 268
5.3.3 Contribution base 270
5.3.4 Types of contributions 272
5.3.5 Determining the level of contributions 282
5.3.6 Rate setting in fully and highly funded schemes 299
5.3.7 Rate setting in PAYG or scaled premium regimes 300
5.4 Financing other benefits 302
5.4.1 Social assistance 302
5.4.2 Universal (basic) minimum income 308
5.4.3 Other short-term and long-term benefits 315
5.5 International instruments 317
5.6 Summary 322
Annex 5-A1 Testing factor sensitivity in the context of a youngAfrican pension scheme 326
6 Investing social protection reserves 330
6.1 Financial markets: Definition and general characteristics 331
6.1.1 Characteristics of formal financial markets 333
6.1.2 Macroeconomic context and role of financial markets 335
6.2 Nature and institutional management of social security reserves 338
6.2.1 Long-term funds versus transitory reserves 339
6.2.1.1 Pension funds 340
6.2.1.2 Contingency reserves 342
6.2.2 Institutional organization of reserve management 343
6.3 Basic investment principles 344
6.3.1 Safety 344
6.3.2 Yield 345
6.3.3 Liquidity 345
6.3.4 Social and economic utility 345
6.4 Criteria of asset management in practice 346
6.4.1 Maximizing return 347
6.4.2 Minimizing risk 349
6.4.3 Optimizing the time horizon 355
6.4.4 Benchmarking 357
6.5 Analytical tools 359
6.5.1 Equity performance indicators 359
6.5.2 Equity valuation 361
6.5.2.1 Balance sheet concepts 361
6.5.2.2 Concepts based on future cash flows 362
6.5.3 Debt instrument performance indicators 366
6.5.4 Bond yield 366
x
Contents

6.6 Investment strategies 369
6.6.1 Investment by industry 369
6.6.2 Investment by financial market 372
6.6.3 Investment by region 373
6.6.4 Socially responsible investment 374
6.6.4.1 Corruption 374
6.6.4.2 Labour standards 374
6.6.4.3 Human rights 375
6.6.4.4 Social security 375
6.6.5 Common considerations 376
6.7 Investment problems in countries with underdevelopedfinancial markets 378
6.7.1 Emerging markets and investment of pension funds 379
6.7.2 Funding pensions in transition countries 383
6.7.3 Investment in support of national development plans 389
6.8 What comes first: Pension funds or financial markets? 391
6.9 Summary 394
7 Financial governance 401
7.1 Basic legal framework and instruments of financial governance 404
7.1.1 Framework legislation and relation to other legislation 404
7.1.2 Regulatory framework for state-operated systems 405
7.1.2.1 Legal set-up 405
7.1.2.2 Audits and controls 407
7.1.3 Regulatory framework for social insurance schemes 408
7.1.4 Regulatory framework for mandated private insuranceschemes or occupational schemes 408
7.1.4.1 Regulation of private mandatory pension systems 409
7.1.4.2 Regulation of life insurance companies 411
7.1.4.3 Supervision 414
7.1.5 Financial market regulations 415
7.1.5.1 Savings–investment intermediation mechanisms 416
7.1.5.2 Regulations relevant to financial markets 416
7.1.5.3 Basic regulations governing the banking system 417
7.2 Hierarchy of quantitative governance instruments: An overview 418
7.2.1 Descriptive instruments 419
7.2.1.1 Accounting frames 419
7.2.1.2 Social protection statistics 425
7.2.2 Planning instruments 429
7.2.3 Analytical and performance-monitoring instruments 436
7.2.3.1 Scheme-based performance indicators 439
7.2.3.2 Expenditure and performance reviews 447
7.3 Summary 464
Annex 7-A1 A scheme-based set of performance indicators 468
xi
Contents

Conclusion 489
Issue Brief 1 HIV/AIDS: Managing the financial consequences ofa pandemic in a developing country context 495
1. Introduction 495
2. Presentation of Afroland 496
3. Demographic impact 497
4. Economic impact 499
5. Impact of HIV/AIDS on social protection programmes 503
6. Social budget 512
7. Impact of HIV/AIDS on government budget 514
8. Conclusion 516
Annex IB1-A1 Description of the main economic assumptionsused for projections 518
Annex IB1-A2 Impact of HIV/AIDS on defined-contributionschemes 521
Issue Brief 2 Migration and higher labour force participation as factors insocial protection financing: Policy choices in ageing societies 523
1. Introduction and objective 523
2. Demographic context 524
3. Methodological approach 526
4. Results of labour force and economic projections 528
5. Effects on pension scheme financing 532
6. Policy conclusions 538
Statistical Annex IB2-A1 540
Issue Brief 3 The number cruncher’s survival kit 548
1. Basic budgeting techniques 548
2. Calculation of balances and reserves 550
3. Calculation of contribution rates 550
Issue Brief 4 Financial markets: Organization and main instruments 552
1. Primary markets 553
2. Secondary markets 557
3. Debt markets 558
4. Equity markets 560
5. Money markets 561
6. Capital markets 562
Exercise Annex Demoland: A compendium of practical exercises 563
Glossary of terms 609
Bibliography 622
Index 643
xii
Contents

List of tables
1.1 Transfers in formal social protection 19
1.2 Needs covered by and functions of an NSPS 21
1.3 Functional/institutional matrix of expenditure of the NSPSin Lithuania, 1998 26
1.4 Financing matrix for the NSPS in Lithuania, 1998 27
1.5 Measuring the efficiency of two alternative transfers 37
1.6 Effect of earnings, capital income, transfers and taxes onGini coefficients, selected OECD countries, mid-1990s 39
1-A1.1 Classification of social protection functions 56
2.1 Social security expenditure by region and major function,mid-1990s 62
2.2 Summary of demographic and economic assumptions formodel projections 76
2.3 Estimated trends of social expenditure for OECD countries,1980–2050 79
2.4 Estimated trends of social expenditure for Central andEastern Europe, 1993–2050 80
2.5 Rate of demographic ageing, population aged over 60 andover 80, 1950–2050 87
2.6 Velocity of ageing 88
2.7 Effective retirement age worldwide, 1950–90 91
2.8 Inactivity ratio worldwide, 1950–90 92
2-A1.1 Total social expenditure by major function, mid-1970s tomid-1990s 103
3.1 Unemployment and long-term unemployment, selected countries,1990–2000 126
3.2 Trends in earnings dispersion, selected countries, 1985–95 127
3.3 Unemployment by educational attainment for persons aged25–64, selected countries, 1990s 128
3.4 Earnings mobility, selected countries, 1986–91 129
3.5 Gross and net public social expenditure, selected countries, 1997 141
3.6 Poverty rates, socio-economic status and household situation,selected countries, 1990s 144
3.7 Short-term and long-term poverty, selected countries, mid-1990s 145
3.8 Income redistribution, selected countries, 1990s 145
3.9 Generational accounts for two groups (age 25 and age 65),selected countries, 1995 165
3.10 Average effective tax rates, selected OECD countries, 1980–97 170
3.11 Average annual changes in AETRs, selected OECD countries 171
4.1 Combinations of types of social protection benefit delivery andfinancing in selected national social protection arrangements 183
xiii
List of tables

4.2 Simplified central government accounts, selected countries,mid-1990s 188
4.3 Estimated total tax and private social security revenues in selectedOECD countries, 2000 200
4.4 Social protection coverage map, Thailand, late 1990s 208
4.5 Aggregated social budget, Thailand, 1990–98 210
5.1 Factors affecting the financial equilibrium of a social protectionscheme 222
5.2 Independence of financing methods and benefit formulae 228
5.3 Current contribution rates in selected national social securitypension schemes 233
5.4 International overview of applied financing systems 241
5.5 The public-private mix in health financing, selectedcountries, 1997 246
5.6 The menu of health financing instruments 248
5.7 Types of contributions 278
5.8 Guaranteed minimum income, selected Europeancountries, 1998–2000 304
5.9 Composition of benefits and receipts of three classical types ofwelfare state in Europe, 1998 308
5.10 Administrative determinants of social assistance expenditure atgiven objective poverty levels 309
5.11 Structure of an alternative social protection system with a basicincome 310
5.12 Countries in need of global social transfers 318
5-A1.1 Base Case and sensitivity test results of the financialdevelopment of a typical African pension scheme, 1992–2057 328
6.1 Rate of return of selected investment funds, 1993–98 348
6.2 Risk-return development of alternative portfolio compositions 352
6.3 Balance sheet of company XYZ, 31 December 2000 362
6.4 Effect of ROE and plowback rate on dividend growth andthe P/E ratio 365
6.5 Bond present value at different interest rates 368
6.6 Long-term private sector debt issuances by type of economy,1980–95 380
6.7 Equity issuances by type of economy, 1980–95 381
6.8 Areas of remaining major reform backlog 384
7.1 Hierarchy of quantitative governance instruments 419
7.2 OECD social indicators 427
7.3 The ILO’s suggested set of decent work indicators 428
7.4 Performance indicators for social security schemes 440
7.5 Pension replacement rates in selected NSPSs 443
7.6 Administrative cost in national pension schemes or providentfunds, selected countries, early 1990s 444
xiv
List of tables

7.7 Matrix of coverage: An example 454
IB1.1 Assumed future GDP growth for Afroland, 2000–49 502
IB1.2 Required contribution rates, Afroland, 2000–50 509
IB1.3 Projected health care expenditure, Afroland, 2000–15 510
IB1.4 Unemployment rates, Afroland, 2000–15 510
IB1.5 Afroland’s Social Budget, 2000–15 (without HIV/AIDS) 512
IB1.6 Afroland’s Social Budget, 2000–15 (with HIV/AIDS) 513
IB1.7 Government budget, Afroland, 2000 and 2015 515
IB1-A2.1 Accumulated contributions in a DC scheme 521
IB2-A1.1 Historical structural economic data, EU-15, 1991–2000 540
IB2-A1.2 Results of two basic demographic scenarios, EU-15, 2000–50 541
IB2-A1.3 Main results of the economic scenarios, EU-15, 2000–50 542
IB2-A1.4 Results of projections for the PAYG pension scheme underthe two migration scenarios, EU-15, 2000–50 543
IB2-A1.5 Projected pension cost of the newly introduced MRS system,EU-15, 2000–50 (no migration scenario) 544
IB2-A1.6 Projected pension cost of the newly introduced MRS system,EU-15, 2000–50 (migration scenario) 546
IB4.1 Treasury coupon securities auctioned by month 556
IB4.2 Initial public offerings (IPOs) in continental Western Europe,1997–98 557
IB4.3 List of stock exchanges worldwide, 2001 559
T1.1 Demoland’s Social Budget (in million CU): Functionalsummary, 2000–10 568
T1.2 Demoland’s Social Budget (in % of GDP): Functionalsummary, 2000–10 570
T1.3 List of drivers for expenditure and revenues 571
T2.1 Main economic arguments for and against extensivewelfare states 575
T3.1 A social assistance scheme to close the income gap, option 1 579
T3.2 A social assistance scheme to close the income gap, option 2 580
T4.1 Projected government revenue and projected increase with theintroduction of a social assistance scheme, 2000–20 583
T4.2 Projected government expenditure and projected increase withthe introduction of a social assistance scheme, 2000–20 584
T5.1 Expected results for the current public sector scheme,2000–20 587
T5.2 Numbers of beneficiaries, other pensioners, 2000–20 588
T5.3 Benefit levels and expenditure in a universal pensionscheme, 2000–20 589
T5.4 Calculation of contribution base, 2000–20 590
T5.5 Additional cost to the government, 2000–20 591
T6.1 Assumed staff to non-staff cost ratios in different categoriesof care 595
xv
List of tables

T6.2 Assumed initial per capita cost in different categories ofcare, 2000 595
T6.3 Estimated future financial development of a social healthinsurance for the private sector, Demoland, 2000–20 596
List of box tables
1.3.1 Assumed rates of employment growth for model calculations 42
1.3.2 Estimated percentage of total income transferred to inactives 43
1.4.1 Cost of national social protection: Model calculations 48
3.2.1 Selected economic growth and labour market performancestatistics 123
3.2.2 Selected statistics on public finances, 1984–2000 123
3.4.1 Effects of the EITC on participation and number of hours worked 137
4.1.1 Net cash transfers between the government budget and theCyprus Social Insurance Fund, 1988–97 186
4.2.1 Chile: Social pension deficit, 1981–2000 190
4.4.1 Total estimated health expenditure in Ghana, 2003 213
4.4.2 Simulation health insurance, Ghana 214
5.1.1 Results of a random number experiment 224
5.3.1 CSG tax base, 1993 235
5.3.2 Evolution of CSG rates since 1991 235
5.3.3 Revenues generated by the CSG since 1991 236
5.3.4 Relative importance of the CSG versus income tax 236
5.4.1 Contribution financing versus tax financing of statutorypension schemes: A policy checklist 237
5.13.1 Stylized development of funded and unfunded pension schemes 288
5.14.1 Poverty and extreme poverty estimates for theRussian Federation 306
5.16.1 Crude model calculation of the cost of basic income benefitsin a standard country of Central and Eastern Europe 314
5.17.1 Volume of daily foreign exchange transactions 320
5.17.2 Distribution of transactions by currency 320
5.17.3 Geographical distribution of transactions 321
6.5.1 Market capitalization and volume of trade, Bulgaria, 1990s 386
7.5.1 Model calculations for aggregate social protection indices 461
xvi
List of tables

List of figures
I.1 Hierarchy of volumes in the Quantitative Methods in SocialProtection Series 7
I.2 Reader’s guide through the book 8
1.1 Social protection transforms ethical norms into transfers 15
1.2 Shift from interfamily to government transfers, UnitedStates, 1935–80 17
1.3 Basic flow of funds in an NSPS 23
1.4 Financial architecture of an NSPS (Germany, 1998) 24
1.5 Three typical Lorenz curves 31
1.6 The poverty gap 34
1.7 Reducing the inequality gap by closing the poverty gap 36
1.8 Pre-tax and pre-transfer versus post-tax and post-transfer povertyrates, selected OECD countries, mid-1990s 38
1.9 Estimated total transfers and their composition, selected regions,early 1990s 45
2.1 Social protection expenditure in Europe, mid-1990s 63
2.2 Social protection expenditure ratio to GDP and GDPper capita in Europe 64
2.3 Social protection expenditure ratio to government expenditureper capita 64
2.4 Total social expenditure developments, selected Europeancountries 69
2.5 Social benefits by function, EU Member States, 2000 73
2.6 Structure of social expenditure in selected Europeancountries, 2000 74
2.7 Determinants of total social expenditure 83
2.8 Velocity of demographic ageing, population aged 60 and over 88
2.9 Youth, old-age and total dependency ratios, 1950–2050 89
3.1 Principal interrelationships between the economy and NSPSs 107
3.2 Prosperity and social protection 108
3.3 Deadweight loss of taxation 116
3.4 Net social assistance and net average earnings relative to net lowwage, selected countries, 1995 133
3.5 Net retained income for a couple with two children, selectedcountries, 1995 135
3.6 Trade-off between the incentive to accept a low-paid joband the incentive to move from part-time to full-time work,selected countries, 1997 138
3.7 Total net social expenditure, selected countries, 1997 142
3.8 Composition of gross income of couples in retirement and theincome tiers, selected countries, mid-1990s 146
xvii
List of figures

3.9 Income distribution of older couples, selected countries,mid-1990s 147
4.1 Potential pension deficit, OECD, 1990–2050 197
4.2 Estimated potential implicit pension debt, selectedcountries, 1990 197
4.3 Consolidated potential pension deficit, OECD, 1990–2050 198
5.1 Stylized demographics of the first decades of a pension scheme:From inception to maturity 266
5.2 The first decades of a pension scheme: Typical cost development 266
5.3 Typical developments of alternative types of contribution rates 281
6.1 Factor markets, GDP, fixed and financial assets 336
6.2 Fixed assets and financial markets 341
6.3 Organization of an investment department 343
6.4 Risk-return development of alternative portfolio compositions 353
6.5 Impact of the time horizon on the rate of return of differentportfolios 356
6.6 FTSE, DAX, Nikkei historical data 361
6.7 Convexity axiom on bond present value versus marketinterest rate 368
7.1 Total health expenditure, selected countries, 1997 457
7.2 Disability-adjusted life years per percentage point of GDPspent on health care, selected countries, 1997 458
IB1.1 Mortality rates for Afroland, 2010 498
IB1.2 Projected life expectancy for men in Afroland, 2000–50 498
IB1.3 Population pyramids, Afroland, 2000–50 500
IB1.4 Projected GDP per capita for Afroland and a southern Europeancountry, 2000–2110 503
IB1.5 Projected number of old-age pensioners for the Afrolandscheme, 2000–50 504
IB1.6 Projected number of invalidity pensioners for the Afrolandscheme, 2000–50 505
IB1.7 Projected number of widows for the Afroland scheme, 2000–50 506
IB1.8 Projected number of orphans for the Afroland scheme, 2000–50 506
IB1.9 PAYG cost of the Afroland scheme under various scenarios 508
IB1.10 Projection of social expenditure, Afroland, 2000–15 (withoutHIV/AIDS) 514
IB1.11 Projection of social expenditure, Afroland, 2000–15 (withHIV/AIDS) 514
IB2.1 Expected development of demographic dependency ratio,EU-15, 2000–50 525
IB2.2 Demographic results, static projection, EU-15, 2000–50 529
IB2.3 Total population under the different scenarios and dynamic effect,EU-15, 2000–50 530
xviii
List of figures

IB2.4 Total population under status quo and variant 1 with and withoutthe effect of alternative labour force participation rates,EU-15, 2000–50 531
IB2.5 Evolution of replacement rates in MRS scheme under increasinglife expectancy and different real rate of returns, EU-15, 2000–50 533
IB2.6 Projected PAYG cost ratios and GDP cost ratios of‘‘parametrically reformed’’ PAYG pension schemes,EU-15, 2000–50 535
IB2.7 Projected development of rates of return in the reformed pensionscheme under alternative assumptions, EU-15, 2000–49 536
IB2.8 Projected pension expenditure under alternative scenarios,EU-15, 2001–49 537
IB2.9 Development of transition cost, EU-15, 2000–50 538
IB4.1 Synopsis of financial market classifications 553
T7.1 Suggested investment portfolio mix for Demoland’s pensionscheme 600
List of box figures
2.1.1 Typical SEM curves at different levels of coefficient p 72
2.2.1 System dependency ratios, selected countries, 1985–96 84
2.2.2 Changes in benefit dependency ratios and old-age dependencyratios, selected countries, 1985–96 85
2.3.1 Long-term development of demographic dependency ratios,Euroland, 1995–2115 94
2.3.2 Long-term development of old-age system dependency ratios,Euroland, 1995–2115 95
2.4.1 Relation between social expenditure as % of GDP and GDPper capita, selected countries, 1992 98
3.2.1 Benefit recipients, Netherlands and Sweden, 1989–95 124
3.4.1 Earned Income Tax Credit (EITC) 136
4.3.1 Target national tax ratios versus de facto tax revenues(a modified Laffer curve) 205
4.3.2 Simplified simultaneous Laffer curves for contributions andtaxes in a model society 206
5.7.1 Theoretical contribution rates in micro-insurance schemes 255
5.8.1 Composition of public social expenditure in selected countries,mid-1990s 259
5.8.2 A crude efficiency indicator for national health care schemesin selected countries, mid-1990s 260
5.9.1 Structural relationships in a reinsurance proposal for the privatehealth insurance schemes in the Bahamas 263
7.3.1 Social revenue ratio, Panama, 1990–2050 431
xix
List of figures

7.3.2 Social expenditure ratio, Panama, 1990–2050 432
7.3.3 Balance of the social budget, Panama, 1990–2050 433
7.3.4 Development of the IVM reserve, Panama, 1990–2050 434
7.4.1 Elderly population at risk of poverty, EU, late 1990s 449
7.4.2 Employment rates among older workers, EU, mid-2001 450
List of boxes
I.1 Contingencies, risks and risk management: An introductionto the terminology 3
1.1 Insurance benefits as income transfers 13
1.2 From institutional accounts to a social accounting system andsocial budgeting 28
1.3 Calculating and projecting total social transfer ratios 42
1.4 Quantifying a minimum level of social protection expenditurein a transition country 47
2.1 Typical maturation pattern in social protection expenditure 71
2.2 Demographic dependency versus system dependency in OECDpension schemes 84
2.3 Is there an ageing crisis in Europe? 93
2.4 GDP and social expenditure: Does one have to be rich to share? 97
3.1 The political economy of welfare state reforms 112
3.2 The welfare state in Germany, the Netherlands and Sweden:Different track records 122
3.3 Turning conventional wisdom upside down: Another viewof the interactive mechanics of the welfare state 131
3.4 Effect of the EITC on labour participation in the United States 136
4.1 Links between government budget and the Cyprus SocialInsurance Fund 185
4.2 Long-term financial commitment to a privatized pension scheme:The case of Chile 189
4.3 The tax and contribution maximization problem 204
4.4 Ghana’s health insurance plan: Attempting to mobilize resourcesfor universal coverage 211
5.1 Does the size of the risk pool influence the stability ofbenefit experience? 224
5.2 Defined-benefit and defined-contribution schemes:A terminological excursion 229
5.3 A hybrid form of social protection financing: The case ofthe contribution sociale generalisee (CSG) in France 234
5.4 Tax versus contribution financing of mandatory pension schemes 237
5.5 Basic characteristics of the health care market 243
xx
List of box figures

5.6 Costing health care schemes: A summary of calculationtechniques 250
5.7 Systemic financial disequilibrium of a typical smallcommunity-based health insurance scheme 254
5.8 The new hybrid health care financing system in China 259
5.9 A social reinsurance arrangement for the private insurance systemin the Bahamas 262
5.10 Two basic indicators and a rule of thumb for pension expenditure 264
5.11 Broadening the contribution base: Is ‘‘machine tax’’ the answer? 273
5.12 Summary of actuarial formulae for main contribution systems 279
5.13 The ‘‘funding versus PAYG’’ debate in pension financing 282
5.14 Poverty and the financial crisis in the Russian Federation 305
5.15 Discussing the pros and cons of a universal basic income 311
5.16 Rough calculations on the financial impact of the introductionof a basic income in a Central and Eastern European country 313
5.17 The Tobin tax 319
6.1 Financial market: A definition 332
6.2 How financial market investment affects pension payments 354
6.3 Basic actuarial rate-of-return benchmarks 358
6.4 Pension fund for municipal employees: The example of Denmark 370
6.5 Establishing a fully funded second-tier pension in a countrywith underdeveloped financial markets: The case of Bulgaria 386
7.1 An accounting framework and financial reporting for a nationalsocial insurance scheme 420
7.2 Definition of a national social accounting system 424
7.3 Results of an actuarial valuation and social budget exercisefor Panama 430
7.4 Indicators in the ‘‘Open Method of Coordination’’ within theEuropean Union 448
7.5 Sample calculations of aggregate national effectiveness andefficiency indicators for social protection systems 460
7-A1.1 Scheme-based performance indicators: Examples 475
IB4.1 Debt instruments and equity claims 554
IB4.2 Money stocks 561
xxi
List of figures


ACKNOWLEDGEMENTS
As always, a book of this scope is necessarily a result of team work. In additionto the authors who have contributed at least one chapter to the volume, a numberof other people have given valuable input and support to the whole endeavour.By and large, all those who have served as staff members or experts in the ILO’sInternational Financial and Actuarial Service (ILO FACTS) during the past tenyears have helped to build up the knowledge base and the experience that arereflected in this book in one form or another. Thanks are due to MargaretAntosik, Christina Behrendt, Gylles Binet (Quebec), Anne Drouin, MelanieGlenat (Paris), Kenichi Hirose (Manila), Rudiger Knop (Konigswinter), PascaleLapierre (Cologne), Denis Latulippe and Martin Bernard (Quebec), FlorianLeger, Ana Maria Mendez, Mariko Ouchi, Karuna Pal, Jose Tossa, DianeVergnaud, Axel Weber (Manila), and Hiroshi Yamabana (Bangkok).
Warren McGillivray, former Chief of ILO FACTS, has laid many of thefoundations on which the current volume is based. Karuna Pal and DenisLatulippe contributed some of the model calculations in Chapter 2, and furthercollaboration on that chapter and on Chapter 6 was provided by Anne Richter.Issue Brief 2 on migration and ageing was co-authored by Michael Cichon,Rudiger Knop, Florian Leger, Krzysztof Hagemejer and Wolfgang Scholz.Chris de Neubourg made substantial contributions to Chapter 4. Some of thebase data were provided by Jose Tossa and Diane Vergnaud.
The whole 2002–2003 class of the joint ILO/Maastricht University Mastersprogramme in Social Protection Financing (Bina Patel, Oleysis Zan, NeilTagoe, Hao Yu, Mirta Muniz, Santi Singagerda, Shuyan Geng, AnthonyDewees, Walaiporn Patcharananamurol, Hongyang Tang, James Maiza,Yollard Kachinda, Qian Ma, Agnieska Sowa, Rao Pocjampally, RichardRamoutar, Charles Che Fumunjere, Hendrawati Marbun, Lina Salanauskaite,Benjamin Redd II, Mira Koshkimbayeva) was drafted in as co-authors,collaborating notably on model solutions in the Exercise Annex. The Annexwas edited and all model solutions were meticulously checked by ChristinaBehrendt, who also contributed one box in Chapter 7. Karuna Pal, RudigerKnop and Anna and Krzysztof Hagemejer helped to put the Demoland case data
xxiii

and files together. Florian Leger contributed two boxes in Chapter 5, whileJorge Mastrangelo provided input for Chapter 7. The bibliography wascompiled by Diane Vergnaud and Karuna Pal.
Alejandro Bonilla Garcia (ILO), Markus Haacker (International MonetaryFund), Warren McGillivray (ISSA), Chris de Neubourg (Maastricht University)and Axel Weber (Asian Development Bank) were generous with their time inreviewing the draft version of the book; their valuable comments andsuggestions led to substantial revision and improvement of the text.
Michael Cichon and Chris de Neuborg, as well as Ksenija Radojevic Bovetand Karuna Pal, edited and re-edited the text at different stages of itsdevelopment in order to turn it into a coherent whole. Dalmer Hoskins(Secretary General, ISSA) and Assane Diop (Executive Director, SocialProtection Sector, ILO) gave their unstinting support to the project frombeginning to end.
It goes without saying that any errors and mistakes in the book remain theexclusive responsibility of the authors.
The authorsGeneva, The Hague, Quebec City, Santiago de Chile
Autumn 2003
xxiv
Acknowledgements

ABOUT THE AUTHORS
Michael Cichon holds a Masters degree in Pure and Applied Mathematics(Technical University, Aachen, Germany), a Masters degree in PublicAdministration (Harvard University) and a Ph.D. in Economics with aspecialization in health economics (University of Gottingen, Germany). He isa member of the German Actuarial Association (DAV), and worked in thePlanning Department of the German Ministry of Labour and Social Affairs inBonn as an actuary for eight years before joining the Social SecurityDepartment of the ILO in 1986 as senior actuary and health economist.Between 1992 and 1995 he served as social security specialist on the ILOadvisory team for Central and Eastern Europe in Budapest and provided socialprotection policy advice to governments and social partners in Central andEastern Europe. Since 1995 he has been Chief of the Financial, Actuarial andStatistical Services Branch of the ILO’s Social Protection Sector and is incharge of the Quantitative Textbook Project. He writes on financial andeconomic issues related to social security, with occasional excursions intogovernance and, increasingly, the global financing of social protection. He hasundertaken and supervised technical cooperation assignments in socialprotection in over 30 ILO member countries worldwide.
Wolfgang Scholz holds a Masters degree in Economics (University of Bonn,Germany). From 1978 to 1994 he held different posts in the PlanningDepartment of the German Ministry of Labour and Social Affairs, Bonn;ultimately he was head of the Ministry’s Social Budget Division. In 1984 heinitiated the development of a macro-econometric projection and simulationmodel, mapping the German social protection system, and was later responsiblefor the model’s routine application in policy advice. In 1985 he worked for theGerman Permanent Representation to the European Commission, Brussels, andin 1986 joined the Department of Health and Social Security, London, for sixmonths. After 1986 he supervised the Ministry’s feasibility study on a satellitesystem to the national accounts of the German health sector. During Germanreunification, 1989 to 1992, he was involved especially in shaping national
xxv

wage and employment policies aimed at achieving an economically and legallycoherent merger of the two different German social protection systems. Since1994 he has been seconded to the ILO, Geneva, in order to support its SocialSecurity Department. In this capacity he has contributed to short- and long-termfinancial evaluations of the social protection systems of several ILO memberStates, notably Bulgaria (1996–98), Cyprus (1999), Latvia (1995), Panama(1997–98), Thailand (1998) and Turkey (1995–96). In 1991 he was appointedlecturer on social policy at the Social Academy of the City of Dortmund(Germany), a post he held until 1995. He has published articles oninterdependencies between social protection systems, public finance, labourmarkets and macroeconomic developments.
Arthur van de Meerendonk holds Masters degrees in Economics and inPhilosophy, both from Tilburg University (Netherlands). From 1990 to 1995 heworked in the Planning Department of the Dutch Ministry of Health, where heparticipated in the first round of major national health insurance reforms. In1995 he moved to the Ministry of Social Affairs and Employment, servinginitially at the Economic Policy Directorate and currently at the Directorate forGeneral Labour Market Policy. He coordinated a comparative welfare statereview project, and was the Minister’s representative on one of two high-levelcommittees that formulated proposals to reduce the influx of claimants in theDutch disability insurance scheme. At present he is coordinating theestablishment of a private market for reintegration services in the Netherlands.For the ILO, he has contributed to social budget modelling projects in Chinaand Egypt, and conducted a project on housing schemes in Sri Lanka. He haspublished articles on the welfare state and economic performance, tax andbenefit systems, pension schemes, and issues on governance and the marketmechanism in social security.
Krzysztof Hagemejer holds a Masters degree in Econometrics and a Ph.D. inEconomics, both from Warsaw University, Poland. Before joining the SocialSecurity Department of the ILO in 1993 as a policy analyst, he worked asassistant professor at the Department of Economics of Warsaw University andadviser to the Polish Minister of Labour and Social Affairs. During the period1993–95 he was involved in social protection economic and financial modellingexercises in Bulgaria, Slovakia, Thailand and Turkey. Between 1995 and 1998he served as social security specialist in the ILO advisory team for Central andEastern Europe in Budapest, with responsibility for social security projects inthe region, including social budget modelling projects in Lithuania, Poland,Slovakia and Ukraine. Since late 1998 he has served as senior social securitystatistician in the Financial, Actuarial and Statistical Services Branch of theILO’s Social Security Department, with responsibilities covering the ILOInternational Inquiry into the Cost of Social Security, social protection
xxvi
About the authors

accounting and budgeting. He writes on various economic issues in socialsecurity, particularly on problems related to the transition countries of Centraland Eastern Europe.
Fabio Bertranou holds a Masters degree in Economics (GeorgetownUniversity) and a Ph.D. in Economics (University of Pittsburgh). His fieldsof specialization are social security, pensions, health economics and publicfinance. Since 2001 he has served as senior social security specialist at the ILOoffice in Santiago (Chile), conducting technical cooperation projects inArgentina, Brazil, Chile, Paraguay and Uruguay. Before joining the ILO, hewas assistant professor at the Department of Economics of the UniversidadNacional de Cuyo (Argentina) and professor of comparative social policy at thePublic Policy Masters programme offered by the Universidad Nacional de SanMartın (Buenos Aires) and Georgetown University. He has also worked asconsultant for the World Bank, the United Nations Economic Commission forLatin America and the Caribbean (ECLAC) and other public and non-governmental institutions. He has published articles and books on socialsecurity, pensions and health care reforms in Latin America.
Pierre Plamondon is a Fellow of the Canadian Institute of Actuaries (FCIA)and of the Society of Actuaries (FSA). After acquiring experience in aninsurance company and an actuarial consultancy group in Quebec, he joined theQuebec Pension Commission in 1985, where he was Chief of the ValuationDepartment between 1990 and 1998. In that capacity he had responsibility forthe actuarial valuation of the Quebec Pension Plan, the publication of officialstatistics for the scheme and the technical support for the development ofsupplemental (occupational) pension plans in Quebec. In 1998 he joined theFinancial, Actuarial and Statistical Services Branch of the ILO’s SocialSecurity Department as actuarial coordinator. He has carried out variousactuarial assignments for the ILO in Barbados, Bulgaria, Burkina Faso, Coted’Ivoire, Cyprus, Guyana, and Trinidad and Tobago. He has also coordinated astudy on the investment of social security reserves and initiated thedevelopment of a model for the projection of national populations in thecontext of HIV/AIDS.
About the authors
xxvii


LIST OF ABBREVIATIONS AND ACRONYMS
AETRs Average Effective Tax Rates
AFP Administradoras de Fondos de Pensiones (Privatepension fund management company, Chile)
AIDS Acquired Immune Deficiency Syndrome
AIMR Association for Investment Management and Research
BI Basic Income
BIEN Basic Income European Network
CI Citizen’s income
CIS Commonwealth of Independent States
CPI Consumer Price Index
CSG Contribution sociale generalisee (General socialcontribution, France)
CSS Caja de Seguro Social (Social security fund, Panama)
CU Currency Unit
DALE Disability-adjusted life expectancy
DB Defined-benefit scheme
DC Defined-contribution scheme
DDM Dividend Discount Model
DSS Department of Social Security (United Kingdom)
DWP Department for Work and Pensions (United Kingdom)
EBRD European Bank for Reconstruction and Development
xxix

ECU European Currency Unit
EITC Earned Income Tax Credit (United States)
EMS European Monetary System
EMU European Monetary Union
ESSPROS European System of Integrated Social ProtectionStatistics
ESTEEM ILO Employment and Social Transition ExpenditureModel
EU European Union
EUROSTAT Statistical Office of the European Communities
GAD Government Actuary’s Department (United Kingdom)
GAP General average premium
GDP Gross domestic product
HIV Human Immunodeficiency Virus
IBRD International Bank for Reconstruction and Develop-ment
IFC International Finance Corporation
ILO International Labour Office/Organization
ILO FACTS International Financial and Actuarial Service of theILO
IMA Individual Medical Account (China)
IMF International Monetary Fund
IPO Initial public offering
ISIC International Standard Industry Classification of AllEconomic Activities
ISSA International Social Security Association
IVM Invalidez, vejez y muerte (‘‘Disability, old age anddeath’’ pensions programme, Panama)
LIS Luxembourg Income Study
METR Median Effective Tax Rate
MHO Mutual Health Organization
xxx
List of abbreviations and acronyms

MRS Mandatory Retirement Savings
NAO National Audit Office (United Kingdom)
NDC Notional defined-contribution scheme
NEI Netherlands Economic Institute
NHAs National Health Accounts
NHIS National Health Insurance System
NHS National Health Service (United Kingdom)
NIB National Insurance Board (Bahamas)
NRI Net retained income
NSPS National Social Protection System
NYSE New York Stock Exchange
OASDI Old Age, Survivors, and Disability Insurance (UnitedStates)
OECD Organisation for Economic Co-operation and Develop-ment
OTC Over the counter
PAYG Pay-as-you-go
PPP Purchasing Power Parity
PRSP Poverty Reduction Strategy Papers
ROE Return on equity
SAIL Social assistance intervention line
SAS Social Accounting System
SCP Sociaal en Cultureel Planbureau (Social and CulturalPlanning Office of the Netherlands)
SEM Social expenditure maturation
SER Social expenditure ratio
SHI Social Health Insurance (Ghana)
SNA System of National Accounts
SPER Social Protection Expenditure and Performance Review
SPIs Scheme-based performance indicators
List of abbreviations and acronyms
xxxi

SRI Socially responsible investment
SSA Social Security Administration (United States)
SSAC Social Security Advisory Committee (United Kingdom)
SSNIT Social Security and National Insurance Trust
SZW Ministerie van Sociale Zaken en Werkgelenheid(Ministry of Social Affairs and Employment,The Netherlands)
UI Unemployment insurance
UNDP United Nations Development Programme
UNICEF United Nations Children’s Fund
VAC Value added contribution
VAT Value added tax
WHO World Health Organization
List of abbreviations and acronyms
xxxii

INTRODUCTION
Before turning to the substantive debate on the financing of social protection,we should say a few words about the purpose of the latest addition to theQuantitative Methods series. In short, this book seeks to help social protectionplanners, managers and analysts to design and operate social protectionfinancing systems that are effective and equitable as well as being fiscally,financially and economically efficient. Effective financing systems ensure thatbenefit promises are reasonable and can be kept. Aiming for equity means thatthe burden of financing social protection is shared fairly among populationgroups and generations. Aiming for financial, fiscal and economic efficiencymeans making sure that no societal resources are wasted – and thus no welfarelosses incurred – when financing systems are designed or operated. But beforeexploring those targets in more detail, we have to find our way through themaze of definitions connected with the notions of social protection and socialsecurity.
Definitional context and limitations
For the purpose of this book, a pragmatic stance was adopted regarding thedefinition of social protection. When dealing with social protection financing, itsuffices to define social protection as all income transfers (or benefits) in kindand in cash that a society affords to its individual members in order to:
. avoid or alleviate poverty; or
. assist them in coping with a series of life contingencies or risks which, ifthey occurred, might otherwise lead to a loss of income. Loss of income canbe the result of losing one’s job, losing one’s earnings capacity throughinvalidity or old age, or even having to obtain expensive medical care in theevent of illness or impairment; or
. reduce or correct inequalities created through the primary (pre-transfer)income distribution.
One of our reviewers rightly observed that this is a somewhat narrow, evenminimalist, definition. Admittedly, it delineates rather narrow boundaries, butthis is a technical textbook on the financing techniques for certain transfers andthe avoidance of negative economic and fiscal consequences, not a policy bookthat defends and defines the extent, role and raison d’etre of social protection in
1

decent societies. The latter aim would be far beyond the scope of this volume,which is one in a series of technical textbooks on social protection. A wealth ofconceptual work is being conducted on the proper role of social protection insocieties. Bonilla Garcia and Gruat (2003) of the ILO stress the role of socialprotection benefits as investments in the development of societies. They seesocial protection as having three key objectives: guaranteeing access toessential goods and services, promoting active socio-economic security, andfurthering individual and social potentials for poverty reduction and sustainabledevelopment. Our book confines itself to addressing some of the planning ormanagerial challenges that are posed by that or other similar definitions: theeffective and efficient delivery of transfers that a society has agreed to afford toits members.
In the narrow definition used here, social protection is not concerned withthe avoidance or reduction of risks, either; instead, it focuses on helpingsocieties to organize the financing of the mechanisms that help people tomitigate or cope with risks. In the classical sequence of risk management,namely risk identification, risk prevention or risk reduction, risk mitigation andrisk coping, we are dealing only with the last two aspects. In a recentconceptual development, the World Bank (2001a) placed all social protectionmeasures in the wider context of ‘‘social risk management’’, which includesmechanisms at the individual, community or national level that avoid, reduceand mitigate the risk of falling into poverty or suffering a substantial loss ofincome. Box I.1 attempts to dispel the definitional uncertainty that surroundsthese terms.
It is obvious that the World Bank focus on risk management aims tominimize the income equalization effect of social transfers, while the ILOstresses transfers as an investment in development (inter alia through thefostering of social peace) and hence goes beyond the relatively narrow focusof minimizing the risk of falling into poverty or losing substantial parts ofone’s income.
We focus on social protection in the form of transfers in cash and in kindassuming that the individual, the community or the country in question havedone all they could outside social protection mechanisms to avoid and reducerisks – as every prudent individual, family, community or society should. Wealso assume that the transfers that we are dealing with are in keeping with rolesthat the life cycle model or any other model of social protection has assigned tothem in a given society. The techniques developed here for an effective andefficient management of social transfers are essential tools of good governanceunder any model of social protection adopted by a society.
In any society, social transfers account for a substantial part of nationalincome. Depending on their stage of economic development, societies redistributebetween 5 per cent (in developing countries) and 35 per cent (in OECD countries)of their gross domestic product (GDP) through the formal social protectionsystem. According to ILO estimates, this amounts to some US$5,000 billion
2
Financing social protection

annually. However, societies also transfer income through informal arrangementswithin and between households (transfers between individuals, within familiesand in communities, and so on). Taken together, formal and informal transfersmay represent as much as 40 per cent of GDP worldwide: in other words, some
Box I.1 Contingencies, risks and risk management: An introduction
to the terminology
Contingencies are events that might or might not occur (having anaccident or winning the lottery, for example). Risks are contingencies thatare perceived as having a negative effect on individuals, groups orsocieties or even more complex entities, such as the environment. If theprobability of a certain risk occurring is known or can be calculated, thenan important necessary condition for it being considered an insurable riskis fulfilled. In certain cases, however, even if the probability of occurrenceis known the potential damage may be so big that the risk may not beinsurable (for example, an environmental disaster triggered by a defectivenuclear reactor). For an insurable risk it is possible to calculate a premiumthat a policy holder has to pay to an insurer, allowing the latter to pay outa certain amount of money, without going bankrupt, should the riskaccrue to the insured person.
You are exposed to a risk if a certain event can occur and affect youwith a certain degree of probability, for instance living in an environmentwhere a certain illness can be contracted. If you move to a country wherethat particular illness does not exist, you are no longer exposed. You arevulnerable to a certain risk if you have no means of coping with theconsequences of that risk once it has occurred (for example, not being ableto afford medical care that can help you to become healthy again). Socialprotection in the narrow technical sense used here does not help you toavoid risks (except for what can be done through accident or illnessprevention) but it makes you less vulnerable to the financial consequencesshould these risks materialize. It thus provides some social security.
Not all risks are unforeseeable and beyond our control. For example,the probability of contracting a certain illness can be reduced by health-conscious behaviour, the unemployment risk by moving to a regionwhere your skills are in greater demand, and your family’s exposure bysending them out of a country that is beset by political unrest or poorhealth conditions. This is risk reduction, avoidance or prevention. If youare paying insurance contributions that entitle you to a cash benefitshould a certain contingency occur, that would help to mitigate that risk. Ifyour society provides you with social assistance (i.e. targeted and means-tested) benefits should you really fall into poverty, they would help youcope with the risk. The whole portfolio of strategies and arrangementsranging from risk reduction, avoidance or prevention to risk mitigationand risk coping, and consisting of informal arrangements of the individualor the family, market-based arrangements and public provisions, is calledsocial risk management (see World Bank, 2001a).
3
Introduction

US$12,000 billion out of the world’s total GDP of about US$30,000 billion. Thatmeans that for every dollar that is earned in an economy, those who earned theincome in the first place have to transfer 40 cents’ worth of consumption toinactive or low-income members of the society. The overall level of socialtransfers in a society tells very little about the actual level of social protection.Total amounts of transfers or social expenditure consist of transfers that reachbeneficiaries in an efficient way and effectively achieve their purpose as well as acertain amount of waste.
The present work does not deal in detail with the way in which societiesdetermine or should determine the level of social protection. The scope andlevel of social protection that a society wants to afford to its members aredetermined to a large extent by its values, traditions and – according to BonillaGarcia and Gruat (2003) – development strategy, and much less by its economiccapacity (this will be discussed in Chapter 1). We are not taking moral orethical stances here, although we all have our opinions and articulate them inpolicy debates. In the context of this book, benefit levels are of concern to usonly if they create inefficiencies or fall below the benchmarks intended by asociety. This means that we would not argue about whether a pension shouldamount to 50 or 60 per cent of the reference wage as long as the pension as suchdoes not provide too many people at too early an age with an undesirable exitfrom the labour force, and the associated expenditure does not crowd out thefinancing of other benefits such as access to essential health care.
Our main concern is to help to make sure that benefit levels – oncedetermined by societal values – can be financed by sharing, or redistributing,income. If that cannot be done in the long run, then the particular system isdoomed to fail. In relative terms, the willingness to share income does notnecessarily depend on the level of income, but it depends to a critical extent onwhether the system is perceived to be efficient or not. Whatever its level ofwealth, a society can basically afford very high relative levels of socialexpenditure as long as its members are willing to finance such levels oftransfers through taxes or contributions. On the other hand, very few people arewilling to accept waste in public redistribution systems.
Objective
The objective of this volume is to provide readers with a methodologicaltoolbox that will:
. assist them in the policy process that determines the desirable levels andscope of social protection in a given country; and
. enable them to design and maintain a financing structure of national socialprotection systems that ensure an effective and efficient use of availableresources at the community, national and international level while supportinglong-term economic development.
4
Financing social protection

In practical terms, the book sets out to help financial analysts to answer arange of questions usually put to them by policy makers. Here is a list of typicalquestions, together with the indication of the chapters where tentative answerscan be found:
What level of expenditure do we have to expect as a society in the short,medium and long term if we introduce a certain benefit (or a set of benefits)of a certain level? (see Chapter 2)
What would be the likely effect of the system (or a new scheme or benefit)on economic performance and on the government budget? (see Chapters 3and 4)
How do we finance a certain overall level of social protection – in otherwords, how do we make sure that resources are available when benefits fall dueor when a certain new benefit is introduced? Do we finance transfers throughtaxes? contributions? private payments? Who should be paying for what in thesocial protection system? (see Chapter 5)
How can we safeguard the value of the money that we have to keep inreserves to finance future liabilities? (see Chapter 6)
How do we organize the financial management and governance so as tomake optimum and responsible use of scarce resources? (see Chapter 7)
Our aim is therefore to enable readers to make decisive contributions to thegood governance1 of national social protection systems.
Method
This volume offers a wide range of choices for financing a certain socialtransfer, and some criteria for selecting the right option in specific nationalcircumstances. It does not advocate one-size-fits-all answers and tries to discussfinancing options in the most neutral way. To the best of our knowledge, it isthe first work on the subject that seeks to provide a comprehensive overview ofthe many options in financing and financial governance through a detailedanalysis of their advantages and disadvantages.
The predominantly theoretical discourse is complemented by an ExerciseAnnex containing a number of case tasks and corresponding model solutions, allreferring to a fictitious country, Demoland. The compendium enables the readerto rehearse the important concepts discussed in the book by applying them to aconcrete country task using practical, analytical and quantitative skills.
1 For the definition of the term ‘‘governance’’ as used in this book, please refer to the Glossary of terms.
5
Introduction

Audience and level of technicality
This book is intended primarily for financial or policy analysts and plannerswho work (or aspire to work) in the fascinating and challenging field of socialprotection. Financial analysts will find in it an overview of the skills they need.If they need to advance from relatively general financial analysis into the moretechnical field of modelling and thus require more technical detail, they shouldturn to the other textbooks in the Quantitative Methods series. As for policyanalysts or planners who are not necessarily financing specialists, it should helpthem to grasp the complexity of the design and implementation of soundfinancing systems and sound financial governance regimes.
Since it is less technical than the other volumes in the series, this bookshould also be of interest to social policy makers who need to be fully aware ofthe range of existing financing instruments and their possible effects on theeconomy and the budget. It does not contain all the mathematical details neededto calculate a specific tax rate or contribution rate – that is the topic of othervolumes in the series. However, it explains the financial implications of differentfinancing systems and offers simple rules of thumb that will allow plannersand analysts to check at least whether the calculations made by actuaries andother technical specialists are in the right order of magnitude. The readers ofthis book – economists, accountants, actuaries, statisticians or public policyspecialists by training – would typically be working in ministries of economics,planning, finance, labour, social affairs and health or in social securityinstitutions, or training future social protection staff.
Written by practitioners for practitioners, this volume reflects more than onehundred years of our combined hands-on experience in all parts of the world. Insome instances, the sceptical attitude of practitioners towards economic andpublic finance theory and towards standard policy recipes may become evident.However, compliance with academic theory was assured by the technicalediting of Professor de Neubourg who made certain that we did not get carriedaway by overly pragmatic shortcuts.
The place of this volume in the Quantitative Methods in
Social Protection Series
The titles that make up the series thus far are:
Actuarial mathematics of social security pensions (1999)Modelling in health care finance: A compendium of quantitative techniquesfor health care financing (1999)Social budgeting (2000)Actuarial practice in social security (2002)
The sixth – and most likely final – volume in the series, Statistics andaccounting in social protection, is in preparation.
6
Financing social protection

The present book is the ‘‘umbrella’’ or overview volume. Each book in theseries is self-contained, as all the volumes address distinct issues and can all beunderstood without the reader having to go through them all to find solutions toparticular problems in the field of quantitative analysis of social protection.Figure 1.1 lays out the ‘‘hierarchy’’ of the various titles, showing the linkagesbetween this and other volumes in the series. This latest volume provides linksto the other titles in the series and to other standard literature on specificsubjects. At the end of each chapter, readers who require more technical detailson specific questions are guided to other books in the series and/or otherrelevant literature.
Outline
Chapter 1 looks at the definition of social protection from the specific point ofview of financial analysts, the nature and objectives of social transfers, and theireffects on income distribution and poverty. Chapter 2 examines the size ofsocial protection systems in terms of overall national expenditure and identifiesthe determinants of social expenditure. Each financial or social policy analystshould be aware of the potential ultimate size of the social protection systemintroduced in a country. The potential effects of the system as a whole and itsimplicit and explicit incentives for the economy are analysed in Chapter 3. Thisagain is an important aspect in the decision-making process regarding the sizeand institutional fine print of a new system or one that needs to be reformed.The effect of a set of existing or new transfers on the government’s budget and
Figure I.1 Hierarchy of volumes in the Quantitative Methods in Social
Protection Series
7
Introduction

resource mobilization strategies within the framework of the country’s overallfiscal and financial policies are discussed in Chapter 4.
Indeed, understanding the potential size of the social protection sector (thatis, the volume of its expenditure and its possible economic and fiscal effects) isnecessary before the reader can fully appreciate the range of available financingtechniques set out in Chapter 5, the methodological core of the book. Chapter 5presents the various tools that should be used to ensure that the money is
presents the purpose andcontent of the book
Chapter 1: Basic concepts: Social protection and social transfers
explores the basic nature ofsocial protection schemes
Chapter 2: The size ofthe welfare state: Trends, patterns and determinantsof social expenditure
establishes the financial sizeof the social sector andanalyses what drives social expenditure
analyses potentialeffects of the social protection system onthe national economy
Chapter 3: Socialprotection and the economy
Chapter 4: The publicfinance nexus andresource mobilization strategies
analyses potential direct and indirect effects of social protection financing on public finance strategiesand ways of defining resourcemobilization strategiesfor the social sector
book's technical core: describesthe full range of financing techniquesof social protection at the disposal ofdesigners and financial managers
explains how reserves accumulatedthrough a chosenfinancing method should be investedprofitably
Chapter 6: Investing social protectionreserves
explains how to ensure best use of scarce resources
places social protectionfinancing into the widercontext of political decision-making
Conclusion
explores specific topics of interest
helps the reader toreview and consolidateacquired knowledge
Exercise Annex
Issue Briefs 1, 2, 3, 4
Introduction
Chapter 5: Financingtechniques
Chapter 7: Financial governance
Figure I.2 Reader’s guide through the book
8
Financing social protection

available when obligations fall due. Chapter 6, devoted to the investment ofsocial protection funds, recognizes that the level of funding is rising in manynational social protection schemes and that making rational and optimalinvestments of their reserves is an issue of growing importance in the day-to-day financial management of national systems or their component schemes.Chapter 7 passes from questions of design and choice to those of soundmanagement and governance by describing the statistical and legal meansavailable to ensure effective and efficient use of societal resources for socialprotection. A brief conclusion puts these newly mastered techniques into thecontext of political decision-making.
Issue Brief 1, set in an African context, addresses one of the specific majorquestions currently facing many social protection financing specialists, namelythe quantification and financial management of the potential effects of the AIDSpandemic. Issue Brief 2, set in a European context, looks into the relationshipbetween migration and pre-funding of social transfers as a response to socialprotection financing problems in an ageing society. Issue Brief 3 provides a‘‘survival kit’’ of basic formulae that should help all those who have to makerough, ‘‘back-of-the-envelope’’ calculations in social protection budgeting.Issue Brief 4 summarizes basic definitions and terminology of financialmarkets for social protection analysts who do not routinely deal with financialmarkets issues.
The book concludes with the Exercise Annex: a set of eight case tasksdealing with concepts and issues discussed in Chapters 2 to 7, accompanied bymodel solutions. The main aim is to enable the reader to apply theoreticalknowledge to the realm of practical policy questions.
A caveat
The limitations of this book are obviously and inevitably set by the limits of theknowledge of its authors. We have tried to put on paper what we know and todescribe the tools that we use in our work. However, social protection financingis a new academic field and, like any true academic field, provides plenty ofscope for further study and improvement. While we think that we know a fairamount about the financial effects of specific financing instruments, we do notknow enough, for instance, about the interaction between the economy andsocial protection, or about benchmarking the performance of schemes andsystems through indicators. We have mentioned these open questionsthroughout the book. There remains work to be done, and that is the way itshould be. Otherwise life would be boring. We are open to comments andsuggestions and are ready to engage in discussion. We can all be reached byemail ([email protected]) or contacted through the ILO.
The authorsGeneva, Autumn 2003
9
Introduction

1BASIC CONCEPTS: SOCIAL PROTECTIONAND SOCIAL TRANSFERS
Before tackling the main subject of this book, we need to define a number ofconcepts that will be useful as a background for the discussion of socialprotection financing: social protection, social transfers, social budgeting,income inequality and transfer efficiency.
This chapter defines the term ‘‘social protection’’ in (arguably narrow)economic and financial terms. Social protection is a set of measures that asociety employs to give its members some form of income security; thesemeasures necessarily have a profound impact on income distribution in thecountry. As mentioned in the Introduction, the scope of this book is generallylimited to measures that can be characterized as formal transfers of income incash (such as cash transfers in the form of pensions or child benefits) or in kind(such as the provision of medical care). Formal transfers thus exclude socialprotection measures that are not related to income transfers in cash or in kind,for example employment guarantees provided in the former planned-economycountries, or individual or intra-family risk-management strategies such assavings, home ownership, multiple employment, or informal transfers betweenindividuals in families.
While the rest of this book will focus on formal social protection transfers,this chapter will look at income transfers in the wider context of all transfers –both formal and informal – occurring in a society. It will also seek to determinewhether there is a ‘‘normal’’ transfer level in any given society. This willprovide a new and different framework for the debate on the affordability ofcomprehensive social protection ‘‘from cradle to grave’’. Roughly, thereasoning is as follows: If a society redistributes much more income throughinformal transfers than is registered by official statistics, formalizing suchtransfers through the introduction of new benefits or expanding existing benefitsystems might not actually cause any increase in the overall level of transfers inthe society. All that would happen is that previously informal intra-familytransfers would be turned into formal transfers in which the burden of benefitfinancing and delivery would rest on more shoulders.
11

1.1 SOCIAL PROTECTION THROUGH
SOCIAL TRANSFERS
As mentioned, social protection – as understood here – in any given societyis essentially a transfer system that reallocates income both within householdsand among different households. Let us explore that narrow, ‘‘financial’’definition in some more detail.
Income transfers (also called ‘‘benefits’’ in the standard social protectionjargon) can consist of transfers in cash or in kind. Both types of transfers can betriggered by the need to help people to cope with a certain risk (e.g. loss ofincome due to sickness or the insolvency of the family business in theinformal sector) or simply by the objective to equalize consumption within agroup or a society. Cash transfers are a straightforward concept – somebodytransfers an amount of money to somebody else. In-kind transfers are alsoincome transfers. If you benefit from free health care (i.e. health care that isuniversally available, tax financed and free at the point of delivery to everybodyliving in a country, regardless of their ability to pay or their previous tax orcontribution payments) then your consumption of health care is an incometransfer that equals the monetary cost of the care you consume. One essentialelement in the social transfer definition of social protection is the actual flowof income between groups or individuals. This flow might be the result of thefact that the receiving individual enjoyed insurance cover or that the State or thecommunity decided that a certain degree of income equalization was necessary.Box 1.1 explains in more detail why we also consider insurance benefits asincome transfers.
However, income transfers are a means rather than an end in themselves.Their purpose – which is the other essential element in the definition of socialprotection as social transfers – is to:
. guarantee a minimum level of consumption for people living in poverty oron the threshold of it, or
. replace wholly or in part income lost as a result of a certain contingency, or
. achieve a higher level of income equality.
Effective social protection of individuals does not stem from transfers ofmoney but rather from the transfer of entitlements to a certain level ofconsumption. It does not really matter to a pensioner how much money innominal terms is transferred to his or her bank account every month. Whatmatters is what he or she (or their grandchildren) can actually buy with thatmoney. It is important to bear in mind that consumption in this context includesthe ‘‘consumption’’ of such essentials as health care services, basic or higherlevels of education, and shelter (housing).
Thinking of social protection benefits as entitlements to a certain level ofconsumption will also help us answer an important question that has often been
12
Financing social protection

Box 1.1 Insurance benefits as income transfers
Suppose a disability insurance scheme covers the entire workforce.In each year each covered individual k faces a disability risk describedby the probability pi of ‘‘entrance into invalidity’’, as the actuaries say.The financial risk for the scheme for that individual in a specific year t isthe product of the probability and the amount of benefits bi to which thatindividual is entitled during the year (i.e. between the time of occurrenceof invalidity and the end of the period). The total risk that the schemefaces for new cases EN in year t is:
ENt ¼X
kipik ;t * bik ;t ð1:1:1Þ
Together with the expenditure for cases incurred in previous years andfor which benefits still have to be paid EO, the total (benefit) expenditureTE expected for that year amounts to:
TEt ¼ EOt þ ENt ð1:1:2Þ
TE is the total expected expenditure for year t (we are leaving asideadministrative costs for the moment). In a classical PAYG social insurancescheme this expenditure has to be covered by contributions (ignoringother income of a social insurance scheme, for the sake of the argument)and is calculated as follows:
TEt ¼ pt * abt ¼ TCIt ¼ pt * TIWt ¼ cont * act ð1:1:3Þ
where:
TCI ¼ total contribution incomep ¼ average number of beneficiaries in tab ¼ average benefit in tp ¼ contribution rate in year tTIW ¼ total insurable wage of all contributors to the schemecon ¼ average number of contributors in tac ¼ average contribution
TE thus also equals p-th share of the total income TIW of activecontributors. It is the amount of income that is transferred by an averageof con contributors to an average of p beneficiaries in year t. We henceconsider insurance benefits as income transfers. The difference betweeninsurance benefits and universal unconditional transfers (benefits) ortargeted means-tested transfers is simply the legal nature of entitlements(i.e. being entitled to benefits as a contributor, a resident, or a residentfulfilling a certain targeting condition, for example poverty). In this bookwe are interested in the techniques and methods employed to ensure thatTE is met by equal amounts of resources.
13
Basic concepts: Social protection and social transfers

raised in the context of the current debate on funding versus non-funding ofpension schemes. That question is: If we oblige people to save for theirpensions, can we really consider this to be a transfer between individuals, or isthis social protection scheme merely a transfer of income between differentlife-stages of one individual? It clearly is an individual transfer of moneybetween different phases of a person’s life. The money I put in my account isthere when I retire – or at least some of it is, depending on how well myaccount manager performed during my active life. However, I cannot reallyinfluence the level of consumption that my money will buy. If the activeproducers of the current GDP do not want to give me as big a share ofconsumption as I expected, they will probably increase the prices of thegoods and services that I need most (for example, health and nursing carefor the elderly, or home grocery delivery), or they will find a way to tax myincome to prevent my retirement income from fuelling inflation. Ultimatelythey have to agree to share the consumption financed by the current GDP in acertain way.
It should be borne in mind that whatever benefits a social protection schememay promise, in the short run it cannot have any impact on the size of theconsumption cake that has to be shared among actives and inactives – it canonly try to adjust the relative size of the slices. In the long run, however, it mayindirectly help to increase the size of the cake (by maintaining an ageingworkforce in good health, for example). The overall size of future cakes willalso be influenced by many other factors, such as demographic developments,the quality of the workforce, changes in world markets, the volume of domesticinvestments, the quality of the educational system, and so on.
An important conclusion to be drawn from this analysis is that no socialprotection scheme, no matter what it promises or how it is financed, can ensurea certain absolute level of consumption in the immediate or long-term future.All it can do is attempt to issue entitlements to a certain relative share of totalpresent or future consumption in a given society. The longer the time horizonfor the promises made, the greater the uncertainty about absolute levels ofconsumption.
In any case, social protection schemes have a profound effect on incomedistribution in any country. The size and nature of any adjustments to thenational pre-transfer distribution of income are basically a matter of ethics.Every society determines what level of social benefits a person should enjoy inthe event of a certain contingency.
Social transfers thus transform ethical norms into cash or in-kind incomeflows, which in turn are translated into consumption levels. In principle, asociety can choose whether to redistribute income formally or informally inorder to satisfy these ethical norms. Figure 1.1 shows the principal mechanicsof that redistributive process. Societal values and norms dictate that peoplein need should receive a certain level of assistance. Societal preferences,experience and administrative capabilities then determine whether these
14
Financing social protection

transfers should be organized formally through established laws or whether theyshould be left to private initiative.
If it has been decided to formalize a certain kind of transfer, then thescheme has to go through a filter of economic, fiscal and financial affordabilityas well as a filter of administrative deliverability. A basic social protectionsystem offering very modest benefits may be fiscally affordable in a low-incomecountry, but that country might not have the administrative machinery neededfor a complex means-testing procedure. On the other hand, a country may havea sophisticated administrative machinery at its disposal but might not be able toshoulder the additional financial burden of a new benefit system. This may bethe case in some transition countries.
Social transfers have various effects on the population. To name only afew, they help to restore or maintain good health or to make ill health morebearable; they support families financially, alleviate parents’ worries about theirchildren’s future and ease the burden of providing care for the elderly; they alsohelp to maintain a certain level of workforce productivity, thereby providingcrucial support for social peace and cohesion. All of this is ultimately achievedthrough cash and in-kind income transfers equivalent to a certain amount of
Transfers in cash and kind in a societyto help individuals to cope withpoverty, unemployment, sickness,old age, invalidity, death of a close relative
Establishment ofindividualrights andresponsibilities
Filter of fiscal, financial,economic affordability
Filter of administrative deliverability
INFORMAL TRANSFERS FORMAL TRANSFERS
Social values and ethical norms in a society
Figure 1.1 Social protection transforms ethical norms into transfers
Source: ILO.
15
Basic concepts: Social protection and social transfers

consumption that the active population gives up for the benefit of the inactivesor the poor.
Statistical measurements like those applied in Chapter 2 generally captureonly formal social transfers. However, a low level of such transfers does notnecessarily indicate that a society does not care about the less fortunate; it maysimply be transferring resources informally. Since virtually no society will letits inactive dependent population starve to death (except in a situation of veryextreme poverty), there have always been and there always will be incometransfers in one form of another between the active and the inactive ordependent groups of a society. In the informal sector most of them will betransfers in kind (such as providing food and shelter for children, the elderly,the disabled or unemployed members of the family, clan or village). In theformal sector, society has largely – although not fully – commissioned formalsocial protection systems to make these transfers. This is the case in mostOECD and Central and Eastern European countries. However, in all societiesformal social protection transfers are still complemented by informal intra-family, intra-clan or intra-community transfers, even if in many OECDcountries these informal transfers are mere remnants of old traditions.
All transfer systems, whether formal or informal, have four components:
. financiers;
. rules governing entitlements;
. an organization operating redistributive flows and/or providers of goods andservices; and
. recipients.
The fundamental difference between formal and informal transfers is that informal schemes all of the above elements are or should be defined by law orcontractual arrangements, whereas in informal transfers at least one or two – ifnot all – of them are defined on an ad hoc basis according to traditional orgeneral legal obligations within family units.
In any case, in economic terms formal and informal transfer systemssubstitute for each other. Where one does not exist or function, the other willdevelop. Whether the introduction of public transfers (which make up the bulkof formal transfers) replaces private (informal) transfers on a one-to-one basis isnot clear. Lampman and Smeeding (1983, pp. 45–66) have established thatthe ratio of private to public transfers in the total transfers received byhouseholds virtually reversed itself in the United States between the mid-1930s(when the social security system was introduced) and 1980 (see figure 1.2).However, they also observe that the absolute level of private interfamilytransfers has remained almost constant. This means that while the public systemhas taken a growing share of the responsibility for national social protection, itmay also have increased the overall level of protection (or transfers) in absoluteterms rather than simply replaced informal transfers.
16
Financing social protection

1.2 INFORMAL TRANSFER SYSTEMS
Informal intra-family and intra-community transfers can be broken down into avariety of different types, which essentially can be grouped under three majorheadings: child transfers, active-age transfers and old-age transfers. In nuclear andextended families they often consist simply in income- or consumption sharingbetween the breadwinner(s) and dependent family members, as well as theprovision of nursing care in cases of sickness and long-term physical disability.Solidarity in life crises generally extends also to close-knit communities or clans.However, benefits under these informal arrangements are ad hoc and highlyuncertain. The burden of support is placed on families, and its reliability dependson the affluence of the family or the community and the stability of their economicsituation. These families or communities are subject to such joint risks as badharvests resulting from adverse weather conditions or political unrest. Oftenbenefits are also conditional upon compliance with societal behavioural norms,which may be antithetical to personal interests or even dignity.
Benefit levels are also extremely unequal. Generous families may give morethan others, rich communities may give more than others – or vice versa. Thehigher the dependency ratio in a family or community, the smaller the potentialbenefit is likely to be. There is a long history of literature on patterns of incometransfer and consumption sharing within households. One of the key outputvariables used to measure the equity of intra-household consumption sharing is
0
20
40
60
80
100%
1935 1950 1960 1970 1979
Sha
re o
f tot
al tr
ansf
ers
Interfamily transfers Government transfers
Figure 1.2 Shift from interfamily to government transfers, United States,
1935–80
Source: Lampman and Smeeding (1983).
17
Basic concepts: Social protection and social transfers

the level and quality of food consumption. In some developing countries thedistribution of food consumption reportedly remains extremely unequal. Onestudy on Pakistan concludes: ‘‘It is possible to be malnourished in a food-securehousehold as a result of disease, inadequate care, or inequitable allocation offood’’ (Nazli and Hamid, 1999, p. 21). Among the malnourished, ‘‘girlssuffered more than the boys’’ (ibid., p. 11). The degree of female control ofhousehold income is apparently highly correlated with the distributional equityof intra-family consumption. The degree of control appears in turn to becorrelated with the educational level of women.1 The picture is less clear whenit comes to the financing of access to essential health services. Other sourcesshow no gender bias when it comes to utilization of essential health services.While Nazli and Hamid (1999) find a bias against girls in Pakistan, Sauerbornet al. (1996) find no such bias in Burkina Faso, although they do cite a strongbias in health care consumption towards persons of active age.
The actual patterns of income- and consumption-sharing within householdsare obviously a major factor in the effectiveness of informal social transfers.They may acquire additional importance in the grey area between formal andinformal transfers. Basic universal pensions – for example, in Brazil, Namibiaand South Africa – have an important welfare effect on whole households, evenif they are paid at a rate of less than US$1 a day. The elderly pension recipientsare apparently acting as informal agents of social assistance in their households.The payment of a basic pension to the elderly in a household is correlated withgains in the children’s height and weight and increased school enrolment (seeBarrientos and Lloyd-Sherlock, 2002). Even if the so-called ‘‘trickle-down’’effect may be less than perfectly equitable, such combinations of formal andinformal social protection measures might be one valid and realistic way ofeffectively extending social protection coverage in developing countries.However, further research is needed on the distributive effects of suchcombinations, as well as on the long-term financial sustainability of suchtransfer systems.
Evidence also exists on the size and nature of inter-household informaltransfers. There is substantial literature on the motives, extent and determinantsof private transfers in different countries between households. There arefindings that private transfers in so-called developed and developing countriesare not purely altruistic in nature but are to a substantial extent motivated byan exchange of transfers for explicit or implicit services or other goods (see,for example, Cox and Jakubson, 1995, and Cox et al., 1996). Economicconditionality in informal transfers obviously reduces their anti-povertyeffectiveness.
In many developing countries formal social transfers do not reach even 20per cent of the total population. Informal transfers based on family andcommunity solidarity and values will therefore have an important role to play inmany societies for some time to come. Unfortunately, as a result of rural-urbanmigration and new external risks (like the AIDS pandemic) many families or
18
Financing social protection

small communities are no longer in a position to offer basic social protectionto all their members. Larger solidarity pools will have to take over gradually.As mentioned above, a combination of formal and informal social protectionmechanisms may be the most promising solution, but sound financialmanagement of formal transfer schemes remains crucial to their success.
1.3 FORMAL TRANSFER SYSTEMS
The classic formal transfer system provides for the three basic types of transfersthrough the benefit arrangements outlined in table 1.1.
All of these formal transfers serve the same purpose as informal transfers inthe informal sector or the remnants of informal transfers in the formal sector.They are all intended to enable the inactive group to consume goods and serviceseither according to need or at a level previously financed by income fromemployment or self-employment. Since formal social transfer systems operatedby means of national social protection systems are the core of this book, theyneed to be defined here in full detail – tedious though this may be for the reader.
1.3.1 Defining formal social protection, its functions,
institutions and sources of finance2
For the purposes of this book, the material scope of the term ‘‘social protection’’must be defined. In the literature and public debate on social issues, this term isincreasingly taking the place of the expression ‘‘social security’’, which, widelyused for decades, is often understood as the set of transfers that originate fromformal sector employment. Although ‘‘social protection’’ is considered to be awider concept, it is not yet universally accepted, so a definition is in order here.
Table 1.1 Transfers in formal social protection
Group receiving transfers from active employed persons
Children Active age Old
Family benefits(child allowances)
Social assistance Old-age pensions
Health care benefits Short-term cash benefits Survivors’ pensions
Social assistance Health care benefits Social assistance
Housing benefits Housing assistance Housing assistance
Education benefits Unemployment benefits Health benefits
Long-term care Disability pensions Long-term care
Rehabilitation benefits
Survivors’ benefits
Long-term care
19
Basic concepts: Social protection and social transfers

Essentially, a national social protection system (NSPS) can be described as asystem of social transfer schemes that intervene through legally determinedfunctions in cases where a defined set of needs is present. This book takesdefinitions and classifications developed within the European System ofIntegrated Social Protection Statistics (ESSPROS) as a starting point, makingthe ESSPROS definition more universal by adding several categories of needsand functions that are appropriate for developing countries. A more detaileddiscussion of the definition and the scope of the term ‘‘social protection’’ can befound in Annex 1-A1 at the end of this chapter.
In most countries social protection systems are composed of four elements:3
. social security schemes: employment-related benefit schemes, such asemployment-related pensions, short-term cash benefits, employment injuryand unemployment benefits, and perhaps some form of health care benefits;
. universal social benefit schemes: benefit schemes for all citizens, includingtax-financed family benefits and health care benefits;
. social assistance schemes: poverty alleviation systems for citizens andresidents in special need;
. supplementary benefit schemes: as stipulated in collective or community-based agreements or individual contracts mandated by law, usually operatedby co-operative or private sector entities.
A social protection scheme is a distinct body of rules, supported by one ormore institutional units, governing the provision and financing of socialprotection transfers. The institutions usually involved are:
. social insurance schemes;
. central, state or local governments;
. autonomous and self-administered pension funds;
. insurance companies;
. mutual-benefit (insurance) societies;
. public and private employers;
. private welfare and assistance institutions.
Each of these institutions may administer one or more schemes. The entireset of such social protection schemes operating in a given country is called herethe National Social Protection System (NSPS). This definition is nearly but notfully synonymous with the term ‘‘welfare state’’ used in Anglo-Saxon economicliterature. The definition of the ‘‘welfare state’’ has remained somewhat loose.Nick Barr (1993, pp. 6–7) writes: ‘‘the concept of the welfare state. . . defiesprecise definition, and no attempt is made to offer one. . . even Richard Titmuss(1958) ducked it.’’ Pragmatically, we will be using the terms ‘‘national socialprotection system’’ and ‘‘welfare state’’ interchangeably, although we prefer
20
Financing social protection

the former. It should be noted in this context that in the definition of formalsocial protection we also include certain transfers operated by the privatesector, but only those that are mandated by law. Private arrangements betweenindividuals and institutional private agents that are not imposed by publicauthorities, as well as entirely private arrangements between individuals are notconsidered formal and therefore fall outside the scope of this book.4
The core functions of an NSPS – in addition to a general incomeequalization function – and the needs that they address are detailed in table 1.2.In the language of risk management many of these needs may be defined as‘‘risks’’ (though not all – like the need to provide care to children, for example).
Table 1.2 Needs covered by and functions of an NSPS
Type of need: Individual facing. . . NSPS functions designed to cope with the type of need
Sickness Income-replacement transfers in cash in connectionwith physical or mental illness, excluding disabilityin case of inability to work
Ill health or need tomitigate the effects of ill health
Provision of health care goods and services neededto maintain, restore or improve health of the peopleprotected irrespective of the origin of the disorder(¼ indirect income transfer)
Disability Income-replacement transfers in cash and in kind(except health care) in connection with the inabilityof physically or mentally disabled people to engagein economic and social activities
Old age Income-replacement transfers in cash and in kind (excepthealth care) in connection with old age
Survivorship/loss of breadwinner Income-replacement transfers in cash and in kind (excepthealth care) in connection with the death of a family member
Family care/upbringing of children Transfers in cash or in kind (except health care)in connection with the costs of pregnancy, childbirth andadoption, bringing up children and caring for otherfamily members
Unemployment Income-replacement transfers in cash or in kind (excepthealth care) associated with unemployment
Inadequate housing Financial transfers or in-kind transfers to meet/alleviatethe cost of housing
Poverty and social exclusion,inadequate nutritional status
Income transfers in cash or in kind aimed at ensuring aminimum level of consumption (except health care),specifically intended to alleviate poverty and socialexclusion that are not covered by one of the otherfunctions. Direct/indirect transfers in cash and in kindto maintain an appropriate level of nutrition
Inadequate access to(basic) education
Free access to public education and cash/in-kindtransfers to facilitate school attendance(stipends, free textbooks, etc.); the level of education towhich access is guaranteed may depend on the country’slevel of economic development
21
Basic concepts: Social protection and social transfers

1.3.2 Financial architecture of national social
protection systems
The main focus of this book is to describe tools for the design and propermanagement of the financial architecture of national social protection systems.To use the language of network theory, the financial architecture traces themoney entering an NSPS from its origins (sources) to its uses (sinks). One ofthe most powerful tools used to describe this architecture is a flow of fundsgraph. It helps to clarify, inter alia, the issue of who is financing a given schemeand the sources of financing for the social protection system as a whole.
In the classic definition of national accounting, the following sources ofmoney can be identified:
Social protection financing resources, by origin:
I. All residential units
Public sectorGeneral government
Central governmentState and local governmentsSocial security funds
Corporations (financial and non-financial)Non-profit institutions serving households
Private sectorCorporations (financial and non-financial)Non-profit institutions serving householdsHouseholds
II. Rest of the world (foreign aid, etc.)
The above is a first-level analysis. A second-level analysis, however,immediately reveals the fact that government itself does not (or does only to alimited extent) generate income for social transfer systems; rather, itredistributes it. It receives tax payments from corporations (enterprises),households and the rest of the world (through import duties), and uses a part ofits total revenue to finance a social transfer system. A flow-of-funds graph cantake that second level of analysis into account.
Figure 1.3 shows the principal aggregate flow of money in a formal NSPSconsisting of several distinct transfer schemes. Benefits are financed by taxes orcontributions paid to the institutions of social transfer by a subset of all privatehouseholds (the financing households), as well as public and private enterprisesor employers. These social transfer institutions organize the collection ofresources (taxes and contributions) and distribute them according to certainlaws to another subset of private households (receiving households).
It is important to note that the subsets of financing and receiving householdsare not disjunct – that is, the majority of households are both financing and
22
Financing social protection

receiving transfers. In an inter-temporal sense most of them are both financingand receiving households (they finance in some periods and receive in others),but some may be financing and receiving benefits simultaneously: this might bethe case, for example, in a health insurance scheme to which a sick wage earnercontinues to pay contributions while at the same time receiving treatment fromhis physician and receiving drugs without charge from the local pharmacy. Thesame applies to most tax-financed systems where households pay taxes andreceive benefits simultaneously (for example in the case of tax-financeduniversal pension systems).
Figure 1.4 provides a disaggregated overview of the flow of funds in theNSPS of Germany in 1998.5 The figures next to the arrows or boxes denote theamounts of money leaving or entering institutions, households or enterprises.It may be noted that the amount of money leaving households and enterprises isnot equal to the amount of money received by households. This is where afundamental law of network theory is violated: the total amount of moneyentering the net is not equal to the total amount of money leaving the net. Thereason is that the institutions collecting contributions and delivering benefits areusing up some of the resources to administer the transfers. However, they arealso generating income other than contributions or taxes by investing, sellingservices to third parties, and so on. The difference between the sum of the flowsleaving a box and the flows entering the box is the net administrative cost of theinstitution in question (that is, gross administrative expenditure minus incomeother than contributions and taxes generated by the institution; see in particularthe outflow of the unknown values for the private insurance schemes, i.e. x2-a2).
A third-level analysis would show that some expenditure flows andadministrative costs also generate income for enterprises and other suppliers ofservices (hospitals, doctors in private practice, pharmacies, nursing homes,pharmaceutical companies, etc.) that sell goods and services to the institution,as well as the institutional staff, who ‘‘sell’’ their labour to the institution.
Enterprises contributions + taxes(public and private)
Financinghouseholds contributions + taxes
Receiving
Institutions of social transfers
Social security
institutions
Government, private
carriers
households benefits in cashand in kind
Figure 1.3 Basic flow of funds in an NSPS
Source: ILO.
23
Basic concepts: Social protection and social transfers

365
Householdsrecipients financing
poor middle rich327
428 353
1070+x1+x2-A1-A2 x2
Private insurance schemes
248 National Externaldonors/otherreceipts
socialx2-a2 transfer
x1 50 schemesx1-a1
965 551070
Voluntary schemes(other than privateinsurance)
Lower-levelgovernmentcommunity schemes(mandatory)
48
Employers Government
Figure 1.4 Financial architecture of an NSPS (Germany, 1998)1
1The benefit and administrative expenditure of the private sector institutions could not be established exactly and are thus noted here as variables X and A
Source: ILO, based on EUROSTAT data.
24
Fin
an
cin
gso
cia
lp
rote
ctio
n

We will not be paying too much attention to these third-level effects but theyshould be borne in mind when the political and economic aspects of an NSPSare being analysed.
A still more detailed overview of the financial architecture of an NSPS isprovided in the form of two matrices that show the system’s expenditure andincome patterns. The first is a functional/institutional expenditure matrix, whichbasically traces which institution contributes what amount or share of totalsocial expenditure to the different protective functions of the system. It isobvious that one function can be assumed by more than one institution and,conversely, one institution can serve more than one function. Parallel to theexpenditure/institution matrix is a financing matrix which provides informationon the sources of funds for the different functions. From a technical point ofview, establishing these matrices is not always easy, since not all receipts andinstitutional expenditure items can be clearly assigned to specific functions, andreceipts of the same type and from the same source may finance a number ofsocial protection schemes associated with different functions.
In order to establish the two matrices, the accounts of different institutionsmust be analysed in detail. These analyses can also be interpreted as summariesof a social accounting system (SAS) that are compatible with the United NationsSystem of National Accounts (SNA). Both the expenditure and financingmatrices encapsulate the results of what is often decades of financing anddistribution policy decisions by governments and other decision-makers in thesocial protection system. The analysis in the following chapters is essentiallydesigned to help the reader establish and ‘‘manage’’ these two matrices as awhole, as well as the individual columns, rows and cells. One element ofmanagement consists in projecting expenditure and income for some time intothe future and/or simulating the effect of alternative policy measures. This isdone through social budgeting, which is the key financial-managementtechnique for the sector as a whole. Another volume in this technical seriesdescribes the methodology in full detail (see Scholz et al., 2000). Box 1.2 (p. 28)summarizes the structure of institutional accounts in social protection systemsand their relation to national accounting and social budgeting.
Tables 1.3 and 1.4 (pp. 26–27) provide an overview of the structure of totalexpenditure and financing in an NSPS (or formal social transfer system) in atransition country (in this case, Lithuania in 1998). To simplify matters, thematrices deal only with the expenditure and revenues administered by publicinstitutions.
1.4 INCOME EFFECTS OF NATIONAL SOCIAL
TRANSFER SYSTEMS
Much of the impact that national social transfer systems have on individualsand societies – for example, the beneficial influence on social peace and
25
Basic concepts: Social protection and social transfers

cohesion and on personal and societal development – is not directly measurable.However, since all transfers redistribute income, the actual effect of transfers onincome distribution should be measurable. Section 1.4.1 describes classicinstruments used to measure poverty and inequality, and suggests two basicindicators for measuring the efficiency of social transfer systems – indicatorsthat financial analysts could use to assess the redistributive efficiency of eitherindividual transfers or the entire NSPS. The theoretical tools for measuringsystem efficiency routinely on a macro basis are not yet well developed.Generally the social, financial and fiscal efficiency of individual transfers istested in specific studies, monitored pilot programmes or micro-simulationanalyses.6 Section 1.4.2 nonetheless sums up the most important factualevidence available on the redistributive effects of social transfers.
1.4.1 Measures of inequality, poverty and
transfer efficiency
1.4.1.1 Measuring income inequality
The most frequently used graphical representation of income inequality is theLorenz curve. The Lorenz curve plots the cumulative income of all people in acountry or society (or a subgroup thereof) from the poorest upwards. Lorenzcurves can be used to plot different types of income or even transfer payments.Here we assume that the curve plots the disposable, after-tax (direct tax, that is)
Table 1.3 Functional/institutional matrix of expenditure of the NSPS inLithuania, 1998 (as % of total social protection expenditure)
Socialinsuranceinstitution
Healthinsuranceinstitution
Centralgovernment
Localgovernment
Employers Total
Functions
Health care – 26.9 0.5 – – 27.4
Sickness 3.2 – – – 3.2 6.5
Disability 7.6 – 2.0 0.1 – 9.7
Survivors 2.2 – 0.0 0.4 – 2.6
Old age 34.3 – 4.3 1.1 – 39.6
Family andchildren
2.4 – 1.6 3.4 – 7.4
Unemployment 3.0 – – – – 3.0
Housing – – 1.2 – 1.2
Social assistanceand other
0.5 – 0.4 1.7 – 2.6
Total 53.2 26.9 8.9 7.8 3.2 100.0
Source: ILO estimates based on Social protection in Lithuania 1998, Statistical abstract (Statistics Lithuania,Vilnius 2000).
26
Financing social protection

Table 1.4 Financing matrix for the NSPS in Lithuania, 1998 (as % of total social protection expenditure)
Social insurancecontributions ofemployers
Contributionsof employees,self-employedand other
Other social insurancerevenues(e.g. investmentincome)
Centralgovernment
Localgovernment
Corporationsand non-profitinstitutions
Total
Functions
Health care 14.8 5.3 0.2 7.1 – – 27.4
Sickness 0.1 3.1 – – – 3.2 6.5
Disability 7.1 0.2 0.3 2.0 0.1 – 9.7
Survivors 2.1 0.1 – – 0.4 – 2.6
Old age 32.0 1.1 1.2 4.3 1.1 – 39.6
Family and children 2.2 0.1 0.1 1.6 3.4 – 7.4
Unemployment 2.8 0.1 0.1 – – – 3.0
Housing – – – – 1.2 – 1.2
Social assistance and other 0.5 – – 0.4 1.7 – 2.6
Total 61.6 10.0 1.9 15.4 7.9 3.2 100.0
Source: ILO estimates based on Social protection in Lithuania 1998, Statistical abstract (Statistics Lithuania, Vilnius 2000).
27
Basic
co
ncep
ts:
So
cia
lp
rote
ctio
nan
dso
cia
ltra
nsfe
rs

Box 1.2 From institutional accounts to a social accounting system
and social budgeting
Tables 1.3 and 1.4 were constructed from the accounts of social protectioninstitutions. This is a relatively easy exercise for all functions wherebenefits are provided by classic, autonomous social insurance institu-tions. Such an institution generally has its own income, and accounts forall its expenditure against that income. As an institution it also maintainsits own accounts of assets and liabilities. In other institutions suchaccounts are fictitious compilations of expenditures and revenues. Thatbecomes necessary when an institution providing a certain kind of benefitdoes not keep its own accounts because it is embedded in a largerstructure. This is often the case, for example, for social assistanceschemes in which the provision of social assistance is just one function ofa government agency that may also perform a number of other functions,such as supporting cultural events or national sports societies, orproviding labour-market services.
The expenditure of an institution maintaining its own books,organized by main categories, would normally be structured as follows:
Expenditure of a social protection scheme, by type:
Benefit expenditure
. Cash benefits
. Benefits in kind
Transfers to other schemes
Other expenditure
. Contribution refunds
. Loan repayments
. Other
Administrative expenditure
. Salaries and social security contributions for staff
. Purchase and maintenance of property and equipment
. Other
National social protection systems have different sources ofincome. The major ones are taxes and contributions, but other sourcesinclude interest income or certain types of charges (for example,penalties for contributions paid in arrears). Typically, the income sideof the current account of a social protection institution contains thefollowing items:
28
Financing social protection

Receipts of a social protection scheme, by type:
Social security contributions
. Employers’ social security contributions
Actual contributionsImputed contributions1
. Social contributions by protected persons
EmployeesSelf-employedPensioners and others
. Rerouted social contributions
General government financing
. Earmarked taxes
. General revenue
Transfers from other schemes
Other receipts
. Property income
. Other
These institutional accounts can be used as a basis for establishingnational social accounts in the form of functional expenditure and incometables as shown above, or social accounting systems (SAS), which can beregarded as satellites in the system of national accounts.
It should be noted that if the accounts of all national social protectioninstitutions in a country are aggregated into national social income andexpenditure matrices, the position ‘‘transfers from or to other schemes’’disappears. Moreover, a complete overview of the size and financialoperations of an NSPS can be obtained only if a national SAS isestablished. The social accounts compile all social protection income andexpenditure. They provide the basis for comprehensive budgeting orexpenditure and financial planning in the NSPS, and are therefore crucialelements in national social protection resource management.
The key instruments for social protection resource management aresocial budgets. Social budgets are projection and simulation tools thatare constructed from national social accounts essentially by linkingexpenditure and income items to demographic and economic develop-ments. Social budgeting thus permits macro-financial planning inthe social sector. The whole process of establishing social accountsand building social budgets is pivotal in national social governance.
Box 1.2 (cont’d)
29
Basic concepts: Social protection and social transfers

income of individuals. If the total number of the population and the totalincome of the population are both normalized to 1, then the curve is a concavecurve that increases in a two-dimensional graph from point (0/0) to (1/1). In acountry with perfect income equality the curve would take the special linearcase of fðxÞ ¼ x. Figure 1.5 shows two unequal income distributions andcompares them to the case of perfect income equality.
It is obvious that the lower concave curve describes a greater extent ofinequality. The degree of inequality is commonly measured by the Ginicoefficient, which represents the area between the concave curves and thestraight line expressed as a percentage of the triangle under the straight line. Itis obvious that the Gini coefficient takes values between 0 and 1, and that thesmaller the Gini coefficient the more equal is the income distribution.7
If we assume that the cumulative income function wðxÞ is a continuousfunction, then the coefficient can be mathematically represented in thefollowing way:
Gini ¼ 1=2 �
Z 1
0
wðxÞdx
0@
1A,ð1=2Þ ð1:1Þ
However, in real life income functions are discrete functions allocating acumulative income value w(k) to each individual k. The above continuous casecan thus be turned into a formula in which the integral sign is replaced by a sumsign. Assuming that all inhabitants of a country could be enumerated, thecoefficient could be calculated as follows:
Gini ¼Xnk¼1
eðkÞ � wðkÞ
! Xnk¼1
eðkÞ ¼Xnk¼1
ðk * �ww � wðkÞÞXnk¼1
k * �ww
!,,ð1:2Þ
The techniques and raison d’etre of social budgeting are explained in fulldetail in Scholz et al. (2000).
Note
1
Imputed contributions are fictitious contributions that are ‘‘deemed’’ to finance a certain
benefit. If the provision of sickness cash benefits for the first few days or weeks of illness is
an employer liability, then in national accounts or fictitious institutional accounts these
expenditures must be offset by fictitious contributions of equal amounts. Failing to do this
would lead to unaccounted-for balances in the aggregate national social protection
accounting.
Box 1.2 (cont’d)
30
Financing social protection

where �ww is the average income of all individuals k ¼ 1; . . . ; n with incomewðkÞ, and eðkÞ represents the cumulative income of the k poorest income earnersin the equal distribution case. This is equal to:
Gini ¼ 1 � 2Xnk¼1
wðkÞ �ww * n * ðnþ 1Þ= ð1:3Þ
In reality it would hardly ever be possible to enumerate all individuals, so theGini coefficient is usually calculated on the basis of sample data. Anothercommon simplification is to divide all individuals into 10 groups of equal sizewith increasing average income and then calculate the Gini coefficient on thebasis of the average income of these groups. Again, if incomes and totalpopulation are normalized to 1, this formula is:
Gini ¼X10k¼1
0:1 * ð �eek � wkÞX10k¼1
0:1 * �eek
,ð1:4Þ
0
0.2
0.4
0.6
0.8
1
1.2
0 0.1 0.2 0.3 0.4 0.5 0.6 0.7 0.8 0.9 1
Income recipients
Cum
ulat
ive
inco
me
Equal distribution Unequal distribution 1
Unequal distribution 2
Figure 1.5 Three typical Lorenz curves
Source: ILO.
31
Basic concepts: Social protection and social transfers

where �eek is the average value of the cumulative equal distribution functionfor class k, and wk is the average value of the cumulative income functionwðkÞ for class k.
It is obvious that as the number of classes increases from 10 towards n, theresults for formula 1.4 would approximate the results obtained from usingformula 1.2. Likewise, as n moves toward infinity the results of formula 1.2would approximate those of formula 1.1. For practical purposes, using formula1.4 is usually sufficient. In the above example, income distributions 1 and 2were given by the distribution functions fðxÞ ¼ x2 and gðxÞ ¼ x3 respectively.The Gini coefficients for the two distribution functions would be, respectively,1/3 and 1/2. Using formula 1.4 results in values of 0.3300 and 0.4950,respectively.
Other frequently used measures of income inequality are based on theconcept of the statistical variance of incomes around the mean. The resultingvalues often have little explanatory power for the general reader. Accordingly,an indicator which tries to capture the notion of the variance is often used,namely the P10/P1 ratio, defined as
P10=P1ratio ¼ w10=w1 ð1:5Þ
that is, the ratio of the average income in the highest income class to theaverage income in the lowest income class. Another similar measure that isoften used is the P9/P1 ratio, using the highest incomes in the respectiveclasses.
1.4.1.2 Measuring poverty
For a long time, poverty was viewed in economics as a mono-dimensionalincome phenomenon. Now it is increasingly seen as a multi-dimensionalphenomenon, including such dimensions as cash income, health, education andasset protection, among others. A family with a per capita income just above theofficial poverty level and without access to free health care is at permanent riskof slipping into poverty. If one person falls ill, the resulting financial needs willoverburden the family income even though, under normal circumstances, interms of income neither the family nor the ill person would actually qualify aspoor. However, the most frequently used poverty measures are still measures ofincome. Two of them are of particular importance: the poverty headcount indexand the poverty gap.
Any indicator for income poverty requires a comparative benchmark – thatis, a poverty line. The poverty line is the per capita income level (generally for anadult) that constitutes the border between those who are poor and those who arenot considered poor. When it comes to defining that line, there are two schools ofthought: those who believe that poverty is absolute and those who believe thatpoverty is a relative phenomenon.8 The proponents of the absolute-poverty
32
Financing social protection

approach see the poverty line as a priced basket of essential food items, oftenaugmented by other factors to take into account essential non-food needs such asclothing and shelter. The other school of thought defines the poverty line as afixed proportion of a general income indicator – for example, per capita incomeor the average wage.
The poverty headcount index is simply the proportion of persons in the totalpopulation whose income is below the poverty line. When this index iscalculated, children, adolescents and the elderly are given less than full weight(that is, adults are taken as the standard, whereas a child or an elderly personmay be counted as only 0.75 of an adult). It is obvious that the relative concepthas its advantages in times of rising general incomes. Since the poverty lineshifts in tandem with the chosen anchor-index (such as wages per capita), if thecountry in question provides any anti-poverty benefits then benefit levels willautomatically increase if the anchor index increases. However, in times ofeconomic downturn – as experienced by many Central and Eastern Europeancountries after the political turnarounds of the early 1990s – the relative conceptmay lead to an underestimation of poverty. If prices increase or remain constantwhile the nominal income anchor index simultaneously drops or stagnates, thenmore and more people will fall below the absolute poverty line – provided thatincome distribution as a whole moves downwards. In this case a relativepoverty measure might not change at all.
The headcount index does not give any indication as to how ‘‘deep’’ povertymight be in a given society. This aspect can be measured by the averagedistance between individual income and the poverty line, which is generallycalled the ‘‘poverty gap’’. However, this index does not measure the number ofthe poor. The aggregate poverty gap combines the concept of numbers of poorpeople with the concept of the depth of poverty. It is the sum total of alldifferences between the poverty line (whether it is defined in relative orabsolute terms) and the per capita income of people whose income falls belowthe poverty line. Figure 1.6 shows the poverty gap in the case of the secondunequal income distribution used above. The poverty gap is the area betweenthe straight line to the left of the graph and the original average income function(for the ten income categories). It is assumed here that the poverty line is equalto 37 per cent of the average income. The aggregate poverty gap can beexpressed as an absolute amount in national currency units or, alternatively, as afraction of the overall GDP. The second option is generally preferable, since itpermits an assessment of the extent of poverty in a country in relation to theoverall size of the economy. This relative indicator also allows internationalcomparisons. The poverty gap is thus defined as:
pg ¼Xmk¼1
iwðkÞ<pl
ð pl � iwðkÞÞ=GDP ð1:6Þ
33
Basic concepts: Social protection and social transfers

where pl is the poverty line, pg stands for the poverty gap and iwðkÞ representsthe individual wage, which is congruent with the cumulative distributionfunction wðkÞ.
Again, there are more sophisticated poverty indexes, like Sen’s,9 whichcombines individual poverty gaps, the headcount index and income inequalityas measured by the Gini coefficient.
1.4.1.3 Measuring transfer efficiency
The above example is also interesting from the perspective of social protectionfinancing. If the incomes of all impoverished individuals were to be brought upto the poverty line by means of a social assistance benefit, the governmentwould require an additional number of transfers in the order of 12 per cent oftotal income. We are assuming here that income distribution would not beotherwise affected (i.e. that the transfers would be net additional income addedto the country’s total income). This may not be realistic if the group of incomeearners were equal to all income earners in the society. The redistribution ofincome to the poor would then normally have to be financed by additionaltaxation of the non-poor. This, in turn, would change the latter’s disposableincome and hence the distribution of income in the country. To simplify matters,
0
1
2
3
00.
20.
40.
60.
8 1
Income recipients
Ave
rage
inco
me
Average class income 2 Average class without poverty
Figure 1.6 The poverty gap1
1Assuming a poverty line of 37 per cent of average income.
Source: ILO.
34
Financing social protection

we will assume that the additional resources required for social assistancetransfers would be financed through a reduction of non-transfer governmentexpenditure – in other words, from sources ‘‘outside’’ the total amount ofdisposable income available to the population. Under these assumptions, theimpact on the Gini coefficient would be substantial: the figure would drop fromabout 0.5 to 0.4.
If, alternatively, the government were to introduce a general incomesupplement of 12 per cent for everyone, then the necessary overall expenditurewould obviously be roughly the same as in the social assistance model, but theGini coefficient would not change (that is, the inequality would remain at asomewhat higher income level) and the poverty gap would still be as high as8.4 per cent of total income. The two measures, while costing the same, do notseem to be equally efficient at closing the poverty gap. This small exampleshows that the Gini coefficient and the poverty gap may be used to judge theredistributive efficiency of an anti-poverty benefit.
Figure 1.7 shows the impact on income inequality of the social assistancebenefit that brings everybody up to the poverty line (as shown in figure 1.6),using Lorenz curves to reflect income distribution before and after the socialassistance transfer. Total income after the social assistance transfer has againbeen normalized to 1. The normalized Lorenz curve of a general incomesupplement would be equal to the original, more unequal, Lorenz curve. Thisdoes not necessarily mean that total disposable income in the country remainsconstant after the new transfer has been introduced. The normalized Lorenzcurve merely measures relative inequality, which may occur at a level ofaverage income.
On the basis of these assumptions, two indices of the efficiency of the twoalternative redistributive measures (namely, the social assistance scheme versusthe general income supplement scheme) can be developed here. The first is the‘‘poverty target efficiency rate’’, which indicates what percentage of the totalincome transferred actually helps to close the poverty gap. The second is the‘‘inequality target efficiency rate’’, that is, the degree to which a redistributivemeasure reduces the inequality gap (the gap between the straight equality line infigure 1.7 and the ‘‘inequality lines’’). The reduction of inequality by means ofthe above-simulated social assistance scheme is shown in figure 1.7.
The area between the upper inequality curve (which describes the incomedistribution after social assistance transfers and normalization to 1) and thelower inequality curve (which describes the original unequal income distri-bution) is the absolute inequality reduction. The ratio between the amount ofincome represented by that area and the total income transferred by means ofthe redistributive measure is called here the ‘‘inequality target efficiency rate’’.
It should be noted in this context that social assistance schemes shouldnormally have a high level of poverty target efficiency and a substantial impacton income inequality. After all, they are designed to combat poverty andincome inequality. Other social transfer schemes, such as pension schemes, can
35
Basic concepts: Social protection and social transfers

be expected to have much lower poverty reduction and redistributive efficiencyratios. Naturally they redistribute a substantial part of their transfers amonghigher income groups, since they are designed to replace income for all groupsrather then aiming to close poverty gaps or reduce income inequality. Theireffectiveness and efficiency may be measured by a variety of other indicators,which are described in Chapter 7.
Poverty target efficiency is defined as:
PTE ¼ GDPðpg1 � pg2Þ=TTE ð1:7Þ
where pg1 stands for the aggregate poverty gap before or in the absence of thesocial transfer scheme to be analysed, and pg2 and TTE represent the totaltransfer (expenditure) volume of the scheme. Both poverty gaps have to becalculated on the basis of a poverty line that remains the same before and afterthe new transfers – hence, on the basis of an absolute poverty concept.
Inequality target efficiency is defined as:
ITE ¼ ðGini2 � Gini1Þ *TI1=TTE ð1:8Þ
where TI stands for total income in the group or society before any transfershave been made.
0
0.5
1
1.5
00.
20.
40.
60.
8 1
Income recipients
Inco
me
Equality
Cumulative function without poverty alleviation
Adjusted
Figure 1.7 Reducing the inequality gap by closing the poverty gap
Source: ILO.
36
Financing social protection

The indicator values for the above two alternative redistributive measureswould be as shown in table 1.5.
1.4.2 Factual evidence on the redistributive effects
of social transfers
Figure 1.8 shows the net effect of public transfers and taxes on poverty rates(i.e. the poverty headcount index, which is perhaps the most significantindicator of income inequality) in OECD countries – that is, countries withfairly extensive social transfer systems and well-developed tax systems. Theeffects are nothing less than dramatic. The reduction of pre-tax and pre-transferpoverty rates ranges from between some 30 percentage points in Sweden toabout 10 percentage points in the United States. In this context it is worthmentioning that the tax system itself can be used to make certain transfers. Taxbreaks for low-income or large families or tax subsidies for contributions tosocial or private insurance schemes, for example, can all be considered asformal – albeit implicit – transfers. Many of these tax-based benefits areinstruments of income equalization and thus explain a part of the redistributiondescribed in figure 1.8.
However, the above effects must be interpreted with some caution.Generally, pre-transfer income distribution and poverty rates are calculatedsimply by deducting the sum of the transfers from observed household incomes.This provides only an approximation of the effects of transfers on incomedistribution. What we do not know is the extent to which informal transferscould be expected to replace formal ones if the latter were indeed abolished. Inshort, when analysing post-transfer poverty rates and income distribution, thecounterfactual pre-transfer income distribution is only a theoretical construct. Itis difficult to believe, for example, that in the absence of a formal basic anti-poverty benefit, a society, families, neighbours or communities would simplylet the poor die. However, it should be clear that these informal transfers wouldnot be able to achieve the same equality of treatment and benefit security asformal systems. Without entering into an ideological debate, it appears clear
Table 1.5 Measuring the efficiency of two alternative transfers
Measure PTE(Poverty target efficiency)
ITE(Inequality target efficiency)
Social assistance scheme that pays incomesupplements to all personswhose income is below the poverty line
1.00 0.80
General income supplementof 12% of income for all
0.7 0.0
Source: ILO calculations.
37
Basic concepts: Social protection and social transfers

that all transfers involve some efficiency loss as a result of moral hazard andreplacement effects caused by people receiving transfers even though theymight have access to alternative income from work or informal transfers. Thereis no perfectly efficient transfer system. There are always hidden transactioncosts, even if our theoretical efficiency measures indicate a high level ofefficiency. This is the price to pay for living in a society that enjoys a highdegree of income security.
In general, the effect of social transfers on overall inequality is much lesspronounced. As can be seen from the example in section 1.4.1.1, social transfersystems may be ‘‘churning’’ substantial amounts of resources withoutimpacting significantly on the level of inequality – as measured, for example,by the Gini coefficient. They may even completely abolish absolute poverty bysimply shifting all incomes upward by an absolute amount, without affectingthe level of inequality. Theoretically, this could be achieved, for example, bysimply granting all members of a society a universal minimum incomeequivalent to the level of the absolute poverty line. Everyone’s income wouldincrease by the same amount, but the income disparities between individualswould remain constant – provided that this universal payment could be financedwithout regressing disposable incomes (for example, by using external sourcesof finance). It is therefore not surprising that the impact of transfers oninequality is less spectacular than their impact on poverty.
Table 1.6 shows the effect of transfers and taxes in selected OECDcountries. Data for other countries are scarce or non-existent. It should also benoted that almost all industrialized countries experienced some increase in
0
10
20
30
40
Austra
lia
Belgium
Canad
a
Denm
ark
Finlan
d
Franc
e
Germ
any
Irelan
dIta
ly
Nethe
rland
s
Norway
Sweden
United
King
dom
United
Sta
tes
Pre-tax and pre-transfer poverty rates Post-tax and post-transfer poverty rates
Figure 1.8 Pre-tax and pre-transfer versus post-tax and post-transfer poverty
rates, selected OECD countries, mid-1990s (total populations)
Source: ILO.
38
Financing social protection

wage inequality during the 1980s. Inequality increased most in the UnitedKingdom and the United States, and least in the Nordic countries (Gottschalkand Smeeding, 1997, p. 661). This may indicate that many societies’ attitudestowards income equality are changing.
However, a relatively minor effect on inequality does not necessarily meanthat formal and informal transfers are not achieving their objectives. In mostcountries, taxes are clearly designed to reduce inequality. Not all transfers havethe same objective. The impetus for social transfers is not exclusively need,perceived need or inequality.
Social protection transfers also redistribute income in cash and in kind (suchas health services) to people who are not poor and who could afford tolive without a public pension, or who could afford – up to a certain limit – topay out of pocket for their health services. The fact that the measurable incomeequalization effect of social transfers is smaller than what might be expected inview of the overall levels of expenditure – can in part be explained by a moreextensive use of some social protection benefits (such as ‘‘free’’ health care oreducation) by higher income groups. This does not necessarily mean that suchtransfers are inefficient or ineffective.
They are ineffective only if they fall short of achieving their objective. Andthey are inefficient only when they are achieving that objective with anexcessive use of resources. Many transfers are designed to transfer or replaceincome regardless of need but based on a set of explicit (in formal systems) orimplicit (in informal systems) entitlements. A rich person may receive a basicuniversal pension simply because he or she has paid contributions or taxes for aspecific, stipulated period. The pension is what is due to him or her in exchange
Table 1.6 Effect of earnings, capital income, transfers and taxes onGini coefficients, selected OECD countries, mid-1990s
Country Original pre-taxand transferGini coefficientof earnings
Effect of incomefrom capital andself-employment
Transfers Taxes Final post-capital,tax and transferGini coefficient
Australia, 1995 36.5 11.0 �3.0 �15.5 28.9
Canada, 1995 29.7 15.4 �1.3 �15.1 28.7
Denmark, 1994 26.6 9.9 �3.0 �13.0 20.5
France, 1994 25.3 9.2 �0.9 �5.9 27.7
Germany, 1994 33.3 8.6 0.0 �13.8 28.1
Italy, 1993 12.6 34.4 1.2 �14.0 34.2
Sweden, 1995 35.0 5.8 0.4 �16.4 24.7
United Kingdom,1995
28.4 15.6 �2.5 �11.2 30.4
United States,1995
38.5 10.6 �0.5 �15.2 33.3
Source: Forster and Pellizzari, 2000, pp. 87 ff.
39
Basic concepts: Social protection and social transfers

for the payment of contributions or taxes on the basis of an explicitly writtencontractual arrangement between the payer and his or her social protectioninstitution. In an informal context, a daughter’s dowry, for example, may not bestrictly necessary, since the groom may be wealthy enough to provide a decentstandard of living for the new couple; yet there are implicit rules or contracts insociety that dictate such transfers.
It might seem reasonable, then, to abolish benefits for people who have noreal need for them. Surely it would be more efficient economically to focus thewhole transfer system on transfers paid out of general taxation to people inneed. Why not simply adopt a no-fault attitude to poverty and give people whatthey actually need without operating huge redistributive insurance mechanismsthat do not seem to make much difference in the distribution of income?
Most transfers are constructed the way they are for good reason – namely,public acceptance of transfers that go beyond strict effectiveness or efficiencycriteria in risk management. As mentioned, one function of social transfersystems is to prevent poverty. The public perception is that this can and, tosome extent, should be done by forcing individuals to earn entitlements tocertain transfers in cases of defined contingencies. Regardless of whether theindividual is in strict material need or not, these benefits will be paid wheneverthe contingency arises. No charity aspect is involved, no stigma, simplyindividual rights and entitlements. Having a right, an entitlement, is a value initself. People are more likely to contribute to an insurance contract that providesthem with self-earned income security. They are more likely to accept implicitbenefit reductions as a consequence of redistributive transfers from the rich tothe poor, often built into such transfer systems (for example, through thepayment of income-dependent contributions in health insurance schemes, whilebenefits are essentially needs-based) than financing the payment of anexclusively pro-poor benefit out of general taxes. The sum total of taxes pluscontributions collected in a society that establishes inalienable rights-basedbenefit entitlements may be higher than in a society that relies exclusively onneeds-based and means-tested benefits (see discussion in Chapter 4).
However, transfers operated by state or parastatal entitlement-basedinsurance systems may also be inefficient. Unnecessary benefits may be provided,triggered merely by the availability of resources (for example, high-cost‘‘luxury’’ accommodation in hospitals). If not strictly designed or administered,transfers may also foster excessive dependency by encouraging individuals tolive on benefits even though they could be economically productive (as in thecase of overly generous student grants or entitlement to premature retirement).
To sum up, all that this means is that actual social expenditure as reflectedby national statistics or surveys does not indicate whether transfers are effectiveand efficient. A high level of social transfers overall could conceivably becombined with extreme inequality within a society. The question here iswhether a certain normal level of transfer efficiency in a society can beestimated as a benchmark for broad efficiency checks of national social transfer
40
Financing social protection

systems. Such an estimation should include formal (private and public) andinformal transfers, in order to permit a true comparison between countries withdominantly formal transfer systems and countries with dominantly informalsystems. A normal level of efficiency would be defined as a level where allmembers of society would be guaranteed a certain level of consumptiondeemed adequate according to national societal values. Section 1.5 sets out toestablish a first estimate of total normal transfer levels in societies. This is newmethodological territory.
1.5 ESTIMATING OVERALL NORMAL TRANSFER LEVELS
If it is accepted that the ultimate purpose of social transfers is to achieve anadequate level of consumption across all groups of society, then it should bepossible to determine a normal level of transfers by assuming normal con-sumption levels for the different active and inactive groups. On the basis of suchconsumption levels, we can establish a normal level of total (informal andformal) social transfers that a society must accept if it wants to provide a certainagreed-upon level of consumption to the inactive sector of the population.
Thus, the necessary overall volume of income transfers is determined by:
. the demographic situation and employment in a country (which togetherdetermine the level of overall dependency in society); and
. society’s ethical norms concerning the ‘‘adequate’’ level of consumption forinactive members of that society.
Once a country has accepted an ethical norm, what remains is the selectionof the portfolio of formal and informal redistributive mechanisms by which thenecessary transfers will be achieved.
The exercise set out in box 1.3 shows the results of estimating the normallevels of transfers in different regions.10 The estimates refer to the period from1990 to 2050. As a basis for this (admittedly highly abstract) exercise, a simplestatic model which assumes that employed active persons earn all the income ina society (wages plus profits) was developed. The central outputs of the modelare the ratios of the three basic types of transfers (transfers to children, to theelderly and to inactive persons of active age) to total earned annual income inthe country and the sum of those transfers, which represents the total of socialtransfers. This total is called the total normal transfer ratio. The exercise findsthat, should the model calculations hold true, the total transfer ratios that mostregions (with the exception of Africa and Asia) might have to expect within thenext 50 years are in the order of 40–50 per cent of GDP – not dramaticallydifferent from present levels in most cases. This level of transfers could belowered substantially by measures that would contribute to the reduction ofdependency, such as greater labour force participation of women or higherretirement ages.
41
Basic concepts: Social protection and social transfers

Box 1.3 Calculating and projecting total social transfer ratios
For all the regions the per capita income earned by the employedpopulation is set to 100 currency units in the starting year of the exercise(1990). It is then assumed that the active employed population wouldshare this income with children, inactive persons in the active age group,and persons past active age. The initial assumption is that the ratio of achild’s level of consumption to that of an active employed person is 0.25to 1, that of an inactive person to that of an active person is 0.75 to 1, andthat of a person past active age to that of an active employed person is,again, 0.75 to 1. This is, of course, a discretionary assumption. Otherassumptions could be tested as well.
The following other (conservative) assumptions are made:
(1) Future activity rates are kept constant for each age group in the basescenario, but alternative scenarios were also tested, involving agradual increase of the retirement age and a gradual increase offemale labour force participation in the labour market:
. increase of the retirement age by five years between 2000 and2050 (at a rate of one year every ten years);
. female participation rates equal to at least 80 per cent of maleparticipation rates in 2050, for each age group.
(2) In industrialized countries (OECD and Central and Eastern Europe),reduced rates of growth for total employment are assumed for futureyears compared to those observed between 1950 and 1995. For theother regions, where benefits paid to the unemployed are limited, it isassumed that all active persons pursue some form of gainful employ-ment (in either the formal or the informal sector). The effective rates oftotal employment growth are shown in box table 1.3.1.
(3) The household income share of GDP remains constant throughout theprojection period and incomes increase in line with real GDP growth.
Box table 1.3.1 Assumed rates of employment growth for model calculations
Regional basis of classification Annual rates of employment growth (%)
1950–95 1995–2050
OECD – Europe 0.4 �0.4
OECD – Others 1.5 0.3
Central and Eastern Europe 0.4 �0.3
Central Asia 2.3 1.0
Asia 2.0 0.9
Arab States 3.0 2.6
Africa 2.4 2.4
Latin America and the Caribbean 2.7 1.0
Average for all regions 1.8 1.0
Source: ILO.
42
Financing social protection

Since the consumption differentials between the payers and recipientsof transfers are kept constant throughout the projection period, theestimates of the normal rates of transfer largely reflect changes in thedemographic environment. As long as the differential between GDPgrowth and productivity does not change and the assumption of aconstant profit and wage share of GDP is maintained, variations of thereal rate of growth do not affect the relative transfer ratios. Theprojections are thus relatively robust with respect to the economicassumptions. Box table 1.3.2 shows the result of the exercise.
Box table 1.3.2 Estimated percentage of total income transferred to inactives(model calculations)
Tranfers to retirees only Transfers to all inactives
i) Constant replacement rates, retirement age and labour force participation rates
Regions 1950 1995 2050 1950 1995 2050
OECD – Europe 20.7 26.7 40.6 45.2 42.3 49.3
OECD – Others 15.4 19.8 32.3 41.3 36.3 42.9
Central and Eastern Europe 13.3 22.7 34.7 35.1 39.6 43.4
Central Asia 15.5 12.9 25.0 39.5 34.1 36.9
Asia 9.0 10.1 24.6 34.5 31.8 37.8
Arab States 13.3 9.5 20.0 51.3 47.2 44.3
Africa 7.6 8.1 13.0 37.8 39.5 31.1
Latin America þ Caribbean 11.8 12.1 28.4 47.9 39.9 44.1
All regions 11.7 13.0 23.9 37.4 34.4 38.0
ii) Increasing labour force participation rates for women
Regions 1950 1995 2050 1950 1995 2050
OECD – Europe 20.7 26.7 37.6 45.2 42.3 45.0
OECD – Others 15.4 19.8 30.1 41.3 36.3 39.3
Central and Eastern Europe 13.3 22.7 33.5 35.1 39.6 41.8
Central Asia 15.5 12.9 23.1 39.5 34.1 33.5
Asia 9.0 10.1 20.9 34.5 31.8 30.7
Arab States 13.3 9.5 13.2 51.3 47.2 26.7
Africa 7.6 8.1 11.0 37.8 39.5 24.8
Latin America þ Caribbean 11.8 12.1 22.3 47.9 39.9 32.8
All regions 11.7 13.0 20.4 37.4 34.4 31.0
iii) Gradual increase of retirement age
Regions 1950 1995 2050 1950 1995 2050
OECD – Europe 20.7 26.7 32.6 45.2 42.3 43.0
OECD – Others 15.4 19.8 29.9 41.3 36.3 40.5
Central and Eastern Europe 13.3 22.7 31.3 35.1 39.6 40.4
Central Asia 15.5 12.9 22.1 39.5 34.1 34.0
Asia 9.0 10.1 22.3 34.5 31.8 35.7
Arab States 13.3 9.5 18.4 51.3 47.2 43.2
Africa 7.6 8.1 12.0 37.8 39.5 30.0
Box 1.3 (cont’d)
43
Basic concepts: Social protection and social transfers

Box table 1.3.2 (cont’d)
Tranfers to retirees only Transfers to all inactives
Latin America þ Caribbean 11.8 12.1 26.2 47.9 39.9 42.3
All regions 11.7 13.0 21.9 37.4 34.4 36.1
iv) Reduced benefits (from 75% in 2000 to 60% in 2050)
Regions 1950 1995 2050 1950 1995 2050
OECD – Europe 20.7 26.7 35.3 45.2 42.3 45.5
OECD – Others 15.4 19.8 27.7 41.3 36.3 39.6
Central and Eastern Europe 13.3 22.7 29.8 35.1 39.6 39.8
Central Asia 15.5 12.9 21.0 39.5 34.1 34.2
Asia 9.0 10.1 20.7 34.5 31.8 35.2
Arab States 13.3 9.5 16.7 51.3 47.2 42.7
Africa 7.6 8.1 10.7 37.8 39.5 29.6
Latin America þ Caribbean 11.8 12.1 24.1 47.9 39.9 41.5
All regions 11.7 13.0 20.1 37.4 34.4 35.5
v) All of the above (ii, iii, iv)
Regions 1950 1995 2050 1950 1995 2050
OECD – Europe 20.7 26.7 26.2 45.2 42.3 36.8
OECD — Others 15.4 19.8 25.2 41.3 36.3 37.6
Central and Eastern Europe 13.3 22.7 25.8 35.1 39.6 35.3
Central Asia 15.5 12.9 17.2 39.5 34.1 28.3
Asia 9.0 10.1 15.9 34.5 31.8 26.2
Arab States 13.3 9.5 10.0 51.3 47.2 23.8
Africa 7.6 8.1 8.4 37.8 39.5 22.5
Latin America þ Caribbean 11.8 12.1 17.2 47.9 39.9 28.4
All regions 11.7 13.0 15.7 37.4 34.4 27.0
Source: ILO.
The overall ‘‘normal’’ level of transfers defined as a share of GDP willprobably increase slightly across all regions over the next five to sixdecades. Transfer increases in OECD and Central and Eastern Europeaneconomies (due to rapidly ageing populations) contrast with decreasingtotal transfers in developing countries (due to dropping fertility rates).In regions with rising ‘‘normal’’ levels of transfers, the magnitude of theincrease can be corrected by appropriate governance measures. Thisincrease will be particularly significant in Asia and Latin America, whichare undergoing rapid demographic transformation. By the middle of thiscentury, if conditions remain the same, the ratio of transfers to retirees inthese regions will be comparable to the current European ratio. In no region(except maybe Africa) will the total normal transfer ratio change dramati-cally during the next five and a half decades. This is rather surprising,given the prevailing opinion that social protection expenditure is growingunrestrainedly everywhere. In line with the ageing process taking place inall societies, the total transfer ratio will cover a marked structural shiftaway from child transfers and active-age transfers to old-age transfers.
Box 1.3 (cont’d)
44
Financing social protection

In a similar exercise, the ILO report to the International LabourConference11 compared the estimated overall level of transfers in theregions around the world with the statistically observed formal social transferratios (see figure 1.9). Although the methodology is not fully compatiblewith the exercise described above, this alternative approach confirms ourbasic finding concerning the present size of overall normal levels of nationaltransfers.
Under the umbrella of ‘‘normal’’ income redistribution achieved by thetotality of all formal and informal redistributive measures, the proportionof formal transfers (implemented through formal social protectionsystems) increases with the level of economic development. This increasingshare reflects the changes in family and social structures that normallyaccompany economic developments that lead to increasing reliance onformal social transfers. It also reflects increasing population coverage andthe increasing sophistication of benefit entitlement schemes. Yet even inOECD countries, the formal social protection expenditure projected on thebasis of the same assumptions is smaller than the estimated total normaltransfer ratio.
The increase in formal social transfers in developing countries is, to a largeextent, a consequence of a maturation process. Our model simulations showthat the overall level of formal social expenditure will also increase in virtuallyall regions with mature systems, albeit more slowly than in developing
0
5
10
15
20
25
30
35
40
East Africa South-East Asia Eastern Europe Western Europe North America
%
Formal public transfers Informal private transfers
Figure 1.9 Estimated total transfers and their composition (as % of GDP),
selected regions, early 1990s
Source: ILO (2001a).
45
Basic concepts: Social protection and social transfers

countries. However, these increases, observed over the span of five and a halfdecades, are less then dramatic, and can be corrected by policy measures. Evenwithout correction the overall level of formal transfers is and will most likelystay well within the necessary total levels as assessed on the global normalbasis.12
Assuming a steady path of economic development one can infer that – witha time lag of several decades – developing countries will achieve a similar ratiobetween formal social protection transfers and the overall level of transfers.For the time being, the vast majority of all social transfers in these societiesare still made through informal arrangements.
Although the above methodology may provide a reasonable approximationof normal transfer levels, it cannot serve as a basis for assessing theeffectiveness and efficiency of formal national social transfer systems. Suchassessments require a much more detailed performance analysis (see Chapter 7).Nevertheless, it can be stated that the mature formal sector schemes in OECDand Central and Eastern European countries do not, on average, seem togenerate excessive overall expenditure levels. This does not automaticallyexclude the possibility that some NSPSs may be too generous in their benefitprovisions or are wasteful owing to excessive administrative costs, for instance.In these cases public acceptance of expenditure levels might deteriorate infuture.
1.6 ESTIMATING MINIMUM LEVELS OF FORMAL
SOCIAL PROTECTION
The exercise described in box 1.4 takes the normative assessment of minimumlevels of social protection transfers one step further. Cichon and Hagemejer(1996) have tried to estimate the minimum level of social transfers necessaryfor a typical country in transition. It was assumed at the time (in the mid-1990s, i.e. early on in the transition process) that the country would provide arealistic level of benefits under current circumstances (i.e. replacement rates of50 per cent of average wages by cash benefits) and that the poverty level (inthe base scenario) would be 30 per cent. This poverty level was not anunrealistic assumption for most Eastern European countries at the time. Theestimated minimum transfers required to keep people above the UNICEF-defined poverty lines would be around 24 per cent of GDP. That this estimateis ‘‘not far from the truth’’ was demonstrated by a recent social budgetexercise in Ukraine. The joint national and international task force establisheda current level of social expenditure of some 20 per cent of GDP, but thepresent social protection system cannot close the existing poverty gapcompletely.
46
Financing social protection

Box 1.4 Quantifying a minimum level of social protection expenditure in
a transition country1
For the calculation of minimum levels of social protection, a few basicstructural and standard assumptions are needed. All of them are country-specific. For the sake of argument and for demonstration purposes, herewe have used figures that may be considered typical for Central andEastern European countries:
Structural assumptions (base scenario):
(1) Demographic composition2
population under 20: 29 per centpopulation between 20 and 64: 58 per centpopulation 65 and over: 13 per cent
(2) The system dependency rate can be kept at the 50-per cent level(which implies that current actual retirement ages must beincreased).
(3) Employment rate: 80 per cent ofworking-agepopulation
(4) Registered unemployment: 15 per cent(5) Poverty rate3 in total population: 30 per cent
poverty gap: 30 per cent of thepoverty line
(6) Wage share of GDP: 40 per cent4
(7) Employment in health services: 5 per cent of totalemployment
(8) Share of staff costs in health services: 50 per cent5
(9) Sickness and maternity result in an average absence rate of 7 per cent(6 per cent for sickness and 1 per cent for maternity).
(10) The overall administrative cost of all benefits, including maintainingthe accounts of social care institutions, is included in average benefitcalculations.
Normative assumptions (base scenario):
(11) The beneficiary rate in the unemployment benefit system is70 per cent.
(12) An average benefit replacement rate of 50 per cent of the averagewage, with a minimum equal to the poverty line (45 per cent of the1993 average wage)6 for all cash benefits, is acceptable to thepopulation.
(13) Limiting family benefits to an average recurrent benefit of one-thirdof the poverty line is acceptable.
On these theoretical assumptions, the ‘‘rule of thumb expenditurelevel’’ for a country with the demographic, economic and social protection
47
Basic concepts: Social protection and social transfers

structure described above – that is, the minimum cost of social protection –would be 25.4 per cent of GDP. It should be stressed that theseassumptions would require all cash-benefit recipients to settle for anincome equal to or only slightly higher than the poverty line. The long-term political acceptability of these assumptions is highly questionable.
The overall expenditure level is, of course, highly sensitive to variousparameters. This sensitivity was tested using a simple deterministicmodel.7 The base scenario established by the above assumptions wasmodified as follows:
Variant I – Older population: 22 per cent of the population under 20, 58 percent between 20 and 64, 20 per cent 65 and over,8 all other assumptions asin the base scenario.Variant II – High unemployment: employment rate of 65 per cent andunemployment rate of 25 per cent, all other assumptions as in the basescenario.Variant III – Low share of wages in GDP: wage share of GDP reduced to 35per cent, all other assumptions as in the base scenario.Variant IV – Poverty line replacement rates: average replacement ratesreduced to the poverty line, all other assumptions as in the base scenario.Variant V – High poverty: poverty rate increased to 50 per cent of thepopulation, all other assumptions as in the base scenario.
The base scenario and the above modifications yield the crudeestimates of overall hypothetical social protection expenditure shown inbox table 1.4.1.
Box table 1.4.1 Cost of national social protection (as % of GDP): Modelcalculations
Base
scenario
Variant I
Older
population
Variant II
High
unemployment
Variant III
Low share of
wages in
GDP
Variant IV
Poverty line
replacement
rates
Variant V
High
poverty
Pension scheme 10.0 15.7 10.0 8.8 9.0 10.0
Short-term benefits 1.4 1.4 1.4 1.2 1.3 1.4
Unemploymentbenefits
2.8 2.8 5.8 2.4 2.5 2.8
Family benefits 3.8 2.9 4.6 3.3 3.8 3.8
Health care 4.0 4.5 5.4 3.5 4.0 4.0
Social assistance 3.5 3.6 5.0 3.1 3.5 5.8
Total 25.4 30.8 32.2 22.2 24.0 27.7
Source: ILO-CEET.
As can be seen in the table, overall social protection expenditure levelsare very sensitive to ageing, poverty levels and wage shares of GDP. Theageing assumptions adopted in variant I are extreme, positing that the
Box 1.4 (cont’d)
48
Financing social protection

population sector of pensionable age increases by more than 50 per centin comparison to the base scenario. Such a major shift in any populationwould normally take many decades. In addition, the model assumes thatthere is no long-term feedback between ageing and population employ-ment levels, which is a very conservative view. It can be assumed that partof the demographic burden will in future be eased by increased labourforce participation.
Notes
1 The case in this box was taken from Cichon and Hagemejer (1996).2 Approximate Bulgarian structure for 1991.3 Poverty rates and poverty gaps are median assumptions based on UNICEF data; see UNICEF
(1994), p. 2.4 Data on wage shares of GDP are scarce. United Nations data give 1991 figures of 58 per cent
for Hungary and 43 per cent for Bulgaria, including the employers’ share of social security
contributions. In Poland, the 1991/1992 share of wages and other labour costs was 48–50 per
cent. Discounting social security contributions would produce a gross wage share of between
30 and 40 per cent of GDP. The assumed 40 per cent might thus already be normative. For
purposes of comparison, the respective values for Belgium and Germany in 1991 were
54 per cent and 55 per cent.5 Bulgarian data (ILO/EU Commission, 1994).6 UNICEF uses 35 per cent of the 1989 real wage as its lowest national poverty line, which
implies that the equivalent line for 1993 is much higher, since real wages have deteriorated
dramatically since 1989 (for example, by 54 per cent in Ukraine, about 40 per cent in Albania
and about 20 per cent in the Czech Republic). In order to update the poverty line, the Czech
decline in real wages (the lowest in the region) was used here. The poverty line and poverty
rates used here are therefore extremely conservative.7 As far as basic actuarial cost estimates are concerned, this model is a simplified version of the
ILO social budget model ESTEEM (Employment and Social Transition Expenditure Model),
suppressing the macroeconomic modules of ESTEEM, as well as most of the macroeconomic
and internal social protection feedbacks (see ILO/EU Commission, 1994). This model serves
here merely as a means of demonstration; it cannot by any means substitute for a full
quantitative analysis of national social protection systems, using the bigger model.8 The ageing of the population leads to an increase in the per capita cost of health care. Based
on a crude age-specific cost profile observed in Western Europe in the early 1980s (see ILO,
1989, pp. 129–130), it is estimated here that the assumed shift in the age structure leads to an
average per capita increase of 12.5 per cent in health care expenditure compared to the base
scenario.
Box 1.4 (cont’d)
49
Basic concepts: Social protection and social transfers

1.7 NORMAL TRANSFER LEVELS AND
THE AFFORDABILITY DEBATE
Many formal NSPSs around the world – notably in OECD countries – arecurrently being challenged on the grounds that they are too extensive and/or tooexpensive to be economically affordable. The arguments are often simplistic;using international comparisons to allege high levels of national socialexpenditure may suffice in a political debate.
Without entering into the economic aspects of affordability at this point, ourprevious observations concerning normal transfer ratios indicate that suchsimplistic challenges may be more political than factual. The demographicsituation and economic activity rates in the OECD and Central and EasternEurope necessitate a higher level of total transfers than those that are and willprobably continue to be provided through formal social protection systemsunder status quo conditions. Any decent society has to redistribute a certain‘‘normative’’ share of the total income earned by its active and employedmembers to its inactive members, in order to keep them out of poverty ordestitution, or to provide them with an explicitly or implicitly agreed-uponstandard of living. In virtually all societies the level of transfers will primarilyreflect societal values.
As long as normal transfer levels are higher than the observed formal levels,transfers may be inefficient, but there is a priori no reason to believe that,overall, formal transfer levels are not affordable. Again, this does notautomatically mean that the general level of formal transfers is accepted, orthat the level of formal transfers in any of the chief categories of socialexpenditure is accepted. A society might prefer to channel a major part of thesesocial transfers through informal arrangements. Giving in to political pressureto reduce formal systems will probably increase informal transfers to someextent. The net effect on total transfers may even be neutral. However, the effectof shifting transfers from formal to informal transfers will very likely increasethe disparity of benefit levels between different groups in society. Accepting ahigher benefit disparity is also clearly a matter of societal values.
The key to answering the question as to whether formal social transfer systemsare affordable or not does not lie in an abstract analysis of overall expenditure(however tempting that may be), but rather in an analysis of transfer efficiency – thatis, whether they achieve the objectives dictated by societal values with the fewestpossible resources. If resources are wasted, there are social or economic opportunitycosts. The unavailability of those resources for other purposes may have a negativeimpact on the GDP and hence on the public welfare.
The effectiveness of transfer systems is relatively easy to establish. Eitherthey close the poverty gap or they do not; either they provide all elderly peoplewith pensions or they do not. Efficiency, however, is harder to define, except inthe case of anti-poverty benefits. Sometimes high transaction costs, normallyinterpreted as an indication of waste, might still be considered efficient if they
50
Financing social protection

‘‘buy’’ societal acceptance of necessary transfers. As long as we do not knowexactly how to define waste, we are not in a position to answer the affordabilityquestions as clearly as we would like to.
1.8 SUMMARY
The most important fact to bear in mind is that social protection takes placein all societies. Economically, social protection systems are essentiallytransfer systems, transferring income or improved consumption. Formal socialtransfer systems or national social protection systems (‘‘welfare states’’, in asomewhat looser definition) are only one part of a society’s overall socialtransfer system which comprises formal and informal transfers. There is clearevidence that formal social protection systems are an effective means ofmodifying pre-transfer income distribution. In some countries formal transfersystems have quite a spectacular impact on national poverty rates, even if thecounterfactual distribution (that is, what income distribution would have beenwithout formal transfers) is unknown. The impact on income inequality is lesspronounced.
On the whole, in almost every society overall social transfers appear toextend beyond the formal transfer system. There is room – in fact, a need – forsocial transfers in any society, and that room is apparently not completely filledby formal schemes.
Against this background, the debate on the economically affordable level ofsocial expenditure seems somewhat academic. The real question behind thedebate on economic affordability has little to do with the level of expenditure,since a certain normal level of ‘‘expenditure’’ – or, better, transfers – will beincurred in any case (determined only by the ethical standards of a society). Aslong as that level is accepted, the global allocation of resources to socialtransfers will not be questioned. However, this does not necessarily mean thatthe actual pattern of transfers – that is, the portfolio of transfer mechanismschosen by the country in question – will not provoke negative reactions thatmay impair economic performance. Neither does it mean that current levels ofsocial expenditure are efficient. The core of the affordability debate is thus thepolitical acceptability and financial, economic and fiscal efficiency of theexisting pattern of financing transfers in general.
Maintaining the economic affordability and political acceptability ofnational social protection systems translates in practice into:
(a) the policy problem of achieving consensus on a specific mix of formal andinformal mechanisms for financing an implicitly or explicitly agreed-uponlevel of benefits;
(b) the governance problem of ensuring social effectiveness, and financial andfiscal efficiency.
51
Basic concepts: Social protection and social transfers

Societies can afford to share as long as they agree to share and as long as theybelieve that the way they have chosen to share is effective and efficient. Ensuringeffectiveness and efficiency is the challenge we will take on in the followingchapters.
Notes
1 Evidence for this is provided, for example, by Simister and Piesse (2002) for South Africa, andKoolwal and Ray (2002) for Nepal.
2 This section draws heavily on the concepts and definitions used by Hagemejer (2000).
3 See Cichon and Samuel (1995), pp. 1–2.
4 Under certain conditions they can be regarded as substitutes for government-inducedarrangements.
5 The system and the figure include voluntary private arrangements which are used in some Germandefinitions but, as pointed out earlier, fall outside the general scope of this book.
6 Micro-simulation models are models that operate on a disaggregated household basis. They aregenerally used to assess the effects of certain transfer schemes on the income of different types ofhouseholds. If well designed they may be almost perfect substitutes for costly pilot studies. The basic‘‘modelling philosophy’’ of micro-simulation models is explained briefly in Scholz et al. (2000), pp. 79 ff.
7 There are various other inequality indexes (e.g. Atkinson’s). See Barr (1993), p. 158.
8 See, inter alia, the discussion in Barr (1993), pp. 139 ff. The United States official poverty measureis discussed in Citro and Michael (1995), pp. 24 ff.
9 As described, for example, in Forster and Pellizzari (2000), pp. 66 ff.
10 The first exercise of this nature was developed by Gillion (1996). The calculations used here wereundertaken by Denis Latulippe of ILO FACTS in 1997.
11 See ILO (2001a), Chapter 5: ‘‘The Financing of Social Security’’. This estimate of the total normalsocial transfer ratio assumes that the economically active population (including the unemployed) earns allthe income in a country (i.e. profits and wages) and is willing to share this income with children, inactivepersons in the active-age group, and persons past the active age. It is assumed here that the relation of aneconomically inactive person’s consumption to that of an active person is 0.666 to 1. This is, of course, adiscretionary assumption. It assumes implicitly that a shift of dependents between old and young agegroups will not necessarily change the overall degree of sharing. Added to cash transfers are crudeestimates for the regional cost of health care, which are largely transfers in kind between groups as well aswithin groups. The transfer costs of unemployment benefits have been left out, since the data situationwould lead to compatible figures between the developed and developing world. Formal transfers
Further reading
To find out more about standard social accounting conventions, see:
. Scholz et al. (2000), Part II
For more information on poverty and inequality, turn to:
. Barr (1993), Chapter 5
. Atkinson (1995d), Chapters 3 and 10.
52
Financing social protection

amounting to about 2 per cent of GNP could be added to the transfer ratios in Europe, North Americaand Oceania. In this case we would have to add informal transfers to the countries of the developing world,where the concept of unemployment is less clearly defined.
12 However, caution is advised when interpreting a high share of formality at an overall ‘‘normal’’transfer level as a desirable sign of development. A much more detailed analysis is necessary before thatconclusion can be drawn. In a recent social budget exercise the ILO estimated a present overall formalsocial transfer level of 10 per cent for Turkey. The difference between this and the characteristics of themature schemes in OECD and Central and Eastern European countries can be explained to a large extentby the different demographic structure and the fact that the Turkish system is far from mature. Thepension scheme, for example, has reached population coverage of only about 40 per cent of the employedlabour force. A calculation of the ‘‘normal’’ level of expenditure that could be estimated on the basis ofthe standard assumptions above shows that Turkey, like any developing country, still has a long way togo in formalizing its social transfers. This could be interpreted as an indicator of low social development,which in this case would be misleading. A closer analysis of the case also indicates the difficulty ofmaking any global assessment of the adequacy of present social expenditure. Turkey still ‘‘pensionspeople off’’ much too early, and the present demographic ratio (i.e. the ratio of pensioners tocontributors) is well above the ratio that would be demographically justifiable. The present overall levelof formal social transfers – even at the observed comparatively low level – is thus too high rather thantoo low.
53
Basic concepts: Social protection and social transfers

ANNEX 1-A1 DEFINING THE TERM
‘‘SOCIAL PROTECTION’’
This annex explains and discusses the definition of formal social protectionused in this book. The starting point is the definition adopted by the StatisticalOffice of the European Union (ESSPROS), which is itself rooted in thedefinition used in ILO Social Security (Minimum Standards) Convention, 1952(No. 102), but extends it by including the risk of ‘‘social exclusion’’. As definedby ESSPROS, social protection ‘‘encompasses all interventions from public orprivate bodies intended to relieve households and individuals of the burden of adefined set of risks and needs, . . . provided that there is neither a simultaneousreciprocal nor an individual agreement involved’’ (EUROSTAT 1996, p. 12).
The term ‘‘intervention’’ covers the financing of benefits and relatedadministration costs, as well as the actual provision of benefits. The main formsof benefits are cash payments to protected persons, reimbursement ofexpenditure made by protected persons, and the direct provision of goodsand services to those persons. This category should also include tax rebates orsubsidies offered to individuals (reductions in taxes or social contributions paidby individuals or households). In specific cases, such as measures of labourmarket policies, we might also include indirect benefits in the form ofpreferential tax rates, tax rebates or subsidies that, although directed primarilyat the production side of the economy, indirectly protect households (forexample, wage subsidies paid to employers to encourage the recruitment oflong-term unemployed). However, these measures should be clearly separatedfrom the core social protection benefits provided directly to individuals andhouseholds.1
The following is the minimum list, used in ESSPROS and in this book, ofneeds and functions covered by social protection systems:
(1) sickness (income maintenance and support in cash in connection withphysical or mental illness, excluding disability);
(2) health (health care needed to maintain, restore or improve health,irrespective of the origin of the disorder);
(3) disability (income maintenance and support in cash or kind – except healthcare – in connection with the inability of physically or mentally disabledpeople to engage in economic and social activities);
(4) old age (income maintenance and support in cash or kind – except healthcare – in connection with old age);
(5) survivorship (income maintenance and support in cash or kind – excepthealth care – in connection with the death of a family member),
(6) family/children (support in cash or kind – except health care – in connectionwith the costs of pregnancy, childbirth and adoption, bringing up children orcaring for other family members);
54

(7) unemployment (income maintenance and support in cash or kind – excepthealth care – in connection with unemployment);
(8) housing (help towards the cost of housing);
(9) social exclusion not elsewhere classified (benefits in cash or kind – excepthealth care – specifically intended to alleviate poverty and social exclusionwhere not covered by one of the other functions).
This list of functions was established on the basis of European experience.For a wider application, particularly in developing countries, the list shouldbe extended. Benefits related to basic education and basic food and nutritionprogrammes should be included. Education benefits would cover free access topublic education, fee waivers, free textbooks, and so on. Food and nutritionbenefits would include food aid, food stamps and food subsidies.
With regard to various interventions and institutional arrangements directed atthe economically active in agriculture and at the rural population, it is sometimesdifficult to separate their social protection functions from their economic policyfunctions of subsidizing/protecting agricultural production. This is the case withmany social security schemes for farmers, on the one hand, and agriculturalinput subsidies or crop insurance arrangements, on the other. Although inputsubsidies and crop insurance may play a role in supporting the incomes of ruralhouseholds, they should not be classified as social protection schemes.
Another suggested extension of the core ESSPROS methodology concernsthe unemployment function and treatment of labour market policies. ESSPROSis limited in this respect to benefits provided directly to beneficiaries (indivi-duals and households) and excludes ‘‘indirect benefits’’, such as wage subsidiespaid to employers, or reductions in employers’ social security contributions/taxes as an incentive to recruit the unemployed. At the same time EUROSTAT(1999) is developing a separate statistical module database on labour marketpolicies. It covers a much wider range of measures than the core ESSPROSmodule, including not only direct transfers to beneficiaries but also transfers toemployers (in the form of wage subsidies and reductions in taxes or socialsecurity contributions). We suggest embracing this wider treatment of theunemployment function, while making a distinction between direct and indirectinterventions.
Table 1-A1.1 presents a proposed classification of social protectionfunctions, which we intend to follow throughout this book. It is the sameclassification as the one used in the ILO’s Social Protection Expenditure andPerformance Reviews (SPERs) (see Chapter 7). Lower-level classificationsshould focus, especially in the case of services, on categorizing basic servicesalong the lines of the UNICEF/UNDP 1998 study of public spending onbasic social services. Within the health care function in particular it should bepossible to distinguish basic health services (these would include prevention,reproductive health care and basic curative care).
55
Basic concepts: Social protection and social transfers

Table 1-A1.1 Classification of social protection functions
Main functions Possible lower-level classifications
I. Health care Prevention
Primary health care
Other health care
II. Sickness Paid sick leave
Other cash benefits
III. Disability
Disability cash benefits Disability pensions
Other cash benefits (includingtax benefits)
Disability benefits in kind Residential care, day care andrehabilitation, home-help servicesand others
IV. Survivorship
Survivors’ cash benefits Survivors’ pension (widows, widowers,orphans)
Other cash benefits (death grant, other)
Survivors’ benefits in kind Funeral expenses, etc.
V. Employment injury
Employment-injury cash benefits Temporary cash benefit to the insured
Disability pensions to the insured
Other cash benefits to the insured
Survivors’ pensions
Other cash benefits to survivors
Employment injury benefits in kind Health care
Other benefits in kind
VI. Old age
Old-age cash benefits Old-age pensions
Other cash benefits
Old-age benefits in kind Accommodation, care, etc.
VII. Family and children
Family and child cash benefits Maternity benefit
Birth grant
Parental-leave benefit
Family or child allowance
Other cash benefits (includingtax benefits)
Family benefits in kind Day care, accommodation,home help, other
VIII. Unemployment and labour market policies
Unemployment cash benefits Unemployment benefit (unemploymentinsurance, unemployment assistance)
Severance pay (redundancy compensation)
Early retirement for labourmarket reasons
56
Financing social protection

The lower levels of benefit classification should be adjusted to theparticular situation of the country. It is important to distinguish betweencash benefits and benefits in kind. Within the category of cash benefits wecan distinguish between periodic payments, lump-sum payments andreductions in taxes or social security contributions (tax benefits). Benefitsin kind include reimbursements and direct provision of goods and services.Another important distinction to be made is between conditional andunconditional benefits, which can be further categorized as means-tested ornon-means-tested.
In the definition used here, providers of social protection must be publicor private institutions (‘‘public or private bodies’’). Institutions of socialprotection are considered here as all institutions that administer a certain type ofbenefit or a variety of benefits. Clearly social insurance schemes are suchinstitutions. Governments, too, can act as social protection institutions. Theministry of finance collects general revenues. If a portion of these revenues(which does not need to be earmarked) is used to finance social protectionbenefits such as a national social assistance scheme or a national housingsubsidy scheme, then the ministries of welfare and of housing which maybe administering the schemes would be regarded as institutions of socialprotection. The crucial defining element is whether the institution provides ordelivers benefits.
Table 1-A1.1 (cont’d)
Main functions Possible lower-level classifications
Labour market programmes Labour market training
Placement services/job-search assistance
Job rotation and job sharing
Labour cost subsidies and reduction oftaxes/social contributions
Sheltered work (rehabilitation schemes)
Job creation in the public or non-profit sector
Start-up incentives
IX. Housing Cash benefits
Rent/energy subsidies
X. Social assistance and other Low income (cash, services)
Indigenous persons (cash, services)
Immigrants/refugees (cash, services)
Miscellaneous (cash, services)
XI. Basic education (primary) Cash benefits (including tax benefits) andbenefits in kind
XII. Food and nutrition Food aid, food stamps, food subsidies
57
Basic concepts: Social protection and social transfers

Note
1 The condition excluding simultaneous reciprocal agreements does not preclude the possibility thatsocial protection benefits might be conditional on some action to be undertaken by the beneficiary (suchas taking part in a vocational training programme) provided that this action does not have the characterof salaried work or sale of services. Within this category, social protection provided directly byemployers to their employees is limited to:
– the continued payment of normal or reduced salaries during periods of absence from work as a resultof sickness, accident, maternity, etc.;
– the payment of statutory special allowances for dependent children and other family members;
– health care not related to the nature of the work.
The exclusion of individual arrangements does not entirely rule out taking individual insurancepolicies into account. When an employer provides social protection to employees in the form ofinsurance, sometimes policies are taken out in the names of the individual participants. On the otherhand, not all collective contracts are necessarily taken into account. An insurance policy should beincluded in the scope of social protection if it is based on solidarity, whether or not it is taken out at theinitiative of the person insured. The insurance policy is based on the principle of social solidarity if, as amatter of policy, the contributions charged are not proportional to the individual exposure to risk of thepeople protected. Examples include schemes established specifically for persons belonging to the sameprofession or trade, insurance offered by mutual benefit societies, micro-insurance schemes andgovernment-based voluntary schemes open to certain categories of households (owners of smallbusinesses, farmers, etc).
58
Financing social protection

2THE SIZE OF THE WELFARE STATE:TRENDS, PATTERNS ANDDETERMINANTS OF SOCIALEXPENDITURE
Before discussing in the next chapters the full range of mechanisms thatcountries can use to finance a certain level of formal social expenditure throughsocial transfers or to assess the impact of the social protection system on theeconomy or the public budget, we need to consider the size and measurementof social expenditure as well as its structure, developmental patterns anddeterminants.
It is obvious that social expenditure changes along with the state ofeconomic development – generally it increases. These increases are driven bythree sets of factors:
(i) the demographic situation and development of a society;
(ii) the system of governance – that is, the set of entitlements to social benefitsthat reflects societal values and is codified in national laws or collectiveagreements, and the chosen patterns of supervision, management andadministration; and
(iii) the economic environment.
In the following sections we will describe past trends and offer someprojections of national social protection expenditure, analyse certain develop-mental growth patterns of social expenditure derived from observations andprojections, and discuss the impact of the above determinants on the totalvolume of social transfers.
Sound financial governance of a social protection system requiresmeticulous projections of social expenditure in order to establish the futurefinancial volumes that have to be met by different financing instruments. Themethodology for these expenditure projections is explained in full detail inthree other volumes of the Quantitative Methods series1 and will therefore not
59

be discussed here at length. The present chapter thus focuses on providing thereaders with a broad understanding of the general pattern of expendituredevelopments and its determinants. However, for the benefit of those readerswho will not have the opportunity to explore the methods for the projection ofexpenditure in various social protection benefits schemes, a methodology for asimple benchmark projection technique is explained in the form of exemplaryprojections.
2.1 SOCIAL EXPENDITURE RATIO: A BASIC MEASURE
AND ITS LIMITATIONS
Before setting out to analyse worldwide trends and expectations we need todefine the key indicator commonly used to measure social expenditure, namelythe social expenditure ratio (SER). This ratio is the total amount of allexpenditure on social transfers [Te(t)] in a year t related to the gross domesticproduct (GDP (t)) of the country in the same year t:
SERðtÞ ¼ TEðtÞ=GDPðtÞ ð2:1Þ
The SER is a relative concept. Absolute amounts of expenditure have littleexplanatory power, as they are directly dependent on variables such as the sizeof the country’s population or the level of income. They also neglect the aspectof purchasing power parities which needs to be taken into account ininternational comparisons. A few million US dollars can signify high overallsocial spending in countries of the Caribbean but would mean very little for theUnited States or even for its individual states. Ultimately, one would not expecta small country like Estonia, for example, to spend on social causes as much asits more populous neighbour, Poland. Most social transfers are directly orindirectly related to national income or GDP levels. Pensions, for example, arenormally related to the recipients’ former income or to the national averagewage. Their amount will hardly be set by law without regard to the nationalincome level. There are only a few countries that have no provisions in place tolink pensions in some way to the current level of income of the workingpopulation. Even the amount that a country spends on medical care, usually thesecond-largest expenditure item in national social budgets, will be related insome way to the general income level since provider incomes will have someconnection with the overall average per capita income. In fact, the major shareof health expenditure in most countries consists of staff cost (wages, socialsecurity contributions and other non-wage benefits). Relating social expendi-ture to the country’s GDP thus provides for a measure of internationalcomparability. This relative concept allows international comparisons, has anintuitive appeal and is moreover easy to calculate. In fact, the SER is currentlyboth the most widely used and the most aggregated performance indicatorfound in international comparisons.2
60
Financing social protection

However, there are some critical aspects that this indicator does not reveal.Measuring and projecting social expenditure alone is not an end in itself. It onlymakes sense if expenditure analysis is also used to ascertain whether the moniesinvested into the social sector are well (that is, effectively and efficiently) spent.This means that the SER should be accompanied by a thorough expenditureanalysis using a whole set of further indicators of effectiveness and efficiency.High expenditure does not automatically indicate effective or efficient spending.Consider, for example, the case of medical equipment or pharmaceuticals thatare covered by patent law and must be bought at high prices in internationalcurrency. They cause high expenditure but may produce very little health gainscompared to risk prevention strategies like a basic hygiene or HIV/AIDSawareness campaign. The expenditure for such campaigns may not even showup in national social protection accounts as they may be financed by educationalfacilities or employers. Moreover, the SER does not contain any informationabout the comprehensiveness and depth of the national social protection system(NSPS), nor does it provide any indication with regard to the distribution ofbenefits. Furthermore, it gives no indication as to whether monies entrusted tothe social transfer system are spent effectively with respect to the alleviation ofpoverty and social insecurity.
The determination and use of a disaggregated set of performance indicatorsfor national social transfer systems are thus one of the most important tasks ofsocial governance (see also Chapter 7) as they permit to identify anyshortcomings in the efficiency and effectiveness of social spending. Indeed,inefficiency may have very high cost: it may trigger adverse reactions such astax avoidance on the taxpayers’ side and, simultaneously, an abuse of benefits.Apart from the loss of resources spent inefficiently, the social protection systemin question is putting its credibility on the line. Detecting and abolishinginefficiencies inherent in existing social transfer systems can lead to amobilization of resources in the same way as the introduction of a new socialtax or contribution.
Chapter 7 provides a whole set of further performance indicators. However,when it comes to assessing the adequacy and performance of national socialprotection systems, the SER remains – for want of a better indicator – the firstport of call.
2.2 EXPENDITURE TRENDS AND PATTERNS
Based on observed past expenditure developments in the different regions, thissection describes typical developmental and structural patterns of socialexpenditure in formal NSPSs. While expenditure levels clearly vary betweencountries, the similarity of the developments over time in terms of relativeexpenditure increases, and the composition of the expenditure is largely due tothe systems’ maturation processes.
61
The size of the welfare state

2.2.1 Observed regional expenditure trends
Worldwide social expenditure has grown considerably over the past fewdecades. Table 2.1 describes the average level of public social expenditure inthe world’s six regions in the early and mid-1990s. Data were taken from theILO’s International Inquiry into the Cost of Social Security, which containsinformation furnished by national authorities largely including the classicalnine contingencies that are listed by ILO Social Security (Minimum Standards)Convention, 1952 (No. 102).3 Regional averages do not refer to all countriesbut rather to those for which data were available. It should also be noted thatdefinitions of the types of expenditure that are subsumed under the heading‘‘social’’ may not be identical everywhere, and at some point in time they mayhave been changed in individual countries.4 Consequently, the data collectedmay not be fully comparable internationally and may not necessarily beconsistent nationally. Such deficiencies are encountered by almost everyinternational database.
The historical trends that led to the situations depicted in table 2.1 aresummarized in the following sections. For more details on developments inindividual countries in the period 1975–96, see the Statistical Annex to thischapter.
2.2.1.1 Industrialized countries
In OECD countries the share of GDP used to finance social expenditure nearlydoubled between 1960 and 1990, reaching 18.3 per cent. For most Europeancountries the figure is between 20 and 30 per cent (OECD, 1996a). North Americaand Oceania followed a similar trend, although to a lesser degree. A substantialproportion of the increase took place during the first 15 years of the period inquestion. The level of individual benefits and services improved sharply, and
Table 2.1 Social security expenditure by region and major function (as % ofGDP), mid-1990s
Region Total socialsecurity expenditure
of which:Pensions
of which:Health care
All countries 14.5 6.6 4.9
Africa 4.3 1.4 1.7
Asia 6.4 3.0 2.7
Europe 24.8 12.1 6.3
Latin America and the Caribbean 8.8 2.1 2.8
North America 16.6 7.1 7.5
Oceania 16.1 4.9 5.6
Source: ILO, The Cost of Social Security.
62
Financing social protection

coverage of the social programmes was expanded to meet the needs of a greatershare of the growing population. This rapid expansion of the welfare state wasmade possible by sustained economic growth and high levels of employment.
Europe as a whole has a substantially higher SER than North America andOceania. The overall average is in the order of 25 per cent of GDP, with theageing and richer countries of western and northern Europe generally abovethe 25 per cent line and those of southern and eastern Europe below it.Figure 2.1 presents the composition of social expenditure in Europe in the mid-1990s. Figures 2.2 and 2.3 relate the social protection expenditure ratio to percapita GDP levels, respectively government spending per capita. Thecorrelation between GDP per capita and the SER is not as strong as onewould expect; this aspect will be addressed later on. The correlation betweenthe SER and government expenditure is higher, which most likely simplyreflects the high share of public expenditure in total social expenditure.
A comparison of Central and Eastern European countries and EuropeanUnion (EU) Member States in the years before 1990 shows that theirexpenditure on explicit social security systems represented a lower share ofGDP than for the OECD, at rates between 10 and 20 per cent of GDP.However, these figures are not fully comparable, as they did not take intoaccount the high level of implicit social expenditure in socialist countries.Expenditure on social employment and subsidies to state enterprises wereinstrumental to the goal of full employment. Moreover, consumer subsidies
Figure 2.1 Social protection expenditure in Europe (as % of GDP), mid-1990s
Source: EUROSTAT/OECD.
63
The size of the welfare state

Figure 2.2 Social protection expenditure ratio to GDP and GDP per capita in
Europe
Source: Eurostat/OECD.
Figure 2.3 Social protection expenditure ratio to government expenditure
per capita
Source: OECD, National Statistics.
64
Financing social protection

played an important role as a tool of redistributive policy. This implicit socialexpenditure can be estimated to possibly add up to approximately 10 per centof GDP (Cichon and Hagemejer, 1996). Within the recorded social expenditurepensions were the major item, accounting for some 50 per cent. Unemploymentinsurance was inexistent and only limited resources were devoted to formalsocial assistance schemes. Since 1989 explicit social expenditure has increasedas a percentage of GDP but decreased in real terms for Central and EasternEuropean countries as most of them have suffered a substantial reduction oftheir GDP. The structure of expenditure has shifted due to the recording andincrease in unemployment, but only marginal shares of expenditure are stillbeing devoted to social assistance and unemployment benefits. Pensions remainthe major expenditure item.
2.2.1.2 Developing countries
The situation in developing countries is characterized by the existence ofdiverse types of social protection systems as well as by widely varyinglevels of population coverage and the risks and contingencies covered. Withinthe group of developing countries, public spending on social protection andthe stage of economic development differ quite considerably from one regionto another.
Africa
With the accession to independence of many countries in Africa, some formof limited social security systems providing protection was introduced forprivileged groups of workers in the formal sector, namely civil servants andmilitary personnel. Countries formerly under French or Belgian rule establishedsocial insurance systems providing coverage for long-term contingencies of oldage, invalidity and survivorship for workers in the formal sector, while formerBritish colonies adopted the Provident Fund system (that is, compulsory savingsschemes providing one-time lump-sum benefits). Initially, however, the mainitem of social expenditure for the newly independent African states was familyallocations (supplements for dependent children paid to active workers). InNiger, for example, in 1975 these family allocations represented 51 per cent ofbenefit expenditure, compared to 25 per cent for pensions. In the 1970s and1980s the share of family allocations went down while that of pension paymentsincreased. In Benin, for example, the share of benefit expenditure devoted tofamily benefits fell from 72 per cent in 1975 to 19 per cent in 1992. By contrast,the portion devoted to pensions rose from 20 per cent in 1975 to 77 per cent in1992. Protection against the risk of unemployment is virtually inexistent inAfrica,5 as is social assistance.
In most African countries the share of GDP used to finance socialexpenditure was under 1 per cent in 1975. Since the SER is a measure
65
The size of the welfare state

incorporating GDP value, growing social expenditure may go along with astable or falling SER index, as two examples illustrate. Between 1975 and 1990,the national income of Togo in constant 1990 prices declined by 5.6 per cent asa result of economic downturns but social expenditure rose by 49 per cent,hence the share of social expenditure in GDP increased. In the case of Benin,between 1975 and 1990 the national income rose by 84.87 per cent and socialexpenditure per capita by 72.43 per cent in constant 1990 prices. The share ofGDP used to finance social expenditure thus decreased.
However, these low figures for social expenditure – 1 per cent of GDP onaverage – do not reflect the true picture since account must also be taken ofcertain items of expenditure on health care (such as out-of-pocket expenses)which are not included in the figures for overall measured social expenditure.Most African countries have a state-financed universal health care system; in1985, it took up on average some 1.4 per cent of GDP in North Africancountries and 1.2 per cent of GDP in sub-Saharan Africa (ILO, 1993).
Arab States
Social security provisions in most Arab States cover long-term contingen-cies and employment injury. Social insurance programmes for sickness andmaternity exist only in Iraq and Lebanon. The main item of social expenditurehas been pensions, accounting for over 80 per cent of benefit expenditure ofnational social insurance schemes. The majority of social insurance systemscovering long-term contingencies of old age, invalidity and survivorship inthe region were established in the mid-1970s.6 The schemes’ coverage islimited to workers employed in the formal sector (except in Bahrain andLebanon), and in many cases only to nationals. This is why in Kuwait, forinstance, a country whose population is made up to a large extent of foreignworkers, the national social security institution covers only about 20 per cent ofthe economically active population.
Since most schemes are in their early stages of development, expenditure onsocial protection has been rising. The share of GDP used for financing socialexpenditure in Bahrain, for instance, has grown from under 0.5 per cent in 1975to 1.6 per cent in 1990. In Kuwait the share has grown from 0.6 per cent in 1980to 3.7 per cent in 1990 as expenditure per capita (in constant 1990 prices) hasmore than tripled during this period. For Saudi Arabia, however, the share hasremained relatively constant (below 0.2 per cent of GDP) even though socialexpenditure per capita (in constant 1990 prices) increased by 70 per centbetween 1990 and 1992. The same phenomenon can be observed in Bahrain,where real GDP has grown by a little over 5 per cent and social expenditure byover 400 per cent between 1980 and 1990. Yet these substantial rises have littleimpact on the SER as these middle-income countries have low populationcoverage, so that the level of social expenditure with respect to GDP hasremained very low.
66
Financing social protection

Asia
The Asian continent is characterized by a wide variety of systems providingsocial security benefits, types of contingencies covered and coverage rates.Some of the countries in the region, namely former British colonies, haveset up Provident Funds, whereas the newly independent States of the formerUSSR have maintained the social security programmes of their past and covermost social security contingencies. For the rest of Asia and the Pacific, themain contingencies covered are those of the long-term old-age, invalidity andsurvivors’ branch and the employment injury branch. Unemployment benefitprogrammes are almost inexistent – the only countries to have instituted themare Hong Kong (China) and the Islamic Republic of Iran. Some form of short-term sickness and maternity programmes exist in the majority of Asiancountries. In some countries, like for example Bangladesh, coverage by socialsecurity provisions is limited to public employees. Most countries in the regionare characterized by low rates of coverage: 8 per cent of the labour force inIndia, 10 per cent in Thailand and 18 per cent in China (1992 figures) (seeBailey, 1997a). Universal coverage by the national social insurance pensionscheme for long-term old-age, invalidity and survivors’ benefits is offered onlyin Hong Kong (China).
In 1989 social expenditure represented on average approximately 0.9 percent of GDP in ten Asian countries,7 but by 1992 the average for the samegroup of countries had increased to 1.6 per cent (picking a period of time with aparticularly high growth). Social expenditure as a percentage of GDP onaverage has remained very low throughout the region. In India the share of GDPdeployed to finance social expenditure has fallen from a level of 1.5 per cent in1975 to 0.9 per cent of GDP in 1992. In this case the figures hide the fact thatreal social expenditure grew by 2.6 per cent per annum, which was outpacedby real GDP growth at 7.1 per cent per annum. However, an example of risingrelative social expenditure to GDP is Singapore, where in 1975 socialexpenditure represented 1.9 per cent of GDP, going up to 8.9 per cent of GDP in1990, with an increase of approximately 25 per cent per annum.
The Singaporean experience can be extended to the group of middle- andhigh-income countries, namely Hong Kong (China), Malaysia, Singapore, theRepublic of Korea and Thailand (Japan is treated in the section on OECDcountries), which saw the share of GDP devoted to financing social securitygrow in real terms as they registered sustained economic growth. In addition, insome of these countries coverage was expanded, as in the Republic of Korea,for instance, where the social protection scheme was broadened to includefarmers and fishermen as well.
In the region’s low-income countries social expenditure as a percentage ofGDP does not seem to have increased in the same way (for example inIndia). However, on the whole there is a clear upward trend of social expendi-ture in the whole region, even if that trend has stalled somewhat because of
67
The size of the welfare state

the 1997 financial crisis. It can be assumed that the growth trend has resumedby now. In particular, China’s ongoing social security reform process willlead to a rise in formal social expenditure. However, this may not signify anactual increase in expenditure as some of it is simply a transfer to publicinstitutions of enterprise-based provisions that may not have been properlyaccounted for.
Latin America
The types of social security schemes in place in countries of Latin Americavary widely. Basically, all the countries have some form of long-term old-age,invalidity and survivors’ pension programme and an employment injuryprogramme, and most have also a short-term sickness and maternity programmewith in-kind medical care. Unemployment and family programmes are lessfrequently found.
Most countries in the region have developed social security systems basedon the European model of social insurance, and set them up in the first half ofthe twentieth century. The schemes were defined-benefit systems managed bya central administration. In 1981 Chile implemented a reorganized defined-contribution pension system with a decentralized management of thecontribution collection and fund investments, activities hitherto carried out bypublic institutions. A number of other countries, namely Argentina, Bolivia,Colombia, El Salvador, Mexico, Peru and Uruguay, have followed Chile’sexample or are in the process of designing similar models either as the main ora secondary tier in their national pension systems.
The rates of social protection coverage within the region are also widelydivergent: under 15 per cent of the economically active population are coveredby social security schemes in El Salvador, Honduras and Paraguay, under 30per cent in Bolivia, Colombia, Ecuador, Guatemala and Peru, and over 60 percent in Chile and Uruguay.
In 1990 the average share of GDP used to finance social expenditure inLatin America showed a wide range, with Cuba spending 15.2 per cent andVenezuela, at the other extreme, with measured spending of less than 1 per centof GDP. This clearly shows the variation in spending patterns within the region.Pensions have, on average, represented the major item of total socialexpenditure, and have become even more prominent over time. In Colombia,for example, this proportion was 6.07 per cent in 1975 and 55.2 per cent in1992, while Uruguay went from 43.31 per cent in 1975 to 79.04 per cent in1992. In Cuba, during the same period 46 per cent of total social expenditurewent on pensions and 37 per cent on health care.
The proportion of elderly people on the continent is increasing: in 1990, 4.6per cent of the population in Latin America and the Caribbean as a whole wereover 65 years of age, but in some countries the rate of the elderly in relation tothe potentially economically active population comes close to that found in
68
Financing social protection

OECD and Central and Eastern European countries. Yet the level ofexpenditure on pensions and social expenditure at large is considerably lower.
2.2.2 Developmental patterns
Tentative conclusions about expenditure patterns can be drawn from the aboveregional developments. If undisturbed by shocks of an economic, demographic,social or political nature, the expenditure of NSPSs in most countries growsover decades as national per capita GDP level increases. Typical expendituredevelopments over five decades in the relatively stable social, political andeconomic environment in some European countries are mapped out in figure 2.4.With some abstraction national social expenditure seems to follow a logisticalmaturation curve (see logistical formula developed in box 2.1) rather than astraight line with a linear relationship between social expenditure and GDPlevels. As a matter of fact, in a mature or near-mature state social expenditure asmeasured by the SER seems to level off despite further economic growth,possibly indicating society-specific maximum acceptable levels of formaltransfers.
Social protection schemes mature when stable or almost stable relationshipsemerge with regard to the proportion of persons covered out of the total activepopulation and the proportion of persons receiving benefits out of the totalinactive population. That state is called demographic maturity. A pension
Figure 2.4 Total social expenditure developments (as % of GDP), selected
European countries
Source: ILO, The Cost of Social Security.
69
The size of the welfare state

scheme, for example, can be considered demographically mature when nofurther increasing trends are noted:
– either in the proportion of people registered in the scheme (includinginvalidity pensioners of active age) to the total population in the active agegroups;
– or in the proportion of old-age pension recipients to the age group older thannormal retirement age (or latest retirement age).
The second state (i.e. the stability of the pensioner to population ratio)generally follows the first (i.e. the stability of the registered members topopulation ratio) with a time lag of several decades. Only when both rateshave assumed relative stability can the scheme be considered to be in ademographically mature state or, better still, a ‘‘quasi mature’’ state. The term‘‘quasi mature’’ indicates that the scheme will not likely acquire further membersor pensioners because of coverage expansion but may still face structuralexpenditure increases due to the overall ageing of the population. The otherelements of the maturation process are a relative stability of the relationshipbetween the average amount of benefits and the average income subject tocontributions. This state is attained when all pensioners have had a full career inthe scheme and the average contribution periods (that determine benefit levels)will no longer increase. Called benefit maturity, this state may be achievedearlier than demographic maturity. The concept is revisited in Chapter 5.
The logistical maturation is to a large extent a consequence of demographicmaturation which in turn is determined largely by expanding coverage: moreand more people are covered and increasing numbers of them grow intoeligibility for benefits. These benefits rise systemically as the entitlementsusually increase with the average number of years of service or residence ofbeneficiaries. At some point, when all or almost all of those in need receivebenefits, societies seem to decide to stop further growth of entitlements, and thatis when typically the SER curve flattens out (for a more detailed analysis ofexpenditure determinants, see section 2.4). In the case of Europe – with itsmature systems – these levels seem to oscillate around 25 per cent of GDP.
Box 2.1 provides a rule of thumb for the projection of the developmentalpattern of social expenditure based on logistical maturation function. Thatfunction might be useful for summary projections of national social expenditure.Such a curve should be shown to all decision-makers engaged in introducingthe formal transfer system.
2.2.3 Structural patterns
At the end of a – typically long – maturation period, an NSPS usually adopts acertain structural composition that remains fairly constant. That compositioncan be modified by political decisions but generally only to some extent as it
70
Financing social protection

Box 2.1 Typical maturation pattern in social protection expenditure
Box figure 2.1.1 describes two typical logistical social expenditurematuration (SEM) curves. They could apply to a country where theoverall formal social protection expenditure starts with a level of socialexpenditure of 5 per cent of GDP, for example for health care, and whereother schemes such as cash benefits, and notably pensions, come onstream during a maturation process of between 75 and 85 yearsapproximately and the overall final expenditure level is in the order of30 per cent in the assumed mature state. The two schemes differ only inthe speed of the maturation process. Both these elements are largelydetermined by governance factors that define how rapidly full or near-fullpopulation coverage is achieved and how fast benefit entitlements reachtheir ultimate level. Pension systems generally mature very slowly, overseven decades or so, provided no initial entitlement credits are given toearly generations of the insured. In this case the maturation phase is onlyover when people making up the first generation that entered the schemeat the earliest possible age (say, 18) and spent a whole career in thescheme (say, 47 years) have died in their eighties. Contrary to this slowmaturation process, a pension scheme could ‘‘age’’ very quickly if itaffords pensions to all people over a certain age from day one irrespectiveof whether they contributed or not.
A word of caution regarding the ‘‘mature state’’ or ‘‘stationary state’’ ofa social protection system: schemes may fully mature when no structuraldeterminant of the system changes in relative terms – in other words, therelative age composition of the population stays constant, the benefitsentitlements do not change and the economy is on a steady growth pathwithout altering the relative shares of income and wages in GDP. In short,this state is fiction and simply never occurs. National transfer systems areat best in an ‘‘almost’’ mature state. Nonetheless, the concept of maturingor almost maturing is useful for indicating that social transfer systemsbecome more costly over time but also that they do not naturally growout of bounds.
The formula for that curve has the following general form:
SERt ¼ SERf =(1 þ b*pt ) (2:1:1)
where:
SERf is the final envisaged SER in the mature stateb is the coefficient which adjusts the formula to the initially
planned expenditure level SER o through the relationshipSER o ¼ SERf/(1+b)
p is a velocity coefficient that steers the speed of maturation
The above formula could be used as regression curves incurvilinear regressions mapping the expenditure developments inNSPSs and would most likely obtain a much better fit than classical
71
The size of the welfare state

implicitly reflects societal redistributive decisions and priorities which normallydo not change rapidly.
Typical patterns can best be described by the EU schemes that have been inexistence for a long time and can largely be assumed to be at least in a ‘‘quasi’’state of maturity. Figure 2.5 details the composition of social expenditure bymain category of transfers in the 15 EU countries in the year 2000. Figure 2.6(p. 74) displays a similar breakdown for six specific countries. It shows thevariety of national structures behind the EU aggregates. In any case pensionsand health care together normally make up more than two-thirds of totalsocial expenditure. Pensions (old-age, invalidity and survivors’ benefits)generally account for over 50 per cent of all expenditure. This is one reasonwhy financing tools and strategies for health care and pensions are dealt withextensively in the following chapters.
2.3 FUTURE PROSPECTS
Expected future trends of social expenditure can at best be described bymodel projections. This section will present the results of projections of
linear regressions using a straight line. (The concept of curvilinearversus linear regressions is explained for example in Lapin (1975),pp. 335–340.)
Box 2.1 (cont’d)
Box figure 2.1.1 Typical SEM curves at different levels of coefficient p
Source: ILO.
72
Financing social protection

social expenditure following a brief discussion on methodology andassumptions. Ideally, projections of social protection expenditure areundertaken by using a fully-fledged social budget model as described forexample in Scholz et al. (2000) or actuarial valuations of individual schemesas described in full detail by Plamondon et al. (2002). Social budget modelsnormally contain explicit population, economic and labour market modules aswell as explicit modules for all major social transfer systems such aspensions, health care, short-term cash benefits (payable in cases of maternity,sickness, death, unemployment, or purposes of social assistance, and so on).Alternatively the expenditure of individual schemes can be projected byactuarial models based on the same demographic and economic scenarios forall schemes in the NSPS. The results of projections in the individualcomponents of national social protection schemes are then aggregated into anoverall national social expenditure and financing account and links arecreated to the government budget. Establishing a single national social budgetnormally requires many months of intensive research and modelling by awhole team of experts.
The following pages describe the results of an abbreviated projectionmethod developed in the mid-1990s by Denis Latulippe at ILO FACTS.Unfortunately, comprehensive social protection expenditure projections on aregional basis can only be undertaken for OECD countries and for those ofCentral and Eastern Europe. The statistical basis available for other groups of
Figure 2.5 Social benefits by function, EU Member States, 2000
Source: EUROSTAT (2003).
73
The size of the welfare state

countries does not allow for similar projections. However, the findings for alimited number of industrialized countries will indicate what overall level ofexpenditure may be attained by comprehensive NSPSs once national economiesare fully developed and their populations are ageing.
Figure 2.6 Structure of social expenditure in selected European countries, 2000
Source: EUROSTAT (2003).
74
Financing social protection

2.3.1 Methodology and assumptions
In the case of mature social protection schemes operating in mature economies,status quo projections can simply extend present beneficiary rates and presentbenefit replacement rates into the future, possibly with some justifiedassumptions on the impact of future policies. This means that the projectionsbasically reflect a constant set of legal provisions and constant administrativeand governance behaviour in a changing but predictable demographic andeconomic environment. This is a relatively simple and reliable exercise whichcan at least demonstrate to policy makers in the form of status quo projectionswhat would happen if there are no structural changes in the system. This strandof projections does not apply to young immature schemes operating normally ina developing economy context. The modelling of likely future development ofoverall social expenditure in this type of system thus cannot be done on aceteris paribus basis; in fact, it necessitates much greater attention in theelaboration of single modules and the stage and velocity of the respectivematuration processes than is viable in this context.
For the study on OECD and Central and Eastern European countries, anabbreviated projection model on the basis of the social budgeting concept wasdesigned to project national social expenditure until 2050.8 Its basic philosophyis that of a deterministic socio-economic model driven by considerations ofexternal growth and demography. The basic technique of simple ‘‘driver-driven’’benchmark expenditure projections is explained in Issue Brief 3. This techniqueis often the only option available to a quantitative analyst to respond quickly todemands from policy makers for budget estimates of future expendituredevelopment. In the simple model used here total employment is linked togrowth assumptions through assumed productivity levels. Employment is thus‘‘driven’’ by the assumed rates of economic growth and the assumed rates ofproductivity. Labour supply is derived from observed labour force participationrates and demographic change. Benefit levels reflect current legislation.
Three scenarios of economic growth are considered (base, low and high),based on two assumptions of future total employment (increase of 1 per centannually and constant total employment) and two assumptions of labourproductivity increase (1 per cent and 2 per cent annually). The demographic andeconomic assumptions used are summarized in table 2.2.
The long-term economic assumptions have not been further discriminatedfor single countries. It is presumed that the countries of Central and EasternEurope will eventually grow at the same rate as OECD countries, but thetransition period of the former will be marked by a period of economic declineand stagnation (up to 2010) followed by a period of high economic growth(2010–20). The high growth rates are assumed to secure a catch-up process thatshould make up at least in part on past GDP losses.
A number of assumptions on the future development of social protectionexpenditure also have to be specified, anticipating demographic, price and
75
The size of the welfare state

employment prospects, especially for pensions, health care and unemployment.For pensions all assumptions are endogenous, including eligibility for benefitsand the average replacement ratio, both based on the employment record. In thecase of health care, assumptions have to be specified with regard to the
Table 2.2 Summary of demographic and economic assumptions for modelprojections
Demographic assumptions
Fertility From current levels (below replacement rates in all regions exceptNorth America) increasing to 2.10 (1.95 in southern Europe, 2.02 inWestern Europe and 2.06 in Japan) by 2050
Mortality From current levels up to values of life expectancy at birth of around79 years for males (74 in Eastern Europe and 81 in Japan) and 85 yearsfor females (81 in Eastern Europe and 87 in Japan)
Economic assumptions
OECD countries and Central and Eastern Europe after 2020
Annual rates Base scenario (%) Low-growth scenario (%) High-growth scenario (%)
Economic growth (1) 2 1 3
Total employment (2) 1 0 1
Labour productivity (2) 1 1 2
Labour supply Based on activity rates in 1990 adjusted for:
• women’s participation rates: from current levels up to 90% of malesin 2050;
• entry age on the labour market between 1990 and 2050: 50% of the1950–90 increase, subject to a maximum of 22 years on average;
• high unemployment: reduction of the labour supply when unem-ployment exceeds 15%; maximum unemployment rate of 20%;
• two scenarios for retirement age: constant retirement age and constantinactivity ratio at the 1990 level.
Central and Eastern Europe: 1995–2020
Annual rates Base scenario Low-growth scenario High-growth scenario
Economic growth (%) �2 (1995–2000) �2 (1995–2000) �2 (1995–2000)
0 (2000–2010) 0 (2000–2010) 2 (2000–2010)
4 (2010–2020) 1 (2010–2020) 4 (2010–2020)
Total employment (%) �1 (1995–2000) �1 (1995–2000) �1 (1995–2000)
0 (2000–2010) 0 (2000–2010) 1 (2000–2010)
2 (2010–2020) 0 (2010–2020) 2 (2010–2020)
Labour productivity (%) �1 (1995–2000) �1 (1995–2000) �1 (1995–2000)
0 (2000–2010) 0 (2000–2010) 1 (2000–2010)
2 (2010–2020) 1 (2010–2020) 2 (2010–2020)
(1) Subject to a minimum unemployment rate of 2%. (2) Between 1990 and 2010 based on national experience.
Source: Latulippe (1997).
76
Financing social protection

progression of unit costs and the pattern of expenditure by age. Finally, anassumption on the proportion of unemployed people drawing benefits will bespecified on the basis of expectations for the labour market and demographicprojections.
Even when adjusted for population ageing, between 1960 and 1980 healthexpenditure in OECD countries rose faster than GDP per employed person(i.e. labour productivity), while between 1980 and 1990 both health expendi-ture and GDP per employed person grew at the same rate. The developmentof health expenditure depends both on the progression of unit costs and onutilization of services. As health care is a labour-intensive sector, wagesrepresent a substantial proportion of its total expenditure. To project unit costsinto the future, it is assumed that its labour costs will increase at the same rateas in other sectors. In OECD countries, health investments (in infrastructure,technology and research) are presumed to equal 25 per cent of total expenditureand to be increasing at 1 percentage point faster than the rate of growth oflabour productivity. Since real GDP growth in the model equals the product ofthe growth of employment and productivity growth, and the wage share of GDPis assumed constant, unit cost of providing health care will increase at thegrowth rate of GDP per employed person plus 0.25 per cent.9 The respectiverate of increase calculated by the model for the sample countries is slightlyhigher than the rate observed in the 1980s, but that decade was one ofsubstantial cuts following a period of rapid expansion. As the 1980s saw lowerlong-term average spending on health, it will be more difficult to achieve thesame level of savings in the future. Unit health costs are presumed to increasefaster in Central and Eastern Europe because of greater investment needs and inorder to improve the level of services provided. For these reasons an additionalincrease of 0.5 per cent of GDP was allowed. For Central and Eastern Europeancountries the unit cost of providing health care is modelled as increasing at thegrowth rate of GDP per employed person plus 0.75 per cent. On the whole,these assumptions on the development of unit costs can be considered prudent.
To project health care utilization, it is assumed that there will be noextension of coverage, but health care expenditure will increase because of thegreater number of older people. It is clearly established that a substantialproportion of health expenditure is concentrated in the last months of life.However, the age pattern cannot be assumed constant. In 2050 people of agiven age will be healthier than people of the same age are now. This holds truein particular for the elderly. In future the healthier generations will acquiremore statistical weight. It follows that the increase in the number of years spentin old age should result in a less-than-proportional rise in health care costsper capita than at present.
For the projection of expenditure on unemployment, the proportion ofunemployed people who are eligible for benefits is assumed constant in OECDcountries. In Central and Eastern Europe it is assumed to be increasing and thatit will reach a level similar to that of OECD countries as of 2010.
77
The size of the welfare state

The other types of social benefits were presumed indexed to averageearnings and adjusted to take into account expected changes in entitlementpatterns. In the projection the total of social assistance benefits is related to thelevel of unemployment, with an elasticity of 50 per cent, in other words,stepping the expenditure index up by half a percentage point if the relevantunemployment index rises by one percentage point.
2.3.2 Projection results
The results of the projections for all three scenarios are detailed in tables 2.3and 2.4.
In OECD countries, social expenditure expressed as a percentage of GDPincreases under all three scenarios between 1990 and 2050. From a level of18.3 per cent in 1990 it reaches 25.5 per cent in 2050 under the base scenario,23.7 per cent under the high-growth scenario and 30.4 per cent under the low-growth scenario. In real terms, between 1990 and 2050 social expenditureincreases by an average of 1.9 per cent per year, the amount being composed ofa 1.3 per cent GDP growth and an additional 0.6 per cent on average of excessgrowth of social expenditure related to the GDP of the respective year. Themain items, pensions and health care, represent 89 per cent of total socialexpenditure in 2050, compared to 77 per cent in 1990.
On a regional basis, the most significant increase within OECD countrieswill be registered in Japan: from 12.4 per cent in 1990 to 27.0 per cent in 2050.Japan will face a significant and rapid ageing of its population over the nextdecades. In 2050, Japanese median age will be 47.4 years as opposed to 45.9 inWestern Europe, 41.1 in Australia and New Zealand, and 40.4 in NorthAmerica (UN, 1995). In 2050, social expenditure in Japan will still be lowerthan in Western Europe (33.4 per cent of GDP) but significantly higher thanin North America (17.9 per cent) and Oceania (18.4 per cent). The slowdevelopment of social expenditure in North America, Australia and NewZealand is highly dependent on the assumed development of the labour market.Under the low-growth scenario, characterized by constant labour demand,social expenditure reaches a significantly higher level: 25.8 per cent in NorthAmerica and 31.1 per cent in Australia and New Zealand.
Based on the assumption of labour productivity development (basescenario), average earnings in OECD countries are presumed to rise byapproximately 1 per cent per year between 1990 and 2050 (1.2 per cent between1990 and 2010). By comparison, average earnings increased by 2.3 per cent inthe 1970s and 1.7 per cent in the 1980s. Despite this low rate of growth oflabour productivity and the significant rise in social expenditure, the higherlevel of social transfers takes out only 20 per cent of the future earningsincrease. The figure goes up to 30 per cent under the low-growth scenario anddown to 10 per cent under the high-growth scenario.
78
Financing social protection

Table 2.3 Estimated trends of social expenditure for OECD countries (as % ofGDP), 1980–2050
1980 1990 2010 2030 2050
Base scenario: 2% annual growth
Total 16.3 18.3 19.3 23.2 25.5
Pensions 7.8 8.5 10.0 13.7 15.2
Health 4.8 5.6 5.6 6.5 7.4
Unemployment 1.0 1.3 1.1 0.5 0.4
Others 2.8 2.8 2.5 2.5 2.5
Japan 11.1 12.4 17.7 22.0 27.0
Northern America 12.5 14.4 13.9 17.5 17.9
Oceania 12.6 15.6 17.4 17.7 18.4
Northern Europe 20.3 22.4 23.0 25.1 25.1
Southern Europe 16.8 21.1 22.2 25.1 31.4
Western Europe 24.2 24.7 25.9 30.8 33.4
High-growth scenario: 3% annual growth
Total 16.3 18.3 18.3 21.7 23.7
Pensions 7.8 8.5 9.3 12.3 13.4
Health 4.8 5.6 5.6 6.5 7.3
Unemployment 1.0 1.3 1.0 0.5 0.4
Others 2.8 2.8 2.5 2.5 2.5
Japan 11.1 12.4 16.9 20.6 25.2
Northern America 12.5 14.4 13.3 16.4 16.7
Oceania 12.6 15.6 14.4 15.7 16.2
Northern Europe 20.3 22.4 21.3 23.1 22.5
Southern Europe 16.8 21.1 20.2 21.9 26.8
Western Europe 24.2 24.7 25.0 29.9 32.3
Low-growth scenario: 1% annual growth
Total 16.3 18.3 23.1 27.8 30.4
Pensions 7.8 8.5 11.1 15.1 16.6
Health 4.8 5.6 6.1 7.3 8.2
Unemployment 1.0 1.3 2.7 2.2 2.1
Others 2.8 2.8 3.2 3.3 3.4
Japan 11.1 12.4 20.7 22.0 26.9
Northern America 12.5 14.4 17.5 24.2 25.8
Oceania 12.6 15.6 22.1 29.0 31.1
Northern Europe 20.3 22.4 26.6 30.2 30.7
Southern Europe 16.8 21.1 24.9 28.0 31.9
Western Europe 24.2 24.7 30.2 33.6 35.3
Source: Latulippe, 1997.
79
The size of the welfare state

Table 2.4 Estimated trends of social expenditure for Central and EasternEurope (as % of GDP), 1993–2050
1993–95 2010 2030 2050
Base scenario
Total 20.0 20.9 21.0 25.6
Pensions 9.9 10.8 10.9 13.6
Health 4.4 4.9 5.9 7.5
Unemployment 0.8 1.2 0.3 0.3
Others 5.0 4.1 3.9 4.1
Bulgaria (1993) 17.7 18.8 16.4 21.4
Latvia (1994) 22.9 22.5 24.3 28.4
Poland (1995) 26.7 32.3 25.4 30.1
Slovakia (1995) 21.3 24.3 27.8 33.8
Ukraine (1993) 18.9 21.4 18.6 22.2
Russian Federation (1994) 12.5 14.9 14.0 17.6
High-growth scenario
Total 20.0 26.1 21.5 24.1
Pensions 9.9 12.0 10.5 12.0
Health 4.4 5.5 6.0 7.5
Unemployment 0.8 2.5 0.9 0.4
Others 5.0 4.1 3.9 4.1
Bulgaria (1993) 17.7 21.6 15.6 19.9
Latvia (1994) 22.9 26.7 23.2 26.7
Poland (1995) 26.7 35.1 32.2 28.5
Slovakia (1995) 21.3 25.7 26.7 31.8
Ukraine (1993) 18.9 30.1 17.9 21.0
Russian Federation (1994) 12.5 17.5 13.4 16.5
Low-growth scenario
Total 20.0 24.4 24.5 28.2
Pensions 9.9 11.7 12.5 14.7
Health 4.4 5.3 6.3 8.0
Unemployment 0.8 2.1 1.2 0.9
Others 5.0 4.1 3.9 4.1
Bulgaria (1993) 17.7 20.5 18.1 21.3
Latvia (1994) 22.9 24.3 24.7 28.4
Poland (1995) 26.7 34.1 39.6 45.7
Slovakia (1995) 21.3 25.1 28.3 33.8
Ukraine (1993) 18.9 25.7 20.7 22.2
Russian Federation (1994) 12.5 16.5 15.7 17.6
Source: Latulippe, 1997.
80
Financing social protection

The projection of expenditure for Central and Eastern Europe, based on thesituation prevailing in six countries – Bulgaria, Latvia, Poland, RussianFederation, Slovakia and Ukraine – between 1993 and 1995 (Cichon andHagemejer, 1996), indicates that under status quo conditions in the near futurethe evolution of social expenditure will be primarily dependent on changes insocial legislation and economic performance. The degree of uncertainty is veryhigh with regard to the level and disparity of future economic development inthe respective countries. Demographic factors will have a more limited impactuntil 2010.
On the basis of the assumptions specified above, between 1995 and 2010expenditure is set to rise from the original level of 20 per cent to 20.9 per cent.During the initial period the absence of economic growth and the assumedincrease in the proportion of unemployed people who draw unemployment orsocial assistance benefits creates an upward pressure on social expenditure.Beyond 2010, unemployment and social assistance benefits decline because ofassumed economic growth and the rise in employment. Nevertheless, socialexpenditure increases between 2030 and 2050 because of rising expenditure onpensions and health.
By 2050, 25.6 per cent of GDP could be devoted to social expenditure underthe base scenario, 24.1 per cent under the high-growth scenario and 28.2 percent under the low-growth scenario. This is the same level as in OECDcountries. In Central and Eastern Europe the retirement age is lower but theageing process will be, on average, less pronounced than in OECD countries.Moreover, the higher the rates of economic growth aimed at catching up oncurrent and recent GDP losses, the smaller the future rate of growth of socialexpenditure will appear as a percentage of GDP.
The results of the above exercise appear to suggest that, provided they arenot substantially downsized, the present formal social transfer systems inindustrialized countries are likely to reach the proportion of between 25 and35 per cent of GDP: in other words, these economies and societies are headingtowards a situation where between 25 and 35 per cent of the value of all goodsand services they produce will be redistributed through the social transfersystem. That is equivalent to around half the total private consumption. Even ifthe systems come to be downsized in the coming years, they will remain hugeredistributive machines.
The conclusions generated for the selected industrialized countries cannotbe generally used as a guide for developing countries that are far behind interms of GDP. Their expected catch-up phase is too long to allow anymeaningful predictions. For example, if a typical African country with a percapita level of GDP of US$500 in 1994 were to grow at a real rate of 5 per centper annum, it would be about 56 years before it reached the present per capitalevel of GDP in Greece (US$7,700), which is one of the lowest in theOECD. Even with a growth rate of 10 per cent, that country would still need29 years to catch up.10 Whether one can assume that at the end of such a
81
The size of the welfare state

long period a country’s social protection system would be similar to that of atypical OECD country is totally unclear. There are far too many uncertainties:societal values might not follow OECD patterns, economies might remainmuch more informal, and the HIV/AIDS pandemic might change thedemographic structure dramatically, to name but a few. We may not be ableto predict future social protection expenditure with certainty, but we knowwhich factors will actually drive expenditure developments. That is the topic ofthe next section.
2.4 FACTOR ANALYSIS OF THE DETERMINANTS
OF NATIONAL SOCIAL EXPENDITURE
As outlined in the introduction to this chapter, national social expenditure isdriven by three major determinants: demographic developments, governancefactors and economic developments. The brief factor analysis that follows islimited to exploring the main impact of these three categories of determinants,though providing at the same time some explanation for past expendituredevelopments as well as some indications of future trends. The direction of theimpact of the different determinants is shown in figure 2.7. Total expenditure inany scheme is generally the product of the number of beneficiaries and theamount of benefits. Total social expenditure is an absolute expenditure figure.Its explanatory power is relatively limited if it is not put into relation with thetotal size of the economy (i.e. the country’s GDP), by calculating the SER.Gross domestic product can be calculated as the product of the number ofworkers in the economy and the average gross output per worker. The numberof workers in turn is influenced by the economic environment, the demographicenvironment and governance. The impact of social protection on the output perworker is analysed in Chapter 3.
The demographic environment in which a social protection systemoperates affects mainly the number of beneficiaries (such as the number ofold-age pensioners, disabled or sick persons) and the potential number ofworkers. The economic environment, for its part, has a direct influence on thenumber of beneficiaries such as the unemployed, the amount of benefits(depending on whether the benefits paid are determined by wage increases orinflation) and the size of output per worker. Governance also has an impact onall factors by stipulating eligibility conditions (for example, retirement age)and benefit provisions. The various technical aspects involved will beexplored in greater detail in Chapter 5. The next few sections of this chapterwill simply look at the general nature of these various effects and theirinterrelationships.
As the following sections will show, the three main determinants of socialexpenditure interact and are closely interrelated.
82
Financing social protection

2.4.1 Impact of the demographic environment
The demographic environment of a social protection system, which includes themorbidity structure of the population with which the health system has to cope,is one determinant (but not the only one, as we will see) of the systemdependency ratio – that is to say, it has a large influence on the ratio of thenumber of beneficiaries (i.e. transfer recipients) in the system to the number ofpeople financing these transfers or earning the national income out of which thetransfers have to be financed. Biological factors (ageing as expressed indropping fertility and mortality rates, morbidity and mortality) determine to alarge extent the potential number of beneficiaries and financiers of the NSPS; inother words, they explain the pure demographic dependency ratio. Demo-graphic factors do not explain the full size of system dependency: the economyco-determines the number of unemployed while national law, which is agovernance factor, co-determines inter alia the number of retired people andthose receiving education. This last number is influenced for example throughlegal provisions governing the minimum number of years of compulsoryschooling or of studies required for the first university degree. Some factorsmight be considered as behavioural, such as the actual age of entry intoretirement if people are given a choice on when to retire from the labour
Figure 2.7 Determinants of total social expenditure
Source: ILO.
83
The size of the welfare state

market. However, we consider that affording that choice is an element ofgovernance.
Box 2.2 describes the change in system dependency versus the change inpure demographic dependency in pension schemes in a number of major OECDcountries between the mid-1980s and the mid-1990s.
The other determinants – economic development and governance factors –being equal, ageing is the most important purely demographic factor of
Box 2.2 Demographic dependency versus system dependency
in OECD pension schemes
The system dependency ratio 65+ measures the number of pensioners(those receiving a benefit from a public scheme) in the numerator, and thenumber of employed in the denominator; both are calculated in full-timeequivalents. Box figure 2.2.1 shows the development in the systemdependency ratio between 1985 and 1996 in ten OECD old-age pensionschemes.
Box figure 2.2.1 System dependency ratios, selected countries, 1985–96 (benefit
dependency ratios 65 and over: light bar 1996; dark bar 1985)
Source: Arents et al. (2000).
84
Financing social protection

When the number of pensioners increases but all the other factorsremain unchanged, pension expenditure will be driven up. However, thecontribution rate will increase only when the number of pension benefitrecipients rises faster than the number of the employed. The systemdependency ratio takes into account the increase in the employment-to-population ratio and hence reveals the change in the tax base.
Most of the countries listed in box figure 2.2.1 have systemdependency ratios in the same range, around 0.4. Austria (0.25) and theUnited States (0.30) have lower ratios, while Sweden has a systemdependency ratio of over 0.5. In the early 1990s Sweden saw a sharpincrease (7 percentage points), due primarily to a drop in employmentduring the years in question. There were marked rises also in France(9 percentage points) and Japan (7 percentage points as of 1990), whereasin most other countries the increase in the system dependency ratiostayed below 3 percentage points. In the United States and the Nether-lands there was no significant rise in the system dependency ratio at allduring this period.
Box figure 2.2.2 shows the rise in the old-age dependency ratio versusthe rise in the system dependency ratio, both in the period 1985–96. It can
Box figure 2.2.2 Changes in benefit dependency ratios (light bar), and old-age
dependency ratios (dark bar), selected countries, 1985–96
(average annual growth rates in percentages)
Sources: Benefit dependency ratios: Arents et al. (2000); old-age dependency ratios: EUROSTAT.
Box 2.2 (cont’d)
85
The size of the welfare state

influence on pension schemes, which are, in turn, the biggest expenditure itemsin NSPSs. That impact is especially strong in mature systems in societies with ahigh proportion of the elderly.
Tables 2.5 and 2.6 as well as figure 2.8, reproducing United Nationsprojections as quoted in a recent ILO publication on ageing (ILO, 2002a),demonstrate the relative order of magnitude and velocity of ageing in thedifferent regions of the world between 1950 and 2050. Table 2.5 shows that theshare of GDP to be transferred to the elderly between 1950 (when the firstpension schemes in Europe finally acquired their present shape) and 2050through pension schemes under ceteris paribus conditions could almost triplewithin that period and at least double between 2000 and 2050. Biologicalageing obviously poses a challenge for pension schemes and hence for thefinancing of social protection in general. Table 2.6 reveals another fact that maycome as a surprise: while developed regions are substantially ‘‘older’’ than lessdeveloped ones, the pace of ageing is actually much faster in the developingworld. So, if the less developed countries had pension systems with universalcoverage (which they do not, with a few exceptions like Botswana, Brazil,Namibia and South Africa), in relative terms they would face an even moreserious ageing problem between 2000 and 2050 than the schemes in moredeveloped parts of the world.
Figure 2.9, on the other hand, reveals that while pension schemes may faceincreased dependency, for overall social protection systems the challengeappears to be much smaller. The figure adds up old-age dependency ratio(population over 65 divided by population between 15 and 64 years of age) andyouth dependency ratio (population between 0 and 14 divided by populationbetween 15 and 64 years of age). Worldwide the combined demographicdependency ratio remains fairly constant over the coming five decades, but thecurve may be misleading to some extent as per capita transfers to the youngmay amount to less than the per capita transfers to the elderly. However, this
be seen that in some countries system dependency ratios increased fasterthan demographic dependency ratios, but not in others. In Germany, forexample, the system dependency ratio rose by 0.4 per cent on averageand the demographic (old-age) ratio by 0.8 per cent. In the Netherlandsthe system dependency ratio increased by less than 0.1 per cent onaverage and the demographic ratio by nearly 1 per cent. In the UnitedStates the demographic ratio rose by 0.3 per cent on average, while thebenefit ratio increased by no more than 0.1 per cent, the same as in theNetherlands. Employment growth was strong in both countries duringthis period. This was also true of the employment rate of the 55–64age group.
Box 2.2 (cont’d)
86
Financing social protection

Table 2.5 Rate of demographic ageing, population aged over 60 and over 80 (as % of total population), 1950–20501
1950 1960 1970 1980 1990 2000 2010 2020 2030 2040 2050
World 60+ 8.2 8.2 8.4 8.6 9.2 10.0 11.1 13.5 16.5 18.8 21.1
Males 60+ 7.3 7.3 7.4 7.5 8.1 8.9 10.0 12.3 15.1 17.2 19.4
Females 60+ 9.0 9.0 9.5 9.7 10.4 11.1 12.3 14.8 17.9 20.4 22.7
80+ 0.5 0.6 0.7 0.8 1.0 1.1 1.5 1.8 2.3 3.1 4.1
More developed regions 60+ 11.7 2.6 14.5 15.5 17.7 19.4 21.9 26.1 29.8 32.0 33.5
80+ 1.0 1.3 1.6 2.0 2.7 3.1 4.2 5.0 6.4 8.3 9.6
Less developed regions 60+ 6.4 6.2 6.1 6.4 6.9 7.7 8.8 11.1 14.2 16.7 19.3
80+ 0.3 0.3 0.4 0.4 0.5 0.7 0.9 1.2 1.5 2.3 3.3
Less developed regions 60+ 5.9 5.7 5.8 5.9 6.2 6.8 7.7 9.5 11.8 14.2 16.9
without China 80+ 0.3 0.3 0.4 0.4 0.5 0.6 0.8 1.0 1.3 1.8 2.5
1United Nations projections – medium variant.
Source: United Nations (2001b).
87
Th
esiz
eo
fth
ew
elfa
resta
te

could create at least some scope for the reallocation of resources from youth toolder people and thus help to ease the demographic pressure on the NSPS.This in itself is a formidable challenge for governance. What it may mean inpractical terms is finding a way to channel the money saved by closingkindergartens, schools and possibly universities to the old-age transfer system.
Figure 2.8 Velocity of demographic ageing, population aged 60 and over (% of
total population)1
1United Nations projections – medium variant.
Source: United Nations (2001b).
Table 2.6 Velocity of ageing1
1950–2000 (%) 2000–50 (%)
World 60+ 23 111
80+ 109 256
More developed 60+ 66 72
80+ 196 208
Less developed 60+ 19 150
80+ 115 393
1Increase in population share of people aged 60+ and 80+.
Source: United Nations (2001b) and ILO calculations.
88
Financing social protection

Another factor that rapidly modifies the demographic environment in whichNSPSs operate, in particular in developing countries, is the HIV/AIDSpandemic. In some regions in Africa the infection rate is estimated to havereached almost 40 per cent. This very likely means that within the next fiveto ten years at the latest, out of every 100 people alive today 40 will havedied, unless there is spectacular medical progress and – maybe even moreimportantly for Africa – if the cost of drug treatments does not go down. A crisisof this magnitude must have a dramatic effect on the cost of any national socialprotection scheme. Issue Brief 1 explores the subject by way of a modellingexercise. The results can only be of a tentative nature as too little is still knownabout the likely future progress of the pandemic. However, our results give riseto concern. Social expenditure might almost double in a typical African countrycontext and will require substantial additional government resources. It isprobably fair to say that HIV/AIDS will most likely wipe out all the financialand fiscal room for the improvement of social protection that growth in Africacould have produced under normal conditions. It will simply stop the clockor even put it back. In addition to medical and public health research, a lotmore needs to be done to develop financial and fiscal coping strategies inAIDS-stricken countries.
2.4.2 Impact of governance
Governance encompasses a number of elements, ranging from the originaldesign of the different social security schemes to the implementation of andsubsequent amendments to that design by benefit delivery systems and
Figure 2.9 Youth, old-age and total dependency ratios, 1950–2050
Source: United Nations (2001b).
89
The size of the welfare state

contribution- and tax-collection systems, as well as elements of social andeconomic policy that lie outside direct social protection governance. The designof the schemes determines the amount of benefits that a defined group ofbeneficiaries receive under a defined set of conditions. The quality of thesystem’s management and administration determines whether beneficiariesactually receive all or only part of the benefits to which they are entitled undernational law and whether the actual delivery causes large administrativeoverheads or not. Direct social protection governance determines among otherthings when people can retire and receive pensions or other transfers allowingthem to withdraw from the labour market; it thus impacts on the systemdependency rates. However, governance elements outside direct socialprotection governance determine when people are joining the labour marketand hence also have an impact on system dependency rates. Policies affectingbenefit levels are then often used to correct adverse developments of depen-dency rates.
Governance has an impact on virtually all aspects of a social protectionsystem. With respect to the determination of expenditure levels the impact onsystem dependency is probably decisive. The relative importance of governanceis demonstrated here by the impact of governance factors on the systemdependency ratio in OECD pension schemes. While demographic ageingdetermines the potential number of beneficiaries and contributors, governancedetermines their actual number. The effective numbers also depend onbehavioural and legal rules such as the retirement age and the age of entryinto the labour market. In OECD countries, on average 70 per cent of theincrease in the old-age dependency ratio of the pension system between 1950and 1990 is due to changes in the entry and retirement ages, and only 30 percent is attributable to the (biological) change of the population structure.
Between 1950 and 1990 the effective retirement age declined substantiallyin OECD and Central and Eastern European countries, going down by fiveyears on average: from 66.0 in 1950 to 61.0 in 1990. The effective retirementage is obtained here from observed gradual reductions of activity ratios withage. A retiree is then defined as a person who has withdrawn from the labourmarket and is no longer economically active. Retirement is not necessarilylinked to the entitlement to an old-age pension, but defines the act of droppingout of the labour market, although the cessation of economic activity normallygives rise to the payment of an old-age pension or other long-term or bridgingbenefits11 (Latulippe, 1996).
Table 2.7 shows the downward trend of the effective retirement agethroughout the period in all regions except Japan, where it rose slightlybetween 1950 and 1970 and declined over the following 20 years. There areimportant variations in average retirement age between single regions and sexes.In 1990, however, the averaged values for the two groups of countries selectedstood at the same level, although retirement age was 59.2 years in Central andEastern Europe and 59.3 in the seven selected countries of Western Europe.
90
Financing social protection

By comparison, in Japan it was 65.5 and in North America 62.6 years. Theaverage retirement age for all countries was three years higher for males thanfor females. In 1950, the effective retirement age was higher than theinstitutionally set normal retirement age in a majority of countries. The latterremained relatively stable between 1950 and 1990 while the effective retirementage, as noted earlier, underwent marked downward changes and found itselflower than the normal retirement age. The transition from work to retirement ismanaged not only via the conservative drawing of pensions, but also via‘‘covert’’ complementary measures such as early retirement, unemployment ordisability benefits, or simply by relying more on private income.
Current generations of retirees enjoy longer retirement than theirpredecessors because of both a lower retirement age and a longer lifeexpectancy.12 The duration of retirement increased from 12.5 years on averagein 1950 to 18.9 years in 1990. The disaggregation by sex shows that womenenjoy longer retirement than men as they retire earlier and have a longer lifeexpectancy. In 1990, the gender difference in the duration of retirement was 5.8years on average: 22.6 years for women as against 16.8 years for men.13
At the other end of the working life, the average entry age on the labourmarket rose from 16.3 years in 1950 to 19.7 in 1990. By then, it was slightlyabove 20 years in Japan and Western Europe. No significant difference wasnoticed for the aggregated average values between Central and Eastern Europeand the other regions. Combined with a six-year reduction in the retirementage, this 3.4-year rise in the entry age implies that between 1950 and 1990the average period of economic activity declined by almost ten years.Consequently, during the same period the inactivity ratio (duration ofretirement/number of activity years) nearly doubled, going from 25 per centin 1950 to 46 per cent in 1990. In Japan it was significantly lower (39 per cent
Table 2.7 Effective retirement age worldwide, 1950–90
1950 1970 1990
Japan 66.2 66.7 65.5
Northern America 65.9 64.8 62.6
Oceania 65.3 63.2 60.0
Northern Europe 67.2 64.5 61.9
Southern Europe 69.0 63.6 60.1
Western Europe 65.7 63.3 59.3
Central and Eastern Europe 65.0 62.2 59.2
Average
w/o Central and Eastern Europe 66.5 64.5 61.8
All countries 66.0 63.8 61.0
Source: Latulippe (1996).
91
The size of the welfare state

in 1990), but in Western Europe it reached 53 per cent. Details are shown intable 2.8.14
The inactivity ratio is set to continue to rise in the coming decades unlessthe retirement trend is turned around towards later pension entry by decisiveacts of governance. Adjusting the retirement age in order to secure a constantinactivity ratio until 2050 at the 1990 level implies pushing back the retirementage by approximately 3.5 years over the 60-year projection period. The gain inlife expectancy would then be allocated – by good governance – partly toworking years and partly to retirement.
The change in the inactivity ratio directly influences the overall systemdependency ratio of the old-age benefit system, which in turn is one of themajor determinants of the financial status of such a system. The systemdependency ratio increased from 12 per cent in 1950 to 30 per cent in 1990 onaverage, for all regions. As mentioned earlier, the major part of the increase isdue to the evolution of the inactivity ratio, while less weight is attributable topopulation structure. Assuming a constant retirement age at the 1990 level, thedependency ratio will double between 1990 and 2050, when it is set to reach64 per cent. If on the other hand the retirement age is increased so as tomaintain a constant inactivity ratio, the ultimate value of the dependency ratioin 2050 will be 50 per cent.
Cichon (1996) has analysed the potential future development of demo-graphic and system dependency ratios on the social expenditure of a typicalEuropean country. The findings are summarized in box 2.3. The studyaddressed the question of whether there was an ageing crisis in social protectionfor a typical representative of Europe, the region most affected by ageing. Theanswer is that ageing clearly poses a problem but that there is no ageing crisis ifemployment and social policies (i.e. measures of good governance) manage tolift the activity and employment rates of the population in active age groups.
Table 2.8 Inactivity ratio worldwide, 1950–90
1950 (%) 1970 (%) 1990 (%)
Japan 24 28 39
Northern America 27 31 42
Oceania 27 33 49
Northern Europe 24 32 43
Southern Europe 19 32 49
Western Europe 26 34 53
Central and Eastern Europe 27 37 48
Average
w/o Central and Eastern Europe 25 31 45
All countries 25 33 46
Source: Latulippe (1996).
92
Financing social protection

Box 2.3 Is there an ageing crisis in Europe?
In order to avoid distorting the analysis and the debate through the use ofspecific, atypical national social protection provisions, a hypotheticalcountry, here called Euroland, has been devised as a ‘‘laboratory’’’ for thisexercise. In 1995, the starting point of this analysis, Euroland has thedemographic structure of the Netherlands. The population is thenprojected for 120 years (from 1995 to 2115), based on mortality andfertility developments assumed again for the Netherlands by the UnitedNations,1 as well as the general pattern of the United Nations standard lifetables. To simplify the projections, it has been assumed that Euroland’sactive population retires at age 60, which is a fair approximation of thelow actual average retirement age in Western Europe.2
Demographic dependency
Box figure 2.3.1 demonstrates the development of the classical demo-graphic old-age dependency ratio – that is, the ratio of the number ofpersons aged 60 and over to the number of people aged between 20 and59. The curve is familiar and dramatic, indicating more than a doubling ofthe ratio within the next 35 to 40 years. Curves of this category oftenprovide the justification for predicting a doubling of the PAYG contributionrates in national pension systems within the next four decades. Here, thesecond line on the graph already indicates a solution to the demographicproblem: pushing back the effective retirement age from 60 to about 67,phased in gradually – after a due period of notice – over 21 years from 2010.The effect is substantial. Age 67 has been chosen to define a probableupper limit for average national retirement ages in the future.
System dependency
The financial status of an old-age pension system is not determined by thepure demographic dependency ratio, however, but by the ratio of thenumber of pensioners to the number of people actually contributing. In afirst approximation, in this example the system dependency ratio wasestimated by dividing the total population over 60 by the number ofeconomically active persons in the 20–59 age group. Curve n– 1 in boxfigure 2.3.2 maps this ratio, showing the familiar dramatic pattern as inthe pure demographic scenario presented in box figure 2.3.1. Curve n– 2again shows the fall in system dependency ratios due to the increase inretirement age.
However, the most interesting effect is demonstrated by curve n– 3which assumes that the labour force participation rates of women can bebrought up to those of men, except for the child-rearing age groups of 25to 39. This again lowers system dependency ratios.3 In fact, if femaleparticipation rates could be increased and the retirement age pushed backto 67 or even 65 gradually during the next three decades, then the systemdependency ratios throughout the coming decades might almost remain
93
The size of the welfare state

constant. The ageing problem in Euroland, however dramatic it appearedat the outset, would thus disappear as a consequence of the higherretirement age and greater labour force participation.
Increasing the retirement age by seven years over the next threedecades might appear too drastic, but it does not seem unreasonable toexpect generations that have decided to have so few children thatreplacement is not ensured to compensate for the drop in labour supplyby working longer. These generations are actually required to stay‘‘young’’ and be ready to have a longer working life.
The employment connection
The above results could even be improved if today’s level of unemploy-ment were eliminated (at the time of the simulations it stood at about 10 percent of the labour force) and the unemployed added to the group ofcontributors. This reveals the fundamental uncertainty of the aboveexercise.
The key question is: Can the labour market absorb the additionalsupply of labour that results from the upward shift in retirement age,
Box 2.3 (cont’d)
Box figure 2.3.1 Long-term development of demographic dependency ratios,
Euroland, 1995–2115
Source: ILO.
94
Financing social protection

and the potential growth of labour force participation rates? The allegedageing problem hence translates into an employment problem – and thisshould be borne in mind when discussing the issue.
Notes
1
See United Nations (1993).2
The relatively low effective retirement age is a consequence of early retirement provisions as
well as pre-retirement arrangements or the use of the invalidity outlet to leave the labour
market. In total these effects lead to a de facto retirement age which is substantially lower than
the legal retirement age.3
For the purpose of this analysis it has been assumed that all persons above age 60 receive a
pension from the pension system. The increase in labour force participation, that is, the
implicit increase in the future number of contributors thus does not affect here the number of
future beneficiaries.
Box figure 2.3.2 Long-term development of old-age system dependency ratios,
Euroland, 1995–2115
Source: ILO.
Box 2.3 (cont’d)
95
The size of the welfare state

The figures in box 2.3 show that the importance of governance is oftenunderestimated. Further evidence of this can be found in other sources. AnOECD study conducted in the mid-1980s estimated that about 60 per cent of therise in overall social expenditure in the seven major OECD countries between1960 and 1981 could be attributed to the increase in real benefits levels, whichare a governance factor (OECD, 1985). ILO technical assistance teamsestimated that in Central and Eastern Europe the non-collection of contributionsamounted to between 20 and 30 per cent of total contribution income (ILO, 1995;ILO/EU Commission, 1994). This means that the PAYG contribution rates couldbe reduced by the same proportion if system governance were able to ensure fullcollection of contributions. This could solve a major part of the financialproblems of pension systems in countries of Central and Eastern Europe.
In OECD and Central and Eastern European countries, net increases of realbenefit levels through the introduction of new benefits or new entitlements canhardly be expected under present circumstances. Nevertheless, changes tobenefit provisions could have an impact on the development of socialexpenditure or its allocation to different beneficiaries. For example, the methodof benefit adjustments makes an enormous difference for the long-term averagereplacement rates of benefits. Discretionary or partial adjustment of benefitswas used as a way of limiting the increase of social expenditure in Central andEastern Europe during the 1990s. In developing countries the adjustment – orrather non-adjustment – of pensions in payment has often been used tocompensate for the cost of steeply rising number of beneficiaries, thus avoidinghikes in contribution rates which would be a necessary systemic consequenceof the maturation process in the face of political pressures.15 Interestinglyenough this might have fended off short-term political pressures, but theresulting low and deteriorating benefit levels have eroded public confidence inthe schemes.
2.4.3 Impact of the economic environment
As already mentioned, the economic environment in which NSPSs operate alsohas a major impact on social expenditure. It can aggravate negative demographiceffects when, for example, deteriorating demographic dependency ratios arecompounded by high unemployment leading to even higher system dependencyratios. High dependency ratios will translate immediately into high socialexpenditure unless benefits are reduced. Inflation rates, on the other hand, mightincrease nominal social expenditure but may have no impact on the SER if thereare parallel developments in the Consumer Price Index (CPI), which oftendetermines annual increases of benefit levels, and the GDP deflator, whichdescribes the aggregated inflation of all goods and services produced in a country.
On the other hand, positive developments in the economic environment –leading to higher employment, for example – can cancel out a major part of the
96
Financing social protection

negative costly effects of ageing. In a context of increasingly healthy olderworkers, higher labour demand would make it possible to raise the retirementage and even in a rapidly ageing Europe the system dependency ratios of thepension systems, the main cost components in national social protectionschemes, could be kept at levels which would be only marginally higher thanthe present rates (Cichon, 1996).
ILO projections (Latulippe, 1996) for OECD countries, undertaken in themid-1990s, showed that while there are substantial differences betweenindividual countries, in virtually all of them unemployment is likely to reachan assumed minimum level of 2 per cent around 2030 if an average growth inlabour demand of 1 per cent is assumed. If employment were to increase in thefuture at the same rate as during the 1980s, there would be a labour shortage by2030. An increase in the retirement age of more than 3.5 years would then benecessary to fill all jobs.
There is a widespread perception, however, that economic development alsoinfluences the level of formal social expenditure in a more subtle way.Referring to an often-observed correlation between per capita levels of GDPand social spending, it is often inferred that there is a high elasticity of socialexpenditure to per capita levels of GDP. This means that as countries get richerthey tend to spend more on social protection, simply because they can affordhigher levels of redistribution. Box 2.4 analyses that relationship in more detail.The analysis seems to defeat the simple GDP elasticity of social spendingtheory. Formal social expenditure may rather be causally linked to the nationalcapacity of governance than to levels of GDP. However, the per capita level ofGDP may well in many cases16 be a proxy for national governance capacity.Different countries with a similar per capita level of GDP show a wide range oflevels of social expenditure (as measured by the SER), which means that theyhave decided to establish more or less extensive formal transfer systems. This,is turn, signifies that the level of social transfers is at least to some extent amatter of political decision-making and the capacity to successfully implementsuch decisions and not a quasi-automatic consequence of the level of economicdevelopment. This is also in keeping with the observations made in Chapter 1that the extent to which social transfers are formalized and hence show up inpublic expenditure statistics reflects the level of governance capacity.
Box 2.4 GDP and social expenditure: Does one have to be rich to share?
Here we look at the question of whether there is a stringent correlationbetween the level of GDP and social spending. Although methodologi-cally simple, the exercise shows interesting results.
Box figure 2.4.1 depicts the relationship between income levels percapita of selected countries within the different regions and their spending
97
The size of the welfare state

on social protection as a percentage of GDP. It indicates that themathematical correlation between GDP per capita and GDP share ofsocial expenditure is actually relatively weak (even in case of a non-linear,that is, exponential regression line). However, it also reveals a morecomplex picture: OECD countries clearly have a higher level of redistri-bution through the social protection system than lower-income countries,and are placed above the regression line. The higher- and lower-incomecountries actually form two clusters around the regression line, butneither cluster is very dense. This means that the variance of the level ofsocial spending between countries of similar GDP per capita is sub-stantial. These observations lead to one conclusion: the level of socialexpenditure (as measured in share of GDP) does not – or at least notexclusively – depend on the level of GDP. Thus there are poorer societieswho decide to devote the same share of their GDP to social expenditure asbetter-off societies. In other words, one does not have to be rich to shareincome through social protection.
Taking extreme examples, Bulgaria – a low per capita income country –had a social expenditure share of GDP in 1992 which was (in relativeterms) double the Japanese level. By contrast, certain countries withupper middle per capita income levels, such as Saudi Arabia and Bahrain,allocate a very low share of GDP to financing social expenditure. This canbe explained in part by the low coverage levels of mandatory socialinsurance schemes in these countries.
Box 2.4 (cont’d)
y = 2.641e 6E-05x
R2 = 0.1478
0
5
10
15
20
25
30
35
40
0 5 000 10 000 15 000 20 000 25 000 30 000
GDP per capita in US$
Soc
ial e
xpen
ditu
re a
s %
of G
DP
Sweden
JapanUnited States
United Kingdom
Bulgaria
Poland
Romania Chile
Uruguay
BahrainSaudi ArabiaMexico
Malaysia
Singapore
Box figure 2.4.1 Relation between social expenditure as % of GDP and GDP per
capita, selected countries, 1992
Source: ILO and the United Nations.
98
Financing social protection

2.4.4 Weighting the factors
The exact relative importance of the three categories of determinants of thelevel of social expenditure depends of course on the specific national situationand the state of maturity of the country’s social protection system. On the basisof the case of OECD countries – taken here as examples of mature socialprotection schemes – it can be clearly stated that during the past few decadespolitically motivated amendments to governance factors were made, notablythose which permitted generously early withdrawal from and late entry into thelabour force. At that time they had an even greater influence on national socialexpenditure than the ageing of the population. Whereas positive economicdevelopments might help to compensate some of the effects of ageing, negativeones tend to aggravate adverse developments in NSPSs’ financial equilibrium.The effects of changing macro-demographic and macroeconomic conditionsmight be smaller in developing countries – that is, in maturing schemes whichhave not yet attained full population coverage. The demographics of theirsystems and the economic development of the sectors they cover might beinsulated to some extent against changes in the macro-environment. On theother hand – and many pension schemes are witness to this – they might bemore vulnerable to bad governance since their regulatory framework might notbe sturdy enough to withstand undue political interference like excessivegovernment borrowing or diversion of reserves.
Overall, governance appears to be the most important determinant of socialexpenditure. This, in a way, is good news. It means that the systems are nothelpless in the face of negative economic and demographic developments.If governance can increase expenditure it can also – at least in theory – consolidateand focus schemes in a socially responsible way in times of crisis. Financialanalysts have to understand the impact of economic and demographic factorsin order to make a useful contribution to the design of governance measuresaimed at countering any adverse developments in these two sets of determinants.
2.5 SUMMARY
National social expenditure generally follows a quasi (meaning ‘‘not alwaysperfect’’) logistical maturation pattern. It may take a new social protectionsystem about seven decades to reach the stationary state or the mature state.This is largely a consequence of the generally slow maturation process ofnational pension schemes. Social expenditure increases are thus to aconsiderable extent normal and natural phenomena.
Our projections show that, driven by demographic developments,expenditure levels for formal NSPSs will grow during the next five to sixdecades throughout the world. The size, pace and nature of this increase aresensitive to the assumed pattern of future economic development as well as theinitial stage of economic development. The projections also show that the rise
99
The size of the welfare state

in social expenditure is either normal, due to the expected and intendedmaturation processes (in case of maturing schemes), or modest (in the case ofmature systems). In developing countries it may take anywhere between threeto six decades before national social protection schemes reach socialexpenditure levels comparable to the lower-range levels currently found withinthe OECD. In OECD and Central and Eastern European countries the futureincrease in social expenditure will not fully absorb the expected real rate ofgrowth of the active population’s disposable income. Even in view of rapidageing – in some regions – and the obligation of the active population to financeaccordingly higher social expenditure, there would still be net gains in thestandard of living for the active population.
Our factor analyses show that governance parameters have a stronginfluence on social expenditure. This is encouraging as it shows that projectednegative future expenditure developments can be corrected by sensitivegovernance. Simulations show that the application of administratively relativelysimple reform strategies like modifications of pension indexations andincreasing the retirement age (which might prove hard to push throughpolitically) would probably keep the overall social expenditure levels in maturesocial protection systems roughly at about today’s average – that is, at or below25 per cent of GDP. This requires implementing policies to guarantee costcontainment measures and to introduce reallocations of resources betweendifferent categories of social expenditure early on, and will notably entailresource shifts from other categories of benefits to the pension category. This isby no means a minor issue as at the national level it will involve such difficultprocesses as for example the closure of kindergartens, schools and universitiesto channel the resources thus freed to the maintenance of the elderly. Many ofthe reforms will also need decades to become fully effective.
Therefore, if it is assumed that the present empirical level of overall socialexpenditure is more or less acceptable, then there is little reason to believe thatexpected future expenditure developments will almost automatically becomeunmanageable, though considerable political skill will be required to maintainthe political acceptance of necessary structural shifts within the overallumbrella of formal social expenditure.
100
Financing social protection

A checklist of questions for financial and social policy analysts
If a country’s overall social expenditure level is analysed and comparedwith that in other countries, the financial analyst should answer thefollowing questions:
1. On the basis of the national definition of social protection: Can a timeseries of the country’s SER be established? Are there breaks in theseries when new benefits are introduced or others terminated? Arethere sudden shifts in the GDP denominator that explain shifts in theSER curve?
2. Are there shifts in the composition of total social expenditure? Howcan they be explained? (For example, by ageing?) Are all thesubsystems of the country’s national social expenditure mature? Dothe subsystems and the system as a whole cover the entirepopulation?
3. Is the social protection system mature enough to justify the projectionof future expenditure by a simple ‘‘driver’’-based projection model?
4. When comparing the SER with countries having a similar level of GDP,how can differences and similarities be explained? Are the definitionsof social protection in the comparator countries similar/compatiblewith the country being analysed?
5. Can one identify the relative impact of demographic, economic andgovernance factors on the developments of the SER over the lastdecades?
6. Which governance measures could be used to stabilize or reducesocial expenditure during the coming decades?
Further reading
To find out more about the size and structure of national social protectionsystems and about basic projection methodologies, you may wish to referto Issue Brief 3 as well as to the following titles:
. EUROSTAT (2000)
. Scholz et al. (2000, Chapter 1).
101
The size of the welfare state

Notes
1
See Cichon et al. (1999); Scholz et al. (2000); Plamondon et al. (2002).2
Another important aggregate indicator, which should be taken into account for measuring publicexpenditure, is the ratio of public social protection expenditure to the total public expenditure. Countriesmay differ significantly with respect to the size of the public sector (measured as total revenue orexpenditure as proportion of GDP). Countries with a relatively low SER may still have a high ratio ofsocial protection expenditure to overall public expenditure. Also, when comparing the size of socialtransfers internationally one should bear in mind existing differences in taxation levels, particularlydifferences in tax rates applied to social benefits; see the analysis of net social expenditure in Adema(2001).
3
See ILO: The Cost of Social Security: Basic and comparative tables, various editions. The latestdata are available on the ILO website (www.ilo.org).
4
Data on social security expenditure can be retrieved from the System of National Accounts (SNA),which may subsume certain expenditure items under different headings. The SNAs and the OECD,EUROSTAT and ILO guidelines for collection of social security expenditure differ, for example, withrespect to the inclusion of charitable social expenditure, provident pension funds, the attribution of costsfor work-related injuries and care for the disabled.
5
The exceptions are Algeria (1994), Egypt (1959), Libya (1973), South Africa (1937), Tunisia(1982); also Nigeria and Tanzania, which provide for a payment of severance indemnity.
6
With the exception of Lebanon (1963), Saudi Arabia (1962), Syria (1959).7
Bangladesh, Fiji, India, Islamic Republic of Iran, Malaysia, Pakistan, Philippines, Singapore,Sri Lanka, Thailand.
8
The model is a simplification of the social budget model implemented by the ILO in severalcountries since the early 1990s.
9
Linking the rate of growth of health expenditure to GDP makes it possible to take implicitly intoaccount the fact that health expenditure is partly supply-driven – that is, based on our capacity to pay. Infact, unit health care costs will increase at about the same rate as total GDP, considering the increase inthe size of the employed population under the base scenario.
10
The GDP data were obtained from the World Bank (1996). In the 5-per cent growth scenario thecatch-up phase would be extended by about 15 years if Greece were to continue to grow at a real rate of 1per cent.
11
A minimum retirement age of 45 has been assumed not to consider people who withdraw earlyfrom the labour market and get entitled to limited benefits. It used to be an important phenomenon forwomen.
12
The duration of retirement is calculated on the basis of the average retirement age and lifeexpectancy at time of retirement.
13
The retirees’ expected age of death was 77.9 years in the countries of Central and Eastern Europein 1990. It was about 80 years of age in all other regions except Japan, where it reached 83.3 yearsbecause of high retirement age and high life expectancy.
14
The inactivity ratio is very sensitive to changes in retirement age as both the numerator (durationof retirement) and the denominator (number of years of activity) are dependent on retirement age. Achange in life expectancy or entry age will also have an impact but the inactivity ratio, unlike thedependency ratio, does not depend on the number of people in the different age groups.
15
Trinidad and Tobago is a case in point.16
But not always, as the example of some Central and Eastern European countries in the 1990shas shown.
102
Financing social protection

STATISTICAL ANNEX 2-A1
Table 2-A1.1 Total social expenditure by major function (as % of GDP),mid-1970s to mid-1990s
Country Year Total socialexpenditure1
Pensions Health care Other socialsecurityfunctions
Special schemesfor governmentemployees andwar victims
Africa
Benin 1975 1.18 0.19 0.00 0.78 0.00
1980 1.58 0.23 0.00 0.45 0.77
1985 0.75 0.33 0.00 0.22 0.00
1990 0.84 0.43 0.00 0.13 0.00
1992 1.00 0.17 0.00 0.76 0.00
Niger 1975 0.41 0.02 0.00 0.33 0.00
1980 0.30 0.01 0.00 0.24 0.00
1985 1.63 0.06 0.01 0.21 0.38
1992 0.66 0.10 0.07 0.22 0.00
Tanzania 1980 0.20 0.13 0.00 0.00 0.00
1985 0.24 0.16 0.00 0.00 0.00
1989 1.74 0.09 0.00 0.01 0.06
Togo 1975 0.81 0.11 0.00 0.41 0.00
1980 0.98 0.18 0.00 0.59 0.00
1985 1.21 0.37 0.00 0.54 0.00
1990 1.28 0.53 0.00 0.57 0.00
1992 1.40 0.49 0.00 0.59 0.00
Arab States
Bahrain 1975 0.39 0.08 0.00 0.02 0.21
1980 0.31 0.05 0.00 0.02 0.15
1985 0.43 0.27 0.00 0.05 0.00
1990 1.60 0.43 0.01 0.11 0.00
1992 1.60 0.43 0.01 0.11 0.00
Kuwait 1980 0.55 0.37 0.00 0.14 0.00
1985 2.55 1.32 0.00 0.00 0.00
1990 3.66 3.55 0.00 0.00 0.00
Saudi Arabia 1987 0.15 0.13 0.00 0.03 0.00
1990 0.15 0.12 0.00 0.02 0.00
1992 0.20 0.18 0.00 0.02 0.00
Asia
India 1975 1.46 0.36 0.04 0.05 0.96
1980 1.59 0.35 0.06 0.11 1.03
1985 1.54 0.33 0.04 0.07 1.04
1992 0.85 0.29 0.03 0.03 0.48
103

Table 2-A1.1 (cont’d)
Country Year Total socialexpenditure1
Pensions Health care Other socialsecurityfunctions
Special schemesfor governmentemployees andwar victims
Malaysia 1975 1.63 0.55 0.00 0.05 0.79
1980 0.96 0.45 0.00 0.04 0.33
1985 1.96 0.79 0.00 0.07 1.00
1990 2.67 1.52 0.00 0.06 1.00
1992 2.40 1.27 0.00 0.00 1.03
Philippines 1978 0.81 0.17 0.00 0.12 0.39
1980 0.71 0.18 0.00 0.10 0.30
1985 0.65 0.18 0.05 0.04 0.29
1990 0.97 0.41 0.00 0.14 0.32
1992 1.44 0.59 0.09 0.08 0.47
Singapore 1975 1.67 1.61 0.00 0.05 0.21
1980 3.67 2.51 0.00 0.07 0.21
1985 13.01 8.53 0.00 0.20 0.38
1990 8.01 5.49 0.31 0.04 0.00
1991 9.26 6.46 0.30 0.07 0.00
Latin America
Colombia 1975 2.21 0.13 0.51 0.29 1.03
1980 2.80 0.29 0.52 0.48 0.88
1985 2.00 0.47 0.00 0.10 0.47
1990 2.57 0.68 0.80 0.10 0.70
1992 2.49 1.38 0.98 0.13 0.00
Chile 1975 11.22 2.01 1.08 2.83 4.37
1980 11.43 2.52 1.00 2.22 4.68
1985 13.46 8.42 1.51 1.97 0.00
1990 10.73 6.01 1.58 1.55 0.00
1992 10.64 5.57 1.69 1.45 0.00
Mexico 1974 2.72 0.31 1.08 0.25 0.61
1980 2.61 0.27 0.88 0.25 0.50
1985 2.51 0.38 0.71 0.23 0.63
1990 2.61 0.55 0.84 0.39 0.44
1992 3.27 0.74 1.05 0.49 0.48
Uruguay 1975 10.01 4.34 0.13 1.43 1.92
1980 8.64 6.32 0.38 1.21 0.00
1985 9.83 7.34 0.71 0.96 0.00
1990 6.13 4.61 0.52 0.60 0.00
1992 14.11 11.15 1.21 1.05 0.00
Central and Eastern Europe
Bulgaria 1975 12.87 5.79 0.00 2.95 0.08
1980 9.72 6.19 2.28 3.36 0.07
1985 9.88 6.80 0.00 3.09 0.00
104
Financing social protection

Table 2-A1.1 (cont’d)
Country Year Total socialexpenditure1
Pensions Health care Other socialsecurityfunctions
Special schemesfor governmentemployees andwar victims
1990 16.07 8.66 3.69 3.66 0.00
1992 24.36 10.09 7.45 6.75 0.00
Poland 1985 14.42 6.78 3.83 3.23 0.47
1991 21.53 11.89 4.55 3.65 1.02
1992 21.35 13.11 3.20 5.45 1.29
Romania 1975 6.27 0.00 0.00 6.26 0.00
1980 8.39 0.00 2.30 6.09 0.00
1987 9.63 3.76 2.07 3.54 0.07
1990 9.73 5.75 0.48 2.63 0.71
1992 13.18 5.52 0.53 5.20 1.64
Ukraine 1975 13.97 7.51 0.00 2.16 0.00
1980 15.52 8.81 4.28 2.18 0.00
1985 16.66 10.16 4.16 2.33 0.00
1989 18.69 11.12 4.99 2.60 0.00
OECD
Japan 1975 8.67 1.33 2.77 1.94 1.58
1980 11.21 2.55 3.35 2.08 2.06
1985 11.60 3.34 3.66 1.77 2.16
1990 11.42 3.72 3.66 1.43 1.97
1992 11.65 3.81 3.70 1.43 1.94
Sweden 1975 24.88 6.92 1.31 8.85 1.24
1980 31.67 9.58 7.34 11.41 1.90
1985 30.57 12.25 7.66 9.41 0.00
1991 37.06 14.46 7.48 12.98 0.00
1992 39.86 18.67 7.33 11.86 0.01
United Kingdom 1975 17.13 5.48 0.00 4.33 1.48
1980 18.03 5.52 4.81 5.24 1.19
1985 20.05 5.73 4.51 7.04 1.22
1990 17.42 5.07 4.71 4.96 1.66
1992 21.19 5.80 5.52 6.61 2.16
United States 1975 11.65 4.15 0.89 4.13 1.99
1980 12.27 3.75 1.98 3.99 2.07
1985 12.58 4.31 1.75 3.77 2.19
1992 13.89 4.81 2.03 4.35 2.19
1Includes administrative costs.
Source: ILO, The Cost of Social Security.
105
The size of the welfare state

3SOCIAL PROTECTION ANDTHE ECONOMY
As we saw in Chapter 2, social protection systems are major redistributorsof GDP. As such, they are also major economic players in all countries. Nosocial protection planner or manager should design or manage a national socialprotection system (NSPS) or parts thereof without being aware of the potentialinterrelationships between social protection and the economy. This chapterdiscusses the nature and dimensions of their interaction. However, theindications given here cannot be as numerically precise as financial analystsmight wish since the magnitude and impact of those interrelationships dependon the nature of the economy, country-specific behaviour and the characteristicsof the welfare state itself. Still, the discussion should provide enough insightsto enable social protection planners, analysts and modellers to design financingscenarios that reflect alternative country-specific hypotheses regarding thequantitative nature of the interaction between the economy and the welfarestate. Such economic scenarios constitute, together with demographicscenarios, the basis for any testing of social protection financing arrangementsthrough economic and actuarial modelling.
Figure 3.1 maps out the nature of the interrelationships between socialprotection on the one hand and the economy and its major variables (the labourmarket, inflation, wages, productivity, savings and investments, and overallgrowth) on the other. It is obvious that almost all major variables have a directimpact on the performance of social protection – in terms of effectiveness andefficiency – as well as on the structure and levels of social expenditure. (Thesedirect determinants of social expenditure were explored in Chapter 2.)Unemployment, for instance, impacts on expenditure levels, employment onrevenue levels, and wages on benefit and income levels. The only exception maybe overall growth and levels of GDP. As a rule they influence directly the fiscalroom for manoeuvre for social transfers and hence the potential generosity ofthe system, but not necessarily its de facto generosity. As we saw in box 2.4, therelationship between GDP and social expenditure levels is not straightforward.
106

The impact of GDP levels on the performance and expenditure of the socialprotection system is also largely dependent on national policy preferences.
The relationships between social protection and the economy and its mainvariables are generally more indirect. They are not directly measurable sincethey are determined to a large extent by behavioural factors that are themselvesinfluenced by the provisions governing national transfers. For example,unemployment and early retirement may well be influenced by the transfersystems that thus impact on overall economic performance. On the other hand,effective health services might have a direct impact on productivity. Even ifsuch influences are less exactly measurable their impact may be substantial, andno design of a national financing system would be complete without trying toassess it. These from a modeller’s point of view less direct relationships – inother words the feedbacks from the social protection system to the nationaleconomy – are the main focus of this chapter.
Social protection can be seen as an instrument that polishes the rough edges ofthe economic machine. From this perspective, public social protection merelyfills the gap where society has produced no spontaneous informal initiatives – thatis, where ‘‘enlightened self-interest’’ falls short of providing some individualsor households with the basic means of subsistence. Such a view, however,would underestimate government’s more comprehensive ambitions to steer theeconomy.1 Governments can actually deliberately use some of the feedbacksfrom the social protection system to influence macroeconomic behaviour.
Around the mid-twentieth century, governments started to realize that socialprotection could and indeed should be one of the tools used by economic policy
Figure 3.1 Principal interrelationships between the economy and NSPSs
Source: ILO.
107
Social protection and the economy

to increase production and national income. J.M. Keynes provided theargument: increased government spending pays off. Expenditure is also income,and the government can use tax revenues to provide commodities and servicesthat would not be generated by market forces alone. Eichengreen (1994) hasdescribed how institutional arrangements (including the expansion of thewelfare state) in the decades after the Second World War solved a number ofinconsistencies in concerted action, both between countries and between capitaland labour within countries, and established commitment and trust, therebycontributing to rapid post-war recovery in a number of European countries.
As we have mentioned, advanced economies tend to have morecomprehensive social protection systems (see figure 3.2). The bigger thewelfare state, the bigger the influence of intended or unintended feedbacks fromthe social protection system on the economy.
0
4 000
8 000
12 000
16 000
20 000
24 000
0 5 10 15 20 25 30 35 40
Social security expenditure as a % of GDP
GD
P p
er c
apita
in P
PP
OECDcountries
Former communist countries
Developing countries
Oil States
Figure 3.2 Prosperity and social protection
Source: SZW.
108
Financing social protection

This chapter does not provide an extensive survey of the relevant literature.Our aim is to give an overview of the economic arguments concerning theimpact of the welfare state and its various arrangements and mechanisms oneconomic performance. Section 3.1 provides a brief introduction to some of theclassifications drawn from the economic literature on the welfare state. Thesubsequent sections examine three dimensions of the welfare state debate:section 3.2 analyses the theoretical debate on the economic effects of thewelfare state, section 3.3 looks at evidence concerning these effects, andsection 3.4 discusses whether the efficiency of transfer delivery and possiblenegative economic effects of the welfare state can be altered through alternativegovernance procedures (notably by changing the public-private mix in transferdelivery). Section 3.5 addresses the ultimate question as to whether welfarestates will remain affordable. Section 3.6 draws conclusions which – althoughnot as clear-cut as might be hoped – will provide some guidance on ways inwhich social protection planners and analysts should take potential economiceffects into account when designing new social transfer systems or schemes orreforming existing ones.
While the principal conclusions drawn here are relevant for the world as awhole, most of the concrete examples come from developed economies simplybecause they still offer better data and information and a better theory base.As a result, the chapter may appear Euro- or OECD-centred. However, themain economic arguments presented here should be applicable to most marketeconomies.
3.1 ECONOMIC TAXONOMIES OF NATIONAL SOCIAL
PROTECTION SYSTEMS
An NSPS or welfare state is more than a set of social protection schemes, thesum of its constituent parts. In fact, the welfare state is a concept ofcoordination: a means for the government to participate in the economy anddirect its outcomes. In the course of the twentieth century, different countrieshave developed different kinds of welfare states.
The classic distinction between the residual, industrial-achievement andinstitutional welfare states was made by R.M. Titmuss (1958). In line withthis, Esping-Andersen (1990) has classified welfare-state regimes into threecategories:
. the liberal regime;
. the conservative or corporatist regime; and
. the social democratic regime.
Esping-Andersen argues that it is not the level of public social expenditurethat is the significant indicator of the comprehensiveness of the welfare state,
109
Social protection and the economy

but its structure and institutions (in other words, the design of the programmes,their interaction with the market, and alternative private arrangements). Theliberal welfare states tend to offer flat benefits and limited benefit duration,and targeting (means testing, asset testing) is common. The other two welfareregimes generally grant earnings-related benefits (albeit with a ceiling). Theliberal and social-democratic (Nordic) welfare states provide universalcoverage, whereas in the corporatist countries coverage extends primarily tothose who are or have been employed. Liberal and Nordic models tend to betax financed, whereas in the corporatist model social insurance contributionsare common. While the corporatist model relies on the solidarity of employedworkers as a group, the Nordic and liberal welfare states ‘‘buy’’ the commit-ment of middle-income groups by other means (e.g. tax breaks for additionalsocial protection measures for wealthier citizens who can afford to pay forsuch protection). Corporatist welfare states tend to offer less generous provisionsto those without employment records.
Van Waarden (1997) has developed another classification, using thecoordination mechanism (or governance) as a central criterion. He hasdistinguished three categories of coordination in advanced economies. The firstis the liberal market economy. The coordination of economic transactions andthe allocation of productive resources are established first and foremostthrough the market, and the government merely provides the institutionalframework for the market mechanism to operate with as few constraints aspossible. Australia, Canada, the United Kingdom and the United States are allliberal market economies. In the second category the emphasis is on centralplanning by the government bureaucracy. France stands out as an exampleof this ‘‘etatist’’ tradition. In the third category, the so-called concerted orneo-corporatist economies, an important role is played by an elaborate,institutionalized network of intermediary organizations that take part ineconomic governance. One of their key features is that they have developedfrom simple narrow-interest organizations into entities pursuing muchwider policy agendas. Van Waarden (1997, p. 72) describes this as follows:‘‘. . .comprehensive associations can less easily seek rents for special interestsat the costs of others. As such organizations have to aggregate a greater varietyof interests, their policies tend to become more moderate and to gravitate to thecentre of the political spectrum, just as usually is the case for political partiesas they grow bigger.’’ Austria, Germany, the Netherlands and the Scandinaviancountries, among others, all fall into the category of concerted economies.
In the view of Esping-Andersen and van Waarden, then, the welfare stateis a set of institutions – including the tax structure, social insurance andassistance schemes, public provisions, labour market regulations and theindustrial relations infrastructure – that together enable governments (and theintermediary organizations, in concerted economies) to influence the paceand direction of economic development and the distribution of income andwealth. This definition of the welfare state clearly extends beyond the
110
Financing social protection

definition of an NSPS, which we have described as a social transfer system.For the purposes of this chapter, however, we will adopt this widerdefinition, since the size and structure of social transfers in the differenttypes of welfare states have a direct complementary relationship with thenon-transfer elements of the welfare state as defined by Esping-Andersen andvan Waarden, and since economic effects are triggered by non-transferand transfer elements together. The economic effects of certain types of un-employment benefits, for example, cannot be properly analysed in isolationfrom the corresponding labour market regulations and wage-setting mech-anisms in a country.
Governments run the risk of overshooting their ambitions when using theinstruments of the welfare state to influence the economy. In a plannedeconomy the outcome may be low motivation on the part of individualeconomic subjects to offer labour or capital since the reward may fall short ofwhat they perceive as worthwhile. Government spending and activities may‘‘crowd out’’ private investments and initiatives. To paraphrase Okun (1975),in the pursuit of equity, efficiency may suffer.
3.2 EXPLORING THE THEORY: DO EXTENSIVE WELFARE
STATES AFFECT ECONOMIC PERFORMANCE?
During the 1980s and 1990s the welfare state came under heavy political fire.The political and economic debate in most industrialized countries focused onthe issue of the oversized welfare state – that is, the welfare state as a burden onthe economy, hampering economic growth. Opponents of generous socialprovisions came out with clear-cut neoclassical economic arguments, initiallyputting politicians and social scientists that were generally in favour of thewelfare state on the defensive (see, for example, Korpi, 1985). Policies weredesigned to cut down social expenditure, but their impact on economicperformance remains doubtful in many countries. Box 3.1 describes somepolitico-economic aspects of welfare-state retrenchments.
Increasingly, however, economists (starting with Anthony Atkinson andNicholas Barr) began to counter the classical economic reasoning by pointingout that the design of a social insurance scheme can make a difference, and thatsuch schemes can provide efficient solutions where markets – if left alone –would fail. The following two sections offer views of the theoretical economicadvantages and disadvantages of the welfare state, both with respect to itsmacroeconomic effects and its impact on the behaviour of microeconomicsubjects. Section 3.2.1 analyses potential negative effects of extensive welfarestates on economic performance. Some of the arguments relate to the perceivednegative effects of the mere existence of social transfers, while others take issueonly with an alleged excessive size of such transfers. The potential positiveeffects of the welfare state are presented in section 3.2.2. The arguments put
111
Social protection and the economy

forward by no means defend excessive welfare states; rather, they state thepositive effects of well-designed and reasonably sized transfers.
On the whole, nobody is totally against social transfers and nobody defendsover-dimensioned, ill-targeted and badly designed transfers. It is thus importantfor the reader to distinguish in any debate the principal disadvantages of socialtransfers from the disadvantages of badly implemented transfers. In the finalanalysis, it appears that intelligent design of the welfare state matters more thanits size.
3.2.1 Do extensive welfare states have a negative impact
on economic performance?
The main arguments of those who believe that an extensive welfare state isdetrimental to economic growth and is hence an obstacle to welfare itself run asfollows:
Box 3.1 The political economy of welfare state reforms
The downsizing of the welfare state as a political programme generallymeets with resistance and reduces a politician’s chances of winning thenext elections. A good example is provided by the strategy pursued byconservative governments in the United States and the United Kingdomduring the 1980s (Pierson, 1994). Pierson distinguishes concrete meas-ures (‘‘programmatic retrenchment’’) from modifications in the institu-tional parameters (‘‘systemic retrenchment’’). Both strategies wereapplied in both countries. Ultimately, the United Kingdom governmentabolished the universal second-tier pension scheme (established just afew years earlier, in 1975) but other programmes were largely unaffected.Upon taking office the government had initially advocated a reform of theBritish National Health Service that aimed to substitute private healthinsurance for public provision. The plans were soon rejected, in 1982,when it turned out that private insurance was not a means by which tocontain costs. As Pierson (1994, p. 133) remarks: ‘‘However unattractive toconservative ideology, the concentration of control over health careprovision had proven to be a powerful cost-containment technique’’. Theproblem with cuts in income-protection schemes was that both countrieshistorically relied (and still do) on targeted welfare programmes thatprovide benefit levels close to the basic means of subsistence. Theseprogrammes could not be attacked because they were at the core of‘‘residualist’’ conservative political welfare state policies. The US adminis-tration, however, did succeed in one important, indirect way: it reformedtaxes, in two steps – in 1981 and 1986. This effectively restricted the scopefor financing redistribution through welfare-state programmes, showingthat the financing system, for example through ‘‘defunding’’, can be usedto influence benefit levels of the welfare state.
112
Financing social protection

Large welfare states create excessive administrative costs
This may sound like a side issue, but it is actually crucial. If we accept theview outlined in Chapter 1 that every society must be expected to maintain acertain overall level of formal and informal transfers, then the cost of deliveringthese transfers becomes a critical issue. Administrative costs are always apotential source of productive and allocative inefficiencies. If the administrationof a benefit costs more than is necessary, society faces excessive opportunitycost – in other words, other things could be financed with the money wasted onunnecessary administration. However, in the management of formal transferssome administrative costs are unavoidable; they are an inevitable part of thedelivery of benefits. Private formal delivery – for example, through privatedelivery units (such as private sector providers in health care) or through privateor non-government delivery financing schemes – also entails administrativecosts. There is no reason to believe that the administrative costs for privateschemes are lower than for public schemes. In fact, the evidence inindustrialized countries points to the contrary. Given the economies of scaleinvolved in any administration, the administrative costs for generally smallerprivate schemes are inevitably higher than for public ones. The administrativecost ratio of the private Chilean pension scheme is a multiple of that of thepublic systems in, for example, Austria and Canada.2 Similarly, many privateUnited States health insurance schemes have much higher administrativecosts than social insurance schemes in Europe.
For mature social protection systems the problem is not so much theadministrative costs themselves but the widespread perception that publicadministrations have no inherent drive to reduce operating costs whereasprivate providers are more efficient. In developing countries, meanwhile, manysocial insurance schemes face excessive administrative costs.3 If developingcountries do not formalize their informal transfer systems those costs could begreatly reduced, though not completely avoided. However, this would beachieved at the cost of greater unreliability and inequality that are characteristicof informal transfers.
Large welfare states give rise to compliance costs and moral hazard
Compliance costs are resources used in the process of collecting tax revenues,monitoring and policing, and enforcing rules. Many perceive them as inherent inthe public sector (to prevent free-riding), and therefore expect them to be higher incomprehensive welfare states than in residual welfare states. However,monitoring and policing are common in private arrangements (such as insurancecontracts) as well. The avoidance of compliance costs often simply results inlower coverage, which is in turn synonymous with moral hazard or adverseselection problems and may ultimately generate higher direct governmentexpenditure in social assistance for uninsured people in need. If people who are‘‘good risks’’ fail to comply (self-employed people with relatively high incomes,
113
Social protection and the economy

for example), this could simply raise the per capita share of taxes or contributionsfor those who cannot avoid paying. These are often formal sector employeeswhose labour costs increase unnecessarily as a result.
Moral hazard per se is not an argument against the welfare state (Teulingset al., 1997). It occurs in private insurance as well as in public schemes. Thesource of moral hazard is asymmetrical information – that is, the case wherethe agent/insured knows more than the principal/insurer. There are means ofdealing with moral hazard (for example, experience rating, exclusions, co-payments), but they tend to be applied less commonly in public schemes thanunder private insurance policies. Aarts and de Jong (1997) have cited this asevidence for their argument that, since moral hazard is more likely to arise indisability insurance schemes than in (individual) old-age pension schemes,there is more scope for private disability insurance and less for private old-agepension insurance. The administrative costs for the latter are so much higherthan for public (or private occupational) schemes that it is less efficient tooperate private individual old-age pension insurance schemes.
Lindbeck (1995, 1997b) has argued that the long-term effect of largewelfare states is towards moral hazard. At the core of his ‘‘hazardousdynamics’’ argument is the adjustment of behaviour patterns over a longer timespan. The behavioural response to new social transfers tends to be lagged due tocollective arrangements (hampering a rapid individual response), informationand adjustment costs, and moral rules that restrict the influence of economicincentives on behaviour (idem, 1995, p. 10). It takes a ‘‘critical mass’’ of peoplefollowing new rules or taking advantage of new possibilities before anindividual is likely to go along with them. Since the disincentive effects ofwelfare-state schemes appear with a considerable time lag, politicians tend notto anticipate them, and hence, according to Lindbeck, welfare-state policiestend to ‘‘overshoot’’ their objectives.4
Large welfare states affect the supply of productive resources
Microeconomic studies show that taxes and benefit systems in general –and therefore taxes and contributions collected to finance the welfare statein particular – affect the supply of labour. Taxation reduces the income ofindividuals and households. This is the income effect. A second effect stemsfrom the fact that not all activities are taxed at the same rate. Having lessdisposable income, economic subjects will respond by gravitating towardslightly taxed activities, such as consuming leisure and producing in the informalsector. This is the substitution effect. There are different dimensions of laboursupply (effort, hours of work, participation). And increased leisure may takevarious forms, such as putting in less effort on the job, working fewer hours,retiring earlier, and so on. The income and substitution effects of an income taxoperate in different directions and the net outcome is theoretically undeter-mined. In contrast, the income and substitution effects of a received benefit
114
Financing social protection

operate in the same direction – that is, the benefit leads to a reduction in laboursupply (Moffit, 1992). The availability of benefits (replacement income)weakens the incentive to look for a job, supposedly reducing aggregate laboursupply and hence employment (assuming that demand for labour is adequate).
Several economic theories, however, have cast doubt on the argument that thesimple existence of a benefit reduces employment levels. Job search theory, forinstance, points at two opposite effects: (i) the reservation wage5 declines asbenefit expiry approaches, and so the probability of leaving the benefit-paymentrolls increases over the duration of insured unemployment; and (ii) an increase inthe benefit level elicits a greater labour supply from currently non-eligibleworkers who wish to ‘‘buy’’ that protection. In general, then, the effect of higherbenefits on the duration of unemployment is ambiguous (Holmlund, 1997). Thefirst proposition has been the subject of extensive empirical studies (Layard et al.,1991). The end-of-benefit-duration effect is supported by evidence.6
Social security is also said to affect savings and consequently investments.In the pensions literature in particular this is an often-reiterated argument withrespect to public pays-as-you-go (PAYG) pension schemes. In a traditionallife cycle model, in which people base their decisions about saving on theiranticipated lifetime wealth and the rate of return on savings, a PAYG pensionsystem crowds out private savings (Aaron, 1982).7 However, there are somecaveats. Low-income households generally save little; the introduction of apublic PAYG pension system would therefore not depress their savings sincethey would not have saved anyway. Kohl and O’Brien (1998, p. 35) find ina survey of the empirical literature that public PAYG pension systems exerta minor downward effect on private household savings (the marginal effectis found to be �0.05). After reviewing the statistical evidence, Gillion et al.(2000, p. 361) conclude: ‘‘Despite numerous attempts to measure the effectsstatistically, no consistent evidence has emerged, linking the creation ofpay-as-you-go pension schemes with reductions in personal savings rates. Thissuggests that, if these schemes have a negative effect on personal saving, itprobably has been a modest one.’’
The negative effect of private pension schemes (contractual savingsschemes) on private household saving is far more substantial (0.75–0.8). Kohland O’Brien (1998, pp. 36–40) have found, from empirical studies focusing onCanada, Denmark, the United Kingdom and the United States, that additionalprivate savings resulting from these schemes are offset by additional tax expen-ditures. The net effect on the savings-to-GNP ratio in this case would be nil.Adema (1999, p. 2) has calculated that tax expenditures for private pensions inan extreme case such as the United Kingdom can amount to 2.4 per cent of GDP.
Large welfare states generate ‘‘deadweight losses’’
The ‘‘excess burden’’ or ‘‘deadweight loss’’ is the difference between thetotal direct and indirect cost of a tax levied on the taxpayer (this is called
115
Social protection and the economy

the ‘‘consumer surplus’’) and a fictive lump-sum tax yielding the same revenue.Excess burdens are due to substitution effects. That is, individuals alter theirbehaviour because of the tax (e.g. by working fewer hours because of a declinein the relative price of leisure; as a consequence, overall GDP would drop).
Figure 3.3 helps to clarify this point.8 Let us assume that the supply of goodk is perfectly elastic at price pk, so that the equilibrium in the absence oftaxation is at point E. The effect of a tax at rate tk is to raise the consumer pricefrom pk to pk(1+tk). The after-tax equilibrium is at point B. In this partialequilibrium framework the distortion caused by the tax could be measured bythe loss of consumer surplus over and above the revenue raised, the ‘‘excessburden’’. The area ABECD can be taken as a measure of the loss of consumersurplus, the excess burden is represented by the shaded area BCE.
Feldstein (1997) has calculated a marginal excess burden per dollar of taxrevenue as $1.65 (hence the total cost to the average taxpayer in terms ofreduced disposable income could be $2.65). However, Slemrod (1998)estimates the marginal excess burden to be more in the order of $0.20–$0.25,arguing that much of the response to a tax increase is the result of retimingrather than of decreased work effort.
Large welfare states create rigidities
Rigidities may arise from: (i) labour market regulation, (ii) social securitysystems, or (iii) the wage formation process (OECD, 1994, Chapter 5). Closelyrelated to the last item is a fourth factor, minimum wage levels. Some of theseaspects belong to the non-transfer components of the wider concept of the
Figure 3.3 Deadweight loss of taxation
Source: ILO, adapted from Atkinson and Stiglitz (1980).
116
Financing social protection

welfare state. As they often complement or substitute transfers (for example,protective legislation reducing employers’ freedom to lay off workers is apartial substitute for unemployment benefits9), we will analyse them heretogether with the effects of income transfers.
Employment protection regulation reduces short-term unemployment sinceit creates obstacles to laying off redundant workers. But since firms willaccordingly be more cautious about hiring labour in times of economic upturn,employment protection legislation tends to reduce the outflow from un-employment into work and has an upward effect on long-term unemployment(Nickell, 1997; OECD, 1999a).
Generous unemployment benefit levels affect the labour market in two ways:(i) laid-off workers are less inclined to look for new jobs; and (ii) there is anupward pressure on wages as workers are less concerned about losing their jobs.Ljungqvist and Sargent (1998) argue that welfare states are vulnerable in timesof increased economic upheaval. Large numbers of unemployed workers,entitled to generous compensation benefits, find their skills depreciatingconsiderably while economic turbulence makes the acquisition of new skillsvery uncertain. ‘‘The fact that welfare benefits are based on past earnings causesthese workers with depreciated skills literally to ‘bail out’ from the activelabour force by choosing low search intensities and high reservation wages’’(idem, 1998, p. 547). The second effect (upward pressure on wages) is amacroeconomic one. The demand for labour will be reduced when taxes andbenefits drive up wages.
Wage formation is another factor. Labour cost can only go up as a result ofhigher taxes or contribution payments if wage levels are rigid and tax andcontribution increases cannot be absorbed by the reduction of workers’ disposableincome. Some analysis of the wage-setting processes is therefore in order.
In the first half of the 1990s a number of economists perceived the level ofunemployment as an effect of the ‘‘insider-outsider theory’’ which claims thatlabour turnover costs give the employed (the insiders) market power, allowingthem to prevent (real) wages from falling despite increasingly high numbers ofunemployed (the outsiders). This effect is perceived to be aggravated whentrade unions are powerful.10 Calmfors and Driffill (1988) have argued that theimpact of growing centralization in union-level bargaining on wages dependson two forces working in opposite directions: bargaining power and the effectof wages on prices. More centralized unions gain greater bargaining power andwill thus be able to command higher wages. When the scope of bargainingextends beyond the industry level, however, the effect of nominal wages on theaggregate price level will become more significant. The real wage gains ofa given nominal wage increase are hence limited. Others have used a similarline of reasoning (Summers et al., 1993; Alesina and Perotti, 1997): The degreeof centralization in the labour market wage-setting process has an effect oncompetitiveness (measured as unit wage costs). Transfers are financed out oftaxes and these affect union wage costs in countries where unions are involved
117
Social protection and the economy

in wage bargaining at intermediate levels. However, when they operate on anational scale, ‘‘the unions are able to internalize the positive link betweenhigher taxation and social security and welfare benefits. . .’’ (Alesina andPerotti, 1997, p. 922).
Calmfors has entered several caveats with respect to this argument. Accountmust be taken of historical traditions and structural characteristics: ‘‘differentwage-setting institutions may contribute to good macroeconomic performancein different places’’ (1993, p. 182). Next, the openness of economies to foreigncompetitors will force wage restraint in bargaining at the industry level and atthe company level alike. Moreover, Calmfors argues, cooperative andcoordinated wage-setting can take different forms. It may or may not entailmulti-level bargaining. Last but not least, pattern bargaining (in which certainindustries act as wage leaders) can be regarded as a method of informalcooperation (ibid., p. 171).
Minimum wage legislation truncates the earnings distribution at a certainlevel and, according to standard neoclassic economic theory, this will lead toloss of employment at the low-skilled end of the labour market. Manning(1995) has found that there are circumstances under which minimum-wageincreases can lead to net job gains, rather than losses. Furthermore, theargument that high and persistent unemployment can be attributed toeffective floors in the earnings distribution is not consistent with empiricaldata (OECD, 1998a). Examining differences in education and skill levels inGermany, the United Kingdom and the United States, Nickell and Bell(1996) find that the relatively high level of skills attained by middle-rankingoperatives in Germany enables them to sustain a high level of productivity.This enables the German workforce to keep track of increasing skillrequirements due to technological change, and consequently the relativelyhigh German minimum-wage level is less harmful than a similar level wouldbe in other countries.
Large welfare states slow down productivity growth
Large welfare states redistribute resources towards activities that exhibit aninherently slow productivity growth rate. This is a function of the ‘‘Baumolmechanism’’. Service activities like education, the performing arts and healthcare do not allow for constant and cumulative increases in productivity throughcapital accumulation, innovation, or economies of large-scale operation(Baumol, 1967, p. 420). This drives up the relative costs of these activities,and, when demand is price-inelastic, the share of these services in total GDPincreases and the GDP growth rate slows down. However, there is no clear-cutempirical evidence of this mechanism. The expansion of the health care andeducation sectors during the 1960s and 1970s has been largely the result ofpolitical processes. The quality of education and health care has improvedenormously during the past decades. Teachers apply individually targeted
118
Financing social protection

learning methods, and medical technology has increased the efficacy of medicaltreatment. Finally, the endogenous growth literature of the late 1980s (notablyRomer, 1986, 1990; and Lucas, 1988) has opened avenues for exploringeducation’s contribution to productivity and economic growth (this issue isreviewed in section 3.2.2).
3.2.2 Do extensive welfare states have a positive impact
on economic performance?
Welfare-state arrangements (in particular social transfers)alleviate poverty
Apart from a small number of ‘‘natural rights’’ political theorists, theconsensus view appears to be that the welfare state performs a basic poverty-alleviation task. The debate is then not so much on whether the government hasa responsibility to do this, but rather on the extent of the safety net.
Large welfare states are more efficient in the provision of insurance
Owing to the effects of adverse selection and moral hazard on insuredpersons, the insurer does not obtain all the information he or she requires tocalculate an actuarially adequate premium. Adverse selection (in which theopting-out of the lowest risks pushes up the average insurance premium, thusincreasing the incentive for the next lowest risks to opt out, and so on11) leads toreduced efficiency from the perspective of the individual (or group ofindividuals sharing a common risk profile) on the one hand, and the societyor community as a whole on the other. Moral hazard occurs in both the publicand the private domains.
Barr (1989, 1992) has argued that private insurance markets cannotadequately solve the adverse selection problem. Apart from informationdeficiencies (and the more conventional market failures), for some eventsprobability may be unpredictable (future inflation in pension schemes),interdependent (unemployment in the business cycle), or close to unity(the case of the chronically ill). Purely private insurance in these casesis unfeasible. These issues call for ‘‘social insurance: pooling arrangementsthat are not actuarially sound, and hence require support from compulsorytaxation’’ (idem, 1992, p. 754). Barr further points out, ‘‘if preferences aresufficiently similar, the welfare loss from compulsion may be minimal’’ (ibid.,p. 752). A comparison of aggregate shares of net social expenditure – bothpublic and private – suggests that this is indeed the case, as we will see insection 3.4.2. This means that a reduction in public social expenditure – whichhas been proposed as a part of welfare state reforms throughout the industrialworld – will not reduce total social expenditure to the same extent; substitutioneffects may be expected.
119
Social protection and the economy

Large welfare states enable economic subjects to take risks
Gruber (1997) has argued that ex ante sharing of the risks of labour incomelosses, regardless of whether they are due to fluctuations in real wages orunemployment, reduces ex post income inequality. Insurance against the loss ofincome induces risk taking (Sinn, 1995). From this perspective, there may be notrade-off between equity and efficiency at all.12 Equity, according to Sinn, may infact be an aspect of efficiency, although income redistribution programmes haveto be well designed in order not to overshoot the optimal level of risk taking,known as moral hazard. If the government offers public insurance, the need forself-insurance is reduced. This, as Sinn argues, makes it socially optimal totolerate more risk and inequality in exchange for a higher level of averageincome. ‘‘Under the protection of the welfare state more can be dared’’ (ibid.,p. 12). In any case, modern social transfer systems may exploit that relationshipto support entrepreneurial behaviour, even if they do not do so at present.
Large welfare states permit access to schooling facilities,thereby enhancing human capital
The argument here is that capital market imperfections deny the lessprivileged members of society access to private education, thereby creating asub-optimal skill level in the economy. The costs of education divide thepopulation into two classes which differ not only in their current job status andincome, but also in their ability to accumulate human capital (Brandolini andRossi, 1996). This in turn leads to an under-utilisation of the economy’sproductive potential and a lower GDP growth rate. These capital marketimperfections do not have to be explicit credit constraints, the mechanism maywell be more subtle than that (Aghion and Bolton, 1992; Galor and Zeira,1993). Still, the outcome is more or less the same in that the poor cannot or donot borrow to finance their education.
Large welfare states facilitate economic restructuring
Rodrik (1998) has found a strong correlation between openness (tradeturnover) and the share of government expenditure in GDP. The explanation, hehas argued, lies in the government’s role in ‘‘insulating’’ employment andaggregate demand in economies that, because of their integration in regional orglobal markets, have developed highly specialized production patterns and areconsequently vulnerable to external shocks. Moreover, the causality runs frominternational exposure (external risk) to government spending. Openness in theearly 1960s turned out to be a significant predictor of the expansion of governmentconsumption in the subsequent three decades (ibid., p. 1004). Governmentspending on social protection is the crucial variable in the more advancedeconomies, which have well-established administrative institutions. Developingcountries, Rodrik argues, tend to rely on a broader set of instruments, including
120
Financing social protection

public employment, to achieve risk reduction (ibid., p. 1012). This set of instru-ments turns up in the statistics under the heading ‘‘government consumption’’.
Large welfare states build trust and prevent social unrest
Several economists have drawn attention to the balance of power in politicsand the impact of redistributive pressures which are assumed to discourageinvestment and economic growth (Alesina and Rodrik, 1994; Persson andTabellini, 1994). The idea is that by lowering the income of the median(middle-class) voter relative to the national average, increased (pre-tax)inequality unleashes pressure for redistribution. This social unrest discouragesinvestment. Knack and Keefer (1997), for instance, have found a very strongempirical link between trust and investment in the period 1960–92. Benabou(1996) argues that what matters is not income inequality per se, but inequalityin the relative distribution of earnings and political power: ‘‘what matters forgrowth is not just the degree to which the political system departs fromdemocracy. . . but also whose political rights or influence is being curtailed’’.Borjas (1995) points out the close link between social (and racial) segregationand intergenerational immobility in residual welfare states, and a number ofstudies have found a relationship with crime (e.g. Freeman, 1996).
3.2.3 Preliminary theoretical conclusion
Once all the arguments are on the table, the outcome of the theoretical debate onthe potential positive versus negative economic effects of the welfare state appearsto be a draw, at least in our view, though others may draw different conclusions.
For the policy analyst and the decision-maker an inconclusive debate is oflimited help. Some more pragmatic support is needed for national decision-making processes on the extent and structure of the welfare state. The nextsection will accordingly take us a little deeper into the empirical evidence andthe mechanisms that link the welfare state to economic performance. The cruciallink between social protection provisions and economic performance is thelabour market, other links being the tax system and workforce participation. Wewill first look at the indications of the impact of these mechanisms, and then at aninput-output analysis of the performance of the welfare state to see how differentoutcomes correlate with the prevalence of a certain type of welfare state.
3.3 LOOKING AT THE EVIDENCE: THE MECHANISMS
OF INTERACTION BETWEEN THE WELFARE
STATE AND ECONOMIC PERFORMANCE13
To what extent is economic performance determined by welfare stateinstitutions? Are liberal market economies with residual welfare states more
121
Social protection and the economy

competitive than countries with extensive welfare states? In this section we willanalyse some performance statistics, collected primarily from a limited set of fiveadvanced industrial countries. This limitation is inevitable since evidenceelsewhere is scarce. The United Kingdom and the United States are examples ofliberal market economies with residual welfare states, whereas Germany, theNetherlands and Sweden will feature throughout most of the discussion asexamples of economies with extensive welfare states. Occasionally we will referto a wider set of countries, including Australia, Canada, Denmark, Finland andFrance. We will conclude that these economies respond differently to changes inthe economic environment: although the two groups (liberal market economiesand extensive welfare states) use different channels to adjust, the actual degree orintensity of adjustment is similar. There are also huge within-group differencesbetween the more comprehensive welfare states, as box 3.2 makes clear.
Box 3.2 The welfare state in Germany, the Netherlands and Sweden:
Different track records1
Germany and the Netherlands are both neo-corporatist or concertedeconomies. They form the core of what has been named ‘‘the Rhinelandmodel’’ (Albert, 1993). The German social insurance model, born in thelate nineteenth century, was explicitly designed to dedicate the labourmovement and the manufacturers to the interests of the nation-state. Inthe Netherlands the establishment of a comprehensive framework ofpublic social insurance and assistance schemes took over half a centurylonger; as a result, the country’s extensive welfare state emerged ratherbelatedly, towards the end of the 1960s. The comprehensive welfare statein Sweden was established over several decades of social-democraticgovernance. Lindbeck (1997a) describes how the expansion of Sweden’swelfare state was not planned according to some grand design, but wasthe result of numerous separate decisions reflecting a common percep-tion. Sometime during the 1970s ‘‘ambitions switched from equity toequality’’ (ibid., p. 1282). The Dutch and Swedish welfare states expandedrapidly in the decade and a half after 1967.
Germany, the Netherlands and Sweden all experienced the samedecline in international competitiveness from the 1970s onwards.However, the Netherlands felt its full impact a decade earlier thanSweden. Like the Swedish government in the 1980s, in the 1970s theDutch government tried to ‘‘spend’’ the economy out of the crisis thatfollowed the oil crisis. The figures in box tables 3.2.1 and 3.2.2 provide anoverview of the different track records.
Economic growth records were rather similar before 1983, but sincethen disparities have appeared. The high employment growth in theNetherlands is reflected in the lower unemployment figure. In 1982, thegovernments in both Germany and the Netherlands set out to cut publicexpenditure and reduce the budget deficit.
122
Financing social protection

Wage moderation, sustained throughout the 1980s, improved therate of return on investment and contributed to an economic recovery inthe second half of the decade. The Netherlands faced an economicdownturn in the early 1990s, whereas Germany (West Germany)managed to avoid the recession that hit other European countries,thanks to a prolonged reunification boom. The upturn did not last,however. German GDP growth has decelerated from over 5 per cent in1990–91 to an average of less than 1.5 per cent since. Reunification hasresulted in a deteriorating labour market performance and placed aburden on the existing West German social protection infrastructuresince it gave rise to a large number of public transfers eastward.Reunification was conceived and executed as a giant exercise inInstitutionentransfer : a wholesale transplantation of the entire array ofWest German institutions to the former East Germany (Streeck, 1995).The collapse of the markets for East German products caused massivejob losses in the new Lander, from 9.8 million in 1990 to 6.2 million jobsin 1993. Wage moderation in the 1993–94 wage rounds was notsustained in 1995, contributing to a new downturn. After substantialgrowth in 1990 and 1991, employment declined by an average of morethan 1 per cent for some time.
Box table 3.2.1 Selected economic-growth and labour market performancestatistics
GDP average
annual growth rates (%)Employment average
annual growth rates (%)
Unemployment
rates (%)
1973–83 1983–93 1993–2000 1983–91 1991–95 1995–2000 1983 1990 2000
Germany 1.6 2.8 1.3 1.3 �0.7 0.6 6.9 4.8 7.9
Netherlands 1.7 2.7 2.4 1.9 1.1 2.8 9.7 6.2 2.7
Sweden 1.5 1.4 2.2 0.5 �2.4 0.8 3.7 1.7 5.9
Source: OECD (2001a).
Box table 3.2.2 Selected statistics on public finances (as % of GDP), 1984–2000
General government
financial balances
deficit (�), surplus (+)
General government
total outlays
General government
gross financial liabilities
1984 1992 2000 1984 1992 2000 1984 1992 2000
Germany �1.9 �2.5 1.5 46.1 45.0 42.9 40.6 41.8 59.7
Netherlands �6.2 �4.4 2.2 53.8 50.0 41.5 64.2 76.4 56.3
Sweden �3.0 �7.8 4.1 59.1 64.3 52.7 65.1 69.0 62.3
Source: OECD (2001a).
Box 3.2 (cont’d)
123
Social protection and the economy

The government that took office in the Netherlands in 1994 and wasre-elected in 1998 set a ceiling in real terms on public spending anddeliberately used a very modest GDP growth forecast for estimatingrevenues from taxes and social security contributions. Both steps wereintended to make fiscal policy less dependent on the business cycle.Moreover, the government undertook several measures to reform socialsecurity, both in terms of programmes and the administration (seeking inboth cases to improve incentives).
In Sweden the response to deteriorating international competitivenesshad been several rounds of devaluations of the Swedish krona, not wagemoderation. This fuelled inflation and resulted once again in higher wagedemands, since the trade unions were accustomed to setting their targets inreal terms. Full employment had been one of the cornerstones of theSwedish approach, and this translated into a large public sector that acted asa ‘‘last resort’’ in the government’s range of active labour market policies(Lindbeck, 1997a). In the first half of the 1990s Sweden faced a severe macro-economic crisis. This time the government did not respond with accom-modating fiscal measures. Box figure 3.2.1 shows that the number of socialprotection beneficiaries in Sweden rose rapidly in that short time span.
Box figure 3.2.1 Benefit recipients (%), Netherlands and Sweden, 1989–95
Source: Calculated from OECD data.
Box 3.2 (cont’d)
124
Financing social protection

Some may wonder why we are focusing on such a limited set of countries.The answer is simple. One of our objectives in this section is to show that thereare more than two or three kinds of welfare states. As Popper (1963) argued,when your aim is to refute the claim that all swans are white, you do not have towait until you have seen them all. The moment you spot one swan that is notwhite you have proved your point. If we can demonstrate with five countriesthat there are at least five distinct models, then we might as well confineourselves to those five.
In the second half of the 1990s, the Netherlands and Swedenrecovered from their earlier crises. In both cases restrictive fiscalpolicies contributed a great deal. The Swedish government, however,reduced the budget deficit by tax increases more than by cuts in socialexpenditure. In the Netherlands, in contrast, the government used taxrelief to support wage moderation. The labour market was liberalized,while at the same time steps were taken to improve the position of themany fixed-term contract workers. Several measures improved low-skilled workers’ prospects of finding jobs (in both the public and privatesectors). And incentives in social insurance schemes were redesigned,without substantially affecting the entitlements of beneficiaries.
And Germany? The institutional structure of its economy in thepost-war decades was geared toward supporting a strong manufactur-ing sector that sought a high added value. Internationalization fromthe 1970s onwards has challenged this position. The enduring crisissince reunification is attributable to both internal and external causes.Pointing at internationalization, as some commentators do, reflects awide concern that there is no longer room for a social market modelof the German type, one that shields itself from distorting outsidemechanisms. This view holds that adapting the institutional frameworksets in motion a ‘‘spiral of institutional erosion and structural down-grading’’ (Streeck, 1995), and that ultimately the German model willinevitably give way to a liberal market model. Internationalization,however, is not a sufficient explanation for the erosion of the Germancorporatist framework. At least not from the Dutch point of view. Infact, in the 1970s corporatism in the Netherlands was paralysed as aresult of endemic causes; the situation changed when the internationaleconomic environment shifted and put strain on the model. The case ofthe Netherlands teaches us that corporatism can be altered and thatwelfare-state institutions can be reformed in order to contribute to theeconomy’s adjustment potential.
Note
1 The cases and their interpretation are also discussed by de Neubourg (1998).
Box 3.2 (cont’d)
125
Social protection and the economy

3.3.1 The welfare state and labour market outcomes
Until just a few years ago the persistently high unemployment rates incontinental Europe were commonly regarded as sufficient evidence thatextensive welfare state arrangements led to losses in economic performance.Since the mid-1990s, however, this one-dimensional view no longer matchesthe facts. Some welfare states have managed to reduce their structuralunemployment, whereas others appear to have been muddling through. Thecomparison between Germany and the Netherlands in table 3.1 is telling.
The OECD has ascribed the persistence of unemployment in severalcontinental European countries to their extensive welfare state institutions(OECD, 1994, Chapter 5). This is not borne out by facts: several continentalEuropean countries have reformed their welfare state institutions during the1980s. The OECD acknowledges that changes in institutions from the 1980sonwards have not aggravated alleged rigidities; nevertheless, the rise in thestructural unemployment rate may have been related to changes in institutionalarrangements in the 1970s. The OECD thus suggests that there is a time lagbetween cause and effect.
The internationalization of trade (to avoid the more fashionable word‘‘globalization’’, which wrongly implies that trade is truly global, which it isnot), structural economic change (the emerging services sector) andtechnological change are generally assumed to determine the widening ofwage differentials in several countries, such as the United Kingdom and theUnited States (Atkinson et al., 1995, p. 83). Some attribute it to internation-alization, while others emphasize structural and technological change. In anycase, these factors are difficult to disentangle (see section 3.5.2). However,widening wage differentials can be observed in some countries, notably theUnited Kingdom and the United States, whereas no widening of the wagespread can be seen in other countries, for example Germany and Sweden.
We will first look at the trends in earnings dispersion in the five countries.As displayed in table 3.2, in Germany and Sweden the D9/D5 ratio14 (the spread
Table 3.1 Unemployment and long-term unemployment, selected countries,1990–2000
Standardized unemployment rates (%) Incidence of long-term unemployment (%)
1990 1994 1998 2000 1990 1995 1998 2000
Germany 4.8 8.4 9.3 8.1 46.8 45.9 52.6 51.5
Netherlands 6.2 7.1 4.1 2.8 49.3 51.6 47.9 32.7
Sweden 1.7 9.4 8.3 5.9 12.1 31.4 33.5 26.4
United Kingdom 7.1 9.6 6.3 5.5 34.4 49.6 32.7 28.8
United States 5.6 6.1 4.5 4.0 5.5 11.0 8.0 6.0
Source: OECD (2001b).
126
Financing social protection

in high earnings) has been stable since 1985; the D5/D1 ratio (the spread in lowearnings) even declined between 1985 and 1995. For the Netherlands the tableshows a slight rise in both ratios. In the United States the widening in theearnings distribution was accompanied by a fall in the real wages of low-paidworkers (namely, the bottom decile). In the United Kingdom, on the other hand,the real wages of the bottom decile have risen despite a more uneven earningsdistribution (OECD, 1996c, p. 67).
In a larger sample of countries, Gottschalk and Smeeding (1997) summarizethe trends in earnings inequality as follows:
. Almost all industrial economies experienced some increase in wageinequality among prime-aged males during the 1980s; Germany is amongthe exceptions.
. Earnings inequality increased most in the United Kingdom and the UnitedStates, and least in the Nordic countries.
. Rising demand for more skilled workers, in combination with differencesbetween countries in the growth of the supply of skilled workers, explains alarge part of the cross-country trends in the returns to education andexperience.
. Institutional constraints on wages also play an important part.
To elaborate on the last point, the incidence of low-paid employment isinversely related to the occurrence of collective wage-setting practices and theextent of social security arrangements (OECD, 1996c, pp. 71–76). Theexistence of a central and/or sectoral structure for consultation and negotiationin industrial relations and other institutions, such as legal minimum wages andrelatively generous welfare benefits, appears to set a binding wage floor andprevent widening of the earnings distribution (ibid., p. 60).
Once we have established a link between the welfare state and earningsdistribution, the question that remains is: To what extent do welfare state
Table 3.2 Trends in earnings dispersion, selected countries, 1985–95
D9/D5 D5/D1
1985 1995 1985 1995
Germany1 1.65 1.61 1.59 1.44
Netherlands2 1.62 1.66 1.55 1.56
Sweden1 1.59 1.59 1.30 1.30
United Kingdom 1.77 1.87 1.73 1.81
United States3 1.84 2.04 2.03 2.13
1Last year is 1993.2Last year is 1994.3Data refer to male earners.
Source: OECD (1996c), pp. 61–62.
127
Social protection and the economy

institutions inhibit the performance of the labour market? Table 3.3 shows thatin the Netherlands and Sweden unemployment is not more concentrated amonglow-skilled workers than in the United Kingdom and the United States. TheOECD had already affirmed that ‘‘there is little solid evidence to suggest thatcountries where low-paid work is less prevalent have achieved this at the cost ofhigher unemployment rates and lower employment rates for the morevulnerable groups in the labour market. . .’’ (1996c, p. 76).
An earlier observation (table 3.1) is that although long-term unemploymentis high in Germany, it is high in the United Kingdom as well. All this wouldsuggest ‘‘that factors other than relative wages, such as the overall level ofaggregate demand or the amount of training received, may be more importantfor determining labour market outcomes of [vulnerable] groups’’ (ibid, p. 94).Indeed, in educational attainment Germany, the Netherlands and Swedenperform rather well in comparison to the United Kingdom, and have establishedsophisticated vocational training systems that do not exist (or exist to a farlesser extent) in either the United Kingdom or the United States. Nonetheless,this does not rule out the possibility that a widening of the wage spread maywell be effective, particularly in Germany, as a policy measure to lower theshare of unemployed in the low-skilled segment. Franzmeyer et al. (1996, p. 24)mention this: ‘‘As the growing dispersion of wages does not result in a declineof overall unemployment in the United Kingdom and United States, because theoverall quality of their labour supply is too low, the strategy of fightingunemployment among low-skilled workers by reducing their [labour costs]might, in fact, work in countries with well-functioning systems of vocationaland company training’’. This provides some support for policies (asimplemented in the Netherlands in the late 1990s) that aim to lower non-wage labour costs and are targeted at the low-skilled end of the labour market.
For an adequate assessment of the performance of the labour market, wemust also consider whether a prevailing level of earnings inequality is efficientfrom a microeconomic point of view. We should look at whether the individuals
Table 3.3 Unemployment by educational attainment for persons aged 25–64,selected countries, 1990s
Total (%) Men Women
I II III I II III I II III
Germany 15.8 8.8 4.9 17.7 8.4 4.4 14.1 9.4 5.8
Netherlands 4.9 2.4 1.7 3.6 1.4 1.4 6.7 3.6 2.1
Sweden 9.0 6.5 3.9 8.5 6.7 4.7 9.7 6.3 3.1
United Kingdom 10.0 4.7 2.7 12.7 5.3 3.0 7.3 4.1 2.4
United States 7.7 3.7 2.1 7.0 3.9 2.1 8.8 3.6 2.1
Note: I is less than upper secondary education, II is upper secondary education, and III is tertiary education.
Source: OECD (2001b).
128
Financing social protection

in the bottom earnings deciles are mostly new entrants who will subsequentlyadvance into higher deciles or are part of a static pool caught in low-paid, poor-quality jobs, cycling in and out of unemployment (OECD, 1996c).
Table 3.4 provides some data on earnings mobility in Germany, Sweden, theUnited Kingdom and the United States. All four countries have a correlationcoefficient (measuring the persistence in individual earnings over a five-yearperiod) that ranges between 0.68 (United States) and 0.79 (Germany). Thismeans, for example, that roughly two-thirds of inequality observed in the UnitedStates in a single year is persistent. The table also shows the transitionprobabilities for moving upward (column 2). These probabilities indicate thelikelihood that a worker who was in the bottom quintile in 1986, for instance, wasstill in the bottom quintile five years later. To control for the effect of somecountries’ wider earnings dispersion (United Kingdom, United States) on thewidth of the quintiles (thus influencing the transition probabilities of moving upone quintile or more), the table also gives transition probabilities in ‘‘equal widthearnings bands’’ (column 3).15 In the United States, 49 per cent remained in thesame quintile; in Germany the figure was 53 per cent. Measured in earningsbands, the difference is slightly more pronounced but is still small. The biggestdifference between the two countries is the percentage of workers who moved uptwo earnings bands: 17 per cent in the United States and 7 per cent in Germany(not shown in the table). The OECD (1996c, p. 84, chart 3.6A) finds someevidence of a positive relationship between point-in-time earnings inequality and
Table 3.4 Earnings mobility, selected countries, 1986–91
Panel A: Five-year earnings mobility for full-time wage and salary workers
Correlation of 1986 and 1991earnings1
Stayed in the samequintile
Stayed in the same earningsband2
Germany 0.793 53.0 55.3
Sweden 0.711 52.7 61.6
United Kingdom 0.705 48.1 48.2
United States 0.680 48.8 47.8
Panel B: Five-year earnings mobility for low-paid workers who were employed full time in both 1986 and 1991
1991 earnings status of 1986 low-paidworkers
in bottom quintile Moved to 2nd–5th
quintilebelow 0.65 median moved above 0.65
median
Germany 45.1 54.9 26.0 74.0
Sweden 49.1 50.9 – –
United Kingdom 41.1 58.9 39.0 61.0
United States 52.2 47.8 55.8 44.2
1Pearson correlation coefficient.2The five earnings bands relative to the median are: less than 0.65; 0.65–0.95; 0.95–1.25; 1.25–1.55; and greaterthan 1.55.
Source: OECD (1996c), pp. 81, 95.
129
Social protection and the economy

mobility across median-proportion earnings bands. Individual earnings in facttend to be more volatile in the United States than in, for example, Germany.
The key issue, however, is whether this is also the case for low-paidworkers. Is there evidence of a trade-off between point-in-time inequality andlife-time inequality? Panel B in table 3.4 provides some insights. Theprobability of remaining in the bottom quintile is greater for American thanfor German workers. Moreover, the probability of moving up in terms ofmedian-proportion earnings bands is much higher in Germany than in theUnited States: only 26 per cent of German workers who were below 0.65 ofmedian earnings in 1986 were still in this range in 1991, whereas in the UnitedStates the figure was 56 per cent. More generally, the OECD concludes thatlow-paid workers have greater difficulty in moving up in labour markets inwhich cross-sectional inequality is higher.
With respect to both earnings differentials and earnings mobility for low-paid workers, the liberalized labour markets of the United Kingdom and theUnited States do not perform any better than the labour markets in Germany,the Netherlands and Sweden. The volatility of individual earnings is higher inthe English-speaking countries, as is overall earnings mobility. However, thekey issue in assessing microeconomic efficiency is the extent to which low-paidworkers benefit from it, and this appears to be less the case for United Kingdomand United States labour markets than for those in Germany and Sweden.
Sections 3.3.2 and 3.3.3 address some of the institutional fine print for thedifferent types of welfare states, namely the incentive structure that seems toinfluence largely the labour market behaviour of people in active age groups.
3.3.2 Institutional fine print: Tax/benefit systems and
low-paid labour
For people with low educational attainment or little or no work experience,starting wages are likely to be low. Employed people face work-relatedexpenses, such as transportation costs and work-related clothing, and will findthat their welfare benefits are reduced with the income they earn. Means testingfor benefits, income taxes and payroll taxes can work together to make paidemployment uneconomical for many of those on long-term unemploymentbenefits. The gap between net earnings from employment and net socialsecurity benefits can become very small. This problem will be most acute forfamilies with children, since they have the highest benefit entitlements. Thelower the expected wage that can be earned on the labour market, the morelikely individual breadwinners are to find themselves in the so-called‘‘unemployment trap’’.
Because households without the potential to obtain well-paid jobs are themost vulnerable to the unemployment trap, we will concentrate on householdsin the lower segments of the earnings distribution. We use the first-decile
130
Financing social protection

Box 3.3 Turning conventional wisdom upside down: Another view of
the interactive mechanics of the welfare state
There are other views concerning the mechanism by which the socialprotection system interacts with the economy. Cichon (1997b) and Sala-i-Martin (1994) argue that the extensive continental European welfarestates may also be explained by the requirements established by aneconomic policy that is (or was, at any rate) fundamentally different fromthe American model. The argument builds on the observation that thegrowth rate of American productivity per hour worked is lower than thatof most European countries (American productivity per worker is higherowing to the higher number of hours worked per year). Since the oil crisisof the early 1970s the European socio-economic model has beencharacterized by four essential elements: high productivity growth,relatively high wages, high and persistent unemployment, and relativelyhigh levels of social transfers.1
Cichon and Sala-i-Martin offer the following interpretation. TheEuropean model has relied on buying excess and unproductive labourout of the labour market by means of high social transfers, a proceedingthat has facilitated the achievement or maintenance of high productivitylevels.2 High productivity underpins the maintenance of high wage levels,and this in turn – not least because of international competition – triggersfurther productivity drives. High productivity levels per hour workedindicate a highly efficient employed labour force and permit a relativelylow average number of hours worked. Lower employment levels interms of total number of hours worked can be interpreted as a sign ofsuccess. But the number of hours worked is not equally distributed, andthe increasing concentration of work among workers with higherproductivity leads to the exclusion of large numbers of workers from thelabour market.
The ‘‘American model’’, on the other hand, has relied on low(er)productivity growth, low(er) wages, low unemployment and low transfers.Again there is little doubt that low levels and scarcity of income transfersincrease the level of employment. Benefit amounts below poverty levelswill force people into some form of employment, in particular into low-productivity jobs. This additional employment inevitably has an effecton GDP. Most of these jobs can be assumed to be service sector jobsand enter into GDP with the equivalent of their low gross wage.3
This, as Cichon argues, explains to some extent the difference betweenthe United States and the European Union in wage shares of GDP. It alsoexplains the relatively low growth of American productivity.
In Europe some 26 per cent of GDP is redistributed through socialprotection transfers financed by taxation and social security contribu-tions. The United States economy redistributes less through taxes andsocial security contributions, but the socio-economic system makes uppart of the difference by an indirect redistribution caused by lowproductivity which leads to employment higher than is theoreticallynecessary.
131
Social protection and the economy

earnings level (D1) as a proxy of low income. Because individuals’ labour-supply decisions are not independent of the household situation, we have takenthe household rather than the individual as the unit of analysis. Households aredefined here as two married adults and two children,16 and we do not takeaccount of any incentives other than financial ones.
This means, according to Cichon, that about 40 per cent of the totalsocial redistribution system in the United States consists of theredistribution of income through jobs, while the high-income Europeaneconomies rely almost exclusively on the direct redistribution of income.Despite virtually equal or even higher levels of overall redistribution, theUnited States system remains less successful in eradicating poverty – butin the United States the pre-transfer poor tend to work, whereas in Europethey tend to be unemployed.
In the present debate on the affordability of the welfare state, theUnited States socio-economic model seems to be regarded as eco-nomically and financially sustainable – however loosely this term isdefined. The overall levels of redistribution in the European Union and theUnited States, respectively, seem to be in the same order of magnitude;non-employer households receive slightly less disposable income inEurope, but they also have to work considerably less. Poverty in theUnited States remains higher than in Europe. On balance, it seems thatEuropeans would not be markedly better off in strict income terms if theymoved to an American-style redistribution system. Accordingly, judgedby our strict definition of economic affordability, the present welfarestates in the European Union appear (on average) to be as economicallyaffordable as the United States system. If the American socio-economicmodel and the social protection system it comprises are economicallyaffordable, then the same applies to the European model.
Notes
1
Through publicly financed social protection benefits.2
This interpretation in effect reverses the classical argument that high unemployment benefits
(and other social protection benefits like early-retirement pensions) induce increased
permanent or temporary withdrawals from the labour market. It argues that benefits have
to be high to permit the buying out of excess labour from the labour market. Both directions
of this ‘‘chicken and egg’’ problem are compatible with the (albeit shaky) econometric
evidence which correlates the duration of benefits utilization with the level of benefits (as
cited, for example, in Gillion (1996). Econometric equations mathematically only determine
the degree of simultaneity of two or more phenomena; they can never establish a causal
link. It is economic theory that establishes the link and interprets statistical evidence as
support for theory.3
That is, their wages enter into both sides of the GDP accounts: compensation of employees on
the cost side and private final-consumption expenditure on the expenditure side (cf. United
Nations, 1968).
Box 3.3 (cont’d)
132
Financing social protection

The question addressed here is the following: How does the receipt ofincome-tested benefits affect a household’s work incentives? The issue is that ofworking while on benefits. If a person’s earned income is clawed back throughincome-dependent family benefit entitlements, work may not be financiallyrewarding. Ultimately, income-tested benefits create an unemployment trap forlow-income families.
The problem is illustrated in figure 3.4. Each country’s left bar shows thenet income that would result from receiving social assistance benefits relativeto first-decile net income, and the right bar the after-tax income of averagewage earnings, for both single earners and two-parent families with twochildren. For example, a family living on social assistance in Canada would
Figure 3.4 Net social assistance and net average earnings relative to net low
wage, selected countries, 1995
Source: Doudeijns et al., 2000 (orig. OECD Tax/Benefit Database).
133
Social protection and the economy

have just over 60 per cent of the net income of a similar family with earnings atthe D1 level.17 A Canadian family with earnings at the average wage levelwould have some 130 per cent of the net D1-level earnings of a similar family.
Longer bars indicate a wider after-tax distribution than shorter bars. Theafter-tax distribution for single earners in the English-speaking countries ismuch wider than in continental Europe. However, this pattern is much lesspronounced in the after-tax earnings distribution for families. The after-taxaverage wage earnings for a couple with two children in the United States areonly 31 per cent higher than the after-tax earnings at the D1 level, while thefigure is 37 per cent for a couple with two children in the Netherlands.
For most continental European countries (and Ireland and the UnitedKingdom as well), the lightly shaded bars in the left-hand panel indicate highsocial assistance payment levels. Most of the English-speaking countries havebenefits that are specifically targeted at people in low-paid jobs. Supplementingwork income with supplementary benefits increases the gap between benefitincome and in-work income, thus improving work incentives.
The Earned Income Tax Credit (EITC) in the United States is a case inpoint. For a couple with two children, social assistance is 63 per cent ofearnings at the D1 earnings level (after tax and including the EITC). Withoutthe EITC, the level of social assistance would be 97 per cent of the after-taxearnings at the D1 level. The difference widens because EITC benefits are alsopaid to the working poor. At the same time, the EITC increases the level of netD1 earnings relative to net average wage earnings. Similar effects are found inother countries with employment-conditional benefits. Thus, employment-conditional benefits increase the financial incentives to start a low-paying job,but reduce the financial incentives to move up the earnings ladder.
Figure 3.5 looks at the issue of incentives to start a low-paying job fromanother angle. It illustrates what happens to household income when the non-active partner accepts work and receives a wage at the D1 earnings level. Thefigure is divided into two panels, each illustrating financial work incentives forthe non-active household-member. The bars indicate the net retained income(NRI). The NRI is defined as the percentage of (additional) gross earnings thatis not forfeited to income tests, tax liabilities or payroll taxes. A high NRI thusindicates a high reward for work, while a low NRI indicates strong financialdisincentives to work.18
Panel A shows the income gain for a couple with two children wherePartner 1 has been unemployed for a long time (and the household accordinglyreceives assistance benefits), and Partner 2 begins to work, earning at the D1level. The income test for the assistance benefits creates severe disincentives towork. In Sweden, for example, the income test for social assistance (SA) appliesto 100 per cent of earned income without exceptions. Consequently, socialassistance is reduced by 100 per cent of additional earned income. In theNetherlands, too, social assistance entitlements are reduced by 100 per cent ofadditional earned income. Because D1 income is higher than the social
134
Financing social protection

assistance level for the family type assumed here, the NRI is positive. In anumber of countries there are no financial incentives to work unless the totalearned income exceeds the assistance benefit amounts (in the Netherlands, forexample, this means that working part time will not be financially rewarding).In Germany, the claw-back rate is less than 100 per cent, and therefore some50 per cent of gross D1 earnings can be retained.
In the United States, the EITC partly offsets the income test for food stampsand family benefits, and gives one or both partners in a long-term unemployedcouple a strong incentive to work. In the United Kingdom, Family Credit(replaced in 1999 by the Working Families’ Tax Credit) offsets the drop in netincome caused by the withdrawal of Income Support when the combined workeffort of the household is more than two days per week. A supplement providesan extra boost if either partner works 30 hours or more. If individual benefits arepaid, as is generally the case in Australia, each household member’s incentiveto work is determined by his or her own individual entitlements. Disincentiveeffects do not spill over from the beneficiary to the other household members,contrary to cases where income-testing procedures are based on householdincome.
Panel B shows the income gain for a previously one-earner couple wherePartner 1 is employed full time with earnings at the D1 level and Partner 2starts to work full time at the D1 earnings level. In this situation, the lowincome level – since the household’s earned income is at the D1 level – maymean that the family receives income-tested benefits. The reduction of benefit
Figure 3.5 Net retained income for a couple with two children, selected
countries, 1995
Source: OECD Database on Benefit Systems and Work Incentives.
135
Social protection and the economy

entitlements associated with earned income is deleterious to work incentives.This is particularly true in the English-speaking countries. In the United States,for example, a family with earnings at the D1 level is entitled to the EITC. Theincome test for this benefit results in relatively low NRIs (although stillcomparable with those in the continental European countries) if the non-activepartner starts working.
Box 3.4 describes empirical evidence of the impact of the EITC in theUnited States on household labour supply (both participation and number ofhours worked).
Box 3.4 Effect of the EITC on labour participation in the United States
The Earned Income Tax Credit (EITC) lowers the average tax rate on lowearnings. For families with children, the EITC is phased in from zeroearnings to $9,930, where for each dollar of earned income an additional40 cents is credited. In the range between $9,931 and $12,260, the credit is$3,756. From $12,261 up to $30,095 the phase-out range applies—that is,for each dollar earned, 21.06 cents of the tax-credit is clawed back. Boxfigure 3.4.1 illustrates this.
For those who were outside the labour force when the EITC wasintroduced or expanded, a positive participation effect could be expected.For those who were already working, two effects could be expected. Theincome effect (due to the reduced average tax rate) would cause areduction in the number of hours worked. The substitution effectdepended on whether the individual’s earnings were in the phase-inrange, the flat range, or the phase-out range of the EITC, or simply not
Box figure 3.4.1 Earned Income Tax Credit (EITC)
Source: ILO.
136
Financing social protection

A well-known dilemma of social policy is the fact that attempts toovercome the unemployment trap inevitably lead to a poverty trap. In-workbenefits are needed to create sufficient incentives to accept even a low-payingjob. However, as long as the family is receiving means-tested in-work benefits,every earnings increase beyond certain thresholds results in a reduction of thein-work benefit, thereby limiting the increase in net family income.
within the range of the EITC at all. In the phase-in range, for example,the marginal tax rate is reduced, which creates an incentive to work morehours (since the net wage rate per hour is higher); whereas in the phase-out range, the opposite is true.
Moreover, the income of other household members is relevant inaddition to the earnings of the individual worker. The table shows theeffects according to the empirical literature. The observed effects onlabour supply (participation and hours worked) differ for various groups,depending on income and wage elasticities.
The overall effect estimates the total labour-supply effect for aparticular group (such as single parents), taking into account the numbersof individuals from this group in the different earnings ranges. When alarge proportion of single parents have small part-time jobs and are likelyto be in the phase-in range of the EITC, the ‘‘plus’’ in that range has a largeimpact on the total effect. In the case of single parents, the total effect is anincrease in the number of hours worked.
Box table 3.4.1 Effects of the EITC on participation and number ofhours worked
Overall1 Inactive Working
phase-in flat phase-out outside EITC
Singles2
Participation
Hours – –
Single parents
Participation ++ ++
Hours + + +/� – –
‘‘Breadwinners’’
Participation + +
Hours nil nil nil nil nil
Spouses
Participation + +
Hours � + – – –
1 The composition is taken into account: many single mothers, for example, are unemployed or work in smallpart-time jobs; hence, the + in the ‘‘phase-in range’’ weighs more heavily in the result.
2 Singles are eligible for a much smaller tax credit; empirical data for this group are not available.
Box 3.4 (cont’d)
137
Social protection and the economy

Figure 3.6 plots net income as a function of gross earnings for theNetherlands, the United Kingdom and the United States. The figure applies to amarried couple with two children receiving long-term benefits. Net income isexpressed as a percentage of the net income at the first-decile earnings level.Gross earnings are rescaled for all three countries as a percentage of the grossfirst-decile earnings level. At earnings level 0, at the far left of the X-axis, thecouple receives long-term social assistance benefits. The graphs for eachcountry indicate the net income the couple would have if it earned a certainpercentage of the gross first-decile earnings level. Thus, the figure illustrateshow quickly net income increases with a rise in gross earnings for long-termbeneficiaries in the countries considered.
Long-term beneficiaries in the United States have a much lower net incomethan those in the Netherlands and the United Kingdom. The Dutch socialsecurity scheme provides relatively generous unemployment benefits. The flatline for the country indicates that long-term beneficiaries who start to work willnot be able to increase their net household income until their earnings begin toexceed the first-decile level. The untapered means test for social assistanceeliminates any incentive to work for earnings that, after tax, are hardly morethan the social assistance payment rates. The graph also shows that long-termbeneficiaries in the United States see their net income increase from the firstfew hours they start to work. The graph shows a much steeper line for theNetherlands – 100–200 per cent of gross D1 earnings – than for the UnitedKingdom and the United States. Means-tested benefits are no longer paid
Figure 3.6 Trade-off between the incentive to accept a low-paid job and
the incentive to move from part-time to full-time work, selected
countries, 1997
Source: OECD Tax/Benefit Database.
138
Financing social protection

(although housing benefits may, under certain circumstances, still be paid atthese earnings levels), and this means that NRI rates are high. For the UnitedStates, the figure shows only slight net income improvement going up the grossincome ladder. This reflects the EITC phase-out range.
The figure reveals some of the important trade-offs inherent in makingchoices between financial work incentives and avoiding poverty. The Dutchcase shows that high social assistance benefits require a beneficiary to find afull-time job if he or she is to enjoy financial gains from working. After takingup such a job, any additional work effort will generate reasonable increases innet income. The United States case shows that taking up work – if only for afew hours a week – will result in a substantial income gain. The drawback islimited incentive to move up the income ladder because of the high marginaleffective tax rates.
3.3.3 Institutional fine print: Retirement schemes and
other exits from the labour force
In this section we will examine the 55–65 age group. The labour marketparticipation of older males in particular has fallen sharply during the past twodecades, albeit more in continental Europe than in the Scandinavian andEnglish-speaking countries. Pension schemes (early-retirement schemes) anddisability and unemployment insurance schemes are considered to be animportant cause of this drop (Gruber and Wise, 1997; Blondal and Scarpetta,1998). Blondal and Scarpetta (1998) find that institutional factors have exerteda major influence in this respect – apart from such other causes as labour marketslack and the influx of large numbers of young jobseekers.
Gruber and Wise (1997) mention two elements that particularly influencethe (early) retirement decision: the earliest age at which retirement is possible,and the accrual rate. The accrual rate adds value to the pension a person earnsduring his or her career. When the accrued pension (in terms of the replacementrate) no longer increases after a certain age, and when the worker, on top ofthat, is eligible for some benefit that replaces earnings (be it from a pensionscheme or some other social security arrangement), then the net accrual rate isnegative. The accumulated pension wealth (the annual benefit amount times thenumber of years longevity) diminishes de facto each year that the individualcontinues working and receives no benefit. In most countries the accrual rate forolder workers tends to be negative, so the incentive to retire earlier than theofficial retirement age is high. The implicit tax rate levied on work after age 55has increased over the past decades owing to the expansion of pension systems.Moreover, since 1972 the introduction of early-retirement schemes and thegreater take-up of unemployment benefits and disability schemes as alternativeexit routes have increased the incentives to retire early.
139
Social protection and the economy

In the Netherlands, early-retirement schemes for workers (VUT) haveplayed an important part in this respect; disability insurance and unemploymentinsurance have also been used widely (Kapteyn and de Vos, 1997; Lindeboom,1998). In the unemployment scheme, workers older than 571⁄2 are no longerrequired to apply for work. Germany allows workers who have worked for atleast 35 years to retire at age 63 (women can retire at 60), and disabled men areeligible for pensions at age 60.
In the United States the option to retire at age 62 has existed since 1961.However, contrary to practice in many continental European countries, in theAmerican scheme the benefit is calculated on an actuarial basis. Moreover,replacement rates are rather modest, and the pension benefit is calculated fromthe ‘‘best’’ 35 years of earnings – that is, the years with the highest earnings,which tend to be the years at the end of one’s career. Continuing to workenables people to substitute years in which a high wage is earned for early yearsemployed at a low wage.
Empirical studies illustrate that ‘‘hazard rates’’ are high exactly at thoseages when workers are eligible for (retirement) benefit schemes (Gruber andWise, 1997). In the Netherlands, the first exit peak comes at the age whenunemployment insurance stops requiring an active job search (ages 57–58).A subsequent peak occurs at age 60, when workers become eligible for earlyretirement. Kapteyn and de Vos (1997) have calculated an implicit tax ratefor the Netherlands of 141 per cent at the early retirement (VUT) age. Thefinal peak in the Netherlands is at the normal pensionable age (65 years).In Germany a fairly similar pattern exists (there the peaks occur at age 60, 63and 65).19
In Sweden and in the United States the age-related employment profilediminishes much more gradually despite the fact that occupational schemes arecommon (such as the 401[k] plans, in which employees have the option ofreceiving a lump sum at age 591⁄2 ). In addition, in more than three-quarters ofthe defined-benefit occupational schemes in the United States eligibility starts atage 55, whereas other schemes set the eligibility age at 62. Gruber and Wise(1997) explain this gradual exit pattern for the United States by pointing to theactuarial calculation of pension benefits (the implicit tax on continuing to workis substantially less because the benefit replacement rate increases by 8.3 percent for each additional year worked between age 62 and 65), and to the optionfor many Americans to continue working on a part-time basis, facilitated by atapered earnings test.20 The most important factor, however, may be thecollective health insurance for elderly people in the United States: Medicare.Medicare insurance starts at age 65. Accordingly, there is an incentive to keepworking (at least part time) until age 65, since in that case the collectiveemployer’s insurance coverage still applies.21
Blondal and Scarpetta (1998) signal an additional link between patternsof early retirement and industrial relations. The continental Europeancountries have collective bargaining at the sector level, and it is in these
140
Financing social protection

countries that the employment rate among older workers has diminished themost (ibid., pp. 38–39). Other studies demonstrate that employers andemployees (in the Netherlands, for example) have made intensive use of theexisting schemes as exit routes for older workers (Aarts and de Jong, 1992;Hartog, 1999).
Blondal and Scarpetta conclude that modifications in the institutionalparameters will cause the labour supply of the elderly to increase significantly.In particular, the accrual rate and the cross-relationship with other socialsecurity schemes are important elements.
3.3.4 Total social expenditure revisited: Input or
outcome measure
As we saw in Chapter 2, social expenditure of different countries is oftencompared on the basis of the gross public social expenditure ratio (SER). Thegap between the Nordic countries at one end and countries like Australia,Canada and the United States at the other will, under these circumstances,appear large. However, as we pointed out, gross public expenditure is far frombeing a perfect measure of the real level of social security or social protection.Table 3.5 indicates some reasons for this.
First, there are differences in the countries’ tax treatment of incometransfers. The Nordic countries and the Netherlands ‘‘claw back’’ a considerablepart of gross spending through taxation. In these countries, the socialredistribution of resources is lower than suggested by gross spending indicators.Adema (2001) calculates that in Denmark and the Netherlands around 25 percent of the gross public social cash benefits is clawed back by the exchequer,and in Sweden the figure is a little over 22 per cent. In comparison, in Australia,United Kingdom and United States it is less than 5 per cent.
Table 3.5 Gross and net public social expenditure (as % of GDP), selectedcountries, 1997
Australia Canada Denmark Germany Finland Netherlands Sweden UnitedKingdom
UnitedStates
Gross publicsocialexpenditure (1)
18.7 20.7 35.9 29.2 33.3 27.1 35.7 23.8 15.8
Taxes andsocialcontributions (2)
0.8 2.0 9.2 2.0 8.5 6.8 7.2 2.2 �0.6
Net publicexpenditure(3 ¼ 1�2)
17.9 18.7 26.7 27.2 24.8 20.3 28.5 21.6 16.4
Source: Adema (2001).
141
Social protection and the economy

In some countries an indirect form of tax-financed benefits is provided: taxbreaks for social reasons. The United States EITC is an example of a tax breakprovided to low-earning households.22 Tax breaks for social reasons may alsobe offered to employers – for instance, when they hire low-skilled workers –and to private funds, an example being the favourable tax treatment enjoyed bythe capital income of private pension funds.
Second, as seen in Chapter 1, social transfers are not limited to the publicdomain. Figure 3.7 maps out public and formal private institutional transfers(i.e. transfers through private sector institutions but not informal transfers).Formal private transfers play a major role (one that is increasing in severalcountries) in providing close substitutes for public social protectionexpenditure. To assess the real amount of resources used in social transfers,both net public and net private social provisions should be taken into account.
The difference between the countries in terms of net total social spending isfar less pronounced than the gross public figures suggest. These figures supportthe theory that, to a certain extent, formal private and formal public expenditureare substitutes for each other.
Finally, there is a difference also in the way that social security is provided.From Adema’s work (1999, 2001) we know, for example, that the differencebetween the Nordic countries and liberal market economies such as the UnitedKingdom lies not in the amount spent on cash benefits but in the expenditure onservices, such as training and job-mediation services and public child care.Some of these services might have a much bigger effect on labour forceparticipation rates and therefore have a greater potential for growth than others.
In sum, it appears that it is not the volume of expenditure but rather the wayin which money is allocated between different benefits and the design of those
Figure 3.7 Total net social expenditure (as % of GDP), selected countries, 1997
Source: Adema (2001), pp. 27–28.
142
Financing social protection

benefits that determine the welfare state’s effect on the economy and thewell-being of the population. Generally, the fact that a great deal is spenton social protection is no guarantee of success as measured by key per-formance indicators. Expenditure amounts are primarily input indicators andhave very little predictive power as to the social or economic effects of thewelfare state.
3.3.5 Welfare outcomes of different types of welfare states
In the preceding sections we saw that, depending on the type and philosophy ofthe welfare state, there are many ways of delivering its main outcome (namely,effective social protection). In this section we will address the issue of whetherthe outcomes of these different processes are comparable or not. In other words,we will assess the efficacy of the welfare state using two indicators: the extentto which income redistribution schemes help to reduce poverty and inequalityin general (thus returning to the main performance indicators developed inChapter 1), and the adequacy of the welfare state’s main benefit (i.e. pensionprovision for the elderly).
3.3.5.1 Income transfers and the dynamics of poverty
In section 3.3.1 we noted that earnings inequality rose throughout the 1980s andearly 1990s in several countries, while remaining fairly stable in a few others.Turning from earnings inequality to household income inequality, two factorsare relevant: the first is the employment effect on the distribution of earnings;the second is the effect of income redistribution programmes.
Since the net labour participation rate is relatively low in the Netherlands,for example, the difference between the United States and the Netherlands inthe distribution of household income from employment will reflect both a wageeffect and an employment effect. To assess the impact of labour market reformson labour income inequality – and to ensure that income redistributive policiesmeet certain targets – the relative importance of the two effects should beexamined. Taking the employment record of the United States as an example,the OECD has concluded that the employment effect may be considerable.
The distribution of earnings in working-age households is less equal in theNetherlands than in the United States (OECD 1996d, pp. 40–41). We are nothere to judge whether an earnings distribution is equitable. However, precedingsections suggest that the United States earnings distribution is not efficient fromthe point of view of low-paid workers. The share of low-skilled unemployed islarge, and there appears to be substantial shuttling in and out of low labourincome. Most episodes of poverty are found to be short and associated withpassing setbacks for individuals whose income is adequate over the longer term.However, certain groups are at great risk for more prolonged poverty (OECD,2001b; SCP, 2000). The risk is particularly high for households in which the
143
Social protection and the economy

head is female, young, a single parent, or a secondary-school dropout, as well ashouseholds with no adult employed. Children are also more likely to be livingin poverty (OECD, 2001b; ILO, 2000a).
The OECD (2001b) finds that transitions in and out of poverty tend tocoincide with job-related changes more than with changes in the householdstructure. Table 3.6 gives some figures on relative poverty risks for severaleconomic groups and household categories.
The differences in the inactive groups show clearly that the welfare statesin continental Europe are much more successful in containing poverty amongthe inactive groups than the English-speaking residual welfare-state models.The difference in poverty rates for the employed is less pronounced, althoughthe United States is distinctive for a poverty rate among employed persons thatis higher than the overall national rates in the classic European welfare states.
The second factor affecting the difference between earnings inequalityand household income inequality is the welfare-state income redistributionprogrammes. In European Union countries, poverty transitions are related tochanges in public income transfers; this is not the case in the United States.More extensive welfare states direct a higher share of social spending tolow-income households. This reduces point-in-time poverty rates, but, perhapseven more important, it also contributes to reduce the persistence of poverty(OECD, 2001b). The OECD finds that, in general, countries with higher point-in-time poverty rates are also characterized by greater poverty persistence. Itconcludes therefore that a longer-run view tends to accentuate, rather thandiminish, cross-sectional differences in poverty between countries. Table 3.7illustrates this.
Table 3.8 provides some figures on the contribution of social security tothe decline in poverty (poverty being defined as a household income below
Table 3.6 Poverty rates, socio-economic status and household situation,selected countries, 1990s
Australia(1989)
UnitedKingdom(1995)
UnitedStates(1994)
Germany(1994)
Netherlands(1996)
Denmark(1992)
Sweden(1992)
Average for all groups 20 27 24 12 8 7 13
Socio-economic status
Employed 5 7 15 7 4 4 8
Inactive non-retired 69 78 72 33 31 18 19
Retired 41 33 28 8 3 5 21
Household situation
single, age530 14 22 28 28 13 29 33
single, 305age564 27 28 23 15 5 5 5
single parent, age564 44 68 50 47 41 12 10
Source: SCP (2000), calculated from LIS data.
144
Financing social protection

50 per cent of median income). The number of pre-transfer poor households isleast reduced in the United States, followed by Australia. The classic Europeanwelfare states, namely Denmark, Germany, the Netherlands and Sweden, aremuch more successful. United Kingdom’s performance is somewhere in themiddle, although its Gini coefficient of disposable income is worse than that ofany other country in the table. Both market income and disposable income aremost equal in the Netherlands.
3.3.5.2 Adequacy of pensions
The second important indicator for measuring the efficiency of the welfare stateis the adequacy of income after retirement. To assess this we need to lookfurther than merely the coverage of public pension schemes. As we saw earlier,countries may substantially facilitate private pension plans, and the elderlydraw on other sources of income besides public pensions. In this respect theimage of a three-legged stool has been used, with the public pension and thesupplementary private pension serving as two legs, and income from savingsas the third leg.23 Occasionally a ‘‘fourth leg’’ is posited – labour income.
Occupational pensions do not represent a major component of the totalincome of the current generation in retirement in the English-speakingcountries. In these countries income derived from assets (financial assets and
Table 3.7 Short-term and long-term poverty (%), selected countries,mid-1990s
Denmark Germany Netherlands United Kingdom United States
Annual poverty rate 4.7 12.1 7.8 12.1 16.0
Poor at least once 9.1 19.2 12.9 19.5 23.5
Always poor 0.8 4.3 1.6 2.4 9.5
Permanent income poverty 1.8 8.1 4.5 6.5 14.5
Source: OECD (2001b), calculated from household panel data.
Table 3.8 Income redistribution, selected countries, 1990s
Australia(1989)
UnitedKingdom(1995)
UnitedStates(1994)
Germany(1994)
Netherlands(1996)
Denmark(1992)
Sweden(1992)
Gini coefficient
market income 0.490 0.595 0.528 0.550 0.484 0.546 0.550
disposable income 0.347 0.379 0.382 0.319 0.295 0.328 0.320
Inequality reduction (%) 29 36 28 42 39 40 42
Source: SCP (2000), calculated from LIS data.
145
Social protection and the economy

home ownership) constitutes a significant component, as demonstrated byfigure 3.8. The figure shows the composition of income (before taxation) ofcouples in which the household head is aged about 67. For each of thecountries, the bottom, middle, and top quintiles are indicated. The four incomecomponents (starting from the bottom) are: public pension, supplementary occu-pational pension, individual savings (for example, annuities and imputedhousing rent income), and labour income.
The institutional characteristics of the pension systems are reflected infigure 3.8. France, Germany and Sweden have substantial public programmesproviding earnings-related pension benefits. The size of the bottom part of thebar (the public component) increases with the height of the total bar. TheAustralian means and asset tests, in contrast, translate into a relatively minorpublic component in the top quintile. And in the Netherlands, the basic pension(AOW) constitutes a uniform ‘‘floor’’ in total retirement income. In France andthe Netherlands, and to a lesser extent in Sweden, the United Kingdom andthe United States, the occupational pension represents a significant tier, albeitfar less so for the bottom income groups. The English-speaking countrieshave a comparatively large third tier. This individual assets tier is primarilyconcentrated at the top of the income distribution.
In countries with a less comprehensive public tier the elderly tend tocompensate with alternative sources of income. At the same time, however, itis evident that this tactic is much more difficult for the lower-income groups.
Figure 3.8 Composition of gross income of couples in retirement and the
income tiers, selected countries, mid-1990s
Notes: The household head is about 67; the average income of the cohort aged 67 is 1,0; the columnsrepresent the average income of each quintile; figures 1993–95 for most countries and 1990 for theNetherlands.
Source: Calculated from OECD (1999b) data.
146
Financing social protection

This explains why elderly income distribution is more widely spread inEnglish-speaking countries than in Germany and Sweden, for example – thecountries in which the share of public transfers in total retirement income ishighest. Figure 3.9 demonstrates this.
In Australia and the Netherlands, too, the income spread is relativelymodest. In these two countries this is a function in particular of the publicpension tier. In Australia the public pension is means-tested (an asset test isapplied as well), and in the Netherlands the public tier gives a flat-rate pensionbenefit. Moreover, in both countries the income derived from asset ownership isless concentrated at the top than, for instance, in the United Kingdom and theUnited States. The World Bank (1994, Chapter 4) has argued that public pensionsystems tend to be regressive in their redistribution effect. This, however, is notwhat is indicated by the OECD data in figures 3.8 and 3.9. Private pensionsare concentrated in the top income groups, and it appears likely that privatepension coverage offsets the inequality reducing impact of public pensions.
What the graphs show is that the public pension schemes apparently allachieve a basic floor of income security for all ages, albeit at substantiallydifferent levels. On the whole, the increasingly fashionable argument that publicpension systems and their impact on poverty and income replacement cannot beexamined in isolation is factually questionable. The argument goes as follows:What counts in the end is overall retirement income. Retirement income iscomposed of various different sources of income. Accordingly, we must takeother common income-generating mechanisms for the elderly into accountwhen assessing the adequacy of public pension provisions. Figure 3.8 showsthat in all types of welfare states any sizeable complement to public pensionincome from other sources is largely a privilege of the rich – at least thus far.
Figure 3.9 Income distribution of older couples, selected countries, mid-1990s
Notes: The household head is about 67; figures 1993–95 for most countries, and 1990 for theNetherlands.
Source: OECD (1999b).
147
Social protection and the economy

3.3.6 Putting theory and evidence together:
The puzzle remains
We may conclude from the above that the different social protection systems aremore or less doing their job in terms of social protection outcomes. But they do itwith different levels of resources. The more money spent, the better the outcomes.Yet that does not mean that all monies are spent efficiently. We saw in Chapter 2that a wide range of expenditure levels can coincide with the same level of GDP.We also saw that the interaction of some of the non-transfer elements of theclassic welfare states with the transfer provisions has an impact on welfareoutcomes. And we saw that the concrete incentive mechanisms have a majorimpact on microeconomic behaviour and thus probably macroeconomic growth.
We have seen thus far that some of the theoretical economic arguments arenot supported by evidence. Conversely, some of the evidence and the workingsof the obvious linking mechanisms are not well explained by the prevailingtheories. Atkinson, for example, claims that much of the aggregate empiricalliterature on the issue of welfare-state arrangements and economic growth ismerely ‘‘measurement without theory’’, and challenges economists to set outtheir theoretical framework more explicitly.24
The core problems are the following:
(i) Causality may run counter to conventional economic wisdom
In the interaction between the economy and the welfare state, notably withregard to aspects determined by the size of the welfare state, cause and effectare difficult to disentangle. As we saw in Chapter 2, causality may well runfrom economic performance towards the level of welfare spending. In the 1960sone of the widely accepted explanations for bigger welfare states wasprosperity. More prosperous countries could afford to spend more on socialprotection. The income elasticity of the demand for social expenditure wasconceived to be greater than 1. However, another explanation for this directionof causality could be that sluggish growth leads to higher unemployment andhence to more income transfers.
(ii) The set of measures used to map evidence has clear limitations
We have seen that the SER has limitations as a means of describing theactual level of social protection. The amount of welfare expenditure dependsboth on the average replacement rate and on the total benefit dependency ratio;two countries may have a similar share of social expenditure in GDP – one ofthem having a relatively older population and the other more generous socialprotection schemes.
The SER also has limited explanatory power when used as an independentvariable or dependent variable in econometric analyses. Rather than interpretinga low GDP level combined with high social expenditure as evidence of
148
Financing social protection

causality between high social spending and poor economic performance, wecould conclude that an increase in welfare expenditure might be merely atemporary phenomenon lasting until GDP has reached its new equilibriumlevel. High social spending seen as a variable dependent on low economicperformance could also be interpreted as simply a transitory phenomenon.
Moreover, in many cases the SER does not even measure social expenditurecorrectly. Taxes and tax breaks for social purposes, for example, are crucial inthis respect as well. Most studies do not take into account the fact that countriesdiffer in their taxation of transfer income. The factor of tax income forgone as aresult of socially motivated tax breaks is often neglected.
(iii) Indirect economic costs are often ignored
It is important, Atkinson argues, to treat the direct financial impact of theinterrelationship between the size of the welfare state and the economyseparately from the economic effects. Social transfer schemes may haverelatively few budgetary effects but their economic effects, when measured indifferential growth rates, may be substantial. Similarly, opportunity costs inbudgetary terms are often neglected – that is, analysts rarely ask themselveswhat alternative use could be made of the resources that are channelled into thesocial transfer system.
(iv) The fine print in the design of transfers and theirincentive effects does matter
Straightforward neoclassical models trying to trace the economic impactof the welfare state often do not distinguish between the actual types oftransfers. Apart from employment and unemployment, several other labourmarket states can be distinguished. People who are not employed or enrolledin an unemployment benefit scheme may be attending school full time or beengaged in some kind of training programme; they may be enrolled in asickness, disability or early-retirement scheme; or they may be out of thelabour force without receiving financial compensation at all (Atkinson andMicklewright, 1991).
Standard economic models tend to assume a rather narrow (one-dimensional) kind of transfer scheme. However, social assistance does notapply the same set of conditions that unemployment insurance (UI) does. Andthere are differences in social security coverage between regular employmentand marginal or ‘‘atypical’’ employment. These institutional differences affectbehaviour. UI can in fact provide an incentive to take a job, since this wouldallow the applicant to meet the eligibility requirements (ibid.). Caps inentitlement duration may lead to increases in hazard rates (Katz and Meyer,1990; Layard et al., 1991). UI can ease the adaptation of labour demandto seasonal fluctuations by a layoff-recall practice such as that used in the
149
Social protection and the economy

United States (Feldstein, 1976). Means testing, applied in social assistance,may lead to significant unemployment traps due to the high marginal effectivetax rates, not least affecting the partner of the household head (Doudeijns et al.,2000). More generally, advocates of residual social protection programmestend to overlook the fact that social insurance schemes link entitlements tocontribution records.
Returning to taxation, assessment of the tax base on an individual basisgives rise to different incentive effects from taxation of joint household income(Lindbeck, 1997, p. 1300). Another example pertaining to tax design has beenforwarded by Pissarides (1998), who finds the following. First, the impact of atax cut on labour supply depends on the structure of the wage tax; raising thefloor below which income is exempt from taxation and the marginal tax rate atthe same time, thus continuing to generate the same amount of revenue, canlead to a reduction in unemployment, depending on the model used. Second, theeffect of a tax cut on unemployment is far less when benefit levels are adjustedaccording to net wage increases instead of price increases.
It is probably fair to conclude that economic theory and evidence alone donot give us a clear-cut answer as to the net effect of the different kinds of welfarestates on economic performance and hence on the welfare of the population.That may seem discouraging. However, what we have learnt confirms earlierfindings that social protection measures can indeed achieve positive socialoutcomes and do not strangle economic development. That is encouraging. Wenow move on to other important aspects of the welfare state debate.
3.4 ECONOMIC INSTRUMENTS IN THE GOVERNANCE OF
SOCIAL TRANSFERS
In the first chapters of this book we learned that countries can afford quitesizeable welfare states and thereby achieve positive social outcomes. Even thenit is not always certain that a particular mix of social and economic policies willensure the best possible outcomes in matters of social protection. However,what society cannot afford under any circumstances is waste, and waste is oftenassociated with the delivery of social protection through public schemes. Thequestion is whether schemes and systems can be designed in such a way thatwaste is minimized by using the right economic incentives for institutions andindividuals in the public and possibly private transfer delivery systems.
Governments do not have to administer the schemes themselves. They cancommission the actual delivery out to other public or private entities, as inFrance and the Netherlands, for example, where employers and workers takeresponsibility for the provision of occupational pensions. Another option is forthe government to set a number of basic conditions (pertaining to eligibility,contribution rates, and so on) and use market mechanisms to deliver serviceswithin that regulatory framework.
150
Financing social protection

The literature on the market mechanisms as a means of providing socialprotection mirrors the welfare state debate. In the 1960s and 1970s, the decadesof welfare state expansion, the issue of market failure was central in theacademic discussion. With the emergence of supply-side economics at the endof the 1970s, the concept of government failure became an issue. Publicadministrations appeared at times to be pursuing objectives that did notnecessarily coincide with the public interest. This fully matched the view thatthe welfare state was in need of downsizing. Towards the end of the 1980s, andeven more so during the 1990s, the main issue became how the marketmechanism could be used to improve the provision of goods and services incontexts where public objectives were still relevant. It was realized that marketand government failures appeared to stem from the same set of deficiencies, inparticular incomplete information.
This section sets out to explore economic mechanisms for efficientgovernance in the public sector. Section 3.4.1 provides the background ineconomic theory that can be used to develop a logical framework for theefficient delivery of social transfers, while section 3.4.2 discusses a range ofalternatives for the provision of social transfers, from direct governmentprovision to regulated markets for public goods and services.
The following pages thus present an economic framework for the design ofan efficient governance system through the setting of the right incentives for thevarious actors in transfer delivery. Whether transfers are then actually deliveredin an effective and efficient way has to be ascertained and constantly monitoredby performance indicators (this is discussed in Chapter 7).
3.4.1 Theoretical background
Two theoretical strands are particularly relevant to the issue of governance inthe public sector: information economics and new institutional economics. Bothhave received recognition rather late in the history of economics: R.H. Coase in1991 and D.C. North and R.W. Fogel in 1993 won the Nobel Prize in EconomicSciences for their path-breaking contributions to the theory of institutions, andG.A. Akerlof, A.M. Spence and J.E. Stiglitz received the Prize in 2001 for theiranalyses of markets with asymmetric information.
3.4.1.1 Information economics
Information economics revisits Keynes’s argument that the conditions underwhich markets operate in an efficient manner are extremely restrictive. Thetraditional neoclassical model neglected information imperfections. In the realworld, however, such imperfections are widespread. Information imperfectionsare said to exist when one person (or one side of a market transaction) knowsmore than the other. Workers know more about their abilities and effort than thefirm’s owner or manager, the person purchasing insurance knows more about
151
Social protection and the economy

his or her health and behaviour than the insurance firm. These informationasymmetries hence concern both hidden characteristics (adverse selection) andhidden actions (moral hazard).
Adverse selection is the ex ante problem of the principal being unaware ofthe characteristics of the agent. The solution for the principal (a healthinsurance firm, for example) lies in screening applicants or offering them amenu of policies to choose from; the agents also can signal their excessinformation, for example by purchasing policies with a large deductible (i.e. byassuming a large risk) to indicate to the insurer that they have no healthproblems. When quality is not observable and the seller cannot convince hiscustomer that he is offering a high-quality product, inferior-quality products andservices will drive higher-quality ones out of the market. Akerlof’s (1970)example of the used car market, where lay persons find it difficult to judge thequality of the cars on offer, is a good illustration of this situation. A solutionhere would be to license car sellers or establish a quality certificate.
Moral hazard is the ex post problem of the agent, once insured, possiblybehaving in a way that affects his or her risk. Had the insurance firm known thisbeforehand it would have charged a higher premium. The solution in the case ofthe insurer can be co-payment, or monitoring the agent’s behaviour.
This is where the principal-agent (‘‘p-a’’) framework enters the picture. Thep-a theory deals with situations of asymmetrical information – that is, situationswhere one of the transaction partners (the agent) knows more than the other (theprincipal). Contracts, or more generally compensation mechanisms, serve thedouble function of providing an incentive (rewarding effort) and allocating risk.There is an obvious tension between these two objectives, in particular whenthe agent is risk-averse.
Holmstrom and Milgrom (1991) have conceptualized a further importantaspect of the p-a framework, namely the situation where the task performed bythe agent has more than one dimension (i.e. when the agent is ‘‘multi-tasking’’)and the reward system is mono-dimensional. The classical example is the taskof the teacher. The teacher’s performance cannot be fully measured in terms ofthe test scores obtained by his or her students. Standard test scores often do nottake into account important qualities such as the students’ creative thinkingabilities and oral and written communication skills. If the teacher was paidaccording to the observable measure of the students’ test scores, he or she mightdecide to focus entirely on improving their test scores and neglect the non-measurable dimensions of the task. In practice, therefore, teachers – and manyother professionals – are seldom paid according to performance measures suchas test scores, but are paid a fixed wage (with sometimes an additionalperformance component).
The same problem arises when the government contracts out services toautonomous agencies or to private contractors in the market. For example, itwill not reward a social insurance institution merely for having a low number ofunemployment benefit recipients. That would not be sensible. First, the
152
Financing social protection

institution would have no influence on the inflow. Second, it has only limitedinstruments to control the outflow. Third and perhaps most important, it wouldnot matter to the institution – at least not from a purely financial point of view –whether the outflow is due to discouragement of further labour forceparticipation or to returns into paid employment. The only incentive wouldbe to lower the numbers in the books and that can be achieved in various ways,many of them not in the public interest.
Institutions may be paid according to the actual number of benefit recipientsor they may receive a budget, but the budget will in practice never be entirelyfixed. Adjustments may be made ex post – the volume component may beadjusted to the actual number of beneficiaries, or the price component may beadjusted to compensate for inflation. They may also be made ex ante: levellingthe expected costs of a health care insurance fund, for instance by taking intoaccount in the budget formula the share of elderly insured or the share of peoplewho live in less prosperous areas, is an example of such an adjustmentmechanism. An insurance fund with a (disproportionately) large number ofelderly would then receive a (disproportionately) higher budget. In this examplethe budget is devised to dissuade the insurance fund from engaging in riskselection (‘‘creaming’’). The government could of course take other measures,such as introducing a legal obligation for insurance funds to take on allapplicants, but this is not likely to work perfectly if the financial incentivespoint in another direction.
Another implication of the multitask p-a framework concerns ‘‘outside’’activities. These are agent’s activities that do not coincide with the interestsof the principal. A typical example is that of a civil servant engaging inprivate business during office hours. Holmstrom and Milgrom (1991) arguethat the principal will more likely prohibit those outside activities when he hasno sufficient means of monitoring the agent’s performance on the insideactivities – his proper job. Incentives for a task can thus be provided in twoways: ‘‘either the (inside) task itself can be rewarded or the marginalopportunity cost of the task can be lowered by removing or reducing theincentives of competing (outside) tasks’’ (idem, p. 27).
3.4.1.2 New institutional economics
This theoretical strand deals with the institutional framework and theinstitutions of governance. North (1991, p. 97) defines institutions as ‘‘thehumanly devised constraints that structure political, economic and socialinteractions [consisting] of both informal constraints (such as customs,traditions) and formal rules (constitutions, laws, procedures).’’
Williamson (1998) distinguishes four levels of institutional characteristicsin all. The first level comprises customs, traditions, religion, and social norms.The formal institutional environment makes up the second level: this is wherethe constitution, laws, and the organization of government and the public sector
153
Social protection and the economy

are situated; changes in these institutions occur gradually, over decades or evencenturies. Then there is the governance level, in which changes can occurwithin less than a decade. The central issue on this level is getting thegovernance structures right. The fourth level is the level of resource allocationand employment, where adjustments are made continuously in response tochanging market conditions. According to Williamson, this is the level withwhich neoclassical economics, as well as the principal-agent theory, isconcerned. New institutional economics, he affirms, deals with the second andthird levels, and in particular with the third (the governance framework).
Under the neoclassical theory, institutions would not matter in thefunctioning of markets. However, in a world with imperfect informationmarkets may be absent and the absence of particular markets, for instance forrisk coverage, has profound implications for the functioning of other markets(Stiglitz, 2002). Some of the previously listed arrangements of dealing withinformation imperfections (such as the quality certificate) are examples ofinstitutions that allow markets to function.
An important strand within the new institutional framework is transactioncost economics. Transaction costs are costs related to information acquisition,bargaining and contract settlement and to monitoring and policing the contract.Complex contracts are unavoidably incomplete. They contain gaps, errors andomissions, first because individuals do not possess perfect foresight, and secondbecause of opportunistic behaviour of the parties to the contract. For bothreasons, complex transactions will not occur unless some insurance device(‘‘credible commitment’’) is built in. Institutions are a means of dealing withthese risks.
The transaction cost approach originates from the work by Coase (1937) onvertical integration. Firms operate in a market, and inter-firm and firm-to-customer transactions are governed by price signals. However, within the firmsthemselves transactions are not directed by the price mechanism but byhierarchical decisions. Coase found that it seemed efficient to organize someactivities not as transactions in the market (outside) but to restrict them withinthe boundaries of the firm (inside). It is this ‘‘make or buy’’ decision that is atthe core of transaction cost economics.
The same question can be recast with respect to the public sector. Whichactivities should the public sector perform itself, and which ones can becontracted out to the private sector? Which activities can be privatized, andwhich ones cannot? What, in other words, ‘‘are the boundaries of the publicsector?’’ (Bovenberg, 2000). We will come to this shortly.
Another strand within the framework of new institutional economics is theproperty rights approach. The cornerstone of this theory is the lack of completecontracts, which brings it very close to the transaction cost approach. Theproperty right is the right to decide what happens in contingencies that are notincluded in the incomplete contract. This is called residual decision-makingpower: the discretionary power that remains within the limits set by the contract
154
Financing social protection

and the general regulatory framework. Ownership, or authority, is important ininvestment decisions (Hart and Moore, 1990; Aghion and Tirole, 1997). Inrespect of activities taking place in the public sector the government hasresidual decision-making power in circumstances not covered by the contract.Ownership gives control and bargaining power in situations that contracts donot explicitly describe (Shleifer, 1998). If the government contracts outactivities to the private sector, residual power is in the hands of the privatesector and the government has to use other, less tailor-made instruments, suchas regulations, subsidies or tax incentives, to influence the behaviour of privateagents (Bovenberg, 2000, p. 299).
Under this approach, privatization and the contracting-out of public servicesimprove the incentives to innovate and invest in cost-cutting measures.However, public provision is preferable if the government cannot prevent theprivate provider from reducing quality. Private providers have an incentive tokeep costs down and to invest in innovative techniques, but private provisionmay affect quality. Hart et al. (1996) have developed a model explaining whycontracting out to the private sector is generally cheaper but in somecircumstances delivers lower level of quality. If the provider is a governmentemployee he may not benefit from suggesting innovative quality or cost-cuttingtechniques and may thus have no incentive to do so. If he is from the privatesector he may have to renegotiate the contract to obtain higher prices in order toensure the introduction of a quality innovation, otherwise he would not benefitfrom it. Cost-cutting innovations, on the other hand, will always be adopted inprivate sector delivery.
Blank (2000) lists four arguments against relying on the market mechanism:
(i) externalities (causing under- or overprovision);
(ii) information asymmetries (multifaceted in-/outputs, monitoring difficul-ties, unobservable output or quality);
(iii) agency problems (decision-makers are not the recipients: ‘‘the privatemarket decisions of the decider may not produce optimal outcomes for therecipient’’; and if the decision-maker is the recipient, he/she may notalways act in his/her own long-term best interest); and
(iv) distributional concerns (guarantee of access versus universal provision).
Another, perhaps less economic and more political science-orientedapproach is the view that, often, governments are not benevolent. Organizedinterest groups (single-issue focused groups) can successfully pursue theiragenda at the cost of the non-organized and powerless taxpayer. Further downthis line of reasoning is the ‘‘grabbing hand’’ model (Shleifer and Vishny,1998), under which privatization can be seen as a means to disciplinebureaucrats and prevent them from pursuing hidden agendas, politicalpatronage and corruption. This argument, however, is not entirely convincing.‘‘Self binding’’ – committing the bureaucrats to a framework of procedural
155
Social protection and the economy

rules – is indeed important, but it is not clear why it cannot take the form of atransparent governance structure with a clear set of rules, with democraticchecks and balances and a well-performing supervisor (Bovenberg andTeulings, 1999).
3.4.2 Public versus private provision of
social protection
It is time now to construct on the above theoretical basis a more structuredanalytical framework with direct relevance to the efficient delivery of socialtransfers. We will first analyse the potential sources of market and governmentfailures that can be deduced from economic theory and then outline the choicesresulting from that environment.
3.4.2.1 Market and government failures
The market mechanism – Adam Smith’s ‘‘invisible hand’’ – is credited withachieving efficient outcomes. However, markets do fail. That happens whenunregulated markets do not generate efficient outcomes. The ‘‘invisible hand’’needs a helping hand. But governments may fail as well. The two concepts arebriefly examined below. Understanding both types of failures and their systemicreasons is important for the efficient design of social transfers systems.
The following sources of market failure are often mentioned in theliterature: natural monopolies and concentrations of market power, publicgoods and services, externalities, and information imperfections.
Natural monopolies and concentrations
Natural monopolies are a source of market failure but legal monopolies andpatents – a requisite for protecting the property rights on intellectual capital –can lead to a similar situation. The monopolist firm has the power to set theprice. It is not restricted since there are no competitors to push the price down tothe level of marginal costs. Only the price elasticity of demand may act as acheck on the monopolist’s price-setting power. When consumers have an optionnot to purchase the good or service in question the monopolist will have anincentive to keep prices down.
Natural monopolies and concentrations are not a motive for publicprovision, however. Technological developments may allow competition,for example in the network industries (communication, energy, etc.) wheredue to ‘‘depending’’ several providers can use the same network or a similarservice – such as the Internet – can be distributed through different networks.Governments can alleviate market failures by applying a well-designed set ofrules: cartels, for example, are outlawed in most (if not all) countries ofthe world.
156
Financing social protection

Public goods and services
Atkinson and Stiglitz (1980, Chapter 16) have listed the following efficiencymotives for the public provision of goods. First, it may not be possible (orwould be extremely expensive) to exclude non-contributors – the feasibility ofcharging for the consumption of goods depends on the available technology.This is referred to as the principle of non-exclusion. Second, application of theprice mechanism may not be efficient either because demand is inelastic orbecause consumption by one individual does not affect the amount available forconsumption by other individuals (the latter is often referred to as the principleof non-rivalry). Note that for Atkinson and Stiglitz the distinguishingcharacteristics are not entirely embedded in the goods themselves, thecircumstances may be relevant as well. Hence, there is no ‘‘once-and-for-all’’choice for the public versus private provision of a set of goods or services.The decision regarding public provision depends on the available technologyand demand conditions as well as on the technical characteristics of the actualgoods and services itself. For example, modern financing instrumentsfacilitate private insurance against the unemployment risk and cover theinflation risk in private pension provision.
Externalities
Externalities may be defined as unanticipated side effects of calculatedcourses of action. For example, decisions of subject A may affect the welfare ofB, and transactions between A and B may affect the welfare of C. Thetransaction partners do not take sufficient account of the societal impact of theirtransaction. In case of negative external effects the transaction would take placeeven though other individuals would experience welfare losses. Coase (1960)has argued that these externalities can be bargained away – A and B could agreewith C to compensate him/her for the external effects, for example. However,this is not always feasible, in particular in complex contract situations with alarge number of stakeholders. In these situations the free rider problem occurs:it is not possible to ‘‘internalize’’ the externalities, that is, to exclude individualswho would profit from a certain service without contributing to it. Bovenberget al. (2003) characterize these complex contracting situations – where privatetransaction partners are not able to internalize externalities – as ‘‘publicinterests’’.
Information imperfections
These are the imperfections listed in section 3.4.1.1, including multifacetedinputs and outputs, monitoring difficulties, unobservable output or quality,hidden characteristics (adverse selection) and agency problems (moral hazard).
This list sets out the most important sources of market failure. However,markets – if left to themselves – fail not only because they do not operate in
157
Social protection and the economy

an ideal environment but also because they do not produce ideal outcomes.Redistributive failures, another motive for government intervention, are ofparticular relevance for the social transfer sector.
Redistributive failures
Markets will seldom lead to an equitable distribution of welfare. Moreover,access to the market is rarely universal. Insurance markets – for example,private health insurance markets – curtail access for individuals or groups thatare considered to be high risks. Private universities charge high tuition feesthat act as barriers for low-income students. We could draw up a long list ofsuch examples.
Market failures are usually seen as a rationale for government intervention.Governments could intervene in many ways to correct them: through the taxsystem, subsidizing the providers, offering subsidies to low-income groups,imposing regulation; finally, the government could provide the service itself –which is the traditional way of providing social protection. In selecting the bestinstrument the government faces some systemic restrictions to efficiency. Theserestrictions are often referred to as ‘‘government failures’’, but in fact they areno different from the issues already discussed in the context of the newinstitutional and information economics theories: information imperfections,incomplete contracts, and credible commitment.
However, government intervention also raises systemic problems inherent toall government activity. First, governments may interfere with individualownership rights and political intervention distorts existing incentive mechan-isms to achieve, for example, social policy goals. An example would be applyingpolitical pressure on the Central Bank to pursue a less restrictive policy. Thiscould lead markets to lose confidence, force the interest rate upward, thusleading to less investment and, eventually, a higher rate of unemployment –exactly the opposite of what the government had in mind. This credibilityproblem is called the ‘‘intervention paradox’’ (Bovenberg et al., 2003).
A second problem is the trade-off between insurance and incentives. Asalready mentioned in section 3.4.1.2, a contract is a means of both allocatingrisk and providing incentives to perform certain tasks. One form of possibleintervention is contracting-out. In this case the government needs to balance theefficiency gains accruing from high-powered incentives to focus on certainoutcomes in a contractual arrangement against the risks imposed on (perhapsrisk-averse) private providers. An example is the current debate in theNetherlands concerning incentive contracts for providers in the recentlyprivatized reintegration services market (van de Meerendonk, 2003). Theadvantages of a greater focus on outcome and less monitoring of contractcompliance (through performance reporting obligations for service providers)need to be weighed against the increased risk of insolvency for placementservice providers when a labour market faces a severe economic downturn and
158
Financing social protection

where placement outcomes might be poor not because of bad management butsimply because of the unfavourable economic environment.25
Third, there is the problem of tension between asset specificity andcompetition. Competition generates information for the principal – thegovernment – concerning the performance and prices of the various providersin the market. However, when investments are required competition suffersfrom the ‘‘hold-up’’ problem which can arise when investments are specific tothe relationship between the principal and the provider (Malcolmson, 1997).Let us take the example of a private provider deciding to build a new, state-of-the-art hospital. Once the investment is made the provider’s hands are tied –he cannot put the assets to an alternative use without suffering a substantialloss. The government knows this and could force the provider to lower theprice (even below marginal cost level), threatening to change suppliers. Thisrisk of the provider being ‘‘held up’’ by the government or the public healthinsurance fund can be excluded by negotiating a service contract before theinvestment is made.
Fourth, organizations often perform several tasks: an unemploymentinsurance fund, for example, collects contributions, assesses claims and re-integrates benefit recipients back into employment. In such a ‘‘multi-tasking’’situation the government needs to decide whether or not it wants to separatecertain tasks and allocate them to different institutions in order to establish achecks-and-balances situation. However, this comes at a price in terms of a lossin coordination. In general, the advantages of privatization are less obvious themore a given task entails:
. outcomes that are not easily observable for the government – this followsfrom the multitask p-a framework described in section 3.4.1.1;
. externalities to the public budget – an example would be the privatization ofthe unemployment or sickness risk above a certain threshold (that is,allowing for a private tier in addition to the public tier that provides basicincome support). Suppose the public scheme provides a benefit that is set at70 per cent of previous earnings. This would give the individual insured anincentive to resume his or her work as soon as possible. However, when theindividual has purchased additional insurance that covers the full incomerisk of unemployment or sickness, no financial incentives to resume workremain. Still, the largest part of the costs accrues to the public insurancefund. The private transaction between the individual and the insurancecompany affects the public budget (‘‘negative externalities’’).
3.4.2.2 Governance choices
The above dilemmas and trade-offs thus turn the government’s choice of eitherproviding a service itself or contracting it out to a (semi-)public organization ora private firm into a multi-facetted decision (Bovenberg et al., 2003).Moreover, the choice does not lie between just two alternatives – public or
159
Social protection and the economy

private provision – since there is an extensive range of possibilities: publicproviders can be placed at arm’s length, budgeting mechanisms can be tailoredto the outcomes desired by the central authorities, competition can beintroduced between public providers, and customers can be given a moreprominent role. Moving from the public to the private end of the spectrum, wefind the following arrangements:
(1) Government provision (full government ownership) with control byauthority (hierarchical control)
(2) Semi-autonomous public institutions/agencies (public ownership) withformal responsibility separated from operational (executive) responsibility
(3) Quasi markets (public or private ownership; public financing) with
. Budget mechanism
. Yardstick competition
. Incentive contracting in procurement
(4) Markets (private ownership; private or public financing) with
. Tendering (ex ante competition)
. Regular competition (ex post competition) – with/without vouchers
. Contestable markets
(5) Regulation and supervision (also required in all the previous categories)with
. Regulation of markets (setting the framework; determining price(s) and/or price ceiling(s); etc.)
. Supervision (of competition and of the use of public funds)
First, there is a category of services that the government best provides itself.This is the case when externalities occur on a national scale. Examples arenational defence and foreign policy. The tax office would be another example;however, this is less obvious since it is conceivable to have a decentralized taxsystem with some additional clearing mechanism in place that serves to levelmajor regional disparities in tax burdens. Such a mechanism could beincorporated in the Constitution and would not require an ad hoc governmentagency. In this category, the government owns the assets and provides theservice and the Minister assumes full hierarchical control. On the ‘‘flexibility-commitment’’ axis this is closest to flexibility.
Second, there is a category of services that are provided by a publicorganization other than central government. For example, municipalities mayprovide garbage collection or local transport services. And organizations maybe established by law to provide certain services (e.g. a public social insurance
160
Financing social protection

fund). An important characteristic of these organizations is that formal andoperational responsibilities are separated. The Minister commits to a contractwith the organization. The contract contains outcome directives and perhaps aset of procedural guidelines. The organization can choose the instruments thatare applied to meet the outcome targets. The idea behind this separation offormal and executive responsibilities is that decentralized organizations haveless informational gaps and are better placed to tailor services to individualneeds. The central government, in decentralizing tasks and responsibilities, thusagrees to trade off some of its intervention instruments to gain a reduction in theinformation imperfections that are characteristic of the centralized model.
However, this will result in an information advantage of service providersover the government as to the true resource requirements to meet the(government’s) objectives. To deal with this, and to improve the efficiency ofeither public organizations or private organizations that are publicly funded,instruments like budgeting are used. The budget mechanism is a means to solvethe problem residing in the fact that the principal – the central government – hasno accurate information on the provider’s costs and efforts. Still, the problemremains that the ill-informed principal (central government) may set the budgeteither too high or too low. This is where ‘‘yardstick competition’’ comes in. Itentails comparing the performances of different providers, all facing more orless similar (technological) conditions, and using the outcomes in the designof the financing mechanism. This requires the principal to formulate a set ofperformance criteria. Benchmarking the performances of the various organ-izations – often operating in different areas – provides the principal with therequired information. Subsequently the principal can tailor the budget to thecost level of the most efficient organization.
In procurement situations it is optimal for the government to offer a menu ofincentive contracts. The idea is that the contract should be tailored to the firm’sinformation.26 A common feature of these arrangements is the creation ofa ‘‘quasi market’’ – a managed market designed to mimic the outcomes ofreal markets.
In the process of fine-tuning the financial mechanisms, the governmentfaces a trade-off between insurance and incentives. In the subsequent category –relying on markets – it faces an additional trade-off, that between assetspecificity and competition. Competitive tendering (ex ante competition) ispreferable to regular, ex post competition in situations where sunk investmentsmay elicit opportunistic behaviour on the part of the government. The politicalprocess tends to be volatile and this could cause private investors to be reluctantto participate in infrastructural projects – in public utilities, but also in thehospital sector, for example.
Service provision could be opened to competition by specifying andannouncing service requirements, calling for tenders and contracting – for somefixed term – with the supplier submitting the most favourable bid (Lundsgaard,2002). An example could be the farming out of investment services for
161
Social protection and the economy

the placement of social security reserves to competing investment managersusing short- and medium-term internal rates of return within overall investmentpolicy guidelines as benchmarks for the competition (see Chapter 6). Ex ante,competition is introduced and full access is granted to new entrants. Lundsgaard(2002) claims that ‘‘the openness of competitive tendering to new entrantsmakes it a stronger mechanism than benchmarking for revealing the true levelof necessary costs.’’
For tendering to be a means of achieving the government’s objectives, somerequirements need to be met. One of them is transparency: the purchasingagency needs to have information as to performance track records and servicequality, and procedures for selecting contractors need to be transparent. Anotherrequirement is that providers compete on a level playing field. This is especiallyimportant when providers with access to public financial resources (on accountof the fact that they also perform public tasks) are allowed on the market, sincethey could cross-subsidize their market activities out of public resources andoffer lower prices than their competitors.
The government could also allow regular, ex post competition on themarket. Customers then have the option of selecting a service provider. Thiscan be a powerful incentive for providers to improve their service standards.Again, transparency is an important condition for such a market to be efficient.For services like health care and education, for example, funded predominantlyout of public resources, the government could resort to vouchers. These areearmarked budgets that are disbursed not to providers but to customers, topurchase a certain service. The advantage of this arrangement is that itallows the market to function without constraints, while at the same timeaccess for low-income and/or high-risk customer groups is maintained. Asimilar effect can be achieved in a per-user budgeting framework withthe incorporation of risk-related parameters – for instance, age or level ofeducation – in the budget formula. In the Netherlands, for example, this hasbeen applied in the area of sickness funds and the budgeting of social assistanceoutlays to municipalities.
Even in markets with a limited number of suppliers competition is feasibleas long as the market is contestable – that is, the thresholds for new entrants arelow. The market for hospital services will therefore be less contestable than themarket for cleaning services. Markets with government licensing of providersare less contestable than those without such statutory entrance barriers.
Regulation and supervision are not substitutes for public or marketprovision; they should rather be seen as a complement. Even in the case ofgovernment provision, legislation will apply and parliament may appoint asupervisor (e.g. National Audit Office in the United Kingdom). In situationswhere the government relies on the market to provide services, a framework ofrules and a supervisor to safeguard fair competition between suppliers andaccess to services for low-income or high-risk customers are required. Thegovernment’s role then changes from one of direct supplier to that of regulator.
162
Financing social protection

3.4.2.3 Conclusions
Market failures are not sufficient to legitimate government intervention sincethe same factors, notably information imperfections (including agencyproblems) and incomplete contracts are widespread both in public provisionand in markets. However, complex transactions give rise to externalities and itis these that may affect public interests. The protection of public interests is themain motive for government intervention in private markets, and publicinterests in this context include redistribution concerns.
The government needs to balance the gains of intervention against thelosses and select the most appropriate means of action. The economic theoryhas not managed as yet to provide a clear set of general guidelines to politiciansas to when to intervene and to what degree, and when not to, and in any case itremains important to keep an eye on the social consequences of the chosengovernance mechanism.
The government should set a framework that ensures social outcomes butalso provides all possible incentives for the efficient delivery of transfers thatcan achieve these outcomes. That framework includes legislation and lawenforcement that guarantee contracts, delineate and protect property rights,require the government to monitor the market mechanism, and establishconditions that promote fair competition and protect the interests of consumersand workers (such as product-safety regulations and occupational health andsafety standards). Last but not least, it requires welfare state arrangements thatguarantee – while not necessarily delivering to – all citizens a basic level ofsubsistence, as well as access to health and educational facilities. If governanceis able to set the rules or write a watertight contract which, either way,guarantees a defined outcome, then there is little economic purpose in a purelyideological debate on public versus private provision.
Ultimately, delivery and financing systems have to stand a double test:
(a) Can they deliver intended social outcomes?
(b) Can they do this in an efficient way?
Many private and public delivery systems will not pass these tests. If bothprivate and public systems can deliver the intended outcomes, the actual cost ofprovision should, in practice, tip the balance.
3.5 WILL WE BE ABLE TO AFFORD THE WELFARE STATE
IN THE FUTURE?
The analyses in sections 3.2 and 3.3 were of a retrospective nature.Contemporary welfare states however face two challenges that are rapidlyassuming new dimensions and raising questions as to whether the presentdesign of the welfare state remains affordable. ‘‘Affordability’’ is a fuzzyconcept, and requires clarification. Since we have not been able to establish
163
Social protection and the economy

what constitutes economically optimal social expenditure, we must resort to apragmatic income concept of affordability. We simply assume here that NSPSsare affordable as long as the population is willing to finance them. Accordingly,it is ultimately the willingness to pay that determines affordability. Thatwillingness will depend on the level of taxes or contributions. Two newdevelopments could push up this level: the changing demographic environment,and internationalization of the global economy.
3.5.1 The demographic challenge
Pension expenditure accounts for more than 50 per cent of all socialexpenditure almost everywhere, and the projections examined in Chapter 2indicate that this proportion will continue to grow. Ageing will drive up pension(and health) expenditure in the decades to come, putting particular pressure ongovernment budgets in countries with an extensive public pension tier financedon a PAYG basis.
As noted in Chapter 2, the elderly dependency ratio will accelerate in the nextfew decades. The anticipated increase has been estimated at one-half to onepercentage point in all the countries reviewed here. This means that the pressureon pension systems will increase accordingly, and some might becomeunsustainable. Thompson (1998) measures the total cost of the support for theretired (the ‘‘retirement burden’’) as the ratio between the consumption of theretired and GDP. ‘‘Non-sustainability’’ would consequently mean that populationsregard that share as being too high. It is thus first and foremost a political term, notan economic one. When a pension system becomes ‘‘unsustainable’’, four policyinstruments are available to ease financial and fiscal pressure (Holzmann, 1997):
(i) lowering pension benefit replacement rates;
(ii) raising contribution rates;
(iii) increasing the effective retirement age; and
(iv) reallocating resources from elsewhere in the government budget (raisingtaxes, allowing a larger budget deficit, or reallocating funds inside thebudget).
Generational accounting can reveal the impact of ageing on the expectedtax/contribution burden of individual cohorts of the population. It is also ameans of assessing the extent to which public finances are in balance over thelong term. It is a fairly new method but has already been applied in a number ofcountries (Auerbach et al., 1999). Generational accounts display net paymentsor net revenues for all cohorts (the present value of all taxes and contributionsand received income transfers and public services in the course of a lifetime).They allow us to assess which cohorts bear the heaviest burden and which onesreceive the revenue. Table 3.9 shows such data for two cohorts – one thathas just entered the labour market (age 25) and one that is on the threshold
164
Financing social protection

Table 3.9 Generational accounts for two groups (age 25 and age 65) in thousand US$ (scaled for GDP/capita), selectedcountries, 1995
Australia Belgium Canada Denmark Germany France Italy Japan Netherlands Sweden UnitedStates
(1) Net lifetime paymentsof generation aged 25
202 337 247 295 408 409 250 360 321 414 173
(1) Net lifetime paymentsof generation aged 65
�18 �206 �107 �219 �278 �257 �188 �58 �124 �161 �96
Source: Kotlikoff and Leibfritz (1999), pp. 82–84.
165
So
cia
lp
rote
ctio
nan
dth
eeco
no
my

of retirement (age 65). It can be seen that the elderly in countries with anextensive public pension tier (in particular Belgium, France and Germany, andto a lesser degree Italy and Sweden) receive more than the elderly in the othercountries considered. The generation just beginning its working career, though,has a negative lifetime revenue. The table does show some substantialdifferences between the countries: net payments are largest in Sweden, Franceand Germany, and smallest in Australia and the United States. It must be noted,however, that the results of generational accounting analyses are extremelysensitive to the discount rates used.
Nevertheless, the data in table 3.9 allow us to discuss the policies that thegovernments of the various countries have at their disposal to accommodate thepressures created by an ageing population. We have already mentioned thatnon-sustainability is chiefly a political term: it means that when allocativedecisions are made within all public and parastatal budgets there is no politicalagreement to increase the share of resources that goes to the pension system(i.e. financing consumption by the elderly). The results of implicit or explicitcalculations like those in table 3.9 may determine the willingness of futureyounger generations to finance the public pension scheme.
Out of the four policy instruments listed above, lowering replacement ratesin the public tier may be an option for countries with substantial earnings-related public schemes, but far less for countries that operate a flat-rate publictier. This latter group already have a larger private pension tier. And some ofthese private schemes are defined-contribution schemes. Increasing thecontribution rate means that in all countries the current working generationwould face an even higher net burden. Reallocating the government budget isnot really relevant here as it does not alter the generational imbalance.
This leaves us with the option of increasing the effective retirement age.Bovenberg and ter Rele (1999) have calculated generational accounts for theNetherlands allowing for a gradual increase in the employment rate among olderage groups (this has been the trend from the mid-1980s onwards). They calculatedhow the generational imbalance is affected by an increase in the employment rateand the expected rise in private pension incomes (due to the maturation of theprivate pension schemes). While the imbalances could not be completelyabolished, they would at least be dramatically reduced.
It is obvious that the results from generational accounting should beregarded with some caution. They do not necessarily provide a compre-hensive picture of the lifetime balance between implicit and explicit benefitsreaped from national social protection systems and payments made towardstheir financing. Future, smaller generations will pay higher pension contri-butions, but they will probably have benefited from much bigger transfers tothem in their youth than the previous generations did. Not all of thesetransfers would necessarily be informal or formal cash transfers; they mightalso be transfers in kind, such as small classes at school creating a betterlearning environment.
166
Financing social protection

Intergenerational accounting results also suffer from the exclusion of privateincome and wealth transfers in societies. Preliminary calculations by ILOFACTS show that a person born in 1950 in Germany who goes through a‘‘standard’’ private and working life, retires at age 60 and dies at age 83, has adisposable lifetime income 20 per cent lower than that of a person born in 1980.The reason is simple. The calculations add informal intra-family incometransfers to income from employment and formal transfers. In this case biggerinformal income transfers due to smaller family sizes, later ages of entry intothe labour market and larger overall family incomes more than compensatehigher taxes and contributions and lower benefits of the younger generations.This also shows – by reverse analysis – the still substantial net cost of raisingchildren in that national setting. Similar effects can possibly be calculated forother countries. Consequently, one might argue that child- and family-relatedbenefits are economically still too low to provide incentives for families tocorrect the ageing problem by having more children.
However the above calculations do show – thereby confirming the conclu-sions reached in Chapter 2 – how the impact of ageing can be contained.Enlarging the tax base by achieving a substantial increase in the employmentrate is one way of keeping costs manageable. And, as the number of peopleaged 55 to 64 increases, the labour force participation rate of this age group hasto increase.
One factor that we have not addressed so far lies outside the standard socialprotection policy toolkit but is acquiring some prominence in the Europeansocial policy debate: replacement migration. For the time being Europe is theregion facing the most imminent ageing problem, since other parts of the globeare still young. Would it not be logical, then, simply to import young labourinto Europe, thereby increasing the tax base and solving the growingdemographic dependency problem? Issue Brief 2 provides a preliminaryquantitative investigation into the problem and concludes that the answer to thisquestion is: Not really, or probably only in a non-xenophobic ideal world.
Issue Brief 2 tries to assess what migratory inflows would be required forEU countries to maintain a certain per capita GDP growth level (a proxy for thestandard of living) over the coming decades. The reasoning is that if levels ofGDP per capita can be maintained, then the social transfer systems are probablysustainable. If recent per capita growth levels are the declared target, thenreplacement migration – without any change in labour force participation forthe original population – would cause EU’s total population simply to explode.The reason is that each new young immigrant normally arrives with dependants,and all of the new inhabitants would need to be fed – that is, they would requirethe same per capita GDP as the native population (if not immediately, then aftera short transition period), which would lead to a new labour gap after each waveof immigration that would have to be filled with ever-increasing numbers ofimmigrants. The model is ‘‘chasing its tail’’. The obvious conclusion is that acombination of more and longer work and modest income expectations would
167
Social protection and the economy

probably contain the effects of ageing. This means that the classic policyinstruments described above would still have to be implemented in full.
3.5.2 The challenge of internationalization
The growing economic integration during the last decades of the twentiethcentury coincided with rising wage inequality – notably in English-speakingcountries – and increasing unemployment among the low-skilled, mainly on theEuropean continent. This gave rise to theories that trade hurts the less-skilledworkers in advanced economies (Wood, 1995). According to these theories,such workers suffer because their wages are not set in their own domesticmarkets but, in line with the neoclassical ‘‘factor price equalization theorem’’,in Manila, Bangkok or Beijing – to use Freeman’s phrasing (1995). Othershave argued that trade was not the main culprit. There were far too few low-skilled workers employed in the manufacturing industries to account for theobserved rise in inequality; most low-skilled jobs were found within thesheltered service sector. Instead, technological change should be heldresponsible for the sluggish demand for low-skilled labour in the advancedeconomies (Sachs and Shatz, 1994).
The debate is not yet closed, and it probably makes sense to conclude thatboth arguments contain elements of truth. What matters for the purposes of thisbook, however, is less the impact of internationalization on wages than theextent to which it affects the capacity of national governments to set their owntargets with respect to social protection. Critics of the welfare state have arguedthat increased international openness creates difficulties in raising sufficientrevenues, and therefore requires a downsizing of the welfare state.
Three kinds of constraints that international economic integration imposeson national-scale social policies can be cited in support of this argument. Thefirst of these is trade. We have already discovered that trade cannot be heldresponsible for the problems of low-skilled workers – or at least not as theprime suspect. The next question is to what extent trade could be a motive forwelfare-state retrenchment. The channel would be through high labour costsleading to uncompetitive prices for tradable goods and services. First, there isample evidence that net-of-tax wages are more likely to be affected than labourcosts. Second, most trade is regional, not global (Ruigrok and van Tulder,1995). When France trades a Renault for a German Volkswagen, neithercountry’s welfare state will be affected. Third, public expenditure – on educa-tion and health care facilities, for instance – increases labour productivity;income transfers may enhance entrepreneurship, or the willingness to take risks.In this respect, public social expenditure improves – rather than weakens – thecompetitiveness of the country’s tradable goods sector.
The second constraint is labour mobility. Here we can make a distinctionbetween high-skilled and low-skilled labour. Highly skilled labour and tech-nological change are linked; they are complements rather than substitutes.
168
Financing social protection

Hence, in a standard neoclassical (Heckscher-Ohlin) framework countries willspecialize: high-skilled labour will move to the advanced industrial countries,and low-skilled labour will disappear there. However, the facts do not supportthis theory. What we observe instead is a gradual diffusion of technology. In theinitial stage after the Second World War, Japan was a capital-intensive low-wage country, but from the 1960s onwards it rapidly closed the gap with theUnited States and European economies, and increasingly specialized in high-tech products. With a time lag of about one and a half decades, the sameprocess took place in the ‘‘economic tigers’’ such as the Republic of Korea,Taiwan and Singapore. In the 1990s, countries like Thailand and Vietnam tookthe leap and presently China too is poised to make the transition. In fact, somecoastal areas of mainland China (Guangdong and Fujian provinces, forexample) are already developing rapidly into medium-tech strongholds,attracting large numbers of migrant workers from the rural hinterland. Withthe diffusion of technology comes an upgrading of skills, while low-skilledlabour flows in the opposite direction, often seeking means of subsistence in theinformal sectors of the economies of advanced industrial countries. There, thesemigrant workers largely remain outsiders with no entitlements to the generousprovisions of the welfare state.
The third possible constraint is capital mobility. This is probably the mostserious candidate, and the Asian crisis of the late 1990s has proved that capitalmarkets can indeed have a strong impact on economies with institutionalweaknesses. However, ineffective and inefficient (or corrupt) governmentadministrations are the main culprits in this regard. Taxes and social protectionschemes do not classify as an institutional weakness unless incentives to investeffort or savings are so greatly distorted that investments cease to be profitable.If social protection schemes are well designed, they may even be an asset inattracting venture capital from abroad.
There is some evidence that countries are currently engaged in taxcompetition, although the effects seem to be much smaller than might beexpected. In the case of tax competition triggered by globalization, we wouldexpect to observe declining capital tax rates and rising labour and consumptiontax rates. In particular, tax rates on the most immobile production factor, low-skilled labour, should have risen. Table 3.10 shows average effective tax rates(AETRs)27 in a number of OECD countries. The figures reveal no across-the-board decline in AETRs on capital income, but AETRs on labour income andconsumption have risen considerably. A closer look at tax revenue and the taxbase (see table 3.11) reveals that the substantial decline in the latter has beenresponsible for the rise in AETRs on labour income. AETRs were raised inorder to compensate for the shrinking tax base.
The tables might be interpreted in such a way as to prompt the conclusionthat domestic labour must absorb some of the pressures of internationalization.However, that would be a massive problem only if disposable income in theindustrialized countries actually dropped dramatically as a result of new
169
Social protection and the economy

Table 3.10 Average effective tax rates (as % of GDP), selected OECD countries, 1980–97
Capital Labour Consumption
1980–85 1986–90 1991–97 1980–85 1986–90 1991–97 1980–85 1986–90 1991–97
United States 28.3 29.2 31.1 21.6 22.1 22.6 6.3 5.9 6.1
Germany 22.9 21.1 19.9 33.1 34.8 35.9 14.8 14.6 15.8
France 24.3 22.9 23.6 35.4 38.5 40.2 18.8 19.0 18.0
United Kingdom 46.4 47.1 38.4 24.3 22.3 21.0 16.0 16.4 16.9
Australia 26.1 28.0 28.0 21.4 23.7 22.6 14.0 13.5 11.9
Netherlands 22.5 23.4 24.7 41.1 42.0 41.0 16.1 18.3 18.7
Norway 27.1 22.8 20.2 33.8 34.7 35.5 27.6 27.4 26.9
Sweden 25.5 35.3 30.5 46.8 51.0 48.5 17.7 20.4 18.7
Switzerland 22.4 25.9 25.1 27.2 28.1 30.2 8.5 8.9 8.4
OECD 25.1 26.7 26.6 30.0 32.2 33.4 16.1 17.2 17.1
EU 24.2 25.1 25.1 33.0 35.3 36.8 16.6 18.6 18.7
Source: Carey and Tchilinguirian (2000).
170
Fin
an
cin
gso
cia
lp
rote
ctio
n

financial pressures on the social transfer systems. This has not happened yet,and there is no evidence that it might happen soon.
The theoretical arguments for cuts in social provisions are basically notdifferent from those we reviewed in section 3.2.1, and the counter-argumentscome down to those we listed in section 3.2.2. International competition merelyputs additional pressure on the alleged institutional rigidities in extensivewelfare states. But it also increases the need for sound social policies.Therefore, at this point it makes sense to take a look at the empirical data. Oneway to do this is to compare the economic performances of comprehensivewelfare states with more liberal market-oriented economies so as to find outwhich group performs better.28 We concluded in section 3.3.6 that this exerciseprovides no clear answers.
We can also acknowledge that different countries pursue different paths andthat different kinds of policies can be successful as long as they areimplemented with a view to the long-term impact. Recently, for example, theILO studied the economic performances of four small European countries(Austria, Denmark, Ireland and the Netherlands), all of which are highlyexposed to international trade (Auer, 2000). The findings were that thecombination of sound macroeconomic policies, innovative labour marketreforms, and the re-establishment of a social dialogue (corporatist governance)contributed to the remarkable economic track records of these countries in the1990s. The Maastricht process29 resulted in the redressing of budget deficits,and this enhances the scope for fiscal fine-tuning.
The ILO points to the correct timing of macroeconomic consolidation asone crucial element in preventing cyclical unemployment from becoming
Table 3.11 Average annual changes in AETRs (as % of GDP), selected OECDcountries
Tax revenue Tax base
Capital Labour Consumption Capital Labour Consumption
United States 0.0 0.0 0.0 0.2 �0.2 0.1
Germany 0.0 0.0 0.0 0.3 �0.3 0.0
France 0.2 0.1 0.0 0.5 �0.4 0.1
United Kingdom 0.0 �0.2 0.1 0.1 �0.2 0.1
Australia 0.1 0.1 0.0 0.1 �0.3 0.1
Netherlands 0.1 �0.3 0.1 0.4 �0.5 �0.4
Norway 0.0 �0.1 0.1 0.1 �0.3 0.1
Sweden 0.2 0.0 0.0 0.3 �0.4 �0.1
Switzerland 0.0 0.3 0.0 �0.2 0.2 0.0
OECD average 0.1 0.1 0.1 0.2 �0.4 0.0
Source: Carey and Tchilinguirian (2000).
171
Social protection and the economy

persistent.30 Activating labour market policies, such as tax cuts for low-wageemployment and improvements in the operation of (public) employmentservices, have also contributed. Corporatist governance – combining in a socialdialogue the divergent interests of specific groups with the interests of theeconomy as a whole – has been conducive to sustained wage moderation andthe recovery from high unemployment. A particular lesson drawn by the ILOfrom the country studies is that economic openness pays off. Globalizationseems to have no longer-term adverse effects on the labour markets of thesecountries (ibid., p. 96).
Elmeskov et al. (1998) have studied a larger set of countries, and find thatthose that managed to reduce structural unemployment in the 1990s (Australia,Denmark, Ireland, Netherlands, New Zealand and the United Kingdom) hadimplemented broad policy packages that included reductions of the tax wedge,reform of social security schemes, and reductions in employment-protectionlegislation. The authors emphasize that one of the keys to their success andpublic acceptance was the inclusion of measures to compensate those who werenegatively affected by the reforms.
This chapter has focused on the welfare state debate in the advancedindustrialized economies (roughly the OECD area). The issues at stake here,however, are relevant for transition and developing economies as well. Theirintegration in the global economic system can be facilitated when economic andlabour market policies are firmly grounded in the awareness that the losers willneed to be compensated. Workers who are set to lose their jobs in the process oflabour market liberalization, or those who find that their pension savings werenever real savings but rather part of the companies’ now obsolete stocks, willnot be rushing to welcome the new free-market standard. They are more likelyto mobilize their unions or man the barricades themselves in order to force theirpoliticians to slow down the process of economic restructuring.
The good thing for the countries lagging behind is that they can learnfrom the (often expensive) mistakes that more advanced countries have madeduring the same process. Their economists and financial analysts should takethese lessons on board so as to be able to advise their politicians to make theright choices.
3.5.3 Summing up
Our model simulations in Chapter 2 and Issue Briefs 1 and 2 show that there isvery little reason to suppose that even under fairly conservative growthassumptions social expenditure in OECD countries is likely to explode –although it may increase somewhat over the next two to three decades, providedthat the present level of employment can be maintained and that resources canbe shifted between different categories of social expenditure, for instance fromless-needed family benefits and education expenditure to old-age benefits.31
172
Financing social protection

Relatively small changes in the benefit structure would even make it possible tokeep expenditure and hence redistribution at present levels.
There is no reason to believe that social protection systems cannot bemaintained as long as the overwhelming majority of all societal subgroupsaccept that level of redistribution and the consequential reduction of personalincomes and profits from contributions and taxes, and do not resort to variousforms of tax evasion.
Assume a European society that finances its social protection system byredistributing 30 per cent of its GDP. Let us assume further that a neighbouringcountry, possibly in Eastern Europe, has overall labour cost and profit levelsthat are 30 per cent lower, with the result that its total GDP is also around 30 percent lower. There is no reason why that society could not redistribute about 30per cent of the lower level of GDP through the social protection system – or, inother words, share the cake in the same way as its richer neighbour.
No generic rule determines the limits of solidarity (which historicalexperience shows to be changing over time) in any given society and inparticular between generations. These limits can only be tested politically, andthey reflect basic societal concepts and values rather than economic parameters.What we observe in Europe is that these limits seem to be shifting. Financingburdens appear to be becoming increasingly ‘‘unacceptable’’.32 The reasons aremanifold and touch on such fundamental concepts as changing social values,which are beyond the scope of this book. It is a fact, however, that in everysociety there are limits to solidarity and, accordingly, to the level ofredistribution deemed acceptable – or, in more concrete terms, limits to publicacceptance of tax and contribution rates. Non-acceptance of financing burdensis often camouflaged as economic criticism citing the abovementioned macro-and microeconomic effects of social protection and citing unemployment as themajor single negative effect, and may be accompanied by threats of economicmigration.
Some of the public criticism levelled at the welfare state may be defused ifthe system is making credible efforts to achieve cost efficiency by using eitherprivate entities or market mechanisms within public entities. However, theactual political balancing of the public-private mix is much more complex thanstrict microeconomic reasoning might suggest.
3.6 SUMMARY
On the whole, the debate on the economic effects of the welfare state and itsdifferent forms remains inconclusive. Poverty and equality indicators are betterin the extensive welfare states, whereas the residual welfare states seem toachieve slightly more reliable labour market outcomes – even thoughexceptions can be cited. We have discussed arguments for and against, andthey themselves appear to be open to some dispute.
173
Social protection and the economy

We have spent some time showing that the labour market is a crucialtransmission belt in the interaction between transfer elements and non-transferelements of comprehensive welfare states. We noticed that less comprehensivewelfare states face trade-offs similar to those confronted by the morecomprehensive welfare states. In their solutions, the less comprehensive welfarestates in English-speaking countries appear to put more emphasis on the take-upof employment. The incentive for less-educated workers to work in low-paid jobsis enhanced, owing to work-conditional benefits. The downside of that approach,however, is that upward mobility is impeded, for reasons related to the highmedian effective tax rates (METRs) in the phase-out range of in-work benefitschemes. This is one major factor in the explanation of the unfavourable povertyrecord (in terms of both incidence and persistence) of these liberal welfare states.The more comprehensive continental European welfare states tend to pursue anapproach where employment and benefit dependency are mutually exclusive.Incentives to take up low-paid work are not strong, but, once employed, workersface no great barriers to moving up the earnings ladder. Income transfer schemesare effective in their target of reducing poverty. The situation is not static,however. In the 1990s some countries managed to incorporate elements of allwelfare models in their policies, with successful results.
Overall, we decided that it all comes down to the fine print in the design ofthe welfare state; it is not the welfare state’s size but its internal structure that isimportant. The incentive structure in some benefit systems has the potential tocause adverse economic effects. If the pension system in an ageing population,where labour supply is shrinking, continues to provide incentives for earlyretirement, the result will clearly be waste unless the reduction in productioncapacity can be fully offset by capital.
At this point we should go back to the reasoning outlined in Chapter 1,where we concluded that all societies require a certain overall level of transfersbetween active and inactive people. How much of that is formalized willdepend not only on administrative capacities but also on the society’s goalsconcerning equity and such values as solidarity. These goals may change in linewith economic development, but they are not established primarily byeconomics. We need to understand how the transfer system in itself createspositive or negative economic effects that bear on the achievement of thesesocial targets. The role of social protection analysts, planners and financialmanagers should be to keep potential productive inefficiencies in check.
There is no point in clinging to ideologies and remaining entrenched ineither public or private social protection schemes. Where there is scope formarket provision of welfare-state services and where there are good arguments(not just the commonsense ones) for assuming that the market itself or market-like mechanisms in a public sector may deliver the goods more effectively andefficiently, why not take advantage of that? However, it is a misconception thatmore market means fewer rules. For markets to perform well, governmentsneed to make their targets clear and explicit. Public goals can be achieved with
174
Financing social protection

private means, but this requires governments to be aware of possibleshortcomings and to maintain the capacity to step in and enforce public policywhenever necessary. The ultimate test as to whether public or private provisionis superior should simply be whether the systems achieve their delivery targetsor not, and whether they do it as inexpensively as possible.
Facing the ultimate question as to whether the welfare state will remainaffordable in the future, we argued that there is scope for an extensive welfarestate. Globalization, changing social patterns and ageing populations putpressure on comprehensive welfare states – pressure to modernize outdatedarrangements.33 However, modernizing is not necessarily the same asretrenching. There are no convincing arguments for cutting down on socialexpenditure as long as the schemes are well designed – and taxpayers accept theburden. Willingness to pay depends crucially on whether the transfers areperceived to be reasonably free of waste, since no-one is willing to financesomeone else’s leisure if it increases his or her own tax burden. We cannotafford ‘‘rent-seeking’’ behaviour and waste, but we can afford a welfare statethat provides decent benefits.
A checklist of questions for financial and social policy analysts
If the economic tolerance of a new or old social protection scheme and itsfinancing system is to be tested, then a list of research-leading questionsmight look like this:
1. What is the overall target of the measure: reducing poverty, reducinginequity, reducing government spending?
2. What is the specific social need that the new/old measure isaddressing? Are there more pressing needs at this time? In otherwords, is this measure making the best use of scarce resources?
3. Can similar outcomes be achieved by other economic means (forexample, alternative labour market policies)? In other words, whatwould be the economic opportunity cost if the measure were notintroduced?
4. What behavioural incentive would this measure create for employ-ers, workers and other players in the economy? How would theincentive structure affect the cost of the measure? Would thatincentive affect overall economic performance?
5. Would the country’s competitive position in the global marketplace(or relative to its main trading partners) change, and would thatchange occur in the short or the long run?
6. Which would be more effective and efficient in delivering the benefit,the public sector or the private sector? Which incentives areemployed to achieve efficiency? Can we estimate the cost of thealternative delivery methods?
175
Social protection and the economy

Notes
1 That governments have such ambitions is clear from both historical economic literature and theworks of the major economic scholars of the past two centuries, from Adam Smith to John MaynardKeynes and beyond. Political economics in the tradition of Smith and Ricardo was all about how theeconomy operated and the tools the State could apply to redirect its course. The final decades of thetwentieth century showed how industries could be fostered and shielded by governments until they weremature enough to face international competition, and how governments could help maintain the rightdomestic conditions (labelled ‘‘selective comparative disadvantages’’ by Porter in 1990) to enable thoseindustries to outperform their competitors.
2 See, for example, the table on page 148 of Gillion et al. (2000).3 Ibid.4 Lindbeck (1994, 1997a) describes this process of overshooting in politics and provides common
examples of moral hazard in Sweden.5 The term ‘‘reservation wage’’ describes that wage at which a benefit recipient is ready to give up
his or her benefit and return to work.6 See, for example, Katz and Meyer (1990) for the United States, and Carling et al. (1996) for
Sweden.7 Note that this, in itself, poses no problems as long as the scheme is in actuarial balance; to the
extent that this is not the case, labour supply decisions will be affected, not investment decisions.8 This is a standard text book explanation, derived from Atkinson and Stiglitz (1980), pp. 367–368.9 Auer (2000, p. 94) observes, for example, that ‘‘ . . . in the labour markets of Denmark and Austria,
weak dismissal protection. . . seems to go together with relatively strong income protection at the societallevel. . .’’
10 Lindbeck and Snower (2001) provide a survey.11 Akerlof’s (1970) ‘‘market for lemons’’.12 The concept of a trade-off between equity (equality) and efficiency was introduced by Arthur M.
Okun in 1975 in his essay ‘‘Equality and Efficiency: The Big Tradeoff’’.13 This section draws on earlier work, in particular Doudeijns et al. (1999) and van de Meerendonk
(1998, 2000).14 This ratio is the ratio of the average earnings in the ninth earnings decile and the average earnings
in the fifth earnings decile.15 The methodology is explained in OECD (1996c), pp. 78–79.
Further reading
To find out more about:
. the mechanics of the interrelations between the economy and socialprotection, see:
– Scholz et al. (2000), Annex I, Issue Brief: ‘‘Interdependencies betweenmacroeconomic developments and social protection’’
. the economic effects of pension systems, turn to:
– Gillion et al. (2000), Chapter 13: ‘‘Economic effects’’
. the economics of health care, see:
– Cichon et al. (1999), Issue Brief 1: ‘‘Concepts of health economics’’.
176
Financing social protection

16 Most countries have special allowances for families with children. Our results do not necessarilyapply to other household types.
17 The left-hand panel of Panel B in fact shows the net replacement ratios for working families ofthe type assumed here.
18 Formally, NRI is defined as the ratio of the total increase in the net household income and thetotal increase in gross earnings. In this case, the total increase in earnings equals the total gross earningsthat the non-active partner would receive if he or she was working.
NRI ¼ 100% · ðNI1 � NI0Þ=GE
where:
NI0 ¼ net household income in the starting or reference situationNI1 ¼ net income that the household would have if the non-active partner were to workGE ¼ total gross earnings that the non-active partner would receive if he or she were to work.
19 Antolin and Scarpetta (1998), p. 16.20 See also OECD (1999b), p. 63 and Council of Economic Advisers (1999), p. 143.21 Rust and Phelan (1997); Council of Economic Advisers (1999), p. 149.22 In 1997 the cost of this programme amounted to almost $30.5 billion, of which $6.1 billion was in
the form of a tax credit, regarded as a tax break here. The remainder, $24.4 billion, is a tax credit thatexceeds the tax liabilities of the recipients and is therefore treated as (untaxed) social expenditure(Adema, 2001).
23 Council of Economic Advisers (1999), p. 153.24 Atkinson (1995a, 1995b, 1997).25 In the case of procurement contracts a similar trade-off occurs between rent extraction and
incentives (Laffont and Tirole, 1993).26 Laffont and Tirole (1993) provide an extensive theoretical elaboration.27 AETRs were calculated by taking the tax revenue of a specific income item, such as capital
income, and dividing this by the tax base with respect to that particular income item.28 See, for example, SZW (1996, 2000); van de Meerendonk (1998).29 The EMU (‘‘Maastricht’’) entrance criteria have served as a benchmark for fiscal policies not only
in the EMU area, but in various countries all over the world.30 See also Franzmeyer et al. (1996), who in particular blame the German Central Bank for its
overly rigid stance or – what amounts to the same thing – its excessively narrow focus on the inflationtarget throughout the 1990s.
31 See Cichon 1997a, 1997b.32 From the 1980s to the mid-1990s there was a substantial increase in wage inequality in Europe
and the United States, partly as a result of rising low-wage employment. These developments resulted ina widening of the income distribution (see ILO, 1996).
33 For a more extensive analysis, see ILO (2000a).
177
Social protection and the economy

4THE PUBLIC FINANCE NEXUS ANDRESOURCE MOBILIZATIONSTRATEGIES1
Public outlays on social protection schemes can amount to more than one-thirdof GDP, depending on the country’s state of development, the age compositionof its population, and other characteristics of its employment and socialstructure. Financing transfers of this magnitude inevitably affects the system ofpublic finance: either directly, when governments pay benefits and finance themfrom general revenues or through contributions, or indirectly, when privateinstitutions pay benefits and finance them through contributions that are part ofthe overall tax and contribution burden of citizens.
This chapter sets out to explore the manifold direct and indirect linksbetween social protection financing and public budgets of which financialanalysts have to be aware. Even in countries where they are organized throughindependent parastatal organizations or where parts of their delivery andfinancing are contracted out to the private sector, social protection transfersaffect overall fiscal policy. Ultimately, they are all financed from the sameresource base: the income of households and the profits of enterprises. Theshare available for social protection financing is definitely finite and is limitedto a certain share of the overall resource base. This nexus is the backgroundagainst which we will be exploring the possibilities of developing nationalstrategies aimed at mobilizing resources for the social protection sector.
4.1 SOCIAL PROTECTION IN NATIONAL
AND GOVERNMENT ACCOUNTS
In the United Nations System of National Accounts (SNA), the most frequentlyused account structure,2 public social benefits – whether financed directly bygovernment or by autonomous public bodies – are regarded as governmentexpenditure and appear in the general government accounts. These include allincome and expenditure of the government sector; they thus cover income and
178

expenditure of central, state or province (if applicable) and local governmentsas well as some parastatal autonomous organizations such as social securityinstitutions.
All or a subset of these accounts can be combined into one consolidatedaccount. International Monetary Fund (IMF) financial statistics, for example,provide consolidated accounts for central governments that combine the latter’sbudgetary sphere with nationally operating social security schemes.3 Con-solidation does not simply mean adding up all income and expenditurecomponents of the various accounts for the different benefit levels since theaccounting levels (or levels of government) are often connected by a complexsystem of transfers. State governments might receive transfers from centralgovernment while at the same time subsidizing local governments. Socialsecurity institutions might receive government transfers or they might transferexcess contributions to the central government account. The different transfersbetween government levels cancel each other out when a summary account isestablished for the overall government sector.
The balancing item of the consolidated (central) government account orgeneral government account (which is technically called ‘‘net borrowing or netlending’’, or ‘‘cash balance’’, or also ‘‘public sector borrowing requirement’’, inthe terminology used in the United Kingdom), indicates whether the generalgovernment sector is in surplus or in deficit. The component accounts withindifferent government levels, including the social security account, help to tracethe source of a deficit or a surplus. This means implicitly that current deficits insocial security institutions are part of national deficit.
A surplus or deficit measures the difference between current income andexpenditure. In the case of short-term cash benefits (e.g. maternity and sicknessbenefits) this approach might provide a full picture of the financial status of asocial security programme. The income and expenditure of short-term benefitschemes are normally expected to balance within a year. Social securitypension schemes whose accounts are in balance do not contribute to nationaldeficits in terms of the consolidated general government account. However,balanced annual accounts do not necessarily signal a sound financial status forthe pension scheme, which might still be underfunded in the long run. Thus, byimplication, current national accounts also fail to provide a full picture ofthe government’s financial obligations in respect of pension scheme financing.The focus on annual balances is a major deficiency of current national accountsfor assessing government obligations for all social security benefits that mayaccrue substantial reserves or potential future debt – primarily social securitypensions or public service pension schemes.
This standard international accounting practice indicates that in the logic ofthe SNA and IMF International Financial Statistics, social security benefitsprovided through public institutions or lower-level government agencies areregarded as government expenditure in the same way as benefits organizedand financed directly by central government. In effect, from an accounting
179
The public finance nexus and resource mobilization

perspective the provision of benefits through autonomous social securityschemes is considered as being merely a different form of governmentorganization or provision. The IMF and United Nations accounting methodssubsume social security contributions under tax revenues.
However, current national accounting usually does not cover the fullnational expenditure on protection, both public and private, or the financingthereof. Incomplete accounting of liabilities and benefits is the second majorshortcoming of standard national accounts with respect to pension and socialsecurity accounting. The provision of benefits by private entities such asemployers, private occupational pension schemes and life insurance companiesis not captured in government accounts. Most importantly, this also concernspension or health care provisions mandated by law but administered, as inSwitzerland, by private insurance companies. This effect not only distortsinternational comparisons of national social expenditure based solely ongovernment accounts but might also lead to an underestimation of total long-term potential government liabilities for the financing of social benefits. Someof these liabilities are implicit and contingent, such as government guaranteesfor private pension schemes, which only lead to concrete expenditure whenprivate schemes fail. These are difficult to account for under any accountingsystem. Others are implicit and hidden, such as tax subsidies for private pensionand health care schemes, which represent income forgone by the government(tax expenditures) but should in fact be counted as an implicit part of overallgovernment pension or social security expenditure.
This does not mean that the revenue and outlay of non-public pensionschemes are unaccounted for in standard national accounts: individuals’contributions to funded private schemes, and the benefits they receive, are to befound in the accounts of household income and expenditure, while employers’contributions are to be found in the production and savings accounts of theprivate sector. What it does do is to underline the dangers of comparing the sizeof the welfare state solely on the basis of government accounts, especiallybetween countries that may have very different proportions of social securitybenefits derived from public and private sources.
In principle, the accounts for all identifiable social protection expendituresand revenues can only be captured in national social expenditure accounts(social expenditure budgets) used in countries of the European Union.4 They areessential tools for the overall management of the social sector at a macro-economic level. Social budgets compile expenditure for all national socialtransfers, including the expenditure for benefits financed and administeredby private entities but mandated or promoted by law or agreed upon in collectiveagreements between employers and workers. In addition to pensions andother long-term benefits, these include health care and short-term cashbenefits, as well as goods and services in kind. The accounts relate them tothe totality of all sources of financing, which include mandatory social securityand private insurance contributions, voluntary contributions, out-of-pocket
180
Financing social protection

contributions, employer liabilities and imputed contributions and financingthrough taxes.
Only when such a comprehensive social accounting is established andprojected under realistic economic and demographic assumptions can the long-term sustainability of the overall national social protection system (NSPS) beevaluated. Moreover, only then can one assess to what extent the governmentbudget will be affected by the financing of social transfers.5,6 Some countries alsoinclude the estimated tax revenues forgone through tax allowances: in Germany,for example, indirect fiscal benefits accounted for 7.6 per cent of total socialexpenditure in 1993.7 The methodology is fully explained in Scholz et al. (2000).
In many countries (e.g. Turkey) the government covers or has for a long timecovered the deficit of social security institutions. This budget link is more orless automatic. However, it is not the only way of associating governmentbudgets and social security budgets, as we will see in the following sections.
4.2 FINANCIAL LINKS BETWEEN SOCIAL PROTECTION
SCHEMES AND GOVERNMENT ACCOUNTS
There are a number of ways in which social security accounts and governmentaccounts are explicitly or implicitly linked, and in which social protectionfinancing affects the government’s short- and long-term financial positions.
There are essentially three ways of organizing the delivery of socialprotection benefits:
. government delivery, where benefits are provided through governmentagencies or departments;
. public institutional delivery, where benefits are provided by autonomouspublic institutions; and
. private delivery, where benefits are provided by private entities (privateinsurance schemes, occupational pension schemes, and employers).
There are also three sources of financing for social protection schemes:
. taxes, where benefits are financed or co-financed simply by allocations fromgeneral revenues or earmarked taxes;
. social security contributions, where benefits are paid by mandatorycontributions collected from employers and workers (this includesmandatory contributions to private pension, health care or accident schemesthat are charged as a percentage of insurable earnings); and
. private sources, such as private insurance contributions or imputedcontributions attributed to an employer, or to employees, who financepensions directly out of the current income of a company or through forgonewages paid on the basis of collective agreements or legal obligations(entirely voluntary individual financing is excluded here).
181
The public finance nexus and resource mobilization

Table 4.1 lists some of the main instances of the possible combinations ofbenefit provisions and sources of financing.
Apart from government delivery-tax financing for social assistance, theincome of most schemes comes from a mix of different sources. General taxrevenues are often a major source of income, even in systems that are notpredominantly tax financed. In many cases, government resources flow in theform of open or hidden subsidies to national social insurance schemes, andthere are even instances where they flow to the accounts of private insurancecompanies, for example when governments contribute to privately managedpension or health care schemes on behalf of their own employees, or whenthey grant tax concessions to employers or workers contributing to a privatepension scheme.
At the same time, not all of the current income of social insurance schemes,notably pension schemes, may be used to finance concurrent pensions.Resources flow from pension schemes to the private sector or governmentaccounts when social insurance or private insurance reserves are lent togovernments or private companies.
As a result there are many explicit or implicit, conditional or unconditional,recurrent or occasional transfers of financial resources between governmentaccounts and social protection schemes, even if the latter are officiallyindependent.
4.2.1 Financial flows from social security schemes to
government accounts
The debate about public deficits and high overall public spending on socialprotection may hide the fact that some government budgets have benefited fromthe existence of national pension schemes. Young pension schemes normallyproduce large surpluses in their early years since that is a period when oftensubstantial contributions are collected but few, if any, pensions are paid. Inschemes with direct government provision and earmarked financing forpensions (e.g. through payroll taxes), these surpluses might simply be absorbedinto the general government budget. Social security pension schemes inmany Central and Eastern European countries, for example, for many yearstransferred surpluses into the general government account. The volume ofmoney collected through the high social security contributions levied onthe wage funds of enterprises bore no relation to present or expected futurebenefit expenditures. Social security contributions were thus simply anotherform of tax.
Also, young pension schemes operating under the social insurance model ofpublic provision accumulate substantial reserves. These reserves must beinvested. Many schemes invest in government bonds, either out of choice orbecause they are forced to do so (by law or through the lack of functioning
182
Financing social protection

Table 4.1 Combinations of types of social protection benefit delivery and financing in selected national socialprotection arrangements
Government delivery Public institutional delivery Private delivery
Tax financing (1) Social assistance schemes:almost everywhere
(1) Social assistance schemes(2) Health care schemes
(1) Social assistance schemes(2) Health care schemes
(2) Health care schemes:national health servicesschemes (United Kingdom,some former British colonies),public service schemes(Scandinavia);
(3) Pension schemes:e.g. Sweden (basic pensionguarantees)
(3) Pension schemes: second-tierpension schemes for publicservants, e.g. United States
National health insuranceschemes (e.g. Canada);
(3) Pension schemes:e.g. Denmark (first tier),Australia, South Africa(social assistance scheme)
Contributionfinancing
(1) Social assistance schemes (1) Social assistance schemes (1) Social assistance schemes
(2) Health care schemes (2) Health care schemes: all socialinsurance schemes in Latin America(e.g. Mexico), Europe (Austria,Germany, France), Asia (Thailand)and schemes operated by socialinsurance in French-speaking Africa
(2) Health care schemes: mandatedprivate insurance in Switzerland
183
Th
ep
ub
licfi
nan
ce
nexu
san
dre
so
urc
em
ob
ilizatio
n

Table 4.1 (cont’d)
Government delivery Public institutional delivery Private delivery
(3) Pension schemes(e.g. United States,Cyprus, Canada, Ireland)
(3) Pension schemes: all social insuranceschemes in Latin America(e.g. Mexico), Europe (Austria,Germany, France), Asia (China) andschemes operated by social insurancein French-speaking Africa and someEnglish-speaking countries(e.g. Ghana), also Sweden(basic pension guarantees)
(3) Pension schemes: Switzerland;Australia (mandated secondtiers), Chile (mandated savingsschemes)
Financing formprivate sources
(1) Social assistance schemes(2) Health care schemes(3) Pension schemes:
some optional second-tierpension schemes forgovernment employees
(1) Social assistance schemes(2) Health care schemes (optional
benefits in some social insuranceschemes)
(3) Pension schemes (optionalbenefits in some social insuranceschemes?)
(1) Social assistance schemes(2) Health care schemes: private
insurance in United States andsome Caribbean countries
(3) Pension schemes: e.g. Germany,France (second-tier schemes)
Source: United States Social Security Administration.
184
Fin
an
cin
gso
cia
lp
rote
ctio
n

financial markets). In many countries these investments have been devalued byhigh inflation rates or have earned lower than market interest rates.8 In othercases governments have simply forced the scheme to write off government debt.In all these instances social security pension schemes subsidized governmentbudgets by accepting a low interest rate, write-offs or no or negative realinterest rates. In such cases social security contributions are simply anotherform of tax helping to finance current government expenditure. These types ofimplicit transfers from a social security scheme to the government budget areoften not directly visible in government accounts.9
Box 4.1 describes the relationship between the government budget and theSocial Insurance Fund in Cyprus during the 1990s, when the cash flow from thescheme to the government turned negative.
Box 4.1 Links between government budget and the Cyprus Social
Insurance Fund
The information given here draws on the findings and observations of arecent ILO actuarial valuation of the country’s social insurance scheme(ILO, 2000d).
Box table 4.1.1 describes the development of the net cash flowbetween the government budget and the finances of the Cyprus SocialInsurance Fund which provides pensions, short-term cash benefits andunemployment benefits. The net cash flow results from the followinglinks between the budget of the Fund and the government: the schemeinvests its reserve almost exclusively in government bonds; thisrepresents a positive cash flow for the government, giving it access tocapital funds; on the other hand, negative cash flows result from the factthat the government must contribute to the scheme by way of its generalsubsidy, which amounts to about 4 per cent of total insurable earnings,and by way of its contribution as an employer; it also has to pay intereston money borrowed from the scheme.
The net cash flow became negative in 1989 and went on increasingeach year, as can be seen in box table 4.1.1. What the table shows isthat in practice the government simply pays the difference betweenthe scheme’s total expenditure and the contribution income from theprivate sector. That cash-flow relationship cannot be identified whenreading the law. The law simply regulates the government’s financingresponsibilities vis-a-vis the Fund, namely paying a general subsidy andpaying contributions as an employer. The financial regulations requirethe scheme to invest in government bonds and the government topay a certain interest rate, which has a fixed relationship to theLombard rate.
Without further increases in the present combined contribution rateof 16.6 per cent (including government contribution) for the basicand supplementary tiers of the system, the government subsidy will
185
The public finance nexus and resource mobilization

4.2.2 Flows and links between government accounts
and social protection schemes
Direct government involvement in financing social protection is not limited tofull financing of benefits as found in the basic pension system of theNetherlands or the National Health Service (NHS) in the United Kingdom, forexample. Governments may also subsidize social security pension schemes
continue to grow. In the case of Cyprus – and in contrast to many othercountries – this does not come as a surprise to the government as itcommissions regular actuarial reviews and is fully aware of cash-flowprojections for the coming decades. When the scheme was conceived inits present form in the early 1980s, the government made a consciousdecision to borrow from the scheme while the country was entering acrucial phase of its economic development. It was aware that at somepoint the scheme’s investments in government bonds had to be paidback. The options open to the government – currently discussed in thetripartite advisory board – are either to increase the contribution rate andbuy some more time before the start of the payback period, or simply tocontinue increasing net payments to the Fund.
Box 4.1 (cont’d)
Box table 4.1.1 Net cash transfers between the government budgetand the Cyprus Social Insurance Fund, 1988–97(in thousands of Cyprus pounds)
Year Positive cash flow Negative cash flows Net cash flow to
the government2
New loans granted
to the government
by the scheme1
General
government
subsidy
Contribution of
the government
as an employer
Interest
payments
on borrowed
money
1988 64 969 26 417 16 174 21 889 489
1989 72 488 29 005 17 406 26 390 �313
1990 82 628 32 548 19 295 31 273 �488
1991 86 324 34 950 20 891 36 651 �6 168
1992 104 747 39 453 22 001 42 912 381
1993 123 247 49 634 26 163 52 337 �4 887
1994 141 643 56 204 31 918 61 239 �7 718
1995 146 213 59 108 30 683 70 736 �14 314
1996 155 067 63 826 34 340 80 934 �24 033
1997 160 816 67 393 38 970 91 899 �37 446
1 Equal to total income of the scheme minus scheme’s expenditure.2 Equal to income from private sector contributors minus scheme’s expenditure.
Source: ILO (2000d).
186
Financing social protection

through a general subsidy (which is the case in Cyprus, as we have seen).In other countries government subsidies transfer specific amounts orpercentages of total benefit expenditure to compensate the scheme for specifictasks considered to be those of general government: in Germany, for example,the Ministry of Finance transfers a fixed percentage of benefit expenditure tosocial insurance pension schemes. Governments also often contribute to socialsecurity pension schemes or to private pension schemes, as is the case inSwitzerland, through employer contributions for their own employees.10
Public financing of transition costs – which fall due when a country ischanging its social security pension scheme from a pay-as-you-go (PAYG) orpartially funded defined-benefit (DB) scheme to a funded defined-contribution(DC) scheme – is another form of an explicit government financing of anational pension scheme. The government could finance these additionalobligations through immediate tax increases, by using the proceeds fromprivatization, borrowing on the capital market, or even borrowing from the newpension scheme which is accumulating substantial reserves in its early years; orit could issue recognition bonds, which are bonds that honour the pension rightsof beneficiaries from the old pension scheme. Recognition bonds thus transforma government debt (which is equivalent to the current value of all pensionrights of all present pensioners, as well as the acquired rights of all contributorsat the time of the reform) into a series of annual transfers from the budget intothe new pension scheme.
The use of borrowing, or of recognition bonds, spreads the financing of thetransition over several decades, or even over a number of generations of insuredpersons. In this context it should be noted that the issuance of recognitionbonds, or the promise to finance a defined transitional cost, transforms aconditional government liability into an unconditional one. Pension promisesthat are underwritten by governments, or even directly financed by them, aregenerally conditional as the related or contingent government liabilities are,in practice, often adjusted to fiscal and financial constraints. Bonds, or otherforms of financing and defined debt, are unconditional liabilities. Such switchesmight be good policies for a variety of non-fiscal reasons, but they greatlyreduce the governments’ flexibility in dealing with future financial situations.The limitation of future financial flexibility becomes even more severe whengovernments issue inflation-indexed bonds in order to enable the privateinsurance industry to issue price-indexed annuities.
Table 4.2 shows the degree of general revenue financing within the overallnational public social protection scheme11 in selected countries. The countrieshave been selected according to their system of providing and financing basicpension benefits, ranging from schemes which come under the system ofgovernment provision (Australia, Netherlands, United Kingdom) and thosedominated by social security provision through autonomous public institutions(Austria, Bulgaria, Egypt) to schemes dominated by the private provision model(Chile). They all have some form of mixed financing system. Even in the
187
The public finance nexus and resource mobilization

United Kingdom, which is often cited as the standard case for general revenuefinancing of social protection, social security contributions account for aboutone-third of total social security financing. In Chile, with its emphasis onprivate financing, in the late 1990s current benefits were overwhelminglyfinanced from general revenues. This is because the government collectedcontributions only from those who decided to remain in the old system. Thecontributions were not sufficient to cover the benefits awarded on the basis ofthe old law and those benefits were therefore financed from general revenues.
Box 4.2 shows how transition costs can affect government’s long-termfinancial situation through the example of Chile, the first country to changefrom a DB social insurance pension scheme to a mandatory DC scheme in theearly 1980s.
The details in table 4.2, based on IMF government account data, arelimited to measuring explicit financial flows into the social sector, andhence into basic public pension schemes. Government accounts generally donot display indirect or implicit government liabilities for the financing ofpublic and private pension schemes, which are discussed in the followingsection.
Table 4.2 Simplified central government accounts (as % of GDP), selectedcountries, mid-1990s
Austria Australia Bulgaria Chile Egypt Netherlands UnitedKingdom
1994 1995 1995 1995 1993 1995 1995
Expenditure
– Social assistanceand social security
18.8 9.2 10.5 6.4 3.0 18.8 13.0
– Health 5.5 3.7 1.4 2.3 0.7 7.4 5.8
– Other 16.2 14.5 29.6 10.5 23.7 24.6 23.0
Total 40.5 27.4 41.6 19.2 27.4 50.9 41.8
Revenues
– Taxes 18.8 22.2 20.3 16.5 14.2 23.8 27.3
– Social securitycontributions
14.1 0.0 7.7 1.3 2.6 19.2 6.2
– Pensions 0.0 0.0 0.0 0.0 0.0 0.0 0.0
– Other income 3.3 2.5 8.4 3.8 13.8 3.1 3.0
Total 36.2 24.6 36.4 21.5 30.6 46.1 36.5
Surplus/Deficit �4.2 �2.8 �5.2 2.3 3.2 �4.7 �5.3
General revenueshare of financingof the social sectorin % of total socialexpenditure
41.98 100.0 35.36 85.05 28.86 26.92 66.83
Source: IMF data.
188
Financing social protection

Box 4.2 Long-term government financial commitment to a privatized
pension scheme: The case of Chile1
Chile’s famous pension reform replaced the DB social insurance pensionscheme in 1980 with a mandatory savings system. Contributors can joina pension fund (Administradoras de Fondos de Pensiones, or AFP) of theirchoice and pay 10 per cent of their insurable earnings into individualaccounts. These savings are invested by the AFP and the balance ofthe individual accounts is converted into pensions either through thepurchase of annuities from life insurance companies or through theso-called programmed withdrawal where the member deducts a certainamount calculated on the basis of the remaining balance and his/her lifeexpectancy. Invalidity and survivor protection is purchased in addition, inthe form of collective private insurance contracts.
The government continues to play a vital role in the system as afinancier of transition costs and guarantor of a minimum old-age income.
Its role as financier of transition costs basically consists in coveringthe deficit of the old DB scheme that is being phased out but still payspensions to people already in or near retirement when the new schemewas introduced. In addition, the government finances recognition bonds.These represent the current value of the pension entitlements earnedunder the old system. They are basically a paper value that is adjustedfor inflation and earns a guaranteed real rate of return of 4 per centannually. Payment on these bonds only falls due when the recipientretires.
As the guarantor of a minimum old-age income, the government hasto protect a minimum rate of return on individual accounts (even thoughthe greater part of that risk is covered by legally required contingencyreserves of the AFPs) and acts as ultimate underwriter if private insurancecompanies that sold annuities or are paying invalidity pension becomeinsolvent. The main part of the guarantee, however, consists in payingminimum pensions to people who after 20 years of contributions do nothave enough savings to purchase an annuity at a minimum pension level.In addition, the government pays basic social assistance pensions to oldnon-qualifiers. Its total financial commitment to the national pensionsystem is summarized in box table 4.2.1.
There is some uncertainty as to when the actual burden due torecognition bonds and the deficit under the old system will peak andbegin to recede, but it must be assumed that for the next decade or twosome transition cost will persist.
At the same time the AFPs are building up reserves; these passedthe level of 50 per cent of GDP in 1998. The interest on savings of thatmagnitude would theoretically be high enough to finance most of thenational pension deficit. In any case, the total pension debt accumulatedsince the reform exceeds the present level of AFP savings. The futurefiscal cost of the system will depend primarily on the long-term cost ofthe minimum pension provisions and the social assistance pension
189
The public finance nexus and resource mobilization

scheme. These costs in turn consist of explicit social guarantee cost butalso implicit underwriting cost covering the potential failure of theprivate AFP schemes. If the latter fail to achieve high populationcoverage and high contribution density because of deficient enforce-ment of membership obligations, then the government’s obligationswill increase accordingly. One might well ask whether Chile could notafford to convert the contingent and uncertain liability for social assis-tance and minimum pensions into a predictable explicit liability byintroducing a universal anti-poverty minimum first-tier pension scheme.
Note
1
There is extensive documentation on the pension scheme and the effects of the reform. The
information in the box was extracted from Arenas de Mesa and Benavides Salazar (2003) and
Gillion et al. (2000).
Box 4.2 (cont’d)
Box table 4.2.1 Chile: Social pension deficit (as % of GDP), 1981–2000
Year Old pension
scheme
Military
pensions
Social
assistance
pensions
Recognition
bonds
Minimum
pensions
Total
1981 1.6 2.0 0.2 0.0 0.0 3.8
1982 3.9 2.1 0.3 0.1 0.0 6.4
1983 4.4 2.1 0.4 0.2 0.0 7.1
1984 4.7 2.2 0.5 0.2 0.0 7.6
1985 4.0 2.0 0.5 0.2 0.0 6.7
1986 4.0 1.9 0.5 0.3 0.0 6.7
1987 3.5 1.7 0.5 0.4 0.0 6.1
1988 3.2 1.5 0.4 0.4 0.0 5.4
1989 3.4 1.3 0.3 0.4 0.01 5.4
1990 3.2 1.3 0.4 0.5 0.01 5.4
1991 3.2 1.3 0.3 0.5 0.01 5.3
1992 3.1 1.2 0.3 0.5 0.01 5.1
1993 3.1 1.3 0.3 0.6 0.01 5.3
1994 3.0 1.2 0.3 0.7 0.01 5.2
1995 2.7 1.2 0.3 0.7 0.02 4.9
1996 3.0 1.2 0.3 0.7 0.02 5.2
1997 2.9 1.2 0.3 0.8 0.02 5.2
1998 3.1 1.2 0.3 0.9 0.03 5.5
1999 3.1 1.3 0.4 1.1 0.04 5.9
2000 3.1 1.3 0.4 1.1 0.05 6.0
Average 1981–2000 3.3 1.5 0.4 0.5 0.0 5.7
Source: Arenas de Mesa and Benavides Salazar (2003).
190
Financing social protection

4.2.3 Indirect subsidies and contingent liabilities
In addition to direct financial costs, governments may bear indirect costs or beliable for potential costs. When government agencies administer socialprotection benefits directly they often bear part of the administrative costwhich might not be clearly attributed to the administration of pension benefits.If benefits are administered by the ministry of labour and social affairs (as inCyprus), part of the ministry’s administrative cost should normally also befinanced through social insurance contributions. If this is not the case, thegovernment supports the scheme through a further indirect transfer.
If delivery of benefits is contracted out to private entities (as in the case ofAustralian occupational pension schemes, AFP pension funds in Chile, ormandatory health insurance coverage in Switzerland, among others), theprovision of benefits still creates costs for the government as it has to superviseand regulate these private bodies (for example through the superintendent ofpension funds in Chile). Another form of indirect government co-financingof national social expenditure consists in granting tax concessions to individualsor employers who join private occupational protection schemes.
It is often overlooked that governments frequently subsidize private healthcare financing schemes. In most countries with an explicit public sectorhealth care infrastructure, private insurance schemes use public facilities. Thefacilities concerned charge user charges, but these often do not reflect the fullcost of the case.12 In many developing countries user charges cannot evenreflect the full cost because (i) cost accounting in hospitals and other publicfacilities is often rudimentary at best, and (ii) most of the people who do notbelong to the fortunate minority that enjoys private or public insurancecoverage would not be able to afford full-cost charges. Community-basedschemes that are springing up in many developing countries can generallysurvive only because governments or local authorities sell services to them atsubsidized prices. There are various other forms of indirect subsidization as, forexample, when the medical consequences of work accidents, an originalemployer liability, are treated in government facilities.
Yet another form of government participation in the financing of benefits isbecoming increasingly important, especially after reforms which mandatedprivate entities to carry out some of the national pension provision. This is thegovernment’s role as financial guarantor, or ultimate underwriter, of socialsecurity and private pension schemes (see the case of Chile, box 4.2). Thiscontingent liability through underwriting of social security or private benefitschemes can take several explicit and implicit forms. An explicit form occurswhen the social insurance law stipulates that the government covers potentialdeficits of a social security scheme. Guarantee payments of this type exist inseveral European countries (e.g. Bulgaria). In other cases of direct guarantees,governments might guarantee minimum benefit levels by complementing socialsecurity or private pension benefits, which provide a minimum benefit level to
191
The public finance nexus and resource mobilization

each beneficiary who meets certain conditions (as is the case of the pensionscheme in Chile). These benefit guarantees are sometimes called conjecturalliabilities (see Heller, 1998). They are affected by systemic declines in the priceof assets of private savings schemes, or liabilities associated with drops in assetprices triggered by market turmoil.
An implicit guarantee is given if, as a result of public pressure, thegovernment simply must bail out non-performing private or social securityschemes: Bag-Kur, the public system for the self-employed in Turkey, is onesuch example. A form of indirect bailing out of failing public and privateschemes is the increased payment of social assistance benefits or publicsubsidies if private systems are not in a financial position to pay benefits in full,or when benefits are provided at a low level. Guaranteeing an adequateminimum consumption and hence income of pensioners is unavoidable for mostgovernments. Pensioners in ageing societies make up an increasing proportionof voters. Most elected governments need a good proportion of their votes andthus will not be able to ‘‘walk away’’ from the ultimate responsibility tosafeguard their income either explicitly or implicitly.
Through financial guarantees governments provide de facto reinsurance forpublic and private social transfer systems. Thus, even without directly financingpension benefits governments underwrite multiple risks, including:
. unforeseen negative developments in system demographics and economics;
. insufficient returns on investments (lower-than-expected interest rates andfalling asset prices);
. bad management; and
. failing political support for the existing systems leading to changes in theregime.
These risks may be difficult to predict. However, they embody substantialfinancial commitments by the government. If the latter were a private sectorfinancial management company, these commitments would have to beaccounted for by recurrent reinsurance premium payments. It can be concludedthat the direct amount of social expenditure in government budgets to befinanced from general revenues is higher under government direct delivery thanunder the other models. However, under the indirect delivery models,governments may face substantial hidden fiscal risks. Indirect delivery ofbenefits also means that the government’s ability to manage the financialdevelopment of the main national pension benefit may be more limited thanunder the direct delivery pattern. Under the private delivery model thegovernment share in the financing of benefits could in theory be reduced tozero, but the implicit – and to a certain extent unpredictable – liabilities, someof which stem from capital market risk that is largely outside governmentmanagerial control, are bigger than under the public institutional delivery ofpensions.
192
Financing social protection

Standard government accounts and other commonly used ancillaryaccounts fail to record indirect subsidies and contingent liabilities. Thismight be largely due to technical difficulties involved in quantifying theseliabilities. Yet their quantification should be part of the design of a rationallong-term overall public finance strategy incorporating a social securityfinancing strategy.
4.3 EFFECT OF SOCIAL PROTECTION FINANCING ON
PUBLIC DEFICITS AND DEBT
All types of explicit public expenditure, indirect subsidies and contingentgovernment liabilities, including those for publicly guaranteed or financedsocial protection schemes, can produce annual deficits in institutional orgovernment accounts. Since annual deficits are components of debt, thediscussion here focuses on the concept of public debt caused by socialexpenditure. It centres on the effect of direct expenditure, as indirect subsidiesand contingent liabilities are generally not, or not completely, recorded ingovernment accounts. It should be sufficient to clarify the main nature of theimpact of social protection financing on public deficits and debt.
It has become common practice to distinguish between explicit and implicitdebt, in particular with regard to pensions, although both notions are fraughtwith definitional and methodological problems. The two phenomena areanalysed here separately.
4.3.1 Explicit debt
The above analysis of the links between current government accounts andpension financing indicates that any explicitly recorded expenditure position ina negative consolidated government account contributes to a deficit and henceto public dissavings or the creation of public debt. In the same way, deficienttax collection, attributable either to a poor design of the tax revenue structureor to tax evasion, contributes to deficits, and hence also to public dissavingsor debt.
If a social protection scheme (whether government-executed or adminis-tered by an autonomous public institution) has its earmarked resources either inthe form of social security contributions or earmarked taxes, annual positive ornegative balances can be calculated. Consequently, it is possible to calculateexplicit debt accumulated in the past. Debt accumulation can be rapid if therevenue shortfall is large. It should include interest that the governmentmust pay to lenders to finance the accumulating debt in case of an overallnegative government budget, or the forgone interest income that it would earnon the total accumulated amount of pension subsidies. In the latter case, thegovernment could have invested the resources elsewhere and would have
193
The public finance nexus and resource mobilization

earned interest on those investments had the pension scheme not requiredsubsidies. In the case of Turkey, the ILO estimated in 1995 that unless thecurrent financing practice was changed, debt (largely for pensions) wouldaccumulate within one decade from 1.7 per cent of GDP in 1995 to 23 per centof GDP in 2005.
If a social security pension scheme is financed from general revenues, noannual deficit or surplus – and consequently no social protection reserve ordebt – can be calculated directly. The only way to introduce the notions ofdeficits and debt would be to fix a certain arbitrary level of maximumacceptable expenditure – codified, for example, in the form of explicit budgetallocations, and to regard positive or negative past deviations from thatbenchmark as a (normative) deficit or surplus. In the same way as in the caseof schemes with earmarked revenues, these deficits can then be linked to theoverall national public surplus and deficit and hence, in a longer-term view, tosavings or debt.
However, even in the case of a scheme with earmarked resources and anegative balance, earmarked taxes or contributions might never have beendesigned to cover the full social security pension cost; general revenuesubsidies might always have been foreseen (as is the case in Cyprus or theFarmers Pension Scheme in Germany). This also applies to the provision ofpensions through public institutions where, when the contribution rates weredetermined, government subsidies were always envisaged. In this case, singlingout explicit social protection deficits as a unique or major source of generalpublic debt is politically misleading.
4.3.2 Implicit debt
While explicit public debt is a retrospective concept summarizing real pastdeficits, implicit debt is a prospective concept. It is generally only applicable tolong-term benefits (pensions), some parts of health expenditure and long-termcare. Short-term benefit schemes are normally expected to balance their bookswithin a fiscal year, so that no future implicit debt can accrue. Implicit debt isthe result of a summation of expected future deficits. Depending on the source,the term is often defined in two different ways:
Definition 1
Implicit social security pension
debt ¼ Present value of all future benefits to presentpensioners and all accrued rights of currentcontributors/taxpayersminus
the amount of the initial reserve of the pension scheme;
194
Financing social protection

Definition 2
Implicit social security pension
debt ¼ Present value of all future benefits to present andfuture pensioners
minus
the amount of the initial reserve of the scheme
minus
present value of all expected future contributionpayments of present and future insured personsat a constant initial contribution rate.
The first definition follows a strict private insurance concept, whereas thesecond is a modification that follows a public finance approach. The first hasbeen used by the World Bank in one prominent publication (1994, pp. 139–140),while the second is preferred by the ILO and the IMF and is commonly usedby the World Bank in its analysis of client countries (see Heller, 1998, p. 17).
In the first definition, an amount is calculated that (except for the initialreserve) is equal to the termination reserve, which is the reserve that one wouldneed to have available in order to settle all financial obligations to presentpensioners and present contributors with accrued rights according to the presentrules of the scheme.13 The level of the termination reserve can be regarded asthe full funding level of the scheme. This amount thus also equals the resourcesthat would be required to close down a social security scheme in order to start anew one while honouring all past commitments. No major social securityscheme in the world has a termination level of reserves.
For social security schemes, which are not secured exclusively by amountsof invested financial resources but rather by societal commitments and contractsbetween generations, this level of funding is not necessary. This notion of debtmay be useful for some intergenerational accounting, for example for deter-mining the amount of contributions that would be required in the future to payfor pension liabilities already accrued, but it has little relevance as an indicatorfor the overall financial status of a social protection scheme.
The second definition assumes that promises are made to all present andfuture generations of pensioners and contributors, that these promises must behonoured and protected by law, and that present and future contributors willalways have to pay their dues to finance the system. These assumptions havesometimes proved to be invalid, as countries have failed to fulfil their socialsecurity commitments. For countries with sound governance, however, thisdefinition describes the gap between expected future expenditure and revenues,provided that present and future contributors continue to contribute at presentlylegislated contribution rates.
In tax-financed systems the second definition can only be applied by proxy.It must be assumed that the present level of government resources used to
195
The public finance nexus and resource mobilization

finance benefits (measured in relative terms, for example, as a percentage ofGDP) will stay constant throughout the foreseeable future and that risingpension expenditure (also in relative terms) will create potential annual pensiondeficits, leading to an accumulation of implicit pension debt. For the ministry offinance this potential financing gap is an indicator of its potential additionalfinancial liability in the financing of the pension scheme.
It must be emphasized that the term ‘‘implicit debt’’ (second definition)does not describe a real financial liability of the government. Due to itsprospective nature it only describes potential debt, which is merely an indicatorof a financial risk for the government rather than a real financial obligation.This debt might never occur if – by practising good and pre-emptivegovernance – the government is always able to adjust the contribution ratesor the tax allocation for the financing of benefits, or to reduce benefitexpenditure. Sweden’s pension reform of the 1990s, for example, will mostlikely substantially reduce potential government debt. Another open question iswhy the concept of implicit debt should be applicable to unfunded publicpension schemes but not to other tacit promises of a State, for example publichealth care, education and defence spending, or un-built geriatric hospital wardsor nursing homes in ageing societies. All of the latter will have to be financedby future taxpayers and similarly constitute unfunded state liabilities.
The concept of implicit pension or social security debt is frequentlymisused in pension reform debates. It is often argued that a large implicit debtusing the first definition is a problem that should be resolved by a change insocial security financing. However, that is only correct if there is a large debtunder the second definition. If there is a large implicit debt under the firstdefinition but financing has been agreed upon by society and ratified inlegislation so that there is no implicit debt under the second definition, there isno social security financing problem. It is thus intellectually questionable tooffset transition costs triggered by a change of pension financing systems (forexample from a PAYG defined-benefit to funded defined-contribution system)against implicit pension debt, as is done in many national reform debates, sincefiscal transition costs are real or unconditional whereas implicit debt occursonly if governance fails.
Figure 4.1 shows an estimate of the emerging financing gap between socialsecurity pension expenditure (measured as a percentage of GDP) and thepresent financing level for all OECD countries. In 1990 OECD countries spentan average of 8.5 per cent of GDP on pensions. An ILO model projects that thisproportion will increase to 15.2 per cent of GDP by 2050.14 The graph assumesthat the present level of financing as a percentage of GDP would be maintainedthroughout the 60-year projection period.
The implicit pension debt under the second definition can be calculated onthe basis of emerging annual social security deficits. Figure 4.2 shows the totalimplicit debt (assuming the present financing level) in 13 selected countries forwhich data could be obtained, thereby permitting long-term projections.
196
Financing social protection

Figure 4.1 Potential pension deficit (as % of GDP), OECD, 1990–2050
Source: ILO projections.
Figure 4.2 Estimated potential implicit pension debt (% of GDP), selected
countries, 1990
Source: ILO projections.
197
The public finance nexus and resource mobilization

As shown in figure 4.2, implicit social security pension debt under the seconddefinition ranges from virtually zero in the United Kingdom to about 210 percent of GDP in Turkey. The middle ground is covered by countries likeDenmark, Germany and Sweden with implicit debts from around 100 to 160 percent of GDP.
Figure 4.3 demonstrates how a potential financing shortfall of a socialsecurity pension scheme can be resolved. It is assumed that in OECD countriesthe retirement age will increase by 3.5 years on average, combined with a 20per cent rise in the financing level. The combination of policy measures reducesthe implicit debt over 60 years to zero. This implies that national schemes willinitially be overfinanced for a number of years. In later years, the return oninvestments on the accumulating reserves – and ultimately phased dissavings,together with current tax and contribution allocations – would be sufficient tocover expenditure.
4.4 SOCIAL PROTECTION FINANCING AND PUBLIC
FINANCING STRATEGIES
The direct and indirect links between general government budgets and socialprotection financing make the latter de facto part of national fiscal and publicfinance policies. That relationship, which is too often overlooked in day-to-daygovernance, is explored here in more detail. No social protection scheme is a
Figure 4.3 Consolidated potential pension deficit, OECD, 1990–2050
Source: ILO calculations.
198
Financing social protection

financial island, however independent its legal status might be. Theinterconnectedness of fiscal policies and social protection financing alsodetermines the options and limits for social protection resource mobilizationstrategies that are described in section 4.5.
Fiscal policy makers must match the cost of fulfilling a set of governmentcommitments (generally perceived as public obligations ranging from nationaldefence, the guarantee of internal security and the provision of basicinfrastructure and services to education, health care, social protection, and soon) with the amount of (generally) scarce resources available. They have attheir disposal a limited range of options to raise revenues, namely:
. tariffs and excise duties,
. charges for government services,
. indirect and direct taxes,
. social security contributions and, in the case of developing countries,possibly some foreign aid.
As regards discharging their obligations to society, policy makers havebasically three options open to them: direct provision (e.g. providing externalsecurity by maintaining an army), commissioning services out to the privatesector or to parastatal institutions (e.g. by having private doctors deliveroutpatient care) while financing these services from public revenues, or relyingon the private sector for the provision and financing of some services (e.g.provision of automobile insurance in many countries, or requiring mandatorycontributions to private health or pension schemes).
However, the different financing and delivery options are interconnected. If,for example, the level of pension expenditure – regardless of its method offinancing – becomes too high, either it will begin to crowd out other nationalsocial expenditure or public expenditure, or fiscal pressure will result in areduction of benefits in an effort to keep the overall tax and contributionburden for citizens at an acceptable level.15 Contributing and tax-payingcitizens demand that governments provide – directly or indirectly – a certainrange and quality of services, and they naturally want to minimize the cost ofthese services in terms of overall tax and contribution burden.
It should not be assumed that contracting out the financing and provision ofpensions, health care or long-term care to the private sector has no effect on taxrevenues, although these effects will normally be indirect. There is good reasonto believe that even private insurance premiums are crowding out public taxes.If a government withdraws from the public provision of health care, forexample, and requires its citizens to turn to the private sector so that they haveto join expensive private insurance schemes, they might be very reluctant toaccept a simultaneous increase in the overall income tax. Apart from theimplicit or explicit obligations mentioned in section 4.3 (i.e. the government’srole as ultimate underwriter of many national social protection provisions),
199
The public finance nexus and resource mobilization

government budgets can obviously be affected indirectly by private provision ofsocial security.
There is no rule as to what constitutes acceptable limits of overall taxationand contribution payments. They can be tested only in a trial-and-errorprocess by governments, and we can safely assume that governments havebeen doing it for decades. There are indications that across societies theselimits vary.
Table 4.3 adds net private outlays for social security (i.e. after reduction inthe cost of private insurance premiums through tax breaks) to the overall taxburden of a society (as measured in per cent of GDP and consisting of socialsecurity and other taxes). It seems to suggest that societies in Europe, andnotably those in northern and central Europe (that is, the classical welfarestates), accept higher limits than countries in the Anglo-Saxon group wherescepticism vis-a-vis the government is generally more widespread and has evenbeen nurtured politically over the last few decades. The exception to the rule isGermany, which is often considered as over-taxed, but surprisingly does notseem to have a much higher combined tax and private insurance burden than theUnited States. Much more research is needed on the overall limitation of taxesand contributions in different societies and their determinants. For the purposeof this book it is assumed that these limits exist. Ignoring them would probablymean designing unrealistic financing strategies for NSPSs. Similar conclusionshave been reached by a number of researchers, for example Besharov (1998) inhis reasoning on the ‘‘tax ceiling’’ in OECD countries.
It is also unclear whether these limits generally depend on the actual mix offinancing instruments (for example, taxes or contributions). However, with the
Table 4.3 Estimated total tax and private social security revenues in selectedOECD countries, 2000
Country Non-socialsecuritytaxes
Social securitycontributions
Total tax revenue(including socialsecurity contributions)
Net privatesocialexpenditure1
Total taxesand privatesocial securitycontributions
Australia 31.5 0.0 31.5 4.1 35.6
Austria 28.8 14.9 43.7 1.3 45.0
Belgium 31.5 14.1 45.6 2.2 47.8
Denmark 46.6 2.2 48.8 0.8 49.6
Germany 23.0 14.8 37.8 1.6 39.4
Netherlands 25.6 16.1 41.7 3.8 45.5
Sweden 39.0 15.2 54.2 2.2 56.4
United Kingdom 31.3 6.1 37.4 3.2 40.6
United States 22.7 6.9 29.6 8.1 37.7
11997 data, taken from Adema (2001).
Source: OECD taxation data.
200
Financing social protection

existence of such limits mandatory contributions to social protection schemes –whether they are paid to parastatal social insurance schemes or mandatorily toprivate insurance carriers – potentially limit the government’s general taxationcapacity or restrict other government expenditure.
Thus, whether governments prefer to commission pension financing toparastatal authorities or private insurance carriers, or else to administer allcompulsory pension provisions themselves, the matter is inevitably one ofoverall national financial and fiscal strategies.
Leaving income policy considerations aside for a moment, a governmentwould then prefer direct provision of all mandatory pension programmesover mandated private sector provision if that direct provision wouldleave it with higher tax revenues for the coverage of non-social protectionexpenditure. If it believed that the overall tax, plus contribution income,would be higher under mandated private sector provisions and that earmarkingresources for social protection would leave it with higher revenues to financenon-social protection obligations, it would most likely prefer this type offinancing mix.
When weighing the different options, however, the government should alsotake into account the hidden cost of the financial guarantee it offers withmandated private sector provision, as well as the loss of room for financialmanoeuvre when overall uniform tax revenues are replaced by a system ofearmarked taxes (or contributions). Considerations of this nature have led someIMF representatives to prefer for certain countries direct public financing ofpublic social transfer obligations through the government – in other words, topromote the principle of unifying all public finance commitments ‘‘under oneroof’’ in the interest of greatest possible manageability of the overall system ofpublic finance.16 The interests of the citizens, however, might differ from thoseof fiscal policy planners. Citizens might prefer to have a certain share of theiroverall tax and contribution burden at least formally reserved for the provisionof health and long-term care or old-age benefits. They may not realize that theymight have to pay for this earmarking in the form of a higher overall financialburden (for example on account of higher administrative costs under indirectinstitutional or private provision of pensions), or they may be willing to acceptthis type of transaction costs to insulate resources for old age against rival usesof public resources.
The design of overall national public finance and fiscal policies, includingthe choice of the social protection financing system, is always the result of along explicit – or implicit – negotiation process between the public and thegovernment. The ultimate choice of public finance instruments will reflectthe popular trust or distrust of governments, public perception of the role ofthe State, the trust or mistrust of private sector institutions, including thefunctioning of the capital markets, the perceived need for publicly guaranteedsocial and income security and values such as the degree of societal solidarityand the acceptance or non-acceptance of income inequality.
201
The public finance nexus and resource mobilization

4.5 MOBILIZING RESOURCES FOR THE SOCIAL
PROTECTION SECTOR
We saw in Chapter 2 that social protection expenditure in any country willfollow a certain logistical growth path, and Chapter 3 showed us how to avoid,within certain limits, the negative side effects of social transfers on theeconomy. We have just seen that resourcing social transfers – that is, decidingwhich type of income-generating mechanism to use in order to financeexpenditure is in effect, directly and indirectly, part and parcel of overallnational financing strategies; as such, it is subject to fiscal policy limitations. Itis now time to explore the possible sources of money that can be tapped tofinance a set of transfers that a society has decided to afford. In fact, suchexplorations are a routine part of any preparatory process for a new benefitscheme. Their results are normally contained in a financial justification partwhich is generally a component of legislative bills that are submitted toparliament by the government or by parliamentary factions. No parliamentshould adopt any law that creates benefit expenditure but contains no indicationon how the resources to finance the benefits can be mobilized.
4.5.1 Basic choices
From the nature of social transfers as explored in Chapter 1 we have learnt thateach society has a fundamental choice: it can leave transfers to informalarrangements between people within and among households, or it can formalizethem. There are certain stages of development at which conversions frominformality to formality generally take place, although there is no hard-and-fastrule as to when certain transfers have to come on board. The case of theRepublic of Korea, which developed the core of its social protection systembetween 1963 and 1996, is quite typical (see Jung and Shin, 2002). The countrystarted out with pension provisions for government employees and the militaryin early 1960. It added employment injury protection for larger companies inthe mid-1960s and social health insurance for workers in larger companiesin the second half of the 1970s. Between the mid-1970s and the mid-1990s the group of protected persons was constantly extended and universalcoverage in health insurance was reached around the year 2000. Unemploymentinsurance was introduced in the early 1990s and assistance to cope with thefallout from the Asian financial crisis towards the end of the decade.Unemployment benefits are usually introduced only when labour marketshave reached a certain level of formality. Their introduction is currently debatedfor example in Thailand.
This does not mean however that in industrialized countries the build-up ofthe national transfer system has been fully completed. It was only in the 1990sthat countries like Austria and Germany decided to formalize their long-termcare transfers by introducing a long-term care insurance, recognizing that
202
Financing social protection

ever smaller nuclear families and changing employment patterns made caringfor the disabled and the elderly in a household setting in many cases animpossible task.
Half-way between leaving benefit transfers to the family or householdsetting and formalizing them into public or private transfer arrangements wefind community-based solidarity schemes (mostly applied in health care, in theform of so-called micro-insurance schemes). These schemes operate on avoluntary basis, normally insure a group of a few hundred or a few thousandpeople, and are – at least in theory – run by the community. Their strengths andweaknesses are analysed in more depth in Chapter 5.
The main categories of sources that governments can tap to finance socialtransfers are:
(1) Family/household sources: used for informal need-dependent coping withcontingencies in households and families;
(2) Community sources: used to finance limited basic transfers for contributorsand possibly dependants on a voluntary basis in a community oroccupational group;
(3) Private insurance contributions: used to finance social transfers forcontributors in larger pools in mandated or voluntary private insurance;
(4) Social insurance contributions: used to finance mandatory socialtransfers for employees and their dependants, operated by public socialinsurance;
(5) Taxes, general revenues or earmarked taxes: used to finance socialtransfers for the total population of a special group (for example, publicemployees).
We should not overlook a further important component of any resourcemobilization strategy for certain social transfers: savings in other expenditurecategories. These can be simply shifts of resources or efficiency gains. Shiftswould fall within the five categories listed above. As for efficiency gains, theyare largely the consequence of government deficiencies; they will be dealt within Chapter 7, where we will try to develop a set of mechanisms designed to helpavoid such inefficiencies.
The optimal use of the different sources and the optimal combination ofsources can only be established in the context of an overall national publicfinance strategy and within agreed fiscal constraints. This involves choosing anational portfolio of specific financing sources aimed at optimizing combinedtax and contribution incomes. This results in a theoretically very sophisticatedexercise (described in box 4.3) through iterative finding of an optimalcomposition of the resource portfolio. In practice this will most likely be aheuristic trial-and-error process that simply increases the share of eachcomponent until it can be empirically observed that people react adversely (forexample through increased tax evasion).
203
The public finance nexus and resource mobilization

Box 4.3 The tax and contribution maximization problem
Many different forms of taxes and contributions can be levied on asociety. That does not mean however that 100 per cent of all potential taxor contribution income will actually be collected. If taxes are too high, agrowing number of companies or individuals will not be able or willing topay; if tax rates are too low the cost of collecting them might be higherthan the potential revenues. Law-abiding firms and citizens will seek legalexemptions, and others will find illegal ways to avoid paying. There arealways some taxpayers or contributors that will not comply with theirobligations. Workers might move into informal sector arrangements toavoid social security contributions and income taxes, employers mightunder-report their workforce numbers or their wage bill in order to saveon contributions, or not declare their full turnover in order to avoidtaxation. Employers and workers might collude to avoid the payment ofcontributions.
We have little empirical knowledge about the general behaviouralpattern or the ratio of the amount of contributions or taxes actuallycollected to the total amount of contributions legally due (or the collectionrate, sometimes also called the compliance rate) depending on the levelof taxes. And most likely, as we have seen from national examples, thepatterns and the overall accepted limits of taxation and contributionsdiffer from country to country.
In public sector economics the relationship between the amount oftaxes collected and GDP tax ratio is described by the so-called Laffercurve.1 The original Laffer curve looks like a half-circle (see box figure4.3.1). For our purposes it has been slightly modified, plotting theintended target tax ratios to GDP versus the proportion of maximumpossible tax revenue that is actually collected in taxes. This maximumrevenue is always less than the target ratio. At a target ratio of 50 percent of GDP, actual collection might only reach 45 per cent due toinevitable losses attributable to evasion and imperfect enforcement.The target ratio is a theoretical ratio: for example, the result of a math-ematical application of income tax rates to the income distribution ina country and a division of the resulting amounts by the GDP in therespective year. The target ratio thus implies a 100 per cent tax andcontribution collection ratio.
The Laffer curve represented in box figure 4.3.1 simply shows that attarget tax ratio of zero per cent there is no tax revenue and at target taxratio of 100 per cent of GDP there will also not be much tax income as alleconomic activity in the formal sector will probably cease. It can be safelyassumed that the optimum level of taxation, that is, the level of thetargeted GDP tax ratio that creates an optimum amount of de facto taxincome, would be somewhere between these extremes. The figuresuggests a ratio of 50 per cent as optimum but that is only an illustrationand, as we have seen, real values have to be tested empirically in everycountry. It would be ideal if one could add all target rates of direct and
204
Financing social protection

indirect taxes and contributions that are levied in a country and thensimply find an empirical way to establish a national Laffer curve. Thechoice of the overall level of taxation would then simply involve theoptimization of national tax ratio.
However, that one-dimensional model is much too simple a view ofthe world. In reality people are subject to various forms of taxesand contributions and react differently to different charges. Optimumrevenues might be collected at a targeted general tax ratio of 20 per centof GDP, at a private insurance contribution ratio of 10 per cent of GDP anda social security contribution ratio of GDP of 25 per cent. The situation isdescribed in box figure 4.3.2 where potential net revenues from differentfinancing instruments have been expressed as a percentage of GDP. Thismeans there are a set of Laffer-type component curves that affect thepopulation in question simultaneously and that social protection plannersneed to respect. There is no point in aiming at a target contribution ofprivate insurance to GDP if we know that due to the nature of the privateinsurance business a contribution of, say, 10 per cent as in this example isthe optimum to which one can aspire. Higher contributions may beunrealistic since, for example, not enough members of the population areable to afford the income-independent health insurance premiums ofprivate health insurance.
Box 4.3 (cont’d)
Box figure 4.3.1 Target national tax ratios versus de facto tax revenues
(a modified Laffer curve)
Source: ILO.
205
The public finance nexus and resource mobilization

If there were no limits to overall taxation one could simply go for thesum of the individual optima of the component Laffer curves and thusarrive at a maximum overall level of tax and contribution income.However in the above example the sum of the optimum ratios would addup to 55 per cent of GDP; a level against which the population mightrevolt. If there was an assumed overall level of taxation of 45 per cent ofGDP, for example, then one would have to find an iterative process toarrive at an optimum combination of the target level of the differentinstruments that would yield maximum revenue at minimum collectioncost. If it were assumed here that in the example given in box figure 4.3.2relatively low-cost collection can be achieved for taxes and social securitycontributions, then the optimum level of taxation and contributionincome might be reached without using the private insurance option. Inother countries, where tax and contribution collection might be a biggerproblem, the choice could be completely different.
In theory one could build a linear or non-linear programming model todetermine the ideal portfolio of financing instruments. In practice onewould probably never find the data to establish the individual curves, sothe exercise reverts to the pragmatic process referred to earlier. None-theless, the concept of simultaneous Laffer type curves is useful forunderstanding the nature of policy choices in mobilizing resources forpublicly financed social protection.
Box 4.3 (cont’d)
Box figure 4.3.2 Simplified simultaneous Laffer curves for contributions and taxes
in a model society
Source: ILO.
206
Financing social protection

4.5.2 Developing a national resource mobilization strategy
A planned rational use of the different financing sources should first establishthe limits of formal sector sources (taxes and contributions) and set thepriorities for coverage in the form of a coverage map. Coverage is hereunderstood to have three dimensions: scope (the number of contingenciescovered), extent (the share of people having access to services/goods providedwithin the different categories of contingencies), and depth or quality (the levelof protection as measured for example by the replacement rates). More detailsabout the performance of social protection schemes are provided in Chapter 7.
Table 4.4 describes the coverage map of Thailand in the late 1990s.It includes the effect of the recently introduced 30-baht health care schemewhich provides practically universal health care coverage to all those whoare not covered by social insurance and are able to make a moderate 30-bahtco-payment to the public hospitals at the point of delivery of care.
The map does not show the depth/quality of coverage and disaggregatesthe population according to employment. A different disaggregation wouldbe possible. There is obviously no general rule as to how such coverage mapsshould be organized. What is important is that white spots can be clearlyidentified, though this does not necessarily mean that no transfer system can takecare of a certain need. Their presence simply indicates that no formal transfersystem is in operation. It can be assumed that in most of the white spots informaltransfer schemes are in operation. Maps like this one can serve as descriptions ofcurrent conditions or may be drawn up for certain years in the future asmilestones for a strategy to extend the coverage of formal transfer schemes.
In order to develop a credible strategy to fill in the white spots in thecoverage map, five steps have to be taken:
However, the isolated optimization of GDP tax ratios might not be theonly objective of national policy, there might also be overall long-termeconomic goals. Optimal taxation – in relative terms – might lead tolong-term opportunity cost in term of economic growth (see analysis inChapter 3). Thus the design of a national public finance and socialprotection resource mobilization strategy also has to be aligned with theoverall national economic policy. Again this will be a pragmatic processinvolving the search for policy compromises among different players innational policies.
The extent and the mix of the use of the above instruments to financea certain transfer or the transfer system as a whole together make up aresource mobilization strategy.
Note
1
See, inter alia, Stiglitz (1986), pp. 118–119.
Box 4.3 (cont’d)
207
The public finance nexus and resource mobilization

Table 4.4 Social protection coverage map, Thailand, late 1990s
Source: ILO (forthcoming).
208
Financing social protection

Step 1:
In national decision-making processes the priority white spots, those that needto be tackled first, have to be identified.
Step 2:
Policy options for covering the contingency have to be developed.
Step 3:
Policy options have to be costed.
Step 4:
The cost-sharing arrangements between different financiers (the government,private households and employers) have to be worked out.
Step 5:
Exploring appropriate financing instruments for each financier either by raisingnew funds (introducing or increasing co-payments, raising contributions,introducing a new earmarked tax, and so on) or by reallocating resources (forexample by terminating other expenditure); this presupposes assessing the roomfor manoeuvre in the government budget and the budget of other financiers,both in financial terms and in terms of political acceptability of new financialburdens by the stakeholders in the respective systems.
The pragmatic testing of alternative financing instruments and the financialroom for manoeuvre would normally be established in a social budget analysis(see Chapter 7 for more details). Table 4.5 summarizes the main structure anddevelopment of the social budget in Thailand during the 1990s. The politicaldecision-making process there has generated a clear demand for universalaccess to health care as the country’s next social protection priority. Suchprocesses do not always send clear messages as they can at times be ill-definedand are often a matter of political economy (see also Conclusion).
The case of Thailand however was relatively straightforward. The presentgovernment won the elections on a platform in which the introduction of the30-baht scheme featured prominently. Planners in the Ministry of Health anddiverse political interest groups must have calculated that covering someadditional 45 million people by that scheme would have an additional net costto the government of 25 billion baht (2003 estimate), largely for capitation feesthat will have to be paid to participating hospitals. The amounts are roughlyequivalent to about 0.5 per cent of GDP, which is assumed to decline inthe longer term as coverage under the social insurance scheme increases. Theplanners must have concluded that in future that amount of revenues canbe raised or shifted from other sources although a detailed health budget plan(which would be a sub-budget of the national social budget) has not been madepublic.
209
The public finance nexus and resource mobilization

Various options for resource mobilization (higher co-payments, or theintroduction of general health care contributions, for example) have beensuggested17 but have not yet been agreed upon. However, new options willmost likely have to be found as the government is operating under tight budgetrestrictions and the additional cost represents a substantial rise in overallnational social expenditure. As table 4.5 shows, public social expenditure(excluding education) amounts to only 2.52 per cent of GDP in 1998; theinclusion of the new 30-baht scheme would add 20 per cent to total socialexpenditure, which would be a major increase.
Box 4.4 describes a similar coverage extension exercise currently under wayin Ghana. The President there has declared that his government wishes to abolishthe ‘‘cash and carry’’ health care system requiring people to pay substantial userfees, and to replace it by a national health insurance system within the next fewyears. Finding the resources for that political priority is a typical resource
Table 4.5 Aggregated social budget (as % of GDP), Thailand, 1990–98
1990 1991 1992 1993 1994 1995 1996 1997 1998
Social expenditure 4.35 4.60 5.11 5.30 5.46 5.41 5.55 6.62 6.77
Education 2.85 2.96 3.21 3.53 3.55 3.52 3.49 4.17 4.25
Pre-primary,primary and secondaryeducation
2.12 2.15 2.32 2.78 2.76 2.74 2.69 3.16 3.22
Tertiary education 0.31 0.39 0.43 0.54 0.62 0.58 0.58 0.75 0.78
Other 0.42 0.43 0.47 0.20 0.18 0.20 0.22 0.26 0.25
Social protectionexpenditure
1.49 1.63 1.90 1.77 1.91 1.89 2.06 2.45 2.52
Health 1.00 1.12 1.31 1.20 1.33 1.33 1.44 1.74 1.77
Hospitals 0.47 0.54 0.65 0.74 0.79 0.80 0.86 1.04 1.14
Clinics and medical,dental
0.31 0.35 0.40 0.22 0.27 0.23 0.25 0.30 0.30
Other 0.21 0.22 0.27 0.25 0.27 0.31 0.33 0.40 0.33
Social security 0.48 0.50 0.57 0.50 0.52 0.50 0.55 0.63 0.67
Welfare 0.01 0.01 0.02 0.07 0.06 0.06 0.07 0.08 0.08
Revenues
Social securitycontributions
0.02 0.14 0.18 0.20 0.26 0.24 0.26 0.28 0.26
Out-of-pocket outlaysof households
n.a. n.a. n.a. n.a. n.a. n.a. n.a. n.a. n.a.
Local governmenttaxation
0.08 0.10 0.13 0.14 0.11 0.11 0.15 0.16 0.14
Central governmenttaxation
4.24 4.36 4.80 4.95 5.09 5.07 5.14 6.18 6.38
n.a. ¼ not available
Source: ILO (forthcoming).
210
Financing social protection

mobilization exercise in social protection; it will therefore be discussed in detail.The ambitious new plan requires raising new financial resources. Thegovernment will most likely finance it by resorting to a combination of resourceshifting (from pension financing to health care), new health insurancecontributions and increased value added taxation. Box 4.4 is a result of aquantitative policy analysis of an ILO team which visited Ghana in early 2003.18
The analysis concludes that while matching the expected cost with resourcesappears possible in theory, it seems realistic to try to phase in additional burdensand full coverage over the next ten years, instead of going for immediateuniversal coverage. The extent of immediate hikes in value added tax combinedwith a substantial health insurance premium appears prohibitive.
Box 4.4 Ghana’s health insurance plan: Attempting to mobilize
resources for universal coverage
Background
The President of Ghana has stated categorically that the country’spresent ‘‘cash and carry’’ system of health care is to be abolished by2004. The Government is seeking to replace it by a National HealthInsurance System (NHIS) designed to provide universal coverage for thepopulation.
Ghana’s economic situation is difficult. The new government inheriteda US$7.2 billion national debt (US$5.9 billion external and US$1.3 billiondomestic). The national currency has depreciated dramatically andinflation is spiralling. The present budget situation is fairly serious.Revenues in 2001 reportedly covered only 72.6 per cent of total expend-iture. The deficit amounted to US$3.2 billion in 2001, or approximately 9per cent of GDP. Debt relief schemes will probably ease the situationsomewhat.
Although there has been some improvement in many healthindicators, including mortality and morbidity, crude indicators stilldemonstrate the need for major improvements. Life expectancy in 1999was only 54.2 years for males and 55.6 years for females, and is thoughtto have gone down even further since then due to the impact of HIV/AIDS.The mortality of under-fives is high: 118 per 1,000 for males and 109 per1,000 for females. Public expenditure on health in the late 1990s wasonly in the order of US$11 per capita annually, and more than 50 per centof it was borne out of pocket. Access to and use of health facilities is lowand has been declining. A survey conducted by the Ghana StatisticalService revealed that in 1992 as many as 42.5 per cent of the urbanpopulation and 54.7 per cent of the rural population did not seek medicalattention in times of illness or injury. By 1998 medical consultations hadfallen by 46.6 per cent among the urban population and by 69.2 amongrural dwellers. This trend can likely be linked to rising health care userfees in recent years.
211
The public finance nexus and resource mobilization

The proposed health insurance system and its financing
The health insurance system being proposed is a fusion of Social HealthInsurance (SHI) and Mutual Health Organization (MHO) concepts. It will bebased on a district-level MHO approach covering both the formal andnon-formal sectors. It is assumed that the scheme is formally mandatoryfor all residents. De facto only the formal sector workforce will probably(after a transition period) be covered on a mandatory basis. Community-level and non-formal occupational groups will be encouraged andsupported to collect premiums from the non-formal sector to be paid tothe district MHOs.
The introduction of a NHIS in the national health care financingsystem requires an overall health care budget and financial planning ofthe sector so as to ensure that the additional administrative cost incurredthrough the introduction and the maintenance of the NHIS actually leadsto real improvements in access and quality of care. There is a real risk thatthe system may only facilitate access for groups who already have accessto health care delivery systems and that the quality of care may actuallydeteriorate if the overall budget of the sector is not increased. The healthbudget thus needs to stipulate explicitly the target level of additionalresources that are meant to be used in the sector, and identify thefinanciers of the additional resources. It must show that the newresources do not simply feed additional medical inflation but ratherfinance better care and improved access.
The present design of the scheme envisages a variety of resources tofinance the system, ranging from social insurance contributions of theformal sector to earmarked taxes and levies (on alcohol and tobacco,gross investment of the Social Security and National Insurance Trust(SSNIT), car sticker revenue), plus a variety of other sources. All or part ofthe resources will go into the National Health Insurance Fund, from wherethey will be allocated to the participating insurers. The allocation isplanned to include risk-equalization payments, reinsurance and crosssubsidization.
The calculations portraying a simplified quantitative mapping of theenvisaged NHIS reveal some structural problems with the financing ofthe new system. Box table 4.4.1 presents a simplified but structurallycorrect picture of the present national health care budget (for careprovided in public facilities) based on data supplied to the ILO projectteam by the Ministry of Health. However, much more detailed healthbudget analyses including basic projections are needed to support thegovernment’s decision to introduce the NHIS.
According to the data provided to the team, the health care deliverysystem is currently used by about 50 per cent of the population, or some10 million people. Per capita costs are at a level of around US$16.40 – onlyabout one-third higher than the absolute minimum calculated by theWHO macro-economic commission for health. Total expenditure on
Box 4.4 (cont’d)
212
Financing social protection

publicly provided health care is in the order of 2.5 per cent of GDP.Government resources account for only 55 per cent of the total financing ofcare in public facilities, which is equivalent to about 5.8 per cent oftotal general revenues. Overall public health spending as well as theshare of the government’s budget is low by the standards of manyother developing countries (see, for example, WHO 2000, Annex table A8).
Box table 4.4.1 Total estimated health expenditure, Ghana, 2003
Billion cedis US$ (million) In % of total
Care financed by
Regular budget 763 90.83 55
External aid 389 46.31 28
Co-payments 228 27.14 17
Total 1 380 164.29 100
Key structural data
GDP 58 500.00 6 964.29
Status quo healthexpenditure in % of GDP
2.36 2.36
Estimated general revenues 13 250.00 1 577.38
Status quo government healthexpenditure in % of generalrevenues
5.76 5.76
Average annual expenditureamounts per user
Cedis US$
Regular budget 76 338.17 9.09
External aid 38 919.46 4.63
Co-payments (cash and carry) 22 811.41 2.72
Total 138 069.04 16.44
Estimated population access
Population million
Formal sector population 5
Informal sector population 15
Total 20
People with access rate
Formal sector population 1 5
Informal sector population 0.333 5
Total 0.49975 10
Source: Data from Ghana.
Box table 4.4.2 simulates in round figures what would happen to thehealth sector if the health insurance system as presently planned hadbeen introduced in 2003, without a transition period. Technically speak-ing, this means that the calculations assume an ad hoc transition to thestationary state on the day the new system becomes effective. This is
Box 4.4 (cont’d)
213
The public finance nexus and resource mobilization

hypothetical but still useful to illustrate structural weaknesses of the NHISdesign. The key assumptions in this model calculation are as follows:
. the cost of care and present level of fees are unchanged;
. abolishing co-payments at the point of delivery would increase therate of utilization by the population by about 50 per cent (in technicalterms, the price elasticity of utilization is 50 per cent); and
. the scheme would cover all the people in the formal and informalsectors.
Box table 4.4.2 Simulation health insurance, Ghana (stationary state for 2003)
Structural assumptions
Assumed increase of utilization due to abolishment of user fees (%) 50
Coverage Rate
Formal 100
Informal 100
Number ofpersons (millions)
Formal 5
Informal 15
Total 20
Contributions
Formal sector
Average monthly wage Cedis 860 000 US$ 102.38
Compliance rate (%) 100 100
Contribution rate (%) 2
Informal sector
Average annual contribution Cedis 24 000 US$ 2.86
Estimated expenditure Billion cedis Million US$
Formal 1 035.52 123.28
Informal 3 106.55 369.83
Total 4 142.07 493.1
In % of GDP 7.08 7.08
Financing
Present governmentcontribution
763.00 90.83
Present external aid 389.00 46.31
Contributions
Formal sector 206.40 24.57
Informal sector 360.00 42.86
Deficit 2 423.67 288.53
In % of general revenues 18.29 18.29
Box 4.4 (cont’d)
214
Financing social protection

Once the general resource mobilization strategy has been decided upon, thefinancial instruments have to be designed in more detail. This requires sometechnical knowledge, which will be provided in Chapter 5.
4.6 SUMMARY
Social protection schemes make promises, some of them of a very long-termnature. Financing such promises requires a clear financing strategy thatencompasses both the public and the private sector as there are multiple direct
Box table 4.4.2 (cont’d)
Potential financing of deficit
Additional% points
Billion cedis Million US$
General SSNIT 0.02 206.40 24.57
VAT 0.02 459.20 54.67
Remaining deficit �1 758.07 �209.29
Source: ILO calculations.
The table demonstrates that if:
. the government were to maintain the present level of its financing;
. external aid were to remain at the present level;
. formal sector workers were to contribute 2 per cent of their insurableearnings together with their employers to the NHIS;
. people in the informal economy were to contribute 24,000 cedis perperson and per year;
. VAT were to be increased by 2 percentage points; and
. 2 percentage points were shifted from pension contributions to healthcare;
the scheme would still incur a deficit of about 1,800 billion cedis. It wouldbe very difficult to close that gap through other types of incomes. Even afurther 2-percentage-point increase of VAT and an additional subsidy bythe SSNIT of 2 percentage points of their present contribution would notsolve the problem. It appears that the government cannot afford 100-percent population coverage in the immediate future. However, furthercalculations show that if general revenues were to increase in real termsby about 3 per cent annually, then this bold endeavour to move towardsan effective health care coverage of the complete population could befinanced in ten years – if the government were willing to devote about 40per cent of the additional revenue to the health care sector.
Box 4.4 (cont’d)
215
The public finance nexus and resource mobilization

and indirect relationships between the financing of social transfers andgovernment budgets. This chapter has shown that the accounting instrumentsnecessary to monitor the full public cost and commitments of a national socialtransfer system are not yet fully developed. Implicit government debt incurredfor example by an underfinanced and overpromising pension scheme is notaccounted for in any standard government accounting system. The same is trueof risks that governments incur as de facto ultimate underwriters ofsystematically captured parastatal and private sector transfer schemes.
Given the numerous direct and indirect links between general governmentaccounts and pension financing, as well as the pivotal role of governmentas the ultimate guarantor of income security, it is difficult to establishwhether a specific financing option is ultimately cheaper for governments andtheir financiers, the taxpaying and contributing citizens, than other availableoptions.
The analysis of the various links between public finances and pensionfinancing shows that governments, representing society at large, always remainthe ultimate guarantors of national social security pension schemes. If promisescovering in part the lifetime of several generations can be made at all, they canonly be made by societies as a whole. Capital markets, private insurancecompanies or enterprises – as alternative providers of old-age security – cannotgive long-term guarantees as to their proper functioning or even their meresurvival over such long periods.
If one takes a global view of social security schemes and presupposes thatthe government’s ultimate responsibility is to ensure at least a minimum levelof transfer of resources for consumption to the elderly, the disabled, survivors,the sick and the poor, then national choices of public and private provision ofpension benefits, or any specific public-private mix, are reduced to questions ofsocial and income policies versus questions of public finance policies.
Public provision of social protection benefits means that the incomedistribution effects of these transfers can be designed to provide protectionagainst poverty and to reduce income inequality to some extent through thepension scheme. Contracting out part or even the bulk of social protectionprovision to the private sector will inevitably lead to greater income inequalityamong the beneficiaries, since private entities can hardly be expected to includeredistributive elements in their benefit provisions. For the social protectionanalyst all this means that the financial analysis of a national social protectionscheme or the development of a blueprint for introducing a comprehensivesystem requires not only straightforward actuarial costing and financing for thatsystem or an individual scheme, but also an extensive analysis of explicit andimplicit government obligations. In addition, an understanding of the limits ofthe acceptable overall contribution and tax burden as well as the acceptablecomposition of that burden (between taxes, social insurance contributions, out-of-pocket-outlays and private insurance premium) must be developed. Limitsand compositional preferences can only be tested in trial-and-error operations
216
Financing social protection

that often take decades of feeling one’s way ahead in complex societalconsensus processes.
Only if such analyses have been carried out is it possible to design afinancing strategy allocating financial burdens to certain financiers andfinancing instruments.
A checklist of questions for financial and social policy analysts
If a resource mobilization or financing strategy for a new benefit schemeis being developed analysts might wish to try to use the followingchecklist to ascertain whether the major potential impacts on governmentfinance and fiscal policies have been covered:
1. Who is the ultimate guarantor of the new benefit? The government?If so, does that mean that the government would have to bail out thesystem if the resource mobilization strategy for the scheme fails?
2. Are there other long-term direct or indirect liabilities for thegovernment inherent in the design of the benefit?
3. Is the resource mobilization strategy realistic – in other words, is thepublic likely to accept the additional financing burden in the form oftaxes, contributions, or private outlays? And is it ready to accept theway in which that burden is being allocated to different financiers bythe resource mobilization strategy?
4. Could the introduction have any potential negative side effects on theoverall tax compliance in the country?
5. Would the resource mobilization strategy have any opportunity costfor the government – that is, are there other government projectswhich would have to be shelved because the measure in question islikely to crowd out the financing for that alternative use of publicresources?
Further reading
To find out more about:
. the United Nations System of National Accounts (1993 SNA), consultthe UN Statistics Division’s website (http://unstats.un.org/unsd/sna1993)
. the links between the SNA and a social accounting system, turn toScholz et al. (2000), Chapter 6
. the economic effects of taxation, see van den Noord and Heady (2001)
. public expenditure management, read Allen and Tommasi (2001).
217
The public finance nexus and resource mobilization

Notes
1 This chapter draws heavily on Chapter 14, ‘‘The consequences for public finances’’, written byMichael Cichon, in Gillion et al. (2000). However, it has been extended to cover benefits other thanpension benefits and has been thoroughly reviewed.
2 See United Nations (1968), p. 25.3 See IMF (1997a, 1997b).4 See, for example, EUROSTAT (2000).5 For example, if a country introduces a new pension scheme with a relatively generous pension
formula (as was the case in many countries in Africa, the Caribbean and Latin America), financed throughpartial funding – that is, through a contribution rate which in the initial years is much higher than thecontributions which would be needed in order to cover the initially low cost, then the government couldborrow from the schemes and invest in national infrastructure, for instance by financing an extensivehealth care infrastructure. Proper social budgeting will show that the flow of money between the schemesand government accounts will subside at some point, and must even be reversed, or contribution rates inthe pension schemes will need to be increased. The government’s financial planning has to prepare forthese events: it either has to prepare the public well in advance for higher contribution rates, or it has to beprepared to redeem some of its loans and might even have to suppress other expenditure (e.g. on healthcare and other social transfers) in order to be in a position to retrieve funds for the scheme. The casewould be the same if the government were to borrow from private pension insurance schemes.
6 The principles of social budgeting are explained in greater detail in the social budgeting textbookof this technical series (see Scholz et al., 2000).
7 See Federal Ministry of Labour and Social Affairs (1994).8 See, for example, Cichon and Samuel (1995).9 In this context, national accounting adds an interesting connotation to the debate on funded versus
unfunded PAYG financing of pension schemes. If an allegedly funded social security scheme invests allits reserves in government investment facilities, and if the government pays the correct (inflation-indexed) interest rates and correctly redeems capital borrowed, then the pension scheme is no more thana mixed contribution and tax-financed PAYG scheme, as liabilities for interest payments and redemptionmust be financed by general taxation. At the level of the consolidated government account the schemeturns into a PAYG scheme.
10 On the other hand, the fact that governments directly provide benefits does not automatically meanthat the schemes are fully financed by general taxation. Governments might well execute a social insurancetype arrangement which collects contributions in the same way as an autonomous social insurance scheme(as in the United States, for example). Even schemes with universal benefits for every resident mightcollect contributions (or earmarked taxes) which help to finance the benefits (as in the United Kingdom).
11 Including pensions, short-term benefits, health, unemployment benefits and social assistance.12 There is plenty of evidence to support this. One of the most recent findings is reported in the ILO
study of a potential catastrophic health insurance fund in the Bahamas: see ILO (2001b).13 This also means, by implication, that in any scheme where such a level of reserves is required at
any given point in time total annual contributions paid in any future years must be equal to the presentvalue of all future pension rights derived from this annual contribution.
14 The model was used to project long-term social expenditure in OECD and Central and EasternEurope. Details of the methodology and the assumptions are described in Latulippe (1997). The centralassumption of the model is a 2-per cent annual average real growth over the projection period. Totalemployment is assumed to grow by an average of 1 per cent annually. The long-term average realinterest rate is assumed to be 3 per cent.
15 In this context the appropriate financial planning instrument for national social policy and hencepension policy is comprehensive national social expenditure accounting and planning in the form ofnational social budgets.
16 See, for example, Tanzi (1996), p. 31.17 See ILO (2002b).18 See Cichon et al. (2003b).
218
Financing social protection

5FINANCING TECHNIQUES1
The expenditure of national social protection systems (NSPSs) or individualsubsystems is determined by the rules governing respective social transfers.These rules are themselves determined first and foremost by societal values; overthe last few decades, however, they have been more and more frequentlychecked against the perceived affordability of the individual schemes or systemsas a whole. In order to evaluate that affordability, which is – as we saw inChapter 3 – largely a political process of trial and error, the immediate, mid-termand long-term costs of a given scheme or system have to be established. This isdone through actuarial and social budget studies. As the relevant techniques aredescribed extensively in three other textbooks of this series,2 there is no need todwell on them here. Understanding what typical cost developments might beexpected in a young pension scheme, for instance, and what factors influencethem, is quite sufficient (these elements were described in Chapter 2).
This chapter takes cost developments as granted and, as mentioned earlier,also assumes that a society has taken all necessary measures in terms of riskavoidance. It limits itself to presenting the options that financial planners andpolicy makers have at their disposal to finance the expected expenditure – inother words, how they can ensure, once basic political decisions on resourcemobilization strategies have been made (see Chapter 4), that the right amount ofliquid resources is available when expenditure falls due. We are restrictingourselves here to financing techniques for formal transfer systems, with someextension into community-based schemes. Designing and choosing financingsystems is about finding ways to keep benefit promises. This chapter willtherefore address the following questions:
(1) who pays. . .
(2) from what income. . .
(3) what amounts of contributions or taxes. . .
(4) at what point in time. . .
(5) for whom. . .
given a certain expected development of expenditure.
219

In order to make sure that resources are always available when needed,societies decide the above questions by selecting specific financing systems – inother words, by determining the way in which the income needed to financedifferent social benefit schemes will be generated. As we have already seen,resources can be mobilized in a variety of was, ranging from tax to contributionfinancing (and a number of mixed financing systems in between), and withincontribution financing available options range from full funding to zero funding.
In the following pages we will define and explain the main conceptsinvolved (section 5.1) before discussing in detail the options open to a countrywhen it comes to selecting a financing system for health care benefits, pensionsand other social protection benefits (sections 5.2, 5.3 and 5.4 respectively).Acknowledging the all-pervasive trend of globalization, section 5.5 explores thepotential options for the international financing of social protection. A briefsummary is presented in section 5.6.
5.1 FINANCING SYSTEMS: DEFINITION, PARAMETERS
AND MAIN APPLICATIONS
After defining financing systems and their principal objective, this sectionanalyses the systems’ constituent parameters and provides an overview oftypical applications for the various social protection benefits or transfers.
Financing systems are defined as a set of legal provisions aimed at ensuringthat at each point of a scheme’s life cycle the amount of expenditure is matchedby equal and available financial resources – in other words, that the scheme is infinancial equilibrium. As mentioned above, all financing systems are fullydescribed by four parameters:
(1) size of the covered group (Who pays . . . for whom?);
(2) financing rules under which they operate (. . .what amounts);
(3) definition of actuarial equilibrium, which is synonymous with the scheme’slevel of funding (. . . at what point in time); and
(4) sources of financing (i.e. the resource base) earmarked for the financing ofbenefits (from what income?).
The expected evolution of spending and the choice of the financing systemthen determine the financial burden of each generation of contributors. Beforeexploring the above basic parameters, we need to introduce the concept offinancial equilibrium that all financing systems seek to maintain.
5.1.1 The principal objective of financing systems
From the actuarial point of view, a scheme is in financial equilibrium if thepresent value of all future expenditure plus the initial reserve t ¼ 0 is equal tothe present value of all future income of the scheme at a given point in time.
220
Financing social protection

This can be translated into the fundamental (simplified) equation for the generalfinancial equilibrium3 of a social protection scheme:
R0 þX1t¼ 0
pt � TIWt � rt ¼X1t¼ 0
TEXt � rt ð5:1Þ
where:t ¼ 0; . . . 4 denotes yearsR0 is the initial reservept is the contribution rate charged in year trt is the discount rate (1/(1+i)) to the power of tTIWt is the total amount of insurable wages or incomes in year tTEXt is the total expenditure in year t
The above equation has to hold at any point in time for a theoretically unlimitedperiod. The non-limitation of the time frame is justified by the fact that theexistence of social security systems is guaranteed by law for unlimited periods.
The equation applies to pay-as-you-go (PAYG) financing systems, to systemsfinanced on a fully funded basis4 and to all forms of intermediate funding.
It should be noted that – when applied to pension schemes – the abovefinancial equilibrium is a close cousin of the concept of implicit pension debt. Ifthe contribution rate pt is kept constant at the initial level over time then thesecond concept of implicit pension debt is equivalent to formula 5.1. Ensuringthe schemes’ financial equilibrium through responsible management of theincome and expenditure side is thus equivalent to avoiding implicit pension debt.
This general long-term equilibrium does not automatically guarantee liquidityat each specific point in time. In PAYG systems the scheme is by definition inequilibrium on a year-to-year basis, whereas under other options temporary annualdeficits (which would have to be closed by borrowing) are theoretically possible,provided they are compensated by later annual surpluses. The rules and regulationsof a given financing system have to translate the financial equilibrium and theannual liquidity requirement into an ‘‘actuarial equilibrium’’ (a close relation ofthe general financial equilibrium) that ensures the provision of cash flow to coverthe benefit expenditure at each point in time and which is a more pragmatic andmanageable requirement than the ‘‘eternal’’ general financial equilibrium.
Before proceeding to analyse the main features of financing systems, weshould recall briefly one of the main messages of Chapter 2, namely whatdetermines the level of expenditure in social transfer systems. As we have seen,the expenditure (and therefore also the financial equilibrium) of a benefitscheme is influenced by three sets of factors:
. demographic factors, which determine the relative size of the active (andfinancing) generation to the non-active (and benefiting) generation;
. economic factors, which determine the ability (itself dependent on the levelof economic development) of the different financiers to honour theircontractual arrangements; and
221
Financing techniques

. governance factors, which describe the actual nature of the contract, namelyhow much is promised to the inactive generation and how well the financialflows are managed.
Table 5.1 summarizes the impact of these concrete and measurable influencefactors on the income and expenditure of a social protection benefit scheme.
Table 5.1 Factors affecting the financial equilibrium of a socialprotection scheme
Impact on income items Impact on expenditure items
Economic factors
(1) growth insured persons andwages
entitlements and numberof beneficiaries
(2) employment(most likelydepends on (1))
number of contributorsor taxpayers
number of beneficiaries(invalidity, sickness,unemployment, povertyalleviation benefits:immediately; old-age,survivors’ benefits: inthe long run)
(3) wage share of GDPand wages (mightdepend on (1))
insurable earnings benefit amounts(after a time lag)
(4) wages/inflation insurable earnings benefit amounts
(5) interest rates increase investment income
Demographic factors
(1) initial populationage structure
number of actives number of beneficiaries
(2) mortality changes number of actives number of beneficiaries andaverage length of servicethat determines entitlements
(3) fertility increase number of contributors(long run) if economicdevelopment permits
number of beneficiaries(long run)
Governance factors
(1) design of the scheme contribution or taxprovisions
benefit formula andentitlement conditionsdetermining the numberand amounts of benefits
(2) maintenance (adjustment ofpivotal scheme parameters)
ceiling on insurableearnings
benefit levels
(3) administrative complexity administrative and hencetotal expenditure
(4) registration compliance (short-term) total amountof insurable earnings
(long-term) number ofbeneficiaries and amount ofbenefit expenditure
(5) wage compliance (short-term) insurableearnings
(potentially long-term)level and amount ofbenefit expenditure
222
Financing social protection

5.1.2 Parameters of financing systems
5.1.2.1 The size of the covered group
The smallest group within which social transfers take place is obviously thenuclear family. The next group in size is the extended family or aneighbourhood, followed by a community or occupational group. Unlessmandated by specific legal provisions (such as alimony provisions in familylaw), transfers within families and/or small communities are often of aninformal nature. The extent of solidarity within nuclear groups varies greatly,depending again on societal values and specific family or communitycircumstances. There are generally no clear entitlements to benefits, even incommunity-based schemes. As in informal family settings, community-basedtransfer levels are often income-defined – in other words, actual levels of socialprotection depend on the income level of the group as a whole rather than onthe objective need of potential transfer recipients.
The reliability of benefits increases, at least in theory, with the size ofthe group covered by a specific transfer arrangement. National schemes – orat least social insurance schemes with wide coverage – generally have amore stable benefit experience and income than smaller groups. All socialtransfer systems are based on resource pooling to cope with contingenciessuch as invalidity, poverty, old age, sickness, and so on. The variance of thebenefit experience of big groups (i.e. their financial risk) is inevitably morestable than that of smaller groups, and this in turn stabilizes the financialposition of larger groups. This point is illustrated by a random numberexercise in box 5.1.
In addition to the principal mathematical internal risks set out inbox table 5.1.1, small groups also often face joint external risks likeunemployment in an occupational group, poverty in a family, epidemics incommunities. In other words, as long as they are well governed, bigger schemescan usually cope better with most risks. The disaggregation of nationalsolidarity into smaller solidarity groups inevitably also leads to a greaterdisparity of benefit levels. With some likelihood this will create smaller groupswith a wide range of average income, which means that these groups canpotentially also cater for different levels of benefits: richer groups will be ableto finance more and better benefits.
However, actuarial arguments for large risk pools might be in contradictionwith a society’s political preferences. A society might choose wide risk pooling inone social protection subsystem (like the National Health Service [NHS] in theUnited Kingdom), while at the same time opting for a very heterogeneous pensionsystem (like United Kingdom’s mixed public/private pension system). Othersmay opt for strong basic protection against poverty in old age while leaving theguarantee of adequate income replacement rates to group-based schemes (theNetherlands pension system, for example). Worldwide, a trend towards greater
223
Financing techniques

Box 5.1 Does the size of the risk pool influence the stability of
benefit experience?
Assume there is a health insurance scheme. We know that the average‘‘true’’ benefit per insured person per period is 10 Currency Units (CU)and that the true standard deviation is CU 5. We further assume that thisscheme has a choice of insuring ten, 100 or 1,000 members with ahomogenous risk structure (that is, a normally distributed randomvariable with mean CU 10 and standard deviation 5). Of course, in reallife not every member would experience exactly such a benefit take-upthat the overall average would be CU 10 and the standard deviationexactly 5. According to the law of large numbers, an exact normaldistribution with these two parameter values would be approximatedonly if the scheme were insuring a high number of people. The smallerthe number of insured persons, the further away would the real benefitexperience be from the true values. To illustrate the point, a standardrandom number generator of Excel was used to simulate normallydistributed random benefits over ten years for a scheme with ten, 100 or1,000 people.
The standard deviations from the true mean of CU 10 are noted inbox table 5.1.1. In a second step the average standard deviation of theobserved standard deviation from the true standard deviation of 5 wasalso calculated over the period of ten years. The results show clearly thatthe ten-year experiment with a scheme covering 1,000 members wasmuch closer to the true value than in the scenarios with ten or 100members.
Box table 5.1.1 Results of a random number experiment
Year Standard deviation from true mean
10 members 100 members 1 000 members
1 3.69 4.63 5.16
2 5.06 4.87 5.17
3 4.8 4.54 5.32
4 4.41 4.17 5.12
5 4.38 5.09 5.26
6 5.12 4.56 5.21
7 3.47 5.05 5.26
8 5.05 4.82 5.17
9 5.62 5.25 5.37
10 6.51 4.63 5.17
Standard deviation(SD) of observedSD from true SD
2.38 0.47 0.17
Source: ILO calculations.
224
Financing social protection

disaggregation of solidarity groups can be observed, all the way down to fullindividualization found in Mandatory Retirement Savings (MRS) schemes. Thisinevitably creates a greater differentiation of individual benefit levels.
5.1.2.2 Financing rules
Statutory public social security schemes operate on the basis of financing rulesor principles that are fundamentally different from private arrangements aimedat ensuring income security. Private insurance companies, for example, financepensions on the basis of individual equivalence, a financial rule which stipulatesthat the present value of the contributions of each individual contributorentering the scheme has to equal (on average) the present value of all expectedbenefits (plus administrative cost). In the case of defined-benefit (DB) pensionschemes, in practice this generally leads to pension insurance contribution ratesthat are calculated for cohorts defined by the age of entry into the insurance.Individual premiums might be charged for persons with certain handicaps.Normally there are no income transfers between generations or income groups,the only risks insured being longevity, premature death or invalidity (if the lasttwo contingencies are included in the insurance contract). In the case of MRSschemes, the principle of individual equivalence is automatically fulfilled. Eachparticipant’s account balance is determined solely by his or her contribution andthe associated investment earnings, and the present value of the benefitprovided by the scheme is exactly equal to the balance of the scheme (minusadministrative fees which, incidentally, may be substantial).
The rules governing social security financing systems are more discre-tionary than those dictated by private sector financial requirements but can bededuced from the general societal mandate of NSPSs. Three main rules can beidentified: the financial solidarity rule, the rule of collective financialequivalence, and the rule of intergenerational equity. In practice, they are
The contingency reserve that a small scheme would have to maintainin relative terms (that is, relative to the overall average benefitexpenditure) would obviously have to be much bigger than that of ascheme with a large number of members. In other words, a small schemefaces a higher probability of bankruptcy than a large one. A small schemehas two alternative ways of insuring against bankruptcy. One way wouldbe to limit its liabilities and thus push some of the risk back to itsmembers; building up a contingency reserve will then be enough to covera conservative estimate of a total annual or multi-annual benefit outgo.Alternatively, the scheme could buy reinsurance, thereby turning anunpredictable risk of high annual benefit expenditure into a constant andpredictable reinsurance premium.
Box 5.1 (cont’d)
225
Financing techniques

hardly ever all fulfilled at the same time and are almost inevitably the result ofpolitical compromise.
The financial solidarity rule5
Under this rule, contributions or taxes for the financing of benefits are chargedon the basis of the members’ ability to pay, regardless of their risks orcircumstances (suffering from a health impairment or having eligible dependants,for example). In social insurance schemes this principle is generally embodied inuniform contribution rates charged as a fixed percentage of insurable earnings.This might even be modified by lower contribution rates for low-income earners.In the case of pension financing from direct taxation, this rule generally appliesautomatically owing to the usual overall progressiveness of tax rates.
The rule of collective financial equivalence
This rule is parallel to the principle of individual or cohort-based equivalencein private insurance – in fact, it extends the equivalence rule from the individual ora cohort (of the same age, sex or occupation) to a covered community. It requiresthat at any point in time the total present value of all expected future expenditureof the social protection scheme should be equal to the present value of all futureincome of the scheme (plus the initial reserve at the respective point in time, ifapplicable). This has three implications: First, it simply requires that the schemebe in financial equilibrium (as does the principle of individual equivalence in theprivate sector). Second, it permits redistribution of income between groups aslong as the long-term financial equilibrium is secured. It also stipulates that in thelong run income has to cover expenditure regardless of whether reserves are builtup or the scheme runs on a pure PAYG basis. Third, it implies that social securityresources should not be used to finance non-social security expenditure (whichmight happen if governments borrow resources and either do not return them orreturn them at a substantially lower real value), and that the scheme should notreceive any external subsidy. The latter can occur if a scheme does not cover thewhole population but is subsidized from general revenues. Both these situationsraise serious questions of equity with respect to whether a particular populationgroup should be asked to pay extra taxes (which happens if social securitycontributions are used for purposes other than social security requirements) andwhether the general public can be obliged to subsidize the standard of living of aspecific group (which occurs when a scheme is subsidized from general revenues).
The rule of intergenerational equity
This rule is generally applied only to long-term benefit schemes – that is, topension schemes and long-term care schemes (the latter provide non-timebound nursing care for the permanently disabled, mainly the elderly, at home or
226
Financing social protection

in specialized establishments). It requires that members of all generations (i.e.successive generations) pay roughly the same share of their disposable incomeduring their active life in order to earn equal benefit entitlements (in terms ofreplacement rates). This principle is the most contentious, least clear and mostopen to diverse interpretations.
In PAYG or partially funded systems, early generations normally pay lowercontribution rates than the generation at or near the maturity stage of thescheme, while often earning similar pensions. Generational accounting wouldclearly show that the present value of their contributions is lower than theaverage present value of their benefits. This might be called a windfall profitwhen a new pension scheme is started in an economy with a roughly constanthigh standard of living. For developing economies one might argue that a lowercontribution rate for early generations is justified on the grounds that theirliving standard is normally only a fraction of that of the following generationsand that it is therefore only equitable to transfer some of the benefits of latergrowth to early generations. If one were to finance a pension system by atheoretically eternally constant contribution rate, then most of the contributionsmade by the early generations would go into building up reserves. At thematurity stage of the scheme, the income from investments would help tofinance the scheme and keep the contribution rate at its eternal level. If the earlygenerations had not contributed to building up reserves then the missinginvestment income in the later stages would be equivalent to the redistributionof income from later (normally richer) to earlier (normally poorer) generations.Such income redistribution might still be regarded as socially equitable even ifit is not equitable in strict actuarial terms.
In most cases the above rules are not applied in their pure form. There areoften tax subsidies for pension schemes that do not cover the total populationor, on the contrary, pension reserves may be borrowed and consequently writtenoff. Both cases violate the rule of collective equivalence. In defined-contribution (DC) schemes, survivors’ benefits might depend to a crucialextent on the age of the breadwinner at time of death, which would violate thefinancial solidarity rule. The concept of intergenerational equity is muchdebated but is seldom clearly defined. It might even be in conflict with reality ifthere are no capital markets to absorb the initially high reserves under‘‘eternally’’ constant contribution rates, or if the scheme lacks access toexperienced investment management skills. The extent to which societiesadhere to the different rules and the priorities they give to one principle overanother are a matter of political preference, and the choice of a particularfinancing system implicitly reflects these preferences.
5.1.2.3 Actuarial equilibrium and the level of funding
As mentioned above, the actuarial equilibrium translates the general financialequilibrium into a rule that can be followed easily in day-to-day practice. In
227
Financing techniques

short-term benefit schemes, which provide health care, unemployment benefits,sickness or maternity benefits and where benefit and/or contribution levels canbe adjusted relatively quickly to changing economic, demographic or politicalrealities, it is enough to stipulate that a scheme’s contribution rate is calculatedon the basis of the expected total expenditure in the coming fiscal year plus areasonable contingency reserve. In a health system the contingency reserve mayvary from less than half to the equivalent of one year’s expenditure. That levelof contingency reserve would ‘‘buy’’ enough time for the scheme to adjustbenefits or contributions to new realities. The actuarial equilibrium shouldnormally be defined by law.
The following paragraphs deal mainly with pension schemes as the mostprominent long-term benefit schemes, where setting the necessary level ofreserves is somewhat more complicated.
Actuaries commonly distinguish three financing methods that createdifferent levels of reserves in a pension scheme:
. virtually no funding (i.e. PAYG),
. full funding, and
. intermediate funding (i.e. partial funding).
It has already been mentioned that the determination of pension levels(i.e. the level of benefit protection in a society) and the financing of the schemeare in theory mathematically independent areas. This can be demonstrated bytable 5.2 which shows that both major types of pension benefits, namelypensions calculated on the basis of the defined-benefit method and thosecalculated on the basis of the defined-contribution method, can be financed byeach of the three main financing methods. But before we explore thatrelationship, we should take a closer look at the definition of ‘‘defined-benefit’’and ‘‘defined-contribution’’ schemes (see box 5.2).
Private sector pension schemes are governed by rules that usually requirefull funding – in other words, they need to have sufficient resources at theirdisposal to honour their obligations should the insurance company or the
Table 5.2 Independence of financing methods and benefit formulae
Type of benefit formula PAYG Partial funding Full funding
DC formula NDC schemes(e.g. Latvia,Poland, Sweden)
Could be achievedin NDC schemes withdemographic bufferfunds
Mandatory savingsschemes in LatinAmerica (e.g. Chile,Mexico, Peru)
DB formula Tax-financed first-tiersystems (e.g. Denmark,Netherlands), contribution-financed systems(e.g. France, Germany)
All social securityschemes with higherthan PAYG fundinglevel (e.g. Cyprus,Japan, United States)
Occupational pensionschemes (e.g. UnitedKingdom), some rarecases of socialsecurity schemes(Kuwait)
228
Financing social protection

Box 5.2 Defined-benefit and defined-contribution schemes:
A terminological excursion
In a defined-benefit (DB) scheme, the scheme’s regulations define abenefit level that may have no strict relationship with the amount ofcontributions actually paid by the contributor during his or her career.A good example is the following pension formula for old-age pensions:
PENS ¼ (n� 0:015 þ 0:2)�RW if n 4¼ 15 (5:2:1)
where:
n is the number of contribution yearsRW is the reference wage0.015 is the accrual rate.
The reference wage is the wage indicator on which the pension maybe calculated. This could be, for example, the average of the last threeannual wages before retirement, or the adjusted career average wage. Inboth cases a ceiling could be applied to the amount of wages that entersinto the calculation. In the above case, after 40 years of contributions aworker would receive a pension of 40�1.5 per cent, plus 20 per cent of thereference wage, hence a total of 80 per cent of the full reference wage. Thatmay or may not be generous. If the reference wage is a career average, forexample, and the annual wages entering into the carer average calculationwere not indexed to compensate for inflation, then the reference wage maybe relatively low compared to the pension recipient’s last wage. This meansthat the ratio of the amount of pension to the last wage (the replacementrate of pensions) may also be very low. A low replacement rate in turngenerally signals a relatively big drop in the standard of living when aperson retires. Also, pensions may not be indexed during the pensioner’slifetime, which means that the purchasing power of an initially relativelyhigh pension may diminish quite quickly as a result of inflation. In caseswhere n < 15 (i.e. if the person has less than 15 insurance years), there maybe only a lump-sum payment instead of a pension.
In any case, the above formula makes the pension independent fromthe contributions actually paid by the individual. Insurable earnings enterinto the equation but the actual contributions paid on these earnings donot. The pension rights earned during a career may have been paid for byvery low contribution rates in young pension schemes, or by very highcontribution rates in old schemes serving a very old population.
In a defined-contribution (DC) scheme the total amount of contribu-tions paid is generally accumulated in an individual account. Theaccumulation includes the accumulation of interest earned duringthe active career. At the time of old-age or invalidity pension receipt thebalance in the account is divided by an annuity factor, which is in factthe present value of a lifelong pension of 1 currency unit (possiblyadjusted for inflation). In an MRS scheme the total amount of balances is
229
Financing techniques

occupational pension scheme be dissolved. Public pension schemes, which arebacked by a societal promise guaranteeing their liquidity and indefiniteexistence, do not require the same level of funding; their level of funding isdetermined by objectives other than the exclusive financial safeguarding ofpension promises.
The level of funding in a social security scheme is defined by the legaldefinition of the scheme’s actuarial equilibrium. A private pension scheme is inactuarial equilibrium if at each point in time the amount of reserves is equal to
actually available in the scheme. Theoretically the scheme could beliquidated at any given point in time and the total amount of contributionsand earned interest could be reimbursed to all active members, and thepensioners could receive the present value of their expected remainingpension payments till the end of their lives. In this case the simplified‘‘pension formula’’ for a standard old-age pension would look as follows:
PENSt ;x ¼ BALt ;x= €aax (5:2:2)
with €aax ¼P1
t ¼ 0
�Lxþt � (1 þ w )t
�=�Lx � (1 þ i)t
�where:
t ¼ 0; . . . ;1 is the year of pension receipt,BALt,x is the balance in the individual accounts at age x in
year tLx is the number of people surviving till age xw is the annual rate of adjustment of pensions (assumed
equal throughout pension receipt)i is the interest rate (again assumed equal throughout
pension receipt)
The latest arrival in this definitional context is the notional defined-contribution (NDC) scheme. These are actually non-funded schemes (likethe pension schemes in Sweden and Latvia) which simply use the formulaof the DC scheme as a benefit formula without having the actual amountof reserves to back up all the entitlements. They sometimes assume thatthe annual rate of adjustment of pensions is identical to the interest rate.In this case the pension formula would look even simpler as the ax wouldturn into the life expectancy at retirement age ex:
PENSt ;x ¼ BALt ;x=ex ð5:2:3Þ
It can be mathematically shown that these schemes are close cousinsof DB schemes with actuarial increments or reductions to account for lateor early retirement (see Cichon, 1999a).
Box 5.2 (cont’d)
230
Financing social protection

the present value of all liabilities of the scheme, including the present value ofall pensions in payment as well as the present value of all pension rightsaccumulated by active contributors. If this condition is met then the scheme isfully funded. The corresponding reserve level is called the terminal fundinglevel, since the reserves are sufficient to finance all present benefit obligationsif the scheme were to be terminated at a given point in time. With the exceptionof very few social insurance schemes, such as the Social Insurance Fund inKuwait, no major social security pension scheme pursues a similar fundingstrategy.
In social security the actuarial equilibrium is a discretionary concept.Technically it is usually stated in the form of a provision in the social securitylaw which stipulates:
(a) that the scheme has to maintain a certain level of funding of k times theannual expenditure (i.e. the funding ratio)
(b) for a certain number of years x (i.e. the period of equilibrium).
The periodical actuarial review of many national social security pensionschemes tries to establish whether their present and likely future financial statuscomplies with the legally defined actuarial equilibrium. If this is not the case,then the valuation will make recommendations on how that equilibrium can berestored. It should be noted here that the financial equilibrium and the actuarialequilibrium are closely related but are mathematically by no means identical.Being in financial equilibrium in the long run does not mean that the scheme isin actuarial equilibrium at each and every point in time. Likewise, if thescheme is in actuarial equilibrium at a certain point in time, that does notmean that it will also be in equilibrium beyond the actual period of equilibrium.Ideally, an actuarial valuation should propose a sequence of contribution ratesfor the future that would keep the scheme in a permanent actuarial equilibrium;this would then also mean that the scheme would be in ‘‘close financialequilibrium’’. However, this would require exact projections for an unlimitedperiod, which is hardly a realistic expectation.
If – in the legal definition of actuarial equilibrium – k is smaller than unity(i.e. the scheme holds less than the equivalent of one year’s expenditure asreserves) and x equals 1, then the scheme is financed on a PAYG basis with asmall contingency reserve. A bigger k indicates that the scheme is at leastpartially funded. Internationally, a wide variety of rules are applied: in theUnited States, for example, k is relatively high and x equals 75 years, whereasin Germany k is smaller than 1 and x is only 15 years. A full terminal fundinglevel of reserves would lead to a much bigger k, which would in each casedepend on population mortality rates, on interest rates and on the benefitprovisions of the scheme. Recent ILO calculations for the social securityscheme in Trinidad and Tobago, for instance, indicated that the terminalfunding level of k would be in the order of 24 in a near-stationary state.
231
Financing techniques

It should be noted in this context that, from a national perspective, complexand pluralistic systems composed of PAYG tiers and fully funded tiers arenothing other than a partially funded pension system. Fully funded nationalpension systems are thus an exception rather than the rule, but a pension systemmay well have fully funded components.
5.1.2.4 Sources of financing
This section examines only public formal social protection systems, which havefour types of revenues:
(a) taxes, in the form of a share of general revenues or taxes earmarked forsocial protection purposes;
(b) social security contributions paid by employers and/or workers;
(c) investment income; and
(d) a wide range of other revenues, which ordinarily play only a marginalrole.
Social protection schemes are generally categorized according to whetherthey are dominantly tax financed or contribution financed. Fully tax-financed or fully contribution-financed schemes (and hence systems) arerare. Most NSPSs are actually financed through a mix of sources. Evenmany dominantly contribution-financed subsystems, such as pension schemes,are often subsidized to some extent from general revenues. The degree ofmixed financing in selected national public pension schemes is presented intable 5.3.
In practice, social protection benefits can be financed using any source ofgovernment revenue. The source of financing is usually related to thecharacteristics of the benefit. Universal benefits are normally funded fromgeneral tax revenues but they can be funded from mandatory contributions,possibly including contributions from the unemployed and non-workers.Means-tested social assistance type benefits (such as the public pensionscheme in South Africa) are normally funded from general tax revenuesbecause the low-income recipients of these benefits might not qualify on thebasis of accumulated contributions. Provident funds and individual accountDC plans are financed by workers’ contributions withheld from wages, oftenwithout a corresponding contribution from employers. Social insurancesystems are usually financed through shared contributions of employers andworkers, at times complemented by government contributions (see table 5.3).To the extent that schemes are funded, investment earnings also help tofinance benefits.
In Africa, where coverage is low, social insurance schemes are usuallyfinanced entirely from employers’ and workers’ contributions and investmentincome. General tax subsidies for schemes with low population coverage couldhardly be justified on equity grounds. In countries where coverage is low but the
232
Financing social protection

government contributes to the social security system from general revenues, ifthe source of general revenues includes taxes from low-income people then thistype of social security financing is regressive, precisely because in countrieswith low coverage it is the low-income workers who tend not to be covered.Primarily tax-financed social protection systems are generally progressive(and are thus often more efficient at alleviating poverty than social insuranceschemes). They usually provide flat-rate benefits and are paid also to peoplewho have little or no attachment to the labour force or have limited capacity tocontribute (as in Denmark and the Netherlands, for example). Financing canalso come from earmarked taxes (reserved specifically for social security
Table 5.3 Current contribution rates in selected national social securitypension schemes
Country Total contributionrate (in % of totalinsurable earnings)
Employer share(percentage points)
Employee share(percentage points)
Governmentcontribution
France 14.85 8.2 6.65 Variable subsidies
Belgium 16.36 8.86 7.5 Annual subsidies
Luxembourg 24 8 8 8% of totalinsurable earnings
Canada 7 3.5 3.5 Cost of basicuniversal pensionand cost ofincome-testedbenefits;contributionsfinance onlyearnings-relatedtier
Italy 32.7 23.81 8.89 Cost of socialassistance benefitplus overall deficit
Germany 19.5 9.75 9.75 Cost of non-insurancebenefits
Gabon 7.5 5 2.5 None
Poland 32.52 16.26 16.26 Funds for minimumpension guarantee
Pakistan 5 5 None Subsidies as needed
Trinidadand Tobago
8.4 5.6 2.8 Full cost of socialassistance benefits
United States 12.4 6.2 6.2 Cost of specialbenefits andmeans-testedallowance
Republic of Korea 9 4.5 4.5 Partial cost ofadministration
Source: SSA (1999).
233
Financing techniques

financing), or from general revenue taxation. A portion of governmentcontributions to social security in Panama, for example, comes from a tax onalcohol. Proceeds from the privatization of government enterprises can alsobe used to finance public pensions or the transition from one pension system toanother. Part of the financing of Bolivia’s DC system, for example, came fromthe privatization of several state-owned industrial enterprises.
In the early 1990s France introduced an innovative hybrid between tax andcontribution financing of social protection, called contribution socialegeneralisee (CSG). This general social contribution is described in box 5.3.
Box 5.3 A hybrid form of social protection financing: The case of the
contribution sociale generalisee (CSG) in France1
During the 1990s social security financing in France underwent anumber of important changes. Despite a relatively high level of publictaxes (around 45 per cent of GDP) income taxation was comparativelylow by international standards, and there was a chronic socialprotection deficit. The CSG, which came into effect in 1991 with theaim of introducing an element of taxation into the financing of socialsecurity, has since become one of the key elements of social protectionfinancing.
Almost every individual in France is now covered by social security.Traditionally, social security financing had been almost completelyassured by workers and employers, through wages. As this was bothinequitable and financially insufficient (since the sum of wages tends togrow very slowly), the CSG was created to introduce taxation into socialsecurity financing. It has since been used to improve the financialequilibrium of the different schemes and to ensure greater equity amongthe population covered by social security, through a diversification ofresources, mainly through taxation of capital income.
Indeed, the CSG has broadened the financing base of socialprotection. It has every legal feature of a tax (and was in fact recognizedas such by France’s Constitutional Council) except that it is not allocatedto the state budget but to the social security schemes themselves (health,family and old-age funds) – which is a classic feature of a contribution.Unlike social security contributions, however, it gives no entitlement tobenefits. All individuals fiscally resident in France pay the CSG. The taxbase includes the following:
. Income from employment (wages of public and private sector workers,bonuses).
. Replacement income (old-age and invalidity pensions, unemploymentbenefits, early retirement pension, illness, maternity, work injury, andoccupational disease benefits). Reduced rates apply to low-incomehouseholds that do not pay income tax. Most family benefits areexonerated, as is income from social assistance.
234
Financing social protection

. Income from assets (revenues from estate – land and property, capitalincome, life insurance income, fixed-yield investment, equity divi-dends, capital gains).
In 1993 it was estimated that while 87 per cent of income fromemployment was subject to the CSG, for replacement income and fortaxed asset and investment income the figure was less than 50 per cent;by 1997, however, most of the exonerated assets had been incorporatedinto the calculation base.
Box table 5.3.1 CSG tax base, 1993 (in billion French francs)
Household income CSG base Share (%)
Employment income 3 107.4 2 706.9 87
Replacement income 1 353.8 641.4 47
Income from assets 558.2 245.7 44
Source: Syndicat National Unifie des Impots, 1997.
The CSG is collected by different institutions depending on the natureof the tax base (social security institutions for employment andreplacement income, tax authorities for income from assets). The CSGrate was set at 1.1 per cent in 1991 and has already been raised threetimes. At the time when the CSG came into effect the old-age pensioncontribution rate was cut by 1.05 per cent. The CSG was not deductiblefrom income tax. A first increase in 1993 was not compensated andremained non-deductible. The second increase, however, was offset by areduction in the health care contribution rate, as was the third; both ofthese increases were income-tax deductible. As the CSG base is broaderthan that of social security contributions, the net effect of substitution ispositive.
Box table 5.3.2 Evolution of CSG rates since 1991
Date Rate (%) Reduction of social
security contributions (%)
Deductible from
income tax (%)
1991 1.1 1.05 (old age) No
1 July 1993 2.4 No No
1 January 1997 3.4 1 (health care) 1
1 January 1998 7.5 (6.2, 3.8 or0 for replacementincome, means-tested)
4.75 (health care) 5.1
The allocation of CSG income is linked to the historical development ofthe contribution as follows:
Box 5.3 (cont’d)
235
Financing techniques

. 1.1 per cent Caisse Nationale d’Allocations Familiales (CNAF) (familybenefit fund)
. 1.3 per cent Fonds de Solidarite Vieillesse (FSV) (old-age fund)
. 5.1 per cent Caisse Nationale d’Assurance Maladie (CNAM) (health fund).
CSG income growth is shown in box table 5.3.3.
Box table 5.3.3 Revenues generated by the CSG since 1991 (in billion euros)
1991 1992 1993 1994 1995 1996 1997 1998 1999
4 6 8 13 14 14 21 46 51
(% of GDP) 0.4 0.5 0.8 1.1 1.1 1.2 1.7 3.5 3.8
Source: Assemblee Nationale francaise, 2000 (French Parliament report) and ILO calculations.
In 1999 CSG returns represented about 25 per cent of centralgovernment revenues, and roughly the same proportion of the incomeof the main social security scheme. Moreover, that was the first year thatCSG returns were higher than income tax. It is important to note thedifferences between these two charges: the CSG is a flat-rate tax, whereasincome tax is progressive. Nevertheless, both taxes have their ownredistributive effects: the CSG levied on capital income, for example,obviously affects higher-income groups more. In addition, the CSG allowsfor reductions in social security contributions, which has resulted in netsalary increases together with a transfer of charges from low-income tohigh-income households. Likewise, the CSG implies a transfer of chargesfrom the economically active to the inactive.
Box table 5.3.4 Relative importance of the CSG versus income tax(in billion French francs)
1991 1992 1993 1994 1995 1996 1997 1998 1999
CSG 28 38 55 85 89 92 138 302 337
Income tax (Impot surle revenu des personnesphysiques)
304 307 310 296 297 314 293 304 334
1 euro = 6.55957 French francs.
Source: Assemblee Nationale francaise, 2000 (French Parliament report).
There have been many changes and improvements in the provisionsgoverning the CSG since its inception, making it one of the mostprominent, but also one of the most complex taxes in France. Almostevery government, whatever its political orientation, has strengthened therole and structure of the CSG.
Note
1 This box was prepared by Florian Leger of ILO FACTS.
Box 5.3 (cont’d)
236
Financing social protection

The source of financing has some bearing on the level of funding.Dominantly tax-financed social security schemes are generally financed on aPAYG basis, whereas contribution-financed schemes can operate at any level offunding. Second-tier pension schemes, most notably occupational pensionschemes, are usually financed on a contribution basis and are generally fullyfunded. It should be noted, however, that some countries have unfundedoccupational pension schemes. In France, Germany, Luxembourg and Japan,pension schemes provided in the private sector are not fully funded. In France,the mandatory industry-wide pension schemes use PAYG financing. InGermany and Luxembourg, and to a lesser extent in Japan, most occupationalpension schemes are financed using book reserves, meaning that no separatefund is established but the pension promises are backed by the assets of thecompany. During the 1950s and 1960s, this has especially helped to financemajor corporations which did not have to seek external financing to the sameextent as enterprises in other countries. Pension promises, however, are securedby a national reinsurance co-operative.
The differences between contribution and tax financing have been muchdiscussed in the past. The comparative strengths and weaknesses of the formerin relation to the two major forms of tax financing of social protection pensionschemes (general revenue financing or earmarked tax financing) aresummarized in box 5.4.
Box 5.4 Tax versus contribution financing of mandatory
pension schemes
In theory, contribution-financing and tax-financing options have certainadvantages and disadvantages in specific economic and socio-economicenvironments. The main characteristics generally attributed to thedifferent financing options are set out in box table 5.4.1. The table canalso be used as a policy checklist by social protection planners setting upor reforming a national or regional public pension scheme.
Box table 5.4.1 Contribution financing versus tax financing of statutory pensionschemes: A policy checklist
Characteristics
or impact on:
Contribution
financing
General revenue
financing
Earmarked tax
financing
Populationcoverage
(1) Appropriate forschemes that do notcover the total popu-lation (equity con-siderations under thecollective equivalence
Appropriate foruniversalcoverage
Appropriate foruniversal coverage,but can also beused for partialpopulation coverage(if taxes can be targeted,
237
Financing techniques

Box table 5.4.1 (cont’d)
Characteristics
or impact on:
Contribution
financing
General revenue
financing
Earmarked tax
financing
principle), but can beused for universalcoverage(2) Could lead tounwanted exclusion oflow-income groupsfrom coverage
consumption taxes onagricultural inputs,such as fertilizers,could be used forexample to co-financea farmers’ pensionscheme)
Administration Higher administrativecost of collection thanin general revenuefinancing
Easy toadminister, asno extra cost foradministration
Collection easier thanin case of contributionsbut more costly thangeneral revenuefinancing
Compliance Thought to be high ifbenefits are attractive,reliable andincome-related
As high as forgeneral taxcollection,thus possibly lowerthan contributionfinancing
Same as generalrevenue financing
Benefit design (1) Generally thoughtappropriate for income-related benefits as itpermits a closerelationship betweenbenefit levels andcontribution payments(2) In practice theonly option for DCschemes
Generally usedfor flat-rate benefits
Generally the sameas general revenuefinancing but incase of earmarkedincome tax could beas appropriate ascontributions forearnings-relatedbenefit schemes
Income policyconsiderations
(1) Permits financingaccording to the abilityto pay (principle offinancial solidarity)within the coveredgroup(2) Also permits theexclusion of highearners or parts oftheir incomefrom coverage
Can makesocialprotectionfinancing moreprogressive
Basically the sameas (1) undercontributionfinancing
Financing (1) Allocation of publicfunds to pensions moretransparent and reliableand more (though notfully) independent ofoverall governmentbudget decisions(see Chapter 4)
(1) Provides noearmarked sourceof income for thesocial protectionscheme and con-sequently for thepension system,making benefit
(1) Combination ofcontribution(earmarking)and tax financing(governmentcontrol), actualform depending onlegislative provisions
Box 5.4 (cont’d)
238
Financing social protection

Box table 5.4.1 (cont’d)
Characteristics
or impact on:
Contribution
financing
General revenue
financing
Earmarked tax
financing
(2) Maintenance offinancial equilibriumrequires explicitchoices on long-termbenefit levels(3) Offers the optionof accumulatingflexible level ofreserves (and henceof pursuing secondaryeconomic policy goals)
levels subjectto annual budgetdecisions; as aresult, thought tobe less reliablethan contributionfinancing(2) Provides greaterflexibility and overallgovernment controlover public sectorfinancing(3) Generally usedonly for PAYGfinancing
and practice offinancial governance(interventionist vs.non-interventionist);in theory couldaccumulate reserves,but in practicethis is unlikely
Economicimplications
(1) May increaselabour cost in labourmarkets wherecontributions cannotbe passed on to theinsured persons,thereby reducinglabour demand(2) May provideincentive forinformal sectoractivity rather thanformal employmenton a microeconomiclevel for bothemployers andworkers
(1) No directrepercussions onthe labour marketin a macroeconomicpolicy context(2) same as (2) incontributionfinancing withregard toemployees
Same as forgeneral taxation
Governance Generally thoughtappropriate fororganizationallyindependentschemes governedby tri- or bipartitegoverning bodies
Generally usedfor schemesoperated bygovernmentdepartments
Could be used forindependent andgovernment-operated schemes
Box table 5.4.1 and the reasoning developed in Chapter 4 showclearly that far from being only a matter of social protection policy,the choice of a financing option also involves public finance andfiscal policy issues, as well as economic (or investment policy)considerations.
The complexity of the repercussions of the different financing optionsmay explain why most governments opt for mixed financing of theirNSPS.
Box 5.4 (cont’d)
239
Financing techniques

5.1.3 Application of the different types of
financing systems
While most financing systems can theoretically be applied to all socialprotection benefits, certain preferences have developed in international practice.Table 5.4 provides a broad overview of the financing systems used in differentcountries for major benefits or transfers. The transfers are grouped into threemajor categories: health care, pensions, and others. We will discuss theirpotential financing systems in that order in the following sections. Table 5.4thus also provides a ‘‘roadmap’’ through the next three sections of the chapter.
Whatever the financing system, all benefits schemes ultimately have to fulfilthe condition of financial equilibrium (see formula 5.1 above). If schemes arecontribution financed, then the collection of contributions and the returns oninvestments have to be scheduled in such a way that resources are availablewhen the benefits fall due. The same applies to tax financing; however, sincetaxes are collected from many different tax bases, for many different purposesand in many different forms, the equivalence is often less obvious. One way ofmaking financial equivalence explicit is to collect taxes earmarked for specificpurposes, for example health care. If taxes are not earmarked for socialprotection purposes then one cannot project easily whether future resources ofthe social protection system will be sufficient to cover expenditure without acomprehensive or at least a medium-term financial plan on the part of thegovernment. There are many competing uses for scarce tax money in thegovernment budget, and if allocations of tax resources to an alternative use –the military, say, or the education system – are higher than anticipated, theymight well crowd out resources planned for social protection. The futurefinancial soundness of a tax-financed social transfer system can only beassessed if financial planning encompasses the total government budget.
Table 5.4 shows very clearly that pragmatic preferences have developed inmany social protection contingencies with regard to the actual choice offinancing systems. The most complex menu of financing options is obviouslythe one open to pension schemes. The financing of pensions will therefore bedescribed in more detail than that of other schemes (see section 5.3).
5.2 FINANCING HEALTH CARE BENEFITS
The financing of health care benefits is markedly different from that of other socialprotection benefits. Health care benefits are usually benefits in kind rather thancash transfers, but even as in-kind transfers they complement the income of therecipient, who does not have to pay the user charge or the market price for theservices received. The benefits are delivered by provider units (doctors in healthcentres or in private practice, hospitals, pharmacies, etc.) which may or may notbelong to the financiers of care – that is, the government or a social or privateinsurance. These providers have economic objectives of their own: the private
240
Financing social protection

Table 5.4 International overview of applied financing systems
Type ofbenefit
Tax-financedPAYG
Social insurancecontributionsPAYG
Social insurancecontributionsPartially funded
Social insurancecontributionsFully funded
Private insuranceand other privatesources
Health care National healthservice or publicservice healthcare systems inUnited Kingdom,Scandinavia, someformer socialistcountries
Bismarckian socialinsurance schemes(Central Europe,Thailand, manycountries in LatinAmerica)
United States systemfor the general work-force, second-tiersystems in manycountries (reservesare built for old ageof insured persons);mandated privateinsurance coveragein Switzerland
PensionsInvalidity,survivors’,old-age
DB schemesuniversal schemes(first tier), UnitedKingdom, Ireland,Denmark, Canada,Netherlands
Classic Bismarckianpension DB schemesin Germany, France,Austria, Belgium,first tier in China
Classic Bismarckianpension DB schemesin United States,Luxembourg,Cyprus, all of theCaribbean, Africaand Asia
Rare exceptionin case of DBschemes (e.g.Kuwait)
DB schemes assecond tier (e.g.Switzerland),DC schemes inLatin America(e.g. Chile, Peru,Argentina, Mexico)
Other benefitsSocial assistance(general assistanceto cover cost ofliving, or means-tested supplementsto other benefits,e.g. pensions)
Means-testedalmost everywhere(United States,United Kingdom,Germany, France,Scandinavia, etc.)
Universal BasicIncome
Scheme thus farnot employed anywhere,but taxes or earmarkedtaxes would be the onlylogical source
241
Fin
an
cin
gte
ch
niq
ues

Table 5.4 (cont’d)
Type ofbenefit
Tax-financedPAYG
Social insurancecontributionsPAYG
Social insurancecontributionsPartially funded
Social insurancecontributionsFully funded
Private insuranceand other privatesources
Short-term cashbenefits(sickness, maternity,unemployment)
Classic short-term socialinsurance schemes; inmost countries whereapplied, earnings-relatedbenefit with some employerco-payments (payment ofsickness or maternity benefitsfor some weeks or severancepay in case of unemployment)
Same asunder PAYG
Other short-termbenefits (housing,food stamps, educa-tion vouchers, etc.)
Wherever this systemis used, general orearmarked taxationpossible
Employmentinjury benefits
Non fault social insurance eitherwith uniform or industry- orfirm-specific experience-ratedcontribution rate
Non fault socialinsurance either withuniform or industry-or firm-specificexperience-ratedcontribution rate
Non fault socialinsurance either withuniform or industry-or firm-specificexperience-ratedcontribution rate
In many formerBritish colonies,employment injuryis still an employerliability paid fromemployer sourceson PAYG principles
Family benefits Tax-financed universalbenefits, sometimes withmeans test, in Germany,United Kingdom,Ireland, Scandinavia
Social insurancebenefit in Franceand French-speaking countriesin Africa
Long-term care PAYG-based,social assistanceprinciples in mostcountries
Special branches ofsocial insurance inAustria, Germany,Luxembourg
242
Fin
an
cin
gso
cia
lp
rote
ctio
n

entities among them can generally be expected to maximize income, andthe public sector ones to reduce stress and workload. In both cases they mostlikely also wish to maintain or earn professional recognition in their own peergroup. The economic relationships on the health care market are among themost complex of all product markets. Box 5.5 provides an overview of its basiccharacteristics. However, financial planners and political decision-makers requirea much deeper understanding of these relationships than can be listed here.A detailed analysis thereof may be found in Cichon et al. (1999, Issue Brief 1).
Box 5.5 Basic characteristics of the health care market
The health care market has some specific characteristics that distinguish itfrom most other markets for goods and services:
. the need for health services cannot be substituted easily by otherproducts;
. the individual need for services is highly uncertain;
. how need is transformed into demand depends on a variety of factors,including physical access to services, information about availableservices and their potential beneficial effect, and the ability to pay;
. the structure of the supply of services is dominated by provider peergroups (such as leading doctors in hospitals or doctors in privatepractice); in other words, it is ultimately the providers who determine toa large extent the baskets of goods and services offered in a countryand those that are consumed in specific cases of illness;
. third-party payers, necessary to facilitate the financing of uncertainindividual demand, also impact on the demand and pricing of healthservices;
. government regulations and legal liabilities of providers co-determinethe quantity and structure of services delivered;
. the health care labour market is characterized by severe imbalances:
(a) the income distribution among health professional is extremelyskewed: medical professionals in leading positions often earnmany times the average income of the population they serve,while junior doctors, nurses and ancillary staff may receiverather meagre salaries;
(b) the perceived high income and status of medical professionalslead to permanent over-abundance of doctors in industrializedcountries and brain drain in developing countries;
(c) high education cost hinders the training of a sufficient number ofhealth professionals in many developing countries;
243
Financing techniques

Despite the complexity of the health care market and potentially unlimiteddemand, relevant financing systems (that is, third-party payment systems) haveto be designed rationally: the contractual relationships in the triangleconstituted by contributors/taxpayers/patients – providers – third-party payershave to be clearly defined in the design of the financing system. The design hasto provide answers to the following five questions:
(1) What is covered (benefit package)?
(2) Who is covered?
(3) Who pays for what?
(4) Who provides what?
(5) How are providers paid?
The last item is of crucial importance for cost control. The way in whichproviders are paid – on a salary basis, by capitation, by fee-for-service (forindividual medical acts, by case, by day), or out of an overall budget – has amajor influence on their economic behaviour. Without going into great detail,it is obviously clear that providers who are paid on the basis of an uncappedfee-for-service schedule have an incentive to maximize the volume of careprovided, possibly beyond the amount and structure that would yield optimummedical results. At the other extreme, providers paid on an overall budgetbasis would most likely economize on time and cost. If paid on capitation,
(d) professional health care managers and administrators are nottrained in sufficient numbers;
. the health delivery system in developing countries operates undersevere budgetary and general resource constraints.
The demand for health services is almost unlimited but marginalhealth gains are approaching zero above a certain expenditure level ofproduction and expenditure at a given level of medical knowledge andtechnological development. The key problem is that nobody knowsexactly how to define the spending cut-off point, as health gains aredifficult to measure and health expenditure generally competes with otheruses for scarce societal resources. Moreover, with their privilegedknowledge of the necessity and effectiveness of the services they offer,providers – who are either too numerous (in many industrializedcountries) or too few (in many developing countries) – are in a positionto determine their own income and thus influence resource allocation inthe health care sector.
Box 5.5 (cont’d)
244
Financing social protection

they may spend more time attracting new patients than treating those alreadyregistered with them. Payment by case gives them a clear incentive toincrease the number of cases and inflate the diagnosis of the cases treated,turning them into higher value added cases. Hospitals paid on a per diembasis have no incentive to send their patients home as long as their capacityutilization is below 100 per cent.
It is clear that a well-balanced provider payment mechanism is crucial for asound financial architecture of all national health care systems. As elsewhere inthis chapter, we will concentrate on the options available in financing a givenlevel of expenditure. The estimation of expenditure levels and the impact ofprovider payment mechanisms on the expenditure of health care financingsystems are described in full detail in Cichon et al. (1999).
5.2.1 National health care financing systems
There are different health care financing schemes operating in variouscountries (see Cichon et al., 1999, figure 3.2), ranging from dominantlyprivately financed systems (like the one in the United States and the mandatedprivate insurance scheme in Switzerland) to dominantly tax-financed systems.In fact, all national health care financing systems are pluralistic – that is, theyconsist of a combination of different schemes. In all countries the State willplay some role in the delivery of services, most likely in basic healthpromotion and prevention (such as vaccination campaigns) or in basic publichealth (hygiene); at the other end of the spectrum, in many countries highlyexpensive and specialized tertiary care hospitals have to be maintained.Employers in numerous countries will finance some type of on-site healthservices in their enterprises. Pluralism in health care financing is unavoidable,as the better-off will always find ways to buy the care they consider adequate.Table 5.5 breaks down total health expenditure by type of financing frompublic and private sources.
Table 5.5 shows that even in the United States, often said to be the epitomeof a dominantly private health care system, the public share of health financingis about 44 per cent, higher than in many developing countries where out-of-pocket financing of scarce services is much more frequent than in industrializedcountries.
Due to the complexity of health markets and the inevitable public-privatemix of the financing system, careful design and meticulous control of the latterare of crucial importance from both a health care and a fiscal policy point ofview. We have seen in earlier chapters that there are specific limits to theoverall social expenditure in every country. Health costs are a part of thisenvelope of possible expenditure. Unlike many other social expenditure items,health expenditure enjoys a high degree of public acceptance. If health costs arenot tightly controlled then there is an obvious risk that they might crowd outother social expenditure. In other words, due to the overall limits of spending,
245
Financing techniques

uncontrolled growth of health expenditure might be financed by increasedlevels of poverty. Complementary to the widely held view that bad health is anattribute of poverty, there is a risk that over-dimensioned health expenditure forsome portions of the population might create poverty for others. On the otherhand, the health sector is an employment-intensive sector. National govern-ments might well use it to increase and encourage service sector employmentand thus combat unemployment.
The financial management of a national health sector shows more clearlythan the management of any other social protection subsystem that:
(a) the sector has to be governed comprehensively; the classic instrument offinancial governance is a national health budget (see, for example, Cichonet al., 1999, Chapter 5);
(b) the management of the health sector has to be aligned closely with a globalnational view of the social sector; the technical instrument to be used hereis a national social budget (see Scholz et al., 2000).
Table 5.5 The public-private mix in health financing, selected countries, 1997
Country Public expenditureon health in % of GDP
Private expenditureon health in % of GDP
Total expenditure onhealth in % of GDP
Bangladesh 2.4 2.5 4.9
Bolivia 3.4 2.4 5.8
Brazil 3.2 3.3 6.5
Bulgaria 3.9 0.9 4.8
Canada 6.2 2.4 8.6
Central AfricanRepublic
2.0 0.9 2.9
China 0.7 2.0 2.7
Czech Republic 7.0 0.6 7.6
Egypt 2.6 4.4 7.0
France 7.5 2.3 9.8
Germany 8.1 2.4 10.5
Ghana 1.5 1.6 3.1
India 0.7 4.5 5.2
Italy 5.3 4.0 9.3
Mexico 2.3 3.3 5.6
Nigeria 0.9 2.2 3.1
Poland 4.4 1.8 6.2
Sri Lanka 1.4 1.6 3.0
Switzerland 7.0 3.1 10.1
United Kingdom 5.6 0.2 5.8
United States 6.0 7.7 13.7
Source: WHO (2000).
246
Financing social protection

The instruments used for financing a pluralistic health system are listed intable 5.6. The design of an overall national health care financing systeminvolves a rational choice as to what mechanism is used for which services andfor which covered group.
All of these financing instruments are PAYG-based. Hardly any systems(except for some private insurance arrangements) create reserves that exceedthe size of contingency reserves. Tax-financed systems almost by definitionmaintain no reserves. Social insurance schemes generally maintain acontingency reserve, which caters exclusively for unforeseen expenditurehikes during a budget year, and which is generally measured as a multiple ofbenefit experience. The multiple is generally smaller than 1.
It may well be asked why social health insurance schemes do not maintain atechnical reserve which would help to finance the negative cost effects of ageingonce they occur. In principle health insurance schemes with wide populationcoverage face the same ageing-related cost increases that pension schemes willhave to confront. However, thus far conventional wisdom among healthinsurance managers and planners has been that demographic development is oneof the major cost determinants of any health care scheme but not necessarily thecritical one. Ageing – even if it may appear dramatic – is still a predictable andrelatively slow process. Health care costs are much more directly influenced bymedical inflation and changes in the general levels and structure of utilizationthan by pure demographic shifts. Their effects are hard to predict, and norational rule on the level of necessary reserves can be devised. Reserves in ahealth care scheme might actually be counterproductive. In order to containtheir overall use in the health sector, resources have to be kept scarce. Theavailability of a sizeable technical reserve would send the wrong signal to healthproviders and patients alike. On the whole, short-term budget managementmight be the most rational way to finance health care schemes.
The application of most of the instruments used involves some actuarialtechniques. A basic set of formulae for calculating expenditure and the necessarycontribution rate in a social health insurance scheme are given in box 5.6.
Many national health care and social security schemes have failed to reach theinformal sector in urban and rural areas. Millions of people in developingcountries, but also increasingly in transition economies, find themselves out in thecold: working under informal conditions, they have no formal labour contract thatwould guarantee them access to the benefits of public social transfer schemes.They work without the right to sickness, invalidity or unemployment benefits andwithout the entitlement to survivors’ or old-age pension benefits. The nationalpublic service health care and social assistance schemes often lack the resourcebase to reach out credibly to people in remote rural areas or the slums of big cities.
It may be noted in this context that growing informal sectors are not justa social protection problem, but a problem for the State as a whole. Membersof the informal sector generally pay neither social protection dues nor any directtaxes, they are often not registered as workers, and the overall infrastructure
247
Financing techniques

Table 5.6 The menu of health financing instruments
Groups coveredby the scheme
Category ofservices
Possible financinginstruments
Informal sectorcommunities
Health promotionand prevention
Government financingInternational grants
Primary careservices
Government financingUser chargesContributionsto community-based schemesInternational grants
Secondary careservices
Government financingUser chargesContributions to community-based schemes (to a lesserextent than under primary care)International grants
Tertiary careservices
Government financingUser chargesInternational grants
Formal sector workersand their dependants(or groups thereof)
Health promotionand prevention
Government subsidiesInternational grants
Primary careservices
Government subsidiesUser chargesContributions to social insurance schemesPrivate insurance contributionsEmployer financing
Secondary careservices
Government subsidiesUser chargesContributions to social insurance schemesPrivate insurance contributionsEmployer financing
Tertiary care services Government subsidiesUser changesContributions to social insurance schemesPrivate insurance contributionsEmployer financing
Inactive former formalsector workers
Health promotionand prevention
Government subsidiesInternational grants
Primary care services Government subsidiesUser chargesContributions to social insurance schemesSubsidies from active members ofsocial insurancePrivate insurance contributions
Secondary careservices
Government subsidiesUser chargesContributions to social insurance schemesSubsidies from active members ofsocial insurancePrivate insurance contributions
248
Financing social protection

of the State is not built to meet their needs. If they pay taxes at all they have topay indirect taxes (such as value added tax, or VAT). Many of them live fromsubsistence farming and subsistence-level service activities, most of which arenot even subject to any form of indirect taxation. Poverty and destitution in theinformal sector are rampant. People find themselves simply excluded from thesociety as a whole rather than from social protection alone.
The existence and growth of the informal sector in societies and economiesis a major failure of overall governance, not just a failure of existing socialprotection mechanisms. It can thus be safely assumed that the long-termsolution for the problem of exclusion of whole subgroups of the populationfrom social protection coverage lies in the upgrading of overall nationalgovernance systems. However, proponents of community-based health careschemes argue that in the meantime something must be done for the people whoare living today and are affected by exclusion today (see Dror and Jacquier,1999). Community financing is currently being promoted as the second bestanswer to ensuring wider access to care. Its possible strengths and weaknessestherefore merit a separate section.
5.2.2 Community-based schemes for
the informal sector
Community schemes, sometimes also called micro-insurance schemes, couldconceivably deliver and finance a variety of benefits. However, most of them
Table 5.6 (cont’d)
Groups coveredby the scheme
Category ofservices
Possible financinginstruments
Tertiary care services Government subsidiesUser chargesContributions to social insurance schemesSubsidies from active members of social insurancePrivate insurance contributions, employer financing
Total population Health promotionand prevention
Government financing from general revenuesInternational grants
Primary careservices
Government financing from general revenuesor earmarked taxesUser chargesInternational grants
Secondary careservices
Government financing from general revenuesor earmarked taxesUser chargesInternational grants
Tertiary careservices
Government financing from general revenuesor earmarked taxesUser chargesInternational grants
249
Financing techniques

Box 5.6 Costing health care schemes: A summary of
calculation techniques
This box deals with basic calculation techniques of social insurancefinancing of health care, which is the most complicated case in publicfinancing of health care. The following formulae follow a classical three-step approach:
Estimation of expenditure (simplified formulae)
The principal formula for the projection of total benefit cost in thiscategory is as follows:
TBEðtÞ ¼X
j
FCj ðtÞ þ VCj ðtÞ ð5:6:1Þ
where:
TBE(t) ¼ total benefit expenditure in tFCj(t) ¼ fixed benefit cost for category of care j in year t andVCj(t) ¼ variable benefit cost in year t.
Fixed benefit cost is all cost items which – at least for the duration ofone financial year – are not directly dependent on the degree of utilizationof a provider unit (for example, salaries of regular staff). For the fixedbenefit cost, a budget plan for the next four to five years (predictionperiod) is usually established.
Variable benefit cost (assumed here that providers are paid on a percase basis) can be formulated as (variable j omitted here):
VC ðtÞ ¼Xs;x
VCs;x ðtÞ * COVPOPs;x ðtÞ * fs;x ðtÞ ð5:6:2Þ
where:
VCs,x(t) ¼ variable cost per case for a patient of sex s and ofage (group) x in year t
COVPOPs,x(t) ¼ the numbers of protected eligible persons of sex sand of age (group) x in year t
fs,x(t) ¼ frequencies of cases per protected person of sex sand of age (group) x in year t
Variable cost per case and frequencies are most easily modelled in thefollowing general recursive way:
VCs;x ðtÞ ¼ VCs;x ðt � 1Þ * ð1 þ vcs;x ðtÞÞ ð5:6:3Þ
fs;x ðtÞ ¼ fs;x ðt � 1Þ * ð1 þ ifs;x ðtÞÞ ð5:6:4Þ
250
Financing social protection

where:
vcs,x(t) ¼ the rate of increase of VCs,x(t) in year tifs,x(t) ¼ the rate of increase of fs,x(t) in year t
The rate of increase in cost per case (unit cost), which in this case ismainly the cost of materials and drugs, might be projected by thefollowing method. In principle, this method will also be applied toother cases:
1 þ vcs;x ðtÞ ¼ ð1 þ pðtÞÞ * ds;x ðtÞ ð5:6:5Þ
where:
p(t) ¼ the general inflation rate in year tds,x(t) ¼ the average deviation factor, which describes the average
deviation of the rate of increase in the unit cost from theobserved general inflation rate during the whole or a part ofthe observation period
The ds,x(t) for a single year during the observation period is calculatedas follows:
ds;x ðtÞ ¼ ðVCs;x ðtÞ=VCs;x ðt � 1ÞÞ=ð1 þ pðtÞÞ ð5:6:6Þ
Estimation of the total contribution base
TABðtÞ ¼Xi;s;x
CONTi;s;x ðtÞ � ABi;s;x ðtÞ ð5:6:7Þ
where:
CONTi,s,x(t) ¼ number of contributors in category i of sex s, age x inyear t
ABi,s,x(t) ¼ average assessment base (average income subject tocontributions)
Calculation of contribution rate
CRðtÞ ¼TBEðtÞ � OIðtÞ þ AC ðtÞ
TABðtÞð5:6:8Þ
where:
TBE(t) � OI(t) þ AC(t) ¼ the amount of total benefit expenditureminus other income OI(t) (non-investmentincome) plus administrative cost AC(t) dur-ing the whole period t
Contributions for the medium term are calculated in the same way asin the case of pension benefits (see box 5.10 on page 264).
Box 5.6 (cont’d)
251
Financing techniques

are presently focusing on the provision of health benefits. These schemes arefinanced by voluntary contributions of small groups of insured persons andcover the insured plus the members of their immediate family. As they areconsidered by some as a major new source of health care financing, we willexamine their potential contribution in more depth.
Most community-based voluntary health insurance schemes have severalcharacteristics in common. The following observations are based on first-handexperience in Uganda and Ghana, but a review of recent literature suggeststhat similar schemes in other countries encounter the same systemic problems.6
Community-based schemes often obtain services for their members from asingle provider, either a hospital or a health centre. Even if initially created bycommunities, most provider facilities now benefit from substantial externalsubsidies. These may take the form of payments of salaries of core healthcentre staff by the national or district governments or foreign donors, theprovision and maintenance of buildings or equipment, or general subsidies (forexample, Anglican Church donations to the Kisiizi Mission Hospital inUganda). In these cases ‘‘micro-insurance’’ thus denotes a pooled pre-paymentarrangement of user fees charged by a specific (or preferred) provider. In thisway the schemes smooth the potential financial consequences of illness forparticipating families while also stabilizing non-subsidy income for the(preferred) provider units.
It is obvious that the government and external donors are not covering theprovider units’ full operational cost. Provider units are thus dependent on thecollection of user fees or on other forms of subsidies from the community theyserve. It appears that health centres and hospitals in many developing countriesare fairly strict when collecting user charges. This is a perfectly rationalstrategy, in particular for provider units which operate their own scheme or co-operate closely with an affiliated community-based health financing scheme.Leniency in the collection of fees would undermine the credibility ofprepayment schemes.
Contribution collection rates are not easily determined in an environmentwith weak data, but statements from health centres and hospital staff in Uganda,for example, indicated that in spite of rigorous fee collection policies bad debtwas a relatively widespread problem. In all cases, debtors (patients or heads ofhousehold) are registered and if they make no further effort to repay their debtthey may be refused access to the facility concerned. An ILO mission toUganda in April 2000 was told by local communities that access to hospital carewas their main priority. In case of hospitalization many people have to selllivestock or land to pay hospital fees if they can no longer borrow from familyand friends. That means that serious illness of a family member may actuallycost a family its means of existence. In other words, one spell of illness canmake the difference between poverty and longer-term destitution. A chronicdisease is almost inevitably a death warrant. The principle of replacing apotentially catastrophic expense in the event of illness with modest recurrent
252
Financing social protection

prepaid amounts thus obviously appeals to many community members, notablywomen; men appear to be less responsive to the possibility of avertingpotentially catastrophic risks to the family.
Systemic and solvable problems
Most community-based schemes are still at an experimental stage andinevitably face a series of problems:
Management deficiencies. Whatever the size of a health insurance orhealth financing scheme, its operation requires substantial managerialcompetence and specific health care-related management experience, as wellas basic accounting and statistical skills. These basic skills seem to be lackingin many schemes.7 It is obvious that micro-insurance schemes, like all otherhealth insurance schemes, cannot be started and operated successfully in theinitial phase without support from an experienced professional health careadministrator who has to be available for at least one year. Longer-termmanagement problems can and must be solved through training and coachingof staff.
The ‘‘poverty wall’’. There is generally very little information on theactual income distribution of the population effectively or potentially coveredby the schemes. However, especially in rural areas, cash income levels areobviously low and irregular. In many rural communities cash income is highestduring harvesting time. Many families who depend exclusively on income fromsubsistence farming reported in 2000 to an ILO mission to Uganda, forexample, that they would find it impossible to contribute regularly more thanvery small amounts. Many schemes covering hospital services demandquarterly contributions that are simply prohibitive. If no alternative (non-cash) ways are found which permit these families to contribute (for examplethrough direct labour, which has to be remunerated by a third-party sponsor),then the population coverage of community-based schemes will, at least in ruralareas, have natural limits (in other words, it will hit the ‘‘poverty wall’’).
The actual premium level elasticity of insurance coverage is unknown inmost countries, but it is obviously negative: each rise in the amount of thecontribution will lead to a fall in population coverage. Even poor people maybe able to raise enough money from family or friends in order to pay userfees in the event of sporadic, isolated cases of illness, or they may be able tosell some of their productive capital, but they will be neither willing nor ableto raise money recurrently from these channels to pay their insurancepremiums.
Overcoming the ‘‘poverty wall’’ thus requires some systemic externalsubsidization if high coverage at community level is a policy objective.
253
Financing techniques

Systemic financial disequilibrium or the recovery gap. All micro-insurance schemes that provide a full range of ambulatory and stationaryservices face a structural cost problem. Many of them appear to be affected bysystemic financial disequilibrium.8 As a result, community-based schemesrelying on regular contributions of insured persons will not be able to reach outto the very poor.
Benefits have to be delivered by a core group of highly skilled formal sectorworkers and financed from the money income of informal sector employees.This leads to a state of systemic financial disequilibrium. This point isillustrated in box 5.7.
Box 5.7 Systemic financial disequilibrium of a typical small
community-based health insurance scheme
The example chosen is one of a scheme covering around 2,000 people;1
the following assumptions are made:
(1) the scheme would require the services of at least:
. one medical officer
. one paramedic
. one auxiliary staff member
to provide ambulatory care; about 25 per cent of the staff budget wouldhave to be added for non-staff cost (investment in and maintenance ofmedical technology, general overhead costs of a health centre) ofambulatory care; the scheme would also have to employ at least oneadministrator (or purchase administrative services equivalent to the staffcost of one administrator);2
(2) the cost for inpatient services and pharmaceuticals would be similarto that required for ambulatory care;3
(3) the health care professionals and the administrator would have anaverage annual income of about ten times the average annualincome of the insured population;
(4) the average family would consist of five people, with one personeconomically active in the informal sector.
The 400 economically active people financing the scheme would haveto pay about 21 per cent of their money income to finance their healthcare.4 In a formal sector context, where the income differential betweenproviders and financiers is much lower (say in the order of 3 to 4), therelative cost of such a scheme could be kept in the order of 6 to 8.5 percent of the family income. In the context of a developing country thiswould be an acceptable order of magnitude.
254
Financing social protection

If the scheme size fell short of the 2,000 figure, as many schemes do,then the relative cost of health care for each participating family wouldincrease further as staff costs in medical care are not necessarily a linearfunction of the number of people covered. The provision of outpatientservices for an insured group of 1,000 people would probably requireretaining approximately the same group of health care staff as a grouptwice that size. If one assumes that staffing for the first 2,000 coveredpeople would be roughly constant for outpatient care and that costs forhospital care and pharmaceuticals would be directly related to thenumber of covered persons, then the PAYG cost rates (that is, the PAYGcontribution rates that theoretically have to be paid from the cash incomeof insured persons) for different levels of income differentials betweenhealth sector professionals and informal sector workers would be aspresented in box figure 5.7.1.
Much more detailed country and community-based studies would benecessary to confirm the above pattern. However, some systemicconclusions can be drawn from the example. The model calculationshows that a cost covering contribution rate for a provider/financierincome differential of over 5 would never be lower than 10 per cent, andshould certainly be expected to be much higher, notably for smallschemes. This theoretical exercise clearly shows that small schemes
Box figure 5.7.1 Theoretical contribution rates in micro-insurance schemes
(by number of covered persons and provider/financier income
distribution)
Source: ILO calculations.
Box 5.7 (cont’d)
255
Financing techniques

The results of the ILO Social Re project9 seem to indicate that financialshortfalls are systemic for many schemes and that only part of them can befinancially stabilized through re-insuring random excess losses alone. It thusappears unlikely that community-based insurance schemes in informal sectorsettings could ever achieve a systemic full cost of recovery; in other words, inmost of them there would be a recovery gap between the total cost and the totalamount of contributions that can be collected. Consequently, such schemes willmost likely always remain dependent on external subsidies. The poor cannottake care of the poor on their own. Some means must be found to maintain orintroduce a certain level of national or international subsidy (should allinstitutions of national governance fail) on behalf of the poor. These subsidiescan be organized in various ways, ranging from national to international formsof systemic subsidization.
However, the potential of community contribution to the financing ofhealth care must also be exploited. Being poor does not carry with it theright to default on any self-responsibility. When it comes to health carefinancing, every able-bodied and able-minded person of active age shouldcontribute either in kind or in cash. In-kind contributions could take the form ofvoluntary community service, for example.
One possible option of combining ‘‘macro-solidarity’’ with communityinvolvement would be to organize community-based satellite insurance
which have to cover the full cost of a comprehensive range of serviceswill most likely require prohibitive contribution rates. Bigger schemeswould require more staff (although the relationship is not a linear one)and the pattern of above cost curves would most likely simply repeat itselfin a higher bracket of covered persons.
Notes
1 This is roughly the size of the practice of a general practitioner in the United Kingdom.2 This is a rather optimistic exercise. The German health funds, for example, required one
administrative staff member per 220 members in 1989 (see Normand and Weber, 1994,
p. 97).3 This relationship reflects roughly the relationship observed in the statutory health funds in
Japan in 1994 (see Cichon et al., 1999, Table JPN6, p.323). This is again an optimistic
assumption as the referral rate in Japan seems to be less than 5 per cent of all ambulatory
visits, while at least the health centre-based scheme in Kunaba and the hospital-based
scheme in Kisiizi faced referral rates of around 10 per cent.4 Calculation: CR ¼ ((1.25� 3�AI� 10 (ambulatory cost)) + (1.25�3� AI�10 (hospital cost))
þ (AI�10 (administrative cost))/400�AI ¼ 85/400 ¼ 0. 2125.
Box 5.7 (cont’d)
256
Financing social protection

schemes to complement national social health insurance schemes.10 Maintain-ing such satellite systems could become a new activity of national socialinsurance schemes. Instead of trying to reach out to the informal sector withtheir standard benefit package and standard contribution provisions, they couldplay a role in the organization and subsidization of community-based schemes,acting as their ‘‘godfathers’’ – that is, as tutors, sponsors or even supervisors.A similar role could be played by new departments in national ministriesof health. In effect, these arrangements would lead to a hybrid form ofcommunity-based health care consisting of a combination of voluntary com-munity-based contributions and systemic subsidies from the taxpayer or formalsector contributors (see the example of the planned National Health InsuranceScheme in Ghana, presented in Chapter 4). A lot more work needs to be doneon concrete country examples before definitive conclusions can be reachedabout the long-term financial stability and viability of micro-insuranceschemes.
Random expenditure fluctuations in small schemes (see box 5.1) may belevelled out through reinsurance. Private insurance schemes – be they life,non-life or health insurance schemes – never carry their risk alone. Theynormally reinsure, which means concluding a contract with a reinsurancecompany which accepts to cover their bad risks in exchange for a premium.One could test whether a form of reinsurance could be applied to micro-insurance schemes. Although there has been reinsurance for particular socialprotection schemes, such as company-based insurance arrangements in caseof employment injury schemes, explicit reinsurance on a larger and systemicscale is a rather novel idea in social protection financing. The ILO ispresently exploring the idea of reinsuring micro-insurance schemes, but it isstill too early to judge whether that idea can be viable in many nationalcontexts.
In sum, it appears that micro-insurance schemes have the potential toincrease coverage by health care systems. However, to overcome the recoverygap and bring contributions down to a level that the poor can afford, they mostlikely need financial support from external sponsors (such as the State orformal sector social security schemes). The exercise for Ghana in Chapter 4demonstrates that the extension of coverage through micro-insurance mightlead to an increase in overall government financing through the subsidizationmechanism. This is something that social security planners should bear inmind.
5.2.3 Private insurance and mixed financing systems
Private health insurance schemes usually cater for the better-off on a voluntarybasis. They provide either a full range of benefits (like many schemes in theUnited States) or top-up benefits that complement the benefit package of a
257
Financing techniques

National Health Service or a Social Insurance System. They hardly ever coverthe full population and their premiums are usually risk- and age-dependent.From a social protection point of view they generally play a limited role innational health systems, the United States being a notable exception.A discussion of the main features of private health insurance schemes andthe calculation of contribution rates may be found in Cichon et al. (1999,section 3.3.3, respectively Issue Brief 3). A newer approach to private healthcare financing is the introduction of mandatory savings accounts for health carepurposes, as practised in Singapore. Basically, health care is a classical case forinsurance, or risk pooling, where the cost of unlikely but expensive events ispooled among numerous people. Individual savings schemes – if applied inpure form – are the opposite of pooling. They lead to an influx of money intohealth savings, money that is blocked in individual accounts of many peoplewho are healthy and do not need the money, while it is lacking in the financingof care for the sick who are in need of it.
While exclusively private financing arrangements are hardly a compre-hensive answer to national health financing problems, private schemes can beassigned specific roles within the public-private mix of overall national healthcare delivery and financing systems.
One of the latest additions to the range of patterns of the public-private mixoriginated in China, where the health financing system for urban employees wasreformed in the 1990s, and an attempt is being made to incorporate a savingscomponent into the system. The main characteristics of the Chinese health caresystem are summarized in box 5.8.
Another way of bringing in private financing arrangements is to useprivate insurance schemes as substitutes for social insurance schemes eitherby mandating private insurance or by subsidizing private insurance if itcomplies with certain quality, minimum benefit and enrolment requirements.The latter strategy is followed in Switzerland where in 1899 a referendumon the introduction of a compulsory social health insurance failed, and thatapproach was substituted by a subsidization of ‘‘approved’’ private insurancecarriers. Meanwhile, about 99.5 per cent of all Swiss citizens are covered byan approved health insurance even though many of them are not obliged toresort to such schemes. The extent of the federal subsidy makes it simplyunattractive to seek insurance on the unregulated insurance market(Schneider et al., 1993).
Similar options might be of interest for countries where private insurancehas already captured a substantial market share before the government has beenable to devise plans for a universal health care coverage and needs to beincorporated into the universal coverage plans. There are various ways of doingthis. One option was developed recently by an ILO team for the Bahamas.Within the framework of a technical cooperation project, the ILO has suggesteda public reinsurance arrangement for private health insurance schemes (seebox 5.9 on pages 262–3).
258
Financing social protection

Box 5.8 The new hybrid health care financing system in China
China’s total public expenditure for health care is only in the order of 2 to3 per cent of GDP. Even in the United States, where health care has thereputation of being a predominantly private affair, public healthexpenditure as a percentage of GDP is more than triple that of China(see box figure 5.8.1). Health indicators in the United States show betterresults than in China. Life expectancy at birth for females in the UnitedStates, an admittedly crude health indicator, exceeds the Chinese valueby about eight years. However, the Chinese public health care systemseems to be more efficient than the United States system, at least inachieving high life expectancy. One simple method of comparison is todivide per capita health expenditure by the average life expectancy forfemales. One then obtains a ratio $/per life-year, which could beinterpreted (boldly) as an efficiency indicator, saying that the Chinese
performance is indeed worse than that of the United States but that Chinagets more out of the dollars it spends in terms of health outcomes thanthe United States (see also a similar indicator developed in Chapter 7).
The comparison would not be fair if it were calculated with the(statistical) absolute amount of dollars spent on health care per capita. Thebulk of health care costs are staff costs, and staff is cheap in China andexpensive in the United States. To correct for that bias we have adjustedthe dollars per capita in China to the United States GDP per capita level –that is, the average income per capita in China is artificially taken to be the
Box figure 5.8.1 Composition of public social expenditure in selected countries,
mid-1990s (in % of GDP)
Source: World Bank.
259
Financing techniques

same as in the United States. Then the comparison basically draws on thedifference of the GDP share that is spent on publicly financed health care inthe two countries. The result is impressive (see box figure 5.8.2). Chinaseems to spend about one-fifth of the amount per life-year that is spent inthe United States. We are aware that the comparison is crude. It is usedhere simply to set the scene for the ambitious reform that the Chinesedesigned for their health system in the late 1990s.
Even if public expenditure appears low and fairly successful, theoverall economic restructuring in China and in particular the progressivedismantling of the health facilities in formerly state-owned enterprisesforced the government to seek alternative financing for the health sector.The option chosen and recommended by the Central Government toprovincial level governments for the urban population is a hybridfinancing model, composed of a solidarity-based social insurance schemecombined with a system of Individual Medical Accounts (IMAs). Thesystem presently covers some 13 per cent of the total population (so farthe rural population is excluded). It is financed by a contribution rate of 8per cent, of which 2 per cent is paid by the workers and 6 per cent byemployers. The workers’ contributions are paid fully into the individualaccounts, as is 30 per cent of the employers’ contributions. That meansthe solidarity tier receives an average total of 4.2 per cent. When aninsured person or a family member uses health services, fees are chargedfirst to the individual account up to a limit of ten times the average annual
Box 5.8 (cont’d)
Box figure 5.8.2 A crude efficiency indicator for national health care schemes in
selected countries, mid-1990s
Source: World Bank, ILO calculations.
260
Financing social protection

5.3 FINANCING SOCIAL SECURITY PENSIONS
Before we can discuss the various options for financing social securitypensions, we need to understand the typical cost developments in pensionschemes. The main problem is that – unlike short-term benefit schemes withrelatively short qualifying periods – pension schemes mature very slowly, thatis, over many decades. The financing systems adopted have to take account ofthat phenomenon in particular. We should therefore first of all analyse theprocess of maturation in pension schemes.
5.3.1 Typical expenditure life cycle of
pension schemes
There are two basic indicators that describe the evolution of current expenditureof a pension scheme. Both of them are relative measures: the PAYGcontribution or cost rate describes the expenditure of the scheme in relationto the insurable earnings of the insured persons, while national pension costdescribes the expenditure of a pension scheme as a share of GDP. The firstindicator describes the real (for a PAYG-financed social insurance scheme) orhypothetical (for a universal scheme financed from general revenues)‘‘financing burden’’ of the active contributing population (measured as apercentage of their gross insurable earnings), and the second places pension
wage per insured person, and after that it is the solidarity tier that pays.The total amount of benefits per year is limited to four times the averageannual wage per insured person. It is unclear what happens if a familyexceeds that threshold. The schemes are administered on the prefecturelevel or the provincial level.
The main problem facing the scheme appears to be of a systemicfinancial nature. Epidemiological studies show that everywhere about 80per cent of total health expenditure is consumed by 20 per cent of thepopulation. That in itself is the classical justification for insurance –covering contingencies that are rare but, if they do occur, are tooexpensive for the individual to finance. If the ratio of heavy users of thehealth system in China is anywhere near the international experience,then those 20 per cent of seriously or chronically ill persons will soonexhaust their accounts and move over to solidarity financing. However, asubstantial amount of resources reputedly flowing into the health systemis blocked in the accounts of healthy people and not available for solidarityfinancing but is rather feeding the capital markets or other governmentexpenditure when borrowed by the prefecture, provincial or federaltreasurers. There is a risk that the system will run into financial difficulties.
Box 5.8 (cont’d)
261
Financing techniques

Box 5.9 A social reinsurance arrangement for the private insurance
system in the Bahamas
This proposal is an innovative combination of the Swiss (mandatedprivate insurance) approach to health financing and a public reinsurancearrangement, called the Catastrophic Health Insurance Fund. It envis-ages coverage of formal sector workers by mandated privateinsurance, meaning that all employees have to be insured either on agroup insurance basis or on an individual basis by a health insurancecontract providing a minimum pre-defined basket of services. Insuringall staff would be an employer liability. There would be open enrolmentand no exclusions on the basis of pre-existing health conditions(including HIV). In turn, the public sector would provide a per personstop-loss reinsurance coverage. This means that if the approvedexpenses per person exceed a threshold of, say, US$15,0001 (for carenot available in the country’s public sector), then the public reinsurancefund would finance the excess cost. A lower threshold could be fixed forpensioners and the National Insurance Board (NIB) could be chargedwith paying part of the premium for pensioners (however, this optionhas not been assessed in financial terms). The threshold would beadapted annually on the basis of a common binding fee schedule formedical services.
Non-contributing informal sector workers would be provided (asthey are in principle today) with general care in public facilities andgranted cost coverage of treatment not available in the public sector(either in-country in the private sector or in the United States, based onrate agreements with selected providers). That expenditure couldbe financed by a catastrophic health tax or levy. In exchange forobligatory open enrolment (which means that private insuranceschemes are no longer able to screen out or exclude bad risks),private insurance companies would not have to pay reinsurancepremiums. The structural relationships of the proposal are mappedout in box figure 5.9.1.
The advantage of this approach is that the whole population iscovered. Mandated private insurance for all formal sector employeesincreases significantly the number of those covered for general healthcare by private insurance and reduces the financial burden on the publichealth sector for general health care provision. Thus there would behigher per capita resources available for those accessing health care inthe public sector. The resources available in the public sector can then bespread over a smaller proportion of the population and, therefore, thequality of care provided should improve.
Since all formal sector employees would be covered by private healthinsurance, and the private insurance organization would be contributingindirectly to the catastrophic health insurance fund through the co-financing of all catastrophic cases up to US$15,000 (or US$20,000),this would effectively reduce the health contribution payable by eachhousehold. Initial estimates are that the household tax could be reduced
262
Financing social protection

expenditure within a national context. It may be noted that the PAYG costindicator is equal to the product of:
. the demographic ratio, which is identical to the ratio of beneficiaries toactive contributors, and
. the financial ratio, defined as the ratio of the average pension to averageinsurable earnings.
Mathematically this product is equal to the ratio of total pension expenditureto total insurable earnings. If the share of total insurable earnings in the totalremuneration of employees in the country stays constant, and if the share of thetotal remuneration of employees in GDP (i.e. the wage share of GDP) also staysconstant, then the curve of both indicators will have the same shape over time.The mathematical formulation of the two indicators is given in box 5.10.
to $12–24 per month. It can be assumed that through the extendedcoverage of private health insurance as well as the use of public funds fora smaller part of the population, the overall quality of care provided toindividuals will improve.
Note
1 For the purpose of the crude actuarial calculations it was assumed that the frequency of this
event is equal to the frequency of cases of over US$15,000 per year.
Box figure 5.9.1 Structural relationships in a reinsurance proposal for the private
health insurance schemes in the Bahamas
Source: ILO.
Box 5.9 (cont’d)
263
Financing techniques

Box 5.10 Two basic indicators and a rule of thumb for
pension expenditure
The first indicator for the financial development of a social securitypension scheme is the PAYG cost, defined as:
Net PAYGt ¼ Pt=At * APt=AIWt ð5:10:1Þ
where:
Pt /At ¼ the demographic ratioAPt/AIWt ¼ the financial ratioAt ¼ the number of active contributors in year tPt ¼ the number of pensioners in year tAPt ¼ the average amount of pensions in year tAIWt ¼ the average amount of insured wages or income in year t
The notation delineates the net PAYG cost. This formula alsoencapsulates a famous rule of thumb used by pension analysts: for aquick assessment of the relative cost of a pension scheme measured inpercentage points of the overall tax or contribution base of the scheme,it suffices to multiply the average system replacement rate in thescheme with the demographic ratio or burden. For example, if a schemehas an overall replacement rate of 50 per cent (across all pensions, thatis, old-age, invalidity and survivors’) and has to cater for about 50pensioners per 100 contributors (meaning that the demographic ratio isalso 50 per cent), then the overall PAYG contribution rate in thestationary state should be in the order of 25 per cent. The rule is alsouseful for quick checks on the results of actuarial valuations of pensionschemes.
The second indicator is the national pension cost, measuring pensioncost as a percentage of GDP:
NPCt ¼ ðPt � APt þ ACt Þ=GDP ¼ PAYGt � irt � WSt ð5:10:2Þ
where:
NPCt ¼ national pension cost in year tirt ¼ the share of total national gross wages sum (i.e. in terms of
national accounts the remuneration of employees) which issubject to contributions in year t
WSt ¼ the share of total remuneration in GDP (or wage share inGDP) in year t
ACt ¼ the administrative cost of the scheme in year t
264
Financing social protection

All pension schemes, whether introduced on a national basis or for specificsubgroups of the population (occupational pension schemes, for example),show a similar characteristic expenditure development over time as representedby the SEM curve in Chapter 2, box figure 2.1.1. Figures 5.1 and 5.2 describethe typical life-cycle expenditure patterns of a young pension scheme.
The first graph (figure 5.1) depicts the schematic process of maturationin a new pension scheme. The horizontal bars describe consecutivegenerations of people (every fifth generation, to be exact). To keep thingssimple, all the people have been given the same life expectancy of 85 years.To simplify the process even further, it is assumed that they start working(or go into paid apprenticeship) at age 15, work until age 65 and enjoy 20years of retirement before dying at age 85. In our simplified cost calculationevery cohort that is marked black at a certain point in time is receiving apension of a constant amount in real terms. If the scheme is introduced atthe age 65 of the first generation then maturity is reached 70 years later –that is, when the generation that was entering the labour force at the time ofthe scheme’s inception has died out. At that point in time all cohorts have afull career in the scheme and hence all cohorts have full pensionentitlements.
The second graph (figure 5.2) describes the typical schematic expenditurepattern of a new scheme in hypothetical expenditure units (they could becurrency units, percentage points of the PAYG cost or percentage points ofGDP share). This hypothetical example assumes a constant demographicstructure: it assumes no mortality during active age; from the outset the schemecovers the total working population or all members of a specific insured group,and the relationship between the number of retired persons and the number ofpersons of active age remains constant during the projection period. It is furtherassumed that the average replacement rate during the projection period staysconstant. As we will see, this latter assumption is a major simplification.Invalidity pensions and survivors’ pensions are ignored here. Under thesecircumstances, the cost curve of the pension system is a perfect logistical curve,painting an ideal picture of a scheme’s maturation over 75 to 80 years. Inreality, the logistical maturity curves are never as smooth as in this hypotheticalexample.
Quasi-logistical cost curves (i.e. imperfect logistical curves) are observedfor the following reasons: During the first years after the inception of thescheme, usually only very few pensions are paid. If pensions are paid atall during these early years, these are mostly invalidity pensions. For thefirst decade or two hardly any old-age pensions would be paid (unlessgenerous transitional arrangements are made for persons close to retirementage when the scheme is introduced). During a second phase, the number ofpensioners grows rapidly and as a result the PAYG cost indicators and GDPshare indicators rise steeply. There are three reasons for these steep costincreases:
265
Financing techniques

Figure 5.1 Stylized demographics of the first decades of a pension scheme:
From inception to maturity
Source: ILO.
Figure 5.2 The first decades of a pension scheme: Typical cost development
Source: ILO.
266
Financing social protection

(i) a new cohort of new pensioners joins the ‘‘pension force’’ each year;
(ii) as the coverage of pension schemes increases, these cohorts of pensioners(generally after a time lag of two to three decades) also increase everyyear. If the growth of the pension cohort in the early years after the firstpensioners become eligible for benefits exceeds the growth of the activecontributing population in the same years, then the PAYG cost increasesnaturally. This is a normal phenomenon, since the growth of the firstpensioner cohorts during the maturing phase reflects the growth of thescheme’s coverage rate in its early years, which normally slows downafter the first one or two decades of the scheme’s existence;
(iii) the average pension entitlements of each early new cohort of pensionersincrease in line with a generally rising average number of years of serviceof the new cohorts.
The stage of maturity (also called the stationary state) is reached when allpensioners in the scheme can look back on a full career insured in the scheme.This is the case at the time of death of the first cohort of workers who joined thescheme on joining the labour force, and at a point in time when the populationcoverage of the scheme has reached its ultimate level.
As we saw in the theoretical example, this cannot happen earlier than aboutseven decades following the inception of the scheme. Even then any schemecan only be in a stationary state if the legal provisions have not changedsubstantially during the maturing process, and that is not often the case. Inanticipation of the demographic impact of ageing, for example, the retirementages might be pushed back and benefit provisions might have to be reduced. Onthe other hand, gender inequalities might have to be abolished. All thesechanges have their own maturation period. The increase in retirement agenormally has to be announced to individuals approaching pension age at least adecade in advance and the increase then has to be phased in by cohort. Theprocess of increasing the retirement age by two years may easily take one totwo decades. Maturation processes of this type are superimposed on the generalmaturation process of the scheme. In practical terms it means that they ‘‘putback the clock’’ – that is, they reduce the pace of overall maturation of thescheme. In the ‘‘legal’’ stationary state of the scheme the financial indicatorsdefined above only change in line with the scheme’s demographic environment(in the simplified picture of reality portrayed in figure 5.2, the curves of the twoindicators are turning flat). Given the extremely long maturation period and theadditional condition of legal constancy, some analysts claim that no existingmajor social security pension scheme has ever reached its stationary state.
The above analysis shows that increasing pension costs are a perfectlynormal phenomenon during the maturation phase of national pension schemes,which lasts several decades. Rising pension costs per se are not necessarilyindicative of a financial problem. The design of pension financing systems hasto accommodate that natural growth of expenditure.
267
Financing techniques

It is also worth bearing in mind that a current expenditure pattern similar tothe one above will occur in any national context regardless of whether benefitsare determined by a classical pension formula, flat-rate tax-financed universalpensions or by way of an annuity derived from the final balance of lifelongsavings under an MRS system.
As noted earlier, cost increases in national pension schemes are natural.However, they have a secondary effect in that they bluntly reveal initial benefitoverpromising. Young pension schemes which for decades have to pay hardlyany old-age pensions can afford almost any level of generosity in theirprovision, but as they approach maturity that generosity might becomeunaffordable: the public may resent further contribution rate increases, theschemes can run into financial difficulties and end up being discreditedpolitically. It is of crucial importance that actuarial studies with long-termprojections of the schemes’ financial development be undertaken even beforethe schemes are introduced. Overpromising and later correction of benefit levelsundermine a scheme’s credibility. The credibility of schemes that makepromises stretching over several generations is a more important asset than realreserves.
The pension cost described above can be financed in various ways – throughtaxes, through contributions coupled or not with income from interest, or acombination thereof. Tax financing is generally combined with PAYGfinancing which makes it mathematically and financially simple. In thefollowing sections we will therefore focus on the most complex form of pensionfinancing, which is contribution financing. Contribution systems are character-ized by the actual incidence of contributions, the contribution base and thedesired funding level.
5.3.2 Incidence of contributions
The relative level of employers’ and workers’ contributions varies considerablyacross countries, although in most cases the employer pays half or more of thetotal contribution. In the former communist countries of Central and EasternEurope the contribution was paid almost entirely by the employer. Morerecently, in countries of Latin America such as Bolivia, Chile and Peru, whichopted for radical reforms using DC systems, social security contributions arepaid entirely by the employee. El Salvador, however, has established amandatory DC system to which the employer contributes at a higher rate thanthe employees. The split between employers and workers should not affect totallabour cost if the employee ultimately bears the cost through receiving a lowerwage than he or she would otherwise receive, and if the tax treatment ofemployers’ and workers’ contributions is consistent.11 If this is the case, aseconomists generally believe, then self-employed workers should pay acontribution rate equal to those of employers and employees put together. Anadvantage of having employers and workers pay at least part of the social
268
Financing social protection

security contribution, however, is that it makes them more aware of the cost ofthe system and gives some sense of ownership of the schemes.
In some countries the contribution rate varies depending on the worker’sage and sex. It may also vary by occupation, especially when special provisionsor special schemes apply to some occupational groups. In Switzerland, thecontribution rate to the mandatory employer-provided second-tier pension ishigher for older workers and increases at earlier ages for females than malesbecause women can retire earlier. In Bulgaria, the contribution rate variesdepending on occupation. In Norway, it is reduced in certain geographic areasto encourage employment there and is lower for workers under 16 and over69 years of age. In Finland, the contribution rate is reduced for workers startinga business for the first time. In a few countries the employer’s mandatorycontribution rate varies depending on the perceived ability of the employer, andperhaps ultimately the employer’s workers, to pay.
Social security contributions are usually mandatory, but in a number ofcountries they are voluntary for some categories of workers or in somesituations. In Argentina, for example, housewives may make voluntary socialsecurity contributions. Some countries allow self-employed workers to becovered on a voluntary basis. This is the case in Chile, as well as in Panama,where self-employed workers whose earnings fall within a certain income bandand who have no employees may make voluntary contributions. In severalcountries, including India and Indonesia, establishments with less than five orten employees may voluntarily cover their workers. In a few countries, workersmeeting qualifying conditions can reduce their social security contributionpayments so long as they participate in an individual or occupational pensionscheme of sufficient generosity. This arrangement, called contracting-out, ispossible in the United Kingdom and Japan. Some schemes allow for thepayment of supplementary contributions on a voluntary basis. This is the case inChile, where a 10-per cent contribution rate is mandatory but workers canvoluntarily contribute more to their DC plan.
In most countries the mandatory contribution rate is constant across incomelevels, but in some it is progressive, being higher for higher-income workers.This is the case in Haiti and the United Kingdom. In Egypt, a highercontribution rate applies to earnings above a certain ceiling.
The financing of pension benefits for the self-employed under socialsecurity is a critical topic in many national schemes. Compliance is a notoriousproblem. Defining contribution obligations in a way that does not make them adeterrent to self-employment and at the same time maintaining a meaningfullevel of protection is a major challenge. National approaches vary greatly. Inmany social security schemes self-employed workers are paying a contributionrate equal to the sum of the employers’ and workers’ contributions, as in theUnited States. In the United Kingdom, low-income self-employed are exemptfrom the requirement to contribute, but may do so voluntarily. Self-employedworkers earning above a minimum amount pay a flat weekly contribution,
269
Financing techniques

while higher-income self-employed workers also pay an earnings-relatedcontribution. To encourage self-employment, the contribution rate chargedto higher-income self-employed workers is less than half the combinedemployers’ and workers’ rate. In Egypt, self-employed workers can choose thelevel of earnings on which their contributions are based, while taxi drivers arecharged a flat rate, payable when they renew their driving licence. In Panama,self-employed workers may be covered voluntarily. In Chile, self-employedworkers earning above the minimum wage may participate if they wish, butnearly all choose not to. Those who do participate pay the same rate asemployed workers.
It may be noted in this context that voluntary participation in public socialsecurity schemes has not met with much success anywhere. Significantincentives in the form of tax breaks are necessary to induce people toparticipate in any voluntary scheme. Such incentives are effectively a publicsubsidy for the voluntary coverage of specific groups, which may raise equityproblems when no public subsidies are granted for the schemes of employees.
5.3.3 Contribution base
The contribution base is generally the worker’s wage or a certain part thereof.Rather than using actual earnings, however, some countries use a series ofwage bands, where all workers whose earnings fall within a particular bandpay the same amount. This system is currently used in some countries ofCentral America and the Caribbean, as well as in Turkey. In Japan, wherethere are 30 wage classes, so long as the worker’s wage does not go outside aband, the same contribution amount is paid the whole year. In Jordan,employers submit to the social security corporation a statement of the earningsfor each employee as at 1 January. For employees who remain with the sameemployer, those earnings form the contribution base for the entire year, eventhough the employee’s earnings may rise or fall during the year. Thesesystems of basing contributions on a single earnings figure for an entire yearand on the midpoint within an earnings band simplify record-keeping and thecalculation of benefits.
Restrictions are often placed on the earnings subject to mandatory socialsecurity contributions. Many countries have a ceiling on covered earnings, withno social security contributions required on higher earnings. Most countriesbelieve it desirable to allow room for high-income workers to establishoccupational pension plans and to have private savings. Alternatively, if there isno ceiling on covered earnings but there is a ceiling on benefits, high-incomeworkers receive no additional benefit for contributions made on earnings abovethose necessary to receive the maximum benefit.
Only a few countries, Ecuador and Guatemala among them, have no ceilingon employers’ and workers’ contributions. Brazil and the United Kingdom have
270
Financing social protection

no ceiling on employers’ contributions but do have one on employees’contributions. Not applying the ceiling on contributions while maintaining it onbenefits makes the scheme more progressive, but contributions above a ceilingnot relevant to benefits effectively constitute a tax.
Most OECD countries have a ceiling on covered earnings, whichgenerally lies between 100 and 200 per cent of the average salary. In otherregions there are variations in the level of a ceiling when expressed as apercentage of average wages. This goes along with the greater dispersion ofearnings between the different sectors of the active population and is the casein many countries. Non-indexation of the ceiling is a major problem in somedeveloping countries. Often ceilings are not adjusted in line with wages orinflation, so that the proportion of total earnings subject to contributions of thecountries’ total wage bill declines rapidly. As long as benefits are more or lessstrictly related to covered earnings, this might not pose a big problem for thefinancial equilibrium of the scheme but might make benefit levels irrelevantfrom a social point of view. The ILO has observed these phenomena in someCaribbean countries and Turkey. Ceilings should thus be indexed in linewith the growth of earnings in order to maintain the level of protection overtime; otherwise the level of protection will be gradually eroded and couldultimately lead to the payment of flat-rate or minimum pensions to allparticipants.
Ceilings can make social security schemes regressive. That can happen iftotal earnings are used to calculate social security contributions but flat-ratebenefits are provided. The maximum affects only upper-income workers andreduces their contributions relative to their total earnings. The maximum isusually justified in order to leave room for private provision of occupationalpension plans. In some countries, like the United Kingdom, the maximumapplies to the employee’s contribution but not to the employer’s.
Many countries generally have a floor on income subject to mandatorysocial security contributions, not requiring workers with low earnings, or whowork few hours, to contribute. Low-income earners either have no benefitentitlements or enjoy only reduced entitlements, as in Japan. Also, workersbelow a minimum age are often not required to contribute. This age is 16 inJordan. Some countries do not require workers above a maximum age tocontribute. If workers with earnings below a certain floor are not covered bysocial security then this might create perverse incentives for employers tocreate low-income jobs without social security (as is apparently the case inGermany).
Questions arise as to types of compensation excluded from the contributionbase. The contribution base is the measure of worker earnings subject tomandatory contributions. The growth of non-wage benefits such as pensionsand employer-provided health insurance in some developed countries haseroded the contribution base as well as the tax bases by reducing the percentageof total compensation that is subject to mandatory contributions. In order to
271
Financing techniques

deal with this issue, in the United States employee contributions to a populartype of employer-provided DC plan – called the 401(k) plan (after the section ofthe tax code that created it) – have been made taxable under the social securitypayroll tax.
Total contributions can be increased by raising the contribution rate orextending the contribution base. When governments need to increase socialsecurity contribution income, they often do both. The contribution base couldbe extended by raising the ceiling or lowering the floor on earnings subject tocontributions, or by making additional aspects of non-wage earnings subject tosocial security contributions. This may lead to a corresponding increase in thebenefit level in the future.
During the 1980s and 1990s researchers and policy analysts in Europesuggested changing the basis of the contribution payment for employers’contributions from the payroll to the value added of an enterprise. The rationalebehind the proposal was to avoid ‘‘penalties’’ on employment and improve thecost structure of enterprises with an employment-intensive production vis-a-visthose with a capital-intensive production through the so-called ‘‘machine tax’’.In effect, that would bring about a reduction in labour cost in enterprises withemployment-intensive production.
Thus far no country has introduced such a change in the contribution baseand the issue has largely disappeared from the political agenda. One reason iscertainly globalization. Enterprises with capital-intensive production areusually relatively mobile. Increasing their tax and contribution burden wouldclearly heighten the risk of their migrating to low-tax and low-cost regions. Theother reason may be that the labour market situation in most OECD countrieshas improved considerably since the 1980s and 1990s. In some countries (suchas the Netherlands) labour costs have been reduced by wage restraints ratherthan a change in the social protection financing system. Trade unions inLuxembourg have recently reopened the ‘‘machine tax’’ debate. The variousarguments put forward in the debate are presented in box 5.11.
5.3.4 Types of contributions
The type of contribution charged by a pension schemes reflects twothings:
(a) the policy choice a country has made concerning its preference with respectto the different financial rules of social protection; and
(b) the level of funding it has accepted or is aiming to achieve.
A summary of the different types of contributions and their majorcharacteristics is provided in table 5.7. The mathematical formulae for thecalculation of the different contribution rates are displayed in box 5.12.
272
Financing social protection

Box 5.11 Broadening the contribution base: Is ‘‘machine tax’’
the answer?1
The basic concept
The basic idea of a Value Added Contribution (VAC) is to replace wages asthe contribution base for social insurance schemes with the broaderaggregate of value added as an assessment basis for employers’ pensioncontributions (or, in general, for their social security contributions). Thecore socio-economic reasoning behind this proposal is as follows: If, inthe context of technological progress, labour is replaced by ‘‘machines’’(capital), then these should contribute to the financing of socialprotection. Literature on this topic makes the distinction between grossand net value added. Gross value added is generally defined as the valueof output less the value of intermediate consumption (input) of aneconomic unit (e.g. an enterprise). Net value added is derived by furthersubtracting the consumption of fixed capital.
Furthermore, ‘‘substitutive’’ as well as ‘‘additive’’ concepts have beendiscussed: in the former, VAC fully replaces employers’ contributions; inthe latter, employers’ contributions would be maintained and a VACintroduced in addition. During the 1950s and 1960s the discussion on VACwas prompted mainly by concerns that purely wage-related contributionsmight have detrimental effects on the competitiveness of small andmedium-sized enterprises – which could not be proven in empiricalstudies. During the 1980s the debate regained momentum, focusing onpotential positive employment effects of a VAC.
The labour-income-to-GDP ratio (‘‘labour income share’’)
One of the major concerns behind the VAC proposal is the observationand/or expectation that the share of the macroeconomic income left forsocial protection financing will continue to decline in the long term, whichmight be the result of an unfair underlying income redistributionmechanism and/or of technological developments (‘‘machines’’ replacinghuman labour). Statistically, this hypothesis is usually measured bycalculating the percentage share of labour income in GDP (or one of itssuitably chosen derivatives); therefore, part of the related discussion oftenconcentrates on these measures, obtained through national accounts.
Indeed, statistical information on Europe provided by EUROSTATindicates a trend decline in the adjusted2 labour income share. The lineartrend value of the labour income share – calculated for the periodbetween 1975 and 1999 – dropped by 8.6 percentage points, and in Japanby 9.6 percentage points.3 The long-term development of the labourincome share is essential with respect to financing social security. If, atgiven contribution rates, labour income does not grow as fast as valueadded (GDP), then the amount of revenues to be expected under a VACregime would be higher than under the usual wage-related contributioncollection system.
273
Financing techniques

Still, whether (even under this perspective) the introduction of VACwould resolve or at least attenuate social security financing problemsremains an open question.
Expected theoretical impact of VAC
The VAC concept broadens the assessment base for employers’contributions as the value added includes not only the sum of wagesand all other labour-related costs (including employers’ social securitycontributions) but also capital-related costs (interest, rents, leasing costsand – in the case of gross value added – the consumption of capital) andprofits. The relative share of the cost of social security financed throughlabour income could thus be reduced – depending on the actualdetermination of the level of VAC. Many advocates of VAC maintainthat if the labour share declined the relative inputs of production factorswould react to the changed cost relation between labour and capital and,accordingly, lead to more labour-intensive production – that is, bringabout an increase in employment. Its opponents, on the other hand,argue that, for exactly the same reasons (impact of changed costrelations), the volume of the overall fixed capital stock would fall belowthe level accumulated otherwise, resulting in lower growth and, thus,lower employment over the long run.
Sectoral cost shifts
Implementing the VAC concept could lead to a reallocation of the financialburden of financing social security among employers. Overall productioncosts of sectors with a high labour cost content will diminish, and those ofsectors with a high capital input will increase. A number of studiesundertaken for Germany show that VAC would imply cost reductions inmany branches of the manufacturing industry and the State as they areboth relatively labour cost intensive. Cost increases would have to beborne by capital-intensive sectors like energy and water supply, oilrefining industries, housing, agriculture, as well as financial intermedi-aries (banks, insurance, etc.).
In this context, a number of issues should be considered: First, incase of a government move to introduce VAC, heavy lobbying forexemptions can be expected. For instance, cost increases in housingmight result in higher rents, which the general public might vehementlyoppose – even if there were counterbalancing price decreases for othergoods and/or services. Exemptions might also be sought in theagricultural sector. Second, due to normally applied accounting rulesthe State would be one of the main winners, although ‘‘in reality’’ itsvalue added is probably much higher than measured. In the politicalprocess prior to the introduction of VAC this grey zone of measurementmight lead to some arbitrariness in fixing the ‘‘correct’’ contribution rate.Third, technology (i.e. sectoral production functions) is undergoing rapid
Box 5.11 (cont’d)
274
Financing social protection

changes worldwide, with obvious direct and indirect impact on capitaland labour markets. It might very well be that the introduction of VACwould be consistent with production function technologies observed inthe past but not with future technologies, and might actually impedetheir dissemination.
Evolution of contribution income
To the best of our knowledge, the two most recent econometric studieson the macroeconomic impacts of introducing VAC date from the mid-1980s and concern the German economy (Schmahl et al., 1984; Krelle et al.,1985). Both of them reveal only small (though statistically significant)growth and employment effects. It is argued that such minor effectswould not justify a systemic change in financing social security. A later(non-econometric) study argues – on the basis of the same findings – thatany negative growth effect can obviously be considered too small to beused as a counter-argument to a system change. While the results of thethree studies show all in all that the introduction of VAC should neitherinspire excessive optimism about positive employment effects nor becharacterized as a penalty on capital, there is evidence that the evolutionof contribution income over time of social security institutions could bestabilized and thus be positively influenced. This coincides with aneconomic intuition as some of the macroeconomic aggregates involved –sum of wages, sum of profits, sum of capital costs – usually fluctuate in amutually compensating manner over the business cycle. However,analytical results date from the mid-1980s and in the meantime globalcompetition has intensified. It is therefore not certain that the findingsfrom almost two decades ago are still valid.
VAC incidence
The distributive impact of VAC is equivalent to the impact of a valueadded tax (VAT). The latter is usually considered regressive – that is, therelative tax burden increases with declining personal incomes as low-income earners on average have a higher consumption share than high-income earners. This effect can be (and in many countries actually is)counterbalanced by lower VAT rates for basic goods and services. Butsuch a measure cannot be applied if VAC were to be introduced since itis difficult to establish and maintain product-related bookkeepingsystems – these would permit to calculate product-related incomegeneration accounts and thus, theoretically, split (product-dependent)VAC rates.
If VAC is introduced so that it replaces the (previous) volume ofemployers’ contributions, then this is equal to reducing labour costswhile refinancing state (or social security) income losses through a VATequivalent. The impact on CPI (and, thus, on real incomes) depends onthe relative reaction of prices on the production level and how these
Box 5.11 (cont’d)
275
Financing techniques

would spill over into the CPI basket. In principle, it is an open questionwhether – and if so, how – overall cost reductions in labour-intensiveindustries (including the State) might trigger wage increases so thatearlier cost levels in these industries might be attained once again, aftersome time. Yet, under full or nearly full employment conditions thismight easily happen. Whether the related cost-push could be trans-formed into price increases (in which case the consumers would bearthe costs) or would have to be counterbalanced by rationalizationmeasures (in which case employment would be reduced) is, again,difficult to answer.
Systemic aspects and administrative considerations
VAC would undoubtedly loosen the link between contributions andbenefits as the actual payment of employers’ contributions would nolonger be based on individual employment contracts – in other words, theequivalency principle would be (partially) challenged. The meaning ofindividual, contract-related contributions could thus mutate to a generalemployers’ grant (transfer) to social security. The VAC might then beconsidered a tax rather than a social security contribution; this might,more fundamentally, question social security’s ownership rights of VACincome. In fact, ownership of VAC might be attributed to the State ratherthan to social security. In case of (hitherto) tripartite administrativestructures of social security management, the inclusion of employerswould no longer be justified.
The introduction of VAC would mean establishing a second set ofshort-term accounts – in addition to the ‘‘normal’’ (monthly) wageaccounts – that would consist of preliminary elements (estimates) to aconsiderable degree. It often takes tax offices a long time to determinethe ‘‘correct’’ profits of an enterprise. If VAC were to be introduced itwould have to be decided whether the responsibility of determiningprofits, this time for social security purposes, would be taken on bythe social security administration (profits might then differ from thosecalculated by the tax offices, inevitably triggering law suits), orwhether social security should rely on (and wait for) the tax offices’determination. In any case, social security would have to make do withgrowing incidence of part payments and equalization payments (tobalance out past over- and under-payments). This would add topossibly increasing efforts to circumvent social contribution paymentobligations by using interpretation margins of ‘‘soft’’ accounting andtaxation rules.
On balance. . .
Until now, all countries that have discussed VAC have shied away fromintroducing it because of its administrative and political complexity and
Box 5.11 (cont’d)
276
Financing social protection

Private sector DB schemes generally charge flat-rate contributions percohort (by age and sex, possibly differentiated by risk), while manyoccupational schemes (DB or DC) and virtually all first-tier social securityschemes charge an earnings-related contribution in the form of a fixedpercentage of insurable earnings (i.e. a contribution rate). The latterapproach is an effort to charge contributions according to the ability topay (solidarity principle). Benefit levels may – but do not necessarily haveto – depend on the amount of contributions paid or on earnings duringactive age. In case of major non-earnings related components in the pensionformula, contribution charges as fixed rates of earnings can make theschemes progressive.
Several features of social security financing contribute to the progressive-ness of social security pension schemes. First, countries can establish anearnings deduction. For all workers, earnings below a fixed level are not subjectto contributions but the earnings deduction does not affect the earnings used incalculating future benefits. Because the earnings deduction is a fixed amount, itis relatively more important to low-income workers than to upper-incomeworkers. This feature is used in Canada.
unclear economic effects in the context of growing globalization ofmarkets. One of the most powerful disincentives to the introduction ofVAC is probably the fact that there are easier ways of reducing labourcost, for example by increasing the general revenue share in thefinancing of social security. This reasoning is in line with an apparentlyrenewed trend towards greater universalism in social security which isseen as a reaction to growing problems of coverage exclusion in allsocieties.4
Notes
1 This box is based on the reasoning furnished by the ILO for the case of Luxembourg
(ILO, 2001c). It should however be valid for most European and other industrialized
countries.2 The ‘‘simple’’ labour income share might decline/increase because the share of the self-
employed in total employment is increasing or decreasing, respectively. The statistical
information quoted here, was calculated on the technical assumption that the share of self-
employed and, thus, employees in total employment does not vary over time.3 It is interesting to note that the only major industrialized countries with stable or almost
stable labour income shares are, over the same 1975–99 period, the United Kingdom and the
United States. For EU Member States and Japan the same negative trend holds true if one
extends the observation period back to 1960, whereas for Luxembourg the trend is reversed
as the labour income share during the 1960s was on average only 58 per cent.4 As observed inter alia by Hoskins (2002).
Box 5.11 (cont’d)
277
Financing techniques

Table 5.7 Types of contributions
Financing method Contribution rate Funding level
Private pension schemes
Full funding Flat-rate uniform contributionamount, usually differentiatedby age of entry (in theorystable over long periods).
Should lead to the terminallevel of funding, i.e. reservesare always equal to the presentvalue of all accrued rights andpensions in payment.
Pay-as-you-go Flat-rate or income-relatedpremium (could change onan annual basis).
Exceptional case for occupationalschemes in France, state mandatedand state guaranteed.
Book reserves Earnings-related imputedcontributions generally paidby employer (in theorystable over longer periods butdifferentiated by age and sex).
In theory same as fully fundedoption, but investments inenterprises operating thescheme, reinsurance obligatoryin most cases (for example inGermany).
Public pension schemes
Pay-as-you-go Contributions collected yearby year should almost exactlymatch the expected expenditureof the year and could thus varyfrom year to year.
Does not lead to theaccumulation of funds except fora modest contingencyreserve maintained to avoidliquidity problems.
Partial funding(scaled premium)
The contribution rate is fixedand maintained constant over adefined period (called ‘‘equilibriumperiod’’) so that incomes andexpenditure should be in actuarialbalance/equilibrium over thisperiod, taking into account thefunding objective at the end ofthe equilibrium period.
The size of the reserve normallyincreases in line with the lengthof the equilibrium period, and afunding objective at the end ofthe equilibrium period is fixed,either to avoid liquidity problemsor to pre-finance a part of theliabilities.
Partial funding(general averagepremium)
Premium balances the presentvalue of total expected futurebenefits minus initial reservesand contribution income, staysconstant in theory ad infinitum.
Accumulates similar level ofreserves as full funding but higherduring initial phases of a schemeand lower towards the final years(if calculated over a definedperiod).
Full funding(individual mandatorysavings)
Earnings-related theoreticallyconstant rate throughout the lifeof the scheme, scheme is inautomatic financial equilibrium.
Terminal funding level ofreserve automatically equal tototal amount of savings in allindividual accounts.
Full funding(terminal funding)
Contributions collected over adefined period should be equalto the discounted value of thebenefits accrued during this period,subject to adjustments foraccumulated surpluses or pastunfunded liabilities.
A reserve equal to the value of allaccrued benefit entitlements isaccumulated. The value of accruedbenefit entitlements includes thevalue of current pensions and thevalue of benefit entitlementsearned to date by active andinactive members.
278
Financing social protection

Box 5.12 Summary of actuarial formulae for main contribution systems
The mathematical formulae for the different types of contribution ratescan be summarized as follows:
Pay–as-you-go (PAYG)
CRðtÞ ¼TEðtÞ � OIðtÞ
TABðtÞð5:12:1Þ
where:
TE � OI = the amount of total expenditure minus other income(non-investment income) during the whole period t
TAB = the amount of total insurable earnings respectively thetotal assessment base subject to contributions.
Scaled premium
The constant contribution rate CCR(t) for a period of t years, i.e. for theyears 0,1,2,. . .,t � 1, on condition that the level of funding is k(t�1) at theend of the period, is calculated as follows:
CCR(0;...;t�1) ¼Xt�1
j ¼0
D�TEðjÞ � OI(j)
�þ k(t � 1) � D
�TE(t � 1)
�
� RESðoÞ
!�Xt�1
j¼0
DðTABðjÞÞ ð5:12:2Þ
where:
D (TE(i)�OI’(j)) = the discounted value of total expenditure minusother income (non-investment income) in year j,
D (TE(t�1)) = the discounted value of the expenditure in year t � 1,the last year of the period with a constantcontribution rate,
RES(0) = the initial reserves at the beginning of year t ¼ 0 andD (TAB(j)) = the discounted value of total insurable earnings in j.
The discounted value of total expenditure of a year t is calculated as(simplified):
D(TE(t)) ¼ TE(t) � (1 þ i)(�t)
where:
i is the interest rate which is assumed constant throughout thecalculation period. The discounted values of the other variables arecalculated accordingly.
279
Financing techniques

A second feature of progressiveness is to charge higher social securitycontribution rates on higher-income workers but to base benefits on earningsrather than contributions. This feature is used by the United Kingdom in its DBsystem. The DC scheme in Colombia requires all members who earn more than
We can simplify the notation by substituting the letters DS for thesummation of present values for the year j ¼ 0; . . . ; t � 1 and write:
CCRð0;...;t�1) ¼
�DSðTEðtÞ � OIðtÞÞ þ kðt � 1Þ * TEðt � 1Þ � RESðoÞ=DSðTABðtÞ
�If a new scheme is introduced, the necessary initial reserve is usually
created by a time-lag between the commencement of contributioncollection and that of benefit payments.
General Average Premium (GAP)
GAP(0) ¼DS(TE � OI) � RES(0)
DS(TAB)ð5:12:3Þ
where:
DS(TE � OI) ¼ discounted value of total expenditure minus otherincome (non-investment income) during an infiniteperiod to the point t ¼ 0; i.e. the beginning of theprojection period,
RES(0) ¼ initial reserves at the beginning of year t ¼ 0 andDS(TAB) ¼ discounted value of total insurable earnings for the
infinite period following t ¼ 0:
Full funding (terminal funding)
CGAPð0Þ ¼DS�TEE(0)
�þ DS
�TEE(t)
�� RES(0)
TAB(0)ð5:12:4Þ
where:
DS(TEE(0)) = discounted value of all benefits (present and future)which are already in payment in year t ¼ 0
DS(TEE(t)) = discounted future value of all benefit entitlementsaccrued but not yet in payment at time t ¼ 0
Box 5.12 (contd.)
280
Financing social protection

four times the minimum wage to contribute an additional 1 per cent of theirincome as a solidarity tax. The revenue is matched by budget transfers and usedto subsidize the contributions of targeted poor groups in an attempt to extendthe coverage of the formal social security system.
Most social security schemes are de facto scaled premium systems.Even systems which started out as fully funded schemes or schemesfinanced on the basis of a GAP were often turned into scaled premiumschemes when the real financial development of the scheme, more often thedeterioration of the reserves due to inflation, was not in line with originalexpectations, and contribution rates had to be increased successively (themore than 100-year-old history of the German pension system might serveas an example here).
The typical evolution of the most important alternative contribution rates –the PAYG rate, the terminal funding (or full funding) rate, a scaled premiumrate, and the GAP – for a social security pension scheme experiencing typicalcost development is described in figure 5.3. It should be noted that this is anactuarially idealized picture of reality. It accepts that all assumptions made onthe demographic, economic and governance environment of the scheme holdtrue in reality. This will not be the case. Thus the height and the width of thesteps in the ‘‘staircase’’ of the scaled premium system might vary over timeand the general average premium will not remain perfectly constant. Thegraph depicted in figure 5.3 is based on a real example of an Asian countryand the cost curve is hence not as smooth as one would expect for atheoretical exercise.
Figure 5.3 Typical developments of alternative types of contribution rates
Source: ILO calculations.
281
Financing techniques

5.3.5 Determining the level of contributions
Even if we regard benefit levels and eligibility criteria as given – and thus alsothe level of total expenditure and the basic type of contribution financing, theactual setting of the contribution rate remains discretionary to some extent.
The level of the contribution rate in social security pension schemes chosenby governments varies according to:
. the political need to maintain the stability of the contribution rate overextended period for reasons of political acceptability;
. the need to adapt the contribution level (and hence non-wage labour cost) ofthe scheme to the present economic situation and expected futuredevelopments;
. the capacity to invest and manage the accumulated reserves effectivelywithout undue risk of mismanagement or asset depreciation;
. the capacity of the accessible financial (mostly domestic) markets to absorbthe accumulated reserves;
. the need for a contingency reserve to cope with unexpected incomeshortfalls or increases in expenditure.
The most appropriate level of funding has to be determined in each nationalcase, reflecting a variety of social, fiscal and economic objectives. Recent yearshave seen a heated political debate about the necessary level of funding innational pension schemes. Box 5.13 details the principal theoretical argumentsfor and against full or high-level funding.
Box 5.13 The ‘‘funding versus PAYG’’ debate in pension financing
Most current proposals to re-introduce full funding in national pensionsystems or in parts thereof advocate the introduction of MRS schemes,following the example set by Chile in the early 1980s. The World Bank hasbecome a major advocate of such schemes, although concrete proposals bycountry vary as to whether they should be introduced as a first or a second-tier system.1 Leaving aside all arguments dealing with the administrativefeasibility of transition as well as all evidence of past mismanagement offunded and non-funded systems, we are listing below the main argumentsfor and against2 a pension system which relies on individual savings.
Arguments in favour of funded systems
1. Population ageing and the resulting greater demographic burden ofnational pension systems will lead to PAYG contribution rates thatwill become unsustainable as contributors will not be willing to
282
Financing social protection

accept higher contributions to finance income transfers to the non-active population. Current PAYG schemes place an enormousimplicit debt on the active population. Collective or individualsavings for the future would avoid such a burden, since part ofpension expenditure would be financed from past savings. Nationalpension systems would thus be less vulnerable to adverse demo-graphic developments.
2. The economies in many countries – notably countries in transitionand developing countries – are in urgent need of investment capital.Since foreign investment often remains sluggish, forced savings bythe population through a ‘‘pension’’ system can create domesticcapital for investment. The schemes would lead to higher nationalsavings rates which would create more resources for investmentsand consequently increase long-term growth.
3. Savings schemes are DC schemes, meaning that individual benefitsare determined exactly by the amount of contributions paid duringthe active working life. Since these contributions have to be creditedto individual accounts they cannot be diverted by the State and, atthe same time, benefits do not pose a (major) risk to public finances,since the sums paid out are on average equal to the accumulatedsavings. The schemes are thus deemed to be in automatic financialequilibrium. As a result, this system helps to stabilize allegedly‘‘exploding’’ social expenditure.
4. In times when i > w + g funded schemes provide a higher return oncontribution payments than PAYG-financed schemes: where idescribes the rate of return on investments, g the rate of growth ofemployment and w the rate of growth of wages. In an ageing societywith declining or stagnating employment levels that should be thecase. This is the standard relationship that was first mentioned bySamuelson (1958).3
Arguments against funded systems
1. Funded systems need reliable and stable capital markets as thepension levels of future generations of pensioners rely on long-termpositive real returns on investments. Capital markets in manycountries are not yet functioning and even in functioning capitalmarkets long-term positive real rates of return cannot be relied upon.Funding merely replaces the reliance on the willingness of futuregenerations to support the older generation by reliance on the long-term performance of the economy.
2. Funded systems and hence future pension levels are vulnerable toinflation. The historical evidence in Europe regarding the long-termreliability of savings is clearly less than encouraging.
3. Since benefits are individually dependent on personal savings,institutions have less incentive to collect contributions than in
Box 5.13 (cont’d)
283
Financing techniques

collectively financed systems. Individuals, on the other hand, are justas likely to evade contributions as under PAYG systems. In particular,low-income groups (maybe particularly myopic) might find ways toavoid paying, preferring to solve present financial problems ratherthan distant income problems in time of old age. The Chileanexample shows that despite the alleged attractiveness of the system,compliance could not be improved. Low compliance in particular bylow-income groups means increased poverty in the long term, whichin turn means higher social assistance payments (through a hiddenor contingent liability for the State).
4. Pension schemes with individual accounts have only a very limitedsolidarity component. The only form of redistribution is due to theinsurance component (people who live past normal life expectancymight benefit from an annuity-based pension). Income redistributionbetween different income groups is generally excluded. DC schemesin particular offer no or only scant protection to younger workersagainst the risk of invalidity, and very limited survivors’ benefits.They also offer no possibility to reward women and men for suchdesirable activities in society as periods spent child rearing or takingcare of disabled or sick family members. Without publicly financedsubsidies the negative effects of still shorter employment biograph-ies cannot be compensated. Savings-based pensions in their pureform de facto desolidarize a society, putting squarely on theshoulders of the individual the financial risks that periods of sickness,unemployment and disability pose for the maintenance of thestandard of living during invalidity, survivorship or old age.
5. If decent pension levels were to be maintained in the present PAYGschemes during transition to the new, funded levels, the activegeneration would face a double burden. It would have to finance thetransfer incomes of the inactive population and simultaneously buildup reserves for the future financing of its own retirement income.This would either place a prohibitive burden on the present activegeneration, or the government would have to borrow resources,inter alia from the savings for future pensions under the newsystems. However, this would again – as in the present PAYGsystems – mean borrowing from future generations which wouldhave to pay back the borrowed amounts.
6. The part of GDP that is consumed by the retired population has to befinanced out of the production of the active population under anyfinancing system, whether pension payments are actually financedfrom the capital income share or the labour income share of GDP. Onthe GDP level all social transfer systems are de facto PAYG systems.This is due to the fallacy of composition: individuals can shiftconsumption forward over time (into retirement age) by contributingto a pension scheme, but societies as a whole cannot. The goods andservices that will be consumed by the next generation of pensioners
Box 5.13 (cont’d)
284
Financing social protection

cannot be stockpiled – they have to be produced by the nextgeneration of workers.4 Hence national pension schemes – whetherfully funded, partially funded or PAYG – are only devices that definehow future consumption is shared between active and inactivegroups in a society. The relative size of these generations will alwaysinfluence their share in total national consumption. All financingsystems are thus vulnerable to economic and demographic trends. Ifthe active population and/or overall output decline (either due to thedemographic shrinking of the workforce or to unemployment) and ifthe pensioners’ share of current disposable income is boostedrelative to the share of the fall in employed population, inflationarypressures are likely to reduce the income levels of the inactivepopulation under both PAYG and funded pension schemes. Thiseffect could be avoided if the drop in working-age population can becompensated by increased productivity. Such higher productivity –needed to safeguard benefit levels in funded pension systems – couldalso be used to stabilize the financing of PAYG pension systems.
7. A high level of funding would create reserves which would rapidlyapproach the level of GDP that could easily become concentrated inthe hands of very few institutional investors. This might constitute aserious non-democratic shift of power in any society. Furthermore,there might not be enough investment outlets nationally andreserves would have to be exported (which adds a further measureof risk or is of no use to the domestic economy) or the domestic ratesof return will be driven below the inflation level, which erodes thepension entitlements of the saving generations.
8. The ageing crisis is a myth. There is no automatic explosion of socialexpenditure in ageing societies. First, pension expenditure has to beseen within the context of overall national social spending. Theincrease in pension expenditure will be compensated by certainexpenditure items that will diminish over time (family benefits,unemployment, housing and education). Second, if a generationmakes a rational decision to have fewer children than its parents’generation, then the members of that generation will simply have towork longer – thus compensating for missing workers in thegeneration of their children. Effective increases of retirement age,combined with a higher labour force participation of women, candefuse most of the demographic tension in overall NSPSs (see theEuroland exercise in Chapter 2). ILO model calculations show that ifpresent employment levels in Europe were to be maintained and theretirement age increased to 67 during the next decades, then theoverall cost of national social expenditure could be kept in the presentorder of magnitude.5 With growing longevity and improved healthstatus of the elderly population there is no demographic supply sideconstraint that would make a dramatic increase in the demographic
Box 5.13 (cont’d)
285
Financing techniques

ratio inevitable. Ageing alone is thus no reason to move to a fundedsystem. The real problem is therefore an employment problem. Ifeconomies were able to maintain the level of employment, thensocial protection would most likely remain sustainable.
On (tentative) balance. . .
Some tentative conclusions can be drawn from the above sets ofarguments:
1. Ageing alone does not provide sufficient financial or economicreasons for replacing present PAYG pension systems. Overallexpenditure is not likely to explode and can be controlled byparametric reforms of PAYG schemes.
2. Individual savings may isolate the overall financing of the pensionsystem more effectively against poor social governance. They maymake it more difficult to ‘‘load’’ pension expenditure with unfundedliabilities, which are often a consequence of government ‘‘generosity’’(especially before elections) or hidden financing of unemployment.
3. Mandatory savings schemes individualize financial risks. If theeconomy does not perform well or if the individual has anunfortunate personal economic biography (interrupted by sickness,disability or unemployment), the individual savings are reduced andthe consequence is a lower individual pension without repercussionsfor the society or the community of contributors. Since governmentsgenerally function only as financial guarantors of last resort tonational pension systems, this reduces their fiscal risk. Actuariallyspeaking, savings schemes are in ‘‘automatic financial equilibrium’’.
4. PAYG-financed schemes provide more predictable benefit replace-ment rates to individuals, as benefits are less dependent on economicperformance and hence less vulnerable to bad economic policies orgovernance. The benefit package under a PAYG scheme can also bemore comprehensive, as it can provide adequate coverage ofcontingencies like invalidity and death and minimum incomeguarantees to low-income workers. Savings-based pension schemesindividualize financial consequences of poverty, unemployment,invalidity and sickness and lead to particular disadvantages forwomen and low-income earners. However, they can only guarantee arelative pension level, as the absolute amounts of the average level ofpensions depend on the economic and demographic environment.
5. The effect of pension funding on national savings rate is generallyinconclusive (see Brown, 2002, pp.13–14), but positive effects cannotbe excluded under certain economic circumstances, for example incountries where the propensity to save is low, and where well-targeted and concentrated investments are urgently needed (inter
Box 5.13 (cont’d)
286
Financing social protection

alia in countries emerging from a major economic or politicalupheaval and lacking access to foreign investment).
6. On a macro-societal and macroeconomic basis PAYG and fundedpension systems or savings schemes are both subject to demo-graphic and economic risks. The fact that highly funded schemesare subject to the same demographic risks as PAYG schemes isdemonstrated in box table 5.13.1 – an illustration of stylizedsimplified demographics of a national old-age pension scheme –which shows the evolution of two pension schemes operating inthe framework of a declining population. A more sophisticatedanalysis is provided in Issue Brief 2. The schemes only differ by thepension formula and the method of funding. Ten points (or betterperiods) in the schemes’ life cycle are concerned. It is assumed thatat each of these points a full new active generation that spends 40years in activity is starting to contribute and a retired generationthat spends 20 years in retirement is starting to draw pensions.At each period a new generation joins the active status and an ‘‘old’’active generation goes into retirement (even if in this simplifiedmodel the old generation dies out after half the period). On the roadto retirement the active generation loses 25 per cent of its membersto death. An arguably conservative real rate of return of 1 per centper annum was assumed for a savings scheme. The table showsthat if one assumes that asset prices in capital markets and in thereal economy adjust themselves in line with declining populations,then the replacement rates under the funded scheme fall in linewith the demographic development, whereas in the PAYG schemethe contribution rate should increase if no policy intervention takesplace. If contribution rates are perceived to be high in PAYGschemes then policy action would consist of reducing replacementrates or the number of beneficiaries by increasing the retirementage. That means that neither the PAYG nor fully funded schemesare demographically immune.
7. The transitional cost of switching from a PAYG scheme to a savingsscheme is substantial. Cost may be borne by the transitiongeneration or pushed forward to a future generation by borrowingthroughout the transition period; in either case, the double-burdeneffect for at least one generation remains. Some reforms even‘‘consolidate’’ present pension expenditure – that is, reduce benefitlevels and hence force pensioners to ‘‘contribute’’ to the financing ofthe transition. The ILO study on pension reform in Turkey has shownthat it takes about five and a half decades for the total annual deficitfinancing of the transition to the government to disappear, if thegovernment finances the transition by covering the liabilities of thephased-out old pension scheme. The reason for the persistence ofthe double burden effect is simple. In PAYG schemes one or moreearly generations receive a windfall profit (they receive more in
Box 5.13 (cont’d)
Financing techniques
287

Box table 5.13.1 Stylized development of funded and unfunded pension schemes
Standard PAYG
Time periods1 2 3 4 5 6 7 8 9 10
Actives 1 000 1 000 1 000 900 800 700 600 500 500 500
Survival rate 0.75 0.75 0.75 0.75 0.75 0.75 0.75 0.75 0.75
Initial pensioners 0 750 750 750 675 600 525 450 375 375
Average wage 100 100 100 100 100 100 100 100 100 100
Average pension 40 40 40 40 40 40 40 40 40 40
Replacement rate 0.4 0.4 0.4 0.4 0.4 0.4 0.4 0.4 0.4 0.4
Accumulated capital 0
PAYG cost - PAYG 0.00 0.15 0.15 0.17 0.17 0.17 0.18 0.18 0.15 0.15
Contribution rate 0.15
Standard Fully Funded Asset Price Adjustment
Time periods
1 2 3 4 5 6 7 8 9 10
Actives 1 000 1 000 1 000 900 800 700 600 500 500 500
Survival rate 0.75 0.75 0.75 0.75 0.75 0.75 0.75 0.75
Initial pensioners 0 750 750 750 675 600 525 450 375 375
Average wage 100 100 100 100 100 100 100 100 100 100
Average pension 0.00 40.23 40.23 36.21 35.76 35.20 34.49 33.53 40.23 40.23
Replacement rate 0.00 0.40 0.40 0.36 0.36 0.35 0.34 0.34 0.40 0.40
Capital price 1.00 1.00 0.90 0.89 0.88 0.86 0.83 1.00 1.00 1.00
adjustment
Accumulatedcapital(for survivors)
549971.7003 549971.7003 494974.5303 439977.3602 384980.1902 329963.0202 274985.8501 274985.8501 274985.8501 274985.8501
PAYG COST 0.00 0.15 0.15 0.15 0.15 0.15 0.15 0.15 0.15 0.15
Contribution rate 0.15 0.15 0.15 0.15 0.15 0.15 0.15 0.15 0.15 0.15
288

Box table 5.13.1 (cont’d)
Standard Fully Funded No Asset Price Adjustment
Time Periods
1 2 3 4 5 6 7 8 9 10
Actives 1 000 1 000 1 000 900 800 700 600 500 500 500
Survival rate 0.75 0.75 0.75 0.75 0.75 0.75 0.75 0.75 0.75
Initial pensioners 0 750 750 750 675 600 525 450 375 375
Average wage 100 100 100 100 100 100 100 100 100 100
Average pension 0.15 40.23 40.23 40.23 40.23 40.23 40.23 40.23 40.23 40.23
Replacement rate 0.00 0.40 0.40 0.40 0.40 0.40 0.40 0.40 0.40 0.40
Capital price 1.00 1.00 1.00 1.00 1.00 1.00 1.00 1.00 1.00 1.00adjustment
Accumulated capital(for survivors)
549971.7003 549971.7003 549971.7003 494974.5303 439977.3602 384980.1902 329983.0202 274985.8501 274985.8501 274985.8501
PAYG Cost 0.00 0.15 0.15 0.17 0.17 0.17 0.18 0.18 0.15 0.15
Contribution rate 0.15 0.15 0.15 0.15 0.15 0.15 0.15 0.15 0.15 0.15
Notes
Assumed average wage: 100
Assumed average pension: 40
Wage increase: none
Pension increases in line with wages
Interest rate in % 0.01
Discount rate 0.99009901
Surviving cohort 750 out of 1000
Source: ILO calculations.
289

pensions than they contribute). Think of it as a ‘‘grandfather clause’’ –that is, a case where the first generation of retirees is receivingpensions without paying at all, their pensions being paid by the nextgeneration. That ‘‘debt’’ is now carried forward from generation togeneration, each active generation paying for the consumption of theprevious one. If we see this as a problem, then we automaticallyassume that society’s days are finite (or numbered) – at some pointin time there is a last generation of youngsters who will not havesuccessors to finance their consumption. As long as nobodyquestions the system we can go on taxing the next generationforever. As we have seen, active generations need to produce thegoods and services for the inactives anyway. Questions will ariseonly when the relative size of the generation shifts and the burden ofthe active generations is perceived as becoming too heavy. At thatpoint society will be looking for a new formula of sharingconsumption between actives and inactives. This is the situationwe are now encountering in many ‘‘old’’ or ‘‘ageing’’ societies. Thedebate of funding versus PAYG financing of pension schemes isde facto a distributive battle for shares of consumption between theold and the young.
8. Therefore, both PAYG and funded schemes are facing demo-graphic and economic risks. They differ by the actual allocation ofthe risk between the society and the individual. This allocation isa policy decision, one that is obviously not independent ofincome policies. If the overriding policy objective is relativeincome stability for the elderly, dependants and survivors, asociety would maintain a DB scheme regardless of its overallcost. If on the other hand the main policy objective is to maintainfiscal and financial stability to the greatest extent possible, thenletting a financial market mechanism decide on the respectiveconsumption shares of the elderly and disabled versus the activepopulation would be the preferred option. In order to ‘‘sell’’ thelatter option to the public, the notion of ‘‘equity’’ is used as apolicy instrument. That means that pension levels are linked notonly to financial market performance but also strictly to owncontributions to the scheme. The idea of ‘‘I get out of it what Iput in’’ appeals to many people’s feelings about equity andfairness, but ignores elements of ‘‘social’’ insurance wherebypersonal contributions also buy protection against a wider set ofsocial risks. If you are unlucky enough to live in a country whichundergoes fundamental political or economic crises while you areof active age, your pension under a DC scheme will be small,whereas a PAYG scheme can compensate to some extentfor previous hardship and make sure that you participate to amuch larger extent in present affluence. Pension formulae are
Box 5.13 (cont’d)
290
Financing social protection

Textbooks should not offer personal opinions and in box 5.13 effortswere made to carefully weigh the pros and cons. However, sometimes wefeel the need to state a view. The one featured on the following pageswas expressed by one of the teachers in the Maastricht Masters Course inSocial Protection Financing in the form of a letter to the students. It shouldbe read like a newspaper commentary. You could also skip it and readinstead much more scientific arguments put forward by Barr (2000) andBrown (2002).
ultimately a means to ration consumption of the inactive popu-lation in line with policy preferences.
9. Ultimately, the total size of consumption depends on economicgrowth which in turn depends on labour productivity. There may bevalid arguments to use the national pension system to createadditional national savings in a particular historical situation,namely if these savings are used to invest in the long-term abilityof the society to maintain a solid growth path. In the absence ofother sources of investment, that may be the perfect way ofinvesting in the long-term financial stability of the pension scheme.If a country falls into anarchy, even investing in a national policeforce might be a good investment from a long-term pensionperspective. It may help to protect property rights and hence attractlong-term investments which are the basis of economic affluence.However, as we have already seen, in DB pension schemes almostany level of reserves can be achieved. The difference from fundingpension schemes on an individual level would then simply be thatthe reserves are collective rather than individual in nature and thattheir level has no impact on the level of pensions. Reducingpensions or extending the duration of working lives would requiretransparent policy decisions when the demographic or economicenvironment changes, whereas in the case of individual fundingthis would occur automatically, without any explicit governmentintervention.
Notes
1 The first and most prominent source is World Bank (1994).2 Many of the arguments are discussed in detail in Beattie and McGillivray (1995).3 As quoted by Barr (2000).4 See for example Barr (1993), p. 223.5 See Cichon (1996).
Box 5.13 (cont’d)
291
Financing techniques

Commentary
Sorry, you won’t make it
A letter to Social Protection Financing students at Maastricht Universityon their prospects for early retirement
Sometime around 1880 in a small town in Poland my great-grandmother took her precautions. She saved for a rainy day. Rainydays were days without income from the tiny shop where her husband,a cobbler by trade, repaired the shoes of the town folk. The savings wouldalso be for ‘‘later’’, for when they got old. A bit of money could make it alittle more attractive for the eldest son to take care of them when mygreat-grandfather could no longer work. She put her money away safely.She put it under her mattress.
When her husband actually could work no longer they began to spendthe money. What neither of them had realized was that during the time ithad been stashed under the mattress the money had lost a lot of its value.It was certainly not enough to pay for their upkeep after retirement, butthey gave the shop to the eldest son, my grandfather, who in turn took careof them. He had his own problems, though, as one of his sons was sick andneeded a lot of medical attention, which had to be paid out of pocket. Sowhen his parents died, my grandfather sold the shop and moved to theRuhr Valley, where he became a travelling salesman: self-employed, andwithout any social protection from the then young social insurancescheme which did not cover the self-employed. But he had learnt thelesson from his mother, so he too – hard as it was – saved for a rainy day.But he also remembered the lesson about inflation and put some money inthe bank, where it happily accumulated interest, but not much. He boughta small place to live in, even though – so the story goes – his wife naggedconstantly that it wasn’t good enough and that he would have done betterto save a little longer and buy a better place later. But she dropped thesubject when the Great Depression wiped out all their savings in the 1930s.
Nothing could be put aside during the pre-war and war years.Grandmother died, but grandfather lived beyond retirement age andactually received a small pension from the white-collar scheme that nowcovered the self-employed, even though – as I suspect – he had alwayscheated on his income when paying contributions. What he did not thinkabout was that the 1957 pension reform had effectively changed thefinancing of the pension scheme from a highly funded one to a de factoPAYG scheme. That meant the scheme no longer had any sizeablereserves for when that rainy day came. But there was no need forreserves – such was the thinking at the time – there would always be newcontributors who would be able to finance the pensions of the oldergenerations. That worked well even when my father retired in the early1980s, although contribution rates kept going up, slowly but surely.
When the economy slowed down in the aftermath of the 1970s oilcrisis, the main problem was unemployment. In a great show of
292
Financing social protection

consensus, politicians and employers got people to retire early so theywould be ‘‘off the books’’. The falling numbers of the labour force due tothat great invention, the birth-control pill, would at some point take careof the unemployment problem anyway, they thought. The success of thehealth system and the general improvement in living conditions meansthat most people now spend about half as many years in retirement asthey spend working (up from a ratio of 1 to 4 half a century ago). Theyenter the labour market later, they leave it earlier, may not be employedthroughout their working lives and when they retire, they live happily forabout two decades. The PAYG pension scheme showed cracks of distress.Retirement age should go up. But in times of high unemployment that ispolitically almost unfeasible. Alternatively pension benefits should comedown, and contributions should go up. But that’s harsh medicine, andgetting spoilt generations to swallow it is far from easy.
Then, in the early 1990s, the World Bank came up with a solution.Save for a rainy day, it said, but not like your great-grandmother. Don’tput your money under the mattress. Save intelligently, invest wisely, andwe can keep contribution rates as they are. As long as the real rate ofreturn on investment that can be earned on the capital market is higherthan the sum of the rate of growth of employment and the real increase ofwages, you are better off taking your money to the capital market. There itwill not be vulnerable to ageing. And it will also do a lot of other good: itwill increase national savings and hence investment, which in turn willcreate higher growth, and that will increase the welfare of us all. Privatelyoperated pension funds (so-called ‘‘defined-contribution (DC) schemes’’)which collect your savings and convert the balance at the end of thesavings period into an annuity – that’s the answer to the ‘‘pension crisis’’,the Bank said. . .
There is little doubt that institutions on capital markets are interested ininstitutional savings that are available for investment and that can bemanaged for a substantial fee but at no risk to the manager. If thesesavings are not performing well then pensions will be lower than theywould be otherwise, but there is little risk to the manager of the scheme.There is ample evidence that the administrative fees of DC schemes arerelatively high, or at least considerably higher than reasonable administra-tive cost ratios of DB schemes in OECD countries. The pensioner incursadditional costs when the savings are converted into an annuity. Of course,in the interest of good governance the whole system also has to besupervised, which creates further cost. The whole process represents any-where between 10 and 36 per cent of annual contributions – at least20 times as much as it costs to administer the United States DB socialsecurity scheme (Old Age, Survivors and Disability Insurance (OASDI) pro-gram) (see Baker and Kar, 2002). All these costs reduce the ultimate pen-sion levels by the same amount, as each year the new contributions goinginto your account would be reduced by the administrative cost and hencethe whole balance of your savings would be affected in the same way.
Commentary (cont’d)
293
Financing techniques

If you base your pension income on a 35-year savings time, thatwould mean losing between 0.5 and 2 percentage points of interestincome per year, depending on the actual level of administrative cost andthe rate of return earned. There is considerable debate on the reliability ofthe return of investments on the capital market. It is hard to tell how bigyour risk is when you save, but it is a fact that without protectiveregulation (stipulating minimum pensions and a minimum rate of return)you have to bear it alone.
The impact of the new schemes on the aggregate national savingsrate is inconclusive. Countries with the highest pension reserves havelower (or not significantly different) savings rates compared to othercountries with relatively low pension reserves. However this is only anindication as we are comparing stocks and not changes of aggregatesavings rates after the introduction of mandatory pension savings. Butthat evidence is virtually non-existent, even though Chile claims a highersavings rate after the introduction of its scheme. So the macroeconomicimpact is doubtful.
The problem of the double burden for those who are active when thesystem is changed is not solved. They theoretically have to save forthemselves and to transfer income to the elderly at the same time. Ifmonies have to be borrowed (from the new pension savings) and repaidfrom future generations’ tax payments then the scheme remains defacto a PAYG scheme. But there might be miracle gains fromsomewhere (like privatization proceeds) that may help to finance thetransition.
That leaves us with the argument that we are better protected againstthe effect of ageing under a fully funded DC scheme.
Is a fully funded DC scheme better at protecting us against the effects
of ageing than a PAYG scheme?
‘‘Protecting’’ would certainly mean that we would get approximately thesame pension independently of demographic developments. The pensionformula of a DC scheme is:
P ¼ B=a€
where B is the balance of our savings at retirement and a is the present
value of a (let us say, indexed) pension of 1 currency unit paid from the
day of retirement. The present value is a function of the assumed future
interest rate, the annual adjustment rates of pensions but also the
assumed mortality rates after retirement. If we live longer that factor gets
bigger and our pensions get accordingly smaller.Not ideal for me, but fair enough, you might say.However that still implies that the rates of return in the economy are
indifferent to ageing, which may not be the case. To understand the issue,
Commentary (cont’d)
294
Financing social protection

we should try to understand, step by step, how a DC scheme actuallyfunctions. Let’s assume that we live in a simplified two-phase world,where we save in phase one and dissave in phase two, while the nextgeneration saves. In reality these phases are cohort-based processes thatoverlap, but that does not change the logic.
Step 1: We save
Let us assume that we belong to the first cohort of savers and that we putour contributions into our savings scheme (DC pension scheme) everyyear. These contributions are entered in our account. At the end of eachyear the interest earned on last year’s balance and the contributions paidduring the year and the interest thereon are credited to the account. Thatis the paperwork. But where does the interest rate come from?
Well, what happens internally is that our money – say the balance atthe beginning of each year (to make things simpler, let’s say we are notwithdrawing anything this year) – is invested together with all otherbalances in bonds, stocks, direct investments, etc. The market value ofthese investments is Ro equal to the amount of reserves in the scheme atthe beginning of a year. At the end of the year, some interest and dividendpayments will have been made and the asset price will have changed.Together the value of the investments will then be R1. The rate of return isthen calculated as:
I ¼ 2ðR1 � RoÞ=ðR1 þ RoÞ
That rate will be applied to our initial balance at the beginning of the year.We can assume that it will be applied pro rata temporis to the newcontributions made during the year as well. As long as R1 is bigger thanRo all should be right with the world. Again, at the beginning of the newyear the total amount in all accounts should add up to the value of thejoint portfolio of reserves held by our scheme. The accounts in theportfolio are being managed together. Nobody deals with hundreds ofdifferent accounts separately. If the portfolio of the scheme as a whole ispredominantly made up of bonds with fixed-interest payments and aslong as inflation is lower than the interest there is no loss, at least. If agrowing number of governments pursue a balanced budget policy andrepay their debt then the volume of bonds declines and we have to lookfor alternative investments. Let us simplify matters again and assume thatwe go for stocks.
This means that apart from dividends our rate of return is largelyaffected by the price on the stock market. The price has been going upsince our first investments. We were buying in increasing numbers andno pensions were paid. The latter means that our scheme had not yet hadto sell assets to finance our pensions. If a nation does this, prices on thestock market should go up if institutional savings through pension fundsare a net addition to savings in a world without DC schemes. We are
Commentary (cont’d)
295
Financing techniques

forced to buy – as required by our government. We have no option not tosave. And asset prices went up for a long time, as we all know. Around25 per cent of total equity capital in the United Kingdom and the UnitedStates is already owned by pension funds. The only option open to us ifwe want to consume more would be to reduce our non-pension savings.If we are lucky enough to have any, that is. . .
Step 2: We retire
Let us assume that we retire at the beginning of a year when the nextgeneration of contributors comes in. The dissaving period begins, we areselling assets to the next generation of savers. Through the capital marketthey transfer some of their current income to us. They thus earn anentitlement to a future pension for themselves. In the PAYG system theseentitlements were earned by a legal reward for taking care of the previousgeneration.
In practice our savings balance enters into a cohort pool from whichannuities are paid. That pool should be exhausted when the lastsurvivor of our cohort dies – provided the actuaries did their jobproperly and the assumed future rates of return behave as assumed. Ifnot, the scheme may be in surplus or in trouble. However, if we think ofourselves as just average guys, it suffices to think of us as drawingdown our savings by an equal amount every year (assuming there is noinflation in the system).
Now let us assume that our society is ageing. To take things to theextreme, we are assuming that we are living in one of two alternativeworlds. One is a closed economy, the other a completely open one. Let uslook at them in turn:
Closed economy
All other things being equal, the numbers of the active generation godown. If their productivity increases enough to compensate for the lossin numbers then their wages will increase faster than during our time.Overall economic growth rates might be sustainable. Let us assumethey save more per capita to keep the overall national savings rateconstant; that would mean sustained demand for financial and tangibleassets, enabling us to sell ours with a probably modest but real rate ofreturn, which would be needed to finance our pension through theconversion of our balance into annuities. That means we would receivethe pension that we more or less expected. But if the new generationcan keep up productivity to that extent they could have also paid us aPAYG pension. And Issue Brief 2 casts some doubt on whetherstandards of living and income can really be maintained in the face ofageing.
What happens if the decline in the new generation is faster, and thefall in numbers cannot be compensated by productivity gains? Then
Commentary (cont’d)
296
Financing social protection

GDP would drop, savings would most likely go down with it and theamount of savings available to absorb our dissavings would bereduced. The demand for financial assets would hence decline andasset prices would go down, which in turn means our pensions wouldbe lower than anticipated. We could counteract that by working longerand thus compensate for the loss in the numerical size of the activegeneration (for which we are ourselves responsible since we did notproduce enough babies), by retiring later and technically speakingreducing the annuity factor in the pension formula (i.e. reduce ourpensions).
We could have done that just as well in a PAYG scheme.
Open economy
Let us assume that we simply trade our assets on the world’s financial ortangible asset markets and that our investments are all globally mobile(which they may not be), and let us assume also that the number ofbuyers on the world market grows indefinitely. It may not do that, as theworld is ageing globally. But let us assume that we are still retiring in aphase of growing numbers of global buyers.
We would be able to earn at least a decent rate of return on our assets.We would be able to draw down a substantial pension from our‘‘dissavings account’’ every year. So far, so good.
Unfortunately, we – or most of us – would want to (or probably haveto) live in the society we grew up in. An ageing society. The return onour assets would be converted from, say, US dollars into euros. As wewould bring in an increasing amount of dollars, the exchange ratewould most likely fall since the ageing society would buy less from theglobal market and there is less demand for dollars. That means ourpension would be devalued in purchasing power terms. That may ormay not happen.
Let us assume the exchange rate stays constant; we would then – as ageneration of elderly people – bring in substantial amounts of money intothe economy. We would want to finance our consumption (or that of ourgrandchildren) with that amount of money. We would not buy goods likeconsumer durables on the world market, nor would we buy quantities ofhouses or domestically produced cars. We would first of all buy healthcare, nursing and other services, as well as food. Food is either producedor processed locally or brought into the country and distributed locally.Nursing and health care have to be produced locally. For political reasonswe may not be able to import enough foreign nurses and doctors. Theservices are thus most likely produced by a shrinking generation. If theirproductivity could compensate for the loss of numerical size of the labourforce we would be able to finance the consumption we need. If they arethat productive, they could also finance a PAYG scheme. However, if theyare not, then our money will compete for the purchase of a contracting
Commentary (cont’d)
297
Financing techniques

amount of goods and services produced and hence will produce inflation.Our real consumption would go down.
To avoid this, we could compensate for the loss of the work force andwork longer. We could have done that under a PAYG scheme.
What really matters is the entitlement to consumption
What my great-grandmother was trying to do when she put that moneyunder the mattress, or my grandfather when he put it into the bank, or myfather when he paid his social security contribution, was to make sure thatthey could finance a decent level of consumption once they were nolonger active. My great-grandmother knew that she had to give thatmoney to the household she would be living in so the family could takecare of her. She knew that she would have to pay the local doctor or thehospital, and the community when buying her gravesite. Somehow thatknowledge got lost. She did not know enough about making sure that thevalue of her money kept up with the prices of the services that she wouldhave to buy. But she knew that she and her husband could not afford toretire too early so as not to make the family take care of her for too long.Somehow that knowledge got lost, too.
What ultimately matters is that when we are old there are enoughpeople around ensuring GDP that provides for levels of consumption highenough that those other people are still willing to share with us. What weearn during our active lives is a set of certificates that entitle us to afuture share in GDP. Whether that is a piece of paper with a legal claim ina PAYG scheme or one with a figure on it that says that we once put acertain amount of money into the capital market, appears rathera secondary notion. Ultimately, entitlements in both systems can bereviewed and altered. If we do not want to see our level of consumptiondrop too dramatically we would have to do our bit to make sure that theoverall GDP gets produced. Investing wisely into an economy thatmaintains high productivity rates or one that provides workplaces for theelderly may do that. Even if the former succeeds we still don’t knowwhether the next generation is willing to share as much as we feel theyshould. Our safest bet is to keep producing as long as we can. Reducedependency, as the technicians say.
In the end, it all depends on the magnitude of the different effects.But – to this day – nobody knows exactly how an economy reacts toageing. Again, the best bet is to reduce the amount of transfers needed.Whether there is money under the mattress or not, we won’t have asmuch time as we thought to lie on that mattress and be idle.
Incidentally, who said that being idle is a good thing, anyway?I am turning 50 and might still make it into a relatively early
retirement. As most of you are 20 years behind me you most likely willnot. Sorry, folks.
8 November 2002
Commentary (cont’d)
298
Financing social protection

5.3.6 Rate setting in fully and highly funded schemes
Where contribution rate levels are concerned, the least room for manoeuvreexists when countries opt for a very high level of funding or for fully fundedpension schemes.
Some countries have decided to operate their schemes on a high level offunding in the belief that this would increase their national savings rate. Wehave seen that research on this issue is inconclusive, as discussed in lectures onthe economic implications of social security. Other countries follow a fullfunding regime for different purposes: Kuwait turned to full funding so as toexploit its current positive economic situation, backed by still abundant oilsupplies, in order to provide some guarantee for its long-term pension promiseseven for the day when the oil runs out. Its present economic state of affairsallows high initial contribution rates, calculated on a terminal funding basis.Countries such as India and Jordan have a relatively high level of funding oftheir DB social insurance schemes. Their aim is to have their pension liabilitiesfully funded. The schemes’ reserves are mainly invested in either publicsecurities or short-term assets.
It should be noted that public pension funding through investment ingovernment securities is little more than PAYG financing in the context ofoverall public sector financing. While excess reserves are invested in publicsecurities, non-social security tax rates are kept ‘‘artificially’’ low since excessgovernment expenditure is financed through social security contributions.During the phase when governments have to redeem their debt, this has to bedone from current government revenues – in other words, the government hasto raise taxes or forgo other expenditure.
In fully funded DB schemes the contribution rate is the dependent variableonce the level of benefits has been set. The setting of the contribution rateunder mandatory retirement savings systems should ideally be based onsimilar calculations starting from desired benefit levels under a full career, butin practice it seems to be governed by affordability, economic and financialaspects.
The accumulation of a high level of reserve funds can be desirable topromote contribution rate stability in the context of an ageing population or amaturing scheme. Nevertheless, as shown in figure 5.3, stability of thecontribution rate is not synonymous with full funding of pension liabilities.Maintaining a high level of funding makes the contribution rate sensitive to theunavoidable deviations of experience from actuarial assumptions, contributionsand benefit payments. These deviations generate surpluses or deficits thatnecessitate periodic changes in the contribution rate to maintain the scheme’sfunding objective.12 The risks of pension funding are more pronounced forcountries with unstable macroeconomic conditions or limited capital markets.History has shown that pension assets may be depleted by high inflation, bad
299
Financing techniques

investment policies (i.e. poor management) or government abuse of pensionreserves (i.e. poor governance).
In any case, if a country decides to build up a substantial reserve foreconomic purposes it has to do so during the early stages of a scheme’sexistence, while expenditure is low and a contribution rate markedly higherthan under PAYG standards can be charged. One way of doing this is to aim fora constant contribution rate from the inception of the scheme. This istheoretically possible with a GAP system. While this contribution level is notneeded to cover current expenditure in the early years of the scheme, it can beconsidered fair to the early contributing generations as they acquire the sametitle to future benefits in exchange for their contributions as future generations(principle of intergenerational equity).
The stability of the contribution rate may enhance the scheme’ssustainability by strengthening fiscal discipline via an early recognition of thescheme’s long-term cost and the cost implications of benefit amendments. If ascheme was operated on a scaled premium or a PAYG system from inception,the first generations of insured persons would inevitably benefit fromthe scheme as their ‘‘return’’ on investment compared with that of subse-quent generations would be positive. The GAP can be calculated on the basisof the formula for the general financial equilibrium. The resulting reserve levelis a dependent variable and will reach a maximum at about half of the periodduring which it is calculated (which is usually a long period used as a proxyfor the theoretical infinity on which the concept of the general averagepremium is based).
5.3.7 Rate setting in PAYG or scaled premium regimes
Even after the recent reforms in a few countries in Latin America and Centraland Eastern Europe, most national social security schemes are still financed ona PAYG or partial funding basis (as defined through a scaled premium system).The boundary between the two systems is a matter of definition. Whether ascheme is a PAYG system with a necessary contingency reserve or scaledpremium with a relatively small technical reserve is a matter of subjectivejudgement. Still, the process of fixing the level of contribution rates under bothsystems deserves a more in-depth analysis.
There is no hard-and-fast rule as to the level of the contingency reserve thata PAYG scheme has to maintain. The most rational procedure would be tosimulate, through a combined economic and actuarial risk analysis, the financialdevelopment under a most pessimistic economic scenario and then calculate acontingency reserve which has to cover income shortfalls during the period thatpolicy makers would need to adjust either the contribution rate or the benefitprovisions to the different economic circumstances. The level of reserves is
300
Financing social protection

obviously dependent on the volatility of the economy and the state of maturityof the scheme, but a contingency reserve of one to two times the annualexpenditure should be sufficient in most cases.13
Frequent revisions of the contribution rate under a PAYG or scaled premiumsystem could be preferable in order to avoid an excessive accumulation ofreserve funds or in order to keep the contribution rate at a low level in a periodof economic difficulties or in the early stages of economic development.
The decision of countries that have opted for partial funding ratherthan PAYG financing was motivated by either the intention to limit contri-bution rate increases during the first years of the schemes or the wish to haveinvestment income in order to finance part of future pension expenditure. SomeOECD countries (Canada, Sweden) have recently decided to raise the fundinglevel of their social insurance schemes as a way of reducing future contributionrates during periods of high pension spending associated with the ageing oftheir populations.
Experience has shown, though, that the phased increase of contributionrates under a pure PAYG or a scaled premium approach has substantial politicalrisks. It is tempting to introduce a pension scheme with a generous pensionformula and an initially very low contribution rate. However, when the perfectlynormal cost increase, as demonstrated in figure 5.2, sets in with full force lateron in the maturation process, the contribution rates will have to be increased.The rule of thumb is as follows: the longer the period of contribution stabilityunder a scaled premium system, the higher the necessary increase in contribu-tion rates between the different periods of equilibrium, provided that a definedlevel of funding (i.e. a defined capitalization ratio k) has to be maintained.
The political problem is that governments often wait too long beforeraising contribution rates as each increase, even if perfectly normal andforeseeable financially, is politically unpopular. Waiting too long means thatthe scheme will either run into liquidity problems or necessitate a bigcontribution hike. Uninformed political propaganda will immediately declarethe scheme bankrupt and call for it to be fundamentally reformed ordissolved. Political managers often react by taking ‘‘consolidation measures’’which entail cutting benefit levels or tightening eligibility conditions. Tosome extent these might even be justified, as beneficiaries in young schemesgenerally have only limited entitlements and a generous pension formulahelps to boost their standard of living. Later on, as the average careers ofbeneficiaries get longer, stricter eligibility conditions and benefits entitle-ments earned per year of service might be justified. However, maintainingthe financial equilibrium through ad hoc adjustments to the benefit side iscommon practice, often necessary but certainly not always constitutive ofgood governance. Ad hoc modifications of the benefits side are generallydetrimental to the scheme’s public credibility, which is in effect its mostimportant asset. In order to avoid such manipulations as much as possible,schemes need three regulatory provisions:
301
Financing techniques

1. A clear definition of the actuarial equilibrium (stipulating the duration of theperiod of equilibrium x and the level of funding k) combined with a rule onwhen the contribution has to be increased, if necessary.
2. A benefit formula that can be maintained at the stationary state and not onlyduring the scheme’s ‘‘youth’’, possibly combined with transparenttransitional benefit provisions for the early pensioner generations (so-called‘‘grandfather clauses’’).
3. A set of demographic and financial stabilizers stipulating clearly how thefinancial consequences of adverse demographic and financial developmentsare allocated between contributors and beneficiaries.
Experience shows that without such a set of rules the financial equi-librium of a partially funded or even a PAYG scheme cannot be maintained.Wherever partially funded schemes have failed in the past, their failure couldbe traced back to political opportunism that failed to define the above rules oradhere to them.
5.4 FINANCING OTHER BENEFITS
This section groups considerations that should influence the determination ofthe financing system for the remaining major social transfers in an NSPS.Prominence is given to the main anti-poverty tool in national social protectionschemes, namely means-tested social assistance, sometimes also called‘‘welfare’’. This is followed by the exploration of a universal basic income(BI) which is in many ways an alternative to targeted social assistance butwould certainly under national expenditure constraints also require substantialadaptations of national social transfer structures. The system is not yet fullyoperational in any major country, but a lively debate on its pros and cons isgoing on in South Africa, for example. In an era marked by simultaneous trendstowards greater universalization of basic benefits and greater individualizationof higher-level benefits, we felt that we should not leave this alternative out ofour technical analyses.
The section is completed by a cursory mention of other short- and long-termbenefits. The financing systems used for them are basically a combination of thesystems that are applied to health care, pensions or social assistance and do notwarrant any special treatment.
5.4.1 Social assistance
In most countries with fully developed social protection benefits, socialassistance schemes are the schemes of last resort for the poor, providing generalincome cash subsidies as well as a variety of in-kind benefits ranging from foodand clothing assistance to the provision of health care benefits for thepopulation lacking coverage. The only determinant for benefit eligibility should
302
Financing social protection

be need. In practice, benefit expenditure is often de facto cash-limited – that is,benefit levels are also determined by the amount of resources that are madeavailable by the financiers. The financiers of anti-poverty benefits are generallynational and local governments. Benefits are thus financed out of generaltaxation. Public funds may be complemented by charities or other privateinitiatives. In all cases PAYG is the financing method used.
As noted in Chapter 4, social assistance schemes are also part of the State’srole as ultimate guarantor of a minimum level of social security to all citizens aswell as de facto re-insurer for other social transfer schemes. In some casessocial assistance schemes also function as the ‘‘default repair system’’ of thewelfare state. Some NSPSs may be confronted with new risks for which nospecific protection schemes have yet been developed, and social assistanceschemes are therefore used to fill the void. The classic example is the soaringcost of nursing care for the very old in many OECD countries. Since familypatterns have changed 24-hour nursing of disabled and mostly elderly relativescould no longer be provided in a family setting, and yet monthly nursing homerates were prohibitive for many families. Social assistance was thus used almostroutinely to finance nursing care at least in part. In some countries (Austria,Germany, Luxembourg) this situation triggered the introduction of a newbranch of social insurance, the so-called long-term care insurance.
Social assistance benefits are generally means-tested. Means tests seek toestablish and measure the need of an individual or a family for benefits.Principal eligibility to income support benefits is established by assessing thelevel and potential sources of income of a family (such as support from familymembers or potential revenues from the sale of assets) and comparing that levelto an amount of income needed to buy a basket of goods and services that anindividual or a household needs in order to enjoy a minimum standard of living.The benchmark income for the comparison is generally created by establishinga basket or baskets of minimum goods and services which are then costed atcurrent price levels. In the former planned-economy countries in Central andEastern Europe these baskets were called Minimum Consumption Baskets. Ifthe income of a family falls short of the cost of the basket for their family type –that is, a household in a certain region with a certain demographic composition,then the difference between the household’s income or potential income and thecost of the basket (or a certain percentage thereof) should be the socialassistance benefit that is paid to the family. In practice many social assistanceschemes thus follow an absolute concept of a poverty line when it comes todetermining benefits even though a relative concept may be followed in nationalstatistics. If social assistance income support is paid up to a certain proportionof the cost of the minimum consumption basket, that proportion is called thesocial assistance intervention line (SAIL) or the guaranteed minimum income.
The total minimum income for households is generally ‘‘anchored’’ to aminimum income estimate for one adult and all further family members arethen taken into account by means of ‘‘adult equivalent’’ weightings. In Ireland,
303
Financing techniques

for example, the second adult in a household is counted as requiring anadditional income of 60 per cent of the minimum income of the first adult, and achild a further 40 per cent. Special additional transfers in cash or in kind may bemade in case of special need, such as chronic illness or disability. Manycountries also pay special housing allowances for the poor.
The price of the minimum basket and hence the minimum income may varyfrom region to region, as price levels within larger countries also generallyvary. The actual relationship between the SAIL or guaranteed minimum incomeand the actual price of a minimum consumption basket may not always bestrict. Governments may choose not to adjust the SAIL for inflation for severalyears in order to keep costs down. Table 5.8 details the guaranteed minimumincome in several European countries for an adult. These figures may not becompletely comparable as some countries pay additional ancillary benefits.
The strictness of the means test varies greatly between countries. It may bea test of all financial means available to a person, ranging from the income andassets of direct relatives and own assets to income from all types of sources, ormerely a test of current income. In Germany, for example, children may be heldresponsible for the provision of a minimum income to needy parents. InAustralia, on the other hand, public pension is in theory means-tested but themeans test is fairly generous. In any case, means testing is the most frequentlyused way of targeting benefits (i.e. directing the bulk of the expenditure to thosemost in need). Critics of means testing argue that the procedure itself is verycostly and a deterrent to efficient benefit delivery and that the receipt of a socialassistance benefit inevitably leads to social stigma. Stigma may actually be usedimplicitly as a means to contain expenditure. Means-tested social assistancebenefits might also create poverty traps whereby it may not be rational for a
Table 5.8 Guaranteed minimum income, selected Europeancountries, 1998–2000
Country Amount of guaranteed minimum incomeper month per single adult (in euros)
Year
Estonia 25 2000
Latvia 21 2000
Czech Republic 107 2000
France 367 1998
Ireland 367 1998
Italy (maximum) 268 1998
Germany 316 1998
Denmark 930 1998
Belgium 513 1998
Portugal 109 1998
Source: European Commission (1999); Council of Europe (2001).
304
Financing social protection

social assistance recipient to take up a low-paid (formal sector) job with anincome close to the social assistance level. All three pitfalls – relatively highbenefit administration cost, social stigma, and the poverty gap – can of coursebe avoided if benefits are paid across the board. But this means paying benefitsto a number of people who do not actually need them and who would thusconsume resources that would not be available for redistribution to those whoare truly in need.
A ‘‘mid-way’’ house between general means testing and universal benefitsis ‘‘categorical targeting’’. This method of channelling cash and in-kind supportto the needy identifies categories of people who – with a substantial probabil-ity – require financial assistance. One such category would be, for example,families with more than one or two children. The probability of living inpoverty is much higher for families with children than for those without any.Box 5.14 shows that relationship in the arguably extreme case of the RussianFederation in the late 1990s, when the country was simultaneously coping witha difficult structural economic transition and the effects of a financial crisis.
Box 5.14 Poverty and the financial crisis in the Russian Federation1
World Bank data2 paint a dramatic picture with regard to the povertytriggered in the Russian Federation by the financial crisis of the late 1990s.Already in 1996, basing itself on the findings of three rounds of a RussianLongitudinal Monitoring Survey (RLMS),3 the Bank placed RussianFederation’s poverty rate at 43.1 per cent, or nearly double the ratequoted by the country’s statistical office (Goskomstat). Its estimates arebased on the same minimum subsistence levels (differentiated bychildren, active-age adults, and persons older than normal retirementage) as those used by Goskomstat. The Bank reckons that in 1996 about15 per cent of the population lived in extreme poverty – this figure refersto persons living in households where less than 50 per cent of the officialsubsistence minimum consumption basket is consumed.
Later World Bank data show that the August 1998 financial crisisprobably pushed up the extreme poverty rate by between 2.1 and 4.4percentage points. If the general poverty rate were to increase propor-tionally, that would mean that in the aftermath of the crisis as many as 55to 60 per cent of all Russians might have been poor. It should be notedthat the above data try to take account of income earned in the shadoweconomy, by basing household poverty calculations on the value of totalhousehold consumption (instead of money income per household, whichis lower because of underreporting). But it is not quite clear to what extentthis procedure really succeeds in accounting for the full amount ofincome earned in the informal sector.
However, as in other countries, poverty does not affect all populationgroups evenly. World Bank data also showed that in 1996 almost half ofall households with one child were poor and about 16 per cent extremely
305
Financing techniques

poor, while some 61 per cent of all families with two or more childrenwere poor and about 30 per cent extremely poor. The 1998 crisis hasalmost certainly sent even more families with children into poverty. Onemight assume that about two-thirds of all families with two and morechildren are poor. The data for households with one or more elderlymembers are quite surprising: their poverty rates are clearly below thenational average poverty rate. The World Bank’s main findings on povertyin the Russian Federation are summarized in box table 5.14.1.
One should not use the above data to jump to premature conclusionsregarding the effectiveness and target efficiency of the social protectionsystem of the country. It is patently true that the social assistance scheme,designed to alleviate poverty by providing some form of minimumincome protection for all in need, is not fulfilling its objective. On theother hand, it should not be simply assumed that the resources spent onthe overall NSPS are all ill-targeted or inefficiently allocated. It is obviousthat the pension system continued to function even in difficult circum-stances, managing to keep millions of elderly and disabled persons aswell as widows and orphans at least out of severe poverty and
furthermore providing some indirect transfer income to youngermembers of the households (who can be assumed to be taking care ofthe elderly). Without money transfers from the pension systems – even ifthese transfers are smaller than promised decades ago and often paid
Box 5.14 (cont’d.)
Box table 5.14.1 Poverty and extreme poverty estimates for the RussianFederation
Population groups Pre-crisis estimate 1996 Post-crisis estimate1
1998/99
Povertyrate %
Extremepoverty rate %
Povertyrate %
Extremepoverty rate %
All persons 43.1 15.0 49.1 18.3
Persons in households with number of elderly members
None 47.8 16.3 54.1 20.2
One 39.9 13.6 45.1 16.2
Two 31.5 12.2 37.6 14.6
Three 38.8 17.9 43.3 22.4
Persons in households with number of children
None 30.6 9.9 35.6 12.9
One 48.6 15.9 55.6 19.0
Two or more 61.2 29.2 67.5 28.5
1Assuming a linear decline of incomes across the income distribution due to the August1998 crisis.
Source: Data supplied by J. Braithwaite and M. Rutkowski, World Bank, 1999.
306
Financing social protection

There is an obvious relationship between the use of rights-based benefitsystems (such as social insurance schemes where a certain number ofcontributions entitle the contributor to a certain amount of benefits or incountries where benefits are universal) and social assistance schemes.Generally, countries that rely quite heavily on means-tested social assistancebenefits have a smaller share of non-means-tested social expenditure thancountries relying on a rights-based approach. The former also generally apply a‘‘residual model’’ of the welfare state (according to the taxonomy in Chapter 3).Table 5.9 illustrates that point by detailing the expenditure and incomecomposition of seven NSPSs, three of which follow the classical Bismarckiansocial insurance model, two the Nordic welfare model, and two the residualmodel. Relying to a considerable extent on social assistance is obviouslysynonymous with following a conservative policy when it comes to the‘‘generosity’’ of social transfers.
The quantitative techniques needed to establish the cost of a socialassistance scheme are essentially the same as those needed to calculate theamount of the poverty gap (see Section 1.4.1.2 in Chapter 1) and require nofurther explanation at this point.
However, any government in charge – whether national or local – hasseveral ways to determine the level of overall expenditure or to shift costs toother social protection institutions at any given ‘‘objective’’ poverty level.Table 5.10 summarizes the administrative means of determining the level ofsocial assistance expenditure.
In any case, there is little doubt that social assistance schemes in afunctioning governance environment can be a cost-effective measure to combatabsolute poverty. The actual cost depends to a large extent on the society’svalues – they determine on the one hand the generosity of the level of benefitsand on the other the extent to which the population might abuse the benefits. In adeveloping country context, using a categorical system broader than elaborateindividual means tests might be a more appropriate way of identifying the needy.
late – pensioners would be the core group of the poor. It must thus be saidthat the bulk of the overall social transfer payments in the country wassuccessful in preventing poverty. This fact is often overlooked by thosewho focus their critique of the Russian social protection system on theinadequacy of its social assistance scheme.
Notes
1 Based on Cichon (1999b).2 As supplied by M. Rutkowski and J. Braithwaite (World Bank) in January 1999.3 The database is public, and estimates and calculations are open to checks by any researcher.
Box 5.14 (cont’d.)
307
Financing techniques

5.4.2 Universal (basic) minimum income
Proponents of this idea, found across the political spectrum,14 have suggested avariety of alternative benefit systems to cure the apparent ills of the traditionalsystems, namely adverse incentive effects, stigma of needs-related benefits,increasing difficulties to achieve universal coverage in view of changing labourmarket attachment patterns, and the rising cost of overall NSPSs.
Table 5.9 Composition of benefits and receipts of three classical types ofwelfare state in Europe, 1998
‘‘Social insurance countries’’ ‘‘Nordic welfarestates’’
‘‘Residual welfarestates’’
Belgium France Germany Denmark Sweden Ireland UnitedKingdom
Expenditure and receipts in % of GDP
Expenditure 27.5 30.5 29.3 30.0 33.3 16.1 26.9
Means-tested benefits 1.0 3.3 2.7 0.9 1.9 4.9 4.3
Non-means-testedbenefits
24.9 25.6 25.5 28.3 31.0 10.5 21.6
Administrative cost 1.0 1.2 1.0 0.8 0.5 0.7 0.9
Other expenditure 0.6 0.3 0.1 0.0 0.0 0.1
Revenues 30.2 30.7 30.1 34.2 36.2 16.1 29.1
Social securitycontributions
22.0 20.4 19.9 9.1 17.5 6.0 14.9
Tax receipts 7.4 9.4 9.3 22.9 16.6 9.8 13.8
Other receipts 0.8 0.9 0.9 2.1 2.1 0.2 0.4
Discrepancy 2.6 0.2 0.8 4.2 3.0 0.0 2.2
Expenditure and receipts in % of national total
Expenditure 100.0 100.0 100.0 100.0 100.0 100.0 100.0
Means-tested benefits 3.7 10.9 9.4 2.8 5.6 30.3 15.8
Non-means-testedbenefits
90.4 84.1 86.9 94.3 93.0 65.2 78.4
Administrative cost 3.8 4.0 3.4 2.7 1.5 4.3 3.1
Other expenditure 2.1 1.0 0.3 0.2 -0.1 0.1 0.3
Revenues 100.0 100.0 100.0 100.0 100.0 100.0 100.0
Social securitycontributions
73.0 66.4 66.1 26.6 48.3 37.5 51.2
Tax receipts 24.4 30.7 30.9 67.1 45.8 61.3 47.6
Other receipts 2.6 2.9 3.0 6.3 5.8 1.2 1.2
Discrepancy 0.0 0.0 0.0 0.0 0.0 0.0 0.0
Source: EUROSTAT.
308
Financing social protection

Most of these alternative benefit systems are derivatives or combinations ofthree basic elements:
(a) an unconditional transfer payment (income) for every member of thesociety, financed from general revenues (the so-called citizen’s income (CI)or basic income (BI));
(b) negative income tax, which automatically supplements the income oftaxpayers when their income is below certain thresholds,
(c) public or socially useful employment for persons excluded from the labourmarket (also called ‘‘workfare’’), often as a condition for the granting ofsocial assistance payments.
The negative income tax mechanism is fundamentally only slightly differentfrom a means-tested social assistance cash-income support system or otherincome-dependent benefits (like various types of family benefits in severalcountries). Administratively speaking it is likely to be more cumbersome and lessflexible, but for benefit recipients it is more accurate and less stigmatizing. Itindicates that the tax system can be used to better target tax-financed benefits but ishardly a viable administrative response to urgent problems on the individual basis.The concept of ‘‘workfare’’ has been criticized on the grounds of undemocraticcoercion and the fact that it could undercut the wage structure in an economy.15
The main discussion on alternative benefit systems is presently focused onthe concept of basic or citizen’s incomes, but it is still largely confined toacademic circles, although wider political debates are under way in SouthAfrica and some states of Brazil. The political supporters of the concept come
Table 5.10 Administrative determinants of social assistance expenditure atgiven objective poverty levels
Impact Measures
Total social assistance expenditure Shifting social assistance tasks to other social protectionschemes (e.g. social assistance pensions to be paidthrough the pension scheme) or other government units(e.g. shifting cost down from the national level to localgovernment)Limiting overall expenditure in budgets and providingbenefits on a ‘‘first come, first served’’ basis or on anupward sliding scale of neediness
Number of recipients Changing the amount and types of income and assetsincorporated into the means test (e.g. the income andassets of close relatives)Using stigma or complicated procedures to deterutilization of benefitSuppressing/publishing information about entitlements
Amount of benefits Determining amounts or ingredients of minimumconsumption basket discretionarilyAdjustment/non-adjustment of the SAIL
309
Financing techniques

from different parts of the political spectrum. One group is predominantlyconcerned with rising poverty, another with long-term prospects of growingexpenditure for what they consider to be unsustainable traditional socialprotection systems and is eager to ‘‘buy itself’’ out of a social policy debate. Inmost countries such schemes are still considered as being too radical. However,there is a new debate on the universalization of benefits (see Hoskins, 2002) thatmight lead to a re-introduction of some universal elements.
In order to finance a BI it is generally proposed to use the present budgetallocation for social assistance and part of the budgetary or contributionfinancing for social security benefits as a financing tool for the new system. Ineffect the introduction of BI thus not only amounts to a fundamentalrestructuring of the benefits system but also of the financing system. Thenew structure of the overall social protection system – after the introduction ofBI – could look as outlined in table 5.11.
The main systemic difference between the present and alternative system ofsocial transfers is that BI is designed as a multipurpose benefit replacinga number of other benefits totally or in part. The main arguments for and againstBI are summarized in box 5.15. A much more passionate defence of BI can befound in Standing (2002, pp. 201–238).
Table 5.11 Structure of an alternative social protection system with a basicincome
Social protectionsubsystem and benefits
Contingencies covered Population covered Principal conditions
Universal benefits(tax financed)
• health services Ill health All residents Event of contingency
• basic income All residents None
Social security
A. Statutory All benefits to bereplaced largely by BI
B. Voluntary
(financed byvoluntary contributions)
• pensions Old age, invalidity,survivorship
Defined subgroupsof employees plusdependants
Event of contingencyplus eligibility conditions
• health Ill health
Social assistance(tax financed)
• benefits in kind Income (poverty), otherspecific conditions(disability, handicap)
All residents Event of contingencyplus means test
310
Financing social protection

Preliminary, rough calculations by the ILO’s Central and Eastern Europeanteam in the mid-1990s (see box 5.16) show for example that in a typical countryin Central or Eastern Europe a BI benefit equal to the poverty-line level (i.e. 45per cent of current average wage) would most likely increase the overall socialexpenditure ratio (SER). But this is largely an effect of churning income fromthe employed to the unemployed workforce by financing BI income from taxpayments of the actives themselves. The real income redistribution to non-active groups would probably be reduced. The benefit would have to be paidout of general revenues. It will probably only stand a chance in the policydebate if the overall tax and contribution burden after such fundamentalrestructuring of the benefit and financing system does not exceed previouslyaccepted limits in the respective societies (see Chapter 4). It is not clear yethow the income churning effect affects the acceptable limits of taxation.
Box 5.15 Discussing the pros and cons of a universal basic income
The arguments in favour of an unconditional BI are the following:1
1. The right to a minimum standard of living and hence a minimumincome is a human right; BI would achieve that objective.
2. BI benefits could achieve a 100 per cent benefit take-up rate withoutany social stigma.
3. Even a minimal income has a liberating effect on the labour marketas it encourages geographical, occupational and educational mobil-ity. It reduces the pressure to find traditional forms of formal full-timeemployment, at a time when the labour market obviously cannotprovide such employment for all who are available for work.
4. BI would reduce the poverty trap and the unemployment trap – thatis, the recipient could afford to take up a low-paid job without losinga full benefit (the loss of benefits can prevent beneficiaries from re-entering the labour market).
5. BI would be a way of rewarding types of socially useful work forwhich the society has not yet found other adequate means ofcompensation.
6. BI is simple and avoids extensive administrative means testing.
Arguments against an unconditional BI:
1. Unconditional income encourages dropping out from the formallabour market or even from the formal economy, either throughsimple long-term idle dependency or the ‘‘topping-up’’ of BI throughinformal sector activities, which
311
Financing techniques

. reduce directly the tax and contribution income of the State,
. decrease ‘‘formal’’ GDP through a reduction in labour utilization.
2. By reducing the pressure on government and society to pursuefull employment policies, BI increases long-term unemploymentparticularly of high-risk groups and can therefore cause social exclu-sion instead of curing it.2
3. BI cannot replace the existing social assistance and universal benefitsystems. Social assistance provides benefits in cash and in kindbased on specific personal needs identification. Such benefits willstill have to be provided to recipients with personal above ‘‘normalbasic needs’’ (the disabled, the single old, orphans, etc.). Hence notonly the institution of social assistance remains necessary but also amajor part of the administrative machinery (i.e. local social welfareoffices).
4. BI cannot replace existing social security and social insuranceschemes without reducing the level of social security of most‘‘classic’’ employees. More resources than can be saved from areduction of the social assistance schemes and family benefitschemes are needed to finance BI. As it is unlikely that the overallresource allocation to the social sector will increase substantially inmost countries in Europe resources will have to be ‘‘freed’’ fromother purposes, most likely social insurance. This can only mean thatreplacement rates of the present pension schemes (or other earnings-related social benefit systems) have to be reduced.
5. BI makes the overall level of social protection in a countrydependent at least in part on government discretion. There ishistorical evidence that tax-financed benefit systems, the financingof which has to be obtained each year in competition for budgetresources, face more difficulties in preserving the real level ofbenefits. There is a risk of BI benefits deteriorating over time and ofsocial security deteriorating owing to the additional burden for BI,thus leaving with adequate benefits only those who during theiractive lives can afford supplementary non-statutory cover. Inaddition, social partners are generally involved in the managementand supervision of social security schemes. It is hard to envisage asimilar ‘‘empowerment’’ of the main stakeholders of social securityunder BI provisions.
Notes
1 Standing (1994).2 Social exclusion is not solely about lack of money – it is also a question of not being able to
contribute to society.
Box 5.15 (cont’d)
312
Financing social protection

Box 5.16 Rough calculations on the financial impact of the
introduction of a basic income in a Central and
Eastern European country
A. Assumptions for a standard Central and Eastern European social
protection system
Structural assumptions
(1) Demographic composition1
population under 20: 29 per cent
population between 20 and 64: 58 per cent
population over 65: 13 per cent
(2) The system dependency rate in the pension system can be kept atthe 50 per cent level (which implies that present actual retirementages must be increased).
(3) Employment rate: 80 per cent of population of working age
(4) Registered unemployment: 15 per cent
(5) Poverty rate2 in total population: 30 per cent individual averagepoverty gap: 30 per cent of the poverty line
(6) Wage share of GDP: 40 per cent3
(7) Employment in health services: 5 per cent of total employment
(8) Staff cost share in health services: 50 per cent4
(9) Sickness and maternity lead to an average absence rate of 7 per cent(6 per cent for sickness and 1 per cent for maternity).
(10) The overall administrative cost of all benefits, including themaintenance of social care institutions accounts, is included inaverage benefit calculations.
Normative assumptions
(11) The beneficiary rate in the unemployment benefit system is 70per cent.
(12) An average benefit replacement rate of 50 per cent of average wage,subject to a minimum equal to a poverty line (45 per cent of 1993average wage)5 for all cash present cash benefits is acceptable to thepopulation.
(13) Limiting family benefits to an average recurrent benefit of one-thirdof the poverty line is acceptable.
313
Financing techniques

B. Assumptions for a BI
(1) BI is paid as a proportion of average wage to all adult citizens and ashalf that amount to all children under age 20.
(2) The overall pension level is kept constant (i.e. the sum of BI plusadditional pension for pensioners is equal to the pension level underthe previous system).
(3) Family benefits are abolished.
(4) All other traditional cash benefits are paid in addition to the BI up tothe poverty line.
Notes
1 Approximate Bulgarian structure for 1991.2 Poverty rates and poverty gaps are ‘‘median’’ assumptions based on UNICEF data; see
UNICEF (1994), p. 2.3 Data on wage shares of GDP are scarce. United Nations data for Hungary in 1991: 58 per cent
and Bulgaria: 43 per cent including the employers’ share of social security contributions. In
Poland the 1991/92 share of wages and other labour costs was 48–50 per cent. Discounting
social security contributions would lead to a gross wage share of between 30 and 40 per cent
GDP. The assumed 40 per cent might thus be already of a normative nature. In comparison,
the respective values for Belgium and Germany in 1992 were 54 per cent and 55 per cent.
Box 5.16 (cont’d)
Box table 5.16.1 Crude model calculation of the cost of basic income benefits in astandard country of Central and Eastern Europe, in % of GDP
Item Base scenario Variant I Variant I Variant I Variant I Variant I
BI equal to0.45 timesaveragewage
BI equal to0.35 timesaveragewage
BI equal to0.3 timesaveragewage
BI equal to0.25 timesaveragewage
BI equal to0.2 timesaveragewage
Pension scheme 10.00 1.00 3.00 4.00 5.00 6.00
Short-termbenefits
1.40 0.00 0.28 0.42 0.56 0.70
Unemploymentbenefits
2.78 0.00 0.56 0.83 1.11 1.39
Family benefits 3.75 0.00 0.00 0.00 0.00 0.00
Health care 4.00 4.00 4.00 4.00 4.00 4.00
Social assistance 3.89 0.40 1.18 1.56 1.95 2.34
Basic income (BI) 0.00 33.17 25.80 22.11 18.43 14.74
Total expenditure 25.82 38.57 34.82 32.92 31.05 29.17
Source: ILO model calculations, 1995.
314
Financing social protection

As we mentioned, our calculations are only preliminary and aggregated andcannot replace a more in-depth analysis. But there is reason to believe that evena BI at a poverty level will leave classic social security recipients with lesstransfer income than traditional social protection systems, the reason being thatsimplicity and non-targeting have opportunity cost in terms of lowerconcentration of payments to ‘‘classic groups’’ of benefit recipients. However,BI will obviously increase income security in the society. Again, this isultimately a matter of national priorities and values.
5.4.3 Other short-term and long-term benefits
This section summarizes some salient aspects of financing systems for theremaining social transfer schemes. The techniques that can be applied to theseschemes are essentially the same as those discussed above in respect of majorschemes.
Short-term cash benefits
As a general rule, short-term cash benefits (these are inter alia sickness,maternity, family benefits, housing, food stamps) are usually financed on aPAYG basis, as they are considered to be short-term commitments on society’spart. Adjustments to benefit levels and the financing mechanism can be made ina relatively short period of time should the schemes face financial difficulties.This means that the financial horizon of a scheme’s financing system is usuallyone year. The actuarial calculation techniques involved are simple and can beeasily derived from the more complex ones described in the preceding sections.Earnings-related benefits (unemployment, sickness and maternity benefits) aregenerally financed through contributions while other universal or needs-basedbenefits are generally financed by taxes.
Unemployment benefits
The micro- and macroeconomic implications of unemployment benefits werediscussed in depth in Chapter 3. These effects are more interesting than the
4 Bulgarian data.5 UNICEF uses 35 per cent of the 1989 real wage as its lowest national poverty line, which
implies that the equivalent line for 1993 is much higher since real wages have deteri-
orated dramatically since 1989 (by 54 per cent in Ukraine, about 40 per cent in Albania
and some 20 per cent in the Czech Republic, for example). For the purposes of updating
the poverty line, the Czech decline of real wages was used here (which is the lowest
in the region). Poverty line and poverty rates used here are therefore extremely
conservative.
315
Financing techniques

financing systems, which are generally straightforward. The overall unemploy-ment benefit financing systems are in some cases hybrid systems consisting of:
– a contribution-financed scheme that covers a certain number of monthsafter the onset of unemployment, and
– a tax-financed means-tested component aimed at preventing povertyduring longer spells of unemployment.
As in the case of pensions and (more recently) health care, there seems to bean emerging debate as to whether part of the financial consequences ofunemployment cannot be individualized by introducing a savings componentinto the financing system. In parallel to the discussed savings for health (seebox 5.8) this would leave essentially younger unemployed and persons withfrequent spells of unemployment at an obvious disadvantage, as substantialperiods of savings would probably be needed to generate enough income duringlonger spells of unemployment.
Employment injury benefits
Benefits paid under employment injury schemes are either short-term (medicalcare or short-term cash benefits) or long-term (e.g. disability pensions). Intheory they can thus be financed like other short- and long-term benefits. This isautomatically the case (as in Cyprus) if there is no separate branch foremployment injury benefits. Where such a branch exists, contributions aregenerally made by employers alone as the financing of employment injurybenefits is in most countries considered an employer liability. Contributionsmay be uniform for a country, region or industry, or experience-rated byenterprise (see Plamondon et al., 2002, Part III).
Long-term care
Long-term care benefits (largely nursing care in institutions or at home) arefinanced in most countries by a mixture of private funds and general revenuesor community or regional taxation. Only in a few countries are they financedunder a new branch of social insurance (Austria, Germany, Luxembourg); inother countries some benefits are financed under other social transfer systemslike the Medicaid scheme in the United States.
Since these are essentially long-term commitments in theory they should befinanced using similar financing systems as for pension schemes. However, asin the case of health care, their long-term cost is much less predictable thanpension expenditure. It is relatively easy to project the demographic number ofpeople at risk of becoming dependent on long-term care as most of these peoplebelong to the age group over 65. However the actual incidence by age and sexwithin that group will vary over time as health status changes and the cost ofcare is equally difficult to predict. This means that explicit benefit systems for
316
Financing social protection

long-term care should probably be financed on a partially funded or PAYGbasis. Incidentally, the redistributive aspects of the introduction of explicitbenefit systems for long-term care deserve special attention. Indirectbeneficiaries may be communities or families who would have to finance apart of the care in the absence of a special long-term care insurance scheme.A long-term care insurance may thus provide income protection for the familiesof the long-term disabled and sick as much as it provides secure care andincome security for the direct beneficiaries.
5.5 INTERNATIONAL INSTRUMENTS
The financing of NSPSs is already connected internationally through globalcapital markets and the interest of global players with respect to tax payments.If that is the case, then it is legitimate to ask whether increasing globalizationmay also constitute the opportunity to construct global financing mechanismsfor at least a minimum of social protection in all countries.
Alleviating poverty is – or should be – the primary objective of all socialprotection financing in many developing countries. However, some of themare simply not able to do this on their own. Countries might well redistributemore than 40 per cent of their GDP through formal or informal transfers (seeChapter 1) without abolishing poverty. Only a few countries are so poor thateven an assumed uniform equal relative redistribution would not lead to aper capita consumption higher than the poverty line. In most other countriespersistent poverty means that the inequality of pre-transfer incomedistribution in combination with the societally adopted transfer mechanismsdoes not permit to redistribute enough income to lift all the people over thepoverty line.
The ILO has estimated how many countries (of the 110 countries with anadequate database) do not have sufficient own means to provide at least aminimum level of material security to their people. Table 5.12 shows how manycountries cannot provide their citizens with a consumption of one, two, three orfour dollars per day and would thus need, at least temporarily, transfers fromthe global community. The estimates are admittedly crude, but the relativelysmall dimension of the necessary transfers makes one wonder whether it isreally politically impossible to eradicate destitution worldwide. There wasnever any doubt that it would be financially possible – if the world communitywere willing to share.
However, what these model calculations also show is that the othercountries should be able to avoid extreme poverty. And reality shows that manyof them choose not to.
The globalization of social protection financing in recent years has gonealmost unnoticed but has already established itself quite firmly. Major second-tier pension schemes are already dominant players on the international financial
317
Financing techniques

markets. As the performance of these markets is interconnected, the reliabilityof social security entitlements of many workers around the world is alreadyhighly interdependent. If one major stock exchange crashes, or if stock marketscollectively make a downward adjustment to stock market prices, as wasobserved in 2001 and 2002, millions of workers around the world aresimultaneously affected. Indeed, already today the savings of workers in theindustrialized world are financing investments and therefore jobs in developingcountries.
International financial institutions are increasingly lending money for theinception or reform of social security systems. International loan and grantmonies go into national and regional social funds. International aid is providingdisaster relief, subsidies to national health systems, and so on. The IMF and theWorld Bank are now tying debt relief to the development of sound nationalanti-poverty policies through the so-called Poverty Reduction Strategy Papers(PRSP) instrument. All these developments and initiatives have thus farproceeded without any coordination. A global social protection financing policyis still not in sight. And yet, just as in national economies, global markets alonewill not create reliable social protection benefits.
It is difficult to imagine that, faced with global markets and taxcompetition, NSPSs will be able to provide inhabitants with reliable levels ofsocial security without some form of global social standard setting andregulations. So far the ILO is the only international body with a mandate toset such standards.
While global adherence to an agreed set of standards might take a fewmore decades to develop, the global war on severe poverty (that the BrettonWoods and United Nations organizations have vowed to wage) could becomea starting point for a global social policy. Just as at the national level societiesare the ultimate underwriters of national social protection schemes or at leastbasic safety nets, in the worldwide context international organizations couldbe the organizers and underwriters of at least a minimum global social floor.According to the ILO estimates mentioned above, it would take only about 2per cent or less of world GDP to lift all people out of most severe povertythat cannot be abolished by national transfers. Organizing or even channelling
Table 5.12 Countries in need of global social transfers
Poverty line in PPPUS$ per day
Number of countries unable to providetransfers to inactive persons of at leastthe poverty line level
Estimated total share (%) of globalGDP of necessary external transfersto close the poverty gap
1 1 0.2
2 16 1.1
3 31 1.3
4 37 4.3
Source: ILO.
318
Financing social protection

transfers of that magnitude is still an enormous challenge for globalgovernance, but it does not seem impossible. With their debt relief campaignthe international financial institutions have made a first decisive step.
Now more imagination is needed. In addition to already existinginternationally financed national social funds, a Global Social Trust whosefeasibility the ILO is presently exploring16 could probably help to avoid socialdisasters in some of these countries. The Tobin tax proposal has often beenquoted as one option to create a globally collected tax that could be used tofinance minimum global social transfers. The history and content of thisproposal are described in box 5.17. The Zedillo report (United Nations, 2001d)has recently introduced into the international debate, as an alternative, thepossibility of an international carbon tax. For the time being, however, it seemsthat mandatory international tax mechanisms to finance global transfers are stillfar off. But that does not mean that innovative voluntary global initiatives couldnot be explored. It does not appear unrealistic that in the near future some sortof global support through voluntary contributions or debt swap agreementsmight become accessible to some national social protection schemes.
Box 5.17 The Tobin tax1
It was in 1972 that James Tobin, longtime Professor of Economics at YaleUniversity and Nobel laureate, first floated the idea of a 0.25-per cent taxon all foreign exchange transactions. The thinking behind his proposalwas inspired directly by Keynes, who had advocated a fee on speculation.
The idea is very simple: a unique flat-rate tax on foreign exchangetransactions. Different rates of taxation have been suggested, from 0.05per cent to 0.5 per cent; the most common is 0.1 per cent. Thus, forinstance, if a 0.1 per cent tax rate is applied, speculative traders would pay2.4 per cent over a year (0.1%*2*12) for an ‘‘in/out’’ transaction once amonth, 10 per cent (0.1%*2*50) for an intervention once a week, and 48per cent (0.1%*2*240) for a once-a-day transaction, assuming that thetransaction amount is constant, and irrespective of the gains. Exemptionscould be granted for small transactions.
It is estimated that 80 per cent of foreign exchange transactions arecleared within a week or less. It is thus anticipated that the Tobin taxwould discourage a significant proportion of short-term speculativecurrency trade without affecting long-term productive investment. Lessspeculation would lead to less volatility in exchange and interest ratesand would subsequently generate greater stability.
As foreign exchange transactions total about US$1,500 billion daily(see box table 5.17.1), income from the tax could be quite substantial. It ishowever difficult to estimate, as the tax would lead to a reduction in thevolume of transactions. Frankel (1996) estimated that in an extremescenario the amount of transactions could drop by as much as 60 per
319
Financing techniques

cent; revenue from the tax would, at a rate of 0.1 per cent, amount toabout US$144 billion a year, or about 0.5 per cent of the world GDP.
James Tobin was well aware of the limitations of the tax: he once saidthat its objective would be to ‘‘throw some sand on the fire ofspeculation’’; he did not see the income from the tax as its only raisond’etre. This might explain why the utilization of such income is not aclearly defined issue. Some argue that it should be managed by anexisting international organization (UNDP or ILO, for example), whileothers advocate the creation of an organization devoted exclusively tothis purpose. Whatever the technicalities, the aim should be to use themoney raised to combat poverty and to finance projects of social interest.
Financial markets experts disagree, however, on the potential realimpact of the Tobin tax. In theory, speculation is often seen as one polaruse of futures markets (the other pole being hedging), both uses togetherstabilizing financial markets. In practice, it is not known which transactionis speculative and which is not. Therefore, it is probably not possible to
Box 5.17 (cont’d)
Box table 5.17.1 Volume of daily foreign exchange transactions(in billion US$)
April 1989 April 1992 April 1995 April 1998
Cash transactions 30 400 520 600
Term transactions 240 420 670 900
Total 590 820 1 190 1 500
Source: Groupe de reflexion d’Attac-Liege (2000).
Box table 5.17.2 Distribution of transactions by currency (%)
April 1992 April 1995 April 1998
US dollar 82 83 87
Deutsche mark 40 37 30
Yen 23 24 21
Pound sterling 14 10 11
Swiss franc 9 7 7
Canadian dollar 3 3 7
ECU and other EMS currencies 16 23 22
Others 13 13 18
Total (*) 200 200 200
(*) Each transaction implies two currencies, which explains why the total is 200.
Source: Groupe de reflexion d’Attac-Liege (2000).
320
Financing social protection

tailor the tax so that it precisely targets (only) those actors that it intendsto reach. Experts also question its effectiveness, warning against aparalysis of the foreign exchange market. Moreover, the Tobin tax wouldnot be substantial enough to prevent major attacks on currencies. One ofthe main arguments raised by its opponents, however, is that itsintroduction would require a consensus within the international com-munity and that this will never be achieved.
Nevertheless, box tables 5.17.2 and 5.17.3 show the high concentra-tion in the foreign transactions market in the 1990s, meaning that theagreement among just a few countries could be quite sufficient to startimplementation of the tax.
Supporters of the Tobin tax have never presented it as a universalpanacea but rather as a first step towards a new international financialpolicy whose overriding aim would be to improve the well-being of thepeople.
The issue is a highly political and controversial one, and no consensusis likely to emerge soon. However, for a few years now, and particularlysince the Asian financial crisis of 1997, proponents of the Tobin tax havetaken many initiatives in favour of its introduction. Its implementation, orstudies relating thereto, have been put to the vote in different institutionssuch as the European Parliament, the French Parliament and others.Despite its rejection, the number of votes in favour of the Tobin tax wassignificant. More than 30 years after it was first proposed and 20 yearsafter its main advocate was awarded the Nobel Prize, the Tobin tax ismore topical than ever.
Note
1 This box was prepared by Florian Leger of ILO FACTS.
Box 5.17 (cont’d)
Box table 5.17.3 Geographical distribution of transactions (%)
April1989
April1992
April1995
April1998
United Kingdom 26 27 30 32
United States 16 16 16 18
Japan 15 11 10 8
Singapore 8 7 7 7
Germany – 5 5 5
Switzerland 8 6 6 4
Hong Kong 7 6 6 4
France – – – 4
Total 79 77 78 81
Source: Groupe de reflexion d’Attac-Liege (2000).
321
Financing techniques

5.6 SUMMARY
This chapter presented the full menu of options open to societies for the purposeof financing their formal social transfer provisions – in other words, the ways ofmaking sure that the money is there when promised benefits need to be paid.Choosing a certain financing system for a specific benefit implies answering thequestions listed at the very beginning of this chapter, namely:
(1) who pays...
(2) from what income...
(3) what amounts of contributions or taxes...
(4) at what point in time...
(5) for whom?
The wide range of different financing instruments used in different countriesfor the same benefits shows plainly that there are no clear-cut, ‘‘one-size-fits-all’’ answers to these questions and hence no optimal financing system for thevarious types of benefits. We have analysed however the underlying principlesand the salient characteristics of the most important forms of financing.
It has also become clear at various junctures that the actual choice offinancing system is a policy choice which rests not only on technicalconsiderations but also on non-financial policy objectives and the need todevelop financing systems that fit into the financial architecture of the socialsector and into the national fiscal system. But even if the choice of a financingsystem turns out to be a political issue, it is still important for financial plannersand managers to understand the full technical consequences of that choice.
Gillion et al. (2000) conclude the chapter on pension financing with anumber of observations which hold true for the financing of other benefitsas well.
When it comes to selecting a financing mechanism for an individualbenefit scheme, the prime concern from a social protection point of view isclearly that of generating sufficient cash flow from the various sources ofincome to cover the costs set by the benefit provisions, administrative costs,the demographic environment and the economic environment. Benefit levelsare decided by social policy on the basis of societal values. However,financing systems are also expressions of policy decisions. The choice of anyfinancing system involves constraints, opportunity costs, short- to long-termpolitical strategies and side effects. Moreover, financing systems have theirown policy effects.
Policy choices that are implicitly and explicitly made when adopting afinancing system concern the following policy areas:
. equity and fairness: the choice of financing system determines whetherthere are any income subsidies involved and whether benefit levelsequitably reflect the contributions or taxes paid;
322
Financing social protection

. benefit levels and eligibility: in many national circumstances it is theamount of resources available for a specific benefit in a complex web ofsocial and fiscal relations that actually determines the level of benefits andthe number of eligible recipients;
. economic utility and effects: the amount of reserves that are accumulatedin a social transfer system makes that system a potentially powerfulinstrument of economic policy. The choice of financing system alsoinfluences labour cost and hence potentially employment, or it may alsoimpact on the microeconomic behaviour of individuals (for example,through ‘‘I want my money back’’-type utilization behaviour incontribution-financed systems);
. intergenerational equity: it is through the level of funding that financinginstruments determine whether generations are contributing to a differentdegree to the financing of social protection;
. efficiency of overall resource allocation in the social sector: the actualchoice of financing system also determines to some extent the amount ofresources channelled into a certain type of benefits (e.g. a contribution-financed health scheme appears to be more successful in allocatingresources to health than a tax-financed system where resources are subjectto stiff budgetary competition); isolating resources for a certain benefit mayprotect them against competition from other social purposes but may notbe efficient from the viewpoint of overall social policy.
. efficiency of overall fiscal resource allocation: as we saw in Chapter 4, thechoice of a financing instrument also indirectly co-determines how muchresources a government is left with for other purposes.
The choice of a financing system also involves long-term strategic socialpolicy decisions. For example, if a developing country introduces a pensionscheme with a relatively low contribution rate, which helps to ‘‘sell thescheme’’ to workers and employers at the beginning, an implicit choice isalready made with regard to long-term allocation of overall social protectionresources. Partially financed schemes will have to raise their contributionrates as they mature if they want to keep their benefit promises. That meansthat the financial room for other benefits in coming decades is alreadylimited once a pension scheme, as cheap as it may seem at the outset, isintroduced.
The above reasoning shows that the theoretical independence of expenditureand hence benefit levels of the financing systems is an elegant theoreticalconcept, but in social policy practice it is a myth. If countries pursue multiplesocial, economic, financial and fiscal objectives with their social protectionschemes then the level of social expenditure and consequently the level ofbenefits become to some extent dependent variables. In economies governed byscarcity of resources it cannot be otherwise.
323
Financing techniques

Further reading
To find out more about:
. the costing and calculation of contribution rates for long-and shortterm benefit schemes, turn to Plamondon et al. (2002).
. the costing and financing of health care schemes, see Cichon et al. (1999).
. the development and nature of social security pensions, turn to Gillionet al. (2000), which contains a complete anthology.
. the financing of community-based schemes, see Dror and Preker(2002), where you will find detailed information on the subject.
. the funding versus PAYG debate in pensions, see Orszag and Stiglitz(1999); Holzmann (1999); Barr (2000); Brown (2002).
A checklist of questions for financial and social policy analysts
If a country’s overall social protection system and its financing systemare being analysed, the financial analyst may keep the followingquestions in mind:
1. Is the financing system chosen for a benefit, respectively for thesector as a whole, generating enough cash flow at each point in timeto cover the expenditure caused by benefit promises?
2. What alternative financing options are there?
3. Why were the present financing systems chosen? Why were othersnot chosen?
4. What are the explicit or implicit policy implications with respect to:
– equity and fairness
– benefit levels and eligibility
– economic utility and effects
– intergenerational equity
– overall efficiency of resource allocation in the social sector
– efficiency of overall fiscal resource allocation?
5. Which long-term social, financial and fiscal strategies were pursuedwhen the financing system was chosen, or should be pursued whena new financing system is designed?
324
Financing social protection

Notes
1 This chapter draws to some extent on Gillion et al. (2000), Chapter 6 (‘‘Financing pensionsystems’’), but has been extended substantially to incorporate later thinking, as well as financing aspectsof benefits other than pensions.
2 See Iyer (1999), Scholz et al. (2000), Plamondon et al. (2002).3 The actuaries among you might realize that this is a simplification, since here it is assumed that all
benefits for the year are paid on 1 January and that all of the wages or incomes subject to contributionsare earned on the same day. We should also use integral signs for the formula, but in real life – where allis finite and discrete – integrals have a tendency to turn into sum signs.
4 In this context, ‘‘fully funded’’ means that at each point t in time the scheme holds an amount ofreserves equivalent to the present value of all future pension payments and all future financial liabilitiesthat would arise from accrued entitlements of the insured population. This would theoretically allowterminating the scheme at point t while the scheme would still be able to honour all its liabilities to theinsured persons.
5 It should be noted that this solidarity rule or principle refers to the financing side of a benefitscheme only; the expenditure side, embodied in a benefit formula, might have more solidarity elements.
6 For an extensive listing of micro-insurance schemes and some first-hand assessment of theirstrengths and weaknesses, see ILO (2000b).
7 This point may be illustrated by the following example. The ISHAKA hospital scheme was forcedto suspend operations in February 2000 because of a deficit of some 10 million Uganda shillingsaccumulated during 1999. Its activities were investigated by a team from the Uganda Community HealthFinance Association (UCHFA). The team’s findings and recommendations showed that the scheme wassuffering from all the administrative, managerial and conceptual problems that could confront aninexperienced health care management team: adverse selection (for example through over-proportionalenrolment of chronically sick members), imperfect registration procedures, deficient contributioncollection, illegitimate use of facilities (exemplified by a utilization rate of 30 contacts per family in onesub-plan), as well as a general underestimation of per capita cost.
8 This is a consequence of the income gap between providers and insured persons. It seems difficultto finance income expectations of formal sector providers through contributions paid by informal sectoremployees (whose per capita income is often a fraction of the income that professional providers wouldaccept).
9 More details can be found in Dror and Preker (2002), Chapter 13.10 See ILO (2002c), Annex 1.11 Generally, employees’ contributions are tax deductible and employers’ contributions are not
considered as taxable income to the employees. Contributions to social security and contributions tooccupational pension schemes should be treated equally. In both cases employer contributions on behalfof employees are not usually treated as taxable income to the employee. Employee contributions tosocial security are generally not a deduction from taxable income, while employee contributions tooccupational pension schemes often are. In those circumstances, employees’ contributions to socialsecurity and occupational pensions are not treated equally for income taxation.
12 The great difficulty of guaranteeing pension indexation with funded schemes illustrates this point.13 The Quebec Pension Plan estimates that in the face of an economic downturn a contingency
reserve of one times the annual expenditure is sufficient. However, in order to provide for supplementaryprotection the pension plan maintains a reserve of two times its annual expenditure.
14 Some of them are organized in the Basic Income European Network (BIEN).15 See Standing (1990).16 See ILO (2002c).
325
Financing techniques

ANNEX 5-A1 TESTING FACTOR SENSITIVITY
IN THE CONTEXT OF A YOUNG
AFRICAN PENSION SCHEME1
For the purpose of this annex a simple pension projection model was designedwhich permits to demonstrate the typical cost development of a pension schemeas well as the simulation of the relative impact of the different influence factors.The case used for the modelling is a typical new pension scheme in Africashowing the characteristic African features of a steadily growing demographicenvironment and a rapidly changing economic environment based on a realisticpopulation prospect. Placing the scheme in the African context has theadvantage of presenting a typical but realistic development of a scheme thatstarts from a zero basis (i.e. with no pensioners).
The typical relative cost development of a hypothetical pension scheme inAfrica has been simulated under the following key assumptions:
Demographic assumptions
The population structure of Zimbabwe is used here as a basis for the modelcase. The determinants of the future demographic development – that is,mortality and fertility, are based on the projections of demographic indicatorsfor Zimbabwe.2
Economic assumptions
It is assumed here that the economy in question has a 3-per cent real growthrate per year. The assumed wage share of GDP is 44 per cent. Labour forceparticipation rates and employment rates again are those of Zimbabwe.3
Governance assumptions
It is assumed here that the scheme has a benchmark replacement rate of 40 percent of career average earnings (here approximated by a ten-year average ofrevalued earnings) subject to a minimum replacement rate of 20 per cent.The 40 per cent corresponds roughly to the requirements of ILO SocialSecurity (Minimum Standards) Convention, 1952 (No. 102). Shorter periods ofemployment lead to a reduction in the pension level of about 1.33 per cent foreach year worked less, down to the 20-per cent replacement threshold. This is afairly conservative pension formula which does not reflect most of the moregenerous formulae in French-speaking Africa. In the Base Case, pensions inpayment are adjusted in line with insurable wages. Invalidity pensions are paidat the benchmark rate and survivors’ pensions are paid at a rate of 60 per cent ofthe entitlement of the deceased.
326

It is assumed that the population registration compliance rate increases froman initial value of 10 per cent to 80 per cent after 35 years and stays constantthereafter. Wage compliance rises from 50 per cent to 80 per cent after 15 yearsand stays constant thereafter.
Typical cost developments
The results show that under rather careful assumptions on the pension formulaeand with the slowly ageing population, the overall cost of the pension schemeremains at fairly low levels for at least the next six and a half decades, providedthe scheme’s management is sound (see table 5-A1.1). But the PAYG costdevelopment also shows the characteristic pattern of increasing expendituretypical of all national pension schemes. Starting from very low levels theoverall PAYG cost will amount to some 13 to 14 per cent in the relativelystationary state. This implies generally that the labour market has to havereached its final stage of formalization. We have avoided speculating here onthe length of that period, but it might easily take several decades.
The bad news in this case is that – on the basis of assumptions which arethought to be realistic – even after six decades only about 17 per cent of thelabour force would be covered and only about 20 per cent of the totalpopulation over the age of 60 would be receiving a pension (if one assumes thatat least two persons over the age of 60 per household benefit from a pension).
If one were to assume that the formalization of the labour market and theeconomy were to occur much faster and reach European levels by the end of theprojection period, then the overall cost of the pension system would probably bein the order of magnitude of 6 to 7 per cent of GDP, which is still considerablylower than in OECD countries, because the country in our example has ayounger population and the scheme is still not fully mature.
Within overall social spending, health and social assistance schemes couldfinally take up another 10 per cent of GDP (OECD average for 1990). Thenational social protection scheme could at the end of the phase of economicdevelopment – lasting about six decades, assuming real average growth ofabout 3 per cent throughout the projection period – cost as much as Greece andPortugal allocated to their social protection schemes in 1994.
However, it is worthwhile discussing briefly in this context whether theabove typical country in Africa could not already afford a much more efficientsocial protection system, for example a universal tax-financed pension schemefor all invalids and persons over 70 years of age. Even a modest benefit of 20per cent of the present average wage in the formal sector would go a long wayin combating poverty. The option is explored in more detail in the recent ILOpublication on pensions (Gillion et al., 2000, Technical Brief 4). The result isthat a modest benefit paid to eligible persons not presently covered by thenational social insurance scheme (in this typical country) would initially cost
327
Financing techniques

about 2 per cent of GDP. This could be collected through a 2.2-per cent increasein income tax or a new consumption tax of 3.6 per cent. These figures appearlow but they would require a substantial political effort at a time when thecountry’s budget is already in deficit. Whether this modest additional socialprotection system is affordable depends on whether the government and thepublic are either willing to set different priorities in their present publicspending or whether they would accept to collect and pay additional taxes.Acceptability might be higher in about 25 years’ time, when the economy andthe tax bases will have grown. Yet again, economic affordability is a matter ofpublic acceptance rather than macroeconomic forces.
Sensitivity testing
The planning and design of any national pension scheme requires anunderstanding of the relativity of projections. In other words, it requires under-standing the relative impact of the determinants (demographic development,
Table 5-A1.1 Base Case and sensitivity test results of the financial develop-ment of a typical African pension scheme, 1992–2057
PAYG rate(% of total insurableearnings)
Generalaveragepremium
National pension cost(as % of GDP)
2010t¼18
2030t¼38
2057t¼ 65
2010t¼18
2030t¼38
2057t¼ 65
Base Case 1.9 5.69 13.17 7.1 0.21 1.09 2.53
Sensitivity tests
Demographic parameters
• increase in life expectancyvariation by 10%
1.91 5.76 13.69 7.26 0.21 1.11 2.63
Economic parameters
• GDP growth by 10%(including interest rate)
1.89 5.61 12.82 6.96 0.21 1.08 2.46
• Productivity growth by 10% 1.91 5.72 13.29 7.15 0.21 1.1 2.55
Governance parameters
• increase of benchmarkreplacement rate by 10%
2.05 6.26 14.49 7.8 0.23 1.2 2.78
• excess adjustment of pensionsby 1% point (which is equal to agradual increase of the replacementrate to about 11% in the final year)
1.95 5.96 14.35 7.56 0.22 1.15 2.76
• increase in complianceregistration by 10%
1.9 5.69 13.17 7.1 0.23 1.2 2.78
• increase in wage complianceby 10%
1.9 5.69 13.17 7.1 0.23 1.2 2.78
Source: ILO calculations.
328
Financing social protection

economic development and governance) on the typical pattern and hence onthe specific national projections. Their potential impact is best proven by asensitivity analysis, which was performed for certain differentials of theproperties of the factors. The results of sensitivity test on some of theseparameters are set out in table 5-A1.1.
The above sensitivity tests clearly show that governance parameters are thedeterminants with the most direct impact on the financial development of thescheme with respect to the Base Case. This theoretical exercise in a developingcountry context thus confirms the statistical observations in OECD countriesas mentioned in Chapter 2.
Amongst governance determinants, the 10-per cent rise in the benchmarkreplacement rate (and implicitly the assumed accrual rate) increases the PAYGcost and the national pension cost and the GAP by 10 per cent after 65 years.The effects of the increase in this benchmark rate take effect immediately,notably with an increase in the PAYG cost of 8.0 per cent after 18 years aspension benefits paid out increase without a growth of insurable wages. Anincrease in the registration compliance as well as in wage compliance has animpact both on the income of the scheme (through higher contribution income)and on its expenditure (through pensions calculated on higher reference wages)– therefore, the PAYG cost as well as the GAP do not change with respect tothe Base Case presuming the increases take effect immediately.4 However, thenational pension cost rises as the overall expenditure volume increases.
The 10 per cent rise in GDP, while the productivity per worker remainsunchanged with respect to the Base Case, generates a higher total employmentlevel which in turn increases the wage base of the scheme. However, in the longrun there is also a rise in the number of beneficiaries. Therefore, after 65 yearsthe GAP decreases by only 2 per cent with respect to the Base Case scenario.However, in the opposite case, where there is a rise in worker productivity,GDP remaining unchanged with respect to the Base Case, there is a decline inemployment. This drop in active contributors generates a decrease in thecontribution income and only after some time lag a fall in the number of futurebeneficiaries.
Greater life expectancy affects the length of time during which benefits arepaid out to the insured and hence the cost of the scheme. In the sensitivity test,life expectancy rose by two years over a 65-year time span and generated aPAYG cost and a National Pension cost increase of 3.9 per cent.
Notes
1 Taken and adapted from Gillion et al. (2000), Technical Brief 4.
2 Indicated in United Nations (1998).
3 ILO: Yearbook of Labour Statistics 1995, 54th issue, Geneva 1995.
4 This is to some extent an over-simplification of the model. In reality the effect on the income sidewould precede the effect on the expenditure side.
329
Financing techniques

6INVESTING SOCIAL PROTECTIONRESERVES
Growing numbers of social protection schemes, notably national pensionschemes, are raising or seeking to raise their levels of reserves either throughmajor reforms introducing an explicitly fully funded (defined-contribution)component into the system (as in Bulgaria, Germany, Latvia, Poland, Sweden,and Latin American reform countries) or by raising the funding level of theexisting defined-benefit system (as in the case of the Canada Pension Plan). Asa result, national social protection systems find themselves having to managepotentially huge amounts of money that is collected today for the purpose offinancing future obligations. Understanding the basic mechanics of capitalmarkets and principles of investing social security reserves is a necessity forfinancial planners and decision-makers in social protection. The purpose of thischapter is precisely to introduce them to that subject matter.
The literature on investment is vast and so is the concept, even whenrestricted to the investment of social security reserves. A comprehensivediscussion of this type of investment would need to encompass macro- as wellas microeconomic issues, different types of capital markets and their operation,institutional arrangements and legal provisions, probability theory, mathemat-ical and statistical tools for the analysis of market performance and thepreparation of investment decisions (risk analysis), and much more besides.Given the constraints set by the purpose and volume of this book, we will focuson some basic considerations that should govern decisions on the investment ofsocial security reserves.
Social security reserves are essentially deferred parts of wages; these are(generally) mandatory savings made for the purpose of meeting future benefitpayments. In defined-contribution (DC) systems, where the deducted share ofincome is fixed, future benefits are calculated on the basis of individualcontributions. Ideally, the contributor receives back what he or she has put in.At each point in time the balance in the individual pension account belongs tothe contributor’s personal wealth even if he or she is not free to use that wealth
330

for purposes other than social security. In fully funded defined-benefit (DB)schemes, which guarantee the beneficiaries a fixed income, benefit wealthcannot be measured simply as an amount of money in an individual account at adefined point in time, but is rather the actuarial present value of the pensionentitlement that an individual has earned up to that point in time. This portion ofthe collective amount of the scheme can be regarded as being owned by theindividual.1
Obviously, the amount the individual is entitled to at each point in time alsodepends on the development of the reserves and the results of investmentdecisions. Moreover, in the case of fully or partially funded schemes, it isevident that those who are accumulating the reserves should exercise strongcontrol over the way in which the monies are invested; after all, it is theirdelayed income that is influenced by investment decisions. Likewise, the State,with its power to introduce forced savings, has a vested interest in supervisinginvestment decisions since it usually acts as de facto reinsurer of all socialprotection schemes. Rightly or wrongly, investment decisions thus influence thefuture budgetary obligations of the government. Employers are interestedparties because a scheme’s investment performance could affect the setting ofcontribution rate levels – even if the incidence of contributions ultimately fallson the worker.
In any case, social security reserves are either directly part of a person’sbenefit wealth or have a direct or indirect influence on his or her income.Investment performance affects the present and future financial obligations ofthe government and indirectly those of the employers in their role as financialguarantors or contributors. It is thus four groups – employees, employers,beneficiaries and the government – that have an interest in safeguarding pensionreserves and optimizing investment performance. This is a clear case for theparticipation of all four groups in the supervision of investment management.Many schemes have special investment boards made up of elected (in the caseof contributors and beneficiaries) and appointed (in the case of employers andthe government) members from all four interested parties.
6.1 FINANCIAL MARKETS: DEFINITION AND
GENERAL CHARACTERISTICS
A financial market is a place where people, institutions or enterprises requiringfinancial resources (‘‘deficit units’’) meet people, institutions or enterprises thatare in a position to provide such resources (‘‘surplus units’’) under certainconditions.2 Assume that person A has a business idea but lacks resources tofinance the necessary investment. Person B has excess resources but has noinvestment opportunities of his own and is willing to lend the money. The twopersons meet and agree that B will transfer money to A for her businesspurposes, while A promises to pay back the amount to B plus some additional
331
Investing social protection reserves

cash payments (‘‘interest’’) in future. A’s promise is normally available in somewritten form: that written promise is called a financial asset. A is the issuer ofthe financial asset, and B (holder of the asset) is the investor. B holds a legalclaim on future payments against A.3
This example shows that financial assets allow for a transfer of resourcesfrom ‘‘savers’’ to ‘‘entrepreneurs’’.4 Furthermore, they allow for a redistributionof the risk of loss of income associated with investments in tangible assetsamong those seeking and those providing liquidity. In order to understand thisfunction, imagine the following situation: a unit is in a surplus position but hasno business skills (lack of interest, knowledge, training, education, etc.). If thatunit were to invest its liquidity surplus in a specific business (in tangible assets)it would run a high risk of failing (say a¼ 0.95). The likelihood of success islow (1�a¼ 0.05).5 Assume the surplus unit has knowledge of a deficit unitwhose capacities (experience, knowledge, training, education, etc.) allow a highprobability of running a business successfully (say, the risk of business failurewould be only b¼ 0.01 and the likelihood of its success 1�b¼ 0.99). This isclearly a case for considering a transfer of the surplus unit’s liquidity to thedeficit unit instead of running the business (investing in tangible assets) oneself.
Assume now a large economy with many deficit and surplus units. Thedeficit units are ready to issue financial assets and the surplus units are ready toinvest in them. However, issuers and investors have a severe informationproblem. How do they match their respective sets of preferences? Where are theprofitable businesses? What is the ‘‘true’’ price for assets? It would obviouslybe of great help if both sides knew where to find their counterparts. Lack ofinformation would very likely lead issuers and investors to make inefficienttransactions at wrong prices, and many transactions would simply not takeplace at all. The opportunity costs of such a situation would be very high for allparticipants. The place where all such information is available and wheretransactions incur minimum costs is the financial market.
Deficit units can expect their financial instruments to meet their intendedpurpose – cashing in money – only if there is sufficient demand. Financialmarkets depend on the sustained readiness of surplus units to buy the financial
Box 6.1 Financial market: A definition
‘‘A financial market is a market where financial assets are exchanged, i.e.traded. It is in this market that the cost of capital is determined. Althoughthe existence of a financial market is not a necessary condition for thecreation and exchange of a financial asset, in most economies financialassets are created and subsequently traded on some type of organizedfinancial market.’’ (Fabozzi and Modigliani, 1992).
332
Financing social protection

assets offered by deficit units. This readiness depends on the justified expec-tation of positive returns associated with these investments. If the expectedreturns on the assets were zero or negative, or if the surplus unit expectedthe investment of the deficit unit to fail, then it would be advantageous forthe surplus unit just to hold cash instead of turning it over to the deficit unit. Thecreation of profitable investment opportunities lies in the hands of active andcapable entrepreneurs whose business ideas are the foundation of successfulfinancial markets.
The notion of ‘‘justified’’ expectations of positive returns is important inthis context, and is synonymous with ‘‘according to the best knowledge’’ ofall participants in the underlying transactions. In other words, surplus unitsinvesting in financial assets must be sure to the highest possible degree that theirmoney will not be lost and that returns on investments will at least not be negative;moreover, in order to attract investment they must out-compete alternativeinvestment projects. It is this fundamental urge for investor protection that hasgiven rise to stock market regulations concerning the admittance of instrumentstraded, the prevention of insider trading, and so on. Such regulations are aimed atpreventing fraud. If financial markets were fraudulent surplus units wouldwithdraw from them sooner rather than later and the markets would dry out. Oneof the distinguishing features of stock markets around the world is the degree towhich such regulations exist and are being enforced (see La Porta et al., 2000).One of the core problems of social security investment decisions is findingmarkets governed by reliable regulations that help to safeguard the value of thesavings of insured persons. The following section describes the maincharacteristics of formal financial markets. An overview of the organization,classification and instruments of financial markets is provided in Issue Brief 4.
6.1.1 Characteristics of formal financial markets
The existence of formal financial markets is not a necessary condition for thecreation and exchange of financial assets. It is obviously possible to have andhold financial assets without institutionalized financial markets. Also, financialmarkets are generally not a prerequisite for starting an investment process inan economy.6 However, where market participants have decided to rely onfinancial assets as one form of investment financing, then formal financialmarkets can be supportive in the design and trade of such instruments.7 In thissense, if they fulfil certain criteria, formal financial markets help to make thelife of market participants easier – certainly easier than it would be in theabsence of any market order.
It is usually taken for granted that financial markets, whether formal orinformal, should function well (i.e. be ‘‘efficient’’); in other words, they areassumed to contribute to the issuers’ and investors’ confidence. Issuers (deficitunits) may be the State or private firms whereas investors (surplus units) are forexample pension funds.
333
Investing social protection reserves

According to Fabozzi and Modigliani (1992, p. 11), financial markets areconsidered efficient only if they perform the following functions:
1. Financial markets discover the prices of financial assets. The financialinducements of deficit units to acquire funds depend on the return requiredby the surplus units. This feature of financial markets signals how thesavings of an economy should be allocated among financial assets.
2. Financial markets provide a mechanism for investors to sell financial assets.In this respect, they offer liquidity. In the absence of liquidity, the assetholder will be forced to hold a debt instrument until it matures and an equityinstrument until the company is liquidated. The degree of liquidity is one ofthe main factors that characterize different financial markets.
3. Financial markets reduce and – under conditions of perfect competition –even minimize the different costs associated with transactions: search,information, contracting, contract enforcement and contract control costs.
Therefore, when people talk offinancial markets they usually mean organizedmarkets. Such markets bring together effectively issuers of and investors infinancial assets and allow them to trade efficiently. Market institutions such asbanks or stock markets serve as intermediaries between the two sides of themarket. In performing their role, financial intermediaries support economicgrowth by matching the preferences of issuers and investors at low cost.
The efficient functioning of financial markets in practice is of greatimportance for the investment of social protection reserves. It is not enough forfinancial managers of social protection systems to trust in the theoreticallypositive attributes of financial markets; they have to monitor the actualfunctioning of financial intermediaries – that is, to check whether realitymatches theory. As an element of this monitoring process, social protectionmanagers are obliged to determine not only in which type of instruments toinvest but also in which specific market or markets. If national legislation limitstheir choice of markets, they have the obligation to find out whether the marketsthat are within their reach perform well – that is, whether they operate at least inaccordance with internationally recognized ‘‘best practice’’. If they come acrossdeficient, malfunctioning or otherwise sub-optimal operation, social protectionmanagers would have to use their institution’s purchasing power to themaximum degree possible to initiate improvements. The requests to improveperformance would have to be raised with the stock exchange or bankmanagement itself as well as with trading partners registered at the exchange.This type of intervention is largely independent of the size of the reserves to beinvested. Even relatively small short-term contingency reserves may be used toexert influence. The purchasing power of high reserves, either existing orexpected to accumulate in fully or partially funded pension schemes, may lendconsiderable weight to the intervention of financial managers of socialprotection systems.
334
Financing social protection

In the case of long-term oriented pension reserves, formal financial marketsshould not only be working efficiently today, but also in future. The same holdstrue with regard to the stability of volumes traded. If, for whatever reason,participants were to withdraw from the market, pension fund managers wouldhave to face an unorganized environment and would thus incur enormoussearch and information costs in trying to invest the institution’s reserves orliquidizing accumulated funds.
The operation of modern financial markets is founded on general societalacceptance and enforcement of property rights through state authorities incountries governed by civil law (or variants thereof) on the European continentand common law (or variants thereof) in the Anglo-Saxon world.8 These legaltraditions stipulate that, in principle, every single item of the stock of fixedassets9 of an economy is owned by someone10 – the owners being the State, anenterprise, or an individual. In other words, each owner holds a certificate(a ‘‘paper’’, which in the case of state ownership can be a law) stipulating thathe or she owns the specified fixed asset. Selling or buying a fixed asset is thenparalleled by exchanging documents stipulating the respective ownership. Inthis sense, every individual contract or certificate determining the ownership ofproperty can be considered a financial asset – but, of course, by far not all ofthese assets (ownership rights) are usually traded on the financial markets.11,12
Under conditions of perfect competition the values of the fixed assets equal thevalues of the documents.13,14 This relation – which in reality holds true only toa certain degree – paves the way for an interpretation of financial assets in amacroeconomic context (see Issue Brief 4).
From the point of view of investment of social protection reserves,especially where partially or fully funded pension schemes are concerned butto some degree also in the case of short-term contingency reserves, the aboveefficiency requirements of financial markets have to be assumed existent over along-term horizon. By virtue of their potentially enormous purchasing power,social protection schemes may themselves contribute to maintaining theseconditions over the long run.
6.1.2 Macroeconomic context and role of
financial markets
This section provides a brief explanation of the role and position of financialmarkets in a macroeconomic flow-of-funds context.15 Linking the supplyside (‘‘savers’’) and the demand side (‘‘entrepreneurs’’) for monies, financialmarkets may assume a significant position in generating economic prosperity.We will begin with a rough standard explanation of the production process,its result and the use made of the latter. Much of the explanation refers tofigure 6.1 which sketches out the basic elements of the production process andits relation to financial markets.
335
Investing social protection reserves

The two standard production factors are employed labour (‘‘labour force’’)and the stock of fixed – tangible and non-tangible – assets16 (‘‘capital stock’’).Management (of firms, institutions, etc.) combines these two factors to get theproduction process going. The result of the overall production within theborders of a given country is its gross domestic product (GDP),17 whichmeasures the income of the production factors and the cost of production. GDPis allocated to the two production factors according to their relative contributionto that result.18 The production factor labour receives its share in theform of labour income, and the production factor capital in the form of capitalincome.
Figure 6.1 Factor markets, GDP, fixed and financial assets
Source: ILO.
336
Financing social protection

Some of the goods and services produced have to be channelled back to thestock of tangibles in order to substitute for the consumption of parts thereofduring the production process (resulting from physical deterioration, normalobsolescence or normal accidental damage). The remainder, usually called‘‘national income’’, is available for allocation to the owners of the twoproduction factors in the form of profits (income of the owners of capital) andwages (income of the employed). Once allocated to capital and labour, nationalincome is available for redistributive activities of the State, based inter alia ontax legislation, state budgets and social protection provisions. The economicposition of all sectors of the economy – enterprises, private households, theState itself – is influenced by such activities: after state intervention, thedisposable income of all sectors is different from what it was before.‘‘Disposable income’’ is the amount of resources available to the respectivesectors for spending on consumption, investments and the derivative of unspentdisposable income savings, which constitutes the influx from the real economyto the financial markets.
‘‘Savings’’ is the amount of income available for use on the financialmarkets.19 In other words, surplus units offer (i.e. supply) unspent income to theunits of the economy that are in deficit and are hence seeking resources. It isthe relation between supply and demand that determines the price of theinstruments traded on the financial market.
If channelled through the financial markets into capital stock investment,savings can contribute to economic growth. It is understood that the growth ofan economy is dependent on a growing stock of fixed assets.20 The capital stockgrows by way of investments in tangibles made by enterprises and the State.These investments can be financed out of the sectors’ own resources and/orthrough the issuance of debt and/or equity instruments via the financial markets.
In this context, it is important to note that during the 1980s in theindustrialized world by far the most resources for investment financing of theprivate sector stemmed from profits retained in the companies (that is, notdistributed to the owners). A comparison between Germany, Japan, the UnitedKingdom and the United States over the period 1980–89 shows that between 71per cent (minimum, Japan from 1985 to 1989) and 100 per cent (maximum,United States from 1985 to 1989) of business investments was financed out ofretained profits. Analysis also shows that over the same period in the UnitedKingdom and the United States even more common stock (in value terms) wasbought back from the markets than was newly issued.21
These findings are supported by recent World Bank-based research22
which shows that equity issuance (initial public offerings, or IPOs) over theperiod 1991–95 levelled at around 1.4 per cent of GDP in the emergingmarkets, 2.8 per cent of GDP in the ‘‘Asian tiger’’ countries, 1.0 per cent inthe G4 and, taken as a total of all three, around 1.5 per cent of GDP. Thesefigures are in sharp contrast to the overall national investment ratios which inthe above regions ranged between 20 and 35 per cent of GDP. They might no
337
Investing social protection reserves

longer reflect exactly the financing structure of the late 1990s when issuanceof equity as a form of fund raising was even more prominent. Yet, exceptpossibly for the so-called ‘‘new market’’, it can well be assumed that retainedprofits still are, and will continue to be, the main financing source of businessinvestment.
Thus, for many cases private business expansion is contingent on theissuance of financial assets only if the investment in tangible assets cannot befinanced out of own resources. The owner of a business has to be in a financialdeficit position before being able to issue a financial claim against his or herfirm (or himself/herself personally) in order to cash in the necessary liquidity.Only those investments that cannot be covered out of own resources haveto rely on the services of financial markets.23 It is mainly in phases oftechnological or other market innovations that deficit units may be in needof support through surplus units.24 In any case, such innovative investmentsmay often be especially risky as it is not always obvious that markets willaccept them.
If the investment financed through the financial markets is successful25 (inthe sense that the product or service can be sold), it adds to the productivecapital stock of the economy. Otherwise it has to be written off and the surplusunit’s financial investment is lost. The perceived chances of success or failureinfluence the price of an asset on the financial market.
Aside from its legislative power to shape market settings, as a sizeabledebtor the State plays a major role in determining the size and evolution offinancial markets. As long as it is in a deficit position, the State cannot butcontinuously offer financial claims (debt instruments) to cash in the missingmonies. As long as these financial claims are used for financing publicinvestments the production base of the economy is being broadened (assumingthat public investments are directly or indirectly productive). As in the case ofprivate business, such investments contribute to economic expansion.26 Sinceeconomic expansion increases tax revenue but may also offer the opportunity tobroaden its tax base, the State can repay its debt or, at least, pay interestregularly.
6.2 NATURE AND INSTITUTIONAL MANAGEMENT OF
SOCIAL SECURITY RESERVES
The type and number of social security funds implemented in differentcountries vary widely. Generally speaking, there is a link between the level ofeconomic development and historical governance traditions (federal versuscentralized governance structures, for example) and the number and structureof social security funds in a country. Highly developed countries often havea multitude of social schemes, while less developed countries frequentlyhave only one or two such schemes. The former centrally planned economies
338
Financing social protection

(known as ‘‘transition economies’’) with their inherited uniform centralizedschemes lie somewhere in between these two extremes.
The problems of (and solutions for) investing social security reserves verymuch depend on the type of social scheme under consideration and the socio-economic environment of their country of residence. Problems differ widelybetween pension funds and unemployment insurances; there are differencesbetween schemes based on individual contributions and those paid out ofgeneral taxation. Similar types of schemes may face different investmentproblems depending on the level of economic development of their hostcountries. Different solutions may be needed in countries experiencinghyperinflation and high unemployment as opposed to those enjoying fullemployment and acceptable rates of inflation.
It would be impossible to cover here the myriad possible combinations. Ourfocus is on the distinction between funds with a long-term investmentorientation and those with a short-term one. Classic funds with a long-terminvestment horizon are fully or partially funded pension funds; short-termorientation is characteristic of pay-as-you-go (PAYG) financed social securityschemes, which most often collect cash reserves only on a contingency(‘‘buffer’’) basis. All considerations are generally based on a low-inflationassumption. In section 6.7, however, special attention is given to social securityschemes’ investment problems in countries with underdeveloped financialmarkets and often more volatile inflation.
6.2.1 Long-term funds versus transitory reserves
Both of these notions – ‘‘long-term funds’’ and ‘‘transitory reserves’’ – areimprecise and to some extent enigmatic. While the former suggests stabilityover a long period of time, the latter reflects expectations of irregularity andfluctuation within short periods. This intuitive understanding of the two terms isjustified in the following sense: there are funds (like pension funds, forinstance) which by their very nature make long-term legal promises to theirindividual members – individuals rely today on the availability of fundresources over a potentially extended period starting at a distant point in thefuture. If social policy is to honour these promises on the basis of accumulatedassets, then the availability of these funds, in absolute terms and by theirstructure, as well as their maximization, must be guaranteed over the long run.This requirement implies a long-term orientation with respect to the manage-ment of such funds – that is, the application of ‘‘correct’’ investment policies. Inthe practical application of such investment policies the total assetsaccumulated in a long-term fund or parts of it may actually be rolled overwithin short periods and, in this sense, be only of a transitory nature.
Other types of funds make only short-term promises to their members in thesense that funds are offered to be available at any time, though for short periods
339
Investing social protection reserves

only. Legally, the benefit guarantees of such funds stretch only over relativelyshort periods ahead – in case of unemployment schemes, for example, up toaround three years (Germany). Such a fund, by construction, needs only relativesmall reserves, if at all,27 and relatively limited sophistication with respect toinvestment strategies. Equally, a PAYG pension scheme may be requiredto accumulate only a minimum small contingency reserve by the beginning ofeach fiscal year; in practice, this may be a simple bank account with littleactivity (thereby displaying elements of long-term stability). Investmentproblems and strategies are thus discussed here under aspects of differentpractice in relation to the legal time dimension of promises.
6.2.1.1 Pension funds
Pension funding strategies usually assume the following stylized funddevelopment: over the active savings period – ideally from an individual’slate teens until around 60 to 65 years of age – the accumulating funds are beinginvested in the financial markets. Investment in equity is often preferredbecause of expected higher rates of return over the long run.28 However, returnsare volatile. Therefore, at a certain time before retirement these investmentsare usually converted into fixed-income securities guaranteeing a constant orindexed (rule-bound) flow of income over the expected retirement life span.This pattern broadly relates to both DB and DC schemes. Therefore, fundedpension systems have to rely on the existence of diversified financial marketsthat offer both equity and fixed-yield securities.
Determining the right moment for shifting assets from equity into bonds is astandard problem of pension fund management. Missing that point in time isalways equivalent to losses for the fund member. The solution to this problemvery much depends on the experience and professionalism of fund management.Its success, however, equally depends on the reliability and continuity ofgrowth-oriented macroeconomic policies (monetary, fiscal, labour marketpolicies, etc.), which are usually out of managers’ reach. Volatility of equitymarkets, especially when it is irregular, reduces the chances of avoiding losses.The widespread problems of maintaining the values of existing pension fundsaround the world since 2001 prove this point. By contrast, volatility on differentmarkets that follows regular patterns may even help to reduce the risk of lossesof fund portfolios if their asset composition is adequate (on this issue, seesection 6.4.3). Another problem is building up a certain portfolio structureaccording to a pre-defined investment strategy (see section 6.6). The investmentchoices to be made in this case can benefit from the analytical tools presented insection 6.5. They help to value assets on the basis of the issuing company’sprospects.
A different aspect of the management of pension fund assets relates to acountry’s prevailing approaches to investment financing strategies of privatefirms or the State. Especially during the build-up phase of fully funded pension
340
Financing social protection

schemes, it is important for formal markets to attract a continuously growingnumber of IPOs of productive and profitable firms. The reason lies in thepotentially enormous size of pension funds in relation to the capitalization asembodied in the financial markets. It can be expected that with a sustainedextended supply of monies through growing pension funds the profitability ofavailable investment projects declines, as the most profitable ones would bechosen first. If an adequate minimum number of IPOs fails to materialize, theincreasing purchasing power of growing pension funds may become excessivein comparison to the volume of new market issuance, thus introducinginflationary tendencies in the pricing mechanisms of financial assets. Theresulting asset price bubbles would typically occur when growing pension fundsmeet a stagnant number and volume of financial instruments issued. In that casethe price increases would not reflect a change in the fundamental value of theunderlying fixed assets29 but would merely be driven by excess demand.30
Figure 6.2 helps to clarify the argument by mapping out the macroeconomicconsiderations of the possible volume of the stock of financial assets in relationto capital stock.
The left box represents fixed capital stock, parts of which have beensuccessfully sold to surplus units in the form of financial assets (dark shading inboth the left and the right box). The value of the ownership rights of these partsof the fixed assets is being ‘‘represented’’ on the financial markets. They aretraded on the secondary market. The prices of the financial assets on thesecondary market are, in principle, determined independently of the initial
Figure 6.2 Fixed assets and financial markets
Source: ILO.
341
Investing social protection reserves

issuance by the economic laws of supply and demand. After purchase, theseassets are being held in the investors’ stocks.31
New and additional financial assets (light shading) are issued on the primarymarket by either (i) existing business entities wishing to go public or to expandby investing in fixed assets, (ii) the State, seeking monies to cover deficits, or(iii) new business entities.
This mirror relation between tangible capital stock and accumulatedfinancial assets is useful for anticipating the economic effects of growingpension funds investing in the financial markets. If the volume of additionalissuances does not match the volume of contributions collected by pensionfunds (represented by the lower right-hand box in figure 6.2), inflationary pricesfor financial assets are to be expected. Overvalued financial assets pose thethreat of future consolidation resulting in a substantial loss of monies invested.Pension funds are legally bound to protect the contributors’ monies from thisthreat; however, a rapid growth of their reserves might itself create pricebubbles that need to be inverted.
These considerations take on a special significance under the 1990s neo-conservative fiscal policy paradigm of aiming for surplus public budgets.Assuming the paradigm materializes in practice, large-scale funding ofpensions would have to cope without one of the main issuers of safe financialinstruments on the primary markets, namely the State, because it wouldgradually drop out.32 The portfolio structure of pension funds would thennecessarily have to change towards possibly riskier private sector investments,both nationally and internationally.
6.2.1.2 Contingency reserves
Contingency reserves cover temporary mismatches of income and expenditureof social security schemes that provide short-term benefits. The level of suchreserves may be legally defined as a certain absolute or relative amount ofcurrent expenditure (measured, for example, by the end or the beginning of afiscal year) or otherwise. For example, legislation may stipulate that the reserveby the end of the year has to match one, three, six or 12 months of actual pastspending or of that expected for the following fiscal year. The appropriate levelof contingency reserves depends on several factors. Most prominent amongthem are the country’s general economic situation (growing versus stagnatingor even declining GDP; price stability versus inflation, and so on) and,especially, the quality of the country’s overall financial system, representedinter alia by the effectiveness and efficiency of its financial intermediaries. As arule of thumb, one can say that the more stable a country’s economic situationand/or the better the functioning of its financial intermediaries, the lower thelevel at which the contingency reserve can be set, and vice versa.33
In any case, investments of contingency reserves require treatment differentfrom funds with a long-term orientation. By their very nature, such reserves
342
Financing social protection

have to be held liquid as they might be needed within short periods. In principlethis does not exclude investment in equity if financial markets are liquid.However, if financial assets of a contingency reserve include speculativeelements, this might result in losses that compromise the risk-insurancecharacter of the reserve.
Therefore, secure short-term investment usually takes advantage of theinstruments provided by the money markets, including depositing cash reservesin usually non-yield accounts at commercial banks; however, the bargainingpower of big funds might even lead to modest interest income on such accounts.Social security reserves may also be deposited in fiduciary accounts of publicbodies or other social security institutions overseeing the deposit as trustees.To safeguard reserves for a specified period of time, individually negotiatedlending to governments outside the public financial market may sometimesprovide another opportunity to place deposits.
6.2.2 Institutional organization of reserve management
Reserves are generally managed in a specific investment department of socialprotection schemes. In the broadest sense, such a department has two functions:maintaining the fund’s investment in line with the chosen investment strategy,and ensuring proper accounting of the fund, its gains and losses.34
Social protection schemes are most often governed by a director or a boardof directors with little or no investment experience. However, investmentpractice has to be embedded into an investment policy and strategy laid down inwriting and constituting the investment department’s framework of action(often called ‘‘Investment policy statement’’). A social security scheme wouldthus normally require an investment advisory body (‘‘Investment Committee’’or ‘‘Advisory Panel’’) to formulate the investment strategy on a recurrent basis.
Figure 6.3 Organization of an investment department
Source: Day and Jamieson (1980), p. 206.
343
Investing social protection reserves

The question of whether a social security fund has an own, integratedinvestment department or whether investment tasks are outsourced to anindependent institution depends on the size of the fund’s reserves and on thefund’s capacity to attract and retain investment professionals. Figure 6.3presents a simple department structure on the assumption of high volumes to beinvested and, hence, a department integrated into the social security institution.
6.3 BASIC INVESTMENT PRINCIPLES
Traditionally the ILO stresses four basic principles that should govern theinvestment of social security funds.35 The first three are the same as thoserelating to other fiduciary institutions: safety, yield (return), and liquidity.However, once these basic conditions have been met, another factor should alsobe considered, reflecting the responsibilities and importance of social protectionschemes in the national economy: social and economic utility.
6.3.1 Safety
Safety is the overriding requirement. A social security institution has beenentrusted with the management of other people’s property. Consequently, verystrict rules have to be observed as regards the safety and control of investments.In the first instance, the social security body should ensure formal safety (thatis, that the nominal value of the invested capital is recovered) and regularpayment of interest. However, formal safety is not sufficient if in the meantimethe value of money depreciates. The body in charge of investment shouldtherefore try to maintain the real value of the invested amounts as well as theirreal yield. Real safety is of particular importance for pension schemes’technical reserves, even if the risk of devaluation is also present for theinvestment of contingency reserves under short-term benefit schemes. Theseconsiderations have led some social security bodies to place the funds ininvestments of variable value – that is, in shares and real estate. Obviously,such investments should be made with great prudence and under strict control;since they are vulnerable to economic variations, only a certain proportion ofthe funds should be allowed for this kind of investment.
Another argument advanced in this connection is that investment in variablevalues requires a comprehensive knowledge of the capital market andmanagement of real estate. This kind of investment often involves a speculativeelement, which should be avoided in a social security body whose primaryfunction is the promotion of social welfare. A further consideration ininvestment decisions is the safety of investments in case of insolvency of non-state enterprises. Generally debt instruments have priority over equityinstruments when it comes to the liquidation of remaining assets in insolvententerprises.
344
Financing social protection

6.3.2 Yield
The yield or return on investment is also essential, even if in the case ofcontingency reserves for short-term benefits it is not of primary importancebecause it is usually small. Yet, the yield offered should govern the choice ofcomparable assets in which to invest social security reserves. Priority beinggiven to a high degree of investment security, the trade-off between risk andreturn suggests that earnings on investment will not be substantial. In any case,the yield cannot have a great influence on the scheme’s financial equilibrium.It is therefore not necessary for the investment of the contingency reserve toseek investments with the highest yield as the principal consideration in theplacement of these funds is liquidity. On the other hand, as far as the technicalreserves of a pension insurance scheme are concerned, yield is of fundamentalimportance. As we have seen, actuarial calculations are based on an assumedlong-term interest rate. It is obvious that the investment of the technical reservemust earn interest at least corresponding to the technical rate of interest asotherwise the scheme will have to face an actuarial deficit that has to be coveredin one way or another.
6.3.3 Liquidity
As we have already seen, the contingency reserves of short-term benefitschemes should be placed in rather liquid investments that are easilyconvertible into cash. On the other hand, the technical reserves of a pensionscheme, primarily intended to earn interest, do not require a high degree ofliquidity. In fact, in most national schemes use of the principal amount is notenvisaged so the question of liquidity does not arise. However, this‘‘dispensation’’ from liquidity requirements is justified only for the case ofstable economic development. If economies start to falter, affecting the stabilityof financial markets and thus the value of instruments held by social funds, thentheir managers might wish – or be obliged by law – to restructure their fundsand move them to safer or more profitable assets, thereby contributing to themomentary destabilization of the market. In this case, social security fundsheavily depend and rely on the liquidity of the assets held. It should be notedthat the liquidity of assets at any point in time is not determined by the holder ofthe assets but is a function of the market for the asset or group of assets underconsideration.
6.3.4 Social and economic utility
If the conditions of safety, yield and liquidity are satisfied, the economic andsocial utility of the investment may be taken into account in the investmentpolicy. It is in the interest of the social protection scheme that the funds beinvested in such a way that they contribute directly or indirectly to improving
345
Investing social protection reserves

the insured persons’ health and education conditions or their standard of living,for example. Also, as successful investments always contribute to the creationof higher or new means of production they may be channelled in such away that they simultaneously create a maximum of new employment, thuscontributing to an employment-based increase in national income and,consequently, to a sustained improvement of the population’s standard ofliving.
Pension funds in particular may contribute to fostering national productionsince, unlike other investors, they have at their disposal not only a big volumebut also a long time horizon for their investment. If these means are strategi-cally employed, they might help to ensure a high-income base of the economy.This is best achieved through a combination of high productivity per capita andhigh employment, which in turn ultimately guarantees the survival of a socialprotection scheme. In an ageing society ceteris paribus, the available workforcediminishes and the GDP created by it would consequently decline, too. Sociallyand economically responsible investments in an ageing society could consist ofdirecting the available financial resources into investments that foster thecreation of workplaces suitable for older workers.
In countries with scarce capital it may be justified to put the funds at thedisposal of the national economy, but due account should be taken of therequirements of safety, yield and liquidity, thus ruling out the use of pensionfunds’ capital for mere development aid purposes. It may be stressed here thatthis supply of resources will contribute to the economic development of acountry only if there is sufficient entrepreneurial demand to absorb the fundsinto productive investment. They should be used as a means of obtaining moneyfor the government only if they are being channelled into infrastructureinvestments. Furthermore, such investments have to meet the condition ofdirectly or indirectly broadening the tax base from which the interest on and theprincipal of the financial instruments issued can be paid.
It is therefore indispensable for financial regulations to contain clearprovisions regarding investments and control thereof. Investments should beeasy to manage and not divert management too much from social security’sprimary responsibility, namely the application of social security legislation,including effective provision of benefits.
6.4 CRITERIA OF ASSET MANAGEMENT IN PRACTICE
The above basic principles have to be turned into practice. Social securitymanagers who are not pursuing the goal of maximizing fund returns arepotentially acting irresponsibly as they do not make optimal use of workers’and employers’ contributions. However, maximizing returns can be associatedwith increasing the risk of losing financial investments. This section will dealwith the methodological and empirical aspects of the quest for the ‘‘right’’
346
Financing social protection

balance between risk and return, and with the issue of optimizing the timehorizon of investments.
It is mentioned here only in passing that the risk associated with financialassets of major issuers (private or public) is often evaluated and published byrating agencies. Their results may be helpful to financial investors, includingsocial security funds, as long as the agencies keep an independent view andrefrain from pursuing their own economic or political goals, which may notalways be the case.
In evaluating public debt, agencies use past servicing and recoveryperformance as well as the governments’ actual payment commitments and, tosome extent, national accounts as valuation proxies. For a risk classification ofcorporate debt the following criteria are often monitored: profitability, coverageand liquidity ratios, the debt to equity ratio and the cash flow to debt ratio.36
Rating agencies’ results may introduce elements of additional security intofund managers’ investment decisions but they do not guarantee safeinvestments for the simple reason that there is no systematic monitoring ofagencies’ performance. How often have they been right or wrong in theirjudgements? The 2002 Enron scandal in the United States is just one exampleof failure on the part of rating agencies.37
6.4.1 Maximizing return
Investors in financial markets, including social security fund management, wouldnaturally want to maximize the return on their investments. However, return oninvestments made can be measured only ex post. This is usually done by anannualized geometric mean, which can be interpreted as the annual compoundinterest earned. Funds sometimes measure their annual returns by an arithmeticmean which – as can be shown mathematically – is at least as high as thegeometric mean. It is therefore important to clarify the method of performancemeasurement before comparing the returns of alternative funds or assets.
While maximizing their funds’ return is one of the primary goals of fundmanagers, it is vital that this be done under conditions that safeguard theinvestment – that is, avoiding income losses or even losses in the fund values.
The occurrence of such losses can never be fully excluded in reality. Bytheir very nature financial market investments may be exposed to low, mediumor high risk. This is why investors have been classified accordingly:conservative investors look for ‘‘safe’’ returns (including safe repayment ofthe initial amount); they are ready to forgo possible higher earnings if these canbe achieved only in return for higher risk. Return-oriented investors also tend tobe risk-averse, although to a lesser degree; they are ready to accept a limitedhigher risk in return for higher earnings as long as the increased risk of lossis acceptable within the context of their overall income and wealth position.Risk-prone investors focus almost solely on maximizing their investment; theyare ready to accept a failure of their investment.
347
Investing social protection reserves

The practice of asset management depends on the level of risk-proneness ofinvestors. This is especially important for social security fund management. Asexplained in section 6.3.1, social security funds are and should be conservativeinvestors, with elements of a return-orientation – but only under strict regulations.
Measurement of expected returns relates to past performance. Expectedreturns are usually trend-extrapolations of this experience, sometimes down-ward-adjusted because of elements of caution that might be required by law orby standards of practice. Formal restrictions with respect to unrealisticallyoptimistic earnings forecasts are an important element of investor protectionon financial markets. They may serve as a substitute for the unsolved problemof forecasting cyclical or non-cyclical turnarounds of general economic andfinancial market activities. Table 6.1 shows to what degree the failure offorecasting non-trend events may affect investor income and wealth. Positivedevelopments can be taken as an indicator only but are no guarantee ofprofessional management, to be expected also in future; equally, negative
Table 6.1 Rate of return of selected investment funds, 1993–981
No. Name Development of return in %
10 funds with highest returns
1. ODIN Finland Stocks Finland þ 326.5
2. Fidelity Nordic Fund Stocks Scandinavia þ 320.1
3. ODIN Norden Stocks Scandinavia þ 302.1
4. Fidelity Iberia Fund Stocks Iberian Pen. þ 283.1
5. UBS EI Netherland Stocks Netherlands þ 281.3
6. CS EF (L) Netherland Stocks Netherlands þ 263.7
7. DWS Iberia-Fonds Stocks Iberian Pen. þ 261.6
8. MST European Opport. Stocks Eur. Small Cap þ 254.9
9. SBC EP – Netherlands Stocks Netherlands þ 250.2
10. Parvest Holland (C) Stocks Netherlands þ 248.7
10 funds with highest losses
1. FFF-Japanese Fund Stocks Japan �46.7
2. Fidelity Malaysia Fd. Stocks Malaysia �48.6
3. St. Street Act. Japan Stocks Japan �49.7
4. UBS EI Gold Stocks Goldmines �50.5
5. Parvest Asian Gr. (C) Stocks FE ex Japan �51.0
6. Fidelity Japan Small Stocks Japan Small �53.2
7. Fidelity Asean Fd. Stocks EM Far East �55.6
8. UBZ Gold Fund Stocks Goldmines �57.0
9. Fidelity Thailand Fd. Stocks Thailand �69.4
10. Citip.-Emerg. Asian M Stocks EM Far East �71.5
1 Selection taken from a total of 1,097 funds, calculations based on fund-specific currencies.
Source: Bopp Fondsfuhrer 1998, quoted in Den Otter (1999), pp. 59 ff.
348
Financing social protection

developments are not necessarily an indicator of unprofessional management,but can be a reflection of unforeseen adverse effects on specific markets. Fundswith a positive past performance can turn negative; conversely, funds that havebeen performing negatively can start achieving positive returns.
6.4.2 Minimizing risk
Risks associated with asset management are manifold. There are economicrisks – that is, the investment allocated to a country, a company or a financialintermediary may fail because of macro- or microeconomic mistakes. Suchfailures may be correlated with or caused by adverse political developments,such as changes in the political or legal context of investments. A few years agoenvironmental risks came on the scene, massively affecting the value of equityissued by global reinsurers, for example. It is obvious that the observation ofemerging risks and adequate reaction to them is one of the major problemsfacing social security investment.
Most of these risks are widespread, at least from a global perspective. Forexample, Stockholm Peace Research Institute reports that the number of localor regional armed conflicts increased dramatically during the second half of thetwentieth century, as did the number of countries suffering serious economicdownturns (most often accompanied by exchange rate shocks, hyperinflationand political instability). World Bank international inflation statistics show thatover the last 40 years at least one country each year was affected byhyperinflation – the numbers peaked at between 20 and 30 during the 1990s.Such developments always imply dramatic losses for the investmentschannelled through these countries’ financial markets (where they exist).
National economic or political risks should influence the decision regardingthe extent to which social protection schemes should be funded in the firstplace. If there is a high risk of hyperinflation due to deficient or unreliablemacroeconomic policies and reserves cannot be invested abroad, or if reservescannot be protected from ‘‘improper borrowing’’ (see also Chapter 4, section4.2.1) by the national government, then the decision to pursue a high level offunding is highly questionable. Introducing a DC scheme or aiming for a highlevel of funding through the rate-setting process as described in Chapter 5 maysimply be wrong policies in an unstable political or economic environment.The key determinant for the funding decision is – once again – goodgovernance. But even in relatively stable political and economic environmentsdecisions on the extent of funding (notably in respect of the pension system) canbe made subject to a macro-portfolio risk analysis. The analysis should attemptto assess the relative risks affecting the development of employment and thewage share of GDP, on the one hand, and financial market risks, on the other.If financial market risks are high and expected returns on investments arerelatively low and subject to high volatility while employment seems toexperience a stable upward trend; then that would call for a greater reliance on
349
Investing social protection reserves

PAYG financing, and vice versa. Analytical research on this issue is still in itsearly stages.
If the planning staff in charge of managing social security financing fail torespond to such risks adequately, then the risk of investment losses increases.Professional failure is thus another essential risk that needs to be minimized.
Unlike financial planners, social security managers have little possibility ofminimizing the risks associated with fund income developments such as thosementioned above. We will therefore focus on standard problems and solutionsof risk management, assuming only standard volatility of financial markets.That volatility can be described by two sets of risks affecting respectively thevalue of the assets and the value of the cash flow generated by these assets.These include:
– market risks, due to changes in portfolio values resulting from marketmovements;
– credit risks, due to debtors’ inability to fulfil their obligations;
– operational risks, due to the mismanagement or fraud in the management ofinvestments;
– interest rate risks, due to losses arising from the disinvestment orreinvestment of cash flows in different interest rate environments;
– liquidity risks, i.e. the risk of unexpected amounts of cash being demandedat unexpected times, requiring forced sales of assets; and
– foreign investment risks, due to currency, regulatory, legal or other risksassociated with this type of investment.
By their very nature, the certificates offered at financial markets are soldwith two basic types of promises. Fixed-income securities promise a fixedperiodical yield plus the repayment of the principal, whereas equity promisesdividends on a residual basis. Intuitively, the promise of fixed-income securitiesseems more trustworthy than that of equity. Therefore, estimation of the(present) values and the associated risk of loss of the two types of certificates ona given market should be straightforward for securities and more complicatedand indirect for equity. Since profits are volatile, the payment of dividends onequity may definitively or temporarily fail. However, in practice corporateand even sovereign issuers of income securities sometimes fail to deliver duepayments, or meet their obligations only partially.
The best method of avoiding the risk of loss of income is to stay clear ofinvestments in risky assets or, alternatively, to invest only in risk-free assets.The ‘‘risk-free’’ asset is not to be understood literally, but in relative terms asthe least risky certificate available at the market, usually United States Treasurybonds or money market certificates. The main problem associated with thismethod is that the rate of return of such assets is normally lower than that ofriskier assets. Fund managers executing a conservative, risk-free policy
350
Financing social protection

will most often be exposed to pressure of their clients (which in case of a socialsecurity fund can be the general public, the contributors and beneficiaries, butalso financial markets lobbyists), especially when other fund managers whoaccept riskier assets in their portfolios are able to show, ex post, higher returns.
There are methods of mixing risk-free (or, rather, low-risk) and risky assetsso that, under certain stability conditions, a higher return at unchanged risk canbe achieved. In order to understand better how this asset-mix method works, theconcept of portfolio efficiency has to be introduced: a portfolio is called efficientif there is no other portfolio that, at equal risk, offers a higher return or,alternatively, if there is no portfolio offering the same return at lower risk.
Let us assume that only two real-world portfolio alternatives exist: one islow-risk, the other high-risk. Both are obviously efficient, the low-riskalternative will be chosen by a conservative investor, the other one by amore risk-prone investor. What happens if both alternatives are being mixed –that is, if different portfolios are constructed using a combination of a certainshare y of risk-free and a share 1�y of risky assets?
In order to answer this question without bringing in cumbersomemathematics, a simple example is presented in table 6.2 and figure 6.4. Itdisplays 21 different portfolio combinations (I to XXI), each consisting of onerisky and one risk-free asset. The empirical basis for the risk-free asset in thisexample is the German REX Index (representing a basket of securities), the basisfor the risky asset is the German DAX30 Index (representing a basket of equity) –each measured over the period June 1987 to June 1997.38 For example,combination I consists of 100 per cent equity, combination XI is divided equallybetween equity and securities, and combination XXI consists of 100 per centsecurities. Portfolio I – the ‘‘maximum risk’’ portfolio – is exposed to a risk ofincome loss of 19.3 per cent.39 The other extreme, portfolio XXI, is exposed to arisk of only 3.6 per cent. At the same time, the rate of return of the full-riskportfolio is 10.6 per cent whereas that of the risk-free portfolio is only 7.3 per cent.
Now let us assume that an investor is ‘‘moving’’ his/her portfoliocomposition from XXI to XX. The rate of return increases by 0.16 percentagepoint whereas the risk increases only by 0.1. In other words, by adding riskyassets to the risk-free portfolio the investor is able to increase the rate of returnover-proportionally. In this example, going from XXI to XX is the only‘‘movement’’ with that very result; in all other cases the risk increases fasterthan the return. Still, all portfolios are obviously efficient in the above sense.The actual combination of expected return and risk chosen within the portfoliodepends ultimately on the individual investor’s risk aversion. Varying degreesof risk aversion are imaginable, requiring different risk coefficients. Moreover,different shapes of utility functions are possible, originating from differentcertainty equivalents. Determining the optimal risk-return allocation requiressolving a maximization problem, but that is not the province of this book.If portfolios I to XXI were the only ones offered to a social security fund, itsmanagers would be advised to invest in portfolio XX.
351
Investing social protection reserves

The above example is interesting in that it seems to indicate that one canincrease the return of a given portfolio by adding risky assets without increasingthe risk of income loss (or, at least, by increasing that risk only sub-proportionally). How is this possible? The explanation lies in the statisticalrelation between the two assets as observed over the period June 1987 toJune 1997, which – in this case – is statistically not independent but correlated.The intensity and functional type of that correlation is, again in this case, suchthat it produces the above result.40 The correlation is usually measured by‘‘co-variance’’, a coefficient that can take values between ‘‘1’’, implyingperfectly parallel development of the two assets, and ‘‘�1’’, implying perfectlyadverse development. In taking advantage of the patterns of the assets’behaviour relative to each other, it is possible to compose portfolios withconsiderably lower overall volatility, and in case of the coefficient taking thevalue �1, even to eliminate return risk of the portfolio completely. Correlation
Table 6.2 Risk-return development of alternative portfolio compositions
Equity-securitycombination
Portfolio Risk Return
Equity Securities Standard deviation in per cent Per cent of portfolio
Per cent share
I 100 0 19.33 10.60
II 95 5 18.39 10.44
III 90 10 17.46 10.27
IV 85 15 16.52 10.11
V 80 20 15.59 9.94
VI 75 25 14.67 9.78
VII 70 30 13.74 9.62
VIII 65 35 12.82 9.45
IX 60 40 11.91 9.29
X 55 45 11.01 9.12
XI 50 50 10.11 8.96
XII 45 55 9.22 8.80
XIII 40 60 8.35 8.63
XIV 35 65 7.50 8.47
XV 30 70 6.68 8.30
XVI 25 75 5.90 8.14
XVII 20 80 5.18 7.98
XVIII 15 85 4.54 7.81
XIX 10 90 4.03 7.65
XX 5 95 3.71 7.48
XXI 0 100 3.61 7.32
Source: Hehn (ed.) (1998), p. 294.
352
Financing social protection

coefficients, which have to be significantly different (in terms of the probabilitytheory) from zero41 in order to be meaningful, are retrieved by regressing thehistorical performances of the two respective assets.
The observation of positive or negative co-variances between the indicesof multiples of different assets (or indices of baskets of assets) has led to amultitude of financial market models attempting to optimize the composition ofportfolios so as to maximize their return at unchanged risk. Likewise, thedevelopment of such models has triggered the ‘‘invention’’ of new types ofassets (such as derivatives) designed to exploit as much as possible the risk-reducing implications of co-variances between assets.
Have such models helped to increase returns of investors over and abovewhat they could have expected without them? Probably yes, at least for thosewho were in a position to take advantage of sophisticated model builders andas long as markets followed a stable trend. Have they helped to avoid incomelosses on financial markets? Obviously not, as can be seen from the worldwidedevelopments on financial markets and their negative implications for manyfunded pension schemes and the balance sheets of many (formerly) AAA-ratedcompanies. Like any other economic projection models, either macro- or micro-econometric, these models too usually fail to forecast the turnaround points intime of business cycles or of upward- or downward-directed structural breaksof the economy or market under consideration. The reason for this failure offinancial market models in particular is obvious. They rely on the dynamicstability of the co-variances between assets or asset groups – in other words,
Figure 6.4 Risk-return development of alternative portfolio compositions
Source: Table 6.2.
353
Investing social protection reserves

they assume that correlations observed in the past between sub-marketsor groups or types of financial papers will continue to operate equally in thefuture, which, of course, nobody can guarantee. The future is never certain,however sophisticated formal mathematical models may be. Box 6.2 translatesthe theoretical aspects of risk into the concrete pension context.
The selection of single assets to constitute a portfolio involving returnand risk calculations is known as active portfolio management strategy.Alternatively, fund managers may follow passive strategies-that is, constructportfolios that mimic the asset composition of preferably large indices, such asthe S&P 500 (see section 6.5.1). Passive strategies offer the advantage of savingon information and analysts’ costs. Moreover, the management may behave as afree rider and benefit from the information incorporated in the financial markets(see Bodie et al., 1996, p. 185).
Box 6.2 How financial market investment affects pension payments
(Excerpt from Burtless (2000))
‘‘A popular proposal for reforming Social Security is to supplementor replace traditional publicly financed benefits with a new system ofmandatory, defined-contribution private pensions. Proponents claim thatprivate plans offer better returns than traditional Social Security. Toachieve higher returns, however, contributors are exposed to extra risksassociated with financial market fluctuations. This issue in brief offersevidence on the extent of these risks by considering the hypotheticalpensions US workers would have obtained during the past century if theyhad accumulated retirement savings in individual accounts. The hypothet-ical workers are assumed to have identical careers and to contribute afixed percentage of their wages to private investment accounts. Whencontributors reach retirement age (assumed to be 62), they convert theiraccount balances into level annuities, which provide a fixed stream ofannual income for life.
Contributors differ only with respect to the stock market returns, bondinterest rates, and price inflation they face over their careers. Thesedifferences occur because of the differing start and end dates of workers’careers. The analysis demonstrates that pensions under private planswould usually have been adequate, but that financial market risks areempirically quite large. For example, for workers investing all of theircontributions in stocks, the average pension obtained was about 53 percent of peak pre-retirement earnings but potential outcomes ranged fromabout 20 to 110 per cent of earnings. This striking difference is due solelyto differences in stock market returns and in the interest rate used indetermining annuity charges. Stock market and interest rate volatilitymean that workers who follow an identical investment strategy but whoretire a few years apart can receive pensions that are startlingly unequal.For example, workers retiring in 1969 would have received a pension
354
Financing social protection

6.4.3 Optimizing the time horizon
The above portfolio risk analysis is based on the assumption that equity is exposedto higher volatility of returns than bonds. However, many argue that equityvolatility decreases with an extension of the observation period. Indeed, manyempirical analyses show that the long-term trend of market indices of equity (orgroups of equity) follows an upward trend. Research for Germany, covering theperiod from 1991 to 1996, was undertaken as follows: different portfolios wereconstructed, consisting of real-world bonds and real-world non-domestic equity,the share of equity in the portfolio increasing by 10 per cent steps from zero to100 per cent, the bond share decreasing accordingly. Then, these portfolios weremoved over time in monthly steps. In one version the time horizon was one year,i.e. the rate of return of the portfolios was calculated on the assumption that theportfolio was sold after one year. In a second version the same method was
equal to nearly 100 per cent of their pre-retirement earnings, whileworkers retiring just six years later in 1975 would have received only42 per cent.
Workers could reduce their risk by following a more conservativeinvestment strategy of investing half of their contributions in stocksand the other half in bonds. However, while this approach succeeds insignificantly reducing the variation in potential outcomes, the size ofannual pensions would typically be about one-third lower than forworkers investing solely in equities.
Finally, after workers retire, they face another risk: price inflation.While Social Security protects against this risk by indexing benefits toinflation, workers who purchase private annuities are rarely protectedagainst inflation. All workers retiring after the mid-1930s sufferedsignificant losses in purchasing power during retirement. For example,the real value of a pension for a worker retiring in 1966 dropped by overtwo-thirds between ages 62 and 80. To protect themselves against priceinflation, retired workers could continue to rely on the stock market: eitherdirectly by investing some of their retirement nest egg in stocks or bypurchasing a variable annuity that is linked to a portfolio that includesstocks. However, this decision would substantially increase the invest-ment risk to which the retired worker is exposed, making the amount ofpension income uncertain from year to year. Some of the financial risksdescribed above would also be present in Social Security if reserves of thesystem were invested in private securities, but a public system has oneimportant advantage over private pensions. Because Social Security isbacked by the taxing and borrowing authority of the government, it canspread risks over a much broader population of potential contributors andbeneficiaries, including workers in several generations, reducing thefinancial risks faced by covered workers.’’
Box 6.2 (cont’d)
355
Investing social protection reserves

applied, allowing however for a five-year investment horizon. Both versions werecontrolled for the share of equity in the portfolio; the annualized minimum rateof return was then calculated for both versions depending on this share.
The results show that the number of negative minimum rates of returnincreased drastically with the share of equity under the one-year investmenthorizon but was limited to only a few in the case of the five-year horizon, i.e.with the share of equity rising to over 70 per cent of the portfolio (see figure 6.5).Taking the time horizon into account is important; however, time horizonoptimizing strategies are only possible if past time patterns continue to prevailin the future. Fund management is therefore obliged to monitor closely andcontinuously the time structure of financial investments made.
The above findings have been used for instance to bolster argumentsin favour of implementing funded private pillars of large-scale pension systemsin order to overcome the so-called ageing crisis (World Bank, 1994). Itcan however be assumed that the costs of insuring stock holdingsagainst returns smaller than the risk-free rate will actually rise with time.This holds true if stock prices follow a ‘‘random walk’’ or a ‘‘mean-reverting’’development (see Bodie et al., 1996, pp. 886–887). In any case, whateverthe portfolio composition or model used, there is no guarantee for thefuture stability of patterns observed in the past. Major volatility will alwayscome as a surprise. Implications for social security fund management can bedrawn from box 6.2. The advice to optimize the time horizon of investments issound, although its practical application presents as many problems as all othermeans invented to overcome the tricks and traps of financial marketdevelopments.
Figure 6.5 Impact of the time horizon on the rate of return of different portfolios
Source: Underlying data quoted in Hehn (ed.) (1998), p. 397.
356
Financing social protection

6.4.4 Benchmarking
Benchmarking is a method aimed at improving the performance of an assetmanager or asset management company by way of systematic comparison withthe performance of a pre-defined competitor. It tries to reveal performanceweaknesses and their underlying reasons in order to allow for measures toimprove one’s own (or the company’s) competitive stance. Benchmarking thusneeds. . . benchmarks.
In this context, a benchmark is usually defined as a reference portfolio thatreflects the investment goals, expected investment returns, and the risk-proneness of a given investor. If the investor is a social security fund, thebenchmark would have to be defined by the fund management. If it is to permit ameaningful comparison, a benchmark obviously has to be defined so as to reflectthe characteristics of the fund’s investment strategy. Box 6.3 provides anexample of the benchmarking process that is often used in actuarial valuations ofnational social security schemes.
Efforts to optimize performance can be qualitative, quantitative, or both.Questions of quality broadly relate to organizational (administrative) issues,including competitors’ methods and processes of collecting and using infor-mation, and so on. Quantitative performance comparisons are based onquantitative indicators. Own performance is in this case compared to therisk-return results of the benchmark. Improvements in quantitative perfor-mance may well be expected only once quality improvements have beenmade.
Benchmarks can serve as a basis for the structuring of the assets of aninvestor (a social security fund). Given the broad variety of available financialinstruments and other assets, a benchmark can help to define the strategicallocation of the investor’s assets and monitor their development over time.A benchmark helps to formulate a long-term risk-return profile.
Furthermore, a benchmark serves as a guideline for the asset manager. Whileaiming to increase the volume of assets, the manager has to turn the investor-defined benchmark into a concrete investment strategy. It is worth mentioninghere that the more detailed the investor-defined benchmark the lower the extent towhich the asset manager takes decisions based on own responsibility.
For both the investor and the asset manager, the benchmark serves as abasis for measuring the performance of the investment (its rate of return inrelation to the benchmark). Performance is here understood as the difference,in a given period, between the investment return and the return on thebenchmark portfolio. If, at identical risk, this difference is positive then theinvestment portfolio has outperformed the benchmark; if the difference isnegative, it has underperformed. Taking into account possible differencesin the portfolio’s risk (which, ex post, may turn out to be higher or lowerthan that of the benchmark) adds an extra dimension to the measurement ofsuccess.
357
Investing social protection reserves

Box 6.3 Basic actuarial rate-of-return benchmarks
Social security actuaries who analyse the financial situation of a socialsecurity scheme traditionally also establish the overall rate of return of theinvestment of the scheme. They normally limit their analysis to one ortwo crude performance indicators of the investment performance of thescheme. If these indicators signal any problems, a more detailed invest-ment performance analysis by financial market specialists is usuallyrequested. The basic formula for the gross nominal rate of return ofreserves is:
RoRt ¼ 2It=(Rtþ1 þ Rt � It ) (6:3:1)
where:
RoR ¼ internal rate of returnI ¼ investment incomeR ¼ amount of reserves at the beginning or the end of year t
The difference between the amount of reserves R at the beginning ofthe year and the end of the year is the annual increase or reduction of thereserve originating from the scheme’s cash surplus (contribution incomeplus other income plus investment income minus expenditure) plus thechange of the value of the investment portfolio. I consists of regular cashincome generated by reserves (such as interest payments or for examplerents paid for a real estate investment) in addition to the appreciation ordepreciation of the value of investment assets.
The above nominal rate of return may not be very informative withoutany benchmark. To arrive at a real first-hand assessment of the investmentperformance one should deduct the cost of investment management fromI and divide the RoR by the inflation rate (generally the CPI rate of change)to arrive at a net real rate of return. Comparing this indicator to the zerobenchmark shows whether the scheme earned real additional incomefrom investing the reserves. Normally this operation would have to berepeated for a number of years and a compound and average rate of returnshould be calculated over a number of years (see also Chapter 7).
The comparison with the zero benchmark can generally be regardedas minimum benchmarking. Comparisons with a time- and volume-weighted average government bond rate are more meaningful. This ratecan be composed by assuming that all new reserves – at the time whenthey were generated, respectively when they had to be reinvested – weredirectly invested in long-term government bonds. In most nationalcircumstances and under normal economic and governance conditionsthis would be an extremely risk-averse strategy which would alsominimize administrative cost.
The bigger the scheme and the bigger the reserves, the more shouldthe longer-term average real net rate of return be approaching theaverage real rate of return on the national capital stock in the economy(see also Issue Brief 2).
358
Financing social protection

Performance measurement in relation to a benchmark has the obviousdisadvantage that – as long as the loss of the benchmark portfolio is higher –it attests to outperformance even in the event of investment losses. Moregenerally, the definition of a benchmark does not necessarily provide a uni-vocal interpretation of investment performance. An attempt to standardize per-formance interpretation has been made by the international Association forInvestment Management and Research (AIMR) through performance presenta-tion standards and global investment performance standards,42 broadly reflectingother professional associations’ efforts (actuarial associations, among others)to introduce certain minimum standards of practice.
Benchmarks may serve as an incentive for portfolio managers to outperformthe benchmark if their remuneration is linked in part to the difference betweenportfolio and benchmark returns. In other words, the higher the (positive)difference between portfolio and benchmark, the higher the additionalremuneration to be paid by the investor. While this is clearly an option forprivate contracts between investor and portfolio manager there are strongdoubts as to whether such an arrangement would comply with the basicinvestment principles of social security funds. The reason is twofold:first, only after a sufficient period of time is it possible for the investor, forexample the social security fund, to assess a fund manager’s professionalqualities. Insiders’ estimates put the minimum period at 25 years (!). There isalso the view that ‘‘most of the apparent differences in performance stem fromgood luck or bad luck’’ (Hehn (ed.), 1998, p. 123). Second, there is a typicalprincipal-agent asymmetry in the distribution of relevant market informationamong the social security administration (‘‘principal’’) and the asset manager(‘‘agent’’). This asymmetry usually continues to exist in either case – that is,regardless of whether the asset management is outsourced or maintained as aseparate department within the overall social security administration(see section 6.2.2).
6.5 ANALYTICAL TOOLS
This section examines a few core analytical tools that should be understood bythe top management of any social security scheme in a position to investreserves at the financial markets. It is not intended to replace an in-depth studyof financial analysis since it only scratches the surface of a highly complexsubject.
6.5.1 Equity performance indicators
Practically all stock exchanges have developed indices targeted at measuringthe performance of the stocks traded. These indices are usually calculated on
359
Investing social protection reserves

a daily basis.43 Internationally, the best-known index by far is probably theDow Jones Industrial Average, measured at the New York Stock Exchange.It has been calculated since 1896, and since 1 October 1928 it has contained30 large ‘‘blue-chip’’ corporations.44 The Dow Jones is a price-weightedaverage as it measures the return of a portfolio that holds one share ofeach stock. Its composition has been changed often over the years as itcontains only a small number of firms. For instance, of the 30 companiesthat were included in the index on 1 October 1928, only seven remained byearly May 1991.45
By contrast, Standard & Poor’s calculates and publishes a number ofdifferent, usually much broader-based indices. The best known of these isStandard & Poor’s Composite 500 (S&P 500). It is a market-value-weightedindex. The S&P 500 calculates the total market value of 500 firms on day t andcompares it to the total market value of these firms on day t�1. The change ofthe two values represents the change in the index from one day to the other.Many existing funds mirror the composition of, for example, the S&P 500. Indoing so, they provide a low-cost passive investment strategy for equityinvestors who will be on the safe side as long as the underlying base indexmaintains quality of composition and performance.
Other indices have been constructed and are in permanent use byprofessional analysts and investment firms, including a number of indices forspecific regions or markets. Some focus on the respective market leaders orcomprise a large number of listed companies. The calculation of the indicesmight differ with respect to the deployment of arithmetic averages orgeometric means, which provide a downward-biased measure of a rate ofreturn.46
There are a number of other well-known indices of major stockexchanges outside the United States – among them the Nikkei (Tokyo), theFTSE (London) and the DAX (Frankfurt). These, as most other ‘‘modern’’indices, are value weighted and calculated as arithmetic means (seefigure 6.6).
Performance indicators do not serve only as measures of the overallmarket; there are specific indices for particular market segments, industriesand aggregates of high- or low-performing stocks. Indicators generallyprovide a benchmark instrument to compare the performance of a specificshare or portfolio to the development of other market participants. To obtaininformation on a share’s performance, it can be helpful not only to confrontthe share price development with the observed total market trend but alsowith a cross-industry aggregate. The indicators are therefore a means ofcomparing a company’s share or investment strategy to its competitorsrepresented in the exchange indices, on which a decision to buy or sell sharesmay be based. If the comparator index accounts for selected quality stocks,the comparison would be especially sensible to less favourable performancerecords.
360
Financing social protection

6.5.2 Equity valuation47
A multitude of approaches have been developed and are currently used byprofessional financial analysts seeking to find out whether a stock held ina portfolio is valued at the ‘‘right’’ price. The concern is that a portfoliostock might be overvalued – in which case the fund manager would sell thestock or parts of it, or else undervalued – in which case the manager wouldadd additional stock to his or her portfolio as price increases are to beexpected.
6.5.2.1 Balance sheet concepts
Classical methods refer to the balance sheet of a company. The simplest way ofchecking the value of stock is to refer to the book value of a company, which isbeing presented in its balance sheet. Let us assume that table 6.3 presents acompany’s end-of-year balance sheet.
According to the books of XYZ, on 31 December 2000 the share value wase50.00 (e 12 500 000 000/250 000 000 shares). Roughly at the same time, theshare of the same company was traded at, say, Frankfurt Stock Exchange at a
Figure 6.6 FTSE, DAX, Nikkei historical data
Source: FTSE, DAX, Nikkei.
361
Investing social protection reserves

market price of e70.00. So, did the market overvalue the firm? Not necessarily,as accounting rules may for example have some bias towards undervaluing it.At the same time, the market is looking at the company as a going concern.Present estimation of its future value might actually be higher or lower than inpast accounts. In addition, if the share’s market value is about to fall, the bookvalue of a company cannot serve as a floor for the stock price, below which themarket price would never fall. History has proven this in all those drastic caseswhere corporations went bankrupt.
A guesstimate of a floor for the stock price is the liquidation value of acompany – that is, the value that could be realized per share if the firm were sold(as a whole or in pieces). If the stock price falls below this value, it would berational for the owners (the stockholders) to break up the company because thiswould bring in more than selling the stock. Of course, it is difficult to estimatethe liquidation value of a firm as long as the sale does not take place in reality.
An interesting balance sheet concept is valuating the firm by thereplacement costs of its net assets (per share). It is argued that the marketvalue has to correspond to the replacement cost of the firm because, if not,competitors would set up the same business and start competing in the samemarket. Then competition would drive down the market value of all these firms.Anticipation of this process lets the market value remain close to itsreplacement cost value. Proponents of this concept argue that the ratio betweenreplacement cost and market value will converge to 1 over the long run.48
6.5.2.2 Concepts based on future cash flows
Looking at balance sheets may give valuable insights into the actual economiccondition of a company. However, shareholders are mainly interested in thefuture profitability and future value of a firm. Therefore, analysts have to thinkabout techniques to value future dividends and earnings that the firm isexpected to produce.
The first concept to be addressed here is the intrinsic value concept, whichmay provide a useful reference for the stock’s actual market price. This conceptis based on the observation that an investor in stock expects a return consistingof dividends (cash) and capital gains (in cash or on paper). The intrinsic value,denoted V0, of a share of stock is defined as the present value of all cash
Table 6.3 Balance sheet of company XYZ, 31 December 2000(in e million)
Assets Liabilities and owners’ equity
e 50 000 Liabilities e 37 500
Common equity e 12 500
Shares outstanding 250 000 000
362
Financing social protection

payments to the investor, including dividends as well as the proceeds from theultimate sale of the stock, discounted at an appropriate (risk-adjusted)49 interestrate, k. Whenever V0 exceeds the actual market price, the stock is consideredundervalued, i.e. a good investment.
In the case of company XYZ, using a one-year investment horizon, knowingthat the dividend D1 will be e5.00, a forecast that the stock can be sold at the endof the year at price P1 ¼ e75.00, and a risk-adjusted interest rate of 10 per cent,E( ) denoting expected values, the intrinsic value is
V0 ¼ ½EðD1Þ þ EðP1Þ�=ð1þ kÞ ¼ ½05þ 075�=1:1 ¼ 072:72 ð6:1Þ
The intrinsic value, e72.72, exceeds the current price, e70.00 – we concludethat the stock is undervalued by the market. It is obvious: If our expectations arecorrect, then in case of undervaluation, the investor would buy additional stock,in case of overvaluation he or she would sell. If all investors behaveaccordingly, then the market equilibrium reflects the intrinsic value estimates ofall market participants. This means the individual investor whose estimate ofV0 differs from the market price P0, in effect disagrees with some or all of themarket consensus estimates of D1, P1 and/or k.
Dividend Discount Models (DDMs) are a generalization of the intrinsicvalue concept. Take formula 6.1 as a platform to begin with. Then,
V1 ¼ ½EðD2Þ þ EðP2Þ�=ð1þ kÞ ð6:2Þ
If it is assumed that the stock will sell at its intrinsic value by the end of period2, then P1 (from formula 6.1) equals V1 (from formula 6.2), E(P1) ¼ V1.Substituting V1 for P1 in formula 6.1 leads to:
V0 ¼ ½EðD1Þ=ð1þ kÞ� þ ½EðD2Þ þ EðP2Þ�=ð1þ kÞ2 ð6:3Þ
which can be interpreted as the intrinsic value of a stock holding period of twoyears. In general, one can write:
V0 ¼ ½EðD1Þ=ð1þkÞ�þ ½EðD2Þ�=ð1þkÞ2þ . . .þ½EðDHÞþEðPHÞ�=ð1þkÞH ð6:4Þ
for a holding period of H years. Indeed, the intrinsic value of a stock with aholding period of H years is the discounted value of all dividends paid plus theproceeds of the final selling of the stock in year H. If one assumes H evergrowing to infinity then formula 6.4 turns into:
V0 ¼ ½EðD1Þ=ð1þ kÞ� þ ½EðD2Þ�=ð1þ kÞ2 þ ½EðD3Þ�=ð1þ kÞ3 þ . . . ð6:5Þ
It should be noted that this formula does not state that the intrinsic value isindependent from any capital gains. It only states that any capital gains at thetime the stock is sold will be determined by the estimated (expected) dividendspaid in future.
363
Investing social protection reserves

If – for the sake of simplicity50 – one assumes that the known dividendD0 grows forever in future at a constant rate g (which may be positive, zero,or negative), then formula 6.5 turns into:
V0 ¼ ½EðD1Þ=ðk � gÞ� ð6:6Þ
which is often called the constant growth DDM or Gordon formula.51
Mathematically, the formula is valid only as long as k 5> g (that is, k does notequal g). In case of k ¼ g, the stock value would be infinite, which is economicnonsense. But also, g > k does not make sense from an economic point of view, asit either implies a negative intrinsic value of the stock (the company should thenbe bankrupt and disappear from the market) or the market has to adjust its estimateof k. If a stock market analyst promotes an estimate of g > k, that is, a dividendgrowth rate higher than the interest rate, one should be careful because such anestimate might seem like an investment opportunity, but only if short-termgrowth rates were meant. It might not be sustainable over the longer run.
DDMs have been made more sophisticated by assuming that dividends paidout depend on the amount of earnings retained for the investment policy(expansion) of the company. The question is whether the intrinsic value fallsor increases in case of such a strategy. If the firm’s additional, expansionaryinvestment earns higher returns than the generally required market rate k, thenthe intrinsic value of such a company will increase (which is in accordance withgeneral economic wisdom). Furthermore, the models have been fine-tuned inorder to reflect better the firms’ position over their assumed life cycle(multistage growth models).52
DDMs are easily applied but the challenge lies in establishing their inputs asthey all refer to future expectations. Stock value estimates are no better than theunderlying assumptions. Therefore, as in all other rational techniques that havebeen established in an attempt to look into the future, sensitivity tests shouldalways be undertaken in order to determine how much DDM results react todifferent sets of combinations of assumptions.
An evaluation concept different from DDM is the price–earnings ratio ofstocks. This analysis starts from the consideration that the stock value should bepositively linked to the growth opportunities of the corporation in question wheregrowth opportunities are – in this model – identical to the long-term growth of thedividends paid. One version of the price–earnings ratio is as follows:53
E½P0=E1� ¼ ð1 � bÞ=ðk � ROE*bÞ ð6:7Þ
where:
P0/E1 ¼ ratio of (known) share price in period 0 over (expected)earnings in period 1
b ¼ retention rate, i.e. share of operational surplus reinvested(or ‘‘ploughed back’’) into the company 05b51
364
Financing social protection

k ¼ expected ‘‘normal’’ market rate of return on investmentsROE ¼ return on equity of the company under consideration
Observe that the growth rate g of dividends in this model is:
g ¼ ROE � b ð6:8Þ
Formula 6.7 has the following characteristics: k is usually consideredconstant as it represents the normal market rate of return. As long as b differsfrom zero, a growing ROE increases the price–earnings ratio (given the termROE*b does not equal or increase over k). This makes sense, becauseinvestment projects with high ROE provide the firm with growth opportunities.As long as ROE exceeds k, a higher b increases the ratio. This again makessense, as the market will honour such firms with a higher share price in relationto dividends paid, if they exploit such opportunities by ploughing back parts ofthe operational surplus into these opportunities.
Some simple calculations are summarized in table 6.4 which reflectsnumerically the above considerations.
The higher the plowback rate, the higher the growth rate, but not necessarily ahigher P/E ratio. A higher plowback rate increases P/E only if investments madeby the corporation offer an expected rate of return higher than that offered by themarket. Otherwise, higher plowback is negative for shareholders because it meansmore money is put into projects with inadequate rates of return.
The above equity price calculations should constitute the basis fordeciding on the underestimation or overestimation of the share. As stockexchanges are usually considered near-perfect markets that reflect the ‘‘right’’
Table 6.4 Effect of ROE and plowback rate on dividend growth and theP/E ratio
b 1�b k ROE g P/E
0.00 1.00 0.12 0.09 0.000 8.33
0.00 1.00 0.12 0.12 0.000 8.33
0.00 1.00 0.12 0.15 0.000 8.33
0.25 0.75 0.12 0.09 0.023 7.69
0.25 0.75 0.12 0.12 0.030 8.33
0.25 0.75 0.12 0.15 0.038 9.09
0.50 0.50 0.12 0.09 0.045 6.67
0.50 0.50 0.12 0.12 0.060 8.33
0.50 0.50 0.12 0.15 0.075 11.11
0.75 0.25 0.12 0.09 0.068 4.76
0.75 0.25 0.12 0.12 0.090 8.33
0.75 0.25 0.12 0.15 0.113 33.33
Source: ILO.
365
Investing social protection reserves

prices in a timely manner, gains by buying undervalued shares (‘‘luckybuys’’) are not likely to occur. Yet, if new information on the prospects of acompany revises the results of the equity price calculations, the informationlead against the overall market allows for those gains. In this light, if stocksare priced correctly, brokerage profits rely solely on discovering informationnot yet incorporated in the market price. This highly sensitive type ofinformation may be available to insiders, who are expressly forbidden fromexploiting it by acting on the financial markets. Given the sophisticatedorganization of exchanges and the large number of traders, hopes onspeculative gains in stock trading are slim. Pension funds with their long-termorientation should instead rely on quality investment promising stable growthand dividend payment.
6.5.3 Debt instrument performance indicators
Other than for equity, constructing bond indicators that reflect true prices forprivate sector bonds is not a straightforward matter. Certain government bondsof major industrialized countries are commonly traded on exchanges, and priceindices for them are computed on a daily basis. As regards bonds of less reputedgovernments and commercial bonds in general, the problem is that they aretraded less frequently and true rates of return are therefore difficult to compute(Bodie et al., 1996, p. 69). Hence, up-to-date prices are usually difficult toobtain and price estimates are derived on the basis of bond valuation models.Several indices of overall bond market performance are available, some of thebetter known ones being Merrill Lynch, Lehman Brothers and SalomonBrothers.
6.5.4 Bond yield54
Because a bond’s regular payments (often called ‘‘coupon payments’’) andprincipal repayment55 all occur months or years in the future, the pricean investor would be willing to pay for a claim to those payments depends onthe value of currency units, say euros, received in the future compared to eurosin hand now. It is plausible that the present value of a euro to be received infuture is less than e1. Obviously, the time spent waiting to receive that e1imposes an opportunity cost on the investor; if the money is not on hand itcannot be used for alternative investment that would generate incomeimmediately.
To calculate today’s value of a bond the expected cash flows (coupon plusfinal face value payments) are being discounted by the appropriate discount rate(interest rate). In other words:
Bond value today ¼ Present value of couponsþ present value of face value
366
Financing social protection

If one calls the maturity date T and the appropriate interest rate r, then thepresent value of the bond can be written as:
PVBt0 ¼X
t¼1
T ½Coupon=ð1þ rÞt� þ ½Face value=ð1þ rÞT� ð6:9Þ
where:
PVBt0 ¼ present value of Bond B at valuation date;Coupon: ¼ regular payments at fixed dates between t0 and TFace value ¼ final payment in Tr ¼ market interest rate
The first term in formula 6.9 is often called the present value of an annuity.In the following, we consider a 3-per cent coupon, 30-year maturity bond
with a face value of e1 000 paying an annual e30 coupon. Suppose the marketinterest rate is 3 per cent annually. Then the bond’s present value (the fair priceat which an investor would buy) can be calculated as follows:
Price ¼X
t¼1
30 . . . 30½030=ð1þ 0:03Þt� þ ½01 000=ð1þ 0:03Þ30� ð6:10Þ
Using a standard PC spreadsheet software program it is easy to confirm thatthe present value of the bond’s annuity is e588.01 whereas the present value ofthe final repayment of the face value is e411.99.
Both values add up to e1, 000. The reason is obvious: The market rate isassumed to match exactly the coupon rate. The investor would get a fair returnin future for an investment of e1, 000 today. In other words, the bond would sellat par value.
If the market interest did not equal the coupon rate, then the bond would notsell at par value, as is illustrated for different interest rates in table 6.5. Let usassume that the long-term market rate rose above the initial 3 per cent (couponrate and face value unchanged). Then the present value of the bond’s annuityand of the face value would be lower than par. The reasoning is as follows:at the higher market rate the investor would earn higher returns for his or here1, 000, the price of the bond has to fall. Equally, if the market rate wereassumed to decline, the bond present value would increase.
It should be noted that increases and decreases in interest rates do not leadto symmetric results in terms of the bond price. While the interest variation forexample is þ and �1/3 (4-per cent and 2-per cent market rates compared to the3-per cent coupon rate) the price decrease in case of an assumed higher marketrate is �17.3 per cent (e827.08/e1 000) whereas the increase in case of anassumed decline of the long-term market rate is 22.4 per cent (e1, 223.96/e1, 000).56 This biased property of bond prices is called convexity because of theconvex shape of a graph plotting bond price against market interest. Figure 6.7
367
Investing social protection reserves

shows the inverse relationship between price and opportunity asset interest forthe sample bond.
Interest rate fluctuations represent the main source of risk in the fixedincome market. Also, bond prices react sensitively to maturity. This is obvious,because if the investor has bought the bond at par and the market ratessubsequently rise then the investor makes a loss, and the longer the moneyinvested is tied up, the greater the loss.
Table 6.5 Bond present value (e1,000, 30-period maturity, 3% p.a.) at differentinterest rates
Market interest rate (%) Coupon present value Face value present value Bond present value
1 741.92 774.23 1 516.15
2 552.07 671.89 1 223.96
3 411.99 588.01 1 000.00
4 308.32 518.76 827.08
5 231.38 461.17 692.55
6 174.11 412.94 587.06
7 131.37 372.27 503.64
8 99.38 337.73 437.11
9 75.37 308.21 383.58
10 57.31 282.81 340.12
15 15.10 196.98 212.08
20 4.21 149.37 153.58
Source: ILO.
Figure 6.7 Convexity axiom on bond present value versus market interest rate
Source: Table 6.5.
368
Financing social protection

6.6 INVESTMENT STRATEGIES
For public social security funds there are normally guidelines provided by lawthat may be perceived as quasi-‘‘benchmarks’’ (see box 6.4). The preciseness ofthese guidelines depends on the circumstances. The more the public wants orneeds to have control over the strategies pursued and decisions taken bypension fund management, the more detailed the legislation. The controlexerted should comply with constitutional, legal and other public requirements.Sometimes this might be in conflict with a desired higher degree of freedom ofthe fund management to act. The relative importance of the two factorsprobably needs to be based on expert knowledge and decided on a case-by-casebasis. Advice with respect to investment guidelines for the management ofpension funds can be obtained from the OECD.
We will examine a number of modern investment strategies: investments byindustry, market and region, as well as socially responsible investments. The listis not exhaustive, and the order in which the strategies appear does not indicateauthors’ preferences. Investment strategies focusing on derivatives have beendeliberately omitted as they are not deemed to comply with the basic investmentprinciples of social security funds. In any case, focusing investment on certainpre-defined industries, markets or regions increases investment risk. For socialsecurity funds mixed strategies are possible and are generally advised.
6.6.1 Investment by industry
This kind of investment entails investing in firms that belong to the same typeof industry. The incentive to invest in industries comes from the long-standingobservation that in economies there are often certain industries that grow fasterand are more profitable than others; there are emerging and dying industries;there are firms with long records of high performance and others that are moreor less permanently ailing. The aim of investment would be to invest in thesuccessful industries only. If this strategy were applied, financial reserves ofsocial security schemes would be allocated exclusively to equity and/or bondsof those (groups of) firms.
Obviously, pursuing such a strategy is not possible without industryanalysis, which involves solving numerous methodological problems. First,industries have to be defined: at first glance this seems simple, but is actuallyquite complicated. Many industries issuing equity or securities are in factconglomerates producing and trading different types of products that might ormight not be easily classified under the same heading (industry). One availableclassification system is the International Standard Industry Classification of AllEconomic Activities (ISIC), widely used in the OECD and all other countriesthat regularly publish national accounts. The ISIC is used by governments’statistical offices to group firms for purposes of statistical analyses. Its latestversion is ISIC Revision 3.1.57
369
Investing social protection reserves

Box 6.4 Pension fund for municipal employees: The example of
Denmark1
The Danish pension fund for the employees in municipalities, a fullyfunded DC scheme, operates according to the following asset allocationprinciples:2
The 50/50 ruleA maximum of 50 per cent of the assets may be held in volatile assets(e.g. stocks, junk bonds) whereas the rest must be held in secure assets(state bonds, gilt-edged corporate bonds, real estate, etc.).
The 3-per cent ruleNo more than 3 per cent of the pension liabilities may be invested in onecompany (limitation of risk of default exposure).
The currency ruleA minimum of 40 per cent must be held in assets denominated in nationalcurrency, a maximum of 40 per cent in European Union (EU) currency anda maximum of 20 per cent in other currencies.
No control ruleThe legislation says explicitly that the fund must avoid any decisioncontrol over single companies – except over Asset ManagementCompanies.
Rules like the ones listed above exist in many countries, adjusted tothe specific circumstances. In recent years there has been a tendency toexpand the investment share of stocks and reduce that of bondsaccordingly. This was based on the observation that over the longer runthe rates of return on stocks seemed to be higher (and no less safe) thanthose of bonds. Most recently, given the strong downturn on internationalequity markets, pension funds have revised their general rules on assetallocation in order to better protect their members’ contributions. In doingso, they may have contributed to a downward spiral of the (alreadybearish) stock markets.
The Danish currency rule, in fact, exposes a maximum of 20 per centof the fund’s assets to an exchange rate risk – as long as the governmentpursues a policy of a fixed exchange rate of the Danish crown in relationto the euro and assuming that the national currency is floating freelyagainst other currencies.
The 3-per cent rule is aimed at limiting financial damage to the pensionfund in case of bankruptcy of a firm in which the fund has invested money.It only works as a safety barrier if the bankrupt firm does not triggerbankruptcies of, for example, complementary or dependent companies.
The no-control rule is important for market economies, which dependon free competition. If, for example, a pension fund were to gain controlthrough investments in equity over two competing companies, decisionconflicts might arise; avoiding them might be temporarily helpful to thefund’s assets, but in the long run detrimental to the proper functioning of
370
Financing social protection

the economy – and of the fund. In addition, principal–agent problemsmight arise within pension fund management if its voting power grows:interests may be obscured at the level of a single official and forthe pension fund as a whole, leading to biased decisions (as regardsgovernance of the shares, for example). One should be aware of the factthat this problem (avoiding pension fund control over companydecisions) will become an acute problem with growing numbers ofpension funds and their growing investment potential. For the timebeing, funds in small countries that are big nationally but are smallin international comparison may, as a remedy, easily divert their invest-ment streams to other countries; however, once full funding ofpensions became broadly popular in all industrialized countries, thenthe control problem would accelerate fast in its economic and societaldimensions.
The above rules say nothing about the worldwide regional allocationof the assets held by the Danish fund.
The Danish case reflects an active fund management approach. Thefund management is given room for discrete decisions with respect to thepurchase of investment certificates within the limits of the rules stated.These provisions are kept unchanged over reasonable periods but arepermanently and closely monitored. If the rules are considered outdated orno longer applicable, for example because market conditions havechanged, they are then revised in order to redirect fund managementdecisions.
If the pension fund management were to follow a passive manage-ment strategy, a portfolio would have to be built up replicating the majorcompanies included in the targeted benchmark indices. The developmentof the fund reserves could then be tied to the performance of, e.g. theDow Jones, the FTSE, the DAX or the DJSGI (Dow Jones SustainabilityGroup Index covering 64 industries).
Passive strategies are considered rational if the stock exchanges (byway of their corporate rules) guarantee that only highly profitablecompanies with a long-lasting good economic reputation (‘‘blue chips’’)are permitted for trading and form part of the reference indices, and if thepension fund is small enough not to exert considerable price influence. Inaddition, the rules for a company to be delisted from the exchange ordropped from the index must be transparent. If the exchange provides forthese conditions, it can be expected of the market to honour thesecompanies with a growing index and, in turn, with increased returns(dividends) on the listed stock.
However, movements of indices might be biased by decisions ofsingle, influential, large market participants such as pension funds. Thebigger a fund becomes the more its decisions will contribute to generalmarket movement, measured at the level of indices. Therefore, passiveinvestment strategies may be an option over the short term, but notover the longer term. If all investors pursued a passive strategy, the
Box 6.4 (cont’d)
371
Investing social protection reserves

Placing a specific firm into one of the classes requires detailed knowledge ofits actual purpose and activities. On this basis, financial analysts would have tocheck which firms have issued equity and securities on the formal financialmarkets – that is, whether they are at all ‘‘accessible’’ to investors (such as asocial security fund, for example). Even if the classification is obvious and inevery sense correct, high- and low-performing firms might still be included in thesame class, posing analytical problems to financial analysts. Moreover, analystshave to maintain close professional contact with the practice of statistical offices,as these might include ‘‘newcomers’’ and exclude firms that have come to theend of their life cycle. Furthermore, financial investors may want to place theirmonies domestically as well as internationally, in which case the contents ofclassifications in different countries have to be merged. After solving these andother problems (see Bodie et al., 1996, pp. 506–520), financial analysts wouldlook into the movement of performance-related indices of the firms of interest ina macroeconomic context and, using macroeconomic forecasts as indicator forexpected index movements,58 transform the results into portfolio decisions.
Building up and maintaining the required level of technical expertise isobviously expensive, and social security fund managers are usually not in aposition to employ the professionals needed. A fund management firm wouldhave to be commissioned to manage the portfolio. Again, a typical asymmetricprincipal-agent situation of imbalanced knowledge allocation would occur.In short, social security scheme management would be well advised not to put‘‘all its eggs in one industry basket’’.
6.6.2 Investment by financial market
This notion covers investing in formal markets. For example, the strategy couldbe to invest in one or several of the indices developed for stock exchangesaround the world, for example the Dow Jones, FTSE, DAX, or a combination ofthese (for a list of existing markets, see Issue Brief 4). Other indices servicingspecific investment policies could also be developed, but this would requireenormous additional input in terms of research and analysis. The incentive to
market would eventually come to a standstill. Passive investmentstrategies are therefore a contradictio in adjecto, at least over thelonger run.
Notes
1 Sampension Administrationsselskab: Handout to the PSI Pension Leadership Meeting, 25–26
January 2001, The Hague (Netherlands).2 Such principles are usually open to change over the medium term.
Box 6.4 (cont’d)
372
Financing social protection

invest in specific formal markets is positively linked to the degree of prudentregulations actually enforced and executed at these markets and designed, interalia, to prevent fraud and insider trading. The investment aim would be to investonly in the high-performing markets among the well-regulated ones. Theproblems to be solved are similar to those in respect of investment by industry.If this strategy were applied, financial reserves of social security schemes wouldbe allocated to equity and/or bonds of those markets only.
One of the main problems of investing only in certain formal financialmarkets is of a ‘‘black-box’’ nature. In preparing and executing this investmentstrategy, financial analysts might be inclined to analyse the trend and/or cyclicalbehaviour of indices provided at the markets only, without analysing theunderlying performance of the industries represented. Obviously, the content offinancial market indices differs significantly from the indices constructed forindustries, as mentioned earlier. In order to overcome this obstacle, modelslinking industry-performance indices with market indices would be desirable.However, there are multiple methodological and analytical problems to besolved. Even if such models could be constructed on the basis of pastobservations, there are strong doubts about successfully keeping their structuretime-invariant over sufficiently long periods. Again, their embedment intomacroeconomic contexts poses additional problems.
As regards the level of technical expertise required, here too the sameremarks and conclusion apply as in the case of investment by industry.
6.6.3 Investment by region
This means focusing on one or more countries or regions in the world, includingthe decision on whether to invest only (or predominantly) at home or (also) abroad.Such investments can be made ‘‘by industry’’, ‘‘by financial market’’, a combina-tion of both, or by other investment means (direct investment, for example).
For private portfolios as well as for social security funds, domestic restrictionof investment has long been one of the most controversial issues of assetmanagement. For the OECD, meanwhile, there seems to be general agreementthat investment anywhere in the world should be allowed.59 Funds in majorOECD countries are being collected in convertible currency – in other words, inprinciple there is no problem for their monies to be accepted anywhere in theworld. Because of existing prudence rules, however, OECD-based funds tend toinvest within the OECD and only to a limited extent in non-member countries.The Danish pension fund for municipal employees, for example, in 2000allocated 26 per cent of its equity to firms based in Denmark, while 29 per centwent to developed European countries (excluding Denmark), 16 per cent to Japan,23 per cent to the United States, and only 6 per cent to the emerging markets.
In addition to issues raised by investing in different industries or markets,regionally oriented investment decisions involve additional monitoring andanalytical problems for asset managers.
373
Investing social protection reserves

6.6.4 Socially responsible investment
Socially responsible investment (SRI) belongs to the group of investmentstrategies with an explicit ethical background. It is defined as ‘‘investmentwhere social, environmental or ethical considerations are taken into account inthe selection, retention and realization of investment, and the responsible use ofrights (such as voting rights) attaching to investments’’ (Mansley, 2001, p. 2).For some years now it has been standard practice of institutional investors,especially in the private sector, to offer so-called filters that allow for anallocation of individual portfolios ensuring that the investment meets certainresponsibility requirements set by the investor.
Public social security funds have thus far maintained a more conservativeattitude vis-a-vis these issues. One of the main reasons is that they are legallyobliged to avoid positive or negative discrimination. If – in a democraticcountry – a company’s business is legal, how can investing in that company besocially irresponsible? Public pension funds are not the only entities confrontedwith this consideration – private funds may also have to tackle it, depending onnational or international legislation and their own profile regarding thedestination of their investment.
It is often thought that violations of basic social standards occur only in lessdeveloped regions. However, companies’ conduct should be critically examinedregardless of the location of their activities. ‘‘Social filters’’ may take intoaccount the following aspects:
6.6.4.1 Corruption
There is growing awareness the world over of the damage that corruption cancause to a country’s social and economic fabric. Economic growth andinvestment levels are lower in countries with high levels of corruption becauseof prevailing uncertainty, the costs of bribes and time-consuming bureaucraticprocedures. The 1998 OECD Anti-Bribery Convention requires each Party ‘‘toestablish that it is a criminal offence under its law for any person intentionally tooffer, promise or give any undue pecuniary or other advantage, whether directlyor through intermediaries, to a foreign public official’’.60 Achieving compliancewith such rules in firms is never easy, and is especially difficult in largemultinational companies, with subsidiaries and joint ventures in many countries.It is therefore important that firms develop a comprehensive programme designedto alert all employees to the need to resist corruption in its different forms.
6.6.4.2 Labour standards
Many companies source an increasing portion of their goods from developingcountries. While international trade and investment can bring much-needed jobsto these countries, abuses sometimes occur. If the created jobs are dangerous,
374
Financing social protection

or if the workers are forced to live in appalling conditions, the actual benefits tothem may be minimal. A great majority of the international community hassigned the ILO ‘‘core labour standards’’ which cover issues such as forcedlabour, non-discrimination, health and safety, freedom of association, collectivebargaining, and child labour. Unfortunately, many governments do not enforcethem, often because they fear that international investors may be deterred bysuch laws.
6.6.4.3 Human rights
The internationally accepted standard for human rights is the 1948 UnitedNations Universal Declaration of Human Rights. This framework should formthe basis of a company’s human rights policy and be implemented acrossits sphere of influence. The reputation of many companies has beentarnished because of real or perceived mismanagement on the issue of humanrights.
6.6.4.4 Social security
One of the major problems of social security financing in developing andtransition countries is non-compliance with contribution payments to socialsecurity, often leading to a shortfall in the resources that social securityinstitutions need in order to deliver benefits, both in cash and in kind. Thispractice is frequently tolerated by company management and employees forcost and net-income reasons and by governments for (alleged or actual) reasonsof international competitiveness. Governance – including administrativerelations between social security funds and companies – is often inadequate.When entering into joint ventures, internationally operating companies have acrucial role to play in improving the situation in this regard.
Before deciding on making any financial commitments vis-a-vis a givencompany, social security fund managers may ask whether the company hasexplicit policies on the above issues, whether such policies are beingimplemented, and how. Other issues, too, may be addressed, such as armedconflicts or access to medicine. What is the policy on company conduct in thisregard? Furthermore, social security fund screening practices can be applied soas to exclude companies involved in producing certain goods (e.g. tobacco, oil).
The performance of SRI has so far confirmed the validity of this type ofstrategy. It can be proven that funds pursuing SRI strategies do not performworse than those applying standard investment strategies. A survey comparing183 United States screened mutual funds to unscreened funds found evenhigher average returns for screened funds as of 1999, especially for longerperiod records of three to ten years. Also, the funds’ investors seem to havea higher commitment, as turnover rates are comparatively lower than forthe comparator unscreened portfolios. The sample of the screened funds
375
Investing social protection reserves

accounted for higher volatility and higher share prices than the comparatorunscreened funds.61 Other studies drawing on risk-adjusted comparisons findno return advantages against unscreened funds. Additional risk exposureseems to be inherent in screened portfolios.62 However, such considerationsare challenged by the ‘‘no-effect’’ thesis claiming that screened funds, by thevery nature of their construction, counterbalance such risk-enhancing effects,in which case SRI, exhibiting the same risk-return features, could be regardedfinancially fully equivalent to conservative investment opportunities (Kurtz,1999).
Reasons for the relative success of SRI have been seen in linkagesbetween a management’s setting up of socially responsible programmes andsuperior skills in general production management – in other words, one wouldnot exist without the other. Some of these effects may rebound from thesocially responsible practice of offering fringe benefits to employees, fromimprovements of workplace environment to further professional training. Inaddition to having a positive impact on labour productivity, such measuresalso shape the company’s outside reputation. A good reputation may exertcrucial influence on a company’s clients, future business partners andemployees and enhance business prospects. Of course, for social security fundinvestment decisions these general statements would have to be proven inevery individual case.
Investment in SRI-scanned funds in the United States has grown by morethan 30 per cent between 1999 and 2001. The market for socially screenedfund investment exceeded US$2 trillion in 2000. Private investors havepreferred to put their money into fund portfolios ensuring socially responsibleinvestment with a growth rate 1.5 times that of non-screened portfoliofunds.63
The more popular that SRI strategies become, the closer this approach willcome to its limits. Firms not complying with social filters might increasinglyrely on self-financing of investments; the more limited the pool of firmscomplying with the filters, the more social security funds pursuing SRI willcompete for investment possibilities in exactly these firms. The share price ofthese companies might then increase on account of excessive demand, thoughnot necessarily for reasons of good economic performance. It should be notedthat the SRI strategy applies not only to investment in corporate equity butmight also be applied to the holding of government bonds. This meansscreening governments for their commitment to observe the same rules, ifapplicable, as corporations.
6.6.5 Common considerations
Whatever investment strategy a social security scheme decides to implement –an industry orientation, a financial markets or regional orientation (with
376
Financing social protection

domestic or international focus), an active social filtering policy, a mixedstrategy, or other strategies not addressed here – the procedures of selecting theconcrete investment portfolio should be formally laid down in writing as astandard element of pension fund operations. The specific steps to be taken by ascheme’s asset management department (or an asset management firm carryingout the fund’s policy) could follow the sequence set out below, proposedby Cummins (2001):
. defining criteria: these should be stable over an extended period but may berevised periodically;
. screening data: permanent access to a professional data provider isnecessary;
. auditing data: in-house analytical capacities are indispensable;
. investment analysis: in-house analytical capacities are indispensable;
. stock versus securities selection: according to the outcome of prior research;
. portfolio construction: to be offered to the social security fund management(i.e. no black-box policies);
. voting: decisions have to be supported by the majority of the social securityscheme management and may include the stakeholders.
Before this can be done, the social security scheme has to define itspriorities. In the case of a social filtering policy, for example, financialinvestments should only go to companies which observe:
1. Employee rights, that is:
. allow for workers’ representation;
. pay fair wages and pursue an equal opportunities policy;
. share profits with their employees;
. obey international standards of labour and industrial relations;
. take care of health and safety of their employees.
2. Societal needs, that is:
. actively sponsor communities;
. help to improve local infrastructures.
3. Product quality standards, that is:
. employ explicit product quality and safety guaranteeing mechanisms;
. have a research & development department and a good record ofinnovations;
. pursue a fair marketing and contracts policy.
377
Investing social protection reserves

4. Environmental issues, that is:
. pursue a policy of preventing environmental damage;
. obey legal safety regulations;
. avoid ozone-depleting chemicals;
. avoid other chemicals (as far as considered counter-environmental);
. communicate their environmental problems and the respective policyof amelioration openly;
. do not use tropical hardwood.
Social insurance fund managers must not forget under any investmentstrategy, SRI or otherwise, that the fund’s primary goal is to pay out benefits,such as pensions. Contributors have a stake in expecting maximum return (ata given, low risk) at a future date, on the contributions paid today. Therefore,filters such as the ones described above have to be translated into explicitrequirements. For example, the fund’s stakeholders might not want to investtheir contributions in firms that pollute the environment. The meaning of‘‘polluting the environment’’, however, depends on the definition of‘‘pollution’’. To avoid futile discussions and consequent delays in investmentdecisions, one might say that investment in such firms is prohibited unlesstheir contribution to environmental pollution is unavoidable despitebest practice. Or, stakeholders might not want the scheme’s funds to beinvested in certain countries (non-democracies, for instance). This is difficultto enforce vis-a-vis companies operating internationally; again, rules shouldbe clearly laid down in order to avoid counterproductive delays in investmentdecisions.
6.7 INVESTMENT PROBLEMS IN COUNTRIES WITH
UNDERDEVELOPED FINANCIAL MARKETS
Serious problems arise when markets do not have full faith in the governmentsor when market participants do not trust the operations of the (formal) markets.This is the case when bad governance and corruption undermine public trustin governments’ ability to fulfil their obligations in the long run, and whenmarkets are unable to agree upon and enforce generally accepted prudencerules in order to create a common practice of following best standards. Statecreditors as well as financial market participants will then ask for additionalrisk benefits on top of the basic interest that would be charged to trusteddebtors.
Where funded pension schemes, public or private, are the sole source offinance left to be tapped by governments, they often find themselves in acomplicated position, since they are then usually obliged to invest solely in the
378
Financing social protection

domestic markets and in government bonds – thus acting as a saviour ofotherwise ailing public budgets while simultaneously maintaining otherwisefailing financial markets.
The following sections deal with various aspects of pension fundinvestment problems that have been observed or might arise in emergingfinancial markets, in the financial markets of transition countries or in countriespursuing investment strategies that explicitly address domestic (national)development.
6.7.1 Emerging markets and investment of
pension funds
Emerging markets are generally characterized by lack of transparency,asymmetric distribution of information and lack of culture of mutual trust inthe credit business. As a result, only small amounts of capitalization relative toGDP are available for trading in these markets. Low market capitalization,in turn, serves as a defining criterion of emerging markets (IFC, 1999, p. 3) andthus contributes to perpetuate potential investors’ low grading of financialmarkets in middle- and low-income countries.
An international comparison of primary financial market developments waspublished by the World Bank in 1999.64 The results are especially interestingwhen seen in the context of policies promoting the introduction of fully fundedpension schemes around the world, including developing countries, as theyindicate the absorption capacity of these countries’ markets.
Two observations are of particular importance in this context (see tables6.6 and 6.7). First, long-term private sector debt issuance in relation to GDPfrom 1980 to 1995 in the emerging economies was low (0.6 per cent ofGDP, on average); however, it showed a growing trend of 0.2 per cent overthe period 1980–85, 0.6 growth per cent for 1986–90 and 0.9 per cent for1991–95. The levels are probably overestimated, as GDP figures for thesecountries often do not include informal market production. GDP, includinginformal sector investment, is of interest here as one would like to know howmuch leverage primary market issuances contribute to overall growth. Second,equity issuance in percentage of GDP in emerging markets is higher thanin the major established market economies65 and as high as in the ‘‘Asiantiger’’ countries. Here too, there is possible overestimation. The relativelyhigh equity issuance levels may be explained in part by the fact that a bankingsector, when developed, usually covers substantial volumes of businessfinancing. In most emerging markets, however, the banking sector isunderdeveloped.
Emerging markets display a number of characteristics:New debt issuance is offered by public borrowers. Newly issued sovereign
debt instruments accounted alone for 53 per cent, with a further 15 per cent of
379
Investing social protection reserves

Table 6.6 Long–term private sector debt issuances (as % of GDP) by type ofeconomy, 1980–95
1980–85 1986–90 1991–95 1980–95
Emerging markets
Argentina 0.0 0.3 0.2
Brazil 0.3 0.1 0.4 0.3
Chile 1.3 1.9 3.2 2.3
China 0.0 0.5 0.6 0.3
Colombia 0.2 0.2 0.4 0.3
Greece 0.0 0.0 0.0
Hungary
India 0.0 0.1 0.1 0.1
Indonesia 0.0 0.0 0.2 0.1
Jamaica
Jordan 0.4 0.2 0.1 0.2
Kenya 0.1 0.1
Malaysia 1.7 3.8 2.8
Mauritius 0.2 0.0 0.1
Mexico 0.0 0.4 2.3 0.9
Pakistan
Peru 0.0 0.1 0.4 0.1
Philippines 0.2 0.2 0.5 0.3
Portugal 0.3 2.3 2.0 1.4
Sri Lanka 0.0 0.0
Thailand 0.0 2.4 1.2
Tunisia 0.6 0.5 0.5
Turkey 0.1 0.3 0.0 0.1
Venezuela 0.7 1.8 0.3 0.9
Total 0.2 0.6 0.9 0.6
Asian tigers
Hong Kong, China 0.1 1.0 0.7
Republic of Korea 4.1 6.3 9.5 6.5
Singapore
Taiwan, China 0.2 0.1 0.3 0.2
Total 2.5 2.5 3.6 2.8
G4 Industrialized countries
Germany 9.9 8.4 11.5 9.9
Japan 7.5 12.6 11.3 10.3
United Kingdom 0.2 0.5 0.3 0.3
United States 1.8 5.4 7.5 4.7
Total 4.8 6.8 7.6 6.3
Grand total 1.7 2.1 2.4 2.1
Source: Aylward and Glen (1999).
380
Financing social protection

Table 6.7 Equity issuances (as % of GDP) by type of economy, 1980–95
1980–85 1986–90 1991–95 1980–95
Emerging markets
Argentina 0.0 0.0 0.2 0.1
Brazil 0.2 0.2 0.3 0.2
Chile 1.1 2.0 1.1 1.5
China 0.0 0.1 0.1 0.0
Colombia 0.3 0.2 0.4 0.3
Greece 0.1 0.5 0.6 0.4
Hungary 0.0 0.0 0.9 0.3
India 0.0 0.0 0.1 0.0
Indonesia 0.0 0.8 1.5 0.7
Jamaica 0.0 0.1 0.6 0.2
Jordan 3.2 0.7 5.1 3.0
Kenya 0.0 0.1 0.2 0.1
Malaysia 1.3 2.3 3.6 2.3
Mauritius 0.0 0.4 2.1 1.8
Mexico 0.0 0.1 0.6 0.2
Pakistan 0.1 0.1 0.5 0.2
Peru 0.0 0.0 0.0 0.0
Philippines 0.3 0.3 1.2 0.6
Portugal 0.0 2.5 3.1 2.8
Sri Lanka 0.0 0.1 0.9 0.5
Thailand 0.4 3.3 3.9 2.4
Tunisia 3.9 2.2 3.4 3.2
Turkey 0.2 0.4 0.7 0.5
Venezuela 0.3 1.0 1.4 0.8
Total 0.6 0.8 1.4 0.9
Asian tigers
Hong Kong, China 0.0 0.6 6.9 3.2
Republic of Korea 0.6 4.0 1.4 1.9
Singapore 1.1 0.7 1.8 1.2
Taiwan, China 0.6 0.8 1.1 0.8
Total 0.7 1.5 2.8 1.6
G4 Industrialized countries
Germany 0.5 0.8 0.7 0.6
Japan 0.7 2.0 0.2 1.0
United Kingdom 0.7 1.8 1.7 1.4
United States 0.9 1.0 1.3 1.1
Total 0.7 1.4 1.0 1.0
Grand total 0.6 1.0 1.5 1.0
Source: Aylward and Glen (1999).
381
Investing social protection reserves

overall market volume issued by other public sector institutions.66 All actors inemerging markets face a high interrelation with developments on matureinternational financial markets. The interest and return conditions on theemerging financial markets as compared to the mature markets are the mostimportant factors; they depend, inter alia, on the investors’ views on market riskdifferentials and differentials in expected long-term macroeconomic prospects.
Emerging markets’ assets are generally viewed as risky assets, mainlyowing to general lack of transparency in those markets. The ratings produced byrating agencies for emerging-market instruments are generally found to be inthe B-range, the highest attainable score being AAA, and the lowest D, forexpected certain default.67 This implies the existence of high-risk premiums incompensation of expected lower payback rates.
Emerging-market debt certificates are often denominated in United Statesdollars, euros or yen. The foreign currency denomination shifts the exchangerate risks to the debtor, thus possibly increasing its overall default risk. Incomparison, local financial markets ask for lower interest rates. However, theyare often less liquid since the savings rate and total savings in emerging marketsare usually low.
Low levels of IPOs and the above characteristics have a number ofimplications for international and local pension fund investment policies.
Mature, OECD-based international funds, for example, would invest onlysmall parts of their reserves in the emerging markets, if at all, because the risk–return conditions on these markets most probably do not comply with standardprudence rules of investment at home. In addition, by investing substantialamounts on those markets, mature pension funds would most probably distorttheir operation (sending wrong price signals, etc.).
After reaching a certain volume, domestic emerging pension funds probablyface similar investment problems as they might provoke price bubbles andlarge-scale shifts in asset ownership, given the low level of IPOs in emergingmarkets. Investing abroad is usually not an alternative since it requiresconvertibility of the national currency. If full convertibility were not given, thenany transformation of nationally denominated funds into a convertible currency(United States dollar, euro, yen, pound sterling, or some other) would be costlyor downright impossible.
Convertibility of national currency normally depends on the volume ofinternational reserves held by the national bank. Positive reserves depend eitheron a permanent positive trade balance or on domestic financial marketconditions attracting foreign supply. If these were attractive, however, therewould be no need for pension fund monies to leave the country. Consequently,access by domestic pension funds to emerging markets is costly when aiming atinvestments denominated in convertible currency; in any case, whether reservesare channelled to instruments denominated in convertible currency or placed inlocal instruments, volatility remains high and thus poses high risk of losingworkers’ contributions.
382
Financing social protection

6.7.2 Funding pensions in transition countries68
Many – if not most – transition countries have recently taken steps toimplement funded pension systems. The funded tier usually supplements amaintained but downsized standard PAYG system. It is often mandatory, andis then completed by a voluntary third tier on a pure savings basis (privateinsurance).
Given these decisions, the existence and good performance of financialmarkets in these countries are obviously crucial to the success or failure ofpension reform. One might have expected the markets to have been createdbefore pension reforms got under way. However, many transition countries arein this respect still in a problematic position because neither long-term bondmarkets nor equity markets exist yet, or – if they do – they are still small andperforming poorly because they are badly regulated (see box 6.5 on pp. 386–7).
The main reason, however, is that in many transition countries theemergence of a ‘‘new business’’ community, especially with respect to smalland medium-sized enterprises, is still being hindered by a number of factors,including lagging economic and institutional reforms. An overview of thereform backlog as it was assessed by the Bretton Woods institutions in thesecond half of the 1990s is given in table 6.8. The table may now be outdatedfor a number of countries that have made significant progress but remains validas an example of a basic checklist of governance prerequisites for a properfunctioning of financial markets.
A number of countries, especially the Baltic States and other EU accessioncountries have meanwhile done their homework but there too the financialmarkets are still underdeveloped, largely because the entrepreneurial spirit hasyet to achieve widespread acceptance. Individuals’ efforts to become self-employed or private employers are still often greeted with scepticism by thepublic and are not particularly strongly encouraged by the local administration.Service structures in support of setting up businesses are still underdeveloped orlacking, and the small scale of newly founded businesses allows for onlylimited access to the financial markets for the purpose of financing businessexpansion.
The above are some of the reasons why primary equity markets and marketsfor the issuance of long-term debt (especially corporate bonds) in transitioncountries are still largely underdeveloped. In order to develop a long-term bondmarket69 that could bolster the functioning of funded pension systems in theyears to come, many countries still need to achieve a reliably stablemacroeconomic environment that allows investors to find the future predictablebeyond the six-month horizon and making them disposed to shift to more long-term instruments.
What are the prerequisites? Inflation kept under control, small fiscal deficits,exchange and interest rate volatility reduced to internationally comparablelevels, an increased stock of international reserves to cushion the economy, and
383
Investing social protection reserves

Table 6.8 Areas of remaining major reform backlog
Countries Privatization Governance &enterpriserestructuring
Priceliberalization
Trade &foreignexchangesystem
Competitionpolicy
Bankingreform &interestrate liberalization
Securitiesmarkets &non-bankfinancialinstitutions
Commerciallaw
Financialregulationlaw
Memorandumitem: macro-stabilizationnot achieved
EU accession countries (excluding the Baltic States)
Bulgaria � � �
Czech Republic
Hungary
Poland
Romania � � �
Slovakia �
Slovenia �
Baltic countries
Estonia
Latvia
Lithuania �
Other south-eastern European countries
Albania � � � � � � �
Bosnia & Herzegovina � � � � � �
Croatia � � �
Macedonia, FYR � � �
384
Fin
an
cin
gso
cia
lp
rote
ctio
n

Commonwealth of Independent States (CIS)
Armenia � � � �
Azerbaijan � � � � � �
Belarus � � � � � � � � � �
Georgia � � � � � �
Kazakhstan � � � �
Kyrgyz Republic � � � � � �
Moldova � � �
Mongolia
(not CIS)
� � � � � �
Russian
Federation
� � � �
Tajikistan � � � � �
Turkmenistan � � � � � � � �
Ukraine � � � � � � �
Uzbekistan � � � � � � �
East Asia
Cambodia � � � � �
China � � � � � � �
Lao P.D.R. � � � � � � � �
Viet Nam � � � � � � � �
� indicates reform backlog
Source: IBRD; IMF.
385
Investin
gso
cia
lp
rote
ctio
nre
serv
es

Box 6.5 Establishing a fully funded second-tier pension in a country
with underdeveloped financial markets: The case of Bulgaria
The Bulgarian pension reform of 1999 introduced a fully funded mandatorysecond tier and a voluntary third tier. The mandatory second tier enteredinto force in January 2001 for some occupational groups (types of workconsidered as arduous) and was extended to all employees beginning inJanuary 2002. Nine pension funds have been licensed so far, seven ofwhich have already been active in administrating voluntary private pensionfunds (covering about 10 per cent of the workforce) established since 1994.
Bulgaria’s financial markets are still underdeveloped even though themacroeconomic and institutional environment has improved consider-ably since the economic crisis of 1996-97. The introduction of a CurrencyBoard Arrangement and the linking of the Bulgarian lev to the deutschemark in 1997 have successfully depressed inflation and interest rates tolow and stable levels. Over recent years Bulgaria has enacted a largenumber of measures necessary to render its financial markets compatiblewith EU regulations during the accession process. However, theseregulations have not yet been fully implemented.
Although the banking sector is well developed in terms of liquidityand regulation, capital is invested mainly in low-risk governmentsecurities while only a small share of the banks’ money is loaned toprivate enterprises. It is not clear whether the low level of private sectorloans is due to a lack of demand because of high fees and unattractiveloan conditions, or driven by the banks’ high risk aversion.
The capital markets do not provide an alternative, as the financialinstitutions are yet to be fullydeveloped. The official segments (A, B, C – withdecreasing requirements as a precondition for being listed) of the BulgarianStock Exchange could only attract a small proportion of companies; indeed,most of them prefer to be listed in the free market (even though many wereeligible to be listed in the official sectors). Their reluctance to seek access tothe formal sectors has been explained by high fees for intermediaries,auditing requirements, scant awareness of the advantages of being listed inthe formal sectors, and the unfavourable tax treatment of capital gains onprivate securities. Consequently, the bulk of trade is carried out in the freemarket; as a result, pricing mechanisms lack transparency.
Box table 6.5.1 Market capitalization and volume of trade, Bulgaria, 1990s
Market capitalization (%) Volume of trade (%)
Segment A 2 1
Segment B 0 0
Segment C 9 30
Free market 89 69
Total 100 100
Source: Bulgarian Stock Exchange, cited in Ulgenerk and Zlaoui (2000), p. 20.
386
Financing social protection

avoidance of large macroeconomic swings. In this regard, the outlook for EUaccession countries is quite good. Indeed, thus far they have been movingsuccessfully from controlled to market economies, and implementation ofrather stable macroeconomic policies in recent years has led to the rapiddevelopment of a liquid short-term bond market. However, a long-term bondmarket, which would be the primary focus of pension fund investments, has yetto develop. As regards most non-accession countries, the likelihood of thishappening in the near future is low.
For the funding of pensions, it has been argued, it suffices to develop afixed-income securities market only later on, as the pension schemes are atpresent immature and do not yet need to pay any instalments to theirmembers. If one considers the development of long-term bond marketsinevitable then this pension-funding strategy appears rational with respect tolater annuitization. Experience shows, however, that it was always andeverywhere the State – by way of its deficit-financing requirements – thatmassively supported the development of long-term security markets. Forexample, the volume of long-term government debt issued in the G4(Germany, Japan, United Kingdom, United States) over the period 1980–95was higher than the respective volume of private debt.70 Funded pensionsystems in these countries were able to take full advantage of this largeelement of primary market activity.
Meanwhile, the paradigm of most States with respect to financing theirbudgets has changed. Finance ministers are targeting surplus budgets, whichmeans not issuing long-term government debt any more. Therefore, thisinstrument may no longer be available in the future for pension funds oftransition countries, or only at reduced levels, putting them in a less favourable
In this situation, pension funds largely rely on government securities,as other long-term investment instruments do not exist or are associatedwith considerable risk. Although pension fund regulations would allowfor a higher share of other investments, some 57 per cent of pension fundassets is invested in government and municipal securities, and a third indomestic receivables on demand bank deposits (as of 30 September2001). Only 1.2 per cent of pension funds is invested in securitiesregistered for trading at the regulated securities markets. The dominanceof government securities in pension fund assets is associated withrelatively low returns. In addition, the hope that growing savings inpension funds would boost domestic capital markets and make capitalavailable to entrepreneurs has not (yet?) materialized.
References: IMF (2001b); Ulgenerk and Zlaoui (2000); USAID (2001); World Bank (2001b).
Box 6.5 (cont’d)
387
Investing social protection reserves

situation than their OECD-based counterparts during their start-up phasedecades ago. In order to safeguard ordinary workers’ incomes, one would haveliked to see the structure of the future bond markets emerge and become stablebefore a funding strategy is launched. Given the decisions taken, it should nowbe a political priority for the transition countries to parallel pension legislationwith establishing private bond markets, while complementing these with amarket for public long-term bonds.
As regards equity, it is generally agreed among financial market experts thatin almost all transition economies markets are still underdeveloped (seeClaessens et al., 2000). According to the World Bank, in the 1990s formal stockmarkets were set up in 20 out of 26 transition economies, and yet many of themare undeveloped or dormant, with generally low equity turnover. In the moreadvanced transition countries – Czech Republic, Hungary, Poland – marketcapitalization71 did not exceed some US$15 billion by the end of the decade.Among the members of the Commonwealth of Independent States (CIS), withthe exception of the Russian Federation, market capitalization was even lessthan US$1 billion and, expressed as a share of GDP, level with that of Estoniaand Hungary. As a consequence of low turnovers and small market volumes,information processing costs and contracting costs are high (see Fabozzi andModigliani, 1992, pp. 8, 17). Even assuming good progress in macroeconomicand legal reform, the market capitalization of all transition economies isprojected to be about US$150 billion, equalling just around 4 per cent oftoday’s global market capitalization. There are growth prospects for the marketsin Central Europe and the Baltic States, but under World Bank projections onlythe Polish financial market capitalization would exceed US$20 billion at thestart of the twenty-first century.72
Many transition economies still need to focus on developing the basicinfrastructure for a financial system, including stronger legal rights forcreditors and shareholders, better information, greater disclosure, well-governed institutional investors, and supportive public and private institutions.In many CIS countries it is inflation, large-scale expropriation and limitedtrust in contracts and institutions that discourage people from investing in anyfinancial assets. Furthermore, given their small size, most countries (exceptperhaps the Russian Federation) will find developing substantial stock marketsto be very costly. They should instead aim to develop their banking systemsand open up access to the international market for domestic borrowers. Apotent banking sector would also be the most effective way to foster thedevelopment of small and medium-size enterprises, which are the key toeconomic growth.
As long as financial markets in transition countries remain poorlydeveloped, pension funds will accumulate only slowly. The non-accessioncountries in particular have little chance of investing accumulating fundsabroad because their national currencies are not convertible. Keeping fundswithin national boundaries may be considered a development advantage at first
388
Financing social protection

glance, but it may easily turn into a severe economic disadvantage for workersas long as the local financial markets remain underdeveloped.
For some EU accession countries there might be an option of investingpension scheme reserves in the established EU markets, thus probably bettersafeguarding workers’ and employers’ contributions from fraud or other typesof misuse. These countries’ stock markets are not very likely to endureindependently but will probably merge with bigger European exchanges. Manycountries have already harmonized most of their financial laws with those of theEU. Moreover, corporations increasingly seem to use foreign jurisdictions tohelp define property rights. This part of financial market regulation puts EUaccession countries far in the lead of other transition countries.
6.7.3 Investment in support of national
development plans
In many countries, especially in the developing world, social protectionreserves have been used to support national development plans. Such policiescan be perceived as a special realization of possible asset managementstrategies like, for example, an SRI strategy (see section 6.6.4). If managedprudently, such policy approaches can be considered justified to the same extentas any other investment strategy. In reality, they have often been consideredconform to the investment principles stressed by the ILO, even if this was notalways the case.
The advantage of such policies has been seen in their twofold function ofpursuing a social security goal (building up pension entitlements, for example)together with a broader development goal which, if successful, in turn enhancessocial security. In simplifying to some extent, this approach was part of thepost-Second World War capital-led approach to international developmentaid. The 1994 World Bank publication on averting the old-age crisis can beinterpreted as a late replay of that policy approach – late because discussionswithin the international development community have long since gone beyondthe belief in simple linear development triggering effects of capitalaccumulation.73
In principle, the execution of such investment policies is conditional on thesolution of the same problems as discussed elsewhere in this chapter. Prioritymust be given to an adequate return on the investment at minimal risk andmaximum liquidity. High professionalism of fund management is required tooptimize the financial outcome for the stakeholders of the social securityscheme. Then, broader social and economic development aspects may come tothe fore.
National development plans often aim to build up, improve or maintainpublic or public–private infrastructure. The former context includes roads,bridges, hospitals, schools, and so on, while the latter involves public measures
389
Investing social protection reserves

in preparation for private tangible investments (‘‘technology parks’’). The ideais that all such measures in the long run broaden the taxation base because theyfoster economic growth and can thus be used to pay back the instalments,including interest, to the social security fund. Although theoretically attractive,in reality most of these approaches have failed, fully or in part, especially in theleast developed countries. Their failure can be laid at the door of poorgovernance, a concept already discussed in various sections of this chapter.
Investments in real estate are one example of a typical element of socialprotection reserves used in a national development plan. Many pension funds,especially in developing countries, seriously investigate or have embraced thisoption, for social reasons and in order to support national development. Suchinvestments are considered as a safe haven to protect workers’ contributionsagainst loss, since real estate is seen as constituting ‘‘real value’’.
The following few points are highlighted for consideration:
1. As with any other asset, the current value of a single house, apartmentbuilding, office building or a building hosting retail stores or other types of(industrial) business depends on the future flows of funds generated by thebuilding in question. The present value of a building may often greatlydistort the actual costs of construction. Even if these were high owing to thehigh quality of construction work and of the material used, the present valuemay be low: if business is down and the environment changes for the worseexpected rents will subsequently be low. Conversely, if the constructioncosts were low but monetary demand for apartments and office space ishigh, then the present value of the building is high because high flows offunds can be expected.
2. Net rates of return of investment in real estate very much depend on thespecific circumstances concerning the building. In any case, if theinvestment is made with the aim of selling the building right afterconstruction on a profit basis then sufficient demand needs to be effective.Demand can normally be ‘‘leveraged’’ only if an adequate financinginstrument was tailored to the needs of potential real estate buyers. If,alternatively, the aim is to retain property of the building over the longerrun (as is often the case with life insurance companies), then the initialgood quality of the property must be maintained over that period, for twomain reasons: (i) the owner wants to be able to increase the real rent fromtime to time – which the fund can do on a fair basis only if the real valueof the object increases; (ii) the owner may, in the longer run, want to sellthe real estate. In order to obtain a good price, the property must be ingood condition. In other words, investment in real estate is costly and therates of return to be expected are low. The overall rate of return may behigh only if one includes the amount to be cashed in once the building isfinally sold.
390
Financing social protection

3. Investment in real estate can be very profitable if it is part of a generaldevelopment plan for a community or a region. In this case initialinvestment costs (land, construction, infrastructure) might be low but realestate value increases subsequently if the surrounding area is developedpositively.
4. Investing in real estate for social reasons normally means that the institutionholding the property must be subsidized in one way or another. In suchcases, rents often have to be kept below cost-covering levels. This meansthat either maintenance cannot be financed at the required amounts or theowner of the property has to finance it out of ‘‘other’’ revenue, which – incase of a social security institution – might be general contribution income.Also, rents might be low compared to rates of return achievable if thecontributors’ money had been invested alternatively. This could, in turn,negatively affect benefit levels to be paid to the contributors at a later date.
The above points show the interdependence of the real estate market withoverall economic development. Contradicting deep-seated belief, it can beargued that real estate markets are also volatile but react differently from othermarkets, showing a higher turnover rate with substantial time lags on changes inthe relevant economic environment.
In general, private funds or insurance companies tend to hold only a limitedportion of their assets in this form. The Danish pension fund described inbox 6.4, for example, holds only 5 to 7 per cent of its assets in real estate.Institutions consider these investments to be steady and reliable, producing lowbut solid returns, if maintained well.
6.8 WHAT COMES FIRST: PENSION FUNDS OR
FINANCIAL MARKETS?74
Assuming that all over the world social protection financing will in future bebased increasingly on funding, primary markets will have to play a growing rolein attracting and successfully placing IPOs. Only if the new and growing75
pension funds meet a growing supply of assets on the primary and,consequently, secondary markets, will they be able to invest their stakeholders’resources at fair prices. Otherwise, financial markets might not be buoyantenough to meet the pension funds’ rising demand, and this might result in long-lasting price bubbles, possibly leaving pension fund contributors with falsehopes for high pensions on retirement.
For countries wishing to reform their pension system but lacking an efficientfinancial market sector, questions of reform sequencing arise. We will addresshere the advantages and disadvantages of introducing pension systems with amandatory fully funded tier in an environment of underdeveloped financialmarkets, which has been done recently in many Eastern European countries (seeMuller, 1999).
391
Investing social protection reserves

Imagine a country lacking all basic elements of a functioning financialsystem:
. no solvent banks and insurance companies;
. no organized markets for bonds and equities;
. no long-term financial instruments and annuity products;
. no experienced regulators and supervisors;
. no bankers, actuaries, accountants or lawyers;
. no rating agencies.
Introducing a fully funded pension system under these circumstances seemshardly feasible, as even PAYG social security systems would suffer fromadministrative deficiencies. It has been argued, however, that even in these‘‘non-starter’’ circumstances such a pension reform would nevertheless beadvisable, provided that three preconditions are met (Vittas, 1998, p. 2):
1. A strong, long-term and persistent government commitment to implementthe pension reform successfully.
2. Introduction of effective arrangements for the safe custody of pension fundassets.
3. Free access to foreign expertise.
The first implies a comprehensive reform approach, including a willingnessto address simultaneously and with equal rigour the issues of banking,insurance, capital market, as well as macroeconomic and fiscal reforms. It alsorequires that successive governments, even if representing opposite sides of thepolitical spectrum, commit themselves to the same set of reforms and move inthe same direction. If this is the case, then the other two prerequisites can beconsidered derivatives of the first.
If such an approach exists, the answer to the question ‘‘What comes first?’’is obvious: reform aimed at introducing funded pension schemes must not takethe lead – at best it can be parallel to the other required reform stringsaddressing the creation of functioning market structures.
In the political discussion, advocates and opponents of the introduction offunded pensions would apply different measures as to what aberrations from the‘‘ideal’’ market conditions are tolerable, whereas both groups would probablyagree that ‘‘patience and persistence [are] strongly to be recommended’’ (Vittas,1998, p. 6).
The proponents of funded schemes would allow for relatively highaberrations. For example, they would be satisfied with a reform prerequisiteconsisting of a commitment to macroeconomic stability and accompanied by asmall number of sound and well-functioning banks and insurance companies.
392
Financing social protection

In addition, they would argue that the relatively limited resources of pensionfunds could initially be invested in treasury bills and/or bank deposits; as fundsincreased, growing portions could go into long-term government bonds andcorporate securities.
The opponents, on the other hand, would allow for only small aberrations.They would demand proof of a reliable commitment to macroeconomicstability and require more than just a partially functioning banking sector.Depending on the country’s particular circumstances, meeting these conditionsmay take a long time. Yet, the opponents are concerned that, once the fundedscheme is introduced, reversing to different pension systems would be possibleonly after accepting high additional costs for the stakeholders of the old as wellas the new system.
Concerning the commitment to stable macroeconomic policies in order tosecure the purchasing power of pension benefits, the proponents would arguethat the time when governments used high inflation to solve their debt problemsis definitely over and done with. The opponents would answer in turn that somecountries in transition and some developing countries, especially in Africa,have not yet shed this policy (or, as is the case in some transition countries, thatfailure was due to limited experience and lack of success on the part ofinternational advisers).
From the point of view of economists stressing the innovative role ofentrepreneurs, the discussion on the installation of an effective capital marketand its sequencing is an artificial one. They would argue that if soundentrepreneurship exists (which is a prerequisite for a functioning marketeconomy, anyway) then expanding businesses would automatically attractfinancial investment and the capital market would evolve accordingly. In theabsence of entrepreneurship the accumulated monies could not be pro-fitably invested, in which case instituting funded pension schemes would justdeprive contributors of consumption, thus weakening demand and reducingbusiness incentives. Then, in closing the circle, investment opportunities wouldbe lost.
In this context, the importance of entrepreneurship as a prerequisite forthe development of financial markets should not be underestimated. Enlarginginvestor portfolios and stock market volume is only viable in an environmentof entrepreneurs creating new business. Indeed, no serious government wouldstart ‘‘funded pension’’ reforms in order to develop financial markets.76
Developing financial markets is not the task of pension funds, but the roleof entrepreneurs. If entrepreneurs do not have sufficient own resources thendemand for financial means to bridge temporary non-liquidity will auto-matically become economically significant. Therefore, it is not so muchthe short supply of savings that limits the development of financial marketsin these countries, but the (excessively) small number of entrepreneurs thathave sustainable business ideas and are ready to take on the risk of businessfailure.
393
Investing social protection reserves

6.9 SUMMARY
Equity markets were never far from the spotlight in recent years for they seemedto promise dizzyingly high returns on investments, especially in the form ofwindfall profits. Not surprisingly, they also attracted the attention of socialprotection as they appeared to offer the possibility of improving the income andwealth distribution of societies by broadening ownership participation of labourin capital. However, past performance of individual assets – although followingan upward trend for the overall markets – was quite volatile, putting equityamong stakeholders of pension funds at high risk. Whatever calculation methodwas used, all established stock indices showed very strong increases over theperiod 1980–2000, but also a steep decline since 2001.
This volatility should be kept in mind when pushing social protectionreforms in the direction of more funding. The risks involved with stockinvestments have to be carefully taken into account when setting up andreviewing rules on the extent to which stakeholders’ contribution may beinvested in stocks and securities, for example. The development of the DowJones Index over the last 20 years and its nosedive in 2001 (together with theindices of most other exchanges around the world) reaffirm the findings set outin box 6.2.
Contrasting the short-term volatility argument of equity with a long-termview, the attractiveness of stock investment seems to be reinforced. The annualreal return of equity assets for almost two centuries, from 1802 to 1998, was 7per cent on average (Diamond, 1999, p. 5). With the latest rise in stock prices,equity investment accounts for a substantially smaller dividend return than thelong-term benchmark, as dividend payment remained at the same level. Toreconcile the short-term observation with the stable long-term prospects, eithera rise in GDP growth or a drop in stock prices (according to the Gordonformula) would need to take place. Assuming a ten-year period to adjust from acurrent 3-per cent dividend yield to a 7-per cent return thereafter, stock pricesare calculated to decline by 33 per cent (ibid., p. 13). Yet, apart from a dramaticdownturn in stock prices restoring them to historical levels, it would also befeasible to assume lower rates of return for an extended period, abandoninghistorical data values.
Policies promoting large-scale introduction of funded pension systems,especially during their accumulation phase (that is, before maturing), implicitlyor explicitly rely on the long-term existence of primary markets. In other words,they rely on the continued readiness of the owners of fixed assets to go public.If for whatever reason the primary markets were to dry out, then pension fundswould have to invest in secondary markets only. In countries without adeveloped banking system77 through which investment could be channelledinto attractive investment projects, alternately to primary and secondarymarkets, pension funds are set to compete with other private and institutionalinvestors. The latter could easily be crowded out of these markets, given the
394
Financing social protection

enormous purchasing power of pension funds.78 It could be expected that assetprices rise and returns on investment would be limited. Generally, the marketwould be distorted once the ‘‘big players’’ come on the scene.
The volume of big pension funds raises concerns of a shift in ownership andhence in control of national tangible assets. For illustration, sample data ofemerging markets’ private long-term debt and equity issuance are comparedwith invested pension fund contributions. Pension funds may raise 2.5 per centof GDP in contributions under the assumptions of a labour income share of 50per cent of GDP, a contribution rate of 5 per cent of wages and full compliance.Under slightly changed assumptions of a labour income share of 40 per cent anda 10-per cent contribution rate, the collected funds to be invested annuallywould even account for 4 per cent of GDP. Such funded pension schemes couldwithout difficulty absorb all IPOs, thus gradually monopolizing ownership inthe economies. This scenario could easily come to pass, especially in transitioncountries. If annual supply of savings is higher than annual IPOs, then pensionfunds would be competing on the secondary markets for financial instrumentsissued earlier, again contributing to an insidious monopolization of theeconomy.
A checklist of questions for financial and social policy analysts
When dealing with the issue of investing social insurance reserves or ofimproving such investments, answers to the following list of questionscould be helpful prior to action:
1. What is your country’s general economic situation? Is growth steadyor volatile? Labour productivity? Inflation rates? Exchange rates?Convertibility of your national currency?
2. Does your country have a formal financial market? Who, institution-ally, are the financial intermediaries – banks, stock markets? Howactive is the primary market? Are statistics about domestic IPOsavailable? Are the main issuers public or private? Secondary market:Level of market capitalization in relation to GDP? Liquidity: Marketturnover?
3. Are the formal markets in your country regulated and actuallyoperating according to international best practice?
4. Investment policy guidelines: Does your institution have to supportactively (through its concrete investment decisions) national devel-opment goals? How independent is your institution with regard to itsinvestment decisions? Do written investment guidelines exist? If so,have these been made ‘‘tangible’’ by (a sequence of) investmentstrategy papers?
5. Analytical resources I: Does your social security institution haveinstitutionalized (continuous) analytical capacities available (oraccess to such capacities at reasonable cost) to carry out financial
395
Investing social protection reserves

Notes
1 This proportion of the collective amount would normally be transferred if the individual changesfrom one scheme to another, for instance as a result of relocating abroad, provided that the two countrieshave concluded a respective bilateral agreement.
2 The terms ‘‘deficit’’ and ‘‘surplus’’ unit are used here in a broad sense: a unit can be in a deficitposition even if it has a net surplus of financial wealth but nevertheless requests capital on the financialmarket as it is not ready (for whatever reason) to use its own resources for investment purposes.
Further reading
To find out more about:
. Financial markets, their functioning, their interaction with the realeconomy, valuation techniques and the like, you should read at leastone of the following two books:
– Fabozzi and Modigliani (1992)
– Bodie et al. (1996)
. Turn-of-the-millennium problems relating to and links betweensavings, institutional investors and financial market developments,see:
– Catalan et al. (2000); Claessens et al. (2000); Day and Jamieson(1980); Mathieson and Schinasi (2001), Chapter III: EmergingMarket Financing; Vittas (1998)
. Investor protection at formal financial markets, turn to La Porta et al.(2000).
market analyses, nationally and internationally, on a permanentbasis?
6. Analytical resources II: Does your social security institution haveinstitutionalized (continuous) analytical capacities available (oraccess to such capacities at reasonable cost) to carry out economicresearch (business cycle and structure of the economy, its competi-tiveness, growth prospects, either in toto or in segments) on apermanent basis?
7. What are the pros and cons of managing investments in-house?Should investment management rather be outsourced?
8. Your institution’s liquidity needs: How much of your fund’s reservescan be invested long term (equity, real estate), and how much needsto be kept in money-market instruments? Is a clear pattern of futurechanges in the institution’s liquidity needs readily available?
396
Financing social protection

Similarly, a unit can be in a surplus position even if it had to borrow the liquidity from a third party.Therefore, the two terms do not relate to the profitability or financial standing of the unit.
3 For a further illustration, see Fabozzi and Modigliani (1992), pp. 5–6.4 Some actors on financial markets do not match the characteristics of entrepreneurs, e.g. consumers,
banks (in their function as intermediaries on financial markets) and governments, but they do take outloans. These are then serviced through redistributed asset funds, which – in principle – are raised byentrepreneurs.
5 In the case of a credit contract, the probabilities stated would indicate the likelihood of repaymentof the principal and interest on the amount transferred.
6 In modern economies the bulk of investments are financed directly out of retained profits and notthrough the financial markets.
7 In fact, the stable existence and trade of such instruments is one indicator for efficient (i.e.transaction-cost minimizing) markets. Whether market institutions are efficient depends on opportunitycosts determined by prevailing behavioural codes of business conduct, market size and the legislativesetting. Historically, the existence of banks and other financial intermediaries may be ‘‘rationalized’’ ondifferent grounds.
8 See, for example, La Porta et al. (2000).9 A useful list of fixed assets may be found in Commission of the European Communities et al.
(1993), p. 223.10 For simplicity’s sake, here we disregard any ‘‘pathological’’ cases of non-proven / non-existing
ownership rights.11 Also, not all such contracts (claims) create a positive income stream to their holders.12 In this context, the word ‘‘financial asset’’ is used here in the broadest, unspecified sense. To
become a financial asset that would be accepted for trade on regulated markets, such an unspecifiedfinancial asset has to fulfil a certain minimum set of safety criteria.
13 In principle, these considerations are true not only for market economies but also in relation to theformer communist countries (including the few still existing). In these latter cases one can say that therespective legislation (stipulating people’s ownership of the means of production) is the ‘‘financial asset’’reflecting value and ownership of the (totality of) fixed assets of the socialist economy. Of course, fixingthe ‘‘value’’ could turn out to be an impossible mission.
14 This is a strong statement, which (empirically) holds true only in the longer run. It takes intoaccount (and explicitly acknowledges) the existence of stock market ‘‘bubbles’’, but argues that there arein-built market mechanisms forcing bubbles to implode, sooner or later, in order to re-establish the statedmatch between the ‘‘real’’ and the ‘‘paper’’ value of the economy. We consider the 2000–01 fall on themarkets a proof of this assumption.
15 Readers unfamiliar with the basic economic flow-of-funds theory are advised to refer to a modernstandard textbook on macroeconomic theory. This will not only help them to follow this discussion moreeasily but will also broaden the perspective of all those who are or will be responsible for the investmentof social protection reserves in the financial markets.
16 Fixed assets include: dwellings; other buildings and structures; machinery and equipment;cultivated assets (land, trees and livestock); mineral exploration; computer software; entertainment,literary or artistic originals.
17 This is of course a simplification: GDP is in fact the difference between output and input, both ofwhich have to be meaningfully defined. Also, GDP is only the most commonly known and used measure ofthe results of economic activity. Details on other measures may be found in Commission of the EuropeanCommunities et al. (1993), pp. 121–156.
18 Determining theoretically what constitutes a ‘‘fair’’ share of remuneration attributed to theproduction factors is a classic problem of economic theory.
19 Again, we simplify. Savings, in a national accounts context, is all disposable income (production)not used for consumption. For example, unsold production is considered ‘‘investment in stocks’’(¼ savings). Such details are disregarded here.
397
Investing social protection reserves

20 It is assumed that capital stock growth is a result of investments moving along the ‘‘technologyfrontier’’, i.e. the most recent technology affordable.
21 von Hagen and von Stein (eds.) (2000), p. 412, Figure 94.22 Aylward and Glen (1999), Table A.1 (Primary Market Activity).23 In theory, entrepreneurs invest their monies in those investment projects which promise the
highest returns. If the business is not their own, they might lend their monies to the higher-yield project,and, at the same time, may find an investor for their own projects outside their own business (be itbecause of different risk-aversion considerations, lack of information on third party, etc.). This argumentis sometimes used to explain the high observed amounts of gross capital flows, yet small net capitalflows.
24 One of the most creative contributors to theories about the mutual roles of innovativeentrepreneurs and financial markets in modern economies was Joseph A. Schumpeter. In his Theory ofEconomic Development (1911), Schumpeter basically argued that entrepreneurs create technical andfinancial innovations in the face of competition and falling profits, and that it is these activities thatinduce economic growth.
25 An investment is here seen as successful if it creates income that at least permits the amountborrowed plus interest to be paid back. This is a minimum requirement. Normally one would expect thatan investment create income to the extent that also allows for a profit that can be (partially) reinvested.
26 If private and public entities compete over resources, crowding-out effects are immediatelysuspected. Creditors are likely to prefer sovereign debt because non-servicing and default risks are lower(depending on the debtor’s reputation), yet public investments do not necessarily have to follow the samereturn-maximizing principles as private business investment. Public debtors may attract investmentsbecause they offer better interest and servicing conditions but may have inferior efficiency recordscompared to private businesses, leading to an economically sub-optimal allocation of investments.
27 It might be noted that private insurance companies’ moves during the 1990s aimed at introducingprivate unemployment insurance on a fully funded basis have come to a halt. This is because, unlessfinanced on a social solidarity basis, members’ individual contributions would have to be prohibitivelyhigh.
28 There is a theoretical argument that supports this expectation by stating that companies, once theyhave gone public, are bound to be especially profitable also in future because otherwise they would losemarket value and thus no longer be able to finance business expansion by tapping the savings of privateand institutional investors.
29 This is what obviously happened to the stock prices of the ‘‘new economy’’ during the late 1990s.30 The process of correcting such price bubbles can result in dangerous economic situations.
Examples of such downward price corrections may be found in Japan (which has been sufferingeconomically since the beginning of the 1990s from the earlier price bubble on the domestic real estatemarkets) and the many banks and other ‘‘global players’’ whose national and international investmentstrategies were based on the assumption of further rises in stock market indices. In the face of failedexpectations since 2001, they are now in a process of writing off the assets in their balance sheets; insome cases this has had dramatic implications for their profit development and, what is especiallyimportant from a social policy viewpoint, resulted in substantial cuts in employment.
31 The case where no buyer is found for all or parts of the issuance is, in this context, equivalent tonon-issuance.
32 Related concerns have been indirectly expressed by the World Bank. With respect to the Asiancrisis in the late 1990s it was argued that it is because of budget surpluses that governments fail to play aleading role in developing fixed-income markets. See Del Valle Borraez et al. (1998).
33 Most often, the functioning vs. malfunctioning of a country’s economy and the effectiveness vs.failure of its financial intermediaries are positively correlated.
34 For further details see, for example, Day and Jamieson (1980), p. 199.35 See ILO/ISSA (1997), pp. 101–103.36 See Bodie et al. (1996), pp. 395, 406–407.
398
Financing social protection

37 For example, http://www.senate.gov/,gov_affairs/012402partnoy.htm provides a very interestingaccount of the Enron story, including some realities of United States financial markets at the beginning ofthe twenty-first century.
38 Elisabeth Hehn (ed.) (1998), p. 294.39 ‘‘Risk’’ is here represented by the standard deviation of the average trend of the equity index.40 Finding out such relations by fine-tuning and applying formal mathematical models is one of the
main tasks of financial markets analysts. Concrete model versions belong to the usually classified assetsof financial analyst companies.
41 For the details of mathematical statistics the reader is advised to refer to any modern standardtextbook on empirical and mathematical statistics and probability theory.
42 For details see http://www.aimr.com/standards/pps/.43 For details of calculation methods see, for example, Bodie et al. (1996), pp. 60–67.44 There is no single definition of the term ‘‘blue chip’’. However, it is used to describe well-known,
brand-name companies that have reported growth and sound profits and paid dividends reliably over thelong term. Blue chips are considered safe investment opportunities, offering a stable development ratherthan peak yields.
45 The Wall Street Journal, May 3, 1991, quoted in Bodie et al. (1996), p. 66.46 The geometric mean, by construction, always produces results smaller than those calculated by an
arithmetic mean.47 This section is largely based on the content and structure of Bodie et al. (1996), Chapter 17:
‘‘Equity Valuation Models’’, pp. 521–559, which provides excellent reading.48 The ratio between market price and replacement cost of a firm is James Tobin’s famous ‘‘q’’.49 The risk-adjusted concept starts from the observation that an investor in stocks expects higher
returns from this investment than from a ‘‘safe’’ investment (e.g. bonds). Thus, simplified, k equals therisk free interest rate of, say, government bonds plus a risk adjustment that depends on the degree of riskwhich the stock in question adds to the overall market volatility. For details see Bodie et al. (1996),pp. 236–265 (‘‘The Capital Asset Pricing Model’’ – CAPM).
50 Estimating D1, D2, D3, until infinity is obviously a tough job!51 For a proof of formula 6.6, see Bodie et al. (1996), p. 526.52 Bodie et al. (1996), pp. 528–536.53 For a detailed discussion, see Bodie et al. (1996), pp. 536–541.54 This section is based largely on Bodie et al. (1996), pp. 386–422.55 Principal repayment, the final payment made at the date of maturity, pays back the ‘‘par value’’ or
‘‘face value’’ of the bond.56 Although the percentage change in the market rate is one percentage point in both cases, and the
equivalent differential in the face value to a one-percentage-point change would give the same amount,for the above calculation it is the percentage rates which are set in relation to the base value, resulting innon-symmetric percentage change differentials.
57 For details and further reference, see http://unstats.un.org/unsd/cr/registry/regcst.asp?Cl=17.58 Accordingly, in case of a combined index both domestic and international macroeconomic
forecasts would have to be available.59 Notwithstanding legislation that might still regulate, for better or worse reasons, regional
investment decisions of public institutions or private institutions with a public mandate.60 The full text of the Convention is available at www.oecd.org.61 See Socially Screened Mutual Fund Statistical Summary: 1999 Report: Comparative statistical
information on 183 screened mutual funds versus unscreened funds, at http://www.socialinvest.org/areas/research/other/FundStats_1231-98.htm.
62 Depending on the screening criteria, up to 50 per cent of the stocks found in the S&P500 indexare excluded; consequently, the risk exposure of screened funds against unscreened funds seemsimmediate. Moreover, certain large companies that account for large-volume issuances are frequently
399
Investing social protection reserves

screened out of SRI-committed funds. The fact that entire industries (e.g. tobacco, oil producers) are notreflected in the funds adds an element of risk to the funds’ risk profile.
63 Social Investment Forum: 2001 Report on Socially Responsible Investing. Trends in the UnitedStates, November 2001, available at http://www.socialinvest.org/areas/research/trends/2001-Trends.htm.
64 Aylward and Glen (1999).65 This would probably also hold true if informal GDP were taken into account.66 See Mathieson, Schinasi et al. (2001), Chapter III: Emerging Market Financing, p. 51.67 Following Standard & Poor’s classification. For details on rating systems, see, for example:
http://www.britannicaindia.com/eb/spotdisplay.asp?spotid=991&pgid=3&cid=4.68 This section is broadly based on Scholz (2001).69 See Del Valle Borraez et al. (1998).70 See Aylward and Glen (1999), Table A.1.71 Market capitalization (market value) is the share price times the number of shares outstanding.72 By comparison, the balance sheet of Deutsche Bank Group accounts for 42.5 per cent of
Germany’s GDP (1999 figure). The amount of US$20 billion represents just 2.5 per cent of the Group’sbalance sheet.
73 The most recent proposals for North-South income redistribution seem to be getting greaterattention instead of being dismissed outright. See, for example, the ILO’s Global Social Transferinitiative (ILO, 2002c).
74 This section is largely inspired by Vittas (1998) but reaches significantly different conclusions. Itmay be interesting to recall that much of the general public’s devastating privatization experience in theformer communist countries of Eastern Europe and Central Asia during the early 1990s can be tracedback to the virtual non-existence and/or non-performance of primary markets. See, for example, Uvalicand Vaugham-Whitehead (1997).
75 Growing in terms of funds available for investments in assets.76 See, for example, Catalan et al. (2000).77 When channelling money of surplus units to deficit units, banks perform the same role as primary
markets.78 Here we disregard the possibility of direct investment in individually owned businesses.
Financing social protection
400

7FINANCIAL GOVERNANCE
This chapter completes the body of knowledge and the set of instruments thatfinancial planners and managers of social protection systems require in theirwork. Assume that the financing system of a national social protection system(NSPS) has been designed giving due consideration to the possiblemacroeconomic and fiscal effects, the right financial instruments have beenselected, and the management of the reserve is flawless. In short, all thetechniques and considerations developed in the previous chapters have beensuccessfully applied. What is left then for financial managers and planners todo? They need to make sure that the resources entrusted to the social protectionschemes or systems are used effectively and efficiently so as to avoid waste ordeficient delivery of promised benefits.
Inefficiency and ineffectiveness set off a chain of events that can lead to thedemise of the entire system. They undermine the credibility of any NSPS, andcredibility is a social protection scheme’s most important capital. The lack ofcredibility will trigger declining compliance which will in turn trigger financialproblems which will aggravate the credibility problem, and so on. One of themain shortcomings of many national social protection design processes, forexample, has typically been that the society in question was not made aware ofthe long-term natural cost increases along the maturity pattern described inChapter 2. Generous and inherently costly pension schemes were often initiatedwith low contribution rates which were fully adequate when the scheme wasstill ‘‘waiting’’ for its first pensioners to claim their benefits, but becameinsufficient once the scheme entered the steeper maturation phase. Necessaryhikes in contribution rates were too often delayed for political reasons, with theresult that ultimately the rate increases necessary to establish a new period ofequilibrium were so big that they were politically unsustainable. Benefits wouldthen deteriorate in an effort to contain costs, with often disastrous effects on thescheme’s credibility. The failure of a considerable number of schemes can betraced back to bad governance.
Even if inefficiency (i.e. waste of resources) does not lead directly to asystem’s downfall it might still have high opportunity cost in terms of forgone
401

social protection. There are social insurance pension schemes in somedeveloping countries with administrative cost ratios that exceed tolerablelevels by a very high margin. In some cases, halving these ratios through goodgovernance could free enough resources to finance a 50-per cent increase in theresource base of national public health schemes.
Financial or quantitative planners and managers are in charge of developingand employing the tools that help to ensure sound governance practices in allfinancial matters of social protection. Good governance in a broader sense is thesubject explored in this chapter.
Cichon and Samuel (1995, p. 2) define the term ‘‘governance’’ in the contextof national social protection systems as follows:
. . . we include under governance all consultative and decision-makingprocesses, institutional arrangements and managerial and administrativeaction by which social protection policies are designed, agreed upon,implemented and supervised. The definition encompasses the firstblueprints for a social protection system in government or otherinstitutions, the national consultation process, the legal enactment andfinally the managerial and administrative implementation and thenational and lower level supervision of the performance of individualsocial protection systems. Hence the term governance covers all policy,managerial and administrative means to make social protection work. Asystem of governance for a social protection system is a set of legal andinstitutional arrangements designed to achieve the following two mainobjectives:
(. . .)
. Determining a socially and economically acceptable level of socialprotection through democratic distributive structures.
. Ensuring that benefits are delivered effectively and efficientlythrough a democratically supervised administration.
For the purposes of this book, financial governance is considered as the setof all instruments of the overall system of governance of an NSPS that focus onensuring:
(a) effectiveness (that the social protection system delivers the level ofprotection envisaged by the law(s) and policy objectives);
(b) efficiency (that it does so in the most efficient way possible);
(c) sustainability (that it is financially, fiscally and economically sustainableover the long term and assists decision-makers); and
(d) transparency (that the use of resources in the social protection sector istransparent).
We are aware that this is a fairly broad definition and that it actuallyinvolves quantitative analysts (i.e. financial managers and planners) in allaspects of social protection governance. This is fully intended. Indeed, we
402
Financing social protection

believe that financial managers and planners have too often been excluded fromthe design and governance of systems and schemes, which is detrimental to thelatter’s performance. Ultimately they are the custodians of resources entrustedto social protection schemes that organize the transfer of these resourcesbetween different population groups.
To achieve social policy objectives, financial planners and managers havetwo sets of instruments at their disposal: legal and managerial.
The first type comprises all laws and regulations seeking to enforce socialprotection objectives set by a country’s parliament or government. Theseinstruments, aimed at the management and administration of the scheme, rangefrom the framework legislation setting out clear definitions of levels ofprotection to rules and regulations governing the investment of social securityfunds or the accounting system of social security institutions. Only when theobjectives and standards of good governance are clearly and measurablydefined can the effectiveness and efficiency of the schemes’ performance beensured. Financial managers and planners must therefore be involved already atthe design stage of the scheme and the formulation of the legislation to ensurethat the objectives defined remain objectively verifiable. The first part of thischapter thus provides an annotated and hierarchical list of legal instrumentsthat they have to use in order to carry out the tasks that have been assignedto them.
Managerial instruments, on the other hand, are planning and supervisoryinstruments used to manage and control the performance of schemes in respectof specific targets derived from the overall objectives set by the legalframework. These instruments generally:
(i) describe or project system performance in the form of statistics, accountsor budget projections, and
(ii) with the help of performance indicators, compare scheme or systemoutcomes or processes to chosen benchmarks.
The second part of the chapter provides a wide range of hierarchicallyordered managerial instruments. We do not expect each scheme to use them all.Our main purpose is to encourage planners to select and design a set ofinstruments that will both generate regular measurable information and help toassess performance.
However, more than the earlier ones, this chapter is in many respects aconstruction site. It does not offer ready-made answers. Still, difficulties in thedesign and application of sound instruments of financial governance shouldnot be used as an excuse for not attempting to develop governance systems.This chapter may be tedious reading, but beneath the surface is a fervent pleafor us all to work towards building good legal frameworks that set clearobjectives and indicators that will help monitor the achievement of socialpolicy aims.
403
Financial governance

7.1 BASIC LEGAL FRAMEWORK AND INSTRUMENTS
OF FINANCIAL GOVERNANCE
Legal instruments form the basis of any social protection system. They rangefrom basic framework legislation governing principal entitlements and benefitsto regulatory frameworks for their administration, enforcement and supervision.The most important role of a basic legal framework is to define the objectivesof a particular social protection system. From a governance point of view itthus defines the fundamental benchmarks against which the performance of thevarious schemes should be measured.
Specific legal instruments are necessary to ensure the effectiveness, viabilityand transparency of a social protection system’s financial governance, and theyare intimately linked to that system’s performance. Governance systems areextremely diverse, but a general typology can be established on the basis ofcertain common features.
Social protection schemes and systems have developed over time,influenced by traditions, social and cultural values, and social and economicchange. By the same token, the legal instruments that govern them haveevolved from simple, informal arrangements based on family, community andnon-profit relationships into complex social institutions that are constantlyextending their scope. This development has brought with it an increasinglyintricate legal structure, particularly in view of the growing trend towardsmixed (public–private) provision of social protection programmes.
7.1.1 Framework legislation and relation to
other legislation
Some countries establish the legal foundations for different aspects of financialgovernance – for example, benefits and financing – in their own nationalconstitutions. Others have developed a body of specific legislation to safeguardcitizens’ rights to social protection. In general, sooner or later all countriesestablish comprehensive legislation to cover different types of social risks.In the United States, for example, the 1935 Social Security Act was a responseto economic insecurity generated by the Great Depression. That year, twonational-level social security programmes were established to mitigate the risksof old age and unemployment. The various states also provided grants toimplement means-tested programmes, along with other general socialassistance programmes. Financing for the social protection programmes forold age and unemployment was also included in this comprehensive legislation.
Another important aspect of financial governance involving the legalaspects of social protection systems arises from the country’s own institutionalstructure. Countries that have developed from the start as unified nations (thatis, as single entities) tend to have less fragmented legal systems, whereas
404
Financing social protection

countries based on federations are more fragmented. Many of them havenonetheless managed to create national legislation establishing mechanisms forcoordinating social protection programmes and making their benefits portable,particularly for migrant workers. This issue has taken on new importance in thecontext of globalization and international integration since as a result of thesetrends workers and their families will, during their lifetimes, belong to differentlabour markets governed by different legal regulatory frameworks. The problemof harmonizing these frameworks and making them compatible is of growingconcern.
The decentralization of social protection systems is another relevant legalissue, with important consequences for system performance. The larger the poolof people sharing risks, the more viable insurance coverage is likely to be.Moreover, one of the traditional objectives of social security – namely, theredistribution of income – would be badly compromised if programmes werenot managed and coordinated in a centralized fashion. According to publicfinance theory on fiscal federalism and decentralization, this function should beperformed by the federal government. Legislation should thus favour unifiedschemes in order to reduce potential inequalities and inequities resulting fromsystem fragmentation.
Another relevant consideration has to do with ensuring that socialprotection and other types of related legislation are both coordinated andcoherent in terms of legal jurisprudence. Because programmes are composed ofan interconnected set of social insurance and social assistance programmes,some aspects of their enforcement and regulation can generate institutionalconflicts. Thus, some social protection programmes (for example, pensionsystems managed by private entities) nonetheless involve the participation ofpublic institutions in their regulation, enforcement and supervision.
7.1.2 Regulatory framework for state-operated systems
In the context of state-run social protection systems, relevant regulatory issuesbasically involve accounting and auditing procedures, financial reporting, andsupervision. Thus, regulations focus on establishing a management-adminis-tration and control structure that seeks to minimize any deviation from theobjective of the common good.
7.1.2.1 Legal set-up
Some social protection programmes can provide significant elective benefits.This is a temptation for the State’s political bodies to pressure the institutionsmanaging these programmes to reassign resources for purposes other than thosedefined legally. Programme objectives may also be distorted when the budgetof the managing institution forms part of the general public budget and isconsequently subject to national fiscal policy objectives.
405
Financial governance

In this sense, the design of an administrative system that is legally independentof political interest groups and allocates its budget on the basis of programmeobjectives is crucial to the good management of state-run social protectionprogrammes. A case in point is the Social Security Administration (SSA) in theUnited States. This is the body responsible for administering mandatory publicprogrammes such as old-age, disability and survivor pensions. The SSA has beenfunctionally and financially integrated in the government system since the late1930s, and as a result its benefit programmes and institutional development werealways closely affected by the vicissitudes of governmental fiscal policies. Tosolve this problem, in 1994 Congress and the executive branch agreed on a newlaw designed to give the SSA financial and managerial independence. It providedthat the service would be headed by a commissioner appointed by the presidentfor a six-year term, subject to Senate approval.
In the United Kingdom, public social security programmes are run by theDepartment for Work and Pensions (DWP), which is a governmental bodycreated from the Department of Social Security (DSS) and parts of the formerDepartment for Education and Employment (DFEE). Although this adminis-trative body is part of the government, a series of institutional safeguards havebeen put in place to ensure that it is managed in accordance with the legallyestablished objectives of the common good. The 1980 Social Security Act thuscreated a committee independent of government and sectoral interests which isresponsible for advising the DWP and many social security programmes onmatters pertaining to the public interest. The committee’s functions include awide range of social security programme reviews, which serve as the basis forregular reports and analyses concerning the performance of these programmes.The committee is formed by members appointed in consultation with repre-sentatives of workers, companies, and social security authorities themselvesfrom the governments of the different countries that make up the UnitedKingdom. Moreover, the review and reporting process is carried out bycompetent technical experts widely recognized for their experience with therelevant issues. The committee is also subject to a code of practice and a registryof interests, in compliance with the standards established for advisorycommittees (SSAC, 2002). In addition, actuaries with the Government Actuary’sDepartment (GAD) regularly evaluate DWP-managed social security pro-grammes. The GAD carries out actuarial evaluations of the assets and liabilitiesof DWP-managed programmes when asked to do so by the DWP or Parliament.
In Latin America, social protection programme administration has tradition-ally been the province of public-sector or semi-public entities which in some casesare governed by bipartite (employer–worker) or tripartite (State–employer–worker) bodies. This institutional structure was designed to ensure that managersmake decisions that are consistent with the common good. However, the systemproved ineffective on many occasions. As a result, social protection programmesoften departed from their objectives, a tendency further aggravated by policy-makers’ inability to implement sanctions against negligent or corrupt managers.
406
Financing social protection

These problems, together with economic and demographic factors, promptedradical reforms in most countries. The institutional and financial redesign of socialsecurity programmes focused largely on introducing privately managed schemes.
7.1.2.2 Audits and controls
Another aspect of state-run systems is management risk. The ability of apublicly managed programme to achieve its objectives is sometimes taken forgranted. However, it seems clear that achieving goals is far from automatic andthat consequently instruments for measuring and evaluating results andcorrecting inefficient methods are essential.
Supervision of state-run social protection systems must take place on twolevels: one is accounts and procedures, where supervision focuses on formalaspects and on how well the required functions are performed; the other levelinvolves necessary technical supervision that focuses on evaluating therelationship between the resources used and the results achieved, therebymeasuring and evaluating programme efficiency. Public institutions are usuallysubject to a more or less generalized system of accounting audits, designed toprevent or punish inappropriate use of resources.
Nonetheless, any effort to generate management indicators for public bodiesmust first resolve significant methodological difficulties, among them thebroadness and ambiguity of the definitions of objectives. Similarly, whereproducts or services are provided free or significantly subsidized, beneficiariesare not always able to provide a suitable expression of their value since noexplicit individual transaction has taken place. Moreover, the technical super-vision or evaluation of social protection programmes is complex, especiallywhen programmes are not managed by qualified, specialized independent bodies.
In the United States, the SSA regularly reports on its management in anannual, public Performance and Accountability Report. The United Statespublic pension system, along with other programmes, is regularly evaluatedfrom an actuarial perspective as well. A board of trustees prepares an annualreport on the Federal Old Age and Survivors Insurance and Disability TrustFunds, which includes medium- and long-term projections (SSA, 2002).
Another element that helps control management risk is the obligation topublish wide-ranging statistical reports, thereby facilitating research andanalysis by independent bodies such as universities and specialized studycentres. In this way, irregularities become apparent and problems in themanagement of social protection systems are more easily detected.
In the United Kingdom, the National Audit Office (NAO) – a body inde-pendent of the government – audits all government departments and agencies,presenting reports to Parliament that assess the effectiveness and efficiency withwhich public resources are used. These reports cover the social protectionsystem, especially public old-age, disability and survivor pensions, whichconsume a significant and growing portion of fiscal resources (NAO, 2002).
407
Financial governance

7.1.3 Regulatory framework for social
insurance schemes
Social insurance, as a form of organized social protection, seeks to distributethe risks covered among all insured individuals. It also permits the establish-ment of benefits that are not necessarily proportionate to contributions, thushelping to correct income inequalities.
Social insurance may be administered by public or private (company oremployee representatives), bipartite or tripartite entities, with each type oforganization offering different administrative advantages and disadvantages.However, regardless of how social security is managed, the public interest orcommon good remains the supreme criterion for ensuring suitable management,which directly or indirectly also affects public opinion and hence programmelegitimacy. To control the risk of ineffectiveness or fraud in these programmes,governments create specific regulations and monitoring and enforcementmechanisms, in addition to the evaluations and monitoring mechanisms towhich the insured or their delegated managers may have access.
States attempt to prevent inefficiency and fraud by regulating insuranceprogrammes. An interesting example worth mentioning in this context is theChilean social security system covering occupational hazards and diseases. Thissystem was created in the mid-1960s and its management assigned to non-profitmutual organizations; or, alternatively, in the case of a single companyemploying 2,000 or more people and meeting certain solvency requirements,the company itself could request authorization to manage its employees’insurance scheme. In the latter case, the company adopts a ‘‘self-insurance’’strategy. Thus, the same law that created the insurance provides for itsregulation and supervision by a single independent public entity called theSocial Security Superintendency (Superintendencia de Seguridad Social),which defines mandatory financial and accounting standards to be followed byinsurance managers, and is also responsible for enforcement.
7.1.4 Regulatory framework for mandatory private
insurance schemes or occupational schemes
The regulation of mandatory private insurance or occupational schemes isprobably the area that has generated the most attention in recent times withrespect to public policies relating to financial governance. Pension and healthcare programmes have become the object of intensive structural reforms withthe introduction of private management in many developing countries,particularly in Latin America and Eastern Europe. However, the subject isintensely debated in developed countries as well, including Germany and theUnited States, which are also discussing pension system reform.
The recent crises in many companies, particularly in the United States, haveled governments to review regulations concerning corporate governance,
408
Financing social protection

including occupational pension plans. One of these high-profile cases involvedthe recent collapse of the Enron conglomerate in the United States, whichcaused enormous losses to workers with occupational plans. Also in the UnitedStates, the performance of state public-employment pension plans has provensensitive to the financial governance structure resulting from regulation. Forexample, Useem and Mitchell (2000) found that financial governance policies,especially independent performance reviews, affect the performance ofinvestments and hence the level of social protection that affiliates willaccomplish. Under the auspices of the OECD, the International Network ofPension Regulators and Supervisors (INPRS) has developed Fifteen principlesfor the regulation of private occupational pension schemes. These generalguidelines (OECD, 2001d) also provide useful guidance on the contents ofregulations for private occupational schemes. The most important financialelements are developed further in the following paragraphs.
7.1.4.1 Regulation of private mandatory pension systems1
The financial regime for private mandatory pension systems generally involvesindividual capitalization and its management by private entities in the form oflimited companies set up specifically to manage pension funds and theirbenefits. A specific law governs the functioning of the system, while a stateregulatory body responsible for enforcement and supervision, generally calleda Superintendencia in Latin America, establishes specific regulations andstandards. Moreover, the system enjoys the judicial protection afforded bylegislation governing securities markets and private companies. Similarly, thegeneral laws governing commercial financial entities protect investments in thefinancial system. Thus, regulation and supervision not only allow the State toguarantee minimum benefits, but they are natural complements to the state-imposed requirement that workers contribute to the pension plan.
Systems are designed to keep pension funds secure. They do this by threebasic means:
(i) separating pension fund assets from those of the managing entity;
(ii) requiring that managers maintain assets (reserves) equivalent to apercentage of the amount of resources under management, guaranteeing(in some cases) a minimum profit level; and
(iii) requiring management entities to register as legally constituted companies.
The main regulations governing the pension system fall into two categories:financing and information/advertising.
Financial regulation
Financial regulation aims primarily to control risk assumed by pension fundsand protect them from fraud. To do so, regulations define eligible financial
409
Financial governance

instruments, risk ratings and related factors, investment limits, authorizedmarkets, custody of securities, privileged information and conflict of interest,foreign investment, accounting methods, and how investments are valued.
Authorized financial instruments. Pension fund resources can only beinvested in financial debt instruments, capital instruments and their derivativesthat are expressly authorized by law. The main requirement for all theseinstruments is that they must be publicly offered. Thus, they must be registeredin the appropriate public registry, and information on them must be available toboth the capital market regulatory body and the public.
Risk rating. In general, all debt issues receiving pension fund investmentnot issued by the State, including securities issued by financial entities, aresubject to a risk rating. The rating is conducted by private, controlled agencies.In general, these are affiliated with the main international risk-rating agencies.
Limits to investment. In order to limit the amount of risk assumed bypension funds, the make-up of the investment portfolio is subject to several typesof limitation on investment, which are set by regulatory authorities within a rangeestablished by law. In general, all limits on investment are expressed as ceilings,so there are no compulsory investments. Limits can be based on different criteria,categorized by financial instrument, issuer, specific risk (for example, real estatesector), group of instruments, or issues associated with the pension fund manager.
Authorized markets. Financial instrument transactions that involvepension fund resources can only be carried out in formal primary or secondarymarkets. This ensures that instrument buyers and sellers come togethersimultaneously to determine prices; it also guarantees that their transactionshave the benefit of publicly available information, formally establishedmechanisms for negotiating instruments, and explicit internal regulations.
Custody of securities. All instruments representing pension fund invest-ment must be held in the form of custody specified for this purpose anddetermined by the regulatory body.
Privileged (insider) information and conflicts of interest. To avoidconflicts of interest between pension funds and their managers, as well asinappropriate use of insider information by the latter, financial regulationcreates a set of safeguards, including the following:
(i) A stricture prohibiting pension fund managers from divulging informationon fund investment decisions or using it for their own benefit or that of athird party; the law governing the securities market describes andpenalizes such conduct as the use of privileged information.
(ii) Procedures for electing the candidates for whom pension fund managersmust vote when they elect representatives to the boards of directors ofcompanies in which they hold shares.
410
Financing social protection

(iii) Internal control systems for pension fund managers, which must beexternally audited in order to ensure compliance with conflict-of-intereststandards.
Investment abroad. Investment abroad is subject to regulations stipulat-ing eligible instruments, limits on investment per issuing entity, authorizedmarkets, risk rating, and custodial conditions.
Accounting and establishing the value of investment. Specific regula-tions govern the accounts of pension funds and their managers. At the sametime, the value of pension fund assets is generally determined on a regular andstandardized basis according to the economic or market value of the invest-ments. This system, applied uniformly to all funds, avoids undesirable transfersof wealth among system affiliates as the result of deposits and withdrawals fromindividual accounts. These regulations also establish safeguards for privatelyadministered compulsory pension savings.
Regulations governing information/advertising
Ensuring the accuracy of the information and advertising issued by pensionfund managers is vital so that those insured can select the right company to managetheir funds. In general, managers must provide their affiliates with regular reportsthat include comparative tables showing the profitability of the various pensionfunds after payment of all commissions. These reports must also explicitly detailthe commissions charged by each manager for administration and insurance.
Advertising by pension fund managers is also subject to important regu-lations. For example, they are not allowed to use arguments or situations thatcould confuse their affiliates. Advertising projected rates of return is forbidden ifno mention is made of the commissions charged. The way calculations are madeand the periods covered in a profit promotion are also regulated, and wheneverthe rates of return achieved by managers of a specific fund are mentioned, theaverage profit ratio for the entire system must also be pointed out.
7.1.4.2 Regulation of life insurance companies
Private life insurance companies play an important role in at least one tier ofmany reformed pension systems that rely on mandatory savings. Regulation ofprivate insurance thus automatically becomes part of the overall regulatoryframework governing the NSPS. Life insurance companies complement thepension system by:
– providing disability and death insurance, and
– supplementing individual savings arrangements by offering annuities thatcan be contracted by insured persons or their beneficiaries once therelevant entitlement conditions have been met (e.g. attainment of legalretirement age).
411
Financial governance

In many countries, pension system reforms have played a decisive role inthe development of the life insurance industry. During the early stages, the mostimportant effect is the institution of collective insurance covering the risks ofdisability and death during the working life of the employee. Subsequently, asthe system matures, the annuity market becomes increasingly important.
In general, insurance companies must be commercial entities dulyconstituted in the country in which they operate, dedicated exclusively to theprovision of insurance, and holding a minimum capital determined by theregulatory authority. Moreover, they must have a permit to engage in the insur-ance and reinsurance business, issued by the body responsible for regulating,enforcing and supervising these activities.
The main regulations governing life insurance companies with respect topension systems cover the following aspects: technical bases, solvency,investment limits, model policies and clauses, prices, insurance inflationadjustment, premiums and indemnities, insurance sales, and state guarantees.
Technical bases
Without clear legal frameworks the annuity market is a particularly opaquemarket for the general public. Various technical elements (choice of a life table,pattern of indexation, modalities of the choice between joint versus single lifeannuities, etc.) have a direct bearing on the level of old-age pensions whensavings amounts are commuted into annuities. The incidence tables used tocalculate the premiums or benefit levels for old-age and survivors’ pensionshave a bearing on the contributions or benefit levels of invalidity and survivors’pensions. A minimum regulation on the permitted technical bases, for instancestipulating the mandatory use of a standard unisex life table, may avoid hiddenprofit-making by insurance companies and protect the pension level ofpensioners or the income of contributors.
Solvency
Insuring entities must maintain a required minimum level of equity that isusually related to solvency margins and limits on borrowing. The purpose of thesolvency margin is to ensure that the company has the resources necessary tocover unexpected costs resulting from deviations beyond the statisticallypredictable risks. To determine this margin, the regulating body establishes acertain percentage of additional reserves for each type of insurance. Borrowinglimits must be associated with equity and cannot be exceeded. Moreover, totalborrowing that does not generate insurance technical reserves cannot go beyonda specific percentage of equity.
Investment limits
The regulatory authority must protect the insurance company’s obligationsto those it insures by setting aside reserves equivalent to the actuarial value ofthose obligations. To limit the risks affecting reserves and to protect state
412
Financing social protection

guarantees to the insured, insurance norms generally include regulationsgoverning investment. Technical reserves must be invested in publicly offeredfinancial securities and real estate up to the investment limits established bylaw. The ratio between assets representing reserves and the obligations thatcompanies assume towards those insured is also regulated.
Model policies and clauses
To ensure market transparency and to protect the insured, model policiesand clauses that companies intend to offer in the marketplace must be submittedto the regulatory body which authorizes and registers them if they do not induceerror or confusion or violate the law. Once registered, these clauses and/orpolicies can be used by any company.
Prices
In general, companies freely set the premiums for any kind of insurancegenerally contracted for, together with the fees and commissions for the salesagents and brokers who sell policies for them. The law generally requiresinsurance policies to specify the commission amount or percentage earned bythe insurance agent or broker responsible for the sale.
Insurance (premiums and indemnities) inflation adjustment
In general, the premiums and indemnities associated with insurance shouldinclude an indexing system to deal with inflation.
Insurance selling
Insurance can be contracted directly with the insuring entity through itssales agent or an independent insurance broker. Sales agents are individualswho market and sell insurance for an insurance firm and cannot provide theseservices to more than one company at a time. They must be listed both in aspecial registry maintained by the company and in a registry maintained by theregulatory authority. Insurance brokers are also individuals or registered firmswhose function is to advise people seeking to contract insurance, informingthem of the contract and coverage conditions, and assisting them when theysustain a loss. Regulation of these activities has been the subject of somecontroversy because of important asymmetries in information that arise duringthe process of selling a product as special as this one.
State guarantees
If an insurance company goes bankrupt, the State usually guaranteespayment of pension annuities up to a specified amount, which is normallyrelated to the value of guaranteed minimum benefits (see also Chapter 4).
413
Financial governance

7.1.4.3 Supervision
International experience has shown that there is no single optimum supervisoryscheme. One starting point for the debate on this issue is whether socialprotection programmes, particularly pensions and health insurance, should besupervised by specialized agencies. Most of the recent social security reformsin different countries have introduced such agencies, the Superintendenciasin Latin America being one such example. Some observers object to themon the grounds that supervisory authority is already vested in existing entities(e.g. the country’s central bank, internal revenue administration, and/or bodiesregulating capital markets). They argue that specialized agencies reduce theeffectiveness and efficiency of other entities and generate significant problemsof coordination among the different entities.
A wide range of arguments have been put forward in favour of the creationof specific supervisory agencies. The five listed here relate to new pensionsystems (Demarco and Rofman, 1998):
1. Savings for pensions fall into a special category because they are usuallymandatory, and as a result the State is responsible for ensuring that theirmanagement is based on specific, suitably enforced rules.
2. Capitalization systems have been created in countries with no priorexperience with this sort of scheme, and they generate important inter-actions with capital markets, insurance markets and social security institu-tions. A specific agency helps formalize a minimum level of coordinationamong the relevant institutions.
3. Some products and processes within these new pension systems, such as lifeinsurance and retirement pensions, as well as qualifications for disabilityand the management of resources by third parties, have not, in the past,been governed by clear, specific regulations – or, in some cases, by anyregulations whatsoever. Meanwhile, benefits provided by public systemswere understood to be governed by implicit regulations by their very nature.
4. The confidence in old supervisory institutions is low because of their lack oftransparency and inefficient functioning. The creation of modern super-visory bodies can overcome the lack of trust in pre-existing institutions.
5. New systems permit the creation of new supervisory agencies in which theparticipation of pension fund proprietors is potentially more active,reducing the risk of deviation from the original objectives established forthis kind of saving.
The basic question regarding the role of the supervisory agency is whetherthis agency should be ‘‘pro-active’’ or ‘‘reactive’’. An active role implies thatthe agent is concerned with regulating, supervising and auditing most activitiescarried out by insurance managers. The purpose is to avoid actions, intentionalor otherwise, that could damage the interests of system affiliates.
414
Financing social protection

The second focus is based on the idea that the system must be capable of‘‘self-control’’ through the same competitive forces that generate a marketcomposed of multiple managing institutions. This assumes that those managingthe funds have the right incentives to exercise self-control and avoid damagingbehaviour. In this case, the State intervenes only when these incentives fail.Accordingly, the penalties for violating the system’s rules must be very strong,to send clear signals to the institutions participating in the market.
Experience in Latin America shows that regulatory agencies in general arevery pro-active when it comes to investment: for example, they control day-to-day transactions, evaluate the instruments included in pension funds, reviewthe management of pension savings funds in detail, and so on. However, theyare more reactive when dealing with matters such as publicity, customerrelations, information provided to affiliates, and other non-essential processes inwhich the public can play a much more active role than in investments.
A particularly significant issue that is probably insufficiently regulated inmany countries – especially those with mandatory pension and health careinsurance industries just beginning to develop – is the conflict of interest thatexists for senior officials in supervisory and regulatory agencies. In somecountries these positions are held by industry personnel who in many casesreturn to work for private mandatory insurance managers after completing theirstint of public service. This creates an obvious conflict of interest, andregulations do not clearly prohibit those who have worked in a regulatory bodyfrom going on to work in industry.
7.1.5 Financial market regulations
The social protection system reforms that have changed pension schemes fromsimple pay-as-you-go (PAYG) to individual-capitalization or defined-benefit(DB) schemes with higher reserve levels, together with the development ofvoluntary pension saving systems and occupational plans, have led to stronggrowth in the reserves involved in these schemes, significantly affectingthe financial system and capital markets. This development underlines theimportance of suitable regulations in these areas. Since some aspects of theneed for effective financial regulations were discussed in Chapter 6, this sectioncan be kept fairly short.
Requirements for developing and regulating the financial system and capitalmarkets vary enormously depending on the system adopted. In fact, under aPAYG financial regime, system reserves are relatively small compared to thetotal value of current liabilities, and basically serve to deal with potentialtemporary disparities between revenue flows from contributions and expendi-tures occasioned by benefit payments. These disparities occur mainly as a resultof economic cycles. Investing these reserves, then, basically requires short-termfinancial instruments issued by either financial entities or the State. In contrast,
415
Financial governance

under the system of individual full capitalization, all liabilities generated bypensions in the course of payment and accumulated rights must be backed at alltimes by financial reserves. As already seen in Chapter 6, this situation requirescapital markets and rather sophisticated systems of financial management.
7.1.5.1 Savings–investment intermediation mechanisms
Economic literature identifies two basic models for resource intermediationbetween savings and investment (see, for example, Tsuru, 2000). First, there isthe model based on financial intermediation in which banks assume the task ofselecting clients and investment projects, long-term monitoring of projects andintervention in case of poor investment performance. In this model there is along-term relationship between the bank and its client, based on both parties’reputation, which constitutes a sort of implicit contract. This practice ofchannelling resources into the economy prevails among Asian and Europeaneconomies, especially Germany, and in Latin America.
The other model is based on public issues of financial assets (bonds andshares) for placement in the portfolios of private and institutional investorsthrough capital markets. The most obvious example of this model is thefinancial system in the United States. Under this model, those that contributeresources to a company are protected only by the investment contract itself, andrisks are essentially monitored through the marketplace. Naturally, for thismodel to assign resources efficiently, a competitive, liquid, deep capital marketis required, operating in a climate of extensive company disclosure.
7.1.5.2 Regulations relevant to financial markets
Basic regulations governing financial markets deal essentially with three issues:(i) generation and circulation of reliable information about the economic andfinancial situation of those issuing securities; (ii) stock market regulations, and(iii) company regulations.
In terms of regulating information, it is common to require that the issuerregister with the relevant public security registry and commit to providing theregulatory/supervisory body with regular (quarterly, annual, or other) auditedfinancial statements. This last task is carried out by auditors who are alsoaccredited with the regulatory body. Issuers must prepare their financialstatements in a standardized format and, in addition, must report any essentialfact that affects the company’s situation. Similarly, expert agencies mustevaluate the risk of all publicly offered debt instruments. Usually these agenciesmust be accredited with the regulatory/supervisory body.
Regulations governing stock markets seek to ensure the transparency andefficiency of the market by having instrument buyers and sellers come togethersimultaneously to establish prices, as well as requiring formally establishedmechanisms for negotiating instruments and explicit internal regulations.
416
Financing social protection

Finally, regulations governing private companies seek to establish a basisfor the good corporate governance of these firms and, above all, to protectminority shareholders from any attempt by controlling shareholders towithdraw value. Regulations seeking to protect the positions of minorityshareholders are crucial to the pension system because pension funds mustremain minority shareholders in the companies in which they invest; otherwise,pension reserves could be used in takeover bids.
7.1.5.3 Basic regulations governing the banking system
Normally, the State provides a limited guarantee on demand and term depositsthat the public holds in commercial banks. To ensure both the coverage of thisguarantee and, above all, the general stability of the financial system,regulations have been established to govern the solvency and management ofbanks and other financial companies.
The establishment and enforcement of regulations governing financialinstitutions are vital for the healthy development of a pension system,especially new national pension systems like those in Latin America andEastern Europe where bank-issued securities, together with state-issuedinstruments, are the main investment alternative. Adequate, up-to-date super-vision of the banking system should incorporate certain basic principles interms of capital requirements, management requirements and market discipline.
Capital requirements
According to the 1988 recommendations by the Basel Committee, capitalrequirements should be set in relation to the financial institution’s risk profile.A suitable capital requirement imposes discipline on bank management andcovers unforeseen losses that may arise during the normal course of business. Itis important to remember that capital requirements should be seen as flexibleelements that are adapted to the total risk associated with banking, not justlending.
Management requirements (corporate governance)
By their very nature, financial institutions work with high degrees ofleverage and, as a result, even capital requirements above the recommendedminimum may not be adequate if management is not solid, particularly when itcomes to identifying and controlling business risks. One way of stimulating thedevelopment of competent risk management within the banking business is torate companies in this area. The rating is based on indicators that are publiclyannounced by the regulatory body.
Market discipline
Banking enforcement or supervision carried out by public authorities mustbe supplemented by private agents. This means that accurate, timely and
417
Financial governance

precise information on the exposure and risk of financial institutions must beavailable. The analysis of institutional exposure to risk is in the publicinterest, since the use of this information by some agents does not make itany less useful to others. Accordingly, the function of monitoring banks in theprivate sphere should be especially encouraged as a benefit to society. Inmany countries, insurance and pension fund companies may channel resourcesinto financial institutions only by means of financial instruments that aresubject to risk ratings. This requirement encourages the development ofprofessional risk-rating agencies which provide information to the entiremarket.
7.2 HIERARCHY OF QUANTITATIVE GOVERNANCE
INSTRUMENTS: AN OVERVIEW
Instruments used to manage the finances of national social protection schemesfall into several categories, matching different stages in the managementprocess. Descriptive instruments reveal the current state of a given scheme orthe entire NSPS (statistics, accounting and reporting). Analytical/controllinginstruments facilitate the analysis of scheme or system performance in terms ofits objectives, using available statistics and other information to buildperformance indicators. Performance analysis must precede any decisionsabout the system’s future, budget preparation and plans.
Descriptive instruments are tools that express the present status of a systemor scheme in quantitative terms – namely, national or scheme-based statisticsand accounting, which are the basis for all further analytical or supervisorywork. At the individual scheme level, these are the classic, almost universallyused instruments. At the national level these two concepts (i.e. consolidatednational statistics and accounts) are less frequently used.
Analytical instruments are tools that help the scheme or national socialprotection managers assess the effectiveness and efficiency of a scheme or thesystem as a whole. These tools thus consist largely of a set of performanceindicators. Although they have been used in various schemes, a systemic set ofindicators has been developed in only a few cases. Many indicators are used onan ad hoc basis. In recent years ILO FACTS has started to develop newstandard instruments designed to measure the performance of schemes andnational systems – a system of social security scheme-based performanceindicators and, at the national level, Social Protection Expenditure andPerformance Reviews (SPERs).
When it comes to planning new schemes, designing or – most likely –redesigning a national system, or evaluating the future financial, fiscal andpossibly economic sustainability of a scheme or system, instruments with acertain projection and simulation capacity are needed. For individual schemes,this role is filled by the classic actuarial study (for new schemes) or actuarial
418
Financing social protection

valuation (for periodic reviews of existing schemes). Most countries havelegislation providing for periodic actuarial reviews of existing schemes.
At the national level, social budgeting should be used to model the fullsocial transfer system of a country and to project and simulate the way it islikely to perform in alternative economic, demographic, social and legislativescenarios. Social budgets can be used for periodical assessments of the presentand probable future performance of an existing scheme or to simulate thefinancial and fiscal effects of new benefits. Simulations of this nature are keyinstruments in social policy planning. They can help prevent socially,economically, financially and fiscally expensive mistakes in the legislativeplanning process.
A hierarchical overview of quantitative governance instruments is given intable 7.1.
The following sections will discuss these descriptive and planninginstruments only briefly since they were either already covered in otherbooks in this series or will be the subject of forthcoming publications. Thenewer instruments, system-based performance indicators and Social ProtectionExpenditure and Performance Reviews, will be described in more detail.
7.2.1 Descriptive instruments
7.2.1.1 Accounting frames
The last textbook planned for this series will detail the basic blueprints for theessential statistical and accounting frameworks of social security schemes. Inthe meantime, a standard accounting frame can be found in Cichon et al. (1999,Issue Brief 2). The frame described there is for a national health insurancescheme but can easily be adapted to accommodate other kinds of benefits (seebox 7.1). A standard statistical frame for actuarial valuations, published in
Table 7.1 Hierarchy of quantitative governance instruments
Main purpose of instrument Scheme level National level
Descriptive (statistics,accounting and reporting)
Scheme statistics National social protectionstatistics
Scheme accounts National social accountingsystem (SAS)
Annual reports National social protectionreports
Evaluation and planning (budgeting,projections, simulation, resourcemobilization)
Actuarial studies andvaluations
Social budgets
Performance measurement,monitoring and analysis
Scheme-based system ofperformance indicators
Social Protection Expenditureand Performance Reviews(SPERs)
419
Financial governance

Plamondon et al. (2002, Technical Brief I), can easily be expanded orcondensed to summarize all the information that a scheme would need for itsannual report to members or for regular statistical reporting to its board andsupervisory agency. Regular reporting procedures are a key element of soundgovernance, and need to be followed with due diligence.
There is no generally accepted format for annual or more frequent scheme-based reporting. As most social protection schemes are public institutions, theiraccounting and reporting should follow the standard rules for public finance inthat particular country. Box 7.1 suggests a possible model for annual reportswhich, based on the structure developed by one scheme over decades, seems toprovide a fair picture of the scheme’s activities in the course of a year. Suchreports summarize statistical and accounting information from the scheme andmake it accessible to the general public.
Box 7.1 An accounting framework and financial reporting for a national
social insurance scheme(Excerpts from Cichon et al., 1999, Issue Brief 2)
The accounting framework is a reporting system that enables the budgetto be monitored, and is set up to produce other necessary financialreports, e.g. the income and expenditure report and a balance sheet.Before an accounting framework can be drawn up, a system of accountingmust be decided upon, for this will affect the design of the reports. Themost crucial elements of the accounting framework are the income andexpenditure account, and the balance sheet.(. . .)
Once a system for accounting has been decided, the accountingframework should be designed. A blueprint of accounts should be drawnup for the following statements:
a. Income and expenditure account
b. Balance sheet
c. Other management accounts.
The income and expenditure account shows the results of the financialoperations carried out during the period covered, and measures the(accounting) surplus or deficit for the period. The balance sheet shows thefinancial position at a particular point in time, that is, it lists all assets andliabilities at the date of the balance sheet. The balance sheet is derivedfrom the income and expenditure account, incorporating informationon accruals, assets, liabilities, reserves, depreciation and stock balances.
If the scheme involves a substantial amount of capital expenditure, aseparate capital expenditure account may be required to record capitalexpenditure incurred since the beginning of the financial year. Each majoritem should be shown separately, and should be analysed by type ofexpenditure – purchase of property, office equipment, etc.
420
Financing social protection

It is also recommended that management accounts be produced.These perform the following functions:
. support the monitoring and evaluation of the financial aspects of thescheme, together with the income and expenditure account
. enable a more detailed understanding of the financial status of thescheme, by providing an analysis of costs.
The contents of management accounts will depend on the nature of thescheme, but may include, for example, tables on primary health careexpenditure classified into broad components and by geographic region, oraverage primary health care costs per visit or per insured person by region.
The layout of statements of account differs from one scheme toanother and from one country to another – institutions might also berequired by legislation to observe a particular format for their accounts.
Income and expenditure account
The income and expenditure account is based on information in theledgers, summarizing credit and debit transfers for each item. (Moreinformation on ledgers is given in the following section.) If the cashaccounting system is used, the balances on the accounts are transferredwithout amendment. If the accrual accounting system is used, eachaccount in the ledger needs to be examined and the appropriate accrual(adjustment) needs to be made before the balance is transferred to theincome and expenditure account.
On the annual account, adjustments to balances may also includeitems such as financial reserves and the calculation of depreciation. Theentries in the income and expenditure account from the ledger will needto be analysed, summarized and presented in the prescribed format. Theitems which one would expect to find in the summary of the income andexpenditure account are as follows:
Income
Employers’ contributionsGovernment contributionsInterest and other investment incomeOther income
Expenditure
Total cash benefits awarded during the yearTotal contributions refundedTotal expenditure incurred on:
Provision of medical careAdministration
Box 7.1 (cont’d)
421
Financial governance

Maintenance of properties (with expenditure on broad categoriesshown for each property)Transfers to reserves or development fundsAmounts written off
As stated above, the amount of contributions due, but not yet writtenoff or received, should also be shown in a footnote to the accounts.(. . .)
The balance of the income and expenditure account is either a surplus(if income is greater than expenditure) or a deficit (if expenditure isgreater than income). This balance is transferred to the health insurancereserves at the end of the year.
The balance sheet
As stated earlier, the balance sheet lists all assets and liabilitiesoutstanding at the balance sheet date. After this information has beensummarized in the income and expenditure account, and transfers(adjustments) have been made relating to accruals, depreciation andstock balances, individual accounts are balanced. These balances are thenorganized into a specific format, to produce the balance sheet.
Balance sheet format varies from country to country and may beregulated by legislation. One recommended format is:
Liabilities
Cash benefits awarded but unpaid and still outstanding at the balancesheet dateAmounts due to other creditorsContingency reservesDevelopment fund, if anyHealth insurance reserves, shown as:
. Amount of funds at the beginning of the financial year,plus surplus from income and expenditure account, orminus deficit from income and expenditure account, yielding
. Amount in health insurance fund at the end of the financial year.
AssetsCash on handBalances on current accounts at banksBalances on deposit accounts at banksAny amounts due from sundry debtorsInvestments, with different types shown separatelyStocks of pharmaceuticals, medical appliances and other medicalsuppliesMedical equipmentOffice furniture and equipment
Box 7.1 (cont’d)
422
Financing social protection

At the national level, accounts for the overall social protection systemshould follow the methodology of the national accounts (SNA 93). Onepossible framework is the Government Finance Statistics system developed bythe IMF (2001a). However, it covers only the finances of schemes administeredby institutions in the government sector and may thus exclude many otherimportant social protection schemes. Another, much more comprehensive andfocused framework, developed in the form of satellite accounts to the nationalaccounts, is the European System of Integrated Social Protection Statistics(ESSPROS) (EUROSTAT, 1996). In the course of its social budgeting work theILO has proposed a national social accounting system (Scholz et al., 2000), alsoclosely linked to the national accounts and similar in many ways to ESSPROS.Box 7.2 includes the definition of a social accounting system (SAS) andguidelines for its design.
Motor vehicles (and ambulances)Office buildingsHospitals, clinics, dispensaries and other premises used in connectionwith the provision of medical care.
Fixed assets are depicted according to their book value at the endof the previous financial year, plus the cost of additions, minusdepreciation.
Capital expenditure accountThis should show the total capital expenditure for the year, withexpenditure on various projects (e.g. construction, purchase of buildings)shown separately. Items to be included in a capital expenditure accountare as follows:
InvestmentsDepositsPurchase of fixed-interest securitiesOther investments
PurchasesPharmaceutical products, medical appliances and other medicalsuppliesFurniture and equipment for hospitals, clinics, etc.Furniture and equipment for officesAmbulancesOther motor vehicles
Construction, purchase, or adaptation of buildingsHospitals and other premises for use in the provision of medical careOffice premises.
Box 7.1 (cont’d)
423
Financial governance

Box 7.2 Definition of a national social accounting system(Excerpts from Scholz et al., 2000, Chapter 2)
(. . .) a social accounting system (SAS) is an indispensable part of the databasis required for a Social Budget model. It comprises the flow of fundsdata of the social protection system as observed in the past, system-atically and consistently processed under a unified methodology thatallows for structural analyses at a certain point of time, for time seriesanalyses and for meaningful international comparisons. The SAS is onestatistical basis for social budgeting.(. . .)
The design of an SAS and, thus, a Social Budget depends on its pur-poses, which may be manifold. Initially, the SAS is a tool of governancefor planning, monitoring and analysing social policy decisions at macrolevels. It is a comprehensive formal account of the revenues and theexpenditures of the social protection system of a country. Such anaccount is not an end in itself. Indeed, it serves as an information basis fora country’s government, its general public, its politicians, its economicactors (for example, employers and employees), the social protectionsystem’s beneficiaries, the taxpayers, its scientific institutions and otherswho all might use the same information for different purposes. Theymight want to evaluate the social protection system’s financial flows in aneconomic context; they might want to know about the existing socialsecurity institutions’ relative size in terms of their aggregate expenditures;they might want to know about the structure of social protectionexpenditures and their financing, i.e. how much of total resources goesinto different programmes and what is the relative weight of differentrevenue sources. All these issues might be addressed vertically (for acertain year) or horizontally (under a dynamic time perspective). And, lastbut not least, the addressees of this information might want to use it forinternational comparisons.
Given its basic character as a tool of governance and information, it ishoped that the implementation of an SAS serves to enhance rationality inpublic discussions on social protection and supports the government intaking reasonable decisions on future social protection legislation bytaking into account the aspirations and needs of the general public, aswell as future financial and economic constraints.
As the potential different users of an SAS might normally want toaddress different aspects of the social protection system, it is advisable toclarify from the beginning that an SAS, whatever its final set-up might be,reflects just one, though important, aspect of a social protection system,which is its fiscal flows of funds, disaggregated by different categories.Therefore, an SAS primarily provides information to those who areinterested in a detailed financial picture of the social protection system ina macroeconomic and macrofinancial context. An SAS does not addressmicrosocial or microeconomic issues. Important questions such asadequacy of individual benefit levels, equity of benefit provisions,equivalence between individual contributions paid and benefits received,
424
Financing social protection

7.2.1.2 Social protection statistics
Social protection is an important part of overall social policy. It can therefore beassessed only within the context of a much broader range of statistics andindicators describing the social situation in a country. There is no standardblueprint yet for national social statistics. Countries have different profiles,often for historic reasons. The aim of these statistics is to provide a pictureof a particular country’s social reality and, if possible, to trace trends in socialdevelopment. National social statistics are also used to compare countries toeach other but, with the exception of some expenditure statistics, they are
the impact of social expenditures and their financing on the individualprivate households’ income distribution, and many others, will have to beinvestigated by using other sources of information.(. . .)
Having set its scope and limits, the design of an SAS should be basedon the following principles:
(1) The SAS should be designed so that it allows for methodologicallyprudent links to other information systems, most importantly theSystem of National Accounts (SNA) which is in use worldwide as amethodological basis for the compilation of national accounts.
(2) The SAS statistical scope should cover the social protection system ina comprehensive and significant manner:
. with respect to comprehensiveness – it should include all socialexpenditures (and their related revenues) irrespective of theirsources of financing; and
. with respect to significance – it should cover only social expendi-ture; private voluntary provisions not financed on a mandatorybasis, joining which is the individual’s choice, should not beincluded (private savings accounts, life insurance).
(3) The SAS should reflect ‘‘conventional a priori wisdom’’ of possibilitiesas to how to structure social protection finances; thus revenuesshould either reflect the payments to the institutions of the system bylegal categories (employers, employees, government, others) orcategorize revenues by their economic ‘‘sources’’ (enterprises, privatehouseholds, the public sector, others) or both, and expendituresshould be presented by all institutions administering the system or bythe social ‘‘functions’’ of the benefit provisions, or both.
(4) The SAS design should allow for international comparisons. (Such‘‘methodological pragmatism’’ is essential in order to guarantee this.)
Box 7.2 (cont’d)
425
Financial governance

usually not comparable since the accounting concepts and underlyingdefinitions of other terms differ.
EUROSTAT publishes a list of 18 key social indicators in its annual reportson ‘‘The Social Situation in the European Union’’ (EUROSTAT, 2001):
The European Union (EU) list of indicators for the social situation in Europe
1. Old-age dependency ratio
2. Net migration rate
3. Percentage of the population aged 18–24 having left education with lowqualifications
4. Percentage of population aged 25–64 receiving education/training
5. Employment rate of those aged 15–64
6. Employment rate of those aged 55–64
7. Unemployment rate
8. Youth unemployment/population ratio
9. Long-term unemployment rate
10. Social protection expenditure as a percentage of GDP
11. Old-age benefits as a percentage of total social benefits
12. Income distribution ratio (income share of the 20 per cent of the richest toincome share of the 20 per cent of the poorest)
13. Percentage of the population with an income less than 60 per cent of thenational median
14. Share of households in which no member is employed among allhouseholds in which at least one person is active
15. Female employment rate of 15–64-year-olds
16. Average earnings of women as percentage of men’s earnings
17. Life expectancy at birth and life expectancy without disability (by sex)
18. Percentage of employed persons who have had working accidents
The above indicators answer two basic questions: What are the socialdevelopments (social outcomes) in a particular country, and how do societyand, in particular, the government alter these social outcomes? In a recent effortto develop a set of social indicators,2 the OECD has classified relevantindicators into indicators of social context, indicators of status and indicators ofsocietal response, and defined four categories reflecting primary social policyobjectives (self-sufficiency, equity, health, and social cohesion). Table 7.2presents these social indicators.
The ILO too has recently begun to develop a new concept of statisticalindicators which would reflect all the aspects of its Decent Work Agenda
426
Financing social protection

Table 7.2 OECD social indicators1
Social context Social status Societal response
Self-sufficiency EmploymentUnemploymentJobless youthJobless householdsWorking mothersRetirement ages
Expenditure on labour-marketactivation policiesExpenditure on educationEarly-childhood educationand care (enrolment)Educational attainmentLiteracyReplacement rates (benefitsin case of unemployment)Tax wedge (ratio of net wageto labour costs)Social protection expenditure(public, private, net)Number of older people ininstitutions
Relative povertyIncome inequalityLow-paid employmentGender wage gapUnemploymentJobless youthJobless householdsWorking mothers
Minimum wagesSocial protection expenditure(public, private, net)Benefit recipiency (working-agepopulation)Expenditure on labour-marketactivation policiesExpenditure on education
Equity
National income (per capita)Fertility ratesOld-age dependency ratioForeigners and foreign-bornpopulationRefugees and asylum-seekersDivorce ratesLone-parent families
Early-childhood educationand care (enrolment)Educational attainmentLiteracyReplacement rates (benefitsin case of unemployment)Number of older people ininstitutions
Health Life expectancyInfant mortalityPotential years of life lostDisability-free life expectancyAccidentsRelative povertyUnemploymentDrug use and related deaths
Health care expenditureResponsibility for financinghealth careHealth infrastructureEarly-childhood educationand care (enrolment)Educational attainment
Social cohesion StrikesDrug use and related deathsSuicideCrimeGroup membershipVotingRelative povertyUnemployment
PrisonersEarly-childhood educationand care (enrolment)Educational attainmentPublic social expenditureHealth care expenditure
1Italicization of an indicator means that it also appears in another category as a primary indicator.
Source: OECD (2001c).
427
Financial governance

(see ILO, 2001e). Proposed indicators are divided into four groups, reflectingfour strategic ILO objectives: fundamental rights at work, decent employmentand income, social protection and security, and social dialogue and voicerepresentation (see table 7.3).
The ILO’s Labour Statistics Convention, 1985 (No. 160),3 requires memberStates ratifying the Convention to collect, compile and publish basic labourstatistics in the following areas: economically active population, employment,unemployment and underemployment; average earnings and hours of work,wage structure and distribution, labour cost, consumer price indices, householdexpenditure and income, occupational injuries and industrial disputes. Thesestatistical data would be sufficient to construct most of the ‘‘social status’’ indi-cators associated with the labour market and incomes. Although the listincludes virtually none of the statistics required for the ‘‘societal response’’indicators (such as data on social protection expenditure and coverage), aresolution of the Conference of Labour Statisticians (1957) concerning thedevelopment of social security statistics outlined the requirements for nationalsocial security statistics.4 The standard reporting form of ILO Social Security(Minimum Standards) Convention, 1952 (No. 102), contains some basicstatistical indicators, but they report on scheme-based performance rather thanoverall social protection.
The ILO has also been conducting an ‘‘International Inquiry into the Cost ofSocial Security’’, using a methodology that it hoped would serve as a model for
Table 7.3 The ILO’s suggested set of decent work indicators
Fundamental rights at work Child labour (participation rates)Hazardous and other worst forms of child labourFreedom of association
Decent employment and income Labour force, employment, unemployment,underemploymentWage ratesLabour costsLabour productivityHours of workWorking poorSkills in labour force
Social protection and security Safe work (occupational injuries)Public expenditure on social securityCoverage by social securityStatutory minimum wageContract type (casual, temporary, regular, permanent)Job stabilityPlace of work (home, street, etc.)Poverty incidence
Social dialogue and voice representation Union membershipStrikes and lockoutsCollective bargaining agreements (coverage)
428
Financing social protection

national statistical systems associated with social protection financing andcoverage. Recently, this methodology was largely unified with the approachadopted by EUROSTAT for EU Member States.
7.2.2 Planning instruments
The key planning instruments that might be used to monitor both present andlikely future performance are actuarial valuations and social budgets. They aredescribed more fully in two other books in this methodological series (Scholzet al., 2000; Plamondon et al., 2002). Accordingly, we will give only asummary of the information that social budgets and actuarial valuations provideto decision-makers, planners and managers.
An actuarial valuation basically gives decision-makers four sets of facts:
(1) how the scheme’s expenditure and income would develop under certainassumptions;
(2) whether the scheme is in actuarial equilibrium under status quo conditionsand selected assumptions in the medium- to long-term future;
(3) if not, what measures on the income or expenditure side could restore thefinancial equilibrium;
(4) how a certain set of measures (suggested by the government or otherstakeholders) would affect the actuarial equilibrium.
A social budget would inform the government and the public:
(1) about the development of all social expenditure and all revenue earmarkedfor social protection under certain assumptions in the medium-term future;
(2) whether measures are needed to maintain the financial equilibrium of thesystem as a whole;
(3) how specific income and expenditure measures suggested by stakeholderswould affect the financial equilibrium.
Normally, any major change in the benefit provisions of a system orscheme should be accompanied by an actuarial and social budget analysis. Theresults of such analyses should enter into the financial justification that ought toaccompany all social protection bills submitted to national parliaments. Let usassume that a country wishes to increase the retirement age. Parliament andCabinet must be told about the effect that this measure will have on the pensionscheme’s financial situation. An actuarial study or valuation would calculatethe amount by which the contribution rate for the old-age benefit scheme couldbe reduced, or how much longer the present contribution rate could bemaintained compared to a status quo. However, raising the retirement agewould also have repercussions on other schemes. It might, for example,increase expenditure in the unemployment-benefit scheme, the invalidity
429
Financial governance

scheme or even the social assistance provisions, if some people were to resortto other means of exiting the labour market. Ultimately, it is the net savings inthe social protection system as a whole that should be of interest to decision-makers.
Box 7.3 describes the kind of results that decision-makers can expect fromactuarial valuations and social budget analyses. It gives the results of acombined actuarial valuation and social budget analysis that ILO FACTSundertook for the Government of Panama (respectively the Caja de SeguroSocial) in 2001. Not surprisingly, the results of the analysis generatedconsiderable political debate concerning the future and sustainability of thesocial insurance scheme.
Box 7.3 Results of an actuarial valuation and social budget
exercise for Panama1
The actuarial and social budget projections are designed to provide arealistic view of Panama’s possible socio-economic development. Thepopulation projection is in line with the assumptions of thePanamanian government and the 2000 United Nations populationprojections,2 which all expect that within the next 50 years Panamawill add about 50 per cent to its present population. The assumptionsabout GDP were developed on the basis of per capita growth over thepast 50 years, which was in the order of 2.3 per cent per annum. Forthe period 2000 to 2050 it was assumed that annual long-term averageper capita growth could be around 2.7 per cent, this comparativelypositive bias being the result mainly of an assumed higher futurelabour productivity growth. The total number of employed and thenumber of contributors to the CSS are projected almost to doublebetween 2000 and 2050. Women’s participation in the labour marketwill increase significantly; it is assumed that by the end of theprojection period almost no differences will exist between male andfemale employment levels any more. Unemployment will decline frompresent double-digit rates to turn into almost full employment sometime after the middle of the projection period. Under these conditions,Panama has the potential to improve clearly its income positionrelative to that of its neighbouring and other potentially competingcountries.
By and large, the results of this valuation confirm those of an earliervaluation done in 1998, except that in 2001 it became evident that socio-financial reform measures would need to start earlier than previouslythought. Analysts had initially projected that the CSS pension programmewould run into structural deficits somewhere between 2010 and 2015,thus providing a margin of several years before reform measures wouldactually have to be implemented. The 2001 valuation indicates that
430
Financing social protection

reforms might have to be implemented earlier, since the CSS structuraldeficit is expected to occur as early as 2005.
Panama’s social budget
For 1990, total revenue of the social protection sector of Panama wasestimated at around 965 million balboas; this amount doubled by 2000,reaching 1,921 million. Total expenditure was estimated at some 869million balboas in 1990, and at 1,806 million in 2000. The balance waspositive throughout the 1990s.
Total revenue amounted to 18.2 per cent of GDP in 1990 and 19.2 percent in 2000. In all years contributions and tax revenue each accounted foran almost equal share of around 45 per cent in financing Panama’s socialexpenditure. Capital income accounted for about 10 per cent of totalrevenue. Total spending amounted to 16.3 per cent of GDP in 1990,reached 20.7 per cent in 1998 and fell back to 18.1 per cent in 2000. Of thatspending, old-age benefits absorbed 5.7 per cent of GDP in 1990 and 6.1
Box 7.3 (cont’d)
Box figure 7.3.1 Social revenue ratio,1 Panama, 1990–2050
1Total revenue allocated to social protection as a percentage of GDP.
Source: Database and results of calculations with the ILO social budget model.
431
Financial governance

per cent in 2000, followed by health with 5.1 and 5.6 per cent in 1990 and2000, respectively, and education with 4.1 and 4.5 per cent. Housing playsonly a minor role in Panama’s social budget.
In the long run, overall revenue is expected to decrease from currentlevels to less than 16 per cent of GDP (15.6 per cent in 2020); it will remainat that low level for about a decade and then begin to increase again,although only slightly. By 2050 total revenue is projected to reach 17.1 percent of GDP.
Over the full projection period, the development of social spending inrelation to GDP is influenced by the following broad trends:
(1) as a direct consequence of the declining relative number of children inthe population, the ratio of education spending is set to decrease from4.5 per cent of GDP in 2000 to 2.6 per cent in 2050;
(2) relative spending on health is expected to rise steadily, especially sinceper capita spending on health will increase ‘‘structurally’’ because ofthe expected increase in the number of older patients in relation toyounger ones. All in all, health expenditure is estimated to reach a levelof 7–8 per cent of GDP in 2050 (from 5.6 per cent in 2000);
Box 7.3 (cont’d)
Box figure 7.3.2 Social expenditure ratio,1 Panama, 1990–2050
1Total social expenditure as a percentage of GDP.
Source: Database and results of calculations with the ILO social budget model.
432
Financing social protection

(3) relative spending on old-age, disability and survivors’ benefits isexpected to increase significantly, to more than 10 per cent of GDP in2050 (from 6.1 per cent in 2000);
(4) housing, labour and social security spending will remain at relativelylow levels.
As a consequence of cyclical developments, the overall balance ofPanama’s social protection system was expected to register a deficit in2002 before returning to positive figures in 2003 and 2004, butsubsequently developing a long-term structural deficit. This is unavoid-able at given benefit levels, contribution and tax rates and the assumeddemographic and labour-market developments. However, the deficit isexpected to remain at a tolerable level until the late 2020s (around �1 percent to �2 per cent of GDP) and to reach its peak level of over �5 per centof GDP only by the end of 2050.3
Worldwide, countries spend roughly between 5 and 30 per cent ofGDP on social programmes. From this perspective, Panama spends amiddling share rather than ‘‘too much’’ of its economic resources on
Box figure 7.3.3 Balance1 of the social budget, Panama, 1990–2050
1Total social budget revenue less total social budget expenditure. The balance is equivalent tothe change in the system’s monetary reserves.
Source: Database and results of calculations with the ILO social budget model.
Box 7.3 (cont’d)
433
Financial governance

social protection. Moreover, the projected rise in the social expenditureratio is in itself no reason for serious concern. If we disregard education,4
in 2000 the total social expenditure ratio was about 13.6 per cent, andit is expected to grow to 20 per cent of GDP by 2050. Panama’s socialexpenditure was just half of the European level5 in 2000 and will still lagbehind in 2050, when Europe will have increased its average socialexpenditure ratio to some 30 per cent or more, assuming that legislationremains unchanged.
The actuarial valuation of the CSS
All four CSS programmes have been separately valued for the report.Only the results for the pensions programme (Invalidez, vejez y muerte(IVM) – ‘‘disability, old age and death’’) are displayed here.
The current contribution rate of 9.5 per cent will be sufficient to coverthe expenses of the IVM programme until 2004. As of 2005, the cost-covering rate will be higher than the present legal rate. It will grow from9.9 per cent of basic salaries in 2005 to 24.1 per cent in 2050. The deficitwill be in the order of 9.8 per cent of expenditure over the first twodecades after 2001 and then increase to 60.6 per cent in 2050. Reserves
Box 7.3 (cont’d)
Box figure 7.3.4 Development of the IVM reserve, Panama, 1990–2050
(in balboas)
Source: Database and results of calculations with the ILO social budget model.
434
Financing social protection

will be depleted in 2018; by the end of the projection period, theaccumulated debt will amount to 68.6 per cent of GDP.
The main reason for this development is the rapid deterioration of thesystem dependency ratio. While at present 11 pensioners are beingsupported by 100 insured persons, in 2050 the ratio will have changed to43:100. This trend cannot be counterbalanced by the cost-saving effects ofthe strong no-indexation assumption. Indeed, the system replacementratio for old-age pensions is, under the given assumptions, bound tofall from 86 per cent in 2000 to 49 per cent in 2050.6 If the programmevaluation had taken into account ad hoc pension adjustments (as theytook place in the past), the financial results would have deteriorated evenfurther.
The system replacement ratio declines because of a number ofcoinciding reasons (of which the no-indexation assumption is thestrongest). It does not imply any deterioration of individual newpensions (the pension formula remains unchanged). On the contrary,the pension formula is considered far too generous, at least comparedwith those of other countries. Therefore, an increase in the IVMprogramme contribution rates is inevitable, even if the pension formulais cut back. Over the medium-and long-term the CSS cannot achievefinancial stability as long as pensions are calculated on the basis ofthe present formula and the legal contribution rate is maintained at9.5 per cent.
Notes
1 The exercise was carried out by Wolfgang Scholz and Florian Leger of ILO FACTS. The results
are documented in ILO (2002d).2 United Nations (2001a). See http://www.un.org/esa/population/unpop. htm3 In all projected years the social budget deficit is estimated as slightly higher than the
balance (‘‘resultado del ejercicio’’) of the CSS because investment in tangible assets is
considered current expenditure in the social budget but is not included when calculating
the balance.4 In European social budget methodology, education is not viewed as one of society’s
redistributive expenses (and is consequently not considered part of the social budget), but
rather as an investment in human capital necessary to maintain economic productivity in
the long run.5 The level of social expenditure depends very much on how social expenditure is defined. In
the United States total social expenditure, including charities and private measures, has
been estimated at about 32 per cent of GDP. The European Union definition is set by
EUROSTAT. Definitions used by individual EU Member States may differ from the
EUROSTAT definition. For 1998, EUROSTAT estimated the level of social expenditure in
the EU at about 27.7 per cent of GDP, varying between a maximum of 30.5 per cent for
France and a minimum of 16.1 per cent for Ireland. See Federal Ministry of Labour and
Social Affairs of Germany: Statistics on Labour and Social Security 2001 (Bonn, 2001),
tables 9-18 and 9-18A; or http://www.bma.de.6 The ratios for disability and survivors’ pensions follow a similar pattern.
Box 7.3 (cont’d)
435
Financial governance

7.2.3 Analytical and performance-monitoring
instruments
Over a century has passed since the Government of Germany under ChancellorBismarck created the first widespread system of social insurance (between 1883and 1889). The number of countries with social security programmes has beensteadily expanding, with a concurrent increase in social security’s impact onhuman welfare and the general economy. However, the overall performance ofsocial security in many of these countries has been disappointing, especially insuch essential aspects as the extent of coverage.
Although it would be difficult to list all the varied and complex reasons forthe poor performance of different social security schemes, some of them arefairly obvious. Some are external: many schemes are struggling to cope withnew obligations in a new political and economic environment. These adjust-ment problems are classified as programme design issues. Very often theyare caused by a lack of national coordination and planning mechanisms in thesocial protection system as a whole. Other reasons for poor performance areinternal – these are the so-called ‘‘governance problems’’.5 For example, manyschemes lack such fundamental information as the number of people who arecovered, compared with how many should be covered according to thelegislation in force, or the relative level of current contribution rates comparedwith the PAYG cost rate. As a result, the administrators of such schemes cannotand do not take the measures needed to remedy shortcomings; this inevitablyerodes public confidence in social security and may cause the system to fail.
In particular, governance problems persist because of crucial lacunae at thestrategic or macro-policy level,6 such as:
. lack of mechanism for monitoring the performance of the social protectionsystem as a whole;
. insufficient quantitative analysis to provide a sound basis for decision-making; and
. at the operational level, failure to establish key indicators relating toobjectives in order to monitor scheme performance.
Whether problems arise from conceptual, design or governance issues, theycannot be solved if they are not properly understood. Remedial action can betaken only after diagnostics are clearly specified. The first step towards betterplanning and governance of social protection lies in obtaining correctinformation and analysing it from various points of view in order to determinehow schemes are performing. Although much time and energy is usually neededto clarify situations and to discuss problems from the perspective of facts ratherthan ideology, this step is fundamental for logical, democratic decision-makingby democratically elected stakeholders. Performance indicators serve as catalystsfor the democratic decision-making process by ensuring greater transparency.
436
Financing social protection

To ensure the sustainability of social protection, necessary informationshould be standardized so that it can be used to analyse the situation of thescheme, and it should be collected regularly for purposes of historical analysis.However, it is difficult to select and sort information on essential aspects ofsocial protection without a thorough knowledge of and experience with socialsecurity in both the domestic and international contexts. Furthermore, sinceresources are often scarce, particularly in developing countries, core datashould be carefully selected in order to provide essential informationeffectively.7
Although the basic concept of performance measurement and performanceindicators has been discussed in some papers, no standard set of measuringtools has been proposed.8 Difficult as it is to standardize indicators in differentsocial and economic contexts, we suggest that a set of standard quantitativeindicators should be developed as a pragmatic tool allowing stakeholders in ascheme to assess its performance.
However, the wide range of stakeholders involved creates conflict inindicator requirements, notably with respect to the issue of simplicity versuscomprehensiveness. Professional stakeholders with extensive knowledge andexperience of social security (such as social security policy analysts who carryout detailed research on social security, or managers of social security schemeswho deal with day-to-day administration issues) often require numerousindicators from different levels of the social security hierarchy in order to assessperformance from a variety of different viewpoints. In contrast, non-professional stakeholders with less knowledge and experience (such as high-ranking government officials, board members of social security institutions, orrepresentatives of scheme employees and/or contributors and beneficiaries)might prefer to rely on a limited number of simple indicators.
Performance indicators are used to assess how well a scheme or systemachieves its objectives. There are two levels of performance measurement:
. assessing the process that transforms inputs (resources used by the scheme)into direct outputs (goods or services delivered to the beneficiaries); and
. assessing outcomes – that is, economic or social changes resulting from agiven policy or programme.9
Different dimensions of performance should be assessed:
(1) Efficiency is normally assessed against defined benchmarks (such asindicators derived from comparable schemes or systems in other countries).It normally has at least two major aspects:
(a) Technical or administrative efficiency, which expresses the relation-ship between the inputs and outputs of a particular scheme or system(e.g. the number of insured persons served by one staff member of asocial insurance scheme).
437
Financial governance

(b) Allocative efficiency, which expresses the social outcomes of thescheme or system as measured against the expected outcome ofresource allocation to alternative social protection schemes or systems(e.g. the reduction in the number of poor per percent of GDP spent on aspecific benefit).
(2) Effectiveness measures the social outcomes of the scheme or systemagainst its policy objectives as set by legislation or contractual arrange-ments in terms of coverage, quality, adequacy, equity and fairness,compliance and access (for example, the abolishment of extreme povertyby introducing a social assistance scheme, which is never 100 per centsuccessful because benefits are never taken up by 100 per cent of thepotential beneficiaries).
Indicators measuring inputs for the assessment of a social protectionscheme’s technical or administrative efficiency would relate mainly to humanand other resources used to provide services (administrative costs, personnel,and so on). Measures of inputs used to assess allocative efficiency oreffectiveness would involve resources used to finance social protection schemesand the system as a whole, such as social security contributions, taxes, andthe like.
Measuring outputs relates to the direct results of a scheme, like the numberof beneficiaries to whom benefits were paid or services provided.
Measures of outcomes focus on the ultimate policy objectives of a schemeor the social protection system as a whole: poverty incidence within a targetgroup (children, elderly, disabled, unemployed), inequality of income, healthstatus, and so on. Measuring the impact of a scheme or programme on outcomesis often problematic, since it is sometimes difficult or downright impossible toseparate a given policy’s impact from that of other factors (for example, it ishard to measure the impact of different specific policies on poverty reduction,unemployment or income inequality). However, it is often possible to identifyintermediate outcomes – resulting from specific policies – that facilitate perfor-mance measurement.
In the following sections we will examine two sets of analytical tools: first asystem of scheme-based performance indicators and then a set of tools – socialprotection expenditure and performance reviews – designed to assess theperformance of the NSPS as a whole. We will focus largely on indicators andanalyses of performance measures for cash-benefits programmes, withoutspending much time on problems related to the performance of health caresystems. Health care is certainly one of the main components of an NSPS, butowing to its specificity and complexity any discussion of health care systemperformance would require an approach that goes beyond the scope of thisbook. The reader should refer to Cichon et al. (1999), and to the work done bythe OECD and the WHO.10
438
Financing social protection

7.2.3.1 Scheme-based performance indicators11
Since performance has to be assessed in relation to objectives, it is crucial tounderstand clearly the objectives of a social security scheme and to analysemethodically tangible key indicators that those objectives have been achieved.Since a social security scheme is a complex, multidimensional system,determining a set of indicators is in itself one way of mapping the structure ofthis multifaceted project.
Social protection schemes will function well if:
(1) the legal framework is well established and in line with sound socialsecurity principles, standards and policy objectives (for example, widecoverage and high quality of services – that is, an appropriate benefit levelfor all those who are supposed to be covered);
(2) the governance or management of a scheme is performed efficiently inaccordance with the legal framework (for example, efficient contributioncollection, benefit disbursement, contained administration costs) and in away that satisfies beneficiaries; and
(3) the sound financing of the scheme guarantees its sustained operation (forexample, affordable level with respect to the national economy, appropriatecontribution level, efficient investment).
Given these many different demands, we must define a number of coreindicators that are considered essential for measuring improvement in thedesign and governance of a particular scheme. In light of the different needs ofstakeholders and the limited resources available for indicator maintenance, it iscrucial that indicators be prioritized, permitting the definition of a set of coreindicators.
Table 7.4 provides a set of scheme-based performance indicators used bytwo typical actuarial valuations in the Caribbean by an ILO actuary. Each ofthese indicators led the actuary to a number of conclusions and yet they meanrelatively little to the reader. The increase in the average financial ratio of old-age pensions from 22 to 27 per cent in Dominica could be taken as a sign ofgreater ‘‘generosity’’ of the scheme. But in fact it is rather a consequence of thescheme’s maturation process and should be mirrored against the legal objectivein respect of the pension scheme. The law in Dominica only stipulates theminimum (30 per cent) and maximum (70 per cent) replacement rate ofindividual earnings. We can thus assume that the target overall average ratemight be in the order of 50 per cent. Anything short of that level indicates eithera failure to deliver (for example due to the non-indexing of pensions) or the factthat the scheme is not mature, or a combination of both. How can the observedreplacement rates be that low when the scheme is already 27 years old, and whyare they below the minimum rate? The latter is due in part to the fact thatpensions in payment are adjusted irregularly on an ad hoc basis. Similarquestions are raised by all other indicators. This leads to one basic conclusion
439
Financial governance

concerning the selection and construction of indicators: they generally meannothing without intelligent benchmarks to which they can be compared (asalready discussed in box 6.3).
The actual application of such indicators in policy decisions takes a longtime. However, it should be stressed that the process of establishing these coreindicators in itself contributes a great deal to governance enhancement. Forinstance, the designers of the whole set of indicators are forced to think aboutwhat indicators are necessary for analysing the performance of social securityschemes; statisticians realize what statistics are necessary but lacking;policymakers discussing problems reflected by the indicators are able toprioritize solutions in an organized way.
Since indicators are a governance tool for social security schemes, theyshould in principle be constructed to measure in an organized way every
Table 7.4 Performance indicators for social security schemes
Dominica socialsecurity fund
Grenada nationalinsurance scheme
1999 2002 1999 2002
1. Ratio of ceiling to average insurable wage 3.2 3.1 2.3 2.1
2. Minimum pension as % of average insurable wage 7 7 13.3 12.3
3. Average old-age pension as % of averageinsurable wage
22 27 23.7 24.5
4. Active insured persons as % of employedpopulation
76 – – –
5. Percentage of self-employed persons contributing 5 – – –
6. Number of contributors per pensioner 7.1 4.7 13.9 7.1
7. Percentage of population over 60 receivinga pension
28 34 – –
8. Benefits and pensions as % of GDP 3.0 3.7 1.0 1.5
9. Reserve as % of GDP 32 40 23 31
10. Contribution rate (%) 9.75 9.75 9 9
11. Expenditure rate (%) 9.1 9.75 4.1 5.5
12. Investment income expressed as % ofinsurable earnings
4.4 5.0 4.2 5.5
13. Yield on reserves (%) 6.1 6.1 6.6 6.8
14. Administrative expenses as % ofcontributions
20.3 15.0 13.5 8.4
15. Administrative expenses as % ofcontributions and benefits
11.8 8.3 9.7 9.7
16. Administrative expenses as % ofinsurable wages
2.0 1.5 9.7 9.7
17. Reserve-expenditure ratio 8.3 8.7 17.1 16.3
Note: Contribution and expenditure rates for Dominica exclude redundancy benefit.
Source: ILO Actuarial Reviews (prepared by Derek Osborne).
440
Financing social protection

quantifiable aspect of the complex nature of a social security scheme. Althoughperfect standardization of social security schemes worldwide is impossibleowing to the range of different individual features in each scheme, the scope ofindicators is made as broad as possible. Many indicators should be validregardless of different scheme characteristics such as type of scheme, financingmethods (tax financed versus contribution financed, or PAYG system versus thefunded system) or type of benefits (pensions, short-term benefits, and so on).Furthermore, in many cases indicators measuring the performance of a specificscheme should be analysed in relation to the performance of all othercomparable schemes in the country (for example, the coverage of a particularold-age pension scheme should be assessed in the context of the coverageprovided by all existing old-age pension schemes).
The indicators presented here relate mainly to formal sector social insuranceschemes, and not all of them are necessarily fully applicable to schemesproviding universal and means-tested benefits. Different approaches must betaken for schemes in the informal sector, such as community-based schemes,for which statistics are by their very nature difficult to obtain. The followingpages provide a checklist of the key characteristics that all performanceindicators should have.
Desired characteristics of indicators
Indicators should meet certain requirements. In fact, they must satisfy asmany of the characteristics mentioned below as possible. Some of thesecoincide with characteristics required of statistical or financial reports (such asaccounting reports12), and some are more pertinent to indicators as such.
Intelligent benchmarks. As noted above, indicators mean nothingwithout benchmarks. The word ‘‘performance’’ may create the misunder-standing that every indicator can be used like a test score – in other words, thatwe can judge the scheme’s performance simply by looking at the value of theindicator. Some indicators do permit this kind of interpretation. For example,the higher the coverage rate, the better. However, the demographic ratio, one ofthe important indicators for measuring ageing in the scheme, does not giveconclusive information. Although it may reflect the age of the scheme, thedata may be blurred by bad governance – for instance, a bad compliancerecord for insured persons at early ages. A similar ambiguity applies to thefunding ratio.
Thus, ‘‘the higher the ratio, the better’’ is not generally true. Many financialindicators (such as the demographic ratio and the PAYG cost rate) fall into thiscategory. They may provide concise key information about the status of thescheme, but intelligent benchmarks are needed in order to assess theirmeaning. In addition, care is required when interpreting even seeminglystraightforward indicators. For instance, the replacement rate tends to beinterpreted along the lines of ‘‘the higher, the better’’, and obviously a
441
Financial governance

minimum level must be attained.13 However, overly generous benefits that areincompatible with the net income of working generations may lead tointergenerational conflicts, induce undesirable behavioural reactions, and havenegative repercussions on a scheme’s long-term financial situation or othernegative effects on the economy and society. The choice of benchmarksrequires substantial knowledge of a scheme’s objectives and limitations.
Benchmarks can take several forms:
– objective-based benchmarks, which simply take the objectives stipulatedin the laws as the central point of comparison (for example a replacementrate of 60 per cent in a pension scheme after a 40-year career);
– time-based benchmarks, where the performance of one scheme is simplycompared to the performance in previous periods; this may be sufficient insome mature schemes with a mature management and administration (forexample the administrative cost ratio);
– comparative national benchmarks, which simply compare the performanceof one scheme to that of other similar schemes (e.g. regarding claim-processing times),
– comparative international benchmarks, which compare the performance of ascheme to that of a similar scheme in another country (e.g. populationcoverage at a given age of the scheme).
This last type of benchmarks is also of particular importance for system-based performance indicators. In an environment where planners andmanagers have very little national experience to analyse, for example in theearly stages of new social insurance schemes, international benchmarksmay be the only point of comparisons for national performances. Whileclearly important, international benchmarking has obvious risks and meritsfurther exploration.
Table 7.5 presents a simple indicator showing whether a scheme isoverpromising benefits or not by relating the legal replacement rate atretirement age to the contribution rate. Mature European schemes are comparedwith the maturing Panamanian scheme. It is obvious that the presentrelationship between contributions and replacement rates is generous inPanama and Luxembourg. In Panama this is attributable both to schemeimmaturity and to an extremely generous initial pension. In Luxembourg thehigh indicator is attributable to a relatively heavy state subsidy. Comparing thePanamanian indicator and the mature European ones with each other shouldinject some rationality into the national debate on sustainable pension levels inboth parts of the world.
It is clear from table 7.5 that measuring the performance of each individualscheme in a country’s social protection system is necessary but not sufficient toassess the scheme’s overall performance. Although inconsistency in basicstatistics and the different social and economic situations of each country
442
Financing social protection

Table 7.5 Pension replacement rates in selected NSPSs1
Country Contribution rate forindividuals (includingemployers’ contribution) (%)
Pensionable age Years of service Replacement rate (%) 1% contribution buys . . .% replacement
Remarks
France 19.85 60 40 45.00 2.27 Contribution for
60 35 25.00 1.26 invalidity not included
65 40 45.00 2.27
65 35 45.00 2.27
Luxembourg 16.00 60 40 77.35 4.83 Plus state subsidy
60 35 68.45 4.28 equivalent to 8%
65 40 77.35 4.83 of contribution rate
65 35 68.45 4.28
Germany 19.50 60 Not applicable Plus state subsidy
60 equivalent to 5%
63 40 43.0 2.20 contribution rate
63 35 37.6 1.93
Belgium 19.86 60 40 3.5% contribution rate
60 35 for invalidity included
65 40 53.33 2.69
65 35 46.67 2.35
Panama 9.50 57–62 40 91.25 9.61 Plus state subsidy
57–62 35 85.00 8.95 equivalent to 0.5%
contribution rate1Data are for 1999/2000, depending on availability of information.
Source: ILO (2001c), p. 12; ILO (2002d).
443
Fin
an
cia
lg
overn
an
ce

usually militate against any naive cross-country comparison of indicators,studying indicators in the international context sometimes helps to understandthe situation in a particular country. For example, in any country the PAYG costrate will inevitably increase in the long run as the population ages if the benefitlevel is kept constant; this trend can be assessed by looking at the increasingdemographic ratio. Hence, stakeholders in a scheme with a young demographicstructure can roughly guess future developments by comparing their scheme’sindicators with those of schemes serving a more elderly population (forexample, schemes of OECD countries).
There are many potential pitfalls, however, and often subtle differences indefinition may lead to wrong conclusions. The following example willdemonstrate this. Table 7.6 shows the administrative cost ratio of nationalpension schemes, one of the most frequently used indicators for measuringadministrative efficiency in social protection. But the ratio is arrived at in twodifferent ways: as a percentage of contribution income and as a percentage ofbenefit expenditure.
Expressed as a percentage of benefit expenditure, some of the figures areexorbitant. But they are also misleading. Relatively young pension schemesface a relatively slowly maturing expenditure curve, which means that in theirearly days, while they are collecting contributions that largely build uptechnical reserves, their administrative cost as a percentage of benefit outflowmust be high. When administrative costs are measured as a percentage ofcontribution income, the figures are usually substantially lower – except in
Table 7.6 Administrative cost in national pension schemes or provident funds,selected countries, early 1990s
Country Administrative cost in national pension schemes orprovident funds (early 1990s) expressed in:
% of benefit expenditure % of contribution income
Austria 2.20 2.14
Canada 1.44 2.29
Chile 12.10 8.09
China 0.88 2.34
Denmark 0.12 0.12
Germany 1.57 1.58
Ghana 37.94 11.54
Grenada 54.25 13.16
Guatemala 19.15 12.30
Malaysia 18.71 6.52
Niger 51.83 33.04
Yemen 27.75 7.75
Source: Gillion et al. (2000), p. 248.
444
Financing social protection

countries where non-contribution resources such as taxes (Canada) or generalemployer subsidies (China) play an important role. In mature PAYG schemes(as in Austria and Germany) the values of the two indicators converge, as is tobe expected.
Using other countries’ indicators as benchmarks, while necessary, remainsdangerous. Even indicators of administrative efficiency (for example,contribution or benefit handling time), which are relatively easy to understand,are heavily influenced by social and economic development factors such as thepopulation’s understanding of the scheme or the general education level ofinsured persons, beneficiaries and staff, or the scheme’s equipment – mostnotably, the existence of an electronic database of insured persons andbeneficiaries. Therefore, it is sometimes inappropriate to compare a recentlyinitiated scheme in a developing country with one that is in a developed countryand has a long history behind it. In addition, the underlying statistics of differentcountries used for the calculation of indicators are often inconsistent. It isgenerally more informative to compare countries enjoying similar social andeconomic conditions.
Comprehensiveness. As mentioned, the scope of indicators should beas wide as possible and their dimensions such that they measure all essentialaspects of social security. In principle, standard indicators are constructed insuch a way as to be applicable to any country and any scheme, and to cover allessential dimensions, such as coverage, benefit and contribution level,administrative efficiency and financial status.
Consistency. Indicators must be internally consistent over time,especially those that have much to do with the scheme’s historicaldevelopment, such as the demographic ratio (the number of beneficiariesdivided by the number of insured persons). In addition, indicators should beconsistent with each other, since some of them are closely interrelated andstudied as a group (for example, the PAYG cost rate is in principle the productof the demographic ratio and the replacement rate). This interrelatedconsistency can be achieved by proper definition of each indicator and byusing consistent data in calculating related indicators.
Relevance. In some cases voluminous statistical yearbooks and ledgershave been filled with obsolete data (earning them the name of ‘‘datacemeteries’’) and cannot be used efficiently because the lack of hierarchy inthe data structure means that links to other data are missing. In other wordssome of the data, especially absolute figures, may simply not be relevant to thedecision-maker.
For example, although the absolute number of contributors to a socialsecurity scheme is basic, indispensable information, it is not sufficient in itselfto give us an idea of the extent of the scheme’s coverage. The extent of
445
Financial governance

coverage cannot be grasped unless we also know the total number of employees(including self-employed persons) in the country, or the number of those whoshould be covered according to national legislation: the first statistic gives anidea of the coverage rate in the wider sense (the number of people actuallycovered compared to the maximum potential number of people covered, anumber that is probably beyond the scope of the legislation), while thesecond gives an idea of the coverage rate in the narrow sense (the number ofpeople covered compared to the legal potential number under currentlegislation). Another example is the number of old-age pensioners. Tounderstand the financial aspect of the scheme, we must set the number ofthese pensioners against the number of contributors, which gives thedemographic ratio.
In short, indicators must provide relevant and meaningful informationthat contributes to a better understanding of the situation of a given socialsecurity scheme.
Quantifiability. Obviously, indicators must be expressed in numbersor figures. Since not every aspect of social protection is quantifiable,indicators inevitably have limitations. In addition, data deficiencies mayimpose further de facto limitations on ‘‘quantifiability’’. Feasibility is animportant aspect that should be taken into consideration when indicators aredesigned. If certain indicators have to be given up in the process of applyingthe design, at least planners and decision-makers are forced to decide whetherthose indicators should be used in the future or not, which means decidingwhether the relevant data should henceforth be collected. Good data are thefoundation of performance indicators, but this is not a one-way process:performance indicators may also be an incentive for improving underlyingdata.
The purpose of indicators is to raise questions. Table 7.6 raises the obviousquestion as to why in relative terms it is at least five times as expensive toadminister a pension scheme or a provident fund in Ghana or in Guatemala as inAustria and Germany. Cost structures are not identical, of course, but does thatreally account for the entire difference? Indicator values like these shouldtrigger further investigation. A set of performance indicators measuring thelegal, governance and financial characteristics of a social protection scheme isprovided in Annex 7-A1, along with simple quantitative examples for thecalculation of a basic set of indicators.
A social protection system is a complex structure in which the components(individual schemes) interact with each other, and these interactions may havea major impact on both society and the economy. One scheme might performexcellently – as indicated by all scheme-based indicators – but it might still doso at the expense of other equally important schemes. That is why it is alsonecessary to measure the performance of the social protection system as awhole (see below).
446
Financing social protection

7.2.3.2 Expenditure and performance reviews
Social protection schemes are all part of the overall NSPS. Individual schemeshave their own roles to play and objectives to meet but, as components of thesystem, they also serve the objectives of the overall social protection policy,which is part of the national social policy. The NSPS is not just a set ofindependent components: the schemes interact with each other, and theseinteractions have a major impact on the economy and public finance. It is thedesign of the social protection system as a whole, with different schemesplaying different roles in the coverage of population groups for differentcontingencies and needs that determines the ultimate outcomes of the overallnational social protection policy. The decisions as to what resources areallocated to different social protection functions and how particular schemesproviding coverage for these functions are financed have a major impact notonly on the effectiveness of the whole system but also on the financialsustainability of the system and its components. Decisions concerningindividual schemes should never be taken without assessing their impact onthe system as a whole.
The amount of available resources is always limited, and the mobilizationof new resources has to take into account the fiscal system’s overall capacity toraise revenue, as we saw in Chapter 4. The total sum of contributions paid byemployees, employers or other protected persons, direct taxes levied on income,and indirect taxes levied on consumption is finite. High contribution ratesresulting from the uncontrolled expansion of one scheme serving one sector ofthe population, may significantly limit the possibility of mobilizing resourceselsewhere to finance the social protection coverage of another population group.Gaps in coverage for one contingency (for example, unemployment benefits)may undermine funding for social protection schemes providing coverage forother contingencies. We observe often that in the absence of an unemploymentbenefit scheme, disability and early-retirement provisions are used assubstitutes.
The work on indicators that measure the overall performance of NSPSs isonly beginning, but there are hopeful signs that political initiatives mightaccelerate the process. One example comes from the EU and its ‘‘Open Methodof Coordination’’ which aims to facilitate the convergence of protection levelsbetween the very heterogeneous national social protection schemes through theuse of performance indicators. Box 7.4 provides more details on the process.
As already mentioned, the EU approach is still in its infancy. Generally andsystematically, an NSPS should – just like any of its component schemes – beassessed in terms of its objectives. As in the case of individual schemes, themain objectives can be grouped under the following headings: effectiveness,coverage and efficiency.
The reality in many countries is that not only is coordination of the socialprotection system deficient, but there is also no coherent, standardized
447
Financial governance

Box 7.4 Indicators in the ‘‘Open Method of Coordination’’ within the
European Union1
The EU recently embarked on a process of defining indicators forevaluating the performance of social security schemes in the frameworkof its Open Method of Coordination. This benchmarking exercise aims atimproving policies by facilitating the exchange of information andencouraging mutual learning from the experience of others while leavingthe responsibility for the policies with Member States. Based on a set ofcommon indicators, the Open Method of Coordination will serve as acommon framework to evaluate the performance of national policies in theattainment of specific objectives. The indicators are based on the premisethat they should be neutral towards different institutional structures, sothey focus on outcomes rather than on outputs. So far, this process doesnot aim to set clear targets, but this has not been ruled out for the future.However, the fact that the indicators are comparable and permit interna-tional comparison already implies a certain subtle level of benchmarking.
Open Method of Coordination procedures have been initiated in thefields of old age and pensions, health care and long-term care and socialexclusion; they thus account for more than 75 per cent of total socialexpenditure in the EU. Where old age and pensions are concerned,this recurring benchmarking exercise aims to improve the knowledgebase on the future sustainability of pensions and other forms of incomesecurity for the elderly. Grouped in three sets relating to the overarchingobjectives of adequacy, financial sustainability and modernization(responsiveness to changing needs), the indicators are linked to specificobjectives and are supplemented by a number of context indicators.While the choice of indicators has not yet been finalized, their basicstructure is already relatively clear:
1. Context information
– demographic information such as population by age group, lifeexpectancy at birth and demographic old-age dependency ratio
– household information (such as housing arrangements)
– social and pension expenditure as a proportion of GDP
– regulatory framework for pensions
2. Adequacy
– ‘‘at-risk-of-poverty rates’’ among older people
– relative income of older people compared to younger age groups
3. Financial sustainability
– employment rates of older workers
– effective retirement age
– effective old age dependency ratio
4. Modernization: Responding to changing needs
448
Financing social protection

A first report is not yet formally based on the set of indicators, butit already sets the stage for their further development. Picking out two ofthe indicators used in this report, box figures 7.4.1 and 7.4.2 respectivelyshow low at-risk-of-poverty rates for older people and employment ratesamong older workers.
Among adequacy indicators, the at-risk-of-poverty rate can beconsidered as a relatively uncontroversial indicator for the performanceof a pension system. Avoiding poverty among elderly persons is certainlya fundamental objective of any pension system, and the focus ondisposable income renders this indicator relatively neutral towardsdifferent institutional settings. However, it is relatively sensitive tomethodological choices, such as the selection of the poverty line. Policyconclusions drawn from this indicator could be very different, dependingon how exactly the indicator is defined.
As one example for the indicators on the financial sustainability ofthe pension system, employment rates among older workers are chosenbecause of their double effect on pension finances, both on theexpenditure and the financing side. However, this indicator is quitecoarse, given that it does not reflect the volume and quality of employ-ment among older workers, which would need to be considered in a morecomprehensive evaluation of financial sustainability.
Box figure 7.4.1 Elderly population at risk of poverty, EU, late 1990s
Note: Based on data from the European Community Household Panel (ECHP); disposableincomes adjusted for household size on the basis of the modified OECD equivalence scale.
Source: Council of the European Union (2003): Joint report by the Commission and the Councilon adequate and sustainable pensions, 7165/03, Brussels: Council of the European Union, p. 28.
Box 7.4 (cont’d)
449
Financial governance

information on all existing schemes. While scheme-based performanceindicators require standardized data, reviews of social protection expenditureand performance aim at establishing a framework permitting performanceassessment of the social protection system as a whole. The ILO suggests that theperformance of national social protection systems should be analysed with thehelp of formal test methodologies such as its Social Protection Expenditure andPerformance Reviews (SPERs). The main objectives of these reviews are:
. to identify the scope of social protection in terms of risks and needscovered, as well as existing gaps in coverage (risks and needs not covered orinsufficiently covered);
. to establish the costs in terms of annual expenditure (including allocation todifferent social protection functions) and financing structures (that is, the
The Open Method of Coordination has generated strong politicalinterest in the definition of indicators and in the improvement of theunderlying databases. It is an interesting approach to evaluate theperformance of social security schemes in a cross-national context thatmay also serve as a model in other contexts.
Note
1 This box was prepared by Christina Behrendt of ILO FACTS.
Box 7.4 (cont’d)
Box figure 7.4.2 Employment rates among older workers, EU, mid-2001
Source: Council of the European Union (2003).
450
Financing social protection

different sources of the ‘‘income’’ of the social protection sector, such associal security contributions/general taxation, financing at different levelsof the national government versus private financing, domestic versusforeign financing). Expenditure is measured both as a proportion of GDPand (in the case of public expenditure) as a proportion of overallgovernment expenditure;
. to analyse the effectiveness of the existing social protection system and itsschemes in terms of the main policy objectives (high and equitablecoverage, poverty reduction and income inequality reduction, incomesecurity in the face of different social risks and needs, and so on). Particularattention should be paid to coverage: its scope (risks and needs covered), itsextent (proportion of the relevant population covered), and its level andquality (replacement rates, etc.).
Generally, the focus is on discovering vulnerable groups that are notcovered or whose coverage is not sufficient to alleviate or prevent poverty.
Many of the scheme-based indicators described above can also be used toassess performance of particular social protection functions (served by one ormore schemes) and the NSPS as a whole. They must be aggregated andanalysed in comparison with indicators of social context, status and cohesion(like those proposed in OECD (2001c) and EUROSTAT (2001)). The followingpages give more details.
1. Effectiveness
Performance with respect to social outcomes. It is often difficult toidentify the impact of the social protection system on different social indicators,since the latter are normally affected by many other factors. Any analysis of thesocial protection system should therefore begin with a detailed description of itsoverall context: demographic situation and trends (age distribution of thepopulation, demographic dependency ratio, etc.), economic characteristics(economic growth, inflation, primary distribution of income, etc.) and the stateof the labour market (employment, unemployment, transfer dependency ratio).Demographic dependency ratios and transfer dependency ratios (the ratio ofpeople without any personal sources of primary income – children, unemployed,disabled and other non-actives of working age and over the working age – to thenumber of primary income earners) are the main indicators showing thedemand for transfers, both public transfers and private intra- and interfamilytransfers. When these ratios and the age structure of the population in questionreveal, for example, a predominance of dependants below the working age withonly a small proportion of elderly people, and the only existing form of socialprotection to be old-age pension schemes, something may be wrong with thenational social protection policy.
Key groups of outcome indicators are poverty rates, income inequality,health status indicators, nutrition indicators and indicators of social cohesion.
451
Financial governance

Time-series analyses or comparison with other countries’ experience can beused to estimate a social protection system’s impact on social outcomes.
Distributional performance. Examining the coverage provided for themost vulnerable groups of society is an important aspect of performanceanalysis. It should include:
. analysing the horizontal distribution of coverage and benefits (withparticular attention to gender distribution, formal/informal sector distribu-tion, and distribution among other groups identified as most vulnerable). Itshould cover analysis of the portion of cash benefits actually distributed tothese groups and assessment of their access to social protection and otherbasic social services;
. analysing the vertical distribution of coverage and benefits (with particularattention to the effectiveness of the system and its schemes in reaching thepoorest and closing the poverty gap). Income inequality before and aftersocial protection transfers should be analysed, and the proportion of thepoverty gap that is filled by the transfers should be estimated.
Administrative performance. One aggregate measure of administrativeperformance is the ratio of administrative costs to total expenditure. This ratioshould be determined for individual schemes, institutions and the socialprotection system as a whole. Other aspects of the administration of theparticular scheme and/or institution should also be examined: the effectivenessof contribution collection (compliance rate, arrears, and so on), processing ofbenefit claims and benefit payment/delivery.
2. Coverage
Coverage is measured in three dimensions:
. Scope: range of contingencies, risks and needs covered (old age andsurvivors, disability, unemployment, sickness and health, unemployment,maternity, family and children, poverty).
. Extent: personal coverage, percentage of persons covered (by sex, age,labour market status) within the general population or the target group.
. Level: level of protection (benefit levels, replacement rates, and so forth).
Scope of coverage. The scope of coverage is the range of contingenciesand needs covered by existing schemes: old age and survivors, long-termdisability, short-term incapacity and sickness, maternity and family, unemploy-ment, poverty and exclusion. Specific schemes delivering benefits and servicesin these contingencies have to be identified, and their specific extent and depthof coverage assessed.
Extent of coverage. This is the percentage of persons covered in a specificpopulation group (as defined by sex, age, labour market status), or the percentage
452
Financing social protection

of persons protected (i.e. insured persons and their dependants) within the totalpopulation; coverage has to be estimated based on existing regulations andpopulation, labour market and specific scheme data (such as the number ofprotected persons, insured, beneficiaries). Such information can be collected onlyat the level of the individual social protection scheme, and then aggregated.
There might also be a difference between protection de jure and de facto;actual access to existing benefits and services has to be estimated (by density ofhealth care or social welfare centres, number of staff per insured person, and soon), in addition to the percentage of beneficiaries within the potentialbeneficiary population (old-age pensioners as a proportion of those overretirement age, unemployment benefit beneficiaries as a proportion of the totalnumber of unemployed, social assistance beneficiaries as a proportion of peopleliving below the poverty line, and similar statistics). Thus, access is anotherfactor to be measured, by take-up (or ‘‘access’’) rates, which measure theproportion of persons subject to a given contingency and entitled to benefitswho actually received benefits or used services.
Level of coverage (depth/quality). The level of coverage is the level ofprotection provided (benefit levels, replacement rates and so on): legalreplacement rates, actual benefit level relative to average earnings, averageincome or any other comparable basis, patients’ co-payments as a percentage oftotal expenditure (or, at an aggregated level, private health expenditure as apercentage of total health expenditure), shares of income from different socialtransfers in cash and in kind in the total household income, medical servicesavailable relative to some normative basket of medical services, and other data.
Coverage can be mapped using matrices showing the scope, extent anddepth of coverage for different population groups. An example of such a matrixis given in table 7.7. In this example the focus is on the status and coverage ofpersons providing the main source of income for their respective households.If the necessary data are available, the status and coverage of other householdmembers should also be shown, classed not only by type of economic activity,but also by such features as age and sex.
Aggregate indicators of coverage. Partial indicators (quantitative andqualitative) could be used to calculate an aggregate index of social protectioncoverage using statistical methods similar to those used to build the UNDPHuman Development Index. Little work has been done so far on any aggregatemeasure of coverage. A compound coverage indicator must be a function of theaforementioned three types of partial indicators:
(1) indicators of the scope of social protection functions available relative to allthe social protection functions;
(2) indicators of the percentage of population protected for different contin-gencies and needs; and
(3) indicators of a level of protection measured by replacement rates or other tools.
453
Financial governance

In the absence of a generally accepted indicator, we might make use of anold acquaintance, the SER. It should be noted that since the size of total socialprotection expenditure (measured as a percentage of GDP) is also a function ofthe three dimensions of coverage, it may be used as an aggregated indicator ofcoverage:
Table 7.7 Matrix of coverage: An example
Function Health care Old-age pensions Unemployment benefits
Population group(household) bylabour market statusof the breadwinner
Extent ofcoverage(%)
Level ofcoverage(% of costreimbursed)
Extent ofcoverage(%)
Level ofcoverage (%)(replacementrate)
Extent ofcoverage(%)
Level ofcoverage (%)(replacementrate)
Civil servants
M 100 100 100 100 100 100
F 100 100 100 80 100 80
Employees in public enterprises
M 100 80 100 50 100 40
F 100 80 100 30 100 20
Employees in private enterprises
M 80 80 80 40 60 30
F 80 80 80 25 60 20
Self-employed outside agriculture
M 40 50 10 30 0 0
F 20 50 5 20 0 0
Self-employed in agriculture
M 10 50 0 0 0 0
F 5 50 0 0 0 0
Employees in the informal sector
M 0 0 0 0 0 0
F 0 0 0 0 0 0
Self-employed in the informal sector
M 0 0 0 0 0 0
F 0 0 0 0 0 0
Unemployed
M 15 50 100 0 0 0
F 10 50 100 0 0 0
Economically inactive above retirement age
M 30 100 50 35 0 0
F 20 100 30 25 0 0
Economically inactive below retirement age
M 10 50 5 35 0 0
F 5 50 5 35 0 0
Source: ILO.
454
Financing social protection

SER ¼Xni¼1
bri · rri ð7:1Þ
where:SER ¼ social protection expenditure ratio,bri ¼ ratio of the number of beneficiaries (persons protected) of scheme i
to total population,rri ¼ ratio of expenditure per beneficiary (person protected) to GDP per
capita,n ¼ number of existing social protection schemes.
Another possible and important aggregate indicator of coverageis the proportion of income from social protection transfers (in cash and inkind) in total household income. The necessary data should normally beavailable from the national accounts and/or from household budget surveys.
Information and data requirements. A complete list of all socialprotection programmes must be drawn up. This list should include:
. social insurance-type programmes (mandatory);
. state programmes;
. local government programmes;
. voluntary protection substituting for mandatory social insurance;
. mutual and community-based activities;
. charitable activities (domestic and foreign);
. foreign aid (food and other);
. other schemes.
For each programme the following is required:
. regulations making it possible to identify the number of protected persons;
. information necessary to estimate actual coverage (taking into accountaccess problems owing to distance, staff shortages, lack of information, andother obstacles);
. data on insured persons and beneficiaries (by sex, age group, labour marketstatus, type of employment);
. data on benefit levels and services delivered;
. data on total expenditure (benefit expenditure and other expenditure for allschemes).
General background information that may relate to population subgroupsserved by individual schemes must include:
. population by age and sex;
. labour force by age and sex (formal and informal);
455
Financial governance

. total employed (formal and informal);
. employees by age and sex, by sector (public, private, economic sector, typeof contract – full time, part time, seasonal), by size of enterprise, etc.;
. self-employed, by age, sex, economic sector;
. family workers, by age and sex;
. characteristics of underemployment;
. unemployment, by age, sex, economic sector, etc.;
. average earnings, by age, sex, economic sector;
. any other estimate of average income that could be used as a reference toassess levels of cash benefits.
3. Expenditure, financing and efficiency
The objective is not only to identify existing social protection schemes and assesstheir costs in terms of expenditure, but also to reveal and assess the efficiency offinancing patterns and the allocation of overall expenditure among different risksand needs (functions). Transactions financing social protection schemes can begrouped by type and source of revenue. Efficiency should be analysed bycomparing the social protection system’s outcomes to its overall costs.Benchmarks based on other countries’ experience can be used for this purpose(for example, we could compare social protection expenditure and poverty rates,income inequality, health status, and other factors in different countries).
Another important question relates to the issue of who is financing a givenscheme and what the sources of finance are for the social protection system asa whole – in other words, are resources coming from different levels ofgovernment (central, state or regional, or local), corporations, non-profitinstitutions, households, or the rest of the world.
Ideally, a matrix should be constructed, providing information on socialbenefits by function and by financing source (like table 1.4 in Chapter 1 or thesocial accounting matrix described in Scholz et al., 2000). This may not alwaysbe possible, since not all receipts can be assigned to specific functions – receiptsof the same type and from the same source may finance a number of socialprotection schemes associated with different functions. However, it shouldalways be possible to establish a matrix listing institutions, the schemes theyadminister, and financing sources.
Expenditure (both overall and by function) should be analysed as a ratio toGDP and also as a ratio to consolidated general government revenue andexpenditure. In many developing countries, the GDP ratio is low but the ratio tototal public revenue collected through all forms of tax and social contribution iscomparable to that in developed countries, owing predominantly to the smallsize of the government in terms of the revenue collected.
Figures 7.1 and 7.2 use a simple example to show why expenditure ratios toGDP might be useful indicators of the inputs that a country is willing to invest
456
Financing social protection

in a certain type of benefit but that may not be significant in terms of outcome.Figure 7.1 ranks selected countries by the percentage of GDP they invest in thehealth care system, ranging from Myanmar with 2.6 per cent of GDP to theUnited States with about 13.7 per cent.
Figure 7.2 relates this same investment to a crude outcome indicator,namely disability-adjusted life expectancy (DALE). DALEs are used by theWHO as a central indicator for health status (or health attainment).14 Theefficiency indicator simply divides the per capita DALE by the percentage ofGDP spent on health. This may not paint a fair picture, since we probably havevery small marginal benefit curves in the higher spending ranges of the healthsector, and because health status is also determined by many other factors inaddition to the health care system. United States social policy makers may stillwish to ask themselves whether investing additional resources in the healthsector might be warranted given the fact, for example, that poverty is stagnatingat a relatively high level. Chinese policy makers might ask themselvesessentially the same question but, unlike the United States, China would almostcertainly have no reason to further contain the flow of resources into healthcare. The United Kingdom, which spends at about half the United States leveland has a tightly regulated health system, might serve as a point of comparisonfor Germany and the United States.
This cross-country comparison leaves many questions unanswered,demonstrating the need for further research on social protection outcome andefficiency indicators.
Figure 7.1 Total health expenditure (as % of GDP), selected countries, 1997
Source: WHO.
457
Financial governance

4. An aggregate indicator of the level of social protection and
the efficiency of provision
With this section we venture into uncharted territory. We observed in Chapters2 and 3 in particular that the SER does not really reflect the level of effectivesocial protection in a country. It is an input variable rather than a measure ofoutcome. Moreover, it does not give any indication whatsoever of howefficiently social protection is provided. To this date there are no widelyaccepted aggregate indicators of the effectiveness and efficiency of socialprotection in a country.
Nevertheless, there has been very little research on this problem. In the ILOwork has just begun. Global indicators of social protection and efficiency levelsare by no means exclusively of academic interest; they have a potentiallypowerful political impact. If a rich OECD country discovered that its socialprotection indicator was lagging behind that of a much poorer country, or thatits level of protection was achieved by a much higher allocation of scarceresources, policy makers and interest groups would be bound to ask somepointed questions.
The following paragraphs reflect current ILO thinking. Global indicators ofeffectiveness and efficiency must combine the following variables:
Scope of formal social protection: the number of social security branchesplus social assistance that exist in a country – that is, a number from 1 to 10 (or12 if we include education and housing). These data are available.
Figure 7.2 Disability-adjusted life years per percentage point of GDP spent on
health care, selected countries, 1997
Source: WHO.
458
Financing social protection

Social protection coverage as measured by ratios such as:
. the proportion of the population that has access to health care;
. the proportion of the population that would have access to basic income-security schemes if in need;
. the proportion of the labour force and the elderly/disabled that have accessto or receive old-age and/or disability benefits.
Level depth/quality of coverage15 as measured by ratios such as:
. the average amount of benefits paid by pensions as a proportion of the pov-erty line (for an adult equivalent preferably as a proportion of a relative line);
. the average amount of social assistance per recipient (basic income-securitypayment per month) as a proportion of the average individual poverty gap inthe recipient group;
. the number of contacts with health care services standardized by agecompared to an international benchmark (or a similar ratio).
Social protection expenditure, as measured by overall expenditure inpercentage of GDP (i.e. the SER).
Two new aggregate indicators are suggested here which combine thevariables described above. In this context we should bear in mind that theseindicators provide merely an initial indicative diagnostic marker for certaindeficiencies in an NSPS. By themselves they can never provide concrete evi-dence as to where the deficiencies actually lie. For this a more in-depth systemanalysis is required, backed up by more detailed performance indicators.
Effectiveness16 of (public or total) social protection. As a proxy forthe fuzzy concept of the social protection level in a country, an indicatorcan be created which might take the following mathematical form:
ESP ¼Xtoi¼1
ei � covri � depthi
!�to ð7:2Þ
where:to ¼ total number of branches of social security (or more modern number
of risk categories, in other words, 10–12) that enter into the indicatore ¼ dummy variable that describes the existence or non-existence of the
corresponding branch of social protection (0–1 variable)covr ¼ real coverage rate/protection rate of the corresponding branch of
social security (variables with values between 0 and 1); this mayinclude estimates of the number of people who are protected de factobut not de jure (in countries where schemes exist but do notfunction, the difference between the two is potentially big)
depth ¼ indicator of the depth of the protection provided by the branch ofsocial security in question (variables with values between 0 and 1,see above17)
459
Financial governance

A relevance weight might also be added to the index, reflecting a certainorder of priority/relevance for social schemes. Housing benefits, for example,might be relevant only for a minority of the population, and therefore shouldnot have the same weight as pensions. It could also be argued, for example, thata basic social assistance scheme is a higher priority than a sickness benefitscheme. Even if 100 per cent of the population had access to both kinds ofbenefits, these benefits would still play different roles in the overall level ofprotection. Interesting discussions could be conducted on this subject.
Adequate indicators for covr and depth would have to be selected for allbranches of social security.
Efficiency of (public) social protection. This indicator is measured by theratio of the effectiveness indicator and the SER:
FSP ¼ ESP=SER0 ð7:3Þ
In other words, how much social protection is bought by 1 per cent of GDPexpenditure. The higher the figure, the greater the efficiency. SER0 is the so-called maturity-adjusted social expenditure ratio. In this ratio, expenditure inthe different branches of social protection is adjusted for the fact that someschemes might not be fully mature.18
Box 7.4 provides a sample calculation for a hypothetical OECD-typecountry. It is hoped that social protection indicators will be used along similarlines in the near future.
Box 7.5 Sample calculations of aggregate national effectiveness
and efficiency indicators for social protection systems
If a country has a social assistance scheme that in theory is accessible tothe entire population (provided they are eligible) and the average benefitis 80 per cent of the individual poverty gap, then e would be equal to 1,covr would be equal to 1 since the benefit is available to everyone in need,and depth would be 0.8, since the benefit does not close the poverty gapcompletely. Thus, this social assistance scheme would add a value of0.8 to the overall score of all branches of social protection (to) in thecalculation of the effectiveness of social protection as a whole.
Furthermore, a country that spends 25 per cent of GDP on socialprotection, but reaches an effective level of protection of 50 per cent,would have an index of 2, whereas a country spending 30 per cent butattaining a protection level of 100 per cent would have an index of 3.33 –indicating that it was making better use of resources.
A hypothetical calculation of the two global indices of socialprotection effectiveness and efficiency in a mature system is shown inbox table 7.5.1. According to the table, the model country would reach an
460
Financing social protection

Box 7.5 (cont’d)
Box table 7.5.1 Model calculations for aggregate social protection indices
Branch/risk Scope/
existence
Coverage
(covr)
Indicator Depth
(depth)
Indicator Score for
effectiveness
index
Expenditure
in % of
GDP
Experimental
weighting
relevance
Adjusted
effectiveness
score
Socialassistance
1 1 % of totalpopulationthat hasaccess incase of need
1 averagebenefitin %povertygap
1 2 1 1
Old age 1 0.9 % of labourforcecovered(includingold peoplereceiving)
0.75 averagebenefitin % ofpovertyline
0.675 9 1 0.675
Invalidity 1 0.9 % of employed(formal andinformal)covered(includingdisabledpeoplereceiving)
0.75 averagebenefitin % ofpovertyline
0.675 2.5 1 0.675
Survivors 1 0.9 % of childrenanddependentspouseseligible incase ofcontingency
0.5 averagebenefitin % ofpovertyline
0.45 2 1 0.45
461
Fin
an
cia
lg
overn
an
ce

Box table 7.5.1 (cont’d)
Branch/risk Scope/
existence
Coverage
(covr)
Indicator Depth
(depth)
Indicator Score for
effectiveness
index
Expenditure
in % of
GDP
Experimental
weighting
relevance
Adjusted
effectiveness
score
Sickness 1 0.9 % of employed 0.7 averagebenefitin % ofpovertyline
0.63 2 0.75 0.4725
Maternity 1 0.9 % of femaleemployedcovered
0.7 averagebenefit in %of povertyline
0.63 1.5 0.75 0.4725
Unemployment 1 0.9 % of labourforcecovered
0.7 averagebenefitin % ofpovertyline
0.63 3 1 0.63
Family benefits 1 0.75 % of childrencovered
0.5 averagebenefitin % ofpovertyline
0.375 1 0.75 0.28125
Work injury 1 0.9 % of employedcovered
0.8 averagebenefitin % ofpovertyline
0.72 0.5 0.5 0.36
Box 7.5 (cont’d)
462
Fin
an
cin
gso
cia
lp
rote
ctio
n

Health 1 0.95 % of populationwith access tohealth facilities(both inpatientand outpatient)
0.9 estimatedaveragequalityindex(e.g. lifeexpectancyat birth forfemales asa percentageof maximum)
0.855 7.5 1 0.855
Housing 1 0.25 % of poorpopulationcovered
0.5 averagebenefit in %of ho2usingcost inpoverty lineconsumptionbasket
0.125 0.3 0.25 0.03125
Basic education 1 0.95 % of childrenunderage 16attendingschool andreceivinga benefit
0.5 averagebenefitin % ofpovertyline fora child
0.475 0.9 1 0.475
Total 7.24 32.2 10 6.3775
Effective socialprotection index
0.60 0.64
Efficiency of thesystem
0.0187 0.0208
Source: ILO.
463
Fin
an
cia
lg
overn
an
ce

7.3 SUMMARY
The history of social security is filled with examples of deficient systemperformance. The same history shows, however, that such performance isusually the result of bad governance, in particular bad financial governance.Sound governance might be more important than a scheme’s flawless initialdesign. Design faults can always be remedied by subsequent modifications ofthe law provided they are detected early and the need for corrections can beplausibly demonstrated, inter alia through sound performance-monitoringinstruments.
Instruments for good governance in social protection consist of legal andmanagerial instruments: the former define the objectives of national systemsand schemes and the monitoring and auditing instruments that have to be used,while the latter describe the schemes’ operations in verifiable and preferablyquantitative terms and monitor their performance.
Performance monitoring requires:
– reliable statistical and accounting information;
– clear and verifiable, preferably quantifiable objectives, defined ulti-mately through the basic legislative framework of an NSPS; and
– a set of solid performance indicators and intelligently chosen bench-marks.
This chapter provided a checklist of all the legislative and managerialinstruments that financial or quantitative analysts of social protection schemeshave to design or apply themselves or help others to do the same. Without clearand quantifiable outcome indicators it is difficult to measure the performance ofa social protection system that may redistribute up to one third of a country’sGDP. Without such measurements the redistribution of resources through thesystem is hard to justify in the long run. The credibility of the system may be injeopardy, and credibility is the most important capital of the system and itsvarious schemes. Losing that capital could end public support for any scheme,which in turn will be the end of the scheme.
Our major concern here – which we are not trying to hide – is the fact thatthe instruments meant to ensure an effective and optimal redistribution ofresources are underdeveloped or at least under-applied. This is not particularly
unadjusted score of 60 per cent out of a total possible score of 100 percent (full social protection). If the single branches are weighted byrelevance, the score increases to 64 per cent. This adjustment also slightlyincreases the efficiency score.
Box 7.5 (cont’d)
464
Financing social protection

good news. A lot remains to be done in the development and routine applicationof sound performance indicators in social governance – clearly a field withgood prospects for those seeking employment in social protection research!
The questions listed below should be continually asked and answered inorder to keep the system and all its components functioning properly.
A checklist of questions for financial and social policy analysts
When analysing the level and quality of social protection in a country or theperformance of a national social protection scheme in order to improve itsgovernance, the analyst may find it helpful to ask the following questions:
1. Does the legal system in the country define exactly:
Who is covered?Who contributes?Who provides what benefits?Who supervises the functioning of:
– the system as a whole?
– the individual schemes?
2. Does the regulatory system provide for regular performance checks?
3. Does a system of national statistics and accounting exist?
4. Does it capture the full picture of the country’s social situation?
5. Has a national Social Protection Expenditure and Performance Review(SPER) been undertaken?
6. Do all schemes have comprehensive and mandatory statistical andaccounting frameworks?
7. Has a system of scheme-based performance indicators been devel-oped, and is it in use?
8. Are actuarial studies and social budget simulations carried outperiodically and are the resulting recommendations taken intoaccount when policy decisions are made?
Further reading
To find out more about:
. Regulation and supervision of social security schemes, turn to:
– Gillion et al. (2000), Chapters 9 and 10
– Cichon and Samuel (1995)
465
Financial governance

Notes
1 The discussion in this section largely relates to private pension systems in Latin America.2 OECD (2001c).3 See also the Labour Statistics Recommendation, 1985 (No. 170).4 See ILO (1957).5 By ‘‘governance’’ we mean the management of social security not only in a narrow sense but also
in the broad sense of the ways in which the objectives of social security are effectively and efficientlymet.
6 See Bailey (1997b).7 Statistical yearbooks often lack necessary information because the statistics are not related to other
data, and absolute figures which are not put in relation to benchmarks have little informational value.8 See, for example, Tamburi and Mouton (1976).
. Social protection statistics and accounting, see:
– EUROSTAT (1996): The European System of Integrated SocialProtection Statistics (ESSPROS). A Manual (EUROSTAT, Luxem-bourg) http://www.europa.eu.int
– IMF (2001): Government Finance Statistics Manual 2001 (IMF,Washington, DC) http://www.imf.org/external/pubs/ft/gfs/manual/synopsis.htm
– ILO (2001): Social Security data required for the valuation of anational social security system (ILO, Geneva) http://www.ilo.org/public/english/protection/socfas/research/stat/tabeng.doc.
. Social budgeting, see:
– Scholz et al. (2000)
. Actuarial work in social security, see:
– Cichon et al. (1999)
– Plamondon et al. (2002)
. Social security/social protection performance analysis, see:
– Hagemejer (2000), available at http://www.ilo.org/public/english/protection/socfas/research/sper/spersmet.pdf
– ILO (2000): Performance indicators, available at http://www. ilo.org/public/english/protection/socfas/research/intror.htm#perfind
– OECD (2001c).
Further reading (cont’d)
466
Financing social protection

9 See the discussion of performance measurement in Allen and Tommasi (2001), Chapter 15, onwhich the classification of performance measures described here is largely based.
10 See Hurst and Jee-Hughes (2001) and WHO (2000). Both approaches have many similarities;generally they try to assess health care systems against three sets of objectives associated with healthimprovement, responsiveness and access, and expenditure and financing, respectively. Both the averageoutcome levels achieved and the distribution of outcomes are assessed. See also Allen and Tommasi(2001), Box 15.1, for a detailed set of performance indicators used to assess the performance of theUnited Kingdom health sector.
11 Our definition of a social protection (social security) scheme is based on the ESSPROS approach(see Chapter 1). Some of the indicators may also be used to analyse institutions that administer more thanone scheme.
12 See OECD (1997) for a summary of the criteria for National Health Accounts (NHAs).13 See ILO Social Security (Minimum Standards) Convention, 1952 (No. 102), and other
international standards.14 WHO (2000), p. 28. DALEs are calculated in roughly the same way as life expectancy, but the
number of life years is reduced by a weighted number of years spent in disability. The data used tocalculate the indicator of efficiency are taken from WHO (2000), Annex, Tables 5 and 8.
15 Ideally, quality indicators should be supplemented by indicators of redistributive effectivenessand efficiency. Redistributive efficiency and effectiveness could be measured by the proportion of theaggregate national poverty gap that is closed by social protection and the decrease of pre-transfer versuspost-transfer Gini coefficients. However, poverty gaps and Gini coefficients might be difficult to collect.Furthermore, the counterfactual in the comparison of pre-transfer and post-transfer distribution might bedifficult to establish.
16 We could limit this indicator to a joint coverage indicator, but this would mean losing someindicative power when it comes to using a highly aggregated indicator to alert governments and socialpartners to flaws in their social protection systems.
17 If the ratio of average pensions to the average poverty line exceeds 1, then that variable would beset to 1.
18 This largely affects pension schemes. Assume that a national pension scheme covers the totalactive population but has not yet reached maturity with respect to pension payments. The product ofcoverage, scope and depth would be high and expenditure would still be very low, indicating a verypositive contribution to the efficiency index even though the scheme might waste a good deal of moneyon administration and other expenses. This could be avoided by multiplying the scheme by a maturityindex. If, for example, the pension scheme serves only 20 per cent of the pensioners that it wouldprobably reach in its stationary state, then pension expenditure in the SER could be multiplied by 1/0.2.Alternatively, this could be done by using SEM-type curves as described in Chapter 2, box 2.1.
Financial governance
467

ANNEX 7-A1 A SCHEME-BASED SET OF
PERFORMANCE INDICATORS
(1) Legal indicators
With respect to the legal issues involved in social security schemes, the ILOConventions and Recommendations on social security – for example, the SocialSecurity (Minimum Standards) Convention, 1952 (No. 102) – are used asstandard references on key design features of social security schemes (such asextent of coverage, the replacement ratio, the indexation of benefits). Legalindicators are initially classified as concerning contributions or benefits. Theextent of coverage is the most important concept for indicators associated withcontributions, and the benefit level (quality of coverage) is the most importantconcept for indicators associated with benefits. Accordingly, three indicatorscan be selected as ‘‘core’’ legal indicators:
. legislative coverage rate for insured persons (L-1-1);
. relative average replacement ratio of benefits in payment (L-4-1); and
. effective rate of adjustment of benefits in payment (L-5).
Legal contribution indicators
Among indicators concerning contributions, the extent of coverage – measurednot only by the number of persons covered but also by the amount of earningssubject to contributions – is the main feature to be assessed.
Extent of coverage
High coverage is one of the main objectives of a social protection scheme, andlow coverage often emerges as a major problem. Furthermore, the issue is verycomplicated because the definition of ‘‘coverage’’ is ambiguous in many cases,and differently used in each case. Cases of low coverage can be complex and itis often very difficult to obtain adequate and reliable statistics to allow problemsto be identified. Consequently, we propose to analyse the different dimensionsof coverage in an organized way, so that each indicator corresponding to eachdimension highlights the different reasons for coverage problems.
The extent of coverage can be analysed in two dimensions, namely the legal(or systemic) aspect and the governance (or administrative) aspect. Since legalindicators are supposed to examine the framework of the scheme, ‘‘legislativecoverage’’ is measured here. It is designed to measure the estimated ‘‘legaltarget population’’ entitled to coverage under the present legislation, ascompared with the total population, total labour force or total number ofemployed, depending on the type of scheme in question (see indicator [L-1-1]:legal coverage rate for insured persons). This indicator shows how universal the
468

scope of the legislation is, and has little to do with actual coverage figures. Theactual coverage compared with the legal target – which tells a great deal aboutthe management of the scheme in question – is measured by the governanceindicators of coverage (see indicator [G-1-1]: registration ratio among coveredpersons, and indicator [G-2-1]: effective contributory ratio among insurablepersons). The legal coverage should be defined as the total number of coveredor insured persons who should be covered by a given scheme (or benefit branch,such as old-age pensions or unemployment benefits) divided by the totalpopulation, labour force or employment.
Coverage can also be measured not only by number of people insured,but also by the number of employers or establishments covered (see indicator[L-1-2]: legislative coverage rate for employers). It goes without saying thatcoverage in terms of insured persons is a more important indicator thancoverage for employers, and that unless care is taken, a coverage rate calculatedin terms of employers might give a skewed view, because every establishmentemploys a different number of people. Nevertheless, the figure for coveragebased on employers provides some information, especially for the employersthemselves, who are often direct partners in collecting contributions.
The catchment of insurable earnings (or the contribution base) comparedwith total earnings should reflect the percentage of income that is targeted ina social security scheme. Therefore, the ceilings and floors on earnings subjectto contributions, often stipulated in legislation, should be assessed on the basisof the average individual earnings (see indicator [L-2-1]: relative level of limitson insurable earnings, indicator no.1; [L-2-2]: relative level of limits oninsurable earnings, indicator no. 2; and [L-2-3]: catchment of earnings).
In the category of coverage associated with legal indicators, the legislativecoverage rate for insured persons (L-1-1) is one of the core indicators. Althoughit is very difficult to establish the number of the legal target population(a statistic almost always obtained merely by estimate), this indicator tells theextent of the possible potential coverage of the labour force if it achieved thecoverage stipulated in the legislation.
Other contribution indicators
The average age of insured persons is treated as an indicator of the demographicstatus of the scheme (see indicator [L-3]: age structure of insured persons).
Benefit (quality of coverage) indicators
The main indicators concerning benefits are those that indicate the level ofbenefits compared to the actual level of working generation wages/salaries/earnings, or some other benchmark (such as average consumption, minimumwage, poverty line or subsistence minimum or other national or internationalminimum standards).
469
Financial governance

Benefit level
The present benefit level, or more specifically, the average replacement ratio inthe case of cash benefits such as pensions, should be examined in relation to theaverage insurable earnings or wages, broken down by each type of benefit – forexample, sickness, unemployment, old-age, employment injury, family, mater-nity, invalidity, survivors (see indicator [L-4-1]: relative average replacementratio of benefits in payment). Although this indicator is also influenced bynon-legal factors (such as the history of the scheme, the past contributing periodof individual insured persons) and also plays an important part in the financingof a scheme, it is classified as a legal indicator because it reflects, above all, thedesign of the scheme over the long run.
Both the average replacement ratio of all beneficiaries of the same benefittype (such as old-age pensioners) and the average replacement ratio of newlyawarded benefits should be examined in order to assess not only the totalaverage but also to judge the level of newly awarded benefits, since the mixedaverage of all benefits in the long history of the scheme does not always revealmuch about the effectiveness of the benefits awarded most recently (seeindicator [L-4-2]: relative average replacement ratio of benefits for newlyawarded benefits). The average contributing period for old-age benefits is alsostudied as one of the determinants of benefit level (see indicator (L-4-3]:average contribution period).
Besides the current benefit level, it is important to see how the real benefitvalue was maintained in the past through indexation, especially long-termbenefits such as pensions, because inflation often significantly affects the realpurchasing power of the benefits in many existing schemes. Accordingly,indicators concerning indexation are also admitted (see indicator [L-5]:effective adjustment rate of benefits in payment).
Other benefit indicators
The average age of pensioners is an indication of the demography of the scheme(see indicator [L-6]: age structure of beneficiaries).
Another aspect of scheme coverage extent must be assessed as well: thecoverage ratio for beneficiaries. This is a difficult concept both to formulateprecisely (for example, ‘‘Who might be the target beneficiary?’’) and tocalculate (‘‘What statistics are available?’’). In addition, it is not always clearexactly why potential beneficiaries are not covered. (There are always manyreasons why certain persons cannot receive benefits: They might not belegally covered, or they might not satisfy qualifying conditions; and it is notalways easy to count those who are not denied benefits for each specificreason.)
However, the number of beneficiaries can be gauged against a ‘‘broad’’target, to provide a rough idea of the extent to which existing needs are fulfilled
470
Financing social protection

by a scheme. For example, the target efficiency of the unemployment benefitmay be measured by relating the number of those receiving unemploymentbenefits to the number of unemployed persons. Similar indicators can bedesigned for other benefit schemes: old-age pensioners compared to the numberof those over retirement age, disability pensioners compared to the total numberof disabled, recipients of social assistance benefits compared to the number ofpeople with incomes below the social assistance intervention line (povertythreshold) (see indicator [L-7]: benefit coverage).
Nevertheless, it can be difficult to distinguish those who are not coveredowing to the design of the scheme (those who are not entitled to benefits eventhough they meet some of the criteria, such as age, disability, poverty, orunemployment) from those who are not covered as a result of the deficientgovernance or administration of a scheme (such as people who are not informedabout the possibility of applying for a benefit, who are not reached by socialworkers, who do not apply for benefits for other reasons, or who are refusedbenefits despite their legal entitlement). Ideally, some of the ‘‘governance’’indicators should show the ratio of those actually receiving benefits to thosewho are legally entitled to them (the ‘‘take-up ratio’’), but usually it is virtuallyimpossible to collect the necessary information.
(2) Governance indicators
In order to design a set of indicators for the management – or, more broadlyspeaking, for the governance of a social protection scheme, the first step is toidentify key elements in the scheme’s administration. Management objectives areto register as completely as possible those persons who should be coveredaccording to the legislation (employees and employers in case of a socialinsurance scheme), to collect required contributions from them, and to providebenefits without mistakes and on time. Record-keeping is critical to back up theseoperations (see Ross, 1996). The cost of administration should be minimized aslong as the necessary scheme activities are being carried out properly.
Necessary tasks are grouped in three categories: registration, contributioncollection and benefit payments. In addition to these categories, indicatorsmeasuring administrative cost are also used.
The core governance indicators are:
. Registration ratio among insurable persons (G-1-1)
. Effective contributory ratio among insurable persons (G-2-1)
. Percentage of contributions in arrears during the year (G-4-1-1)
. Speed of contribution collection during the year (G-4-2-1)
. Average claim-handling time for newly awarded benefits (G-7)
. Relative level of administrative costs (G-10)
471
Financial governance

Registration
In order to measure the effectiveness of that vaguely defined term‘‘coverage’’, aspects of registration and contribution collection must beseparated. The registration of employers and employees is the first step thatmust be taken in order to define the target of contribution collection. It is ascheme’s first task to identify people who by law should be covered and toregister as many of those employers and employees as possible. Parallel withthe legal coverage mentioned before is the registration of both employers andemployees. The percentage of registered persons compared with the legaltarget is used as an indicator of registration (see indicators [G-1-1]:registration rate of legally covered persons, and [G-1-2]: registration rateamong liable employers.)1
Contribution collection
The percentage of people who actually contribute, compared with the numberof insured people or with the legal target population, can be used as an indicatorto measure actual contributions compared with potentials (see indicator[G-2-1]: effective coverage rate of insured persons). This indicator is usuallytermed a ‘‘coverage’’ rate, and it is one of the most important coverageindicators. The same type of indicator can be set up for number of employers(see indicator [G-2-2]: effective coverage rate of legally covered employers).
In order to assess more detailed contribution collection operations fromthe standpoint of timeliness and efficiency, several indicators have beenestablished. Some measure the volume of contributions in arrears (see indicator[G-4-1-1]: proportion of contributions in arrears during the year, and indicator[G-4-1-2]: relative level of accumulated contributions in arrears). Othersfocus on the speed of contribution collection (see indicators [G-4-2-1]: speedof collection of contributions due during the year, and [G-4-2-2]: speed ofcollection of contributions in arrears).
In addition to the indicators showing the state of contribution collection,indicators concerning inspections and record-keeping are used to assess keyback-up aspects of contribution collection (see indicators [G-3-1]: percentageof employers inspected, [G-3-2]: ratio of successful inspections, and [G-5-1]:record-keeping ratio of contribution collection).
Benefit payment
The administration of benefit disbursement must be efficient in order toguarantee timely benefit payment, which in turn will enhance the reliability ofsocial security. To find out whether benefits are paid on time without errors, it isimportant to investigate outstanding benefits, claim-handling time and the errorrate for benefit payments (see indicators [G-6]: percentage of outstanding
472
Financing social protection

benefits, [G-7]: average claim-handling time for newly awarded benefits, and[G-8]: error rate on benefit payments).
Administrative expenditure
Since social insurance administration consists basically of contributioncollection and benefit payment, it is appropriate to relate administrative costto the amount of contributions (or insurable earnings) or the amount of benefitspaid to beneficiaries. The administrative cost divided by total insurable earnings(in other words, the PAYG administration cost rate) gives an indication ofthe magnitude of administrative cost compared to the contribution rate (seeindicator [G-10]: relative level of administrative costs). This indicator, ofcourse, also has a financial aspect.
For a better understanding of the structure of administrative expenditure, thepercentage of personnel cost, often the most relevant factor in administrativeexpenditure, is also examined (see indicator [G-11]: ratio of personnel cost toadministrative cost). In addition, staffing level and relative level of staff salaryare investigated in order to ascertain how much effect the demographic factorand the average salary factor have on personnel cost, given that personnel costis the number of staff multiplied by the average staff salary (see indicators[G-12]: staffing level relative to insured persons and beneficiaries, and [G-13]:relative staff salary level).
The indicators mentioned above relate for the most part to the adminis-tration of social insurance schemes. We could develop a similar set of indicatorsrelated to universal and means-tested schemes, focusing on the registration ofpotential beneficiaries, claims processing and administration costs. In this case,instead of contribution collection we would assess the adequacy and timelinessof procedures of disbursing budgeted resources (from central and localgovernment budgets).
(3) Financial indicators
Financing is assessed in three dimensions: the macroeconomic aspect, theactuarial aspect (namely, the contribution rate and the PAYG cost rate)and the investment aspect. The core financial indicators used for suchassessment are:
. GDP ratio of expenditure and income (F-1)
. Pay-as-you-go contribution rate (with and without government subsidies)(F-3)
. Funding ratio (F-5)
. Dependency ratio (F-6)
. Average annual rate of return on investment (F-7)
473
Financial governance

. Liquidity of assets (F-8)
. Percentage of public assets (F-9)
Macroeconomic aspect
The financial flows of a social protection scheme (for instance, total incomeand expenditure) should be assessed in light of GDP and public finance(consolidated general government expenditure and revenue, the central govern-ment budget or the local budget, depending on the type of scheme) in order tograsp its volume and its impact on the national economy and public finance (seeindicator [F-1]: GDP ratio of expenditure and income).
Actuarial aspect
The first indicator describes the balance between the income and theexpenditure of a scheme (see indicator [F-2]: liquidity ratio). The PAYG costrate is a simple but significant indicator showing the present level of actual costin relation to total insurable earnings. The PAYG cost rate should take intoaccount the amount of subsidies the scheme actually receives, but anotherversion of the same indicator should also be calculated without subsidies inorder to ascertain the potential overall cost level without subsidization (seeindicator [F-3]: PAYG contribution rate, with and without governmentsubsidies). The PAYG cost rate is also compared with the current contributionrate (see indicator [F-4]: relative level of contribution rate) and expressed as aproduct of the demographic ratio to show the demographic effect on costs, andof the replacement ratio to show the effect of the benefit level on costs (seeindicators [F-6]: dependency ratio, and [L-4-1]: relative average replacementratio of benefits in payment).2
Investment aspect
For social insurance schemes with reserves (such as schemes providing long-term benefits, like pension schemes), indicators of funding and investmentshould be used. The funding ratio, obtained by dividing the reserves by totalexpenditure, is a fundamental indicator for assessing the volume of reserves inrelation to the volume of expenditure (see indicator [F-5]: funding ratio). Theefficiency of investment is measured by the average annual rate of return oninvestment (see indicator [F-7]: average annual rate of return on investment). Inaddition to these fundamental indicators of reserves and investment, indicatorsmeasuring the investment portfolio should be used. These measure the liquidityof assets (which is important when a scheme uses a portion of its reserves to paybenefits – see indicator [F-8]: liquidity of assets), and the public/private mix ofinvestments (see indicator [F-9]: percentage of public assets).
474
Financing social protection

Box 7-A1.1 Scheme-based performance indicators: Examples
L-1-1 Legal coverage rate for insured persons
The legal coverage rate is obtained by dividing the number of legallycovered persons (that is, those who should be covered according tocurrent legislation) by the number of persons in the labour force in theage bracket of coverage stipulated in the legislation. This rate shows whatpercentage of the labour force should in principle be covered according tolaw. Legally covered persons are those who, by law, should be covered bythe scheme, and their number can only be estimated. For example, thenational labour statistics on employment might be used for an estimationof all employees between the ages of 15 and 60, if that is the grouptargeted by the scheme. The legal coverage rate should be calculated bygender and possibly by other socio-economic characteristics (such assector of the economy, employment status and type of contract, level ofearnings/income, and the like).
Example:
Those in the labour force aged between 20 and 60: 1,000,000 personsLegally covered persons (for example, public sector employees only):200,000 personsLegal coverage rate ¼ 200,000/1,000,000 ¼ 20 per cent
L-1-2 Legal coverage rate for employers
This is similar to (L-1-1) but measures coverage in terms of the numberof employers (establishments). Labour statistics on the number ofemployers/establishments must be used. ‘‘Employers’’ would normallymean ‘‘establishments’’ (excluding self-employed persons). Care mustbe taken to ensure that the definition used by the scheme recordscorresponds to that used by the labour statistics. The rates should becalculated by the size of the establishment (number of employees), sincelegislation often treats small and medium-sized enterprises differently,and actual coverage is often higher for larger enterprises. Coverage ofemployers in different sectors of the economy should also be assessed.
Example:Number of employers/establishments: 100,000Legally covered employers (for example, only employers with more than100 employees): 1,000Legal coverage rate ¼ 1,000/100,000 ¼ 10 per cent
L-2-1 Relative level of limits on insurable earnings (indicator n––1)
This measurement is obtained by dividing the maximum and/orminimum limits applicable to insurable earnings as defined by law
475
Financial governance

(ceiling and/or floor on contributions) by the total average monthly (ordaily/yearly) earnings of full contributors. This indicator shows theeffectiveness of ceilings/floors in terms of average earnings. The indicatorshould be calculated by gender and, if possible, other characteristics ofthe insured (employment status, sector, etc.)
Example:Total amount of contributors’ monthly earnings: 1,000,000,000 unitsNumber of full contributors: 2,000,000 personsAverage monthly earnings of a full contributor: 1,000,000,000 units/2,000,000 ¼ 500 unitsFloor on contributions: 50 unitsCeiling on contributions: 4,000 unitsRelative level of a maximum limit (ceiling) ¼ 4,000/500 ¼ 800 per centRelative level of a minimum limit (floor) ¼ 50/500 ¼ 10 per cent
L-2-2 Relative level of limits on insurable earnings (indicator n––2)
This is another indicator that measures effectiveness of limits on earningssubject to contributions, this time from the perspective of earnings distri-bution. It shows the percentage of insured persons who have earningsbelow the floor and/or above the ceiling on insurable earnings. Theindicator should be calculated by gender and, if possible, by othercharacteristics of the insured (employment status, sector, etc.). Calcula-tions should be based on data from a month when the wage pattern isnormal (meaning without bonus payments and the like).
Example:Total number of insured persons: 1,000,000 personsNumber of insured persons with earnings below the floor: 50,000 personsNumber of insured persons with earnings above the ceiling: 10,000 personsRelative level of the minimum limit ¼ 50,000/1,000,000 ¼ 5 per centRelative level of the maximum limit ¼ 10,000/1,000,000 ¼ 1 per cent
L-2-3 Catchment ratio
This is the ratio of the amount of insurable earnings (after maximum andminimum limits are applied) to the amount of total earnings (includingearnings above the maximum and below the minimum). The indicatorshould be calculated by gender and, if possible, by other characteristics ofthe insured (employment status, sector, etc.).
Example:
Total amount of insurable earnings: 75,000,000 unitsTotal amount of earnings (before any ceilings are set): 100,000,000 unitsCatchment ratio ¼ 75,000,000 units/100,000,000 units ¼ 75 per cent
Box 7-A1.1 (cont’d)
476
Financing social protection

L-3 Average age of insured persons
Since the average age of insured persons shows the demographic ageingof a scheme, its long-term trend should be analysed. Another importantindicator is the average age of those joining a scheme in a given year.These indicators should be calculated by gender.
Example:
Average age for insured persons: 42 yearsAverage age for those newly joining the scheme: 23 years
L-4-1 Relative average replacement ratio of benefits in payment
The average replacement ratio of benefits in payment is obtained bydividing the average annual (or monthly) individual benefit in payment bythe average annual (or monthly) individual earnings of a full contributor.The rates should be calculated by gender and other specific character-istics of the beneficiaries (for example, status as widows, orphans orparents for a survivors scheme, or age in the case of an unemploymentbenefit scheme). For the social insurance scheme, rates should becalculated with respect both to total average earnings and to earningssubject to contributions (after ceiling and floor and other deductions areapplied). If benefits are subject to income tax, then either the ratio of pre-tax average benefit to pre-tax average earnings or a ratio of averagebenefit net of taxes to average earnings net of taxes should be used (thepreference being for gross assessment, since it is often difficult toestimate net benefits and earnings). This indicator is used to assessbenefit level (quality of coverage). In some benefit schemes benchmarksother than earnings might be used—such as minimum wage, povertyline, or other minimum, national or international standards.
Example:
Average benefits: 60 unitsAverage insurable earnings for a full contributor: 100 unitsRelative average replacement ratio ¼ 60/100 ¼ 60 per cent
L-4-2 Relative average replacement ratio of benefits for
newly awarded benefits
This indicator is similar to (L-4-1) but only benefits newly awarded duringa given year are taken into account. This figure is normally higher than thereplacement ratio obtained by (L-4-1) because of deterioration in benefitsin payments owing to the partial indexation of benefits or because oflonger credit periods for recipients of newly awarded pensions. The ratesshould be calculated by gender and other specific characteristics of thebeneficiaries (for example, status as widows, orphans or parents for asurvivors scheme, or age in the case of an unemployment benefit
Box 7-A1.1 (cont’d)
477
Financial governance

scheme). For social insurance schemes, rates should be calculated inrelation to both total average earnings and earnings subject to contribu-tions (after ceiling and floor and other deductions are applied). If benefitsare subject to income tax, then either the ratio of pre-tax average benefitto pre-tax average earnings or a ratio of average benefit net of taxes toaverage earnings net of taxes should be used (the preference being forgross assessment, since it is often difficult to estimate net benefits andearnings).
Example:Average newly awarded benefits: 70 unitsAverage insurable earnings for a full contributor: 100 unitsRelative average replacement ratio ¼ 70/100 ¼ 70 per cent
L-4-3 Average past contribution/service period
The average past contribution period for a contributory scheme should beestimated both for all beneficiaries and for those who were awardedbenefits during a specific year. In most old-age pension schemes and insome other social insurance benefit schemes, the length of service/contribution period is closely related to the replacement ratio and istherefore one of most important influences on benefit level. It should becalculated by gender.
Example (for old-age benefits):Average past contribution period per beneficiary: 20 yearsAverage past service period per beneficiary (sick leave can be counted):22 yearsAverage past contribution period per recipient of newly awardedbenefits—longer than that of average beneficiary: 24 yearsAverage past service period per beneficiary (sick leave can be counted)—longer than that of present beneficiary: 27 years
L-5 Effective adjustment rate of benefits in payment
The effective adjustment rate of benefits in payment is (approximately,and assuming low inflation rates) the difference between the annual rateof increase in wages and/or consumer prices and the average annual rateof adjustment in the value of benefits in payment (rate of increase of anaverage benefit in payment). The effective adjustment rate indicateswhether the benefits maintain both their purchasing power despiteinflation and/or their ratio to average wages (that is, whether they keeppace with the improvement in wages of the working generations). Theconsumer price index should be relevant to the expenditure pattern ofbeneficiaries, if possible.
Box 7-A1.1 (cont’d)
478
Financing social protection

Example:
Average percentage of adjustment in benefits: 5 per centCPI increase: 3 per centWage increase: 7 per centEffective rate of adjustment with respect to inflation ¼ 5 per cent –3 per cent ¼ 2 per cent (purchasing power of a benefit increased by2 percent)Effective rate of adjustment with respect to wages ¼ 5 per cent –7 per cent ¼ �2 per cent (but since real wages increased by 4 per cent,benefits deteriorated compared with a 2-per cent growth in real wages)
L-6 Average age and life expectancy of beneficiaries
The average age of all beneficiaries should be calculated, as well as thatfor the recipients of newly awarded benefits. The average life expectancyat the average age of newly awarded beneficiaries should also becalculated from past and present life tables. The normal retirementage (that is, the age at which a person meeting the requirements fornumber of years of contribution is entitled to a full pension) is specifiedby law. This indicator shows the demographic structure of beneficiaries.The age structure of new beneficiaries indicates actual pensionable age.In addition, the estimated life expectancy of the recipients of newlyawarded old-age pensions has an important financial consequence for apension scheme. Average age and life expectancy should be estimatedby gender.
Example:
Average age of old-age beneficiaries: 67 yearsAverage age of newly awarded old-age pensioners: 58 yearsAverage life expectancy at the average age of newly awarded old-agepensioners (age 58): 19 yearsNormal retirement age: 60 years
L-7 Benefit coverage
Benefit coverage is calculated as the ratio of the number of beneficiariesto the estimated number of those subject to a given contingency or need.This indicates what proportion of existing ‘‘demand’’ for a given type ofbenefit (or, more generally, a social protection intervention) is satisfied bya particular scheme.
Example (for unemployment benefits):Number of unemployed persons: 100,000Number of beneficiaries of unemployment benefits: 30,000Benefit coverage ¼ 30,000/100,000 ¼ 30 per cent
Box 7-A1.1 (cont’d)
479
Financial governance

G-1-1 Registration rate of legally covered persons
This indicator (the number of registered insured persons divided by thenumber of legally covered persons) shows the effective coverage rate. Itindicates the effectiveness of the registration process used by the socialinsurance scheme. See indicator (L-1-1) for explanations of the datacorresponding to legally covered persons and for recommendationsconcerning different desired disaggregations.
Example:Number of registered insured persons: 5,000,000Number of legally covered persons: 10,000,000Registration rate of the legally covered persons: 5,000,000/10,000,000 ¼50 per cent
G-1-2 Registration rate among liable employers
This indicator is similar to (G-1-1), but shows the effective rate of coverage interms of establishments registered. See indicator (L-1-2) for explanations ofthe data corresponding to legally covered employers/establishments andfor recommendations concerning different desired disaggregations.
Example:Number of registered employers: 40,000Number of legally covered employers: 100,000Registration rate of legally covered employers: 40,000/100,000 ¼40 per cent
G-2-1 Effective coverage rate of insured persons (compliance ratio)
This indicator shows the effectiveness of the scheme’s contributioncollection process. The percentage is calculated by dividing either thenumber of insured persons who actually contribute at least once a year (thatis, active insured persons) or the adjusted number of insured persons (fullcontributors) by the number of legally covered persons (excluding thosepeople who are not required to pay contributions, such as unemployedpersons if they are legally insured and do not pay contributions under agiven scheme). For a definition of insurable persons, see (L-1-1). Theadjusted number of insured persons is obtained by dividing either the totalcontributing months by 12 or the number of total contributing weeks by 52.The difference between (G-1-1) and (G-2-1) shows the rate of insuredpersons only registered but not actually contributing.
Example:Number of insured persons actually contributing at least once a year(active insured persons): 3,000,000Number of total contributing months: 24,000,000
Box 7-A1.1 (cont’d)
480
Financing social protection

Number of adjusted contributors (full contributors): 24,000,000/12 ¼2,000,000Number of legally covered persons: 10,000,000Effective coverage rate of insured persons (1): 3,000,000/10,000,000 ¼30 per centEffective coverage rate of insured persons (2): 2,000,000/10,000,000 ¼20 per cent
G-2-2 Effective coverage rate of legally covered employers
(compliance ratio)
This indicator is similar to (G-2-1), except that it measures the effectivecoverage rate in terms of establishments rather than individuals.
Example:Number of employers actually contributing at least once a year (activeinsured employers): 30,000Number of total contributing months: 240,000Adjusted number of contributing employers (fully contributing employ-ers): 240,000/12 ¼ 20,000Number of legally covered employers: 100,000Effective contributory rate of employers (1): 30,000/100,000 ¼ 30 per centEffective contributory rate of employers (2): 20,000/100,000 ¼ 20 per cent
G-3-1 Percentage of employers/establishments inspected
This indicator shows how often the scheme inspects employers. Thepercentage is obtained by dividing the number of employers inspected bythe number of legally covered employers.
Example:Number of legally covered employers: 100,000Number of employers inspected: 2,000Proportion of employers inspected: 2,000/100,000 ¼ 2 per cent
G-3-2 Ratio of successful inspections
This ratio is computed by dividing the number of successful inspectionsby the number of employees inspected. The successful cases are definedas those which result in all necessary information being obtained toestablish whether liability is being met or not.
Example:
Number of employees inspected: 2,000Number of successful inspections: 1,000Ratio of successful inspections: 1,000/2,000 ¼ 50 per cent
Box 7-A1.1 (cont’d)
481
Financial governance

G-4-1-1 Proportion of contributions in arrears during the year
This indicator shows the effectiveness of contribution collection. Thepercentage is calculated by dividing the amount of contributions in arrearsnewly accumulated during the year by the amount of contributions dueduring the year. It should be noted that the arrears carried over from theprevious year (that is, the accumulated amount in arrears) are not includedhere. The contributions that are no longer collectible (because thecompany has gone bankrupt, for example) should be written off.
Example:
Total amount of contributions in arrears newly accumulated during theyear: 20,000,000 unitsTotal amount of contributions due during the year: 100,000,000 unitsPercentage of contributions in arrears during the year: 20,000,000/100,000,000 ¼ 20 per cent
G-4-1-2 Relative level of accumulated contributions in arrears
This indicator is designed to measure the historical effectiveness ofcontribution collection by comparing the accumulated contributions inarrears with the contributions due during the year. The percentage iscalculated by dividing the accumulated amount of contributions in arrearsby the amount of contributions due during the year. Figures from pastyears should be adjusted to their present value (for example, by the rateof return on investment or the interest rate) and cumulated. Any amountthat has become impossible to collect (owing to the bankruptcy of thecompany, for instance) should be written off.
Example:Contributions in arrears three or more years ago: Non-existentContributions in arrears two years ago (the value at that time): 2,000,000unitsContributions in arrears one year ago (the value at that time): 3,000,000unitsContributions in arrears for the current year: 4,000,000 unitsNominal interest rate of two years ago: 10 per centNominal interest rate of one year ago: 5 per centAmount of contributions in arrears two years ago adjusted to currentvalue: 2,000,000 � (1 þ 0.1) � (1 þ 0.05) ¼ 2,310,000 unitsAmount of contributions in arrears one year ago adjusted to currentvalue: 3,000,000 � (1 þ 0.05) ¼ 3,150,000 unitsAmount of contributions in arrears for the current year: 4,000,000Accumulated contributions in arrears: 2,310,000 þ 3,150,000 þ 4,000,000 ¼9,460,000
Box 7-A1.1 (cont’d)
482
Financing social protection

Contributions due in the current year: 20,000,000 unitsRelative level of accumulated contributions in arrears: 9,460,000/20,000,000 ¼ 47.3 per cent
G-4-2-1 Speed of collection of contributions due during the year
This indicator measures how efficiently a scheme collects contributions.Average days per case spent collecting contributions due during the yearshould be counted. The percentage of outstanding cases should also becalculated.
G-4-2-2 Speed of collection of contributions in arrears
The collection of the total accumulated amount of contributions in arrearsis divided into three categories: contributions collected by administrativeaction, contributions collected by the court, and the remainder (un-collected). Data on average days per case spent in collection (duringthe year) should also be recorded.
G-5-1 Record-keeping ratio of contribution collection
The total annual returns of reports to the organization or the institutionadministering a scheme are classified as incomplete returns, completereturns that have been posted to the record, or complete returns that havenot been posted to the record. The record-keeping ratio is calculated bydividing the complete returns that have already been posted to the recordby the number of total returns during the year.
G-6 Percentage of outstanding benefits
This indicator shows what percentage of newly awarded benefits isactually paid during the year. The percentage is obtained by dividing thenumber of outstanding cases by the amount of benefits due (that is, thetotal cases due during the year, or outstanding cases plus already paidcases). If necessary, the amount of benefits in arrears should also beassessed.
G-7 Processing time-lag for newly awarded benefits
This indicator is used to measure the effectiveness of the benefit-deliveryprocess in terms of the average lapse of time between the receipt of theclaim and the first payment of the benefits awarded and paid during theyear. The average length of time (in days) is analysed separately in twophases: the time between the receipt of the claim and the decision toaward benefits, and the time between the decision and the first payment.This indicator might be assessed by survey only.
Box 7-A1.1 (cont’d)
483
Financial governance

G-8 Error rate on benefit payments
This indicator is obtained by dividing the number of payment errors bythe number of total payments made during the year.
G-9 Rate of complaints
This indicator is obtained by dividing the number of public enquiries and/or complaints by the total number of insured persons and beneficiaries. Itis one possible way of measuring the satisfaction of those covered by ascheme with its functioning. Other methods of assessing satisfaction aresurveys conducted among those covered.
G-10 Relative level of administrative costs
The relative level of administrative costs is computed by dividing the totalamount of administrative expenditure by the total amount of insurableearnings or by the total amount of benefit expenditure.
G-11 Ratio of personnel cost to total administrative cost
This indicator measures personnel cost as a percentage of total adminis-trative cost.
G-12 Staffing level relative to insured persons and beneficiaries
The staffing level of the social insurance scheme is calculated by dividingthe number of staff in the institution administering a scheme (possiblyonly the staff dealing with that specific scheme if the institution adminis-ters more than one scheme) by the number of active insured personsand/or by the number of beneficiaries or the number of newly awardedbeneficiaries.
G-13 Relative staff salary level
This indicator shows the relative average salary level of the staffadministering a social protection scheme compared with averageinsurable earnings (in the case of a social insurance scheme) or thenational average wage.
F-1 GDP ratio of expenditure and income
The data on scheme expenditure and income are contained in thefinancial/accounting reports. The accounting method (for instance, cashbasis or accrual basis) should be clearly identified. The GDP ratio iscalculated by dividing income and expenditure by GDP.
Box 7-A1.1 (cont’d)
484
Financing social protection

This is a basic indicator showing the size of a social protection schemein the macroeconomic context. Parallel indicators should be usedcomparing scheme income and expenditure with the consolidatedgeneral government expenditure and revenue and/or with the central orlocal government budgets.
Example:GDP: 100,000,000 unitsTotal benefit expenditure: 10,000,000 unitsGDP ratio of benefit expenditure ¼ 10,000,000/100,000,000 ¼ 10 per cent
F-2 Liquidity ratio
The liquidity ratio is defined as the quotient of total income (including orexcluding investment income) divided by total expenditure (includingadministrative expenditure). This indicator reflects the financial situation,which changes as a scheme matures. The ratio is normally much greaterthan 1 when a scheme commences and eventually drops to 1 or less than1 as the scheme matures. It also has implications for the selection of aninvestment portfolio, indicating how much should be liquidated from thereserves to pay benefits.
Example:Income with investment return: 500 million unitsIncome without investment return: 400 million unitsExpenditure: 450 million unitsLiquidity ratio with investment income: 500/450 ¼ 111 per cent (thescheme is running without deficits by using investment income)Liquidity ratio without investment income: 400/450 ¼ 89 per cent (thescheme would be in deficit without investment income)
F-3 PAYG cost rate (with and without government subsidies)
The PAYG cost rate with government subsidies is calculated by dividingthe amount of total expenditure minus the government subsidies providedfor by law, by total insurable earnings. The PAYG contribution rate withoutgovernment subsidies is obtained simply by dividing total expenditure bytotal insurable earnings. The rate indicates the contribution rate that ascheme would have to levy in the absence of investment income. The ratecalculated without government subsidies shows the overall financingburden that must be borne either by contributors or the government.
Example:Total insurable earnings: 600 million unitsExpenditure: 60 million unitsGovernment subsidies: 20 million units
Box 7-A1.1 (cont’d)
485
Financial governance

Pay-as-you-go cost rate with government subsidies: (60–20)/600 ¼6.7 per centPay-as-you-go cost rate without government subsidies: 60/600 ¼10 per cent
F-4 Relative level of the legal contribution rate
The relative level of the legal contribution rate compares the level of thescheme’s actual (legally fixed) contribution rate with the PAYG contribu-tion rate with government subsidies. This shows any discrepancybetween the actual contribution rate and the PAYG cost rate.
Example:Legally fixed contribution rate: 10 per centPay-as-you-go contribution rate: 5 per centRelative level ¼ 10 per cent/5 per cent ¼ 200 per cent
F-5 Funding ratio
The funding ratio is obtained by dividing the amount of reserves at theend of the previous year by the amount of total expenditure during theyear (including administrative expenditure). This shows how many yearsthe scheme would be financially sustainable without any income otherthan investment income, and serves as a good indicator of the scheme’sfunding level.
Example:Amount of reserves at the end of previous year: 500 million unitsAmount of total expenditure during the year: 100 million unitsFunding ratio ¼ 500/100 ¼ 500 per cent or 5 (years)
F-6 Demographic (dependency) ratio
The demographic (dependency) ratio shows the maturity of a scheme.It is calculated by dividing the total number of (full) beneficiaries by thetotal number of active insured persons (that is, insured personswho made at least one contribution during the year) or by the numberof full contributors (or total contributing months/weeks/days divided by12/52/365).
Example:Number of beneficiaries: 500,000Number of insured persons: 2,000,000Number of active insured persons: 1,500,000Number of full contributors: 1,200,000
Box 7-A1.1 (cont’d)
486
Financing social protection

Demographic ratio no. 1 ¼ 500,000/2,000,000 ¼ 25 per centDemographic ratio no. 2 ¼ 500,000/1,500,000 ¼ 33 per centDemographic ratio no. 3 ¼ 500,000/1,200,000 ¼ 42 per cent
F-7 Average annual effective rate of return on investment
First, the nominal rate of return on investment is calculated, using thefigures for the amount of total assets at the beginning and at the end ofthe year and the amount of total annual investment income. The effectiverate of return on investment is calculated approximately, in any of thefollowing three ways:
(nominal rate of return on investment) � (annual average rate of indexa-tion on benefits)or(nominal rate of return on investment) � (annual average rate of increasein consumer prices)or(nominal rate of return on investment) � (annual average rate of increasein wages).
This indicator shows whether the rate of return is reasonable whencompared with actual economic fluctuations.
Example:Nominal rate of return on investment: 10 per centAverage rate of indexation in benefits: 6 per centAverage rate of increase in CPI: 4 per centWage increase: 7 per centEffective rate of return no. 1 ¼ 10 per cent – 6 per cent ¼ 4 per centEffective rate of return no. 2 ¼ 10 per cent – 4 per cent ¼ 6 per centEffective rate of return no. 3 ¼ 10 per cent – 7 per cent ¼ 3 per cent
F-8 Liquidity of assets
Short-term assets are defined as those that could be liquidated within amonth whenever necessary. The liquidity of assets is calculated bydividing short-term assets by the amount of total expenditure during theyear. This indicates the level of contingency reserves available under agiven scheme.
F-9 Percentage of government assets
The amount invested in government or parastatal papers or investmentvehicles, such as treasury bills, government stocks and governmentbonds or government or institutional facilities, as well as the amountinvested in parastatals, is calculated and divided by the amount of totalassets owned by the scheme. This shows the percentage of assets in the
Box 7-A1.1 (cont’d)
487
Financial governance

Notes
1 It should be stressed that the number of registered persons might be unreliable due to improperrecord maintenance (e.g. failure to eliminate the deceased or those who have become pensioners); theindicator might give the illusion that registration is unproblematic, which is not the case.
2 The replacement ratio is categorized as a legal indicator. However, it is also considered anessential financial indicator.
governmental/parastatal sector, and indicates the asset mix of theinvestment portfolio.
Example:Treasury bills: 20 per centGovernment stocks: 10 per centGovernment bonds: 20 per centGovernment facilities: 5 per centTotal percentage ¼ 20 per cent þ 10 per cent þ 20 per cent þ 5 per cent ¼55 per cent
Box 7-A1.1 (cont’d)
488
Financing social protection

CONCLUSION
There are a number of things that we set out to do in this book.First of all, we have tried to demystify and explain the nature of national
social protection systems (or the welfare state, if you prefer). As financialanalysts, we see social protection as a set of formal social transfers aimedat alleviating or preventing poverty, abolishing or at least reducing socialinsecurity and providing a form of income equalization. These transfers are inpart substitutes for informal societal arrangements and make social protectionfairer and more reliable by increasing risk pools and dissociating access tosocial protection from compliance with behavioural norms. They are toolsthat policy makers can use to implement a variety of overall concepts ofsocial protection and social policy, ranging from a strictly risk-relatedapproach to income protection to a comprehensive life-cycle approach ofsocial protection systems that are anchored in the philosophical and ethicalfoundations of universalism. They are thus neutral with respect to specificsocial policy choices.
We have shown that as a society develops economically its social protectionsystem matures; social expenditure will go on increasing naturally until thesystem turns into a redistributive machine that can account for as much as one-third of the country’s GDP.
Social protection systems have a direct impact on the national economy.It appears, however, that it is not their size but rather their design that decideswhether that impact is positive or negative. After all, even in the absence offormal systems all societies would maintain informal redistributive systemsthat would not be any less costly overall but would lead to a different allocationof benefits.
We have listed the limited types of resources available to finance transfers,their effect on public budgets, and we also detailed a range of techniques thatcan be used to ensure the systems’ financial equilibrium – in other words,making sure that the monies are there when benefit promises fall due. We havealso touched upon the debate on pre-funding versus PAYG financing ofpensions schemes, finding that both options face risks and that the reliability ofa pension scheme ultimately depends on the society’s willingness to shareincome – or rather consumption – with the elderly.
We have shown how, in the face of inevitably uncertain financial marketperformance, reserves of schemes that are largely funded can be investedresponsibly.
489

We have also made the point that ultimately it is sound financial governancethat decides how well a system or a scheme functions and that we – as financialanalysts – should steer governance towards more evidence-based, rationalpolicy choices by developing workable performance indicators. It is the qualityof financial governance that determines whether the resources that a societyentrusts to its social protection system are wasted or not.
We have told you what we know. But we are painfully aware that thisknowledge has its natural limits. However, you should now be well equipped tohelp extend that knowledge base, to survive (or, why not, even sail through) thedaily routine of a quantitative policy analyst in social protection, and to tackletough financial questions in a rational manner. We had to deal with a first layerof rationality – that is, with factual knowledge and its logical consequences forpolicy recommendations. However, there are deeper levels of rationality andbehavioural ethics that we would like to mention as parting thoughts: this mayhelp should you despair of the quality of political decisions that are forced uponyou even if you have rationally advised otherwise.
On political economy
We do not live in a pure, rational island paradise but in a complex politicalenvironment. Politics has its own economy. And in that economy the currencyis electoral votes or wide public support or, in a more limited way, support ofcertain groups of stakeholders. The ultimate reward and capital in that economyis power. To hold on to power, politicians have to ‘‘sell’’ their policies to themajority of voters in a society. However, voters are not a homogenous entity;they can be classified into various interest groups. If policies are designed tosatisfy the wishes of certain groups, then politicians are generally confident thatthe majority in that particular group (for example public servants, pensioners,physicians) will support them. Interest groups are not disjunct entities; theyoverlap in the sense that in addition to their group interest members of onegroup may have, as citizens, fundamental political convictions that are notalways fully compatible with their group interest. At an early stage in EasternEurope’s transition period, Jeffrey Sachs (1995) attributed the resurgence offormer communist parties in general elections to the large group made up ofpensioners, since the successor organizations of the former communist partieswere the only political group that had supported the principles of the oldpension systems. Sachs was wrong, as was demonstrated by wide support forpartly daring reforms in the pension system barely two years later. However, hisreasoning serves as an example for the conceptual framework for the thinkingof a political economist.
Indeed, many reforms of national social protection systems can only beexplained by political economics. Reforms usually come in ‘‘packages’’ – thatis, they contain elements that have been carefully balanced so as to satisfy
490
Financing social protection

the needs or preferences of certain groups or to avoid ‘‘ruffling the feathers’’ ofothers. If in a package of health reforms cost containment measures in publichospitals are severe but glaring waste in outpatient care through privatephysicians is left untouched, then this efficiency gap might have been ‘‘bought’’by the physicians’ agreement to adopt restrictive prescription behaviour.There may also be implicit links between two seemingly different policyareas. If unions suddenly agree to a pension reform package that they havepreviously opposed, the sudden adoption of a new co-determination lawgiving unions more influence in corporate governance may explain theirchange of heart.
Financial analysts and planners have to be aware of such linkages.Otherwise, their feasibility studies may be built on unrealistic assumptions orsimply turn out to be a waste of time. One method of approaching the logic ofpolitical economics, for example, is to carry out winners-and-losers analyseswhen looking into reform proposals. This can be done using complex stochasticmicro-simulation models, which simulate the effect of change in the legalframework of the social protection system on a household basis, or through astatic deterministic analysis of potential changes in the income distribution onthe statistical basis of a household income and expenditure survey. Then it is upto the politicians to assess whether the number of losers is equal to the numberof votes lost and the number of winners to the number of votes won.
In a non-democratic environment the mechanisms of political economy areless obvious, but there too the analysis and balancing of group interests are keyto the feasibility of any political change. However, that context is not within ourpurview so we will not elaborate on it further.
On decision-making under uncertainty
We have mentioned in several places throughout the book that some ofthe issues addressed are not as well researched as they should be. For example,we are still unsure about the full extent of social protection’s impact on theeconomy. We are not certain whether OECD-type social protection mech-anisms will work sufficiently well in most developing countries in theforeseeable future. Nor do we really know whether their younger siblings,micro-insurance schemes, will fare any better. Most serious of all, while ourpolicy objectives might be well defined, in our outcome measures there is roomfor improvement. The gaps in our knowledge will keep us all busy for sometime, and that – as noted in Chapter 7 – is good news.
Is it then appropriate for financial analysts and policy makers to makerecommendations to their societies about reducing or increasing levels of socialprotection if one or more dimensions of the potential impact of these systemsare not yet fully apprehended? Well, formal social transfer systems have existedfor some 120 years now and they have kept millions of people out of poverty,
491
Conclusion

in Europe and elsewhere. Had social security planners and decision-makerswaited to learn all there is to know, there is a good chance that we would still bestudying the potential effects of introducing new pension schemes or socialassistance schemes. Decision-makers always act in a state of incompleteknowledge – whether their decision concerns going to war or going ahead withsocial transfer reform.
When it comes to social protection policy making, however, the minimumthat decision-makers should do is to conduct a state-of-the-art risk assessmentand cost-benefit analysis, and then weigh largely financial and economic risksagainst potential social and economic benefits. These assessments have to beundertaken by financial and economic analysts and by social policy specialists.On the basis of techniques set out in this book a financial, fiscal and economicrisk and cost-benefit assessment should be possible. One method of carrying outsuch assessments is to go through the full checklist of questions at the end ofeach chapter and add some country-specific ones. To assess quantitative effects,models have to be built. New financing instruments as well as new benefits areor should normally be simulated in models before they are applied to real life.The other books in this series provide all the techniques known today forbuilding such models.
All modellers know that a model can always be used to ‘‘prove’’ theviability of one policy option or another. Ultimately, it is the assumptions thatdetermine the outcome of the model. Assumptions are used at critical junctionsin all models. Since as a general rule of nature knowledge and information arealways incomplete, assumptions are used as substitutes for corroboratedknowledge. They often take the form of parameters that are the nerve cells of allmodels. They carry the message from the central brain to all distant parts of thebody and make it, for instance, bend over backwards. Models – and we have allseen this – can also be made to bend over backwards.
For example, if an economist firmly believes that the introduction of afunded pension scheme will benefit the country and its population, his modelwill most likely assume that the aggregate savings rate and hence investment inthe country will be somewhat higher than in the absence of a funded scheme,and that increased investments will create additional growth. This can be donesimply by having a parameter that assumes that aggregated demand forfinancial assets by powerful pension funds will invigorate capital marketsthrough ‘‘deepening’’ and that the availability of attractive stocks will trigger ahigher savings rate. If the economist then keeps the wage share of GDPconstant, then either employment or wages go up. Quod erat demonstrandum.Unfortunately, Latin makes no distinction between ‘‘demonstrate’’ and‘‘prove’’. . . Somebody else – holding different convictions – could simplyassume that there would be no net effect on aggregate savings in the longer termonce people have understood the risks of the stock markets or of capital marketsin general (and why would there be?). He or she would thus assume no increasein growth and then simulate a negative effect of long-term ageing on asset
492
Financing social protection

prices in the capital markets and consequently on future pension levels(see, for example, Issue Brief 2). Quod erat demonstrandum, again.
On analytical ethics
What is required here is a minimum of professional ethics. Every analyst shouldcome out and say when he assumes something he does not know – even if hefirmly believes that his assumptions hold true and are backed by world-famouseconomists. As long as there is no certainty or near-certainty, nothing should betaken for granted. Scenario analyses testing the effect of the assumedparameters have to be conducted and openly explained. The rest is then up tothe decision-makers and their commonsense judgement. Making the ultimatechoice remains their role and their responsibility. We should not take it offthem. Otherwise we would be betraying our role in national and globalgovernance.
Policy makers’ interest may lie in the realm of political economics ratherthan economic economics. When Bismarck’s advisers developed the blueprintsfor Germany’s social insurance schemes in the 1880s, it is not as if the IronChancellor had suddenly been gripped by compassion for the sufferingunderclass – he simply undercut the political support of social democrats andlabour unions and bought some social peace for some time to come.
Maximization of profits in political economics pursued by shrewd decision-makers works best if the public has little information about potential social,economic, fiscal and financial effects of policy action – again, regardless ofwhether they are embarking on war or social policy reform. It is the financialanalysts’ job to enhance understanding of the subject matter wherever they canand to keep to strictly neutral analyses, thereby making societally sub-optimalpolitical profit maximizing more difficult. This is our way of contributing togood governance.
But even with the best and most conscientious of all quantitative analyses,policy choices on introducing new elements into national social protectionsystems or modifying old ones will not always be optimal. Whether systems areoptimally or sub-optimally designed, they have to be managed in the bestpossible way. And here the job of the financial analyst is less contagious thanwhen it comes to designing new systems or reforming existing ones.
Managing complex, interacting and interrelated financing mechanisms ofNSPSs requires a solid understanding of their objectives and functioning, aswell as a set of sophisticated management techniques. It is the actuary who maypoint to high administrative cost. It is the financial analyst who conducts aperformance investigation into the matter. Looking for sources of waste, hemay find out that the main culprit is the health care branch. The healtheconomist may discover that the claims procedure with public hospitals is socumbersome that many staff waste a lot of time over it. The health manager
493
Conclusion

will find that is the fault of the hospital accounting section, understaffed sincethe overall hospital budget is too small. And that might be the case because thehealth tax is too low and additional funds cannot be obtained from generalrevenues. A higher health tax might make the population unwilling to acceptother tax hikes needed to finance anti-poverty measures. And so on and so forth.All that may lead to action on the legal front. A more likely scenario is for thefinancial analyst to discover that the scheme administration simply wastesmoney on lavish offices or fringe benefits and is overstaffed because ofcronyism. The scheme’s board or the legislative supervisory body can act.Abolishing waste helps the system to keep its books balanced. This in turnmakes benefits safer in an unsafe world.
Honest quantitative analysts are in the business of creating transparency.What they can always do is to present the likely effects of alternative policyoptions and put forward assumptions, together with affiliated potential risks andbenefits. They can also always trace bad administrative and managementpractices and quote their cost and opportunity cost. Then it is up to other peopleto act. It is not a bad service to society and it is well worth spending aprofessional life on. And, believe it or not, at times it can even be exciting.
494
Financing social protection

ISSUE BRIEF 1
HIV/AIDS: MANAGING THE FINANCIALCONSEQUENCES OF A PANDEMIC INA DEVELOPING COUNTRY CONTEXT1
More immediately and much more dramatically than ageing, the HIV/AIDSpandemic poses a huge challenge to the financial management of national socialprotection systems. This Issue Brief enters new territory in the financialgovernance of social protection since it endeavours, if only on the basis of asimplified social budget model, first to assess the potential effects of HIV/AIDSon national social protection schemes and then to simulate possible copingmechanisms. It presents the impact of HIV/AIDS on the demographic andeconomic variables that in turn influence the finances of social protectionschemes. The analysis is conducted through the case of Afroland, a hypotheticalcountry hard hit by HIV/AIDS. The Issue Brief compares different scenarios,with and without HIV/AIDS, in order to show the possible repercussions ofthe various factors on the country’s social budget.
1. INTRODUCTION
According to estimates of the joint United Nations Programme on HIV/AIDS(UNAIDS) and the World Health Organization (WHO), at the end of 2000 asmany as 36.1 million people were living with HIV; worldwide, 3 million peopledied of AIDS the same year, and the number of AIDS orphans stood at 12million. The situation is not improving: in 2000 some 5.3 million peoplebecame infected with HIV.
Ninety-five per cent of people with HIV/AIDS live in the developing world.This proportion is set to increase as infection rates continue to rise in countrieswhere poverty, poor health systems and limited resources for prevention andcare compound the problem. Sub-Saharan Africa is the region worst affected.AIDS is now the leading cause of death in Africa, responsible for one in five
495

deaths. Life expectancy in southern Africa, which had risen from 44 years in theearly 1950s to 59 years in the early 1990s, is set to drop to 45 years between2005 and 2010 because of HIV/AIDS. The disease also affects other parts ofthe world: in Asia, for example, in 2000 there were half a million deathsfrom AIDS.
The socio-economic impact of HIV/AIDS is immense given that those mostaffected are in the 15–49 age range, the most economically productive andsexually active age group. Countries like Botswana, Namibia, Swazilandand Zimbabwe have been among the nations hardest hit, with between 20 and26 per cent of people aged between 15 and 49 living with HIV/AIDS. The resultis an increase in morbidity and mortality rates, a decline in population growthand a drop in the supply of labour. As HIV/AIDS cuts into the size and qualityof the workforce, it poses ever-growing problems to business and economicpolicy makers, too. Its direct and indirect costs to business and the economy inthese countries taken as a whole are staggering.
The number of households left without the active ‘‘middle generation’’ isset to increase sharply in the developing world. AIDS deaths will completelymodify the age structure of the population in some countries, affectingprimarily the very young and the population aged 20 to 49. Even if preventivemeasures can be expected to slow down the spread of the epidemic, the shapeof the usual population pyramid will be completely modified and AIDS willcertainly affect the demographic picture for several decades to come.
As a result, HIV/AIDS may have significant impact on both revenue andexpenditure of social security programmes in developing countries.
2. PRESENTATION OF AFROLAND
The impact of HIV/AIDS will be illustrated here with the use of a hypotheticalcase, Afroland, a developing country experiencing a high prevalence of HIV/AIDS. Its characteristics are summarized below.
2.1 Population
Afroland has a population of 14.8 million (2000 figures). It is a young countrysince 43 per cent of the total population is below the age of 15 and only 5 percent is aged 60 and over. The total fertility rate is 5.1 children per woman.
In Afroland there are presently 700,000 persons infected by HIV. Some10 per cent of the adult population (15–49 age group) is estimated to beHIV-positive. AIDS caused 72,000 deaths in 2000. Without HIV/AIDS lifeexpectancy at birth would be 56 years for males and 59 for females, but becauseof the disease it has dropped to 49 and 54 years respectively. It is supposed thatthe incidence of HIV/AIDS will peak in 2010 and that prevention measures willlead to a gradual disappearance of AIDS over the period 2010–50.
496
Financing social protection

2.2 Economy
Afroland’s GDP is currently growing at a rate of 5 per cent, and productivityper worker at 1.2 per cent annually. Labour force participation rates are 76 percent for males and 63 per cent for females; unemployment stands at 13 per cent.It is estimated that 20 per cent of the labour force is in the informal sector.Inflation is low (2 per cent annually).
2.3 Social programmes
Afroland’s pension scheme was introduced 30 years ago. The social securitylaw provides coverage to the total labour force, but because of complianceproblems and the size of the informal sector, only 34 per cent of the totalworkforce (for both males and females) actually pays contributions to thescheme. The present contribution rate is 8.0 per cent of insured earnings.Pension expenditure represents 1.1 per cent of GDP (2000 figures).
Health expenditure represents 3.5 per cent of GDP (1.4 per cent for thepublic sector and 2.1 per cent for the private sector). Other social programmes,accounting annually for 1.5 per cent of GDP, include unemployment insurance,sickness and maternity benefits, a basic employment injury programme, tax-financed family benefits and a limited social assistance programme.
3. DEMOGRAPHIC IMPACT
3.1 Mortality
AIDS will cause an increase in mortality for two critical age groups: the veryyoung (0–4 years) and the young adults (15–49 years). Mortality rates for themwill increase dramatically. Figure IB1.1 shows projected mortality rates in 2010for Afroland. In our example the year 2010 represents the peak of the number ofAIDS deaths.
The additional deaths due to AIDS are concentrated between the ages of 15and 50. Extra mortality for men is likely to appear at slightly higher ages thanfor women. Extra mortality at very young ages (0–4 years) results from cases ofmother-to-child transmission of HIV.
These changes in mortality will have a major impact on life expectancy atbirth. Under the scenario without HIV/AIDS, life expectancy at birth isassumed to increase gradually and continuously from its 2000 level of 56 yearsfor males and 59 years for females to 72 and 77 years respectively in 2050.When HIV/AIDS is taken into account, life expectancy does not improve before2010; then it starts to increase again, approaching the ‘‘non-AIDS’’ values onlyin 2050 (see figure IB1.2).
497
Issue Brief 1

Figure IB1.2 Projected life expectancy for men in Afroland, 2000–50 (with and
without HIV/AIDS)
Source: ILO.
Figure IB1.1 Mortality rates for Afroland, 2010 (with and without AIDS)
Source: ILO.
498
Financing social protection

3.2 Fertility
HIV/AIDS may also affect fertility because more women will become widows,and many of them will not bear any more children. Reduction in fertility ratesmay also be caused by the poor health of women infected by HIV, or by theirdecision not to bear children.
In our base scenario for Afroland (without the impact of HIV/AIDS), it wassupposed that the total fertility rate would fall from 5.1 in 2000 to 2.1 in 2025and that it would remain at that level thereafter. In the scenario taking intoaccount the impact of the epidemic, it is supposed that the ultimate level of 2.1children per woman would be reached more rapidly, in 2010 instead of 2025.
3.3 Total effect on the projected structure of
the population
By combining the effects of HIV/AIDS on mortality and fertility, the globalimpact on the projected population can be very significant indeed. Figure IB1.3illustrates the population structure with and without HIV/AIDS by usingpopulation pyramids. Under the ‘‘no HIV/AIDS’’ scenario, Afroland’s totalpopulation would increase from 14.8 million in 2000 to 34.1 million in 2050,representing an average annual growth of 1.7 per cent. With the effect of HIV/AIDS, the population would be only 22.6 million in 2050 because of fewerbirths and higher mortality. We can observe in 2025 the combined effect oflower fertility and higher infant mortality on the population below age 20,which represents the future labour force and social security contributors. FigureIB1.3 on page 500 also shows that mortality due to AIDS will prevent a largeproportion of the population from reaching retirement age.
4. ECONOMIC IMPACT
4.1 General considerations
The macroeconomic effects of HIV/AIDS are difficult to assess. They aresensitive to assumptions about how HIV/AIDS is going to affect savings andinvestment rates. If the costs associated with the epidemic are financed out ofsavings, then the reduction in investment could lead to a significant decline ineconomic growth. The impact of HIV/AIDS also depends on whether the best-educated employees will be affected more than others. In southern Africa, forexample, there is generally a surplus of unskilled labour and a shortage ofcertain categories of skilled labour. If the epidemic is primarily located amongthe unskilled and easily replaceable members of the workforce, then it will haveless of an impact than if it is located among workers who are highly skilled andthus hard to replace (see Stover and Bollinger, 1999, and Sehgal, 1999).
499
Issue Brief 1

Figure IB1.3 Population pyramids, Afroland, 2000–50
Source: ILO.
Financing social protection
500

A large proportion of HIV-infected population is in the 20–49 age group.If one makes the assumption of labour force participation rates remaininglargely unchanged by HIV/AIDS, this would imply that the labour force wouldbe proportionately smaller because of the fall in the population in that agegroup. But it is likely that HIV/AIDS will affect the age and sex distribution ofthe labour force since a growing number of widows and orphans would seekemployment. Moreover, the fact that a large proportion of HIV-infectedpopulation is in the 20–49 age group may result in greater pressure for an earlyentry of children into the labour force, early retirement of infected persons aswell as a later exit of non-infected persons.
Replacing skilled workers will be difficult and will most likely remainincomplete, resulting in a decline in GDP. Theoretically, capital and tech-nology could substitute the reduced supply of labour. But this is not alwayspossible, especially with few technicians and inadequate systems of equipmentadaptation and modification or maintenance of imported technology.
There is some evidence that with the already high unemployment andunderemployment in many countries, the economic shock of reduced labour forcesupply will be compensated by persons seeking employment. In some cases,import of labour from neighbouring countries may also soften the blow. However,even if unemployment is high, it is not always possible to match human resourcerequirements with the available labour supply, in terms of skills and experience.
Since a large proportion of HIV-infected population falls in the(re)productive age group, the impact on productivity, costs and economicenvironment is considerable. Employers are likely to face increased labourcosts because of low productivity, absenteeism, shortage of labour, shorterworking hours, sick leave and other benefits, early retirement, and additionaltraining costs. Both the well-educated/skilled and uneducated/unskilled workersare affected. Even the healthy workers are now spending time away from workvisiting the sick and attending funerals of relatives or colleagues.
AIDS deaths lead directly to a drop in the number of workers available. Ifyounger and less experienced workers replace experienced workers, productiv-ity is reduced. A shortage in the number of workers leads to higher wages andconsequently higher production costs. This may lead to a loss of internationalcompetitiveness and eventually to shortages of foreign exchange.
The decline in the number of employed persons may lead to reducedgovernment revenues and lower private savings, causing a drop in savings andcapital accumulation, which has the effect of reducing employment creation inthe formal sector. Some workers will be pushed from highly paid jobs in theformal sector to lower-paid jobs in the informal sector.
Economic growth is bound to be negatively affected by all these factors.Various studies have estimated the expected decline in GDP growth. An earlyWorld Bank study on the macroeconomic impact of AIDS in 30 sub-Saharancountries predicted a reduction in the annual growth rate of GDP of 0.8 to 1.4per cent annually.
501
Issue Brief 1

4.2 Our assumptions
It is assumed that HIV/AIDS will cause GDP growth in Afroland to decline,as shown in table IB1.1.
As regards labour productivity, the base scenario assumes that it increasesby 1.2 per cent annually. Under the HIV/AIDS scenario it is assumed toincrease at only 1.0 per cent annually until 2039 and to reach its former level of1.2 per cent again thereafter. As a simplification, it is assumed that salaryincreases follow the increase in productivity.
With regard to the impact of HIV/AIDS on labour supply, it is assumed thatthe participation rates of men will be lower at all ages except for the 15–19 agegroup. Where women are concerned, the need for children and widows to seekemployment would bring about a rise in their participation rates at all agesbelow 44. Combined with lower GDP growth, the unemployment rate (underthe AIDS scenario) goes up from 14 per cent in 2000 to 20 per cent in 2015 andthen decreases owing to the decline in total population resulting from deathscaused by AIDS.2 The detailed economic assumptions for the differentscenarios are presented in Annex IB1-A1.
4.3 Overall economic consequences
The overall economic consequences of the above assumptions on economicdevelopment and on the standard of living are quite dramatic. However, they canonly be estimated using a crude indicator. They may be measured by theestimated extension of the time that Afroland would need to catch up to thestandard of living of a typical southern European country (see figure IB1.4).The GDP per capita measured in purchasing power parities is here used as acrude indicator for the standard of living as well as a measure of economicdevelopment. It is assumed here that Afroland’s GDP per capita, US$720 in theyear 2000, reflects a purchasing power parity of US$1,700.3 The initialpurchasing power parity of the GDP (in 2000) in our comparator country in
Table IB1.1 Assumed future GDP growth for Afroland (%), 2000–2049(with and without HIV/AIDS)
Without HIV/AIDS With HIV/AIDS
Year GDP growth Year GDP growth
2000–04 5.0 2000–04 3.0
2005–09 4.5 2005–09 3.0
2010–19 4.0 2010–19 3.0
2020–29 3.5 2020–35 3.0
2030–39 3.0 2036–39 2.5
2040–49 2.5 2040–49 2.0
Source: ILO calculations.
502
Financing social protection

southern Europe is US$15,000 (which is similar to that of Portugal). We assumethat Afroland’s GDP follows the growth paths mapped out for scenarios 1 and 2.The different growth assumptions between the European comparator andAfroland lead to a slow catch-up of Afroland (in terms of per capita GDPmeasured in purchasing power parities) with the present GDP level of thecomparator.
Under these assumptions, without HIV/AIDS Afroland would need about 74years to catch up to the present level of GDP in the comparator country. This initself is already bad news, but the disease would most likely extend that catch-upperiod by another 18 years. While it may be hoped that the economic catch-upto industrialized country level might proceed faster, one must assume that HIV/AIDS throws the development of those rapidly growing developing countriesback by almost two decades. In our view, this estimate is rather optimistic.
5. IMPACT OF HIV/AIDS ON SOCIAL PROTECTION
PROGRAMMES
5.1 Pensions
The impact of HIV/AIDS on pension schemes may be viewed from two angles.On the expenditure side, the epidemic is expected to reduce the number of old-age pensions in the long term, but to increase survivors’ and invalidity pensionsin the short term. On the revenue side, it will have an impact on the scheme inso far as the drop in the overall numbers of the population will cause a
Figure IB1.4 Projected GDP per capita for Afroland and a southern European
country, 2000–2110
Source: ILO calculations.
503
Issue Brief 1

reduction in the number of people in employment and that employed personsaffected by HIV/AIDS are in the group of contributors to the scheme. Thereality of most developing countries is that the actual coverage of socialsecurity schemes is far from complete and it can be assumed in some cases thatnew contributors will replace – at least partially – those who die of AIDS.However, the extent of this substitution is unknown. We have therefore chosento analyse two scenarios with respect to the impact of AIDS on the numberof contributors to the Afroland scheme: a zero-substitution scenario and afull-substitution scenario.
5.1.1 Old-age pensions
As shown in figure IB1.5, the impact of HIV/AIDS on old-age pensions variesover time. Initially their number will be almost unchanged because the diseasestrikes mainly persons under the age of 50. But for as long as the generations nowunder 50 reach retirement age, the scheme should see a fall in the number of old-age pensioners.
5.1.2 Invalidity pensions
The number of invalidity pensions will be affected by the following factors:
. The incidence of new invalidity cases is set to increase as a result of theincapacity to work of persons living with AIDS at a late stage of the disease.The impact on incidence of new pensions will depend on the length of the
Figure IB1.5 Projected number of old-age pensioners for the Afroland scheme,
2000–50 (with and without HIV/AIDS)
Source: ILO calculations.
504
Financing social protection

waiting period before the pension is paid. In developing countries the periodof time between the start of incapacity due to AIDS and the moment ofdeath is relatively short because life-prolonging drugs are often notavailable. Hence, it may well happen that only few people have the time toclaim the invalidity pension and receive benefits.
. The average duration of invalidity pensions will be reduced because of therapid evolution of the disease and the rapid onset of death.
Figure IB1.6 presents one possible scenario assuming that the incidence ofinvalidity, with AIDS, is multiplied by a factor of 5.0 from 2000 to 2010, whichgradually goes down to 1.0 between 2010 and 2050. To establish it, we haveassumed that those who die of AIDS will be eligible for an invalidity pension atleast for a short period before death. It is also assumed that the duration ofinvalidity pensions is reduced for those affected by AIDS. Furthermore, it isassumed that the mortality rates of invalidity pensioners are five times higherthan in the base scenario from 2000 to 2010 and that this factor thereaftergradually drops to 1.0 by 2050.
5.1.3 Survivors’ benefits
As regards survivors’ benefits, AIDS will cause an increase in the number ofwidows and widowers as well as orphans (see figures IB1.7 and IB1.8). If thescheme provides for a funeral grant, expenditure will increase for that particularbenefit.
The duration of survivors’ pensions should decrease since there is a highprobability of the survivors having been infected by HIV before the death of theinsured person.
Figure IB1.6 Projected number of invalidity pensioners for the Afroland
scheme, 2000–50 (with and without HIV/AIDS)
Source: ILO calculations.
505
Issue Brief 1

Figure IB1.7 Projected number of widows for the Afroland scheme, 2000–50
(with and without AIDS)
Source: ILO calculations.
Figure IB1.8 Projected number of orphans for the Afroland scheme, 2000–50
(with and without AIDS)
Source: ILO calculations.
506
Financing social protection

As regards orphans’ pensions, the increase in their number is proportio-nately larger than for widows’ pensions because the death of the insured personhappens at an early age, at a time when in the household there are moredependent children under the age of 20.
5.1.4 Impact on revenue of scheme
HIV/AIDS will have an impact on the revenue of the scheme to the extent thatit affects the number of contributors and their average contributory earnings.For our simulation on Afroland, we have worked out various scenarios withregard to the impact of HIV/AIDS on the number of contributors. Scenario 1 isthe base scenario, without HIV/AIDS. In scenario 2, we transfer directly onthe pension scheme the reduction in the number of workers, keeping constantthe percentage of workers covered by the scheme (constant age-specificcoverage rates). In scenario 3 the number of contributors remains unchanged,thus leaving the revenue of the scheme unaffected; it is further assumed that thelabour force is largely unemployed and easily replaceable (unskilled). Scenario4 freezes the number of contributors at its 2000 level, assuming that the AIDSdeaths and the lower economic growth prevent any increase in the coveredpopulation.
5.1.5 Global impact on cost of scheme
The global impact of HIV/AIDS on the cost of a social security pension schemewill vary over time. In the short run, the additional survivors’ and invaliditypensions will increase spending and HIV/AIDS may reduce the number ofcontributors because of their death or incapacity to work. In the longer run,HIV/AIDS is expected to reduce the number of persons reaching retirementage, thereby lowering the expenditure related to old-age pensions.
Under the least favourable scenario (frozen participation levels), the pay-as-you-go (PAYG) rate increases dramatically from its present level of 7.7 percent to 20 per cent in 2030, and eventually to 23 per cent in 2050. On the otherhand, if we assume that those who die of AIDS are rapidly replaced by newcontributors to the scheme (scenario 3), then the impact on the overall cost isslightly reduced with a PAYG rate under 12 per cent for the next 40 years.Figure IB1.9 presents the PAYG cost of the scheme under the different scenarios.
It may be helpful to compare the general average premium (GAP) under thevarious scenarios. It is defined here as the constant contribution rate that isnecessary to finance all benefits of the scheme over the period 2000–50. Underthe base scenario (scenario 1), without the impact of HIV/AIDS, the GAPwould be 10.3 per cent, and under scenario 2 it would amount to 11.4 per cent.This means that an immediate and constant increase of 1.1 per cent in thecontribution rate would be required over the next 50 years. On the other hand, ifwe assume that HIV/AIDS does not affect the number of contributors becauseof a full substitution of the labour force (scenario 3), then the GAP would
507
Issue Brief 1

increase to 11.0 per cent (compared with 10.3 per cent under the base scenario).Under scenario 4, the least favourable of all, the GAP would be 16.5 per centover the next 50 years.
5.1.6 Impact on contribution rates
As mentioned in the presentation of Afroland, the present contribution rate of8 per cent was considered sufficient, in the absence of HIV/AIDS, to support thescheme until 2027. The presence of the disease will change the picture andforce an early increase in the contribution rate because of the short-term deficitcaused by higher spending and the possible shrinking of the number ofcontributors. Table IB1.2 presents the contribution rates under the differentscenarios. The starting rate is the present, 8-per cent rate. When it is no longersufficient, it is increased just enough to meet the PAYG cost of the scheme.
In scenario 2, where HIV/AIDS affects the number of contributors in thesame proportion as the entire labour force, we observe that the 8-per centcontribution rate is insufficient already in 2000. The contribution rate must beincreased gradually to reach 10.5 per cent in 2010 in order to face the increasingexpenditure pattern and the lower salary base resulting from HIV/AIDS.Scenario 3, where HIV/AIDS does not affect the number of contributors, alsorequires a faster contribution rate increase (compared to the base scenario,without HIV/AIDS), but at a slower pace than in scenario 2. Under the
Figure IB1.9 PAYG cost of the Afroland scheme under various scenarios
Source: ILO calculations.
508
Financing social protection

worst-case scenario the contribution rate would have to increase rapidly to 17.3per cent in 2020 and to 23.2 per cent in 2050.
5.1.7 Other pension arrangements
The above discussion used the example of a typical defined-benefit pensionscheme. Other arrangements will be affected by HIV/AIDS in a differentway. Annex IB1-A2 presents the impact of AIDS in the context of a defined-contribution (or Provident Fund) arrangement, discussing how this type ofscheme is equipped to address the issue of HIV/AIDS.
5.2 Health
Health is obviously a sector directly affected by HIV/AIDS. Healthexpenditures related to the disease can be divided into curative care andprevention. Health care may be offered by the public sector, by the privatesector, and by donors.
In the particular case of Afroland, it is assumed that all publicexpenditures on health are financed from general revenues and that there isno national health insurance scheme. On the basis of World Bank data for anumber of African countries, we assume that the annual health care costrelated to HIV/AIDS for an individual is equal to 1.5 times the per capitaGDP. In Afroland this translates into an expenditure of US$1,080 per affectedindividual in 2000. This should even allow for the provision of generic
Table IB1.2 Required contribution rates (%), Afroland, 2000–50 (with andwithout HIV/AIDS)
Year Scenario 1 Scenario 2 Scenario 3 Scenario 4
2000 8.0 8.2 8.0 8.3
2001 8.0 8.5 8.2 8.9
2002 8.0 8.8 8.6 9.6
2003 8.0 9.1 9.0 10.4
2004 8.0 9.4 9.3 11.1
2005 8.1 9.6 9.5 11.7
2010 8.4 10.5 10.1 14.1
2020 9.0 11.7 10.1 17.3
2030 10.0 11.3 10.7 19.9
2040 11.8 11.7 12.0 21.6
2050 15.5 15.2 15.2 23.2
Source: ILO calculations.
509
Issue Brief 1

anti-retroviral drugs in regions where their application can be properlymonitored by medical staff. It is considered here that health expenditurerelated to AIDS does not vary much according to age because of the nature ofthe disease and its short duration in developing countries. It is also assumedthat the health care delivery system accommodates the additional demand infull, i.e. that the delivery system is not subject to a capacity constraint. Withrespect to the financial consequences of the pandemic, this is definitely aprudent assumption. Based on these assumptions and the AIDS prevalencerates assumed for Afroland, total health expenditures represent, in 2000,2.5 per cent of GDP without HIV/AIDS and 3.5 per cent of GDP taking intoaccount the impact of HIV/AIDS.
For projections of future health care, we assume that without HIV/AIDS thetotal remains constant as a percentage of GDP (2.5 per cent). Assuming thatHIV/AIDS-related expenditure grows at the same pace as the number of AIDSdeaths (as projected under the demographic model), total health expenditures inthe context of HIV/AIDS increase from 3.5 per cent of GDP in 2000 to 5.1 percent of GDP in 2015 (see table IB1.3).
5.3 Unemployment insurance
The unemployment programme will be affected by HIV/AIDS since theepidemic will slow economic growth and cause unemployment. Table IB1.4
Table IB1.3 Projected health care expenditure (as % of GDP), Afroland,2000–15 (with and without HIV/AIDS)
Year Without HIV/AIDS With HIV/AIDS
2000 2.5 3.5
2005 2.5 4.4
2010 2.5 4.9
2015 2.5 5.1
Source: ILO calculations.
Table IB1.4 Unemployment rates (%), Afroland, 2000–15 (with andwithout HIV/AIDS)
Year Without HIV/AIDS With HIV/AIDS
2000 13 14
2005 12 17
2010 12 18
2015 13 20
Source: ILO calculations.
510
Financing social protection

presents the unemployment rates used in our economic scenario. It must benoted that, since HIV/AIDS leads to a reduction in the population of workingage, after 2015 the unemployment rate would start to decline and after 2025become lower than the rates under the scenario without HIV/AIDS (see point 5of Annex IB1-A1).
We assume that Afroland has introduced an unemployment insurancescheme financed by employer/worker contributions equal to 1 per cent ofcovered salaries. HIV/AIDS will cause a rise in unemployment, as shown intable IB1.4. It is assumed that unemployment in the formal sector and henceregistered unemployment (and consequently unemployment benefits) willfollow the same pattern. Therefore, the unemployment insurance contributionwill have to be increased gradually from 1.0 per cent of covered earnings in2000 to 1.5 per cent in 2015.
5.4 Short-term benefits
In our example, short-term benefits include sickness, maternity and employmentinjury benefits. We assume that the cost of sickness benefits will increase by 50 percent as a result of HIV/AIDS, from 0.5 per cent of payroll to 0.75 per cent ofpayroll. Maternity benefits (0.5 per cent of payroll in 2000) will follow the declinein the fertility rate as a result of HIV/AIDS and the cost of employment injurybenefits will not be affected, remaining at 1.0 per cent of payroll.
5.5 Family benefits
It is assumed that tax-financed family benefits will not be affected by HIV/AIDS.A change in the country’s demographic make-up would be compensated by achange in benefit amounts so as to keep global expenditure at the same level.
5.6 Social assistance
Afroland has a basic social assistance programme whose expenditure, financedfrom government’s general revenue, represents 0.25 per cent of GDP. It isassumed that HIV/AIDS will increase poverty and that the government willhave to support those in need because of loss of income or higher expenses forpersonal health care. It is further assumed that the social assistance programmewould have to pay additional cash benefits of US$500 to 53,000 personsaffected by HIV/AIDS in the year 2000 and that this amount, indexed annually,would be payable to an increasing number of persons, in line with ourdemographic projections.
Under these assumptions, the cost of the social assistance programme woulddouble in 2000 (from 0.25 per cent to 0.50 per cent of GDP) because of HIV/AIDS, reaching 0.9 per cent of GDP in 2015.
511
Issue Brief 1

6. SOCIAL BUDGET
Tables IB1.5 and IB1.6 present the social budget of Afroland without and with theimpact of HIV/AIDS (see also figures IB1.10 and IB1.11). In the year 2000,without HIV/AIDS, total social expenditure represents 5.0 per cent of GDP, out ofwhich 2.5 per cent of GDP goes for health and 1.1 per cent for pensions. It growsmodestly over the next 15 years from 5.0 to 5.4 per cent of GDP mainly because ofthe increase of the expenditure on pensions. Since pensions are financed from
Table IB1.5 Afroland’s Social Budget (as % of GDP), 2000–15 (withoutHIV/AIDS)
2000 2005 2010 2015
Expenditure
1. Pensions 1.1 1.3 1.5 1.7
2. Health 2.5 2.5 2.5 2.5
Public 1.0 1.0 1.0 1.0
Private 1.5 1.5 1.5 1.5
3. Unemployment 0.1 0.2 0.2 0.2
4. Short-term benefits 0.3 0.3 0.3 0.4
5. Family benefits 0.5 0.4 0.4 0.4
6. Social assistance 0.2 0.2 0.2 0.2
Total current social expenditure 4.7 4.9 5.1 5.4
Change of reserves 0.2 0.2 0.1 0.0
Pension insurance 0.2 0.2 0.1 0.0
Health insurance 0.0 0.0 0.0 0.0
Short-term benefits 0.0 0.0 0.0 0.0
Unemployment insurance 0.0 0.0 0.0 0.0
Total social expenditure 5.0 5.1 5.2 5.4
Income
Social security contributions 1.6 1.7 2.0 2.2
Pension insurance 1.1 1.3 1.5 1.6
Health insurance 0.0 0.0 0.0 0.0
Short-term benefits 0.3 0.3 0.3 0.4
Unemployment insurance 0.1 0.2 0.2 0.2
Investment income 0.2 0.2 0.2 0.2
Pension insurance 0.2 0.2 0.2 0.2
Health insurance 0.0 0.0 0.0 0.0
Short-term benefits 0.0 0.0 0.0 0.0
Unemployment insurance 0.0 0.0 0.0 0.0
Income from General revenues 3.2 3.2 3.0 3.1
Total income 5.0 5.1 5.2 5.4
Source: ILO calculations.
512
Financing social protection

workers’ and employers’ payroll contributions, the burden on general revenuesdeclines slightly during the period, from 3.2 to 3.1 per cent of GDP.
With HIV/AIDS the picture is seriously distorted. Health spending, whichrepresents the main social expenditure item financed from general revenues,increases from 3.5 per cent of GDP in 2000 to 5.1 per cent of GDP in 2015.The pension burden doubles from 1.1 to 2.2 per cent of GDP during thesame period. The resulting impact of AIDS on general revenues is that thegovernment will have to finance expenditure amounting to 4.5 per cent of GDP(compared to 3.2 per cent) in 2000 and 6.3 per cent of GDP (instead of 3.1 percent) in 2015.
Table IB1.6 Afroland’s Social Budget (as % of GDP), 2000–15 (with HIV/AIDS)
2000 2005 2010 2015
Expenditure
1. Pensions 1.1 1.5 1.8 2.2
2. Health 3.5 4.4 4.9 5.1
Public 1.4 1.7 1.9 2.0
Private 2.1 2.6 2.9 3.0
3. Unemployment 0.2 0.2 0.3 0.4
4. Short-term benefits 0.3 0.4 0.5 0.6
5. Family benefits 0.5 0.5 0.5 0.5
6. Social assistance 0.5 0.7 0.8 0.9
Total current social expenditure 6.1 7.7 8.8 9.6
Change of reserves 0.2 0.2 0.2 0.1
Pension insurance 0.2 0.2 0.2 0.1
Health insurance 0.0 0.0 0.0 0.0
Short-term benefits 0.0 0.0 0.0 0.0
Unemployment insurance 0.0 0.0 0.0 0.0
Total social expenditure 6.3 7.9 9.1 9.7
Income
Social security contributions 1.6 2.1 2.6 3.2
Pension insurance 1.1 1.5 1.8 2.2
Health insurance 0.0 0.0 0.0 0.0
Short-term benefits 0.3 0.4 0.5 0.6
Unemployment insurance 0.2 0.2 0.3 0.4
Investment income 0.2 0.2 0.2 0.2
Pension insurance 0.2 0.2 0.2 0.2
Health insurance 0.0 0.0 0.0 0.0
Short-term benefits 0.0 0.0 0.0 0.0
Unemployment insurance 0.0 0.0 0.0 0.0
Income from General revenues 4.5 5.6 6.2 6.3
Total income 6.3 7.9 9.1 9.7
Source: ILO calculations.
513
Issue Brief 1

The addition of all the components of social expenditures shows thatHIV/AIDS will have a dramatic impact on government-financed schemes andmay cause serious budgetary problems.
7. IMPACT OF HIV/AIDS ON GOVERNMENT BUDGET
Under our hypothetical scenario, general taxes collected in Afroland represent15 per cent of GDP and, in 2000, those taxes can finance all government
Figure IB1.11 Projection of social expenditure (as % of GDP), Afroland,
2000–15 (with HIV/AIDS)
Source: ILO calculations.
Figure IB1.10 Projection of social expenditure (as % of GDP), Afroland,
2000–15 (without HIV/AIDS)
Source: ILO calculations.
514
Financing social protection

expenditures not related to social security and health. It is supposed that 60 percent of tax revenues results from indirect taxation on consumption (whichfollows the growth of GDP) and that 40 per cent is direct taxes that follow thecontribution revenue of the public pension scheme.
In the context without AIDS, the government’s budget would be inequilibrium in 2000 and its surplus/deficit position would remain the same,assuming that the increase in taxes (due to the move of workers from theinformal to the formal sector of the economy) is compensated by a fall in othergovernment revenues.
AIDS changes the picture dramatically. As shown in table IB1.7, itgenerates a government deficit equal to 1.3 per cent of GDP in 2000 and, ifthe pandemic is not controlled, the budget deficit reaches 3.7 per cent ofGDP in 2015.
What are the solutions for the government in such a difficult budgetarycontext? Two options, attractive at first glance, are not really viable:
. Increasing general taxes in order to finance the rise in health care costs mayjust put additional pressure on a fragile economy and create moreunemployment.
Table IB1.7 Government budget (as % of GDP), Afroland, 2000 and 2015(with and without HIV/AIDS)
2000 2015
WithoutHIV/AIDS
WithHIV/AIDS
WithoutHIV/AIDS
WithHIV/AIDS
Revenue
Taxes 15.0 15.0 17.5 17.1
Social security contributionsand investment income
1.8 1.8 2.4 3.4
Other income 3.2 3.2 0.5 0.5
Total 20.0 20.0 20.4 21.0
Expenditure
Social assistance and social security 2.5 2.8 2.9 4.6
Health 2.5 3.5 2.5 5.1
Other 15.0 15.0 15.0 15.0
Total 20.0 21.3 20.4 24.7
Surplus/deficit 0.0 �1.3 0.0 �3.7
Notes:
• The increase in tax revenue between 2000 and 2015 is due to the increase of the number of workers in the formalsector; direct taxes are assumed to increase in proportion to the total payroll covered by the public pension scheme.
• The figures ‘‘With HIV/AIDS’’ are expressed as a percentage of a GDP that is lower than under the scenario‘‘Without HIV/AIDS’’ because of the impact of AIDS on the rate of growth of GDP.
Source: ILO calculations.
515
Issue Brief 1

. Introducing a health insurance scheme financed by employee/employercontributions would shift the cost burden of the costliest item (healthexpenditure) from the government to the private sector. This would have adirect effect on the government budget. However, a health insurancescheme introduced in the context of a pandemic of this scale has no realchance of being viable because of the incapacity to charge premiums linkedto the high cost of AIDS-related curative care. In addition, this option wouldincrease the cost of labour and have a negative effect on the economy, thusreducing growth, increasing unemployment and diminishing general taxrevenues.
An effective short-term strategy would be to invest in awareness-raisingcampaigns in order to reduce the financial impact of HIV/AIDS, especially onhealth expenditure. Investment in such campaigns at workplaces, designed toreduce the incidence of HIV/AIDS, could contribute substantially to safe-guarding the future financial well-being of the social security system. Someco-sponsoring of campaigns by social security pension schemes seems toconstitute a fully justified and rational course of action.
8. CONCLUSION
As long as a pension scheme is able to replace the workers who areprematurely dying of AIDS, the impact of the disease on national pensionschemes appears manageable from the financial point of view. However, thegreat unknown is the impact of HIV/AIDS on the number of contributors tothese schemes. For developing countries, it may be assumed that highunemployment and the large size of the informal sector will make it possible toreplace AIDS deaths in the workforce to a considerable degree with workersnot currently employed in the formal sector. But even under that assumption, itis possible that the overall growth rates will drop since the productivity of thenew workers is not likely to be as high as the productivity of those to bereplaced, and the cost of training the replacements will increase the overallcost to the enterprise, thereby affecting growth. The dramatic results of thenon-replacement scenario (which certainly describes an improbable extremecase) show that the financial risks of pension schemes affiliated with a potentialloss of qualified workers in the economy are indeed substantial.
On the other hand, the theoretical social budget exercise presented hereshows that the cost of social programmes other than pension schemes mightincrease significantly as a result of HIV/AIDS. The cost of health care,sickness and unemployment benefits schemes may rise dramatically as AIDSputs people out of jobs and generates the need for income support and healthcare. In countries with high HIV/AIDS prevalence, the burden on generalrevenues may put governments in an untenable financial position. Investingin early awareness-raising campaigns remains one possible solution.
516
Financing social protection

Notes
1 This is an extended version of Cichon and Plamondon (2001). The original paper was limited tothe effects of the pandemic on pension systems.
2 The unemployment rate in many developing countries is significantly higher, sometimes reaching40 per cent or more. In that context, our assumptions might appear optimistic. However, as describedearlier in the context of AIDS, high unemployment combined with unskilled labour may lead to an easierreplacement of people dying from AIDS with people coming from the ranks of the unemployed or fromthe informal sector. Consequently, keeping the unemployment rate voluntarily at a low level maygenerate a greater impact of AIDS on the social security system.
3 Such a relationship between the two indicators is observed for example in Cote d’Ivoire.
517
Issue Brief 1

ANNEX IB1-A1 DESCRIPTION OF THE MAIN
ECONOMIC ASSUMPTIONS
USED FOR PROJECTIONS
1. Description of the four scenarios
Issue Brief 1 compares projections under four scenarios depending on thepresence or absence of HIV/AIDS and the extent to which it affects the numberof contributors to the social security scheme. The scenarios are as follows:
Scenario 1
Base scenario, without HIV/AIDS.
Scenario 2
HIV/AIDS affects the number of contributors to the social security scheme thesame way it affects the total labour force. The coverage rates are set equal tothose of the base scenario.
Scenario 3
The number of contributors to the social security scheme is the same as in thebase scenario (without HIV/AIDS). It is assumed that there is full substitution ofcontributors dying from AIDS by workers previously not covered by the scheme.
Scenario 4
The number of contributors is constant and equal to the absolute numberobserved in 2000.
2. Rate of growth of GDP (%)
Year Scenario 1 Year Scenarios 2, 3 and 4
2000–04 5.0 2000–04 3.0
2005–09 4.5 2005–09 3.0
2010–19 4.0 2010–19 3.0
2020–29 3.5 2020–35 3.0
2030–39 3.0 2036–39 2.5
2040–49 2.5 2040–49 2.0
Source: ILO calculations.
518

3. Rate of growth of productivity per worker (%)
Year Scenario 1 Year Scenarios 2, 3 and 4
2000+ 1.2 2000–39 1.0
2040þ 1.2
Source: ILO calculations.
4. Participation rates (%)
Age Scenario 1 Scenarios 2, 3 and 4
Males Females Males Females
15–19 58 37 65 50
20–24 89 44 90 60
25–29 97 47 90 60
30–34 98 49 90 60
35–39 99 49 90 60
40–44 98 51 90 60
45–49 97 51 90 50
50–54 97 49 90 50
55–59 90 46 60 30
60–64 88 39 20 20
65–69 72 23 20 20
Source: ILO calculations.
5. Unemployment rates (%)
Year Scenario 1 Scenarios 2, 3 and 4
2000 13 14
2005 12 17
2010 12 18
2015 13 20
2020 14 19
2025 16 17
2030 17 12
2035 17 7
2040 16 6
2045 15 6
2050 13 6
Source: ILO calculations.
519
Issue Brief 1

6. Percentage of workers covered by the
social security scheme
The following coverage rates are assumed for scenarios 1 and 2. Under scenario2, the same coverage rates are applied to a reduced labour force, resulting in areduced covered population.
Scenario 3 uses the same number of insured persons as scenario 1. Scenario4 uses a constant absolute number of insured persons equal to the observedcovered population in 2000.
Age Age-specific coverage rates
Males Females
15–19 20 20
20–24 25 25
25–29 30 30
30–34 40 35
35–39 40 40
40–44 50 45
45–49 50 50
50–54 60 55
55–59 60 60
Source: ILO calculations.
520
Financing social protection

ANNEX IB1-A2 IMPACT OF HIV/AIDS ON
DEFINED-CONTRIBUTION SCHEMES
In the field of pensions, the Issue Brief has addressed the issue of the financialimpact of HIV/AIDS in the context of defined-benefit pension schemes.However, as already mentioned, certain African countries have adopteddifferent forms of pension provisions. Some countries have introducedProvident Funds or other forms of defined-contribution (DC) systems. Itmay be of interest to analyse how these instruments may deal with the issue ofHIV/AIDS.
Under a DC scheme, contributions are accumulated in an individual accountand the accumulated account is normally paid at retirement in the form of anannuity, a lump-sum or scheduled withdrawals. The usual death benefit under aDC pension scheme is a refund of the account accumulated on behalf of theindividual at the time of death. The accumulated account represents the sum ofcontributions previously paid plus accumulated interest. If the death occurs justa few years after the individual has started contributing to the scheme, then theaccumulated account will be low.
Using the same 8-per cent contribution rate as in the Afroland case,table IB1-A2.1 presents the accumulated account at different ages for anindividual who started contributing to a DC scheme at the age of 20.
Table IB1-A2.1 shows that the regular income that can be purchased fromthe accumulated account is far below the value of a life annuity when the deathoccurs before age 45 (compare columns (3) and (4) of the table). It also showsthat DC schemes are poorly adapted to face the threat of HIV/AIDS because of
Table IB1-A2.1 Accumulated contributions in a DC scheme (age 20 at entry)
Age (1)Currentsalary ($)
(2)Accumulatedaccount ($)
(3)Ratio of accumulatedaccount over current salary
(4)Value of a life annuityto the spouse (of onedollar per year)
25 23 411 12 383 0.5 19.4
30 27 405 28 487 1.0 18.6
35 32 079 52 070 1.6 17.6
40 37 551 86 008 2.3 16.5
45 43 956 134 210 3.1 15.2
Note
It is assumed that:
• the salary increases by 3.2 per cent (nominal) per year
• the individual account earns interest at 6.0 per cent annually
• the life annuity is indexed at 2 per cent annually
Source: ILO calculations.
521

their incapacity to provide regular long-term income to the survivors ofcontributors belonging to the most affected age groups (20-45 years of age).
On the other hand, some Provident Funds allow the pre-payment of theaccount balance in the case of specific events before retirement. Such aprovision may help to pay medicines and hospital expenses and to support thefamily during the last months of the contributor’s life.
522
Financing social protection

ISSUE BRIEF 2
MIGRATION AND HIGHER LABOUR FORCEPARTICIPATION AS FACTORS IN SOCIALPROTECTION FINANCING: POLICYCHOICES IN AGEING SOCIETIES1
1. INTRODUCTION AND OBJECTIVE
Ageing is often perceived as one of the core problems facing the socialprotection sector, and pension schemes in particular; however, this is an undulycurtailed view of its implications for a society. Ageing also means that acountry’s labour force is contracting while the relative number of people thatare dependent on transfer incomes increases. All other conditions remainingequal, per capita GDP should decline, leading to a fall in the standards of livingin general, and of social protection in particular.
If the population as a whole wants to maintain its standard of living then theproductivity of the shrinking labour force has to increase, probably throughmore capital-intensive ways of production. Funding pensions might help tocreate the savings needed. However, the possible increase in labour productivitythrough greater use of capital is limited by the pace of technological change.Even during the 1990s, a decade of rapid technological progress, productivityper worker in Europe hardly increased by more than 2 per cent annually. Theother option would be to expand the labour force through higher rates ofparticipation of the existing population and through migration.
This Issue Brief explores the interrelationships between economicperformance, financing of social protection, migration and higher labourforce participation in a society that wants to maintain its standard of living. Thesetting chosen is the European Union in its current composition, referred to hereas EU-15.
The Brief works through the mechanics of those interrelationships byusing a simple long-term demographic and pension model linked to a
523

simplified long-term national economic accounting model. The simulationmethods used are largely of an actuarial and deterministic nature: in otherwords, they project expenditure and benefit levels for the next 50 yearsunder a variety of scenarios and prudent assumptions based on nationalaccounts identities. The objective is not to develop a perfect model but ratherto move the debate from general qualitative reasoning into concrete technicalassumptions and economic hypotheses. The model used is certainly not perfect,but it can serve as a starting point to structure a policy debate on a verycomplex problem. The analysis brings under the umbrella of one comprehen-sive exercise all the technical and analytical skills that were developed inthis book.
The Issue Brief sets out in particular to:
– assess the necessary replacement migration in an ageing society that doesnot increase its labour force participation but pursues a high productivitypolicy;
– assess the potential mitigating effect of higher labour force participation onmigratory pressures; and
– point out the stabilizing effect of combined high productivity, high labourforce participation and controlled migration policy on alternative financingoptions for pension schemes, which are the main expenditure item innational social protection systems.
2. DEMOGRAPHIC CONTEXT
Europe is ageing rapidly. The facts are well known and hardly disputed.According to United Nations population projections:
– the proportion of those older than 65 of the total population in the EuropeanUnion2 in 2050 will be 30.3 per cent, as compared to 16.4 per cent in 2000;
– the median age of the population will increase from 39 years in 2000 to50 years in 2050;
– the demographic dependency ratio (pop (0–14 and 65+)/(pop (15–64)) willincrease from about 500 per 1,000 population in 2000 to slightly under 800per 1,000 in 2050, as shown in figure IB2.1.
In short, assuming constant labour force participation rates, an ever-increasing share of the population will be inactive because of old age; anever-decreasing share of the population will have to earn the income andproduce goods and services to provide them with income and the goods andservices needed, and that active group will itself become older and older.These developments will constitute an obvious burden for national socialtransfer systems as well as affecting long-term growth rates of the Union’seconomy.
524
Financing social protection

According to a recent report by the United Nations Population Division (seeUnited Nations, 2001c), in the current 15 EU Member States:
– about 47 million migrants would be needed to maintain the overall size ofthe population until 2050;
– about 79 million migrants would be needed to maintain a constant size of theage group 15–64; and
– about 674 million migrants would be needed to maintain a constant old-agedependency ratio.
It is obvious that migratory flows of that order of magnitude might posepolitical problems within EU-15 as well as economic problems (brain-drain)in the exporting countries outside it. The United Nations model calculationsare limited to a demographic analysis and are designed to demonstrate thesize of necessary replacement migration from a ‘‘population numerical’’ pointof view. However, it is not really the potential loss of the overall populationor numerical shift in demographic dependency ratios that can make aconvincing case for a certain necessary level of replacement migration. Whywould a smaller population be a problem for EU-15 as long as its standard ofliving and social protection can be maintained? To assess the requiredchanges in national policies to counteract the effects of ageing on standards ofliving, a more comprehensive combined demographic and economic analysiswould be needed.
0
100
200
300
400
500
600
700
800
2000 2005 2010 2015 2020 2025 2030 2035 2040 2045 2050
total dependency ratio youth dependency ratio old-age dependency ratio
Figure IB2.1 Expected development of demographic dependency ratio (per
thousand), EU-15, 2000–50
Source: Based on United Nations (2001a and 2001b).
525
Issue Brief 2

3. METHODOLOGICAL APPROACH
The methodological approach adopted here is largely based on projections andsimulations of the population, the labour force, as well as employment in theEU (in its present composition, here referred to as EU-15) as a whole on thebasis of alternative economic scenarios. Some sweeping generalizations andsimplifications have to be made so as to contain the complexity of the model tobe used in the analysis.
EU-15 is thus considered here as one economy with no direct or indirectlimitations on intra-economy migration; economic development is consideredhomogenous across the Union. That is an obvious simplification, but country-based analyses are beyond the scope of this Brief. Such analyses would requiredeveloping long-term combined demographic and economic visions of thedevelopment of individual countries. However, more detailed national analysescan be undertaken using the same principal methodology. Labour demand andproductivity developments are not disaggregated by economic sector (thiswould only be meaningful in detailed national studies). The purpose of theexercise is to alert policy makers to the potential size of the impact of ageing oneconomic development and to explore the possible contribution of migration tomitigate that impact.
The central indicator as to whether EU-15 can maintain its presentstandard of living is the maintenance of a target per capita GDP growth. Thisis justified since in EU-15 the share of total household consumption in GDPhas hardly changed over the observation period (it fluctuated between 57 and59 per cent of GDP; see table IB2-A1.1 in the Statistical Annex). We seestandards of living as including standards of social security. It is assumedhere that if a certain per capita average GDP across the Union’s populationcan be maintained then levels of social transfers required to achieve thepresent level of social security can be maintained. The case is demonstratedfor pension schemes, which account for a major share of overall nationalsocial expenditure.
3.1 Modelling philosophy of the economic and
labour force model
The model used here is fairly straightforward and is based on the deterministiceconomic and demographic modelling philosophy that is used as a frameworkfor the ILO’s social budget model.3 Its basic exogenous assumptions concernthe demographic development, an assumed long-term growth path, as well asassumptions on overall per worker productivity.
The basic philosophy is the following: target levels of long-term economicgrowth per capita of the population in the start year of the projection (namely2000, which is the start year of the United Nations demographic projections
526
Financing social protection

used here)4 lead to a calculatory overall economic growth rate for the economyas a whole and hence to a euro amount of total real GDP for all projection yearsuntil 2050. The initial GDP per employed person is determined for the startyear. Exogenous assumptions are made with regard to the annual growth ofthe GDP per employee, i.e. labour productivity. Labour productivity as usedhere thus includes potential increases in the total number of hours worked percapita per annum. Dividing total GDP amounts by the assumed product peremployee returns total employment. Labour force minus employment results inunemployment or labour shortage. The aggregate numerical size of the labourforce is calculated by applying labour force participation rates to thedemographic structure. Alternative assumptions are made with regard tooverall labour force participation rates. The latter mainly include assumptionsof the actual retirement ages and behaviour of the population. Overall labourshortages, respectively unemployment, are interpreted here as gross indicatorsfor the need for migration or the lack thereof. This is of course a simplification,as even in times of high overall unemployment, a country might well needmigration workers with specific skills (as shown by the recent introduction ofthe ‘‘green card’’ for computer specialists in Germany).
The modelling analysis does not stop with the identification of a labourshortage. It assumes that EU-15 will try to close future labour gaps by threemain alternative or combined measures:
(a) migration;
(b) higher labour force participation;
(c) higher labour productivity.
3.2 Main modelling assumptions
Table IB2-A1.1 in the Statistical Annex provides some basic data on theeconomic development in EU-15 between 1991 and 2000. The key variables forthe model are per capita growth and per worker productivity.
Looking optimistically into the future, we assume that the target GDP percapita rate (and hence the average per capita consumption level) shouldincrease in real terms by about 3 per cent per capita annually. We furtherassume that the productivity per worker can annually be increased by 2 or2.5 per cent. All these rates are close to the maxima observed during the chosenobservation period (see table IB2-A1.1). The assumptions may appear over-optimistic, but what is more important than the absolute levels of growth andproductivity increases is the distances between the different growth rates.Projections with more modest per capita GDP growth rates of 2 per cent andproductivity rates of 1.0 per cent, respectively 1.5 per cent, show results similarto the scenario described here. The key variables in this model are linked by thefollowing simple formulae:
527
Issue Brief 2

(Formula 1)
GDP growth per capita ¼ employment growth+ labourproductivity growth – population growth
(Formula 2)
Real GDP growth per capita ¼ Consumption growth per capita¼ (proxy) increase of standard of living
For the first group of status quo projections (variant 1 and variant 2) wehence assume that EU-15:
– wants to maintain a per capita real GDP growth rate of 3 per cent annually;
– could achieve a rate of increase of productivity per employed person of 2.5per cent (variant 1) or alternatively 2.0 per cent (variant 2), even with anageing workforce;
– could increase women’s participation rates in the labour force by about 1 percent (not 1 percentage point!) per year for the next 25 years or so until theyreach a level of only 5 percentage points below that of men (78 per cent ofmales of the age group between 15 and 64 are assumed to be active at thepresent de facto retirement ages);
– will not experience any general increase in effective retirement age; and
– will experience a rate of ‘‘unavoidable’’ frictional unemployment of 2.5 percent for the whole period.
4. RESULTS OF LABOUR FORCE AND ECONOMIC
PROJECTIONS
4.1 Static effects
Based on the above assumptions, the labour shortage would reach substantiallevels. Figure IB2.2 shows the projected population in EU-15 until 2050, thetotal labour force and the projected static labour shortage under the 2.5-per centand the 2.0-per cent productivity increase assumption (variants 1 and 2,respectively).
Under variant 2, in 2050 the model produces a static labour shortage ofabout 88 million workers. Variant 1 would close the labour gap to some extentbut would not abolish it; a static shortage of 38 million would remain. ‘‘Staticshortage’’ means that EU-15 as a whole does not take any corrective measures –in other words, there is no change in labour force participation and no migration(i.e. no import of additional workers).
528
Financing social protection

The effect on the standard of living would be dramatic: GDP would drop toabout 78 per cent of the expected real level by 2050 under the 2.5-per centvariant and to about 61 per cent under the 2.0-per cent variant. These figuresdescribe the ‘‘ageing gap’’ of per capita GDP, the gap between the expected ortarget standard of living and the standard that is possible at a given productivitydevelopment, given demographic development without higher-than-‘‘normal’’levels of migration and labour force participation.
4.2 Effects of increasing migration
The key question we are putting forward is this: What would happen now if EU-15 were to take corrective action by importing labour rather than changing itslabour force participation behaviour through, among others, a higher retirementage, longer working hours, or switching to more productive work patterns?
What EU-15 cannot do is to fill only the calculatory labour shortage eachyear. The old German experience with ‘‘guest workers’’ in the 1960s and 1970swill still hold true. That experience was summarized as follows: We werecalling workers, but people came. Workers will not come alone – they willcome with their families, and that leads to an increasing population. If one doesnot want to discriminate between the standard of living of the natives and themigrants then the same amount of per capita GDP as for the native populationwould be needed to feed the additional population. As long as the newcomershave a lower dependency ratio than the native population, they will still make apositive contribution to the closure of the ageing gap in per capita GDP.
To simplify the model, it is assumed here that every immigrant worker isaged 35. That is compatible with the statistical average age of adult non-EUimmigrants in 1999 (see Brucker, 2002, table 2.5). It is also assumed that each
–100 000
–50 0000
50 000
100 000
150 000
200 000
250 000
300 000
350 000
400 000
2000 2005 2010 2015 2020 2025 2030 2035 2040 2045 2050
Num
ber
of p
eopl
e (in
thou
sand
s)
Total population (status quo) Labour force Labour surplus/shortage, variant 1 Labour surplus/shortage, variant 2
Figure IB2.2 Demographic results, static projection, EU-15, 2000–50
Source: ILO calculations.
529
Issue Brief 2

worker comes with a spouse of the same age who is immediately available tojoin the labour market. Every second immigrant worker also has a five-year oldchild (ibid.). This again is roughly in line with statistical experience. A moredispersed distribution of the immigrants’ age structure and family status wouldchange the results of the models only marginally. It is further assumed that theirreproductive behaviour immediately after immigration adapts to that of thenative population.
Another thing that EU-15 cannot accomplish is to fill labour gaps quasi-instantaneously, at lightning speed. Workers need to be recruited and relocated,and that takes time. The model assumes that each year t the immigrationauthorities in Europe will allow enough workers in to fill the employment gapof t�1. The recruited workers will then come with their families. Even if theaccompanying spouses enter the labour market instantaneously (to cover forsome of the time-lag between the emergence of gaps and the filling process),the model is beginning to ‘‘chase its own tail’’ and the total population isspiralling upward. This is because, while closing last year’s employment gap,the migrant workers and their families are pushing overall consumption levelsand hence the necessary GDP level up so that the structural labour gap of thenative population is wider and next year’s gaps and replacement needs arebigger than the static labour shortage of the native population. The governmentwould import a larger number of workers and their families, and so on.
0
1 000 000
2 000 000
3 000 000
4 000 000
5 000 000
6 000 000
7 000 000
8 000 000
9 000 000
10 000 000
11 000 000
2000 2005 2010 2015 2020 2025 2030 2035 2040 2045 2050
Status quo Variant 1 Variant 2
Figure IB2.3 Total population under the different scenarios and dynamic effect
(in thousands), EU-15, 2000–50
Source: ILO calculations.
530
Financing social protection

The results of the simulation are striking (see figure IB2.3). The mainresults are summarized in the Statistical Annex (see table IB2-A1.3). In anever-greater effort to fill the labour gap, the total population of EU-15 wouldhave to grow exponentially to fill the employment gap. Under the 2.5-per centproductivity increase assumption (or, in other words, a distance of 0.5percentage points between the overall expected increase of per capita GDP andlabour productivity increases) the population would have to approximatelydouble within the next 50 years, whereas under the 2.0-per cent variant thepopulation would simply explode.
A distance of 1 percentage point in the expected rate of per capita growth inproductivity would rapidly remove the labour surplus (i.e. unemployment) inEU-15 but would not be sustainable in the longer term. However, over the period1995–2000 a distance between the two rates of about 1.1 percentage points wasobserved, indicating that some of the economies definitely followed a lowproductivity–high employment strategy. Under variant 1, the net populationincrease would be about 388 million, less than predicted by purely demographiccalculations if one wished to maintain the demographic dependency ratios.
4.3 Increasing labour force participation
EU-15 countries would have one more option. They could increase theretirement age today from about 60 (de facto) to 65. A simple way to model theeffects is to increase labour force participation in the age group 15–64 by about
-
100 000
200 000
300 000
400 000
500 000
600 000
700 000
800 000
2000 2005 2010 2015 2020 2025 2030 2035 2040 2045 2050
Status quo Variant 1 Variant 1 with alternative labour force participation rates
Figure IB2.4 Total population under status quo and variant 1 with and without
the effect of alternative labour force participation rates (in
thousands), EU-15, 2000–50
Source: ILO calculations.
531
Issue Brief 2

15 per cent. We assume that this would take place between 2021 and 2031. Itwould result in building up an additional immigrant population compared to thestatus quo projections of about 112 million over 50 years. That figure seems tobe more manageable.
Figure IB2.4 compares the total population needed under the 2.5-per centvariant and the combined 2.5-per cent variant with higher labour forceparticipation rates. Another interesting outcome is that if one were to reduce percapita growth expectations to the level of the assumed productivity increase(say, at 2.5 per cent), then there would be no labour shortage – neither with norwithout adjustments to labour force participation rates. That means noreplacement migration would be needed.
5. EFFECTS ON PENSION SCHEME FINANCING
The effect of ageing and the possible mitigating effects of labour force,migration and financing policies are illustrated by an analysis of a nationalpension scheme. Pension schemes are most directly affected by ageing and theeffects are most complex when it comes to funded pension schemes. Clearlyhealth, unemployment and social assistance schemes (to name only the majorschemes) would also be affected. But modelling these would not bring muchadditional insight here.
To focus the analysis on the impact and implications of systemic(‘‘paradigmatic’’) reforms and to separate the impact of the parallel parametricreforms, it was assumed here that EU-15 countries have already undergone thefollowing radical parametric reforms of their pension systems (we are notdiscussing either the economic desirability or the social feasibility of suchreforms): The actual retirement age has been raised to 65 years and thereplacement rates of social security pensions lowered to 40 per cent of theaverage gross wage (this being the minimum level accepted by ILO SocialSecurity (Minimum Standards) Convention, 1952 (No. 102)) Old-age pensionsof this level are assumed in our fictitious status quo (‘‘pre-reform’’ variant) to befinanced on a PAYG basis. Invalidity and survivors’ pensions are neglected forthe sake of simplifying the analysis.
The ‘‘paradigmatic reform’’ variant assumes that a Mandatory RetirementSavings (MRS) scheme is starting operations fictitiously in the year 2000 andintends to progressively replace pension payments of the old system during along transition period. Savings rates and pension levels are building up overdecades. The contribution rate to the MRS system is 10 per cent. The differencebetween the total pension cost and the 10 per cent allocated to individualaccounts is the State’s participation in financing existing pensions and pre-existing entitlements as well as in subsidizing MRS pensions whenever they donot meet the desired target of a 40-per cent replacement rate. This is a simplebut realistic modelling of the transition cost. This kind of residual financing of
532
Financing social protection

the transition cost implies that the lower the government obligations the betterthe performance of the reformed scheme.
Pensions in the MRS scheme are calculated as the annuity that correspondsto savings accumulated over up to 40 years (with lower numbers of saving yearsduring the introduction phase). The annuity factors are based on unisexmortality tables and an assumed average discount rate of 3 per cent, which isequivalent to the long-run assumed average rate of real GDP growth per capita.Given a life expectancy of about 16 years in 2000 at age 65 this would lead toan annuity factor of 12.5. That annuity factor is assumed to apply throughoutthe projection period.5 The annual amount of pensions of those retiring iscalculated by dividing the accumulated balance on individual accounts by 12.5.In conjunction with the 10-per cent contribution rate these parameter values areaiming at the replacement rate of about 40 per cent of insurable earnings after40 years of continuous contributions (with 100 per cent density), assuming thatthe rate of return is significantly higher than real growth in insurable earnings.The target replacement rate of the overall pension system is set at the minimumlevel of 40 per cent, but the very nature of the MRS system does not allow forany guaranteed level of benefits (see figure IB2.5). That is why the governmentand the taxpayer – even after the long transition period is over – have to bealways prepared to provide supplementary financing in case (for some or all ofthe people retiring) MRS pension levels do not meet the policy target.
20
30
40
50
60%
2000
2005
2010
2015
2020
2025
2030
2035
2040
2045
2050
5%
4%
3%
2%
Figure IB2.5 Evolution of replacement rates in MRS scheme under increasing
life expectancy and different real rate of returns, EU-15, 2000–50
(after 40 years of contributions at 10% of earnings, with 2%
annual growth of real earnings)
Source: ILO calculations.
533
Issue Brief 2

Both schemes operate in the same demographic and economic environment,which is characterized by the above variant 1 with increased labour forceparticipation rates.
With respect to migration two extreme scenarios are used: a no migrationscenario and a migration scenario. The assumed demographic developmentsunder the two scenarios are summarized in table IB2-A1.2, and the basicemployment and economic developments in table IB2-A1.3 (see the StatisticalAnnex). Without migration, GDP in 2050 would be about 12 per cent lowerthan the targeted level since massive labour shortages would occur after 2035.With a lower level of productivity (e.g. 2 per cent annually) and a slowerupward adjustment of labour force participation rates, the GDP shortfall couldeven be in the order of 40 per cent of the targeted level.
The crucial extension of the economic model is the assumed nexus betweenthe demographic developments and the average rate of return on pensionsavings. Here it is assumed that the rate of return earned by the reformedscheme is equal to the macroeconomic rate of return of the national capitalstock (as defined by formula 3 below). This is a reasonable assumption since thereserves of a fully funded pension scheme may account after some decades for amajor share of the national capital stock. The link between savings and theinterest rate is modelled by the following formulae:
(Formula 3)
National capital stock in t ¼ National capital stock in t � 1 þ Gross
investment (¼ savings) in year t – depreciation of capital stock in t
(Formula 4)
Rate of return of national capital stock in t ¼ Capital income
in t / National capital stock in t
As real growth rates of private and government consumption are linked inthe model to the demographic/labour market developments (through theassumed impact of changing dependency ratios on the size of governmentconsumption and through the application of ‘‘equivalent consumption units’’ tomeasure per capita consumption growth), this results in changes also in savings(and investment) rates and thus in capital stock.
The impact on the rate of return (taking into account assumed constantshares of factor incomes in the national income) depends on what one assumesabout developments of average capital productivity (in other words, the impactof higher/lower savings rates on GDP growth). In the basic version of themodel, GDP growth rate per capita is exogenous and constant: growing saving/investment rates result in capital stock growing faster than GDP. Averagecapital productivity declines as well as the rate of return of the national capital
534
Financing social protection

stock. One could complete this analysis with alternative production functionswhich would release the external per capita growth assumption and use aproduction function with high capital productivity and a strong technologicalgrowth factor. But since the productivity per worker was already assumed asvery optimistic one can assume that the results may not be very different.However, more work needs to be done.
5.1 Projection results
The first set of results refers to the status quo (parametrically reformed) PAYGpension scheme. The results hold no surprises. Under the no migration scenario,the PAYG contribution rate (cost rate without administrative cost) and the costmeasured as share of GDP (the GDP cost ratio) would increase by more than50 per cent over the projection period. Under the migration scenario the costwould also increase over the next few decades but would be brought back topresent levels once the replacement migration sets in. Table IB2-A1.4 in theStatistical Annex summarizes the most important results of the projections.Figure IB2.6 maps them graphically.
The central question now is what would happen to a newly introduced MRSsystem under the two demographic scenarios. The main assumption about theinteraction between demographic development and rates of return describedabove is applied first to the no migration, then to the migration scenario.
0
5
10
15
20
25
30
2000 2005 2010 2015 2020 2025 2030 2035 2040 2045 2050
Per
cent
age
poin
ts
PAYG contribution rate (no migration) GDP cost (no migration)
PAYG contribution rate (with migration) GDP cost (with migration)
Figure IB2.6 Projected PAYG cost ratios and GDP cost ratios of ‘‘parametrically
reformed’’ PAYG pension schemes, EU-15, 2000-50
Source: ILO calculations.
535
Issue Brief 2

Figure IB2.7 shows how the rates of return are affected by the assumptions.The effect is considerable. The ultimate rate of return under the no migrationscenario drops from the initial 4 per cent real to under 3.2 per cent. Under themigration scenario, when replacement migration sets in (in the 2030s) thenGDP increases faster and the rates of return go back to high levels.
Together with the underlying demographic structure the above rates ofreturn determine the actual pension levels under the MRS scheme underdifferent variants in comparison to the expenditure under the status quo scheme.Figure IB2.8 shows the development of the total pension expenditure as apercentage of GDP under the alternative scenarios and also shows the share ofthe total expenditure, which will be covered through pensions from the MRSscheme.
It should be noted that the overall cost of a national pension system in whichan old scheme is being phased out and a new one built up over several decadesis actually identical with the expenditure under the reduced PAYG scheme,since it is assumed that the State will guarantee a minimum overall replacementrate of 40 per cent. What is actually changing is the share of pensions comingfrom the MRS scheme in the overall pension expenditure. It is obvious thatageing affects pension expenditure independently of the way pensions arefinanced. Just as evidently, the negative effect of ageing on the rates of returnand hence the slower progress of new MRS pensions towards the desiredreplacement rate level of 40 per cent extends the period during which the
3.0
3.2
3.4
3.6
3.8
4.0
4.2
4.4
2000 2005 2010 2015 2020 2025 2030 2035 2040 2045 2050
%
No migration With migration
Figure IB2.7 Projected development of rates of return (in %) in the reformed
pension scheme under alternative assumptions, EU-15, 2000–49
Source: ILO calculations.
536
Financing social protection

government has to bear most of the transition cost. Figure IB2.9 shows theeffect of migration alone on the total government transition cost until 2050.
The model is obviously only a first step towards a more complex analysis ofthe long-term stability of funded pension schemes in ageing societies. Todemonstrate the potential effects of ageing on the long-term rates of return,numerous simplifications had to be made. The demographically triggeredreductions in growth and the consequential effect on the real rates of returnmight therefore be overestimated.
But then, the effect of administrative and transaction costs on the real rate ofreturn on pension savings have not been taken into account either, and theywould counterbalance some of the potential overestimation effects. We havealready made extremely prudent assumptions about productivity developmentsand labour force participation rates. Still, some of the simplifications andassumptions may not hold true in future.
However, there seems to be reason enough to believe that stabilizingnational pension systems and hence the financing of the social protectionsystem as a whole in an ageing environment obviously requires moresophisticated solutions than a mono-dimensional reliance on greater fundingof pension schemes. Greater funding of national pension systems may notin itself trigger higher growth paths, as is sometimes claimed. Our analysisshows – since returns on investments are falling under the no migration(i.e. labour shortage) scenario – that it is most likely not capital shortage, butrather labour shortage, that limits growth.
0
2
4
6
8
10
12
14
2000 2005 2010 2015 2020 2025 2030 2035 2040 2045 2050
%
Total expenditure (no migration) Total expenditure (with migration)
MRS pensions (no migration) MRS pensions (with migration)
Figure IB2.8 Projected pension expenditure (as % of GDP) under alternative
scenarios, EU-15, 2001–50
Source: ILO calculations.
537
Issue Brief 2

6. POLICY CONCLUSIONS
Even though they could be improved through further model developments, theresults of this analysis appear sufficiently robust to enable us to state that acombination of polices have to be pursued in typical ageing societies in order tomaintain the standard of living, including the standard of social protection.Migration alone is not likely to provide an acceptable solution, nor is thechange in the financing of national pension schemes or the full exploitation ofthe potential national labour supply. The obvious policy mix for old and ageingsocieties consists of policies that:
– invest in the creation of high productivity jobs;
– invest in the maintenance of the productivity of older workers (whichrequires early investments in the long-term employability of workers);6
– invest in increasing labour force participation rates; and
– provide for controlled migration.
Incidentally, these are the same policies that would stabilize the existingsocial protection and notably PAYG pension schemes.
0
1
2
3
4
5
6
7
8
9
2000 2005 2010 2015 2020 2025 2030 2035 2040 2045 2050
%
No migration With migration
Figure IB2.9 Development of transition cost (as % of GDP), EU-15, 2000–50
(migration and no migration scenarios)
Source: ILO calculations.
538
Financing social protection

Notes
1 This Issue Brief takes up the contents of two papers: Cichon et al. (2003a) and Cichon et al.(2003c).
2 The data used in this Brief refer to the current 15 EU Member States.3 For more details on the model component, see Scholz et al. (2000), pp. 83–110.4 It should be noted that the United Nations population projection already includes a yearly number
of migrants of about 500,000.5 In reality one should expect this annuity factor to grow continuously along with increasing life
expectancy; higher and higher accumulated savings will thus be necessary to buy the same annuity(pension) – this is illustrated in figure IB2.5.
6 For a more detailed list of possible activities, see ILO (2002a).
539
Issue Brief 2

STATISTICAL ANNEX IB2-A1
Table IB2-A1.1 Historical structural economic data, EU-15, 1991–2000
Average growth rates
1991 1992 1993 1994 1995 1996 1997 1998 1999 2000 1991 to2000
1995 to2000
Total population (in millions) 365.4 367.1 369 370.4 371.6 372.7 373.7 374.6 375.5 376.5 0.33 0.26
Total employment (in millions) 154.5 152.7 149.5 149.3 150.4 151.3 152.7 155.5 158.2 161 0.46 1.37
Employment growth (%) �1.17 �2.10 �0.13 0.74 0.60 0.93 1.83 1.74 1.77
Total number of non-employed(in millions)
210.9 214.4 219.5 221.1 221.2 221.4 221 219.1 217.3 215.5 0.24 �0.52
Total economic dependency rate(not employed pop/employed)
1.37 1.40 1.47 1.48 1.47 1.46 1.45 1.41 1.37 1.34
GDP (constant 1991 prices,in billion e)
5 779 5 854 5 831 5 994 6 138 6 236 6 392 6 577 6 748 6 971 2.11 2.58
Real growth (%) 1.3 �0.4 2.8 2.4 1.6 2.5 2.9 2.6 3.3
GDP (current prices, in billion e) 5 779 6 025 6 042 6 334 6 588 6 920 7 288 7 632 8 017 8 524
Per capita GDP (in e) 15 816 15 947 15 801 16 182 16 517 16 732 17 104 17 558 17 972 18 515 1.77 2.31
Real per capita growth 0.83 �0.91 2.41 2.07 1.30 2.23 2.65 2.35 3.03
Labour product (constantprices, in e)
37 405 38 337 39 001 40 147 40 810 41 216 41 859 42 298 42 657 43 298 1.64 1.19
Productivity increase (%) 2.5 1.7 2.9 1.7 1.0 1.6 1.0 0.8 1.5
Final consumption expenditureof households (in billion e)
3 319 3 483 3 508 3 658 3 780 3 997 4 215 4 419 4 670 4 970
In % of GDP 57.4 57.8 58.1 57.8 57.4 57.8 57.8 57.9 58.3 58.3
Compensation of employees(in billion e)
3 068 3 209 3 211 3 289 3 393 3 537 3 699 3 846 4 065 4 336
In % of GDP 53.1 53.3 53.1 51.9 51.5 51.1 50.8 50.4 50.7 50.9
Source: EUROSTAT and OECD data.
540
Fin
an
cin
gso
cia
lp
rote
ctio
n

Table IB2-A1.2 Results of two basic demographic scenarios, EU-15, 2000–50
Year 2000 2005 2010 2015 2020 2025 2030 2035 2040 2045 2050
No migration scenario
Population under 15 59 301 59 506 55 666 52 198 50 795 50 205 49 926 49 218 48 153 47 177 46 605
Population >65 65 729 66 012 69 571 76 325 80 595 86 938 95 000 101 815 104 881 104 557 102 951
Population 15–64 251 970 252 606 252 721 247 574 242 955 234 206 222 350 210 808 202 066 195 731 189 758
Total population 377 000 378 123 377 958 376 096 374 344 371 349 367 276 361 842 355 100 347 465 339 314
Total dependency1 0.81 0.79 0.77 0.77 0.77 0.79 0.83 0.86 0.90 0.92 0.94
Labour force
Male 96 259 96 637 96 765 94 854 93 120 96 251 97 917 92 755 88 820 85 967 83 322
Female 76 202 80 183 84 242 87 549 89 371 92 335 94 008 89 201 85 584 82 965 80 452
Total labour force 172 461 176 820 181 006 182 404 182 492 188 586 191 925 181 956 174 404 168 932 163 774
Migration scenario
Population under 15 59 301 59 506 55 666 52 198 50 795 50 205 49 926 49 218 53 208 63 106 72 680
Population >65 65 729 66 012 69 571 76 325 80 595 86 938 95 000 101 815 104 881 104 557 102 951
Population 15–64 251 970 252 606 252 721 247 574 242 955 234 206 222 350 210 808 220 717 249 632 282 996
Total population 377 000 378 123 377 958 376 096 374 344 371 349 367 276 361 842 378 807 417 295 458 627
Total dependency1 0.81 0.79 0.77 0.77 0.77 0.79 0.83 0.86 0.85 0.80 0.74
Labour force
Male 96 259 96 637 96 765 94 854 93 120 96 251 97 917 92 755 97 019 109 640 124 263
Female 76 202 80 183 84 242 87 549 89 371 92 335 94 008 89 201 93 483 105 811 119 982
Total labour force 172 461 176 820 181 006 182 404 182 492 188 586 191 925 181 956 190 502 215 452 244 245
1Total dependency ¼ (people over 65 þ people under 15)/total employment.
Source: ILO calculations on the basis of UN data.
Issu
eB
rief
2
541

Table IB2-A1.3 Main results of the economic scenarios, EU-15, 2000–50
Year 2000 2005 2010 2015 2020 2025 2030 2035 2040 2045 2050
No migration scenario
Employment
Total labour force(in thousands)
172 461 176 820 181 006 182 404 182 492 188 586 191 925 181 956 174 404 168 932 163 774
Necessary employment 155 000 159 502 163 358 166 751 169 865 172 656 174 968 176 625 177 603 178 065 178 170
Total employment(in thousands)
155 000 159 502 163 358 166 751 169 865 172 656 174 968 176 625 170 044 164 708 159 680
Labour shortage/surplus(in thousands)
13 149 12 898 13 123 11 092 8 064 11 215 12 159 783 �7 559 �13 356 �18 490
Labour productivity (in CU) 53 439 60 461 68 406 77 396 87 566 99 073 112 092 126 822 143 487 162 342 183 675
Growth rate (%) 2.5 2.5 2.5 2.5 2.5 2.5 2.5 2.5 2.5 2.5
GDP
Target per capita GDP (in e) 22 000 25 504 29 566 34 275 39 734 46 063 53 400 61 905 71 765 83 195 96 446
Growth rate 3.0 3.0 3.0 3.0 3.0 3.0 3.0 3.0 3.0 3.0
Target GDP (in billion e) 8 283 9 644 11 175 12 906 14 874 17 106 19 612 22 400 25 484 28 907 32 725
Realized GDP (in billion e) 8 283 9 644 11 175 12 906 14 874 17 106 19 612 22 400 24 399 26 739 29 329
Growth rate 3.1 3.0 2.9 2.9 2.8 2.8 2.7 1.7 1.8 1.9
GDP shortfall due todemography
In % of target 0.0 0.0 0.0 0.0 0.0 0.0 0.0 0.0 �4.4 �8.1 �11.6
Migration scenario
Employment
Total labour force(in thousands)
172 461 176 820.2 181 006.4 182 403.5 182 491.6 188 585.9 191 924.7 181 956.5 190 502 215 451.8 244 245.2
Necessary employment 168 149 172 400 176 481 177 823 177 929 183 871 187 127 177 408 185 739 210 065 238 139
Total employment(in thousands)
155 205 159 502 163 358 166 751 169 865 172 656 174 968 176 625 185 739 210 065 238 139
Labour shortage/surplus(in thousands)
12 944 12 898 13 123 11 092 8 065 11 215 12 159 783 0 0 0
Labour productivity (in CU) 53 439 60 461 68 406 77 396 87 566 99 073 112 092 126 822 143 487 162 342 183 675
Growth rate (%) 2.5 2.5 2.5 2.5 2.5 2.5 2.5 2.5 2.5 2.5
Fin
an
cin
gso
cia
lp
rote
ctio
n
542

GDP
Target per capita GDP (in e) 22 000 25 504 29 566 34 275 39 734 46 063 53 400 61 905 71 765 83 195 96 446
Growth rate 3.0 3.0 3.0 3.0 3.0 3.0 3.0 3.0 3.0 3.0
Target GDP (in billion e) 8 294 9 644 11 175 12 906 14 874 17 106 19 612 22 400 27 185 34 717 44 233
Realized GDP (in billion e) 8 294 9 644 11 175 12 906 14 874 17 106 19 612 22 400 26 651 34 103 43 740
Growth rate 3.1 3.0 2.9 2.9 2.8 2.8 2.7 3.5 5.1 5.1
GDP shortfall due todemography
In % of target 0 0 0 0 0 0 0 0 �2 �2 �1
Source: ILO FACTS projections.
Table IB2-A1.4 Results of projections for the PAYG pension scheme under the two migration scenarios,EU-15, 2000–50
Year 2000 2005 2010 2015 2020 2025 2030 2035 2040 2045 2050
No migration scenario
Replacement rate under PAYG 0.4 0.4 0.4 0.4 0.4 0.4 0.4 0.4 0.4 0.4 0.4
Demographic ratio 0.42 0.41 0.43 0.45 0.47 0.50 0.54 0.58 0.62 0.63 0.82
– in % of total wage sum 16.96 16.55 17.04 18.05 18.98 20.14 21.72 23.06 24.67 25.39 25.79
– in % of GDP 8.48 8.28 8.52 9.03 9.49 10.07 10.86 11.53 12.34 12.70 12.89
Migration scenario
Replacement rate under PAYG 0.4 0.4 0.4 0.4 0.4 0.4 0.4 0.4 0.4 0.4 0.4
Demographic ratio 0.42 0.41 0.43 0.45 0.47 0.50 0.54 0.58 0.56 0.50 0.43
PAYG cost
– in % of total wage sum 16.94 16.55 17.04 18.05 18.98 20.14 21.72 23.06 22.59 19.91 17.29
– in % of GDP 8.48 8.28 8.52 9.03 9.49 10.07 10.86 11.53 11.29 9.95 8.65
Issu
eB
rief
2
543

Table IB2-A1.5 Projected pension cost of the newly introduced MRS system, EU-15, 2000–50 (no migration scenario)
Year 2000 2005 2010 2015 2020 2025 2030 2035 2040 2045 2050
GDP (in billion e) 8 283 9 644 11 175 12 906 14 874 17 106 19 612 22 400 24 399 26 739 29 329
Employment (in thousands) 155 000 159 502 163 358 166 751 169 865 172 656 174 968 176 625 170 044 164 708 159 680
Calculation of savings rate
Government consumption rate (%) 20.00 19.51 19.01 19.00 19.18 19.69 20.54 21.20 22.31 22.84 23.22
Private consumption rate (%) 60.00 58.47 57.42 56.16 54.75 53.16 51.47 50.83 50.83 50.83 50.83
Savings rate (%) 20.00 22.02 23.57 24.83 26.07 27.15 27.99 27.97 26.85 26.33 25.95
Calculation of macro-economic rate of return
Net capital income share (%) 20.00 20.00 20.00 20.00 20.00 20.00 20.00 20.00 20.00 20.00 20.00
Indirect tax and mixed incomeshare (%)
20.00 20.00 20.00 20.00 20.00 20.00 20.00 20.00 20.00 20.00 20.00
Depreciation share of GDP (%) 10.00 10.00 10.00 10.00 10.00 10.00 10.00 10.00 10.00 10.00 10.00
Wage share of GDP (%) 50.00 50.00 50.00 50.00 50.00 50.00 50.00 50.00 50.00 50.00 50.00
Capital stock in % of GDP 500.00 482.38 477.48 481.20 491.23 506.32 525.29 546.11 585.31 613.83 637.22
Savings rate (%) 20.00 22.02 23.57 24.83 26.07 27.15 27.99 27.97 26.85 26.33 25.95
Rate of return (%) 4.00 4.20 4.25 4.22 4.14 4.02 3.87 3.72 3.47 3.30 3.18
Capital productivity
New reformed pension scheme
Assumed contribution rate (%) 10 10 10 10 10 10 10 10 10 10 10
Annual contribution income(in billion e)
414 482 559 645 744 855 981 1 120 1 220 1 337 1 466
Fin
an
cin
gso
cia
lp
rote
ctio
n
544

Annual rates of return (%) 4.00 4.20 4.25 4.22 4.14 4.02 3.87 3.72 3.47 3.30 3.18
Compound interest factor 1.02 1.25 1.54 1.89 2.32 2.83 3.44 4.14 4.93 5.82 6.82
Average savings of retiringcohort (in e) (maximum 40 yearsof savings)
2 725 19 279 41 790 71 862 111 253 161 845 225 631 304 737 386 900 422 725 485 022
New pensioners (retiring cohort) 0 2 150 2 898 3 490 3 592 3 988 4 577 4 552 3 923 3 256 2 957
Annual withdrawals (lump sums) 0 41 121 251 400 645 1 033 1 387 1 518 1 376 1 434
Newly awarded pensions (in e) 0 1 547 3 353 5 765 8 925 12 984 18 101 24 448 31 039 33 913 38 911
Rep. rate of new pensionsin % of average earnings
0 5.1 9.8 14.9 20.4 26.2 32.3 38.6 43.3 41.8 42.4
Annual pension expenditure(in billion e)
0 9 40 100 206 371 627 953 1 233 1 479 1 646
In % of GDP 0.00 0.09 0.36 0.77 1.38 2.17 3.19 4.25 5.05 5.53 5.61
Reserves (in billion e) 422 3 007 6 483 10 963 16 477 22 963 30 171 37 750 45 460 53 203 61 524
In % of GDP 5.10 31.18 58.02 84.94 110.77 134.24 153.84 168.53 186.32 198.97 209.77
Public transition payments andguarantees (in billion e)
702 790 912 1 065 1 206 1 352 1 503 1 630 1 777 1 916 2 136
In % of GDP 8.48 8.19 8.16 8.25 8.11 7.90 7.66 7.28 7.28 7.17 7.28
In % of wage sum 16.96 16.38 16.32 16.51 16.21 15.81 15.33 14.55 14.57 14.33 14.57
Issu
eB
rief
2
545

Table IB2-A1.6 Projected pension cost of the newly introduced MRS system, EU-15, 2000–50 (migration scenario)
Year 2000 2005 2010 2015 2020 2025 2030 2035 2040 2045 2050
GDP (in billion e) 8 294 9 644 11 175 12 906 14 874 17 106 19 612 22 400 26 651 34 103 43 740
Employment (in thousands) 155 205 159 502 163 358 166 751 169 865 172 656 174 968 176 625 185 739 210 065 238 139
Calculation of savings rate
Government consumption rate (%) 20.00 19.54 19.03 19.03 19.20 19.72 20.56 21.23 21.13 21.00 21.00
Private consumption rate (%) 60.00 58.55 57.50 56.24 54.82 53.23 51.54 50.90 50.90 50.90 50.90
Savings rate 20.00 21.91 23.47 24.73 25.97 27.05 27.90 27.87 27.97 28.10 28.10
Calculation of macro-economic rate of return
Net capital income share (%) 20.00 20.00 20.00 20.00 20.00 20.00 20.00 20.00 20.00 20.00 20.00
Indirect tax rate (%) 20.00 20.00 20.00 20.00 20.00 20.00 20.00 20.00 20.00 20.00 20.00
Depreciation share of GDP (%) 10.00 10.00 10.00 10.00 10.00 10.00 10.00 10.00 10.00 10.00 10.00
Wage share of GDP (%) 50.00 50.00 50.00 50.00 50.00 50.00 50.00 50.00 50.00 50.00 50.00
Capital stock (%) 500.00 482.67 477.25 480.53 490.19 504.95 523.64 544.21 539.17 504.27 475.31
Savings rate (%) 20.00 21.91 23.47 24.73 25.97 27.05 27.90 27.87 27.97 28.10 28.10
Rate of return 4.00 4.20 4.25 4.23 4.15 4.03 3.89 3.74 3.77 4.04 4.29
New reformed pension scheme
Assumed contribution rate (%) 10 10 10 10 10 10 10 10 10 10 10
Annual contribution income (in billion e) 415 482 559 645 744 855 981 1 120 1 359 1 736 2 212
Annual rates of return (%) 4.00 4.20 4.25 4.23 4.15 4.03 3.89 3.74 3.77 4.04 4.29
Fin
an
cin
gso
cia
lp
rote
ctio
n
546

Compound interest factor 1.015 1.24 1.53 1.88 2.31 2.82 3.42 4.12 4.95 6.00 7.37
Average savings of retiring cohort (in e) 2 712 19 261 41 768 71 847 11 270 161 938 225 861 305 190 390 351 437 593 522 995
(maximum 40 years of savings)
New pensioners (retiring cohort) 0 2 150 2 898 3 490 3 592 3 988 4 577 4 552 3 923 3 256 2 957
Annual withdrawals (lump sums) (in billion e) 0 41 121 251 400 646 1 034 1 389 1 531 1 425 1 546
Newly awarded pensions (in e) 0 1 538 3 334 5 736 8 883 12 928 18 031 24 364 31 162 34 934 41 752
Rep. rate of new pensionsin % of average earnings
0 5.09 9.75 14.82 20.29 26.10 32.17 38.42 42.58 42.28 44.96
Annual pension expenditure (in billion e) 0 8 39 99 205 369 624 949 1 229 1 484 1 677
In % of GDP 0.00 0.09 0.35 0.77 1.38 2.16 3.18 4.24 4.61 4.35 3.83
Reserves (in billion e) 421 2 999 6 474 10 955 16 477 22 981 30 222 37 851 46 110 56 836 71 900
In % of GDP 5.08 31.10 57.94 84.89 110.77 134.35 154.10 168.98 173.01 166.66 164.38
Public transition payments andguarantees (in billion e)
702 790 912 1 066 1 207 1 354 1 506 1 634 1 841 1 972 2 148
In % of GDP 8.47 8.19 8.16 8.26 8.11 7.91 7.68 7.29 6.91 5.78 4.91
In % of wage sum 16.94 16.38 16.33 16.51 16.23 15.83 15.36 14.59 13.54 11.36 9.71
Source: ILO FACTS projections.
Issu
eB
rief
2
547

ISSUE BRIEF 3
THE NUMBER CRUNCHER’S SURVIVAL KIT
We all occasionally find ourselves having to do some quick, ‘‘back-of-the-envelope’’ calculations. Although only approximate, they can give you somereassurance if you have doubts about the results of complex model calculations.They should normally bring you within ^10 per cent of the results obtainedthrough a sophisticated model. If they do not, then you have the right to askspecific questions about the assumptions and calculation methods of a complexmethod. In our experience, that creates red faces often enough. Similarly, back-of-the-envelope calculations can help to bring some financial realism intofrequently very intense, ad hoc policy debates, especially during electioncampaigns when quick ideas sell best. That – again in our experience – alsotends to create red faces.
But causing embarrassment is not the point of the exercise. We wantyou to have a set of basic survival tools that will help you to contributeto rational decision-making, even under pressure of time. The followingpages will tell you how to make quick projections, calculate reserve levelsand contribution rates. These are shortcuts. They provide a degree offreedom from more sophisticated expertise, but be warned: they do notprovide total independence. Affirming the contrary would be sheer arroganceon our part.
1. BASIC BUDGETING TECHNIQUES
Expenditure can be projected approximately on the basis of the last observedtotal expenditure value of an expenditure item in the expenditure accounts ofa scheme using ‘‘drivers’’. Drivers are variables with a dominant influenceon the expenditure of a certain expenditure category. For example, totalexpenditure for old-age pensions in a social protection pension scheme isusually calculated as:
548

Formula 1
Et ¼ PENSt * APt ¼X100þ
x¼ 60popx;t * Prx;t * Px;t
where:E ¼ expendituret ¼ time
PENS ¼ number of pensionersAP ¼ average pension amount
pop ¼ total number of population of a certain age at a certain timex ¼ age
Pr ¼ pensioner ratio (share of pensioners in pop) at a certain age andtime
P ¼ pension amount at an individual age
The notation 100þ denotes that the summation runs up to the end of thepopulation group displayed in the population forecast.
In a mature scheme the expenditure amount can be projected by using twodrivers, namely:
(a) the rate of change of the number of people in the age group 60þ (peopleaged 60 and older), which assumes that the pensioner rate at that age groupstays constant during the projection period, and
(b) the rate of wage increase ð1þ w ¼ d1Þ or the rate of price increaseð1þ p ¼ d2Þ, which assumes that the average pension amounts areadjusted either in line with prices or in line with wages.
Formula 2
Etþ1 ¼ Et * d1;tþ1 * d2;tþ1
More drivers are possible. The essential skill lies in finding the right or aplausible driver. Projections with the help of drivers are always crudeapproximations.
Incomes of a scheme can be projected by using a similar driver technique.Usually drivers for contribution or tax income are the rate of change ofemployed population (1 þ e) and the rate of change of wages (1 þ w) orincomes. This could look as follows:
Formula 3
CItþ1 ¼ CIt * ð1þ wtþ1Þ * ð1þ etþ1Þ
but generally one would also bring the contribution rate into the equation:
549
Issue Brief 3

Formula 4
CItþ1 ¼ ABt * const * ð1þ wtþ1Þ * ð1þ etþ1Þ * p
where:AB ¼ assessment base (i.e. generally a wage up to a certain ceiling)
cons ¼ number of contributorsp ¼ contribution rate
Other types of income can be projected by the simple driver procedure usedin Formula 2.
2. CALCULATION OF BALANCES AND RESERVES
The balance of the scheme is simply the difference between income andexpenditure:
Formula 5
BALt ¼ It � Et
The reserves at the end of year tþ1 of the scheme can approximately beprojected as:
Formula 6a
REStþ1 ¼ RESt * ð1þ iÞ þ BAL0tþ1 * ð1þ i=2Þ
where: i ¼ is the interest rate and BAL0 is the approximate balance (calledprimary cash balance) that excludes interest income on the emerging balanceduring the year. This helps to avoid circular references in spreadsheetprojections. If all investment income (including that on the emerging balance)is known, as is the case when the accounting results of the year t þ 1 are alreadyknown, then the reserves are simply calculated as:
Formula 6b
REStþ1 ¼ RESt þ BALtþ1
In this case all interest income earned during year t þ 1 is contained in BAL.
3. CALCULATION OF CONTRIBUTION RATES
PAYG contribution rate or cost rate:
Formula 7
CRt ¼ ðEt �OItÞ=TABt
where: OI is other income and TAB is the total assessment base.
550
Financing social protection

A scaled premium for a certain length of a period of equilibrium witha minimum funding requirement k times last year’s expenditure at the end ofthe period t:
Formula 8
SCR½0;t�¼X
tðEt�OItÞ=ð1þiÞt
� �þk*Et=ð1þiÞt�RES0
� �.XtTABt=ð1þiÞt� �
which means that the present value of all future expenditure plus the reserverequirement (discounted to t ¼ 0) minus the initial reserve divided by thepresent value of all future total assessment bases is equal to the scaled premiumfor the years 0 to t.
The calculation of the general average premium (GAP) is equal to the abovebut without the reserve requirement and possibly the initial reserve. That meansthat the reserve requirement at the end of the period is zero. The GAP premiumcan be interpreted as an average PAYG premium over a certain period.
Reminder: Dividing an amount of expenditure or income by the t-th powerof (1 þ i) is discounting a future value back t periods. For simplicity’s sake, weassume here that all expenditure and income items are incurred in the middle ofthe year.
551
Issue Brief 3

ISSUE BRIEF 4
FINANCIAL MARKETS: ORGANIZATIONAND MAIN INSTRUMENTS
Financial markets have been classified in many ways.1 Figure IB4.1 sets outsome of the most commonly used classifications, giving a brief definition of themain classes (explanations on cross-classifications such as primary markets, forinstance, which can be debt markets or equity markets at the same time, havebeen omitted). The functioning of the markets is explained in some detailbelow (see also box IB4.1 on pages 554–555).
One way of classifying financial markets is by distinguishing primarymarkets (markets dealing with newly issued financial claims) from secondarymarkets (those exchanging previously issued financial claims). A classificationby the type of financial claim divides markets into debt markets and equitymarkets. Using the maturity of claims as the relevant criterion, one candistinguish between money markets (financial markets for short-term debtinstruments) and capital markets (for financial assets with longer maturity).Markets can also be classified by their organizational structure as auctionmarkets, over-the-counter (OTC) markets and intermediated markets. In anauction market, some form of centralized trading facility is combined withopen competitive bidding for the assets, and all trades of specified assets takeplace in the same centralized trading facility. Over-the-counter markets consistof dealers willing to buy or sell financial assets from or to any counterpart.There is no central trading facility, and investors are served one by one atseveral trading points. In intermediated markets, an entity called a financialintermediary (e.g. a bank) issues financial claims against itself. With the fundsreceived it purchases financial assets, typically in order to achieve a long-termasset/liability objective.2
The rules governing the different types of financial markets are subject tonational legislation. We will limit ourselves here to describing the broad linescommon to all markets, from which particular national regulation can of coursedeviate.
552

1. PRIMARY MARKETS
Primary markets deal with newly issued financial claims. Governments issuingdebt instruments have always been the dominant actors on these markets.In steadily growing economies where government debt is kept under controlthis is routine business.
For example, the primary market for United States Treasury bills works asfollows:3 The Treasury issues securities on an auction basis. The time intervalsbetween auctions depend on the different, fixed maturities of the securities. Short-term bills (maturity less than one year) are auctioned off weekly, with the amountsto be traded announced in advance. One-year bills are traded in the third week of
Primary Secondary Debt Equity Money Capitalmarkets markets markets markets markets markets
Dealing with Dealing with Dealing with Dealing with Dealing with Dealing withfinancial claims financial claims financial claims financial claims short-term longer maturity
that are previously issued with fixed with residual debt instruments financial assetsnewly issued rates of return rates of return
Example 1: Example 2: Example 3: Example 4: Example 5: Example 6:A company When issued the A government Same as A bank needs The governmentneeds fresh shares of the issues bonds under cash to fulfill issues very longmoney for company under in order to Examples the legal term bondsexpansion. Example1 finance public 1 & 2. minimum (e.g: 30 years).
(e.g: 10 years).
For this are being traded infrastructure reserve Company issuespurpose at the investments. requirements. gilt-edged
it issues shares. stock exchange. It borrows the debt instrumentsrequired funds
It goes "public". from a bank Pension fundswhich has =
excess reserves. typical buyers.
Auction Over-the-counter Intermediatedmarkets markets
Example 7: Example 8: Example 9:
financial assets.
Banks.
Institution (financial intermediary)issues claims against itself.
With the funds received purchases
professional money managers.
(Unlisted stocks = stocks not tradedat a stock exchange.)
Used mainly byinstitutional investors
and
third week every month.52-week bills auctioned theauctioned every Monday.
3- and 6-month US T-billsPrimary market for treasury bills.
Open bidding.
The market for unlisted stocks.in centralized facility.
markets
All trades of financial assets
Figure IB4.1 Synopsis of financial market classifications
553
Issue Brief 4

Box IB4.1 Debt instruments and equity claims
The claim of a holder of a financial asset may be either a fixed currencyamount or a varying, residual amount. In the former case, the financialasset is called a debt instrument.
Examples of debt instruments are:
. A loan by a commercial bank (investor) to an individual (issuer) topurchase a truck. The individual offers the following contract to thebank: I earn income by running the truck in a specified business andpay back the loan plus the interest on that loan in constantinstalments; the bank receives a constant income from the investment;in principle, such contracts are open to be traded in financial markets,but usually they are not.
. A treasury bond issued by a government (or, in general, by a publicinstitution) and bought by a pension fund (investor). The governmentis offering the following contract: I transfer the treasury bond to thepension fund in return for payment by the pension fund of a certaincurrency amount. I promise to pay back the full currency amount,stipulated on the bond, at a fixed date in future plus in-between, atregular intervals, a certain amount of interest (again stipulated on thebond); treasury bonds are typical papers traded in financial markets(bond markets).
. A long-term (10 years) corporate bond issued by a big firm in orderto finance business expansion and bought by a private bank(investor). The contract offered by the corporation to the bank issimilar to the one in the previous example (government / pensionfund). As such long-term bonds imply a long-term promise ofserving the bond in future and also influence the money market,their issuers are normally subject to close inspection and anapproval procedure by the central bank before issuance. Ifapproved, such bonds are considered ‘‘gilt-edged’’.
A residual or equity claim obligates the issuer of the financial assetto pay the holder an amount based on earnings (profits), if any, or onother grounds, after holders of debt instruments (of the same issuer) havebeen paid.
Examples of equity claims are:
. Common stock of Siemens or General Motors. The company (issuer)promises to pay to the holder of the equity (share) an unspecifiedamount relative to the nominal value of the share issued (dividend) incase of sufficient earnings (profits). Besides being debt instruments,shares usually carry with them a voting right for the asset holder,allowing her or him to influence the issuer’s business policy (includingthe amount of dividends paid per share). Common stock shares areusually traded on the stock markets.
554
Financing social protection

every month (announcement the preceding Friday). Furthermore, the Treasuryoffers securities with maturities of two, three, five, seven, ten and 30 years.
Participants in the auction are the government (offering a certain amount, a‘‘tender’’), competitive and non-competitive bidders, and the central bank.According to American tender rules, at the closing of a tender any share boughtby the central bank is deducted first. Non-competitive bidders are restricted to adefined maximum part of the tender4 and, after the auction is finished, pay theaverage yield achieved in the competitive bid. The remainder is allocated tothe competitive bidders in descending order of their bids. This means that thebidder ready to pay the highest price is served first (at the offered price), thenthe one with the second highest price (at that price), and so on. Alternatively,countries apply the so-called ‘‘Dutch tender’’, where all bidders finally pay thelowest price accepted by the issuer during the auction.5
Table IB4.1 shows the months during which longer-term United StatesTreasury securities are issued.
Other entities acting on the primary market are enterprises. They offershort-term and long-term debt instruments and additional shares. Papers withless than one year of maturity are often called ‘‘commercial papers’’, thosewith longer maturity ‘‘corporate bonds’’, and additional shares ‘‘seasonedstock’’.
In recent years, primary markets have attracted special attention on theoccasion of major privatization moves of former government-owned entitiesand of private firms issuing stocks. There are two types of primary marketissues of common stock. Initial public offerings (IPOs) are stocks issued by acompany selling stock to the public for the first time. Before issuance,ownership of the firm may be state or private – and this may be, in principle, thecase again after issuance. In the case of stock companies, ownership very muchdepends on the control rights associated with the share of total capital held.Seasoned new issues are offered by companies that already have floated equity.For example, a sale by DaimlerChrysler of new shares of stock would be calleda seasoned new issue.
The primary market organizes IPOs and seasoned issues. Newlyissued financial claims are most often distributed through banks acting as
. A partnership-share in a business. An individual having an excess ofcash (savings) is invited by the owner of a private business to investthose savings in the company. In return the business owner promisesto let the individual participate in the profits according to her/his sharein the business. Such private (‘‘bilateral’’) arrangements are normallynot traded on the financial markets.
Box IB4.1 (cont’d)
555
Issue Brief 4

lead managers. Examples of successful privatization by means of IPOsinclude:6
1. In the United States, the privatization in March 1987 of government-ownedrailroad company Conrail. More than 58 million shares were sold, raising atotal of US$1.65 billion.
2. British Telecom in the United Kingdom (amount raised: US$4.7billion).
3. In Germany, Deutsche Telekom AG in 1996 (amount raised: DM20 billion);privatization of the part of Deutsche Lufthansa AG still held by thegovernment in 1997 (DM4.7 billion raised) and Deutsche Post AG in 2000(market value at issue: e5.8 billion).
As shown in table IB4.2, the number of IPOs rose considerably in WesternEurope in 1997 and 1998.
Apart from the issuance of claims managed by market intermediaries, bondissuance and trade in equity occurs also on non-organized markets directlybetween business partners or on grounds of personal relation. Trade on non-organized markets is often preferred to the general market for their morereliable long-term commitment. Since the related financial flows would not bechannelled through the formal markets, these investment opportunities rarelyopen up to institutional investors like pension funds. This is of somesignificance as some observers argue that privately distributed issues maytend to represent the more profitable investments.
Table IB4.1 Treasury coupon securities auctioned by month
Month Number of years to maturity
2 3 5 7 10 30
January • •February • • • • •March • • •April • •May • • • • •June • • •July • •August • • • • •September • • •October • •November • • • • •December • • •
• Auctioned in month indicated.
556
Financing social protection

2. SECONDARY MARKETS
Secondary markets deal with previously issued financial claims (stocks,bonds). Broadly speaking, it is there that investors express their opinion aboutthe economic prospects of companies by determining the prices at which tradestake place.7,8
Usually, secondary markets are formal organizations, such as for instancea stock exchange (New York Stock Exchange, London Stock Exchange,Deutsche Borse Group Frankfurt, and so on – see table IB4.3). An exchangeprovides a facility for its members to trade stocks, and only members ofthe exchange may trade there. This explains why memberships (seats) on theexchange are themselves valuable assets.9 Stocks traded on an exchange aresaid to be listed stocks. To be listed, a company must apply and satisfy certainminimum requirements relating to the number of years of the company’sexistence, the face value of shares, the expected share capitalization, thenumber of shares distributed or the number of shareholders to buy the stocks,respectively.10 Moreover, a prospectus giving full financial details and statingthe current ownership and liability situation has to be issued. Alternatively,rules with respect to the listing may originate from legislation, which, forexample, may set minimum standards with respect to the legal status of acompany before it is allowed to go ‘‘public’’.
A major advantage of formal markets lies in low transaction costs, achievedthrough a high degree of standardization of trading. Some argue that thesemarkets are close to ‘‘perfect markets’’. A market is said to be perfect when thenumber of buyers and sellers is sufficiently large, and all participants are smallenough relative to the market so that no individual agent can influence the assetprice.11 Moreover, thanks to direct OTC transactions at an exchange, trade canbe executed without any time lag. However, ‘‘frictions’’ (costs interfering withthe supply and demand of goods and services) are often present on these
Table IB4.2 Initial public offerings (IPOs) in continental Western Europe,1997–98
Country 1997 1998
Belgium 13 18
France 82 226
Germany 24 1531)
Italy 13 21
Netherlands 15 22
Spain 78 184
Switzerland 13 17
1) relates to the year 2000.
Source: Deutsche Borse AG, as quoted in von Hagen and von Stein (eds.) (2000), pp. 959, 963.
557
Issue Brief 4

markets as well. The extent to which such frictions exist is an importantindicator when analysing the performance of stock exchanges in relation totheir competitors. One way of estimating the costs associated with frictions is tocompare the prices of identical assets traded on different markets.
Many formal secondary markets around the world have undergonesignificant changes over recent decades; one of the most striking is theirinstitutionalization – that is, a shift away from traditional small investors tolarge institutional ones. At the same time, so it is assumed, the speed of tradingand stock turnover have increased. At the New York Stock Exchange, forexample, institutional investors nowadays account for most of the trading byfar. Greater implementation of funded pension schemes around the world wouldstrengthen this trend even more.
3. DEBT MARKETS
Debt markets deal with instruments that obligate the debtor to make acontractually fixed series of payments, generally in nominal currency, up tosome terminal date called the ‘‘maturity date’’, when the initial lending sum ispaid back. For the holder of such instruments the income derived can normallybe regarded as safe.
The traded assets include money market and capital market instruments,such as:
. Treasury bills and securities
. Commercial paper
. Medium- and long-term corporate bonds
. Bankers acceptances
. Short- and long-term federal agency securities
. Short- and long-term municipal obligations
. Certificates of deposit
. Repurchase agreements
. Floating-rate instruments
. Federal funds
In industrialized countries, debt instrument12 markets are highly diversifiedand developed, whereas in developing and transition countries they exist only ina rudimentary form.13 These markets are usually dominated by state-issuedinstruments which are normally regarded as safe. Government (‘‘treasury’’)securities are backed by the full faith and credit of the governments issuingthem. This is why social protection reserves are often invested in government-issued financial assets.
558
Financing social protection

Table IB4.3 List of stock exchanges worldwide, 20011
Africa (7) Europe – East (14)
Botswana Stock Exchange Bratislava Stock Exchange
Cairo Stock Exchange Budapest Stock Exchange
Ghana Stock Exchange Lithuania Stock Exchange
Johannesburg Stock Exchange Ljubljana Stock Exchange
Nairobi Stock Exchange Macedonian Stock Exchange
Namibian Stock Exchange Prague Stock Exchange
South African Futures Exchange Riga Stock Exchange
Russian Securities Market
Asia (24) Russian Stock Exchange
Bombay Stock Exchange Slovakia Stock Exchange
Colombo Stock Exchange St. Petersburg Futures Exchange
Hong Kong Futures Exchange Tallinn Stock Exchange
Hong Kong Stock Exchange Warsaw Stock Exchange
India National Stock Exchange Zagreb
Jakarta Stock Exchange
Kansai Commodities Exchange Europe – West (40)
Karachi Stock Exchange Amsterdam Exchanges
Korea Stock Exchange Athens Stock Exchange
Kuala Lumpur Stock Exchange Barcelona Stock Exchange
Mongolian Stock Exchange Belgian Futures and Options Exchange
Osaka Securities Exchange Berlin Stock Exchange
Philippine Stock Exchange Borsaitalia
Shanghai Stock Exchange Bremen Stock Exchange
Shenzhen Stock Exchange Brussels Stock Exchange
Siberian Stock Exchange Copenhagen Stock Exchange
Singapore Commodity Exchange Dusseldorf
Singapore Monetary Exchange Easdaq (Belgium)
Singapore Stock Exchange EUREX (Switzerland)
Taiwan Stock Exchange EURO-NM
Stock Exchange of Thailand Finnish Options Market
Tokyo Grain Exchange Finnish Option Exchange
Tokyo International Financial Futures Exchange Frankfurt Stock Exchange
Tokyo Stock Exchange Geneva Stock Exchange
Hamburg Stock Exchange
Canada (4) Hanover Stock Exchange
Montreal Exchange Helsinki Stock Exchange
Toronto Stock Exchange International Petroleum Exchange
Vancouver Stock Exchange Irish Stock Exchange
Winnipeg Commodity Exchange Lisbon and Oporto Exchange
London International Financial and Futures
Caribbean (3) Exchange (LIFFE)
Bermuda Stock Exchange London Metal Exchange
Cayman Stock Exchange London Securities and Derivatives Exchange
Jamaica Stock Exchange London Stock Exchange
559
Issue Brief 4

4. EQUITY MARKETS
Equities (‘‘common stock’’) represent an ownership interest (or ‘‘share’’) in acorporation. Holders of such stock, called ‘‘stockholders’’ (or ‘‘shareholders’’),are entitled to the earnings of the corporation when those earnings aredistributed in the form of dividends. Shareholders’ claims to the operatingsurplus are served after interest on bonds and tax has been paid. In case sharesare sold, windfall profits may materialize if the selling price exceeds the priceinitially paid. Equity holdings also entitle the holder to a pro rata share of the
Table IB4.3 (cont’d)
Europe – West (40) (continued) United States of America (17) (continued)
Luxembourg Stock Exchange Boston Stock Exchange
Madrid Stock Exchange Chicago Board of Trade
Mailand Stock Exchange Chicago Board Options Exchange
Munchen Stock Exchange Chicago Mercantile Exchange
Nouveau Marche (France) Chicago Stock Exchange
Oslo Stock Exchange Coffee, Sugar & Cocoa Exchange
Paris Bourse Iowa Electronic Markets
Paris Matif Kansas City Board of Trade
Spanish Financial Futures and Options Exchange Mid American Commodity Exchange
Stockholm Stock Exchange Minneapolis Grain Exchange
Stuttgart Stock Exchange Nasdaq
Wien Stock Exchange New York Cotton Exchange
Zurich Stock Exchange New York Mercantile Exchange
New York Stock Exchange
Near East (5) Philadelphia Stock Exchange
Amman Financial Market
Beirut Stock Exchange South America (12)
Istanbul Stock Exchange Bolivia Stock Exchange
Tehran Stock Exchange Bolsa de Mercadorias & Futuros Sao Paulo
Tel Aviv Stock Exchange Bolsa de Valores de Sao Paulo
Bolsa Electronica de Chile
Oceania (3) Buenos Aires Stock Exchange
Australian Stock Exchange Bolsa de Bogota
New Zealand Stock Exchange Mexico Stock Exchange
Sydney Futures Exchange Nicaragua Stock Exchange
Peru Stock Exchange
United States of America (17) Rio de Janeiro Stock Exchange
American Stock Exchange Santiago de Chile
Arizona Stock Exchange Venezuela Stock Exchange
1Internet links to all markets via http://www.boerse.de/. The above list is not intended to be exhaustive.
560
Financing social protection

remaining equity in the event of liquidation of the corporation that issued theshare.14 However, these entitlements are residual. This means that stockholdersare the last in line to be paid after all other claimants (tax office, employees,suppliers, bondholders) who have a claim on the assets and income of thecorporation.15 At the same time, holders of equity are not personally liable forthe firm’s obligations; the most they can lose in the event of liquidation of thecompany is their initial investment.
5. MONEY MARKETS
Money markets deal with debt instruments that at the time of issuance have amaximum maturity of one year. These relatively short-term facilities aresubsumed under the item ‘‘money’’ as they fulfil the functions of money, forexample as a means of payment. Debt certificates figure in one of the extendedmoney stock definitions M3 or M4 of central banks, which in turn were fixed –to some extent arbitrarily – to certain withdrawal conditions and maturityperiods (see box IB4.2). Moreover, if the money market is liquid – that is, ifholders of short-term debt instruments are able to sell their assets at any time(which in OECD countries is usually the case), these instruments can easily beexchanged against cash supply.
Box IB4.2 Money stocks
Central banks define different money aggregates to measure the moneysupply to the economy and as a target for their monetary policies. Theactual inclusion of certain assets varies between the respective centralbanks’ measures, and is subject to adjustment to take account of newfinancial instruments or their different use. The commonly defined moneystocks M1 to M3 comprise the most to increasingly less liquid assetsalong the following lines:
M1: currency (coins and banknotes in use by the public), demanddeposits and other checkable deposits, traveller’s checks
M2: M1 plus short-term savings accounts, small-denomination deposits,money market mutual fund shares (non-institutional)
M3: M2 plus large-denomination time deposits, term repurchase agree-ments, credit lines, money market mutual fund shares (institu-tional), term Eurodollar.
561
Issue Brief 4

6. CAPITAL MARKETS
Capital markets deal with debt instruments that at the time of issuance have amaturity of at least one year, and trade in equity. Equity is normally subsumedunder this market categorization despite the fact that many observers regardshort-termism rather as an attribute of shares, especially in speculative phases ofthe stock markets. The reason is that equity has no specified maturity date – thatis, the only possibility that equity (in terms of common stock) may ‘‘disappear’’from the market is the liquidation of a company.
The conditions and development of capital markets are of special interestfor funded pension schemes with a long-term investment orientation.
Notes
1 See, for example, Fabozzi and Modigliani (1992); Bodie et al. (1996); von Hagen and von Stein(eds.) (2000).
2 In countries with a ‘‘specialized banking system’’ (e.g. United States) investment banks areallowed to acquire equity share capital whereas commercial banks are not. In countries with a ‘‘universalbanking system’’ (e.g. Germany) all banks may buy shares. Some of the reasons for such differencesbetween specialized and universal banking systems reside in differing traditions and philosophiesconcerning the exercise of control rights associated with the holding of equity.
3 For further details see Fabozzi and Modigliani (1992), pp. 415-422.4 For example, the government may offer a tender of US$10 billion, of which the non-competitive
bidders may take a maximum share of US$1 billion.5 von Hagen and von Stein (eds.) (2000), p. 948.6 Examples taken from Fabozzi and Modigliani (1992), pp. 67, 68; von Hagen and von Stein (eds.)
(2000), p. 958.7 See Fabozzi and Modigliani (1992), p. 225.8 Yet, these opinions are not immediately translated into direct consequences for the issuing
business, as the face value of the bond or equity is already cashed in. The market standing of thecompany is taken into account in transactions to follow.
9 For seat prices at the NYSE, see Bodie et al. (1996), p. 82.10 Details for NYSE, London Stock Exchange and Deutsche Borse Group Frankfurt can be found at
http://www.nyse.com/, http://www.stockex.co.uk/ and http://www.boerse.de/ respectively.11 Electronic trading has added a new quality to the notion of perfect market as it allows more,
potentially small, investors to enter the market and ensures market transactions without time lag.12 For a detailed discussion of these instruments, see Fabozzi and Modigliani (1992), passim.13 See Del Valle Borraez et al. (1998).14 Fabozzi and Modigliani (1992), p. 224.15 Bodie et al. (1996), p. 57.
562
Financing social protection

EXERCISE ANNEX
DEMOLAND: A COMPENDIUM OFPRACTICAL EXERCISES
Demoland is a data set that represents the demographic make-up, economy andsocial sector of a hypothetical country. For the purpose of our exercises somereal-country data have been borrowed (without naming names); other data arepurely fictional but were needed in order to create a complete country case. TheDemoland data set may be consulted on the ILO website or obtained in the formof a CD from ILO FACTS.
General information
Demoland is a low-income country in southern Africa. It ranks ninety-second inthe world in GDP purchasing power parity (US$5,400, whereas the worldaverage was US$6,490 in 1999). Life expectancy is 47 years for men and 49 forwomen (17 and 20 years lower, respectively, than the world averages). A fewyears ago, before the AIDS pandemic hit the country, these values were 61 and65; the decline is dramatic.
Demoland emerged from colonial dependence fairly recently. It is currently afunctioning democracy but its parliament and government are still dominated byone major party, the successor of the former freedom-fighter movement. TheCabinet is composed of highly qualified experts, variously trained in the country, inSouth Africa or, inevitably, at Harvard. You will be dealing with the Minister ofLabour and Social Affairs (a former trade unionist with a Maastricht degree ininternational economics, who has been hardened by innumerable wagenegotiations); the Minister of Finance (who was brought home from the IMF,where she was starting a big career as the first African woman in a tough world) andthe Minister of Health (a nurse with a Harvard degree in public health, who sawmany people die in the war of independence). They are all icons of the nationalresistance movement. They are politicians but they are also number-literate.
563

Social protection information
With considerable support from the ILO, Demoland introduced its first socialsecurity law in 1990. Social insurance now provides benefits in case ofmaternity and sickness. Survivors’, disability and old-age benefits are paid onlyto public sector workers. Various private or occupational pension schemesoperate in the formal sector. Social security provisions are complemented bybenefits under the Workmen’s Compensation Fund, which is financed byemployers and provides benefits in case of occupational injuries and diseases.The Social Insurance Fund has registered about 200,000 workers, of whomroughly 75 per cent contribute to the scheme on a regular basis. The labourforce numbers some 682,000, of whom 450,000 are actually employed. Ifimmediate dependants are included as possible beneficiaries, it can be assumedthat the scheme covers some 50 per cent of the country’s total population ofabout 1.8 million. That leaves the other half of the population uncovered andwithout access to even basic social protection in case of poverty, old age,disability, sickness and maternity.
Health services are operated by the Ministry of Health and financed fromgeneral revenue. Like many other public services, the health care system – inparticular rural health stations and hospitals – suffers from chronic under-funding and hence cannot provide adequate quality of care. The Ministry ofHealth struggles with permanent budget shortfalls, and a considerable propor-tion of national health expenditure is already financed by out-of-pocket payments.Only public sector workers are covered by a social insurance health scheme.
It was estimated in the mid-1990s that about 30 per cent of the populationwas living below the poverty line, and unemployment is estimated to havereached a level of 30–40 per cent of the workforce, depending on the definition.National social assistance benefits that could be extended to all the poor cannotbe financed from the government budget (says the Minister of Finance).
Economic and fiscal policy
Real GDP growth has been somewhat erratic in recent years, oscillating between 3and 8 per cent. Long-term expectations are in the order of 3–4 per cent. While mostof GDP growth in the recent past has been absorbed by population growth, theMinistry of Finance expects a long-term real per capita growth of about 2 per cent.Not unlike the South African government, the government of Demoland iswalking on a tightrope. It is maintaining a strict fiscal policy and a deficit of 3–4per cent of GDP. Attracting foreign direct investment is the cornerstone of itseconomic policy since the potential for increasing domestic savings as a source offurther investment funding appears very limited.
The government is trying to maintain relative price stability by variousmeans, including an alliance with the trade union (most of whose membersbelong to the governing party) that would keep wage increases at the rate of
564
Financing social protection

marginal productivity, although it had to make some concessions with respectto the minimum wage and minimum early-retirement benefits for veterans ofthe independence movement. It is attempting to contain the demand for landredistribution and the redistribution of other productive assets by its own partymembers, but is seeking to achieve at least some redistribution through socialsecurity for all.
Your role in Demoland
Life in big bureaucracies is (or should be) full of decisions. Decisions areresearched by technicians and generally taken by managers or politicians. Thesepeople need concise bases for their decisions. Lengthy papers and essays belongto the academic world. No minister will want to read a 300-page thesis afterasking you: ‘‘Should we introduce a funded pension scheme as recommendedby Mr. Holzmann of the World Bank?’’ or ‘‘Can we afford a universal pensionscheme?’’ What he or she wants is a five-page list of pros and cons, suggestedsolutions to the problem and essential figures. Accordingly, technicians inministries and/or major institutions write minutes, memoranda, briefing notes orwhatever the vehicle is called in the particular national context; we will callthem technical memoranda (TMs).
Writing succinct TMs is an art which most technical advisers unfortunatelydo not master, since they have all been trained to write theses or papers full oftechnical intelligence and footnotes. Only a few of them know how to commu-nicate with people who do not have the time to digest all the technical detailsbut need to know the broad outline around which they can develop their policies.
As you may discover, TMs are also an excellent tool for transferring andstoring essential knowledge. A typical TM should have the following structure:
(1) Background and issues involved
(2) Alternative solutions
(3a) Pros and cons, and/or
(3b) Model calculations
. Assumptions and caveats
. Methodology (summary)
. Results
(4) Recommendations
Your knowledge base
Statistical information on Demoland is available on the ILO website at thefollowing address: http://www.ilo.org/public/english/protection/socfas/publ/listpubl.htm. You may download the Excel files in order to familiarize yourself
565
Exercise Annex

with Demoland and to put your knowledge into practice doing the tasksdescribed below. The model solutions that accompany the tasks are based onactual solutions proposed by students of the 2002–2003 class of the joint ILO/Maastricht University Masters programme in Social Protection Financing; theywere all checked and revised by Ms. Christina Behrendt of ILO FACTS. Youcan also take the exercise one step further and try to find your own solutions tothe problems presented.
TASK NO. 1 PROJECTING SOCIAL EXPENDITURE IN
DEMOLAND
(Based on issues covered in Chapter 2)
You are the financial analyst at the Ministry of Labour and Social Affairs.The Minister is leaving for a major donor conference in Washington, DC.He wants to make the case that Demoland needs more foreign aid for thesocial sector. Knowing that in these meetings figures speak louder thanwords, he wants you to undertake urgently a ten-year projection for theoverall social expenditure broken down into its main categories, namelyhealth, pensions, short-term benefits and social assistance. Find an easy wayto achieve rapid benchmark projections for the expenditure and its finan-cing during a ten-year period. Explain the methodology and your assump-tions and write a TM to the Minister. You might wish to use the frameprovided in the Demoland files, but you have to find a simpler projectiontechnique.
MODEL SOLUTION
MEMORANDUM
From: YOUTo: Minister of Labour and Social AffairsSubject: Projecting social expenditure in Demoland
Background and issues involved
The Minister of Labour and Social Affairs is leaving for a major conference inthe United States where he has to convince the donor community that hiscountry needs more foreign aid for the social sector. This TM has been preparedwith a view to assisting the minister in making his case to the donors. Itcontains figures of projected expenditure and revenue for Demoland for thenext ten years.
566
Financing social protection

Methodology
Projections have been carried out in order to establish the development of theincome and expenditure pattern of the welfare sector of Demoland for the nextten years. The results are shown in tables T1.1 and T1.2.
Owing to time constraints a simplified methodology had to be used. Inmaking benchmark projections ‘‘drivers’’ need to be used. These are indicatorsor variables that have a direct impact on certain expenditure categories.Expenditure in these categories is expected to develop as a linear function ofthe drivers. In the projections, the increase in the consumer price index, forexample – one of the most important drivers of nominal expenditure – has beenassumed to remain constant over the ten-year period (at 10 per cent annually).Population growth has been assumed to be 1.5 per cent and constant for the nextten years, whereas GDP has been assumed to be growing at a constant rate of 11.4per cent in nominal terms. A real interest rate of 2 per cent has been assumed.These and other assumptions, as well as the main drivers for the projections areshown in table T1.3. All three tables may be found at the end of this memorandum.
Conclusions and recommendation
According to the projections and on the basis of arguably prudent assumptions,social expenditure in Demoland (measured as a percentage of GDP) willincrease by about 70 per cent over the next ten years. This is an exceptionallyfast increase by all historical standards despite assumptions for rather robustgrowth rates. If we cannot increase the share of out-of-pocket outlays in overallfinancing and the share of social insurance contributions, we will be facing anincrease of around 135 per cent in relative terms (i.e. about 5.69 percentagepoints of GDP) in the share represented by the budget in overall socialprotection financing. This is almost exactly a 19-per cent increase of ouralready high overall tax (and contribution) ratio. There is little chance ofimplementing that. A close look at the projections reveals that virtually all ofthe expenditure increase stems from higher health spending, attributable aboveall to the estimated effects of HIV/AIDS. We might be able to contain thatexpenditure more successfully, but then we would require resources for up-frontinvestment in a major campaign aimed at raising awareness and bringing aboutbehavioural change. We could also shift some health financing from taxes to anextended social insurance. However, that change also requires some up-frontinvestment. We are not likely to obtain the necessary resources from theMinistry of Finance.
Therefore, without external support we will not be able to balance the socialbudget in the next ten years. It is thus suggested to request donor support forinvestments in cost-reducing and cost-shifting strategies. It is unlikely that wewill receive pledges for straight budgetary support as more and more donors aresensitive about the long-term sustainability of foreign aid.
567
Exercise Annex

Table T1.1 Demoland’s Social Budget (in million CU): Functional summary, 2000–10
Expenditure and revenues 2000 2001 2002 2003 2004 2005 2006 2007 2008 2009 2010
Expenditure
1. Pensions and administrativeexpenditure of Pension Fund
203 239 284 330 384 448 521 601 695 804 933
of which: Old-age 142 162 188 211 238 268 301 334 370 411 456
Invalidity 5 6 8 10 12 15 18 22 27 33 40
Survivors 55 69 88 108 133 163 200 243 295 358 435
Retirement grants 0 0 0 0 0 0 0 0 0 0 0
Funeral benefits forpensioners
1 1 1 1 1 1 1 1 2 2 2
2. Health 1 457 1 767 2 139 2 587 3 125 3 772 4 550 5 488 6 618 7 983 9 632
3. Short-term benefits 36 42 50 56 64 74 84 94 106 119 134
4. Social assistance 299 341 391 441 497 560 630 704 787 879 983
5. Transfers to reserves 241 100 119 129 139 150 160 165 167 165 157
Total social expenditure 2 236 2 488 2 982 3 543 4 210 5 004 5 945 7 052 8 373 9 951 11 840
568
Fin
an
cin
gso
cia
lp
rote
ctio
n

Revenues
Total revenues 2 236 2 488 2 982 3 543 4 210 5 004 5 945 7 052 8 373 9 951 11 840
1. Social security contributions 435 506 602 685 782 894 1017 1 144 1 287 1 448 1 629
Pension insurance 264 307 365 415 474 542 616 694 780 878 987
Health insurance 138 161 191 217 248 283 322 363 408 459 516
Short-term benefits 33 39 46 52 60 68 78 88 99 111 125
2. Private financing 595 693 823 937 1 070 1 223 1 391 1 565 1 761 1 981 2 228
3. Investment income(pension, health,short-term benefit)
174 224 250 279 310 346 385 429 478 533 594
4. Other income (pension,health, short-term benefit,including transfers fromreserves)
14 16 17 19 21 23 25 28 31 34 37
Income from general revenues 1 018 1 049 1 290 1 623 2 027 2 519 3 126 3 886 4 816 5 956 7 352
In % of total revenues 46 42 43 46 48 50 53 55 58 60 62
Source: ILO calculations.
569
Exerc
ise
An
nex

Table T1.2 Demoland’s Social Budget (in % of GDP): Functional summary, 2000–10
Expenditure and revenues 2000 2001 2002 2003 2004 2005 2006 2007 2008 2009 2010
Expenditure
1. Pensions and administrative expensesof Pension Fund
0.84 0.87 0.90 0.93 0.97 1.00 1.05 1.09 1.14 1.20 1.26
of which: Old-age 0.59 0.59 0.59 0.60 0.60 0.60 0.60 0.61 0.61 0.61 0.62
Invalidity 0.02 0.02 0.03 0.03 0.03 0.03 0.04 0.04 0.04 0.05 0.05
Survivors’ 0.23 0.25 0.28 0.30 0.33 0.37 0.40 0.44 0.49 0.53 0.59
Retirement grants 0.00 0.00 0.00 0.00 0.00 0.00 0.00 0.00 0.00 0.00 0.00
Funeral benefits for pensioners 0.00 0.00 0.00 0.00 0.00 0.00 0.00 0.00 0.00 0.00 0.00
2. Health 6.03 6.43 6.76 7.31 7.86 8.46 9.14 9.98 10.89 11.89 12.98
3. Short-term benefits 0.15 0.15 0.16 0.16 0.16 0.16 0.17 0.17 0.17 0.18 0.18
4. Social assistance 1.24 1.24 1.23 1.24 1.25 1.26 1.26 1.28 1.29 1.31 1.33
5. Transfers to reserves 1.00 0.37 0.37 0.36 0.35 0.34 0.32 0.30 0.27 0.25 0.21
Total social expenditure 9.26 9.05 9.42 10.01 10.59 11.22 11.94 12.82 13.78 14.82 15.96
Revenues
Total revenues 9.26 9.05 9.42 10.01 10.59 11.22 11.94 12.82 13.78 14.82 15.96
Social security contributions 1.80 1.84 1.90 1.93 1.97 2.00 2.04 2.08 2.12 2.16 2.20
Pension insurance 1.09 1.12 1.15 1.17 1.19 1.21 1.24 1.26 1.28 1.31 1.33
Health insurance 0.57 0.58 0.60 0.61 0.62 0.64 0.65 0.66 0.67 0.68 0.70
Short-term benefits 0.14 0.14 0.15 0.15 0.15 0.15 0.16 0.16 0.16 0.17 0.17
0.00 0.00 0.00 0.00 0.00 0.00 0.00 0.00 0.00 0.00 0.00
Private financing 2.46 2.52 2.60 2.65 2.69 2.74 2.79 2.84 2.90 2.95 3.00
Investment income (pension,health, short-term benefit)
0.72 0.82 0.79 0.79 0.78 0.78 0.77 0.78 0.79 0.79 0.80
Other income (pension, health,short-term benefit)
0.06 0.06 0.05 0.05 0.05 0.05 0.05 0.05 0.05 0.05 0.05
Income from general revenues 4.22 3.82 4.08 4.58 5.10 5.65 6.28 7.06 7.92 8.87 9.91
Source: ILO calculations.
570
Fin
an
cin
gso
cia
lp
rote
ctio
n

Table T1.3 List of drivers for expenditure and revenues
Expenditureand revenues
Drivers Assumptions(exact annual datewhere applicablefrom Demoland file)
Expenditure
(a) Old-agepension
(a) wages (a) on averagenominally +11.7% p.a.
(b) change (in %) inpopulation age 60 and above
(b) on average +0.6% p.a.
(b) Invalidity (a) wages (a) on averagenominally +11.7% p.a.
(b) increased rate of invalidityoccurrence due to HIV/AIDS
(b) on average +10% p.a.
(c) increase in employment (c) on average 2.1% p.a.
(c) Survivors (a) same overall increases asinvalidity since assumed thatmost of the increase stemsfrom death of actives(mostly due to AIDS)
See above
(d) Retirement grant (a) consumer price index (a) on average +10% p.a.
(b) withdrawal rate of actives (b) 0.2% of employedpopulation
(c) increase in employment (c) on average +2.1% p.a.
Short-term pension fund
(a) Funeral benefitsfor pensioners
(a) rate of growth of retiredpopulation
(a) on average +0.6% p.a.
(b) consumer price index (b) on average +10% p.a.
Health (a) population growth (a) on average +1.5%p.a.
(b) annual additional rise inutilization due to HIV/ AIDS
(b) on average +5% p.a.
(c) additional medical inflation (c) on average +3% p.a.
Short-term benefits (a) rate of employment increase (a) on average +2.1% p.a.
(b) rate of growth of wages (b) on averagenominally 11.7% p.a.
Social assistance
Poverty relief (a) population growth (a) on average 1.5% p.a.
(b) consumer price index (b) on average +10% p.a.
(c) reduced by half the GDPgrowth (elasticity assumption)
(c) on average �0.8% p.a.
Revenues
Social insurancecontributions
(a) wage increase (a) on averagenominally +11.7% p.a.
(b) increase in public sectoremployment
(b) increase in public sectoremployment = overallincrease of employment
571
Exercise Annex

Table T1.3 (cont’d)
Expenditureand revenues
Drivers Assumptions(exact annual datewhere applicablefrom Demoland file)
Private financing Same as contributions Same as contributions
Investment income Rough calculation of overall reservesbased on surplus in social insuranceand interest rate assumptions
Interest rate = 11.4%
Other income Constant in real terms CPI assumption:on average +10% p.a.
Income from generalrevenue
Residual
p.a. = per annum
572
Financing social protection

TASK NO. 2 THE WELFARE STATE DEBATE
IN DEMOLAND
(Based on issues covered in Chapter 3)
Even though you have just prepared some benchmark projections for the futuresize of the welfare state, the Minister is still worried that the benefits introducedand immature today may be too much of a burden for the economy in the long run.During a Commonwealth meeting of labour ministers in London he heard from hiscolleagues that European countries and other OECD countries are apparentlytrying to curb the size of the welfare state. A welfare state that is ‘‘too big’’ appearsto have negative effects on the economy. Does the Minister have reason to worry(even if it may be a distant worry for a minister in a developing country)? Write aconcise briefing note in the form of a TM explaining the potential positive andnegative effects of the welfare state on economic performance (i) in principle, and(ii) with specific reference to Demoland.
MODEL SOLUTION
MEMORANDUM
From: YOUTo: Minister of Labour and Social AffairsSubject: The welfare state debate in Demoland
Background and issues involved
Social expenditure in Demoland will rise over the next decades. This is anatural maturation process in any young social protection system. However,many analysts already view the present size of the welfare state in industrializedcountries with concern, and many nations are curbing its growth. For Demolandthis could mean that benefits that are immature today may pose too much of aburden for the economy in the long run and would have to be curbed at highpolitical cost at some later time. The question is whether the Ministry shouldtake pre-emptive action.
The welfare state debate (in principle)
The present state of empirical research does not lend unambiguous support tothe view that a large welfare state has a negative effect on the economy, but itdoes not point to a clear positive relationship, either. Although some studiesshow a correlation between social expenditure and economic growth, thecausality is difficult to establish.
573
Exercise Annex

What really matters for successful economic performance is not the level ofsocial expenditure, but rather the relationship between the social protectionsystem (that is, the welfare state) and the institutional and political frameworkof the country. A stable and non-conflictual relationship, assisted by sound macro-economic policies, can be expected to result in good economic performance.
Arguments concerning the relationship between
the welfare state and the economy
In principle, welfare states complement the market by providing individualswith the income and care security that markets do not automatically provide.The main arguments for the welfare state’s positive effects on the economyfocus on equity concerns. The simple traditional theory of a trade-off betweenefficiency and equity is refuted by the endogenous theory of growth, whichstates that investment in human capital (education, training) leads to higherproductivity growth.
Supporters of residual welfare states (maintained solely to cover marketfailures and provide people with minimum subsistence) claim that the provisionof income and care security will inevitably impair efficiency, negatively affectingthe economy as a whole. Their main arguments relate to behavioural or incentiveproblems, whether in the provision of specific benefits (e.g. the negative effect ofunemployment benefits on incentives to participate in the labour market), in themanagement of public insurance schemes (e.g. low interest in applying measuresto avoid moral hazard) or in public management (e.g. a low propensity to reduceadministrative costs). It appears that at least some of these problems can beovercome by intelligent institutional design. In this context it should be noted thatsimply farming out the management of benefits to the private sector is unlikely toconstitute a universal solution to microeconomic behavioural problems. Theprivate sector may also suffer from inadequate incentive structures.
Table T2.1 summarizes the main arguments explaining the potential effectsof the welfare state on the economy, together with our own tentative judgement.
In this context, the interrelationship between the welfare state and thelabour market has received the most attention. The major criticism targets thedisincentives to participate in the labour market created by public transfers. It isoften claimed that people can become dependent on the system, with aconsequential rise in long-term unemployment. However, a variety of measurescan be taken to increase people’s readiness to take on new jobs or additionaltraining. Benefits could be tied to certain forms of publicly sponsoredemployment – although this step might be resisted by unions fearing theundermining of the country’s wage structure. In such cases, the potentialbeneficial effects of such measures on overall economic performance shouldtake precedence over group interests.
574
Financing social protection

Table T2.1 Main economic arguments for and against extensive welfarestates (WS)
The outcomesof the WSwith effects onthe economicperformance
Positive effects Negative effects Assessment
Social impactof the WS
Poverty alleviation WS can behavelike a paternalisticmonopoly, deprivingconsumers of choice.
Absence ofpoverty maybe moreimportant
Social inclusion Social inclusion fosterslong-term social peace andshould be conducive tolong-term growth
Income security:insurance againstloss of incomeinduces risk taking.
May reduceindividual incentivesfor individual effortto achieve topperformance inthe labour market
Excessive insecuritymay have anegative effecton social peace
Reduction of incomeinequality: a minimumof income inequality(i.e. at least the equalityof opportunity) shouldhelp to tap the fullproductive capacityof a society (e.g.through all benefits thatkeep children at schoolrather than forcing theminto the labour markettoo early)
May reduceindividualincentives forindividual effortto achieve topperformance inthe labour market
Excessive inequalitymay have anegative effecton social peace
Publicexpenditure
Substantial publicexpenditure involved:positive if transfers areat the same timeinvestments in long-termGDP growth and hencein the welfare of thepopulation
Negative ifsocial expenditureis deficit financedand/or crowdsout public/privateinvestments
Many social transfers canbe conceived in such away that they comprise aninvestment aspect with regardto growth and social peace;deficit financing should beavoided as it has a long-termnegative effect ongovernment’s room forfinancial manoeuvre
Savings Pay-as-you-go(PAYG) pensionsystem cancrowd outprivate savings
Empirical evidence isinconclusive. Butfunding might beemployed strategicallyto ‘‘bundle’’ investments
575
Exercise Annex

It must be recalled that the welfare state is a set of institutions, policies andprogrammes aimed at reducing potential losses in population welfare. They dothis both by direct redistribution and by investment-oriented transfers. An overallobjective for a national welfare state should be to provide the population with thegreatest possible total disposable income, individual choice and opportunity whilekeeping poverty and avoidable ill health to the minimum. A simple examinationof national formal social expenditure does not provide much information aboutthe effectiveness and affordability of the welfare state. It is the social andeconomic effects of individual transfers that determine that affordability.
The case of Demoland
In Demoland public social expenditure accounts for 9.3 per cent of GDP. Itslargest component (6.0 per cent) is health expenditure; this is unavoidable
Table T2.1 (cont’d)
The outcomesof the WSwith effects onthe economicperformance
Positive effects Negative effects Assessment
Productivity WS can subsidizeproductivity growththrough educationand training, improvinghuman capital formation
WS allocateresources toactivities withslow productivitygrowth rate(e.g. services,education)
Impact of social transferson human capitalformation could bestronger
Globalization Globalization couldcreate moreuncertainties forcertain groups ofpeople; social protectioncan alleviate theseuncertainties and havepositive effectson productivity
High overall taxrates and labour costdue to social securitycontributions maynegatively effectglobal competitiveness;may lead to out-migration of skilledlabour and capital
Empirical evidence as yetunclear: however, thereis a correlationbetween openness andgovernmentexpenditure
Politicaleconomy
Social security mightfoster identification ofcitizens with a society;this should havelong-term positiveimpact on theirreadiness tocontribute to societaldevelopments
Social benefitentitlements createvested interestswhich could havea sub-optimal impacton financial andbudgetary allocativedecisions; irresponsibleoverpromising can beused to gain unduepolitical influence
Overpromising is a realdanger; it can only beavoided by rigorousinformation andeducation aboutWS limitations
576
Financing social protection

because of the AIDS epidemic. Accordingly, demands for higher expenditureon health care will continue in the short- to medium term. The dramatic declinein life expectancy and the slowed growth of the labour force will put additionalpressure on the invalidity pension scheme.
The health system includes a basic universal service provided by thegovernment (in hospitals and rural health stations), social insurance, and aprivate health service. The effect of health expenditure is undoubtedly positive.It helps create a more stable society, supports the labour force, and preventsintergenerational risks (new pandemic). The epidemic will continue to spreadand dominate the resource needs of the social sector. Demoland’s currentsituation limits its public resources, which could be focused on other socialtransfers generating higher productivity growth and long-term benefits.
The inevitable focus on health has an opportunity cost. The unemploymentrate is high (33.6 per cent of the labour force) and there are no unemploymentbenefits. The overall high poverty rate (30 per cent of the population) and grossincome inequality call for government interventions, which cannot be financed.This situation poses a threat to social peace. As long as that threat is tangible (asreflected in the uncontained demands by veterans for land reform and assetsredistribution) our social expenditure cannot be too high. The introduction of abasic social assistance scheme should be evaluated. At present the size of thewelfare state is not a problem. Given its limited resources, the governmentcould increase incentives for more extensive private participation in pensioninsurance schemes and a greater formalization of the economy, leading to anincrease in income subject to taxes and contributions. The latter could beallocated to health, freeing some of the resources currently used for health tocombat poverty and hence social unrest, with its long-term detrimental effectson foreign direct investment and consequently growth.
Conclusion
The European debate on the size of the welfare state is academic for us.We need higher rather than lower social expenditure. What matters to us is:
(a) finding intelligent ways to mobilize additional resources;
(b) introducing an efficient institutional structure (in design and policy)ensuring the social peace that we need – a peace reflected, among otherthings, in stable, non-conflictual industrial relations and rationalredistributive policies. In such a good environment, sound macroeconomicpolicies can work and permit a sustainable increase in welfare.
Our biggest challenge remains the HIV/AIDS epidemic. If we cannotcontain it, our welfare state will not be able to perform its intended stabilizingsocial function.
577
Exercise Annex

TASK NO. 3 A SOCIAL ASSISTANCE SCHEME FOR
DEMOLAND?
(Based on issues covered in Chapter 3)
From your understanding of Demoland’s economy and its present socialsituation, develop a hypothetical income distribution for the country. TheMinister asks you whether it would be possible to introduce a social assistancescheme to bring everybody up to a minimum income of, say, 25 per cent of theaverage wage in the country. Write a TM to the Head of Planning answering thefollowing questions:
(1) What would be the likely cost as a percentage of GDP?
(2) What are the risks to the calculations in terms of moral hazard?
(3) Do you expect any negative effects on the economy?
MODEL SOLUTION
MEMORANDUM
From: YOUTo: Head of Planning, Ministry of Labour and Social AffairsSubject: A social assistance scheme for Demoland
Background information
On the basis of the income distribution gleaned from official statistics and theresults of the latest household income and expenditure survey, the poverty linefor Demoland could be set at 25 per cent of the country’s average wage(2,278.94 Currency Units [CU] per month), that is, CU 569.73 per month, orCU 6,836.81 per year. Assuming a linear distribution of income within eachincome bracket, the incomes of 1.1 million people (60.6 per cent of thepopulation) are lower than this threshold.
Table T3.1 shows the lower part of the income distribution in Demolandfor 2000 and the benefits that would be necessary to bring the poorest partsof the population up to the income threshold of 25 per cent of averagewage.
Assuming an administrative cost of 10 per cent of benefit expenditure, thesocial assistance scheme would cost CU 2,917.8 million, or 12.08 per cent ofGDP. It should be noted that this level of expenditure is the maximum. Ifeligibility for participation in the scheme is linked to specific criteria, actualexpenditure may be lower. Moreover, actual benefit take-up may be lower, andhence estimated expenditure may decrease further.
The overall cost of the scheme is clearly prohibitive in view of the country’scurrent overall tax-to-GDP ratio of about 30 per cent. Accordingly, we also
578
Financing social protection

present the calculations for a second alternative (see table T3.2). This secondoption is based on an income threshold at the level of the minimum wage (CU340 per month or CU 4,080 per year). The minimum wage amounts to 15 percent of the average wage. It is estimated that 434,205 persons (23.6 per cent ofthe population) live on an income equal to or lower than this threshold.
Lifting the poor to the minimum wage level would require a socialassistance expenditure of CU 608.4 million, or 2.52 per cent of GDP. Again,this is the maximum level of expenditure, but in this case actual expenditurelevels would come closer to this maximum than in option 1. With lower benefitlevels linked to the minimum wage, eligibility would not be made conditionalupon specific criteria, and take-up rates would tend to be higher.
Future expenditure
Relative future expenditure levels for the next decade can be expected tostagnate or even fall in both alternative scenarios, since the economy isexpected to grow, bringing increasing numbers of people into formalemployment or allowing them to earn better incomes in the informal sector.The exact nature of expenditure development is difficult to project, since the
Table T3.1 A social assistance scheme to close the income gap, option 1(income threshold at 25% of average wage)
Income bracket Average income Income gap People inincome bracket
Benefit per month(CU)
0–50 40 530 17 507 9 273 839
51–100 80 490 18 428 9 024 815
101–150 135 435 36 856 16 022 551
151–200 178 392 70 026 27 431 712
201–250 230 340 82 926 28 172 770
251–300 280 290 108 725 31 501 371
301–350 328 242 125 310 30 291 766
351–400 379 191 145 213 27 696 967
401–450 427 143 162 166 23 146 635
451–500 480 90 154 703 13 882 102
501–550 538 32 144 936 4 599 385
Total benefit expenditureper month
221 043 913
Total benefit expenditureper year
2 652 526 954
Total expenditure includingadministrative cost(10% of benefitexpenditure)
2 917 779 649
As percentage of GDP 12.08
579
Exercise Annex

distribution of the additional income generated by the economy betweendifferent income groups is almost impossible to model without a longer historyof observations. Such observations are not available for Demoland.
Considerations
(a) Moral hazard. Depending on the actual design of the means test and theadministrative procedures involved, there is a risk that the scheme will beabused by recipients and administrators. In a classic cash-income or asset test,recipients may underreport their income (for example, by not reporting informalsector income that cannot be verified); or benefits may provide too big adisincentive against accepting formal sector employment. Administrators mayuse the resources discretionarily to obtain favours or secure political influence.Simple asset tests in rural conditions or simple forms of categorized means tests(that is, using such categories as number of children or elderly living in thehousehold, or disability or chronic illness) may have to be devised to makethe administrative decision-making process as transparent as possible. Thedownside is that it would probably not be possible to reach out to all of the poor.This loss in scheme effectiveness has to be weighed against the potentialdamage to society and the economy if dependency becomes a lifestyle.
Table T3.2 A social assistance scheme to close the income gap, option 2(income threshold at minimum wage level)
Income bracket Average income Income gap People inincome bracket
Benefit per month(CU)
0–50 40 300 17 507 5 251 980
51–100 80 260 18 428 4 791 280
101–150 135 205 36 856 7 555 480
151–200 178 162 70 026 11 344 277
201–250 230 110 82 926 9 121 860
251–300 280 60 108 725 6 523 512
301–350 328 12 125 310 1 503 725
Total benefitexpenditureper month
46 092 114
Total benefitexpenditureper year
553 105 363
Total expenditureincludingadministrativecost (10% ofbenefit expenditure)
608 415 900
As percentage of GDP 2.52
580
Financing social protection

(b) Possible negative economic effects could include increased disincentives foractive labour-market participation. Increasing the population’s de factominimum income will increase both the reservation wage (at least in the caseof a poverty line set at 25 per cent of the average wage), and the wage cost tofirms, resulting in the typical effects on employment levels. Benefits have to befinanced by tax increases. Demoland is attempting to attract foreign investment,and increased taxes or wage costs may be a disincentive for investors.
Results and conclusions
In view of the high level of resources necessary to finance such a programme,and the possible negative effects on the labour market, a minimum incomeguaranteed at 25 per cent of the average wage is, at present, hardly sustainableor affordable. In Demoland’s current circumstances, a minimum-wage povertyline is more manageable. Given the very low minimum wage, one option mightbe to increase the level of the poverty line relative to the average wage duringthe next year, and adjust the social assistance scheme accordingly.
The poverty line determination also needs clarification. Need levels oflarger households should be examined more closely with a view to adjustingbenefit levels to the respective needs of adults and children and taking intoaccount regional price-level variations. Most importantly, longer-term povertyalleviation goals should include ‘‘empowerment strategies’’. This means, forexample, that a minimum-income guarantee should be coupled with training,education, and health care programmes.
581
Exercise Annex

TASK NO. 4 FINANCING A SOCIAL ASSISTANCE
SCHEME FOR DEMOLAND
(Based on issues covered in Chapter 4)
Go back to task n– 3. A consultancy agency has assessed the potential cost ofthe scheme. But now the Minister wants a thorough look at the financing side ofthe scheme, and as he was not quite satisfied with the work of the agency,he wants an assessment from his own staff. Write a minute to the Head of Plan-ning answering the following questions:
(1) How would we finance the benefits (through which fiscal instrument, whatwould be the tax base)?
(2) What are the pros and cons of the different options in terms ofadministrative feasibility and equity?
(3) Can we reduce overall government expenditure by ‘‘offloading’’ someother social cost from the budget?
MODEL SOLUTION
MEMORANDUM
From: YOUTo: Head of Planning, Ministry of Labour and Social AffairsSubject: Financing a social assistance scheme for Demoland
Background and issues involved
If a social assistance scheme is to be introduced, it should be based on soundand sustainable financing principles. A scheme conceived along the lines ofoption 2 outlined in the solution to task n–3 would entail expenditure of CU608.42 million per year, or 2.5 per cent of GDP in 2000.
Alternative solutions, their advantages and disadvantages
Possible ways of financing a social assistance scheme for Demoland are:
. higher taxation
. reallocation of present budgetary expenditure
. higher government borrowing
. other options (including increase in transfers from the rest of the world).
In order to assess the maximum budgetary implications of the introductionof a social assistance scheme, we undertook a simple static forecast of theexpected social assistance expenditure under option 2. The forecasts of the
582
Financing social protection

volume and structure of government revenues were taken from officialgovernment forecasts (Demoland GOV file).
1. Increasing taxation
In order to cover the projected expenditure, additional revenue would need tobe generated (see table T4.1). The table shows projected government revenueunder current circumstances and with the projected introduction of a socialassistance scheme.
All other things being equal, government revenue would have to increase by8.4 per cent for 2000 in order to cover expenditure for the social assistancebenefit. The projected relative rise would be lower in subsequent years; it wouldshrink to 5.4 per cent for the year 2020.
If this additional expenditure was covered entirely out of taxes on incomeand wealth, those taxes would have to be increased by 21.9 per cent in 2000,dropping to 14.1 per cent in 2020. Given that income inequality in Demoland isalready very high, it should be carefully evaluated whether the increase in tax
Table T4.1 Projected government revenue and projected increase withthe introduction of a social assistance scheme, 2000–20(in million CU)
2000 2005 2010 2015 2020
General government revenue 7 261 13 448 22 427 37 018 56 883
1. Property income, receivable 288 532 885 1 457 2 234
2. Taxes on production and import 3 004 5 549 9 231 15 199 23 302
3. Taxes on income and wealth 2 782 5 139 8 549 14 075 21 580
4. Social security contributions 435 838 1 451 2 482 3 934
5. Current transfers from rest ofthe world
740 1 367 2 274 3 744 5 740
6. Miscellaneous current transfers 12 22 37 61 93
Projected expenditure for socialassistance
608 993 1 481 2 190 3 051
Revenue would have to increase to 7 869 14 441 23 909 39 208 59 935
Increase (in %) 8.4 7.4 6.6 5.9 5.4
If entirely financed out of taxes onincome and wealth
Projected taxes on income andwealth
3 390 6 132 10 030 16 266 24 631
Increase (in %) 21.9 19.3 17.3 15.6 14.1
If entirely financed out of taxes onproduction and imports:
Projected taxes on productionand imports
3 612 6 542 10 713 17 389 26 353
Increase (in %) 20.3 17.9 16.0 14.4 13.1
583
Exercise Annex

rates should apply equally to all taxpayers, or whether some form of progressivescale could be found. In addition, it may be useful to check whether thenecessary increase in tax revenue could be partly generated by expanding thetax base and improving tax compliance.
If the government were to choose instead to push up taxes on production andimports, the necessary increase would amount to 20.3 per cent in 2000, decliningto 13.1 per cent in 2020. A combined financing of social assistance benefits by thetwo tax types would split the necessary rise in tax rates on different sectors of theeconomy; this might help keep in check possible negative economic effects.
2. Reallocating budget expenditure
We have identified the following possibilities for reallocation of expenditurewithin the budget: defence and public order, economic affairs and services, andcurrent transfers to the rest of the world. As shown in table T4.2, if the socialassistance scheme was to be entirely financed out of the current governmentbudget, 8.0 per cent of current expenditure would have to be reallocated,shrinking to 4.6 per cent in 2020.
After consultations with experts on African affairs, it seems that the end ofthe civil wars in two neighbouring countries may allow Demoland to reduce itsdefence budget. In 2000, the expenditure for defence and public orderamounted to 13.1 per cent of total government expenditure.
Other expenditure items that might possibly be reduced include economicaffairs and services (currently 12.7 per cent). It should be carefully evaluatedwhether efficiency gains could free some resources that could be spent on socialassistance. In addition, the current level of transfers to the rest of the world (3.2per cent of government expenditure) may also offer some room for reallocation.
Table T4.2 Projected government expenditure and projected increase with theintroduction of a social assistance scheme, 2000–20 (in million CU)
2000 2005 2010 2015 2020
Total general government expenditure 7 590 14 360 24 700 42 050 66 129
Defence and public order 994 1 836 3 054 5 029 7 710
as percentage of total expenditure 13.1 12.8 12.4 12.0 11.7
Economic affairs and services 963 1 778 2 958 4 870 7 466
as percentage of total expenditure 12.7 12.4 12.0 11.6 11.3
Current transfers to the restof the world
240 443 738 1 214 1 862
as percentage of total expenditure 3.2 3.1 3.0 2.9 2.8
Projected expenditure for socialassistance scheme
608.42 992.69 1 481.42 2 190.20 3 051.32
as percentage of total currentexpenditure
8.0 6.9 6.0 5.2 4.6
584
Financing social protection

3. Increased borrowing
Since in the year 2000 the government budget is already running a deficit thatwill widen further in the years to come, an increase in net borrowing is not aviable option for covering the cost of a social assistance scheme since it wouldjust shift the burden of financing to future generations.
4. Other options
Another possible option could be to seek to increase transfers from the rest ofthe world. Given its implications, this option should be considered only for alimited period, with a clear view to rapidly building up national resources tofinance a self-sustaining social assistance scheme for the population.
Recommendations
After considering various financing options for a social assistance scheme, wewould recommend combining different sources of financing in order to limit theburdens created by each individual one. We would propose to generate part ofthe resources from taxes on income and wealth and on production and imports.While emphasis should be placed on improving tax compliance and extendingthe tax base, a rise in tax rates will be inevitable. Given the already high incomeinequality, the increase should be designed in a progressive way. In addition,possibilities for reallocation of budget expenditure should be explored, inparticular with regard to defence spending, economic affairs and services, andcurrent transfers to the rest of the world. In order to facilitate the introduction ofthe social assistance scheme, transfers from the rest of the world could besought for a limited period of time.
585
Exercise Annex

TASK NO. 5 A UNIVERSAL PENSION SCHEME FOR
DEMOLAND
(Based on issues covered in Chapter 5)
On his return from a seminar in Europe, the Minister of Labour and SocialAffairs has suggested that the rudimentary pension schemes for public sectorworkers should be replaced with a universal pension scheme for all people over65 years of age. However, the Head of Planning wants to know:
. How would the cost to the Government develop under the present scheme,provided it bears 50 per cent of the contribution?
. What would a new, flat-rate scheme cost?
. How could it be financed?
. Could we sell that plan to the Ministry of Finance? And (if at all) to publicsector workers?
MODEL SOLUTION
MEMORANDUM
From: YOUTo: Head of Planning, Ministry of Labour and Social AffairsSubject: A universal pension scheme for Demoland
Background and issues involved
Most of the population faces insecurity and poverty in old age. Demoland’sexisting pension scheme covers only public sector workers. A proposal is underconsideration to improve social security in old age by introducing a flat-rateuniversal pension for the entire population over 65. As in the current publicsector scheme, this pension would also be available to invalids and survivors.For public sector workers, benefits from the existing scheme would be replacedby those of the universal scheme after a transition period.
A. Reform of the current public sector scheme:
methodology and caveats
The public sector scheme is currently financed by a 20-per cent contributionrate shared between employers and workers on a 50:50 basis. The governmentpresently absorbs surpluses but has agreed to cover future deficits withoutraising the contribution rate. The surpluses are kept in a special reserve ownedby the government. According to government forecasts, the expenditure woulddevelop as outlined in table T5.1.
586
Financing social protection

If it is assumed that the surplus or deficit of the public sector pensionscheme is integrated into the general government budget, the net cost for thegovernment would be CU 80.7 million in the year 2000, but would reach CU1,485.97 million by 2020.
B. Introduction of a universal old-age pension:
methodology and caveats
The following analysis is based on Demoland’s official population forecasts andstatistics (see Demoland files). The following data were used:
. Total population above 65 years of age as beneficiaries of old-age pensions
. Total pensioners (current)
. Total present contributors within the governmental sector
. Total number of other pension beneficiaries (invalids, survivors, AIDSinvalids)
. Total number of persons in the labour force by sector, who could contributeto the universal scheme
Calculations have been made to assess the universal benefit expenditureborne by the government in absolute numbers and as a percentage of GDP.
The pensions for invalids, survivors and AIDS invalids are calculatedseparately. Their composition as a percentage of pensioners has been takenfrom the Demoland data. The level of benefit for this category is kept at
Table T5.1 Expected results for the current public sector scheme,2000–20 (in million CU)
2000 2005 2010 2015 2020
Total expenditure includingadministrative cost (presentcost to government)
212.47 459.26 874.96 1 590.74 2 681.53
as percentage of GDP 0.88 1.03 1.18 1.30 1.43
Contributions 263.54 508.02 879.70 1 504.44 2 391.12
Contributions from employedpersons
131.77 254.01 439.85 752.22 1 195.56
Contributions from employer(government)
131.77 254.01 439.85 752.22 1 195.56
Annual balance of the scheme(surplus/deficit)
51.07 48.76 4.74 �86.30 �290.41
Net cost to government under theassumption that surplus/deficitis integrated into general budget
80.70 205.25 435.11 838.52 1 485.97
Net cost to government aspercentage of GDP
0.33 0.46 0.59 0.69 0.79
587
Exercise Annex

115 per cent of minimum wage level – that is, CU 391 per month in 2000.This anchoring of the projections might lead to an underestimation of the futurenumber of invalidity pensions due to AIDS. The assessment of that particularrisk requires a much more detailed study than could be undertaken inthe context of this TM. This effect is expected to be compensated to somedegree by a corresponding overestimation of expenditure for old-age pensions.However, there remains the caveat that overall pension expenditure might beunderestimated to some extent.
After examining current pension and wage levels, we suggest that thepension level be set at 175 per cent of the minimum wage level for all retirees(CU 595 per month in 2000, subsequently indexed to the development ofwages). In a flat-rate scheme, this benefit level should be granted to the entireelderly population, irrespective of their coverage under the current scheme. Thecurrent scheme has an average monthly benefit level of CU 1,096.28, but coversonly 23 per cent of the population over the age of 65.
Other pensions in the new scheme (see table T5.2) are calculated on the basisof the assumption that the ratio of invalidity pensioners, survivors and AIDSinvalids is the same for the new scheme as for the current public sector scheme.The total number of other pensioners in the whole population is thus calculated onthe following ratios (data from 2000 to 2020, including every fifth year).
Other Beneficiaries ¼ pensioners � ratio
Table T5.2 Numbers of beneficiaries, for other pensioners, 2000–20
2000 2005 2010 2015 2020
Ratios: Other beneficiaries as a proportion of old-age pensioners
Invalidity (without AIDS) 0.04 0.07 0.11 0.15 0.18
Survivors 0.65 0.99 1.31 1.39 1.42
– Widowers 0.25 0.38 0.50 0.53 0.55
– Orphans 0.40 0.61 0.80 0.85 0.88
AIDS invalids – 0.07 0.07 0.08 0.07
Numbers of beneficiaries
Old-age pensioners (pop. 65+) 67 210 69 184 73 409 81 780 91 632
Invalidity (without AIDS) 3 006 4 981 8 090 11 995 16 425
Survivors (widowsand orphans)
43 683 68 355 95 951 113 590 130 319
AIDS pensioners 0 4 537 5 492 6 380 6 735
Total number of otherbeneficiaries
46 689 77 873 109 532 131 964 153 478
Current pension scheme for public sector workers only
Old-age pensioners 15 382 16 121 17 416 19 754 22 535
Other pensioners 10 685 18 146 25 986 31 876 37 745
Total number of beneficiaries 26 067 34 266 43 402 51 630 60 280
588
Financing social protection

On the basis of the above analysis we estimated how government cost woulddevelop. This is shown in table T5.3, for the current and the new scheme. It isassumed that administrative cost is at 10 per cent of total pension expenditure inthe new scheme.
The new universal pension scheme could be financed from contributions ofthe employed or out of general taxation (see table T5.4). The calculations beloware based on contributions complemented by general taxation.
The calculations rest on the following assumptions:
. Wage for private sector employees:
WPriv ¼ [AvWage� (NoPub + NoPriv) � (NoPub�WPub)]=NoPriv
where:
AvWage = average monthly wage in Demoland (both public andprivate sector)
NoPub, NoPriv = numberof public and private sector workers respectivelyWPub = average public sector wage
Table T5.3 Benefit levels and expenditure in a universal pensionscheme, 2000–20
2000 2005 2010 2015 2020
Old-age pension (175% of minimum wage)
Monthly pension level (CU) 595.00 970.81 1 448.75 2 141.90 2 984.04
Yearly pension level (CU) 7 140.00 11 649.67 17 385.06 25 702.85 35 808.46
Benefit expenditure(in million CU)
479.88 805.97 1 276.21 2 101.99 3 281.19
as percentage of GDP 2.19 1.99 1.89 1.89 1.93
Other pensions (115% of minimum wage)
Yearly pension level (CU) 4 692.00 7 655.49 11 424.46 16 890.44 23 531.27
Monthly pension level (CU) 391.00 637.96 952.04 1 407.54 1 960.94
Benefit expenditure(in million CU)
219.06 596.16 1 251.34 2 228.93 3 611.53
as percentage of GDP 1.0 1.47 1.86 2.01 2.12
Total pension scheme
Benefit expenditure(in million CU)
698.94 1 402.13 2 527.56 4 330.92 6 892.72
Total expenditure(in million CU)
768.84 1 542.34 2 780.32 4 764.01 7581.99
as percentage of GDP 3.18 3.46 3.75 3.90 4.05
Current scheme for public sector workers only
Total expenditure, includingadministrative cost(in million CU)
156.12 278.25 467.14 815.18 1 347.40
as percentage of GDP 0.65 0.62 0.63 0.67 0.72
589
Exercise Annex

. Contribution for the universal pension scheme ¼ 10%� insured earnings(non-governmental contribution).
. Contribution is calculated using formula (in three labour forcesectors):
Contribution ¼ W� 12� 10%�CR� IER
where:
W = average monthly wage within the particular sector (seeassumptions)
10% = contribution rate, constant for all years and within sectorsCR = compliance rateIER = insurable earning ratio
However, the contributions of the employed would cover only part of thetotal expenditure of the scheme; the remainder would have to be covered out ofthe general government budget (see table T5.5).
For the year 2000, the total cost of CU 768.84 million would be sharedbetween CU 385.04 million covered by contributions and CU 383.80 millioncovered out of the government budget, equivalent to 1.59 per cent of GDP. Thisamount would have to be financed through an increase in general taxation.
Table T5.4 Calculation of contribution base, 2000–20
2000 2005 2010 2015 2020
Share of insurableearnings in wages
0.49 0.52 0.54 0.57 0.59
Minimum wage (year) 4 080.0 6 657.0 9 934.0 14 687.0 20 462.0
Average monthly wage
All employed 2 279.0 3 718.3 5 548.9 8 203.8 11 429.3
Public sector 3 138.4 5 078.1 7 526.2 11 066.4 15 354.7
Private sector 1 973.0 3 249.5 4 889.2 7 279.7 10 203.7
Number of employed
Employees, private sector 254 434.0 288 421.2 321 829.6 358 717.7 395 064.1
Employees, public sector 90 602.8 99 436.0 107 386.0 115 804.4 123 345.9
Self-employed 47 263.6 52 608.2 57 644.6 63 098.9 68 250.0
Captured people
75% of private sector 190 825.5 216 315.9 241 372.2 269 038.3 296 298.0
95% of public sector 86 072.7 94 464.2 102 016.7 110 014.2 117 178.6
25% of self employed 11 815.9 13 152.0 14 411.1 15 774.7 17 062.5
Contribution (in million CU)
Private sector 221.38 434.41 764.71 1 339.62 2 140.53
Public sector 158.84 296.45 497.53 832.74 1 273.86
Self-employed 4.82 8.76 14.32 23.17 34.91
Total contributions 385.04 739.62 1 276.56 2 195.53 3 449.30
590
Financing social protection
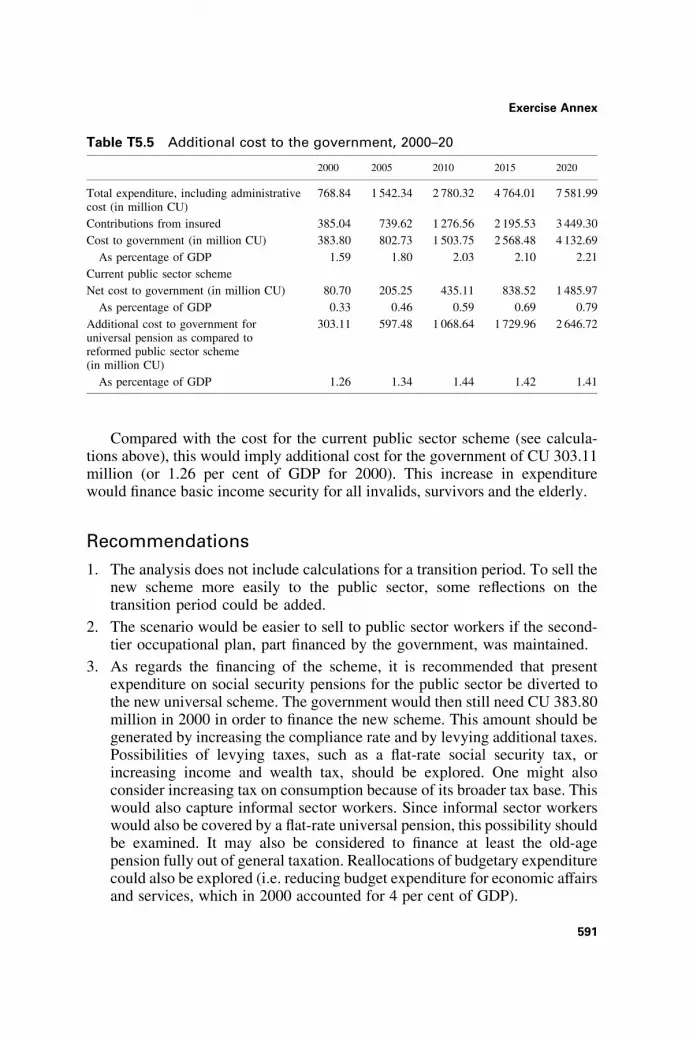
Compared with the cost for the current public sector scheme (see calcula-tions above), this would imply additional cost for the government of CU 303.11million (or 1.26 per cent of GDP for 2000). This increase in expenditurewould finance basic income security for all invalids, survivors and the elderly.
Recommendations
1. The analysis does not include calculations for a transition period. To sell thenew scheme more easily to the public sector, some reflections on thetransition period could be added.
2. The scenario would be easier to sell to public sector workers if the second-tier occupational plan, part financed by the government, was maintained.
3. As regards the financing of the scheme, it is recommended that presentexpenditure on social security pensions for the public sector be diverted tothe new universal scheme. The government would then still need CU 383.80million in 2000 in order to finance the new scheme. This amount should begenerated by increasing the compliance rate and by levying additional taxes.Possibilities of levying taxes, such as a flat-rate social security tax, orincreasing income and wealth tax, should be explored. One might alsoconsider increasing tax on consumption because of its broader tax base. Thiswould also capture informal sector workers. Since informal sector workerswould also be covered by a flat-rate universal pension, this possibility shouldbe examined. It may also be considered to finance at least the old-agepension fully out of general taxation. Reallocations of budgetary expenditurecould also be explored (i.e. reducing budget expenditure for economic affairsand services, which in 2000 accounted for 4 per cent of GDP).
Table T5.5 Additional cost to the government, 2000–20
2000 2005 2010 2015 2020
Total expenditure, including administrativecost (in million CU)
768.84 1 542.34 2 780.32 4 764.01 7 581.99
Contributions from insured 385.04 739.62 1 276.56 2 195.53 3 449.30
Cost to government (in million CU) 383.80 802.73 1 503.75 2 568.48 4 132.69
As percentage of GDP 1.59 1.80 2.03 2.10 2.21
Current public sector scheme
Net cost to government (in million CU) 80.70 205.25 435.11 838.52 1 485.97
As percentage of GDP 0.33 0.46 0.59 0.69 0.79
Additional cost to government foruniversal pension as compared toreformed public sector scheme(in million CU)
303.11 597.48 1 068.64 1 729.96 2 646.72
As percentage of GDP 1.26 1.34 1.44 1.42 1.41
591
Exercise Annex

4. Recommendations on actuarial valuations: The calculations rest onrelatively crude assumptions in respect to the benefit levels. Those are foruniversal retirement pension at 175 per cent and for other pensions(survivors, invalidity) based on 115 per cent of minimum wage level. Inorder to fine-tune these benefit levels, it may be helpful to study need levelsof potential beneficiary households more carefully and to conduct actuarialvaluations in order to recommend better benefit levels.
Conclusion
The introduction of a universal pension scheme would cost the government anadditional 1.59 per cent of GDP in the base year 2000. This would cover allpeople over 65 years, which is about four times the current beneficiary rate, inaddition to beneficiaries of invalidity and survivors’ benefits. We think thisburden is not excessive, considering the value of a universal scheme and itsprimary aim in preventing poverty and vulnerability among this age group.
There are some other positive aspects of universal pensions:The administrative cost of introducing a universal pension scheme is quite
low, as it is relatively easy to identify old people. It remains to be seen whetherthe assumption of 10 per cent for administrative cost could be lowered once thesystem is running.
Most of the old people in developing countries live in large households; theirpensions are thus likely to reduce aggregate poverty through transfers to youngergenerations (the so-called ‘‘trickle down’’ effect). Empirical research shows thatold people are the main carers for both orphans and other children in AIDS-affected families in Africa. A universal pension for old people in Demolandcould have a positive effect on the well-being of the country’s children.
592
Financing social protection

TASK NO. 6 A SOCIAL HEALTH INSURANCE
FOR DEMOLAND?
(Based on issues covered in Chapter 5)
Working on a tight budget, the Minister of Health is seeking to increase theresource base of the health sector. She has just returned from the World HealthAssembly in Geneva, where she learned about the potential for mobilizingresources through a Social Health Insurance scheme. Her idea is to introducesuch a scheme – in addition to the one existing for the public sector – for formalsector workers, who are already contributing to the newly introduced universalpension scheme (see task n– 5). She wants to ‘‘sell’’ services from the publicsector hospitals to the scheme. She wants to charge family rate contributions.She reckons that because of the rapid growth of HIV infections the actualutilization of services in the coming years might increase by about 5 per centannually rather than the 2 per cent observed during previous years, and she isstill assuming a tightly controlled public health budget. The health economist inthe Ministry also estimates that excess medical inflation for the coveredpopulation would be in the order of 3 per cent annually, largely due to growingimports of AIDS drugs that are increasingly replacing domestic drugs in thepalliative treatment of HIV/AIDS at the demand of employers and workers inthe formal sector. The Minister of Labour and Social Affairs refuses to acceptanother contribution rate of more than 5 per cent as he is concerned about thenegative impact on labour cost.
Write a brief TM to the Minister of Health:
. costing the scheme for a medium-term timeframe (making all the necessaryassumptions),
. demonstrating its effect on government health expenditure, and
. advising her on whether you consider this an adequate solution to thefunding problem of the health sector.
MODEL SOLUTION
MEMORANDUM
From: YOUTo: Minister of HealthSubject: A social health insurance for Demoland
Background
Demoland does not have a social health insurance scheme for private sectoremployees. It is hoped that introducing such a scheme would improve the healthcare of the insured population as well as the resource base of the health sector.
593
Exercise Annex

There is political determination as regards the following two characteristicsof a potential new social health insurance scheme:
. the insurance should cover formal sector workers who are alreadycontributing to the newly introduced pension scheme (see task n– 5) andtheir families;
. the contribution rate should preferably not exceed 5 per cent of earnings.
Suggested type of health insurance
The current arrangements regarding the financing and benefit delivery of healthinsurance for public sector workers would be extended to all workers in the formalsector. For reasons of governance, the scheme will remain organizationallyseparate from the public sector scheme. Contributions are designed as flat-ratecontributions. They should be determined as percentages of insurable earningscovering all non-employed family members. This means that dependants withoutregular income from employment in the formal sector would be covered withoutadditional contribution. The new social health insurance branch will purchasecare and pharmaceuticals from public providers on a fee-for-service and full-cost-recovery basis. The Minister of Health insists on that method of payment as it putsthe risk of utilization-driven cost increases under insurance on the insuranceschemes and not on the public providers (which would be the case under acapitation-based reimbursement mechanism of public providers).
Assumptions
1. As in the case of the recently introduced pension scheme (see task n– 5),compliance rates are assumed as follows for the newly covered groups:
. 75 per cent of private sector,
. 25 per cent of self-employed.
2. It is assumed that the initial per capita cost of the new scheme will beidentical to that observed in the public sector scheme. The assumed staff tonon-staff cost ratios are set out in table T6.1.
On the basis of these ratios and the present cost of the existing socialinsurance scheme for the public sector, the following per capita costamounts were established for the start year (the year 2000) of theprojections (see table T6.2).
3. Health insurance will lead to greater use of health services by coveredpersons, and it will also have to provide more expensive technologies,including drugs. The contributors are entitled to a determined basket ofgoods and services. According to all international experience, the utilizationand per capita cost cannot be as tightly rationed as in the public health
594
Financing social protection

service. For the future development of the health system, it was assumedthat per capita cost will be driven by the following drivers:
. utilization of services: set to increase annually by about 5 per cent inthe coming years owing to the impact of HIV/AIDS;
. excess medical inflation: 3 per cent annually owing to the need toimport drugs;
. general inflation rates and wage developments: same as those used instandard government forecasts (and as displayed in Demoland files).1
Modelling results
On the basis of the above assumptions, a 20-year projection of the possibleeconomic development of the scheme was undertaken. Twenty years isusually too long for a health care scheme, but that projection period wasused to demonstrate its potential expenditure dynamics. The projections aredeterministic and limited to one scenario only. Sensitivity tests would havebeen desirable but were not possible within the allotted time. It is nonethelessbelieved that the results are sufficiently robust to permit basic recommenda-tions. The results of the projections are summarized in table T6.3.
Table T6.1 Assumed staff to non-staff cost ratios in different categoriesof care
Expenditure category Staff costshare (%)
Non-staff costshare (%)
Administrative cost 90 10
Ambulatory and other care 75 25
Care in hospitals 75 25
Pharmaceuticals 10 90
Table T6.2 Assumed initial per capita cost in different categoriesof care, 2000
Per capita cost Total CU Staff cost CU Non-staff cost CU
Administrative cost 51 46 5
Ambulatory care 101 76 25
Hospital care 254 190 63
Pharmaceuticals 101 10 91
Total 507 322 185
1This is a slightly more sophisticated approach than the one used for task no 5 where average
rates of increase were used. This actually requires extracting the deflation for private
consumption and the average private sector wage from the Demoland ECO file.
595
Exercise Annex

Table T6.3 Estimated future financial development of a social health insurancefor the private sector, Demoland, 2000–20
Year 2000 2005 2010 2015 2020
Coverage
Insured persons
75% of private sector 190 826 216 316 241 372 269 038 296 298
25% of self employed 35 448 39 456 43 233 47 324 51 188
Total 226 274 255 772 284 605 316 362 347 486
Adjusted (reduced by25% due to non-coverageof family members)
169 705.5 191 829 213 453.75 237 271.5 260 614.5
Covered population 678 822 767 316 853 815 949 086 1 042 458
Estimated health insurance expenditure(1 000 CU)
Administrative cost 34 425 62 211 100 946 163 310 246 682
staff cost 30 982 56 824 93 842 153 386 233 457
non-staff cost 3 442 5 386 7 104 9 924 13 225
Ambulatory care 68 849 160 720 332 522 692 175 1 349 276
staff cost 51 637 120 873 254 766 531 464 1 032 385
non-staff cost 17 212 39 848 77 756 160 711 316 891
Care in hospitals 172 126 401 807 831 317 1 730 462 3 373 239
staff cost 129 094 302 186 636 924 1 328 679 2 580 999
non-staff cost 43 031 99 621 194 393 401 783 792 240
Pharmaceuticalsand other care
68 849 159 568 313 891 649 421 1 278 460
staff cost 6 885 16 116 33 969 70 862 137 651
non-staff cost 61 964 143 451 279 922 578 559 1 140 809
Total expenditure 344 249 784 306 1 578 676 3235 367 6 247 657
Estimated insurable earnings
Average monthlywage
1 973 3 192 4 731 6 995 9 745
Total insurableearnings (1 000 CU)
4 017 947 7 348 768 12 119 301 19 917 027 30 477 680
PAYG contributionrate (%)
8.57 10.67 13.03 16.24 20.50
Expenditure in %of GDP
1.4 1.8 2.1 2.6 3.3
Calculation of government savings
Per capita expenditure 384 612 996 1 646 2 622
Total savings 260 421 469 336 850 030 1 562 315 2 733 753
In % of GDP 1.1 1.1 1.1 1.3 1.5
596
Financing social protection

It is obvious that the new scheme might ultimately save about half thepresent net government expenditure on health. However, it does so atsubstantial overall cost increases in the health sector that will have to befinanced by fast-rising contribution rates in the new branch of social healthinsurance. The contribution rate will largely exceed the 5-per cent criterion setby the Minister of Labour and Social Affairs. The major structural problem isthat cost-containment measures – at present so strictly applied in the publicservice health care scheme – are not expected to operate with the same level ofeffectiveness in the social insurance scheme.
Recommendations
In view of the expected cost development and the necessarily high levels ofcontribution rates which may actually have negative crowding-out effects onthe compliance with other tax and contribution obligations, it is recommendedto consider two other policy options:
. replace the insurance model by an earmarked health tax of, say, 5 percent onall incomes, to be used to increase the budget of the Ministry of Health, or
. reduce the social insurance approach to a catastrophic insurance cover,which can limit the actual cost to less than half of the expected levels underthe social insurance approach.
The latter approach may still contain considerable medium- to long-termcost uncertainties, in particular on account of the HIV/AIDS epidemic. It mightbe preferable to maintain the tight overall lid on health spending until theepidemic runs its course.
597
Exercise Annex

TASK NO. 7 AN INVESTMENT PLAN/PORTFOLIO FOR
THE PENSION SCHEME IN DEMOLAND
(Based on issues covered in Chapter 6)
The actuary has just submitted a long-term projection for the existingpension scheme (see file on long-term financial development in Demolanddatabase). The Minister of Finance wants you to draw up:
(a) investment guidelines for the scheme (i.e. an Investment PolicyStatement); and
(b) a long-term investment plan allocating the reserves shown in theprojections to different types of investments, namely stocks and bonds(in-country and abroad), short-term cash deposits, as well as directinvestments in enterprises.
You have to make assumptions on the nature of investments available in thecountry.
MODEL SOLUTION
MEMORANDUM
From: YOUTo: Minister of FinanceSubject: Investment plan/portfolio for the pension scheme in Demoland
Background
Demoland is running a pension scheme for the public sector, covering thefollowing benefits:
. old-age pension;
. survivors’ pension; and
. invalidity pension.
The scheme has accumulated reserves of CU 1.5 billion as at 31December 2000. As provided by the regulations of the scheme, the Minister ofFinance decides each year whether the annual surplus is transferred to thereserve or absorbed into the current budget. The latter course of action isjustified as the Minister has accepted the obligation to cover potential futuredeficits. Thus far the Minister has opted for transfers into the reserve.However, the unions claim that the monies accumulated are earmarked forpension purposes, and would like to see the reserve managed as in other socialinsurance schemes.
598
Financing social protection

For the time being Demoland’s pension scheme has no investment policystatement to guide the investment of the reserves. The following sectionscontain the draft of such a statement.
Suggested draft Investment Policy Statement
1. Management structure
Investments of pension scheme reserves are guided by an investmentcommittee. The Investment Committee shall be composed as follows:
. Chairperson
. General manager – ex officio member
. Worker representative – member of the board of the scheme
. Employer representative – member of the board of the scheme
. Co-opted member – with expertise in investment banking.
The Investment Committee shall be appointed by the board of the scheme,subject to confirmation by the Minister of Finance. The board shall provide theinvestment committee with regular projections of:
. the likely long-term development of the reserve, and
. the likely cash flow needed from the reserve to cover current expenditurefor a five-year period from the date of the projections.
These projections shall be provided in the context of actuarial valuations ofthe scheme.
2. Statement of purpose
The Investment Committee shall apply best professional practices in itsinvestment activities to ensure the real growth of the reserve entrusted to it bythe pension scheme. The main purpose of the reserve is to achieve long-termreturns designed to help contain long-term contributions to the scheme atacceptable levels. In this process, the Committee shall comply with theprinciples of safety, yield, liquidity and social and economic utility and ensurethat top priority is given to the interests of present and future beneficiaries. Inthis context, long-term stable economic growth rates fostered by investing inindustries with long-term growth and stable employment perspective arepreferable to short-term high real rates of return earned by short-term capitalmarket transactions.
3. Investment objectives
(1) To achieve a real rate of return of no less than 1.5 per cent or at least asmuch as the real Lombard rate of the Bank of South Africa.
599
Exercise Annex

(2) To invest not less than 70 per cent of the fund reserve in the local market.
(3) To maintain a 10-per cent investment in liquid assets for the purpose ofcovering unforeseen current expenditure.
(4) To obtain a risk-adjusted return on all equity investments.
4. Portfolio mix
The composition of the portfolio should be as follows:
Equity 10 per cent
Prescribed assets 40 per cent
Money market 10 per cent
Real estate 20 per cent
Social investment 10 per cent
External equity 10 per cent
Equity: The equity market in Demoland is quite small and thereforecannot absorb a higher share of the reserve. This share should be reviewedevery three years with a view to bringing it into line with the growth of theturnover on the equity market.
Equity10%
Prescribedassets 40%
Money market10%
Real estate20%
Socialinvestment
10%
External equity10%
Figure T7.1 Suggested investment portfolio mix for Demoland’s pension
scheme
600
Financing social protection

Prescribed assets: These are government bonds, treasury bills andmunicipal bills issued in the local capital market. The proceeds are used forinfrastructure development such as the construction of roads, bridges, orcommunication infrastructure. Because of the small size of Demoland’seconomy, it is decided to invest a relatively large proportion in governmentinstruments, i.e. 40 per cent of total funds.
Money market: In order to meet the liquidity requirement, 10 per cent ofall funds is placed in the money market.
Real estate: This being a fairly stable and secure market, 20 per cent ofthe fund reserve is placed in real estate. Part of the real estate allocation isinvested in the South African real estate market.
Social investment: Recognizing the value of efficient social investmentfor the long-term growth of the economy, 10 per cent of the investment isplaced in areas such as housing, construction of clinics or upgrading of thepublic sewage system in municipal areas.
External equity: The Demoland Social Security Act permits externalinvestment to a maximum of 30 per cent of the fund reserve. However, inview of the need to develop the country’s infrastructure and of currently (andin the foreseeable future) sluggish foreign direct investment, the share ofexternal equity is for the time being limited to 10 per cent of the pension fundreserve.
5. Investment rules
1. The 10-per cent rule: The fund shall not invest more than 10 per cent of itsassets in one corporation or company.
2. No control rule: The fund shall not hold a controlling interest in any privatecompany.
3. The currency rule: Not more than 15 per cent of the assets can be held inSouth African rand and not more than 5 per cent of the assets in US dollars.
4. External investment: Not more than 30 per cent of fund reserves can be heldoutside Demoland (see, however, present temporary limitation set above).
5. Safety: The management shall ensure the safety of funds in their investmentactivities, i.e. the nominal value of the invested capital should be recoveredin all cases and ensure regular payment of interest.
6. Yield: As safety and liquidity are given priority in the investment of fundreserves, speculative investments are strictly prohibited. Where investmentis made in equities, a risk-adjusted return should be obtained.
7. Liquidity: Not less than 10 per cent of the fund assets shall be maintained inshort-term near cash assets.
8. Economic and social utility: The management may consider investments inareas that contribute to the improvement of health, education and the general
601
Exercise Annex

standard of living of insured persons. This should be done taking dueaccount of the need to maintain an adequate level of diversification of thefund and should not conflict with the other principles followed by the fund.
Recommendation
We recommend incorporating the above Investment Policy Statement formallyin the regulations of the scheme by Ministerial Decree. It is suggested that ageneral commitment by the Minister of Finance to build up the reserve betraded off against the obligation to cover all potential future deficits. This wouldde facto separate the financing of the public sector pension scheme from thegeneral budget.
602
Financing social protection

TASK NO. 8 A PERFORMANCE EVALUATION SYSTEM
FOR THE SOCIAL PROTECTION SYSTEM
IN DEMOLAND
(Based on issues covered in Chapter 7)
Following heavy criticism from the opposition on the effectiveness andefficiency of the national social protection system, the Minister of Labour andSocial Affairs has decided to go on the offensive. He wants to issue a socialprotection monitoring report to be published every two years (hoping that afterhis departure from the Cabinet the report will be named after him). The reportwill be drafted by his policy advisers. You are his financial analyst. He wantsyou to devise a set of no more than ten quantitative indicators to measure theeffectiveness and efficiency of the system as a whole. Write a briefing note inthe form of a TM to him, suggesting the ten indicators. Explain what theymeasure and calculate one or two as an example.
MODEL SOLUTION
MEMORANDUM
From: YOUTo: Minister of Labour and Social AffairsSubject: Performance evaluation system for the social protection system in
Demoland
Background
Performance indicators allow us to identify gaps in the legal provisions ofsocial protection schemes and performance deficiencies with respect to theirlegal mandates or broader social protection policy objectives. The mainreasons for regular performance evaluations are to promote good governanceand to ensure that programmes continue to respond to society’s changingneeds.
To assess the performance of the social protection system in Demoland,measurements in three policy dimensions are used: legal indicators, governanceindicators and financial indicators.
Assumptions
. The performance indicators used here are defined and analysed only for thepension scheme; similar performance indicators can be developed for otherschemes;
603
Exercise Annex

. the pension system covers only public employees;
. the pension system is still maturing (a fact that is reflected in the indicators’results);
. model calculations are provided only for indicators where data from acurrent database are available; in cases where the data base has yet to bedeveloped, the principal rationale for the indicator is explained withoutsample calculations;
. all calculations are for the year 2000.
Proposed indicator set
Part A: Legal indicators of scheme performance
Indicator 1: Legal coverage rate for insured persons
This indicator reflects the percentage of legally covered persons in the labourforce (that is, those who should be covered according to current legislation).
Example 1
Labour force (15–60 years): 675,464Legally covered (public employees): 90,603Legal coverage rate: 13.4 per cent
This means that, under the legislation, the scheme should cover 13.4 per cent ofthe labour force.
Indicator 2: Relative average legal replacement ratio of benefits inpayment
This indicator (average replacement ratio) is estimated by relating averagepension entitlements to the average/monthly individual earnings of a standard fullcontributor. The indicator allows analysts to assess the adequacy of benefit levelscompared with those of other national schemes or schemes in other countries.
Example 2
The pension formula envisages a 2-per cent accrual rate on revalued career-average earnings. For a beneficiary after 35 years of service (considered a fullcareer in the public service), this would result in a pension of 70 per cent ofcareer-average earnings, which may be high by international standards.
604
Financing social protection

Part B: Governance indicators
Indicator 3: Compliance rate of legally covered persons
This indicator relates to the legal coverage rate and reflects the participationof those who are theoretically eligible for coverage under the scheme.The indicator is the number of people actually contributing to the schemedivided by the number of legally covered people.
Example 3
Number of contributors: 75,164Number of legally covered: 90,603Registration rate of legally covered: 83 per cent
The less-than-100-per-cent rate may be attributable to the existence of anumber of public employers who do not register all their employees. In anycase, the figure should give rise to further enquiries.
Indicator 4: Average real replacement ratio of benefits in payments
This indicator (average replacement ratio) is estimated by dividing the averageannual/monthly individual benefit in payment by the average/monthlyindividual earnings of full contributors. The indicator allows analysts to assessthe adequacy of benefit levels. Monitored over time, it should also provideinsight into the relative income development of pensioners versus activecontributors.
Example 4
Go back to Example 2: The statistical average replacement rate for Demolandis only about 42 per cent. However, if it can be established that final averageearnings are generally twice as high as career averages, then the realreplacement rate for beneficiaries would drop from a legal rate of 70 per centto something like 35 per cent. Although this may seem low, it could largelyexplain the overall average of 42 per cent.
Indicator 5: The administrative cost ratio
This indicator is computed by dividing the total amount of administrativeexpenditure by the total amount of benefit expenditure or total insurableearnings. It can serve as an indicator of administrative efficiency. To use iteffectively we must obtain, by a benchmarking process, the same indicator fromother national and foreign schemes.
Exercise Annex
605

Example 5
Administrative cost in Demoland’s pension scheme in 2000: CU 5.5 millionTotal benefit expenditure: CU 203 millionAdministrative cost ratio (1): 2.7 per cent
This rate could be misleading, since it is likely to give an unfair portrayal ofyoung schemes with low expenditure but a heavy administrative burdenattributable to new contribution collection. Accordingly, the followingindicator might be considered as an alternative:
Total insurable earnings (compliance ratio taken into account): CU 1,318millionAdministrative cost ratio (2): 0.4 per cent
In international comparison both indicators are in a reasonable order ofmagnitude, and a priori offer no grounds for further investigation.
Indicator 6: Average age of insured persons or the demographic ratio
This variable reflects the demographic ageing of the scheme. It can serve as anearly-warning indicator for necessary future policy adjustments. The ageingprocess ought to be monitored over the years so that strategies for schemeadjustment can be introduced early. However, Demoland data provide noinformation on the average age of insured persons.
Alternatively, the demographic (dependency) ratio can be calculated (thatis, the number of beneficiaries divided by the number of active contributors).This ratio also reflects the maturity and demographic burden of the scheme.
Example 6
Average number of beneficiaries in Demoland’s pension scheme in 2000:26,575Average number of active contributors: 75,164Demographic ratio: 35.4 per cent
The demographic ratio shows that, compared with other schemes in the region,the scheme is either approaching maturity or the regulations permit overlyearly retirement, or else access to invalidity pensions may be too easy.
Indicator 7: Complaint rate
This indicator measures the number of complaints about the scheme among theinsured population. It is thus the indicator of satisfaction with the scheme’sperformance. In Demoland, however, no assessment data are available.International or national benchmarking and long-term observation are requiredto make it meaningful.
Financing social protection
606

Part C: Financing and expenditure indicators
Indicator 8: GDP ratio of expenditure
This indicator reflects the size of the scheme. It is calculated by dividing totalpension expenditure by GDP. It permits assessment of the adequacy of nationalexpenditure on civil service old-age provision, in comparison with that in othercountries.
Example 7
Expenditure on Demoland’s pension scheme in 2000 (in million CU): 210.8GDP (in million CU): 24,145GDP expenditure ratio: 0.9 per cent
Indicator 9: PAYG cost rate
This indicator reflects the contribution rate that the scheme would have to applyif all expenditure for a given year were financed out of that year’s contributions.Mathematically, it is roughly the product of the average replacement rate andthe demographic ratio. The indicator shows the total annual burden of financingthe scheme. In many mature schemes this indicator fluctuates between 20 and25 per cent. When using it to evaluate the performance of a scheme designatedfor public employees, we must bear in mind that it is sensitive to governmentemployment policy and employee hiring and dismissal.
Example 8
Expenditure on Demoland’s pension scheme in 2000 (in million CU): 210.8Insurable earnings (in million CU): 1,318PAYG cost rate: 16.0 per cent
Indicator 10: Inactivity ratio
This is the ratio of the average number of years spent receiving an old-agepension to the average number of years that retirees have contributed to thescheme. If the ratio rises above, say, 50 per cent, it indicates that the scheme israther immature, or that people are recruited too late, or are leaving too early. Itis similar to the demographic ratio but offers an easier way of explaining thereal burden to the public.
No data available.
Recommendation
We strongly recommend countering public criticism of the social protectionsystem by developing a set of indicators along the above lines for all schemes.
Exercise Annex
607

Ad hoc working groups for the major schemes should be set up and directed todeliver results within three months. Some international help should be recruitedto develop appropriate international benchmarks.
In addition, we strongly recommend developing a global indicator thatcaptures the performance of the scheme as a whole. One such indicator could bean estimate of the proportion of the poverty gap closed by the transfers of thesocial protection system. It would probably be highlighted by the media eachyear. If it is positive, we can celebrate success; if it is negative, we can use it tosolicit more resources from the Ministry of Finance.
Financing social protection
608

GLOSSARY OF TERMS
Active insured person (or contributor) A person on whose behalf at least onecontribution payment has been made to a scheme during a given period, e.g. a year.
Actuarial balance The difference between the present value of future revenue and futureexpenditure of a scheme over a given projection period.
Actuarial equilibrium The minimum level of funding in a social security scheme to bemaintained over a defined period at each point in time. The actuarial equilibrium is adiscretionary concept. Technically it is usually stated in the form of a provision in the socialsecurity law stipulating that the scheme has to maintain a certain level of funding of k timesthe annual expenditure (i.e. the funding ratio) for a certain number of years x (i.e. the periodof equilibrium).
Actuarial liability The present value of benefit entitlements accumulated under ascheme by insured persons and beneficiaries up to a given future point in time.
Annuity A financial arrangement to provide an income for a specified number of years orfor the remaining lifetime of an individual or a group of individuals out of an accumulatedlump sum. The lump sum is divided by the present value of a pension of 1 Currency Unit tobe paid during the remaining lifetime or a defined period.
Assessment of constituent capital Financial system applied to employment injurybenefits under which the annual cost of the scheme is determined as the present value of allfuture payments relative to pensions awarded during that year. Under that system, a reserveis continuously maintained equal to the present value of pensions in payment.
Asset price bubble Notion describing a situation where the level of a market index is toohigh in comparison to the value of the companies included in the index as derived by othervaluation methods. An asset price bubble is usually the result of mass speculation and endswith the implosion of the bubble.
Basic Income (BI) or citizen’s income A transfer income paid by the State to allresidents or citizens, independent of need. BI is often seen a substitute for social assistance orunemployment benefits.
Beneficiary ratio The ratio between the number of benefit recipients of a social securityscheme at a given point and the number of contributors (or insured persons).
Benefit replacement rate The ratio between the amount of an individual’s benefit(generally monthly or annual) and the amount of the individual’s previous income subject to
609

contributions, or the ratio between the average benefit in a given year and the average incomesubject to contributions in the same year.
Bond Debt instrument issued by borrowers (government, companies) promising to theholder periodical fixed interest rate payments and the repayment of the face value at the dateof maturity.
Capital market Notion traditionally referring to the market for financial claims with along-term time horizon.
Capital stock The stock of all produced and non-produced assets of an economy. Ineconomic theory, one of the two standard production factors. See Labour.
Catchment ratio The ratio between the total amount of earnings subject to the paymentof contributions and the total amount of earnings received by insured persons from gainfulemployment. Theoretically, this ratio equals 1 in case all earnings are subject to contributionpayment; it should be smaller than 1 in case of a ceiling on insurable earnings or of otherexemptions from contribution payment.
Claw-back ratio The proportion of a benefit that returns to the public budget through thetaxation of the benefit.
Cohort A group of individuals with (a set of) identical characteristics, e.g. all personsborn in the same year.
Collective financial equivalence A financing rule requiring that at any point in time thetotal present value of all expected future expenditure should be equal to the present value ofall future income of a scheme.
Combined demographic dependency ratio See Demographic ratio.
Compliance rate The ratio between the number of persons under a scheme on whosebehalf contributions are actually paid and the number of persons who are legally covered forcontribution payment by the scheme.
Contribution ceiling The minimum and/or maximum amount of individual wages that issubject to contributions to a scheme. The upper ceiling usually, though not always, reflectsthe maximum amount of earnings on which benefits are being calculated.
Contribution rate The percentage of the covered insurable earnings that is to becollected to finance the scheme.
Contributors’ ratio The ratio between the actual number of contributors and the numberof all insured persons of a scheme. See Compliance rate.
Cost rate (or PAYG cost rate) The ratio of total expenditure of a scheme to totalinsurable earnings.
Coverage rate The ratio between the total number of registered insured persons (personswith an insurance record but not necessarily active) and a suitably chosen referencepopulation, e.g. the labour force.
Crowding out Situation where expansive developments in one sphere reduce activities inanother. The traditional use of the term in macroeconomics is the hypothesis that government(deficit) spending discourages (‘‘crowds out’’) private investment.
Deadweight loss The difference between the total direct and indirect cost of a tax leviedon the taxpayer and a fictive lump-sum tax yielding the same revenue.
610
Financing social protection

Defined benefit (DB) The benefit paid in a defined-benefit scheme. It is usually basedon a formula that takes into account the individual number of insurance years and theamount of earnings during the same period. The formula-based benefit level is guaranteedto everyone meeting the entitlement conditions.
Defined-benefit scheme A scheme under which the benefit is a formula-defined amount.See Defined benefit.
Defined contribution (DC) The contribution to be paid in a defined-contribution(pension) scheme. See Defined-contribution scheme.
Defined-contribution scheme A scheme under which contributions are paid to anindividual account for each scheme member. The benefit depends on the account balance atthe date of benefit withdrawal, i.e. on the amounts contributed, the interest earned andaccumulated in the account as well as the administrative costs to be deducted.
Deflator In national accounting the ratio between a ‘‘nominal’’ and a ‘‘real’’ variable (e.g.private consumption in current prices versus constant prices of a base year). Measures theinflation contents of the nominal variable. Constructing the basket of goods and servicesunderlying a deflator is one of the core theoretical problems of measuring ‘‘real growth’’ of aneconomy, as the composition of the basket is itself a function of price developments. See Priceindex.
Demographic ratio The demographic ratio is a statistical indicator used in demographicanalyses.
pop ¼ popYþ popAþ popR
is assumed to be a breakdown of the population pop into the sub-groups youth (popY),
actives ( popA) and retireds ( popR), popx,t denoting the number of persons aged x (x ¼ 0, 1,
2,. . .) in period t; then youth may be calculated as:
ðaÞ popYt ¼Xx1
x¼0
popx;t; x1 < around 15 to 20
actives as:
ðbÞ popAt ¼Xx2
x¼x1þ1
popx;t; x2 ¼ around 60 to 65
retireds as:
ðcÞ popRt ¼Xx3
x¼x2þ1
popx;t; x3 usually ¼ 100 ð‘‘and over’’Þ
This breakdown allows defining three widely used demographic ratios:
ðdÞ Youth ratio drYt ¼popYt
popAt
611
Glossary of terms

ðeÞ Old-age ratio drRt ¼popRt
popAt
ðfÞ Total ratio drTt ¼popYt þ popRt
popAt
When multiplied by 100, (d) can be interpreted as the number of youths per 100 actives, (e) as
the number of elderly persons per 100 actives and (f) as the total number of dependants per
100 actives. See Transfer dependency ratio.
Density of contributions The ratio between the number of contributions actually paidduring a period and the maximum potential number of contributions that can be paid duringthe same period.
Domestic income Aggregate income produced by the inhabitants of a country within thecountry’s boundaries, as opposed to ‘‘national’’ income, which is produced by the citizens of acountry irrespective of whether the production takes place within or outside the country’sboundaries. For example, the earned income of a Belgian working in Luxembourg increases thedomestic income of Luxembourg but the national income of Belgium. See National income.
Economically active population Collective term comprising all persons of either sexwho furnish the supply of labour for the production of economic goods and services asdefined by the United Nations System of National Accounts (SNA).
Economic growth Change over time of the income produced by an economy. Usuallyapplied to ‘‘real’’ GDP, i.e. nominal GDP in constant prices of a base year. It can be linear,exponential, logistic or otherwise. Standard policy paradigm claims (exponential) economicgrowth to be necessary for reducing poverty and solving labour market problems nationallyand worldwide. This view has been challenged for environmental and other reasons.
Eligibility conditions The set of legally defined conditions which stipulate if and when aperson has the right to claim a benefit.
Emerging markets Notion characterizing the financial and goods and services marketsin fast developing and transition countries, comprising notably the stock exchanges in LatinAmerica, South-East Asia and Eastern Europe.
Employed persons All persons above a specified age who, during a specified referenceperiod, were in the following categories:
. paid employment
. at work (persons who during the reference period performed some work for wage or
salary, in cash or in kind); or
. with a job but not at work (persons who, having already worked in their present job,
were temporarily not at work during the reference period but had a formal attachment to
their job).
Equity Share in a business. Most often used as a synonym for common stock of apublicly traded company.
612
Financing social protection

European System of Integrated Social Protection Statistics (ESSPROS) A harmonizedframework developed to present in a comparable manner national statistical data on socialprotection receipts and expenditure, as defined by commonly agreed and uniform criteria.
Excess burden See Deadweight loss.
Financial assets Financial assets are means of payment and financial claims, includingeconomic assets close to financial claims in nature. They comprise all items open to trade onfinancial markets, especially monetary gold, special drawing rights, currency, shares, bondsand other instruments.
Financial equilibrium A scheme is in financial equilibrium if the present value of allfuture expenditure is equal to the present value of all future income of the scheme plus theinitial reserve at a given point in time.
Financial equivalence (collective) A rule requiring that at any point in time the totalpresent value of all expected future expenditure of the social protection scheme should beequal to the present value of all future income of the scheme (plus the initial reserve at therespective point in time, if applicable).
Financial instruments Summary expression for all categories of financial assets tradedon financial markets. One normally distinguishes between equities, debt instruments,entitlements (rights), options, futures and other (miscellaneous) instruments. These categoriescan further be broken down into groups (e.g. ‘‘equity’’ is made of shares, preferred shares,others) and attributes (e.g. ‘‘equity’’ can have the following attributes: voting right, ownership,transfer restrictions, others).
Financial investments Investments in instruments traded on the financial markets, e.g.buying shares or bonds, putting money into a savings account or leaving money in a standardgiro-deposit.
Financial market The formal or virtual meeting point between units enjoying a financialsurplus (‘‘surplus units’’) and units experiencing a financial deficit (‘‘deficit units’’).
Financial solidarity rule Rule requiring that contributions or taxes for the financing ofsocial benefits be charged on the basis of the members’ ability to pay, regardless of their risksor circumstances (e.g. health impairments or having eligible dependants). In social insuranceschemes this principle is generally embodied in uniform contribution rates charged as a fixedpercentage of individual insurable earnings. In the case of tax-financed benefits, the ruleapplies as long as the system of income taxation is progressive.
Financing system Systemic arrangement for raising the resources necessary to meet thefinancial obligations of a scheme. A financing system is defined as a set of legal provisionsaimed at ensuring that at each point of a scheme’s life cycle the amount of expenditure ismatched by equal and available financial resources – in other words, that the scheme is infinancial equilibrium.
Fixed assets See Produced assets and Non-produced assets.
Formal sector Economic sector where inhabitants’ socio-economic activities areregulated and protected by formal societal institutions. In its functioning the formal sectoris often closely interlinked with the informal sector. The vast majority of the world’spopulation is excluded from the formal sector.
Full funding Financial system under which the objective is to raise reserves equal to theamount of scheme liabilities or the annual benefit expenditure.
613
Glossary of terms

Funding ratio The ratio of the amount of reserves to the amount of actuarial liabilityunder a scheme.
General average premium (GAP) The constant contribution rate applicable infinitely,theoretically guaranteeing that scheme expenditure can always be covered by thecontributions collected and the funds accumulated in the reserve. It is calculated by dividingthe present value of all future benefits (minus the reserve existing at the valuation date) bythe present value of all future contributory earnings.
Gini coefficient A measure of inequality in income distribution, it expresses the size of thearea between a theoretical perfect equality Lorenz curve (straight line) and the real concaveLorenz curve of a country or another entity to the size of the area under the equality line.
Governance The sum of all consultative and decision-making processes, institutionalarrangements and managerial and administrative action by which social protection policiesare designed, agreed upon, implemented and supervised. The definition encompasses the firstblueprints for a social protection system in government or other institutions, the nationalconsultation process, the legal enactment and finally the managerial and administrativeimplementation, as well as the national and lower-level supervision of the performance ofindividual social protection schemes.
Grandfather clause A provision exempting persons or other entities already engaged inan activity from new rules or legislation affecting that activity, or granting special privilegeswhen including such groups into new legislative provisions. A typical example is specialcredits (fictitious insurance years) granted to older workers when a new benefit system isbeing introduced in order to help them fulfil the benefit conditions.
Gross domestic product (GDP) An aggregate measure of the production of goods andservices within the boundaries of a country. Broadly, the amount of gross income availablefor distribution to the production factors labour and capital, which, after taxation, constitutesthe basis for redistributive state interventions.
Inactive insured person A person who is registered under a scheme but has made nocontribution during a given period.
Individual equivalence A financing rule stipulating that the present value of thecontributions of each individual contributor under a scheme should equal the present value ofall expected benefits (plus administrative and other costs related to benefit payment).
Inequality gap The gap between the straight equality line and the ‘‘inequality lines’’ in aLorenz curve diagram.
Inequality target efficiency ratio A ratio that expresses the degree to which aredistributive measure reduces the inequality gap.
Informal sector Economic sector where inhabitants’ socio-economic activities are notregulated and protected by formal societal institutions. In its functioning the informal sector isoften closely interlinked with the formal sector. The vast majority of the world’s population ispart of the informal sector.
Initial public offering (IPO) First (initial) issuance of a financial instrument on theprimary financial market, either by companies (equity, debt instruments) or by the State (debtinstruments).
Insider trading Any trade on formal financial markets, especially stock exchanges,triggered by actually or putatively advantageous information accessible to traders only
614
Financing social protection

because of their professional involvement in the functioning of the market (‘‘floor members’’and others executing the market functions). Usually strictly forbidden as such trade affectsthe true market price of financial assets, puts the general public trading on the market at adisadvantage, or produces other distortions undermining the business of companies and thecredibility of the market.
Insurable earnings The wages received for services rendered to an employer and subjectto the payment of contributions to a social security scheme. They may or may not includeadditional irregular income components awarded to an insured person. See Contributionceiling.
Insurance credits The number of contributions or periods of service that have been paidon behalf of an insured person or credited to that person since his/her entry into the scheme.
Insured person A person who is registered under a social security scheme.
Intergenerational equity Notion non-specifically requiring a ‘‘fair’’ distribution of‘‘burdens’’ between generations. One example is the requirement that members of successivegenerations pay the same share of their disposable income during their active life in order toearn equal benefit entitlements (in terms of replacement rates). Usually regarded as an elementof fairness in the (legal) design of pension schemes and long-term care schemes.
Intrinsic value Present value of all future net profits of a firm where the chosen discountrate is the rate of return required by an investor.
Labour In economic theory, one of the two standard production factors. In statisticalterms, it can be the number of members of the labour force or the volume of hours worked.See Capital stock.
Labour force See Economically active population.
Labour income share Ratio of the total amount of remuneration paid to employees byemployers to the total amount of aggregate income allocated to the production factors labourand capital. Remuneration includes gross wages, all types of employer-sponsored in-kindincome of employees, as well as employer social security contributions. The labour incomeshare and the capital income share by definition add up to 1.
Laffer curve (or modified Laffer curve) Describes the relationship between the amountof taxes collected and the GDP tax ratio.
Liquidity ratio A financial indicator defined as the ratio of income and expenditure. Theratio reflects the financial situation of a scheme, which changes as it matures or for economicand labour market reasons. In funded schemes the development of the ratio over time mayserve as an ‘‘early warning’’ indicator as it has implications for the structure of an investmentportfolio, indicating how much of the portfolio must be kept or turned liquid in order tomaintain regular payment of benefits.
Logistical maturation curve A tilted s-shaped curve with a horizontal asymptotefollowing a logistical formula that can serve as a mathematical model for the maturation of anational social protection scheme or a social security scheme.
Lorenz curve Graphical presentation of income inequality among a group of persons.Plots the cumulative income of a group of persons lined up from ‘‘poorest’’ to ‘‘richest’’. Inpractice, the application of the Lorenz curve often fails as data on personal income distributionare rare.
615
Glossary of terms

Machine tax Proposal to replace the usual assessment base for employers’ social securitycontributions (gross wages) by an assessment base explicitly representing the income allocatedto the production factor capital (‘‘machines’’).
Market index Statistical measure constructed in order to reflect the development overtime of the value of a basket of shares or other financial instruments. The most prominentindices are those maintained by the principal international stock exchanges (New York,London, Tokyo, Frankfurt). A company’s goodwill is enhanced if its shares are included in amarket index, e.g. the Dow Jones. However, financial institutions (e.g. banks) maintain manyother indices in order to accommodate special financial investment preferences of theircustomers.
Market capitalization Price of the stock of a company multiplied by the number ofshares outstanding.
Maturity State reached by social protection schemes when two conditions are fulfilled:First, stable or almost stable relationships emerge with regard to the number of personscovered as a proportion of the total active population and the number of persons receivingbenefits as a proportion of the total inactive population. This state is called demographicmaturity. Second, a relative stability emerges in the relationship between the average amountof benefits and the average income subject to contributions. This state, which is achieved orapproached when all pensioners have had a full career in the scheme average contributionperiod, is called benefit maturity.
Money market Notion traditionally referring to the short-term cash/currency markets,including financial claims characterized as ‘‘near money’’. Major players are banks lookingfor liquidity in order to cover short-term liquidity problems.
Moral hazard A risk to private and social insurance resulting from uncertainty about thehonesty of the insured, or the risk that a contract/legislation will change the behaviour of oneor all of the parties involved.
National income Aggregate income produced by the citizens of a country irrespective ofwhether the production takes place within or outside the country’s boundaries, as opposed to‘‘domestic’’ income, which is produced by the inhabitants of a country within the country’sboundaries. For example, the earned income of a Belgian working in Luxembourg increasesthe national income of Belgium but the domestic income of Luxembourg. See Domesticincome.
New entrant A person who was registered for the first time with a scheme as insuredperson.
Non-produced assets Non-financial assets comprising tangible non-produced assets(land underlying buildings and structures, land under cultivation, recreational and other landand associated surface water, coal, oil and natural gas and mineral and non-mineral reserves,biological and water resources), and intangible non-produced assets (patented entities, leasesand other transferable contracts, purchased goodwill and other intangible assets). SeeProduced assets.
Notional defined-contribution (NDC) scheme Non-funded scheme which uses theformula of a defined-contribution scheme as a benefit formula without accumulating theamount of reserves actually required to back up all entitlements.
Old-age dependency ratio See Demographic ratio.
616
Financing social protection

Pay-as-you-go (PAYG) rate The ratio of total annual expenditure of a scheme to theannual sum of insurable earnings underlying the scheme. It reflects the contribution rate to becharged annually if a scheme were financed on a pure annual assessment (PAYG) basis.
Performance indicators Attempt to measure the performance of the administration,benefit delivery or financial performance of a social transfer scheme or system in quantitativeterms, either in absolute terms or by comparison to defined benchmarks.
Plowback rate The share of profits not paid out as dividends but reinvested in a company.
Poverty gap A measure of the ‘‘depth’’ or ‘‘intensity’’ of poverty, defined as the averagedifference between the income of poor people and the poverty line (see below). Theaggregate poverty gap is the sum of all these differences in a country. That amount isgenerally related to GDP (the relative aggregate poverty gap).
Poverty line The level of income defining the borderline between the groups of ‘‘poor’’and ‘‘non-poor’’ in a society. If a person/household has less than this amount at his/itsdisposal, the person/household is defined as being poor. There are different (absolute, relativeand subjective) approaches in estimating the poverty line.
Poverty rate (or Poverty headcount index) The proportion of people in a group or apopulation with income under the poverty line.
Poverty target efficiency ratio Describes which proportion of a total expenditure of acertain type of transfer reduces the aggregate poverty gap.
Price distortion The result of any exogenous interference with the functioning ofmarkets (e.g. goods and services markets, labour markets, financial markets) leading to anon-temporary significant deviation from the market-clearing price (i.e. the price that wouldexist without such intervention).
Price-earnings ratio The ratio of a stock’s price to its earnings (dividends) per share.
Price index A price index is an average of the proportionate changes in the prices of aspecified set of goods and services between two points (periods) in time, 0 and t. The twomost commonly used indices are the Laspeyres and the Paasche indices. Both are defined asweighted averages of price relatives, the weights being the values of the individual goods andservices in the ‘‘base’’ period 0 (Laspeyres) or the ‘‘current’’ period t (Paasche) compared. Aprice relative is the ratio of the price of a good or service in t to the price of the same good orservice in period 0. See: Deflator.
Primary market Financial market on which financial instruments are issued for the firsttime. Main function is to raise cash for deficit units (companies, State). See Initial publicofferings.
Produced assets Non-financial assets comprising tangible fixed assets (dwellings, non-residential buildings and other structures, transport equipment and other machinery, livestock,vineyards, orchards and other plantations of trees), intangible fixed assets (mineral exploration,computer software, entertainment, literary or artistic originals and other intangibles),inventories (materials and supplies, work in progress, finished goods and goods for resale)and valuables (precious metals and stones, antiques and other art objects and other valuables).See Non-produced assets.
Production factor In economic theory, a factor producing (in combination with others) aneconomic entity’s output. On the domestic level the production factor can be the labour force or
617
Glossary of terms

the capital stock (of produced and non-produced assets) which – combined via a productionfunction – produce domestic income (for example, GDP). In order to explain long-term growthpatterns other production factors have been distinguished in economic theory, among themmost prominently exogenous and endogenous ‘‘technological progress’’.
Productivity Output produced per unit of factor-input. Economic theory distinguishesbetween labour productivity, capital productivity and total factor productivity. A simpleapproach widely used for measuring labour productivity on a macroeconomic level isdividing real GDP by the total number of employed. The measurement of capitalproductivity is often hampered by the absence of capital stock statistics (which requiremaintaining investment-related and other data over extremely long periods).
Provident fund A fully funded, defined-contribution scheme in which funds aremanaged by a public entity.
Portfolio Composition of a basket of financial assets.
Public pension scheme Pension scheme administered by a public entity.
Recognition bond A government-issued bond recognizing the rights acquired by anindividual contributor under a social security scheme that has been closed or transformed.Recognition bonds have been used to finance the transition costs of changing a defined-benefit PAYG social security pension scheme into a funded defined-contribution scheme.The bond value depends on the provisions of the closed scheme and the interest rate applied.Liquidation of the bond usually takes place on the date of retirement.
Re-entrant A person resuming payment of contributions to a scheme after a break.
Reference earnings Earnings specified by definition and amount, used in benefitformulae. Reference earnings usually refer to the average earnings over a specified periodpreceding the payment of the benefit.
Replacement rate Ratio of the amount of an (average/individual) benefit in period t tothe (average/individual) amount of the insurable earnings in the same or any other suitablychosen period. The rate may be calculated gross or net of taxation.
Reservation wage The lowest amount of wages at which a benefit recipient is ready togive up his/her benefit and return to work.
Reserve Net result of the accumulation of contributions, plus investment earnings, plusother revenue, less benefit payments, less administrative expenses, less other expenditure,under a scheme.
Reserve ratio Ratio of the reserve at a given date to the amount of expenditure of a schemeduring the previous period.
Risk-free asset In theory, an asset that is guaranteed a rate of return. In practice, short-term government bonds are often considered risk-free.
Salary scale Table of factors showing the evolution of the salary by age of an individualover his/her career.
Savings rate That share of disposable income not spent on consumption.
Scaled premium system Financial system for pensions under which contribution rates areincreased throughout the life cycle of a pension scheme on a ‘‘step-by-step’’ basis (where theduration of the individual step is called the period of equilibrium). In practice the contribution
618
Financing social protection

rate is calculated for a defined period of years, often ranging from ten to 25 years, with theobjective of equating, at the end of the period, the income from contributions and theinvestment income to the expenditure on benefits and administration.
Secondary market Market on which financial instruments are being traded afterissuance on the primary market. In terms of turnover/capitalization the secondary marketusually largely dominates the primary market.
Social accounting system (SAS) Methodologically consistent compilation of therevenues and expenditures of a country’s social protection system. Used in social budgeting.See ESSPROS.
Social assistance intervention line (SAIL) Graphical presentation of the minimumincome guaranteed by the State to each citizen through the social assistance scheme. Usuallylower than the poverty line.
Social expenditure Cash and in-kind transfers paid by state or public organizations oragreed upon through collective bargaining on ‘‘social’’ grounds. Transfers include cashbenefits such as pensions, employment injury benefits, short-term cash benefits (sickness andmaternity benefits, unemployment benefits) as well as benefits in kind such as health servicesand basic social assistance. Tax exemptions for social reasons are usually considered part ofsocial expenditure; however, estimating the amount of tax forgone is difficult.
Social expenditure ratio (SER) Total social expenditure in a country expressed as apercentage of GDP.
Socially responsible investment (SRI) Financial investment where social, environ-mental and/or ethical considerations are taken into account in the selection, retention andrealization of investment, and the responsible use of rights (such as voting rights) attaching toinvestments.
Social Protection Expenditure and Performance Review (SPER) A report providingdetailed information on the performance of a national social protection system as well as on theextent of coverage and exclusion from social protection. In an internationally comparable way,a SPER provides information about the structure and level of total social expenditure andestablishes indicators of system performance with respect to its effectiveness, efficiency andthe adequacy of benefit levels.
Social security All cash and in-kind social transfers that are organized by state orparastatal organizations or are agreed upon through collective bargaining processes. Benefitsinclude cash transfers such as pensions, employment injury benefits, short-term cash benefits(sickness and maternity benefits, unemployment benefits) as well as benefits in kind such ashealth services.
Stock exchange A formal financial market most prominently trading equity (shares) andother financial instruments issued by companies.
System dependency ratio Ratio defined as the number of beneficiaries over the numberof employed contributors in a given system. In pension schemes especially this ratio must notbe confused with the old-age dependency ratio calculated on overall populationdevelopments (See Demographic ratio). System dependency ratios and population-baseddependency ratios may differ significantly.
Take-up ratio The ratio of persons actually receiving benefits to those who are legallyentitled to them.
619
Glossary of terms

Tangible assets See Produced assets and Non-produced assets.
Tangible investments Investments in the tangible capital stock of an economy.
Terminal funding Financial system under which a premium equal to the present value ofa pension is paid at the time the pension starts. The premium is set aside as a reserve for theguarantee of future benefit payments.
Time horizon Starting from the last observed statistical values (base period), themaximum number of periods up to which the results of a projection are accessible tomeaningful interpretation. The time horizon varies with the type(s) of scheme(s) and/oreconomy under consideration.
Tobin’s ‘‘q’’ The ratio between the market value of stock-listed companies and theirreplacement costs. Alternatively, the ratio between the change in the value of an enterpriseand the underlying net investment. It shows how an additional currency unit spent on capitalaffects the present value of all future profits. Under this view, q may be interpreted as themarket value of one unit of capital; thus, as long as q41 there is an incentive to invest(q51: to de-invest). Named after James Tobin, who argued that in reality investment shouldbe positively correlated with q. Empirical evidence is inconclusive.
Tobin tax A tax proposed by James Tobin to be levied on short-term foreign ex-change transactions in order to curb exchange-rate speculation which harms (national)economies.
Transfer dependency ratio The ratio of people with no or insufficient primary income– children, unemployed, disabled, part-time and casual workers, and other actives andnon-actives at and above working age – to the number of primary income earners.See Demographic ratio.
Transition countries Countries moving from centrally planned to market-orientedeconomies.
Trickle-down effect The indirect income effect of transfers when individuals other thanthe formal recipient of a transfer benefit from a social transfer (for example, if grandparentsreceiving a pension finance the schooling of their grandchildren).
Unemployed persons All persons above a specified age who, during a specifiedreference period, were:
. without work (not in paid employment or self-employment);
. currently available for work (that is, were available for paid employment or self-
employment); or
. seeking work (that is, had taken specific steps in a specified recent period to seek paid
employment or self-employment). The specific work-seeking steps may include
registration at a public or private employment exchange; application to employers;
checking at worksites, farms, factory gates, market or other assembly places; placing or
answering newspaper advertisements; seeking assistance offriends or relatives; looking for
land, building, machinery or equipment to establish own enterprise; arranging for financial
resources; applying for permits and licences, etc.
Unfunded liability Actuarial liability less the amount of the accumulated reserve.
620
Financing social protection

Unit cost The cost of a unit of service or good in a given category of services (forexample, the cost of a ‘‘hospital day’’ per patient).
Utilization frequency The number of cases of treatment or units of care per protectedperson in a given category of social services.
Universal benefits (transfers) Tax-financed benefits or transfers that are paid to allcitizens or inhabitants falling into a specific category of the population (for example, familieswith children or people over a certain age).
Wage share of GDP Ratio between the total amount of ‘‘remuneration paid toemployees by resident employers’’ (SNA definition) in a given year and the total amount ofGDP. Remuneration includes wages, all types of non-wage cash benefits, as well as socialsecurity contributions.
621
Glossary of terms

1BIBLIOGRAPHY
Aaron, H.J. 1982. Economic effects of social security. Studies of Government Finance
(Washington, DC, Brookings Institution Press).
Aarts, L.J.M.; de Jong, P.H. 1992. Economic aspects of disability behaviour (Amsterdam,
North Holland Publishing Cy).
—. 1997. ‘‘Privatization of social insurance and welfare state efficiency: Evidence from the
Netherlands and the United States’’, Paper prepared for the international conference on
‘‘Institutions, markets and (economic) performance’’, Utrecht, 11–12 Dec.
Adema, W. 1999. Net social expenditure, Labour Market and Social Policy Occasional
Papers, No. 39 (Paris, OECD).
—. 2001. Net social expenditure, Labour Market and Social Policy Occasional Papers,
No. 52 (Paris, OECD, 2nd ed.).
Aghion, P.; Bolton, P. 1992. ‘‘Distribution and growth in models of imperfect capital
markets’’, in European Economic Review, Vol. 36, Issue 2–3, pp. 603–611.
Aghion, P.; Tirole, J. 1997. ‘‘Formal and real authority in organizations’’, in Journal of
Political Economy, Vol. 105, No. 1, pp. 1–29.
Akerlof, G.A. 1970. ‘‘The market for ‘lemons’: Qualitative uncertainty and the market
mechanism’’, in Quarterly Journal of Economics, Vol. 84, No. 3, pp. 488–500.
Albert, M. 1993. Capitalisme contre capitalisme (Paris, Ed. Du Seuil).
Alesina, A.; Perotti R. 1997. ‘‘The welfare state and competitiveness’’, in American
Economic Review, Vol. 87, No. 5, pp. 921–939.
Alesina, A.; Rodrik D. 1994. ‘‘Distributive politics and economic growth’’, in Quarterly
Journal of Economics, May 1994, Vol. 109, No. 2, pp. 465–489.
Allen, R.; Tommasi, D. (eds.). 2001. Managing public expenditure: A reference book for
transition countries (Paris, OECD).
Antolin, P.; Scarpetta, S. 1998. Microeconometric analysis of the retirement decision:
Germany, Economics Department Working Papers No. 204 (Paris, OECD).
622

Arenas de Mesa, A.; Benavides Salazar, P. 2003. Proteccion social en Chile.
Financiamiento, cobertura y desempeno 1990–2000 (Santiago, ILO).
Arents, M; Cluitman, M.M.; van der Ende, M.A. 2000. Benefit dependency ratios: An
analysis of nine European countries, Japan and the US: final report (Rotterdam,
Netherlands Economic Institute).
Assemblee Nationale francaise. 2000. Projet de loi de finances pour 2001 (Paris).
Atkinson, A.B. 1995a. ‘‘The welfare state and economic performance’’, in National Tax
Journal, Vol. 48, No. 2, pp. 171–198.
—. 1995b. ‘‘Is the welfare state necessarily an obstacle to economic growth?’’ in European
Economic Review, Vol. 39, Issue 3–4, pp. 723–730.
—. 1995c. Public economics in action: The basic income/flat tax proposal, The Lindahl
Lectures (Oxford, Clarendon Press).
—. 1995d. The economics of inequality (Oxford, Clarendon Press, 2nd ed.).
—. 1997. ‘‘Does social protection jeopardize European competitiveness?’’, in Bulletin
Luxembourgeois des Questions Sociales, pp. 19–28.
Atkinson, A.B.; Micklewright, J. 1991. ‘‘Unemployment compensation and labour market
transitions: A critical review’’, in Journal of Economic Literature, Vol. XXIX, No. 4,
pp. 1679–1727.
Atkinson, A.B.; Rainwater, L.; Smeeding, T.M. 1995. Income distribution in OECD
countries: Evidence from the Luxembourg Income Study, Social Policy Studies, No. 18
(Paris, OECD).
Atkinson, A.B.; Stiglitz, J.E. 1980. Lectures on public economics (New York, McGraw-Hill).
Attac (Association for the taxation of financial transactions for the aid of citizens) website:
www.attac.org.
Auer, P. 2000. Employment revival in Europe: Labour market success in Austria, Denmark,
Ireland and the Netherlands (Geneva, ILO).
Auerbach, A.J.; Kotlikoff, L.J.; Leibfritz, W. (eds.). 1999. Generational accounting around
the world, A National Bureau of Economic Research Project Report (Chicago, The
University of Chicago Press).
Aylward, A.; Glen, J.D. 1999. Primary securities markets: Cross country findings, IFC
International Finance Corporation Discussion Paper No. 39 (Washington, DC, World
Bank).
Bailey, C. 1997a. Coverage under social security pension schemes (Geneva, ILO).
—. 1997b. Governance issues, An operational framework for pension reform (Geneva,
ILO).
Baker, D.; Kar, D. 2002. Defined contributions from workers, Guaranteed benefits for
bankers: The World Bank’s approach to social security reform, CEPR Briefing Paper, July
2002 (Washington, DC, Centre for Economic Research and Policy).
623
Bibliography

Barr, N. 1989. ‘‘Social insurance as an efficiency device’’, in Journal of Public Policy 9,
pp. 59–82.
—. 1992. ‘‘Economic theory and the welfare state: A survey and interpretation’’, in Journal
of Economic Literature, Vol. XXX, No. 2, pp. 741–803.
—. 1993. The economics of the welfare state (London, Weidenfeld and Nicolson, 2nd ed.).
—. 2000. Reforming pensions: Myths, truths and policy choices, Working Paper of the
International Monetary Fund WP/00/139 (Washington, DC, IMF).
Barrientos, A.; Lloyd-Sherlock, P. 2002. ‘‘Non-contributory pensions and social protection’’,
in ILO: A Global Social Trust network: Investing in the world’s social future, Report and
documentation of a feasibility study (Geneva); and in ILO: Issues in Social Protection,
Discussion Paper No. 12 (Geneva, ILO).
Barro, R.J.; Sala-i-Martin, X. 1995. Economic growth (New York, McGraw-Hill).
Baumol, W.J. 1967. ‘‘Macroeconomics of unbalanced growth: The anatomy of urban crisis’’,
in American Economic Review, Vol. LVII, No. 3, pp. 415–26.
Beattie, R.; McGillivray, W. 1995. ‘‘A risky strategy: Reflections on the World Bank report
Averting the old age crisis’’, in International Social Security Review (Geneva, ISSA),
Vol. 48, No. 3–4, pp. 5–22.
Benabou, R. 1996. Inequality and growth, Luxembourg Income Study Working Papers,
No. 142 (Luxembourg).
Bennett, S.; Creese, A.; Monasch, R. 1998. Health insurance schemes for people outside
formal sector employment, Current concerns, ARA Paper No. 16, WHO/ARA/CC/98.1
(Geneva, WHO).
Besharov, D.J. 1998. ‘‘Social welfare’s twin dilemmas: Universalism versus targeting and
support versus dependency’’, in ISSA, International Research Conference on social secur-
ity, Summing up the evidence: The impact of incentives and targeting in social security,
Conference volume (Jerusalem), January.
Blank, R.M. 1999. When can public policy makers rely on private markets? The effective
provision of social services, NBER Working Paper No. 7099 (Cambridge, MA, National
Bureau of Economic Research) and in Economic Journal (2000), Vol. 110, Issue 462,
pp. 34–49.
Blondal, S.; Scarpetta, S. 1998. The retirement decision in OECD countries, Economics
Department Working Papers No. 202 (Paris, OECD).
Blundell, R.W. 1995. The impact of taxation on labour force participation and labour
supply, The OECD Jobs Study Working Papers Series, No. 8 (Paris, OECD).
Bodie, Z.; Kane A.; Marcus, A.J. 1996. Investments (Boston, MA, Irwin McGraw-Hill,
3rd ed.).
Bonnel, R. 2000. HIV/AIDS: Does it increase or decrease growth in Africa?, preliminary
version (Washington, DC, World Bank).
624
Financing social protection

Bonilla Garcia, A.; Gruat, J.-V. 2003. Social protection: A life cycle continuum investment
for social justice, poverty reduction and development, draft (Geneva, ILO).
Borjas, G.J. 1995. ‘‘Ethnicity, neighborhoods, and human-capital externalities’’, in American
Economic Review, Vol. 85, No. 3, pp. 365–390.
Bovenberg, A.L. 2000. ‘‘On the cutting edge between policy and academia: Challenges for
public economists’’, in De Economist, Vol. 148, No. 3, pp. 295–329.
Bovenberg, A.L.; ter Rele, H. 1999. ‘‘Generational accounts for the Netherlands: An update’’,
in CPB Report 1999/3 (The Hague), pp. 19–25.
Bovenberg, A.L.; Teulings, C.N. 1999. ‘‘Op zoek naar de grenzen van de staat: publieke
en private verantwoordelijkheden tussen contract en eigendomsrecht’’, in: W. Derksen
et al. (eds.), Over publieke en private verantwoordelijkheden, WRR (Scientific
Council for Government Policy) Voorstudies en Achtergronden, V105 (The Hague,
Sdu publishers).
Bovenberg, A.L.; van Dalen, H.P.; Teulings, C.N. 2003. De Calculus van het Publieke
Belang (the Calculus of Public Interest), unpublished report commissioned by the Dutch
Ministries of Economic Affairs and Finance (The Hague).
Brandolini, A.; Rossi, N. 1996. Income distribution and sustainable growth in Industrial
Countries, Luxembourg Income Study Working Papers, No. 130 (Luxembourg).
Brown, R.L. 2002. Security for social security: Is pre-funding the answer?, mimeo
(University of Waterloo).
Brucker, H. 2002. ‘‘Can international migration solve the problems of European labour
markets?’’ in UNECE (2002): Economic Survey of Europe, No. 2 (Geneva).
Burroughs, E.B. 2001. Investment policy guidebook for trustees, International Foundation of
Employee Benefit Plans (Brookfield, WI, 4th ed.).
Burtless, G. 2000. ‘‘How would financial risk affect retirement income under individual
accounts?’’, in Issue in brief, No. 5, Oct. (Boston, MA, Center for Retirement Research).
Calmfors, L. 1993. Centralisation of wage bargaining and macroeconomic performance:
A survey, OECD Economic Studies, No. 21 (OECD, Paris), pp. 161–191.
Calmfors, L.; Driffill, J. 1988. ‘‘Bargaining structure, corporatism and macroeconomic
performance’’, in Economic Policy, 6 (Apr. 1988), pp. 13–61.
Carey, D.; Tchilinguirian, H. 2000. Average effective tax rates on capital, labour and
consumption, Economics Department Working Papers No. 258 (Paris, OECD).
Carling, K.; Edin, P.A.; Harkman, A.; Holmlund B. 1996. ‘‘Unemployment duration,
unemployment benefits and labor market programs in Sweden’’, in Journal of Public
Economics, Vol. 59, Issue 3, pp. 313–334.
Catalan, M.; Impavido G.; Musalem, A.R. 2000. Contractual savings or stock
markets development: Which leads? The World Bank, Financial Sector Development
Department (Washington, DC, World Bank).
625
Bibliography

Central Plan Bureau (CPB). 1991. Scanning the future, CPB Netherlands Bureau for
Economic Policy Analysis (The Hague, Sdu publishers)
Chlon, A.; Gora, M.; Rutkowski, M. 1999. Shaping pension reform in Poland: Security
through diversity, Social Protection Discussion Papers Series No. 9923 (Washington, DC,
World Bank).
Cichon, M. 1996. ‘‘The ageing debate in social security: Barking up the wrong tree?’’ in
Protecting retirement incomes: Options for reform, Studies and Research No. 37 (Geneva,
ISSA), pp. 83–99.
—. 1997a. ‘‘Can Europe afford the future financing of the welfare states?’’ in A. Bosco and
M. Hutsebaut (eds.), Social Protection in Europe: Facing up to changes and challenges,
ETUC-ETUI Conference, Brussels 7–8 November 1996 (Brussels, ETUI), pp. 79–108.
—. 1997b. Are there better ways to cut and share the cake? The European welfare states at
the crossroads, Issues in Social Protection, Discussion Paper No. 3 (Geneva, ILO).
—. 1999a. ‘‘Notional defined-contribution schemes: Old wine in new bottles?’’, in
International Social Security Review (Geneva, ISSA), Vol. 52, No. 4, pp. 87–105.
—. 1999b. In the eye of the storm: The Russian social protection system amidst multiple
crises, mimeo (Geneva, ILO).
Cichon, M.; Hagemejer K. 1996. ‘‘Social protection expenditure: A review of macro-
economic issues’’, in W. van Ginneken (ed.): Occasional Papers on Social Security,
Finding the balance: Financing the coverage of social protection in Europe (Geneva,
ILO/ISSA).
Cichon, M.; Pal, K. 1997. Reflections on lessons learned: Financing old age, invalidity and
survivors’ benefits in Anglophone Africa (Geneva, ILO).
Cichon, M; Plamondon, P. 2001. Assessing the impact of AIDS on social security pension
schemes in developing countries, Paper presented at the 27th General Assembly of the
International Social Security Association, Stockholm 9–15 Sep. 2001.
Cichon, M.; Samuel, L. 1995. Making social protection work. The challenge of tripartism in
social governance for countries in transition (Budapest, ILO; Nicosia, Ministry of Labour
and Social Insurance).
Cichon, M.; Newbrander,W.; Yamabana, H.; Weber, A.; Normand, C.; Dror, D.; Preker, A.
1999. Modelling in health care finance: A compendium of quantitative techniques for
health care financing, Quantitative Methods in Social Protection Series (Geneva, ILO/
ISSA).
Cichon, M.; Hagemejer, K.; Scholz, W. 2001. ‘‘Social budgeting in transition economies’’,
in International Social Security Review (Geneva, ISSA), Vol. 54, No. 2–3, pp. 191–215.
Cichon, M.; Knop, R.; Leger, F. 2003a. White or Prosperous: How much migration does the
ageing European Union need to maintain its standard of living in the twenty-first
century?, Paper presented at the 4th International Research Conference on Social
Security, ‘‘Social security in a long-life society’’, Antwerp, Belgium, May 2003.
626
Financing social protection

Cichon, M.; Normand, C.; Leger, F. 2003b. Comments on the planned National Health
Insurance system in Ghana, Project discussion paper, mimeo (Geneva, ILO).
Cichon, M., Scholz, W. Hagemejer, K. 2003c. Remaining in doubt: The long-term financial
and fiscal stability of fully funded pension schemes in ageing societies, Paper first
presented at a workshop in Geneva, October 2003.
Citro, C.F.; Michael, R.T. (eds.). 1995. Measuring poverty: A new approach (Washington,
DC, National Academy of Sciences).
Claessens, S.; Djankov, S.; Klingebiel, D. 2000. Stock markets in transition economies,
Financial Sector Discussion Paper No. 5 (Washington, DC, World Bank).
Coase, R.H. 1937. ‘‘The Nature of the Firm’’, in Economica, No. 4, pp. 386–405.
—. 1960. ‘‘The Problem of Social Cost’’, in Journal of Law and Economics, Volume 3,
No. 1, pp. 1–44.
Commission of the European Communities; International Monetary Fund; Organisation for
Economic Co-operation and Development; United Nations; World Bank. 1993. System of
National Accounts 1993 (Brussels/Luxembourg, New York, Paris, Washington, DC). Also
available on the UN Statistics Division website: http://unstats.un.org/unsd/sna1993.
Council of Economic Advisers. 1999. Economic report of the President (Washington, DC,
US Government Printing Office).
Council of Europe. 2001. MISSCEO 2000. Comparative tables of social protection systems
in 18 member states of the Council of Europe, Australia and Canada (situation on 1 July
2000) (Strasbourg, Council of Europe Publishing, 10th ed.).
Council of the European Union. 2003. Joint report by the Commission and the Council on
adequate and sustainable pensions, 7165/03 (Brussels).
Cox, D.; Jakubson, G. 1995. ‘‘The connection between public transfers and private
interfamily transfers’’, in Journal of Public Economics, Vol. 57, Issue 1, pp. 129–167.
Cox, D.; Eser, Z.; Jimenez E. 1996. Motives for private transfers over the life cycle – An
analytical framework and evidence for Peru, Boston College Working Papers in
Economics No. 327 (Chestnut Hill, MA, Boston College).
Cuddington, J.T. 1993. ‘‘Modeling the macroeconomic effects of AIDS with an application
to Tanzania’’, in World Bank Economic Review, Vol. 7, No. 2, pp. 173–189.
Cuddington, J.T.; Hancock, J.D. 1994. ‘‘Assessing the impact of AIDS on the growth path
of the Malawian economy’’, in Journal of Development Economics Vol. 43, No. 2,
pp. 363–368.
—. 1995. ‘‘The macroeconomic impact of AIDS in Malawi: A dualistic, labour surplus
economy’’, in Journal of African Economies, Vol. 4, No. 1, pp. 1–28.
Cummins, B. 2001. Socially Responsible Investing and the Robeco Group, Robeco
Institutional Asset Management: handout to the ILO Workshop on Social Budgeting,
Feldafing, Germany, 19–23 Feb. 2001.
627
Bibliography

Cutler, D.M.; Glaeser, E.L. 1997. ‘‘Are ghettos good or bad?’’, in Quarterly Journal of
Economics, Vol. 112, No. 3, pp. 827–872.
Day, J.G.; Jamieson, A.T. 1980. General introduction to investment (London, Institute of
Actuaries and the Faculty of Actuaries).
Daykin, C. 1995. ‘‘Financial management and control of supplementary pension schemes’’, in
International Social Security Review (Geneva, ISSA), Vol. 48, Part 3/4, pp. 75–89.
Del Valle Borraez, C.; Batlay M.; Togo E. 1998. Overview of fixed-income securities
markets in emerging economies, Paper presented at the OECD/World Bank Workshop on
the development of fixed-income securities markets in emerging market economies, Paris,
14–16 Dec.
Demarco, G.; Rofman, R. 1998. Supervising mandatory pension funds: Issues and
challenges, Social Protection Discussion Paper Series No. 9817 (Washington, DC,
World Bank).
Den Otter, M. 1999. Investmentfonds: Grundlagen, risiken, chancen (Zurich/Munich, Verlag
Neue Zurcher Zeitung/Carl Hanser Verlag).
Diamond, P.A. 1999. ‘‘What stock market returns to expect for the future?’’ in Issue in brief,
No. 2, Sep. (Boston, MA, Center for Retirement Research).
Doudeijns, M.; Einerhand, M.; van de Meerendonk, A. 1999. ‘‘Work incentives for low-
income families with children’’, in European Commission InforMISEP Policies Edition,
No. 66, pp. 30–35.
—. 2000. ‘‘Financial incentives to take up low-paid work: An international comparison of the
role of tax and benefit systems’’, in W. Salverda, B. Nolan and C. Lucifora (eds.), Policy
Measures for Low-Wage Employment in Europe (Cheltenham, UK, and Northampton,
MA, Edward Elgar Publishers).
Dror, D.; Jacquier, C. 1999. ‘‘Micro-insurance: Extending health insurance to the
excluded’’, in International Social Security Review (Geneva, ISSA), Vol. 52, No. 1,
pp. 71–97.
Dror, D.; Preker, A. (eds.). 2002. Social Re-Insurance: A new approach to sustainable
community health financing (Geneva, Washington, DC, ILO/World Bank).
Eichengreen, B. 1994. Institutions and economic growth: Europe after World War II, Centre
of Economic Policy Research Discussion Paper Series, No. 973 (London, CEPR).
Elmeskov, J.; Martin J.P.; Scarpetta, S. 1998. ‘‘Key Lessons for labour market reforms:
Evidence from OECD countries’ experiences’’, in Swedish Economic Policy Review 5,
pp. 205–252.
Esping-Andersen, G. 1990. Three worlds of welfare capitalism (Oxford, Polity Press).
European Commission. 1999. MISSOC 1998. Social protection in the EU Member States and
the European Economic Area, Situation on 1 January 1998 and evolution (Luxembourg).
EUROSTAT. 1996. ESSPROS Manual 1996 (Luxembourg, Office for official publications of
the European Communities).
628
Financing social protection

—. 1999. Development of the labour market policy module, Document PS/99/7 for the
Working Group on Social Protection (Luxembourg).
—. 2000. European Social Statistics – Social Protection – Expenditure and receipts
1980–1998 (Luxembourg, Office for official publications of the European Communities).
—. 2001. The social situation in the European Union (Luxembourg).
—. 2003. European Social Statistics – Social Protection – Expenditure and receipts
1991–2000 (Luxembourg, Office for official publications of the European Commu-
nities).
Fabozzi, F.J.; Modigliani, F. 1992. Capital markets: institutions and instruments (Englewood
Cliffs, NJ, Prentice Hall).
Federal Ministry of Labour and Social Affairs. 1994. Social Security in Germany:
Expenditure and Revenue 1960–1993 (Bonn).
—. 2001. Statistics on Labour and Social Security (Bonn).
Feldstein, M. 1976. ‘‘Temporary layoffs in the theory of unemployment’’, in Journal of
Political Economy, Vol. 84, No. 5, pp. 937–957.
—. 1996. ‘‘The missing piece in policy analysis: Social security reform’’, in American
Economic Review, Vol. 86, No. 2, pp. 1–14.
—. 1997. ‘‘How big should government be?’’, in National Tax Journal, Vol. 50, No. 2,
pp. 197–213.
Forster M.F.; Pellizzari, M. 2000. Trends and driving factors in income distribution and
poverty in the OECD area, Labour Market and Social Policy Occasional Papers No. 42
(Paris, OECD).
Frankel J. 1996. ‘‘How well do markets work? Might a Tobin tax help?’’, in M. ul Haq,
I. Kaul and I. Grunberg (eds.), The Tobin tax. Coping with financial volatility (Oxford and
New York, Oxford University Press).
Franzmeyer, F.; Lindlar L.; Trabold, H. 1996. Employment and social policies under
international constraints, Deutsches Institut fur Wirtschaftsforschung (The Hague, Vuga-
publishers).
Freeman, R. 1995. ‘‘Are your wages set in Beijing?’’ in Journal of Economic Perspectives,
Vol. 9, No. 3, pp. 15–32.
—. 1996. ‘‘Why do so many young American men commit crimes and what might we do
about it?’’ in Journal of Economic Perspectives, Vol. 10, No. 1, pp. 25–42.
Galor, O.; Zeira J. 1993. ‘‘Income distribution and macroeconomics’’, in Review of Economic
Studies, Vol. 60, No. 202, pp. 35–52.
Gillion C. 1996. The impact of demographic changes on the provision of retirement income
in ASEAN countries, mimeo (Geneva, ILO).
Gillion C.; Turner, J.; Bailey, C.; Latulippe, D. (eds.). 2000. Social security pensions:
Development and reform (Geneva, ILO).
629
Bibliography

Gottschalk, P.; Smeeding, T.M. 1997. ‘‘Cross-national comparisons of earnings and income
inequality’’, in Journal of Economic Literature, Vol. XXXV, No. 2, pp. 633–687.
Groupe de reflexion d’Attac-Liege (2000). Taxe Tobin, speculation et pauvrete, Document
Attac (Liege).
Gruber, J. 1997. ‘‘The consumption smoothing benefits of unemployment insurance’’, in
American Economic Review, Vol. 87, No. 1, pp. 192–205.
Gruber, J.; Wise, D. 1997. Social security programs and retirement around the world,
NBER Working Paper No. 6134 (Cambridge, MA, National Bureau of Economic
Research).
Hagemejer, K. 2000. Social protection expenditure and performance reviews: Methodo-
logical note on definitions, classifications and performance indicators (Geneva,
ILO), available at: http://www.ilo.org/public/english/protection/socfas/research/sper/
spersmet.pdf.
Hagemejer, K.; Liwinski, J.; Woycicka, I. (forthcoming). Social Protection Expenditure and
Performance Review, Poland: Social protection in transition (Geneva, ILO).
Hart, O.; Moore, J. 1990. ‘‘Property Rights and the Nature of the Firm’’, in Journal of
Political Economy, Vol. 98, No. 6, pp. 1119–1158.
Hart, O.; Shleifer, A.; Vishny R.W. 1996. The proper scope of government: Theory and an
application to prisons, NBER Working Paper No. 5744 (Cambridge, MA, National
Bureau of Economic Research).
Hartog, J. 1999. ‘‘Whither Dutch corporatism? Two decades of employment policies
and welfare reforms’’, in Scottish Journal of Political Economy, Vol. 46, Issue 4,
pp. 458–487.
Hehn, E. (ed.). 1998. Asset management: Finanzdienst-leistungen von und fur -
Versicherungen (Stuttgart, Schaffer-Poeschel Verlag).
Heller, P.S. 1998. Rethinking public pension reform initiatives, Working Paper of the
International Monetary Fund WP/98/61 (Washington, DC, IMF).
Holmlund, B. 1997. Unemployment insurance in theory and practice, Paper prepared for the
Scandinavian Journal of Economics 100th anniversary symposium on Public Policy and
Economic Theory, Oslo.
Holmstrom, B.; Milgrom, P. 1991. ‘‘Multitask principal-agent analyses: incentive contracts,
asset ownership and job design’’, in Journal of Law, Economics and Organization, Vol. 7,
pp. 24–52.
Holzmann, R. 1997. A World Bank perspective on pension reform, Paper for the Joint
ILO-OECD Workshop: Development and Reform of Pension Systems, Paris.
— 1999. Comments on the Stiglitz paper (Washington, DC, World Bank).
Hoskins, D. 2002. ISSA Initiative findings and opinions No. 5, Concluding remarks:
Conference on the ISSA initiative (Geneva, ISSA).
630
Financing social protection

Hurst, J.; Jee-Hughes, M. 2001. Performance measurement and performance management
in OECD health systems, Labour Market Policy Occasional Papers No. 47 (Paris,
OECD).
IDS Pensions Service Bulletin, Nov. 2001, Vol. 150 (London).
International Finance Corporation. 1999. The IFC indexes. Methodology, definitions and
practices (Washington, DC).
International Labour Office (ILO). 1957. Resolution concerning the development of social
security statistics adopted by the Ninth International Conference of Labour Statisticians
(Apr.–May 1957), The Ninth International Conference of Labour Statisticians (Geneva),
available at http://www.ilo.org/public/english/bureau/stat/download/res/socsec.pdf.
—. 1958. Social security: A workers’ education manual (Geneva).
—. 1984. Introduction to social security (Geneva, 3rd ed.).
—. 1989. From pyramid to pillar: Population change and social security in Europe
(Geneva).
—. 1993. Health care under social security in Africa: Taking stock of experience and
potential, Working Paper (Geneva).
—. 1995. The Ukrainian challenge: Reforming labour market and social policy (Budapest,
Central European University Press and ILO-CEET).
—. 1996. World employment 1996/97: National policies in a global context (Geneva).
—. 1997. Economically Active Population 1950–2010, STAT Working Papers (Geneva).
—. 1998. Thailand: Assessment of the feasibility of introducing an Unemployment Insurance
Scheme in Thailand: Report to the government, by W. Scholz (Geneva).
—. 1999a. South Africa: Social protection in South Africa, A technical note, mimeo,
by M. Cichon and C. Gillion (Geneva).
—. 1999b. ILO action against HIV/AIDS – A draft framework for global and regional
initiatives (Geneva).
—. 2000a. World Labour Report 2000: Income security and social protection in a changing
world (Geneva).
—. 2000b. Health micro-insurance – A compendium, Working Paper Sep. 2000, Strategies
and Tools against social Exclusion and Poverty (Geneva).
—. 2000c. Performance indicators (Geneva), available at: http://www.ilo.org/public/
english/protection/socfas/research/intror.htm#perfind.
—. 2000d. Republic of Cyprus: Report to the government – Actuarial valuation of the Social
Insurance Scheme as of 1 July 1997 (Revised version), by P. Plamondon (Geneva).
—. 2000e. Cote d’Ivoire: Evaluation actuarielle du regime des pensions obligatoires de la
Caisse generale de retraite des agents de l’Etat au 31 decembre 1998, by P. Plamondon
(Geneva).
631
Bibliography

—. 2000f. HIV/AIDS: A threat to decent work, productivity and development, Document for
discussion at the Special High-Level Meeting on HIV/AIDS and the World of Work, 8
June 2000 (Geneva).
—. 2001a. Social security: A new consensus (Geneva).
—. 2001b. Bahamas: A report on the feasibility of a catastrophic health insurance fund for
the Bahamas, by M. Burns et al. (Geneva).
—. 2001c. Luxembourg: Evaluation actuarielle et financiere du regime general d’assurance
pension du Grand-Duche de Luxembourg, Remis au Ministere de la securite sociale,
by R. Knop et al. (Geneva).
—. 2001d. Social security data required for the valuation of a national social security system
(Geneva), available at: http://www.ilo.org/public/english/protection/socfas/research/stat/
tabeng.doc.
—. 2001e. ILO strategy and recommendations on statistics, internal document (Geneva).
—. 2001f. Federal Republic of Nigeria: Technical note for the National Social Insurance
Trust Fund – Extension of social protection coverage in respect of short-term
contingencies, by C. Bailey and P. Plamondon (Geneva).
—. 2001g. Montserrat: Fourth actuarial review of the Social Security Fund as of
31 December 1999, by D. Osborne (Geneva).
—. 2001h. Social security: Issues, challenges and prospects, Report VI, International
Labour Conference, 89th Session (Geneva).
—. 2002a. An inclusive society for an ageing population: The employment and social
protection challenge, Paper contributed by the ILO to the Second World Assembly on
Ageing (Geneva), available at: http://www.ilo.org/public/english/employment/skills/
older/download/engage.pdf.
—. 2002b. Thailand: Technical note on the financing of the universal health coverage
scheme (Geneva).
—. 2002c. A Global Social Trust Network: Investing in the world’s social future, Report and
documentation of a feasibility study (Geneva).
—. 2002d. Panama: Valuacion financiera y actuarial de la Caja de Seguro Social
(Geneva).
—. forthcoming. Thailand: Social Protection Expenditure and Performance Review
(Geneva).
—. Yearbook of Labour Statistics, annual publication (Geneva).
—. The Cost of Social Security, Basic and comparative tables, various editions (Geneva).
—. The Cost of Social Security 1990–1996, available at: http://www.ilo.org/public/english/
protection/socfas/research/css/cssindex.htm.
ILO/EU Commission. 1994. Social expenditure in Slovakia: Results of a quantitative
analysis, Report to the Government of Slovakia, draft (Geneva).
632
Financing social protection

ILO-CEET/EU Commission. 1994. The Bulgarian challenge: Reforming labour market and
social policy (Geneva and Brussels).
ILO/International Social Security Association (ISSA). 1997. Training manual: Social
security financing (Turin, International Training Centre).
International Monetary Fund (IMF). 1997a. Government Finance Statistics Yearbook, 1997
(Washington, DC).
—. 1997b. International Statistical Yearbook 1997 (Washington, DC).
—. 2001a. Government Finance Statistics Manual 2001 (Washington, DC), at http://www.
imf.org/external/pubs/ft/gfs/manual/synopsis.htm.
—. 2001b. Bulgaria: Selected issues and statistical appendix, IMF Country Report No. 01/
54 (Washington, DC).
Iyer, S. 1999. Actuarial mathematics of social security pensions, Quantitative Methods in
Social Protection Series (Geneva, ILO/ISSA).
Jung, Y.-T.; Shin, D.-M. 2002. ‘‘Social protection in South Korea’’, in E. Adam et al. (eds.),
Social Protection in Southeast and East Asia (Singapore, Friedrich Ebert Stiftung),
pp. 269–312.
Kapteyn, A.; de Vos, K. 1997. Social security and retirement in the Netherlands, NBER
Working Paper No. 6135 (Cambridge, MA, National Bureau of Economic Research).
Kasa, K. 1999. ‘‘Time for a Tobin tax?’’ in Federal Reserve Bank of San Francisco
Economic Letter, No. 99–12 (San Francisco, CA, Federal Reserve Bank of San Francisco).
Katz, L.F.; Meyer, B.D. 1990. ‘‘The impact of the potential duration of unemployment
benefits on the duration of unemployment’’, in Journal of Public Economics, Vol. 41,
No. 1, pp. 45–72.
Keynes, J.M. 1936. The general theory of employment, interest and money. The collected
writings of John Maynard Keynes, Volume VII (Cambridge, UK, Cambridge University
Press).
Kiander, J. 2001. The future of the Nordic welfare model, mimeo (Geneva, ILO).
Knack, S.; Keefer, P. 1997. ‘‘Does social capital have an economic payoff? A cross-country
investigation’’, in Quarterly Journal of Economics, Vol. 112, No. 4, pp. 1251–1288.
Kohl, R.; O’Brien, P. 1998. The macroeconomics of ageing, pensions and savings: A survey,
Economics Department Working Papers No. 200 (Paris, OECD).
Koolwal, G.; Ray, R. 2002. Estimating the endogenously determined intra household
balance of power and its impact on expenditure pattern: Evidence from Nepal, Working
Paper No. 2814 (Washington, DC, World Bank).
Korpi, W. 1985. ‘‘Economic growth and the welfare state: leaky bucket or irrigation
system?’’, in European Sociological Review, Vol. 1, pp. 97–118.
Kotlikoff, L.J. 1996. ‘‘Privatizing social security at home and abroad’’, in American
Economic Review, Vol. 86, No. 2, pp. 368–372.
633
Bibliography

Kotlikoff, L.J.; Leibfritz, W. 1999. ‘‘An international comparison of generational accounts’’,
in A.J. Auerbach, L.J. Kotlikoff and W. Leibfritz (eds.), Generational accounting around
the world, A National Bureau of Economic Research Project Report (Chicago, The
University of Chicago Press).
Krelle, W.; Elixmann, D.; Joerg, H.; Kreuer, H.; Sarrazin, H. 1985. Der ‘‘Maschinenbei-
trag’’. Gesamtwirtschaftliche Auswirkungen alternativer Bemessungsgrundlagen fur die
Arbeitgeberbeitrage zur Sozialversicherung (Tubingen, Mohr Siebeck).
Kurtz, L. 1999. A review of studies of socially responsible investing, available at:
http://www.sristudies.org/Commentary/Markowitz_vs__Moskowitz/body_markowitz_vs_
moskowitz.html.
Laffont, J.J.; Tirole, J. 1993. A Theory of Incentives in Procurement and Regulation,
(Cambridge, MA, MIT Press).
Lampman, R.; Smeeding, T.M. 1983. ‘‘Interfamily transfers as alternatives to government
transfers to persons’’, in The review of income and wealth, Series 29, pp. 45–66.
Lapin, L. 1975. Statistics: Meaning and method (New York, Harcourt Brace Jovanovich).
La Porta, R.; Lopez-de-Silanes, F.; Shleifer, A.; Vishny, R. 2000. Investor protection:
Origins, consequences, reform. The World Bank, Financial Sector, available at:
http://www1.worldbank.org/finance/html/investorprotection.html.
Latulippe, D. 1996. Effective retirement age and duration of retirement in the industrial
countries between 1950 and 1990, Issues in Social Protection, Discussion Paper 2
(Geneva, ILO).
—. 1997. Projecting social expenditure in OECD and Central and Eastern European
countries, A preliminary technical note, Nov. 1997 (Geneva, ILO).
Layard, R.; Nickell, S.; Jackman, R. 1991. Unemployment: macroeconomic performance and
the labour market (Oxford, Oxford University Press).
Lindbeck, A. 1994. ‘‘Overshooting, reform and retreat of the welfare state’’, in De Economist,
Vol. 142, No. 1, pp. 1–19.
—. 1995. ‘‘Hazardous welfare-state dynamics’’, in American Economic Review, Vol. 85,
No. 2, pp. 9–15.
—. 1997a. ‘‘The Swedish experiment’’, in Journal of Economic Literature, Vol. XXXV,
No. 3, pp. 1273–1319.
—. 1997b. ‘‘Welfare state dynamics’’, in European Economy, pp. 61–77.
Lindbeck, A.; Snower, D.J. 2001. ‘‘Insiders versus outsiders’’, in Journal of Economic
Perspectives, Vol. 15, No. 1, pp. 165–188.
Lindeboom, M. 1998. Microeconometric analysis of the retirement decision: The
Netherlands, Economics Department Working Papers No. 207 (Paris, OECD).
Ljungqvist, L.; Sargent, T.J. 1998. ‘‘The European unemployment dilemma’’, in Journal of
Political Economy, Vol. 106, No. 3, pp. 514–550.
634
Financing social protection

Lucas, R.E. 1988. ‘‘On the mechanics of economic development’’, in Journal of Monetary
Economics, Vol. 22, Issue 1, pp. 3–42.
Lundsgaard, J. 2002. Competition and Efficiency in Publicly Funded Services, Economics
Department Working Papers No. 331 (Paris, OECD).
Malcolmson, J.M. 1997. ‘‘Contracts, hold-up, and labor markets’’, in Journal of Economic
Literature, Vol. XXXV, No. 4, pp. 1916–1957.
Manning, A. 1995. ‘‘How do we know that real wages are too high?’’ in Quarterly Journal of
Economics, Vol. 110, No. 4, pp. 1111–1125.
Mansley, M. 2001. Socially responsible investment: A guide for pension funds
and institutional investors (Monitor Press), quoted in: Just pensions – Socially responsible
investment and international development. A guide for trustees and fund managers,
May 2001, p. 2 (London, Just Pensions), available at: http://www.justpensions.org.
Mathieson, D.J; Schinasi, G.J. et al. 2001. International capital markets: Develop-
ments, prospects, and key policy issues, Chapter III: ‘‘Emerging market financing’’
(Washington, DC, IMF), Aug., available at: http://www.imf.org/external/pubs/ft/
icm/2001/01/eng/.
McFate K.; Smeeding, T.; Rainwater, L. 1995. ‘‘Markets and states: Poverty trends and
transfer system effectiveness in the 1980s’’, in K. McFate; R. Lawson; W.J. Wilson (eds.),
Poverty, inequality and the future of social policy: Western states and the new world order
(New York, Russell Sage Foundation).
Merrill Lynch: Emerging Markets Debt Biweekly, New York (April 2001), quoted in
Mathieson, Schinasi et al., op. cit., p. 69.
Moffit, R. 1992. ‘‘Incentive effects of the U.S. welfare system: A review’’, in Journal of
Economic Literature, Vol. XXX, No. 1, pp. 1–61.
Muller, K. 1999. The political economy of pension reform in Central-Eastern Europe,
Studies in Comparative Economic Systems (Cheltenham, UK, Edward Elgar).
National Audit Office of the United Kingdom (NAO). 2002. The history of the National Audit
Office, available at: http://www.nao.gov.uk.
Nazli, H.; Hamid, S. 1999. Concerns of food security, role of gender and intra-household
dynamics in Pakistan, mimeo (Islamabad, Pakistan Institute of Development Economics
(PIDE)).
Neubourg de, C. 1998. Productivity below sea level: Economic leadership and market
distortion-led productivity growth, 1974–94, Paper presented at the 25th General
Conference of the International Association for Research in Income and Wealth,
Cambridge, UK, Aug. 1998.
Nickell, S. 1997. ‘‘Unemployment and labor market rigidities: Europe versus North
America’’, in Journal of Economic Perspectives, Vol. 11, No. 3, pp. 55–74.
Nickell, S.; Bell, B. 1996. ‘‘Changes in the distribution of wages and unemployment in
OECD countries’’, in American Economic Review, Vol. 86, No. 2, pp. 302–308.
635
Bibliography

North, D.C. 1991. ‘‘Institutions’’, in Journal of Economic Perspectives, Vol. 5, No. 1,
pp. 97–112.
Normand C.; Weber, A. 1994. Social health insurance – A guidebook for planning (Geneva,
World Health Organization/ILO).
Okun, A.M. 1975. Equality and efficiency: The big trade off (Washington, DC, Brookings
Institution Press).
Olson, M., Jr. 1996. ‘‘Distinguished lecture on economics in Government: Big bills left on
the sidewalk: Why some nations are rich, and others poor’’, in Journal of Economic
Perspectives, Vol. 10, No. 2, pp. 3–24.
Organisation for Economic Co-operation and Development (OECD). 1985. Social
expenditures 1960–1990: Problems of growth and control (Paris).
—. 1994. The OECD Jobs Study: Evidence and explanation; Part II – The adjustment
potential of the labour market (Paris).
—. 1996a. Social expenditure statistics of OECD member countries (provisional version),
Labour Market and Social Policy Occasional Papers No. 17 (Paris).
—. 1996b. National Accounts, Main aggregates, 1960–1994 (Paris).
—. 1996c. OECD Employment Outlook July 1996 (Paris).
—. 1996d. OECD Economic outlook 1996 (Paris).
—. 1997. Principles of Health Accounting for International Data Collections, discussed in
the Working Party on Social policy, Second OECD Ad Hoc Meeting of Experts in Health
Statistics (Paris).
—. 1998a. OECD Employment Outlook June 1998 (Paris).
—. 1998b. Maintaining prosperity in an ageing society (Paris, Preliminary edition).
—. 1999a. OECD Employment Outlook June 1999 (Paris).
—. 1999b. OECD Economic surveys: United States (Paris).
—. 2001a. OECD Economic outlook No. 69, June 2001 (Paris).
—. 2001b. OECD Employment Outlook 2001 (Paris).
—. 2001c. Society at a glance: OECD social indicators, Social Issues (Paris).
—. 2001d. Basic Principles for the regulation of private occupational pension schemes,
mimeo, available at: http://www.inprs.org/data/publications/files/fifteenprinciples.pdf.
OECD; European Union (EU). 2003. Fotakis, C. and G. Coomans: ‘‘Equilibrium in the
labour market and social security systems: Demographic trends and the contribution of
immigrants (Part I)’’, in The economic and social aspects of migration, Conference jointly
organized by the European Commission and the OECD (Brussels).
Orsmond, D.W.H. 1996. Ukraine: Agenda for fiscal reform over the medium term, Paper
prepared for joint Fund/Bank seminar on accelerating Ukraine’s transition to a market
636
Financing social protection

economy: Credible macro-economic adjustment and systematic reforms (Washington,
DC).
Orszag, P.R.; Stiglitz, J.E. 1999. Rethinking pension reform: Ten myths about social security
systems, Paper presented at the conference ‘‘New ideas about old age security’’
(Washington, DC, World Bank).
Persson, T.; Tabellini, G. 1994. ‘‘Is inequality harmful for growth?’’, in American Economic
Review, Vol. 84, No. 3, pp. 600–621.
Phillips and Drew. 2000. Pension fund indicators – A long-term perspective on pension fund
investment 2000.
Pierson, P. 1994. Dismantling the welfare state? Reagan, Thatcher and the politics of
retrenchment, Cambridge studies in comparative politics (Cambridge, Cambridge
University Press).
Pissarides, C.A. 1998. ‘‘The impact of employment tax cuts on unemployment and wages:
The role of unemployment benefits and tax structure’’, in European Economic Review,
Vol. 42, Issue 1, pp. 155–183.
Plamondon, P.; Drouin, A.; Binet, G.; Cichon, M.; McGillivray, W.R.; Bedard, M.;
Perez-Montas, H. 2002. Actuarial practice in social security, Quantitative Methods in
Social Protection Series (Geneva, ILO/ISSA).
Popper, K.R. 1963. Conjectures and refutations: The growth of scientific knowledge
(London, Routledge & Kegan Paul).
Porter, M.E. 1990. The competitive advantage of nations (New York, Free Press).
Putterman, L.; Roemer, J.E.; Silvestre, J. 1998. ‘‘Does egalitarianism have a future?’’, in
Journal of Economic Literature, Vol. XXXVI, No. 2, pp. 861–902.
Rodrik, D. 1998. ‘‘Why do more open economies have bigger governments?’’, in Journal of
Political Economy, Vol. 106, No. 5, pp. 997–1032.
Romer, P.M. 1986. ‘‘Increasing returns and long-run growth’’, in Journal of Political
Economy, Vol. 94, No. 5, pp. 1002–1037.
—. 1990. ‘‘Endogenous technological change’’, in Journal of Political Economy, Vol. 98,
No. 5, Part 2, pp. S71–102.
Ross, S. 1996. ‘‘Overview of social security and taxation systems interactions’’, in
Symposium on Interactions of Social Security and Tax Systems.
Ruigrok, W.; van Tulder, R. 1995. The logic of international restructuring (London,
Routledge).
Rust, J.; Phelan, C. 1997. ‘‘How social security and Medicare affect retirement behavior in a
world of incomplete markets’’, in Econometrica, Vol. 65, No. 4, pp. 781–831.
Sachs, J. 1995. ‘‘Postcommunist parties and the politics of entitlements’’, in World
Bank: Transition, The newsletter about reforming economies, Vol. 6, No. 3, March
1995, available at: http://www.worldbank.org/transitionnewsletter/Archives/1995.htm.
637
Bibliography

Sachs, J.D.; Shatz, H.J. 1994. ‘‘Trade and jobs in U.S. manufacturing’’ in W.C. Brainard;
G.L. Perry (eds.), Brookings Papers on Economic Activity 1994:1, Macroeconomics
(Washington, DC, Brookings Institution Press).
Sala-I-Martin, X. 1994. A positive theory of social security, Discussion paper No. 1025
(London, Centre for Economic Policy Research).
Samuelson, P.A. 1958. ‘‘An exact consumption-loan model of interest with or without the
social contrivance of money’’, in Journal of Political Economy, Vol. 66, No. 4,
pp. 467–482.
Sappington, D.E.; Stiglitz, J.E. 1987. ‘‘Privatization, information and incentives’’, in Journal
of Policy Analysis and Management, Vol. 6, No. 4, pp. 567–582.
Sauerborn, R.; Berman, P.; Nougtara, A. 1996. ‘‘Age bias, but no gender bias, in the intra-
household resource allocation for health care in rural Burkina Faso’’, in Health Transition
Review, Vol. 6, No. 2, pp. 131–145.
Schmahl, W.; Henke K.D.; Schellhaass, H.M. 1984. Aenderung der Beitragsfinanzierung in
der Rentenversicherung (Baden-Baden, Nomos Verlag).
Schneider, M.; Biene-Dietrich, P.; Gabanyi, M; Huber, M.; Kose, A.; Scholtes, L.;
Sommer, J. 1993. Gesundheitssysteme im Internationalen Vergleich (Augsburg, BASYS
GmbH).
Scholz, J.K. 1999. Not perfect but still pretty good: The EITC and other policies to support
the US low-wage labour market, Paper for the OECD Workshop on making work pay
(Paris).
Scholz, W. 2001. Financial markets and social policy advice in transition economies. An
ILO position, Paper presented at the Freie Universitat Berlin, 18 Jan. 2001, mimeo
(Geneva).
Scholz, W.; Cichon, M.; Hagemejer, K. 2000. Social budgeting, Quantitative Methods in
Social Protection Series (Geneva, ILO/ISSA).
Schumpeter, J.A. 1911. Theory of economic development: An inquiry into profits, capital,
credit, interest and the business cycle (New Brunswick, NJ, Transaction Books).
Sehgal, J.M. 1999. The labour implications of HIV/AIDS: An exploratory note, Discussion
paper on HIV/AIDS and the world of work (Geneva, ILO).
Shleifer, A. 1998. State versus private ownership, NBER Working Paper No. 6665
(Cambridge, MA, National Bureau of Economic Research).
Shleifer, A.; Vishny, R.W. 1998. The Grabbing Hand: Government Pathologies and their
Cures (Cambridge, MA, Harvard University Press).
Simister, J.; Piesse, J. 2002. Household consumption decisions and nutrition in South Africa,
mimeo, Centre for the Study of African Economies Conference, (Oxford, St. Catherine’s
College).
Sinn, H.W. 1995. A theory of the welfare state, Discussion paper No. 1278 (London, Centre
for Economic Policy Research).
638
Financing social protection

Slemrod, J. 1998. ‘‘How costly is a large, redistributive public sector?’’, in Swedish
Economic Policy Review, Vol. 5, No. 1, pp. 87–105.
Sociaal en Cultureel Planbureau (SCP). 2000. De maat van de verzorgingsstaat: Inrichting en
werking van het sociaal-economisch bestel in elf westerse landen (The Hague).
Social Investment Forum. 2001. 2001 Report on socially responsible investing. Trends in the
United States, Nov. 2001, available at: http://www.socialinvest.org/areas/research/trends/
2001-Trends.htm.
Social Security Administration (SSA). 1997. Social security programs in the United States,
SSA Publication No. 13–11758 (Washington, DC).
—. 1999. Social security programs throughout the world – 1999, SSA Publication
No. 13–11805 (Washington, DC).
—. 2002. The 2001 Annual Report, The Board of Trustees, Federal Old-Age and Survivors
Insurance and Disability Insurance Trust Funds (Washington, DC).
Social Security Advisory Committee (SSAC). 2002. About SSAC, available at: www.ssac.
org.uk
Standing, G. 1990. ‘‘The road to workfare: Alternative to welfare or threat to occupation?’’,
in International Labour Review, Vol. 129, No. 6, pp. 677–691.
—. 1994. Minimum wage, workfare and citizen’s income: Instruments for redistributive
justice, Working Paper presented at the BIEN Congress.
—. 2002. Beyond the new paternalism: Basic security as equality (Geneva, ILO).
Statistikos Departamentas (Statistics Lithuania). 2000. Social protection in Lithuania 1998.
Statistical abstract (Vilnius).
Stiglitz, J.E. 1986. Economics of the public sector (New York, W.W. Norton & Company,
1st ed.).
—. 2002. ‘‘Information and the Change in the Paradigm in Economics’’, in The American
Economic Review, Vol. 92, No. 3, pp. 460–501.
Stover, J. 1993. The impact of HIV/AIDS on population growth in Africa, Options project,
African Population Advisory Committee Series (Washington, DC, The Futures Group
International).
Stover, J.; Bollinger, L. 1999. The Economic Impact of AIDS in Angola, The Policy Project
(Washington, DC, The Futures Group International).
Streeck, W. 1995. German capitalism: Does it exist? Can it survive?, MPIFG Discussion
paper 95/5 (Cologne, Max-Planck-Institut fur Gesellschaftsforschung).
Summers, L.; Gruber, J.; Vergara, R. 1993. ‘‘Taxation and the structure of labour markets:
The case of corporatism’’, in Quarterly Journal of Economics, Vol. 108, No. 2,
pp. 385–412.
Superintendencia de Administradoras de Fondos de Pensiones (SAFP). 1998. El sistema
Chileno de pensiones (Santiago de Chile, 4th ed.).
639
Bibliography

SZW (Ministerie van Sociale Zaken en Werkgelegenheid–Dutch Ministry of Social Affairs
and Employment). 1996. The Dutch welfare state in an international and economic
perspective, Dutch Ministry of Social Affairs and Employment (The Hague, Sdu-
publishers).
—. 2000. The Dutch welfare state: Social policy and economic performance in
an international perspective, Dutch Ministry of Social Affairs and Employment
(The Hague, Sdu-publishers).
Tamburi, G.; Mouton, P. 1976. ‘‘Social Security Indicators’’, in International Labour Review
Vol. 114, No. 2, pp. 155–167.
Tanzi, V. 1996. ‘‘The fiscal dimensions of public pension systems’’, in Protecting Retirement
Incomes: options for reform, ISSA Studies and Research, No. 37 (Geneva, ISSA),
pp. 27–38.
Teulings, C.N., van der Veen, R.; Trommel, W. 1997. Dilemma’s van Sociale Zekerheid:
Een analyse van 10 jaar herziening van het stelsel van sociale zekerheid (Amsterdam,
VUGA).
The Economist. 1998. A survey of social insurance, 24 Oct. 1998.
—. 2001. A survey of globalisation, 29 Sep. 2001.
Thompson, L. 1998. Older & wiser: The economics of public pensions (Washington, DC,
Urban Institute Press).
Titmuss, R.M. 1958. Essays on the welfare state (London, Allen & Unwin).
Tobin, J. 1978. ‘‘A proposal for international monetary reform’’, in Eastern Economic
Journal, Vol. 4, No. 3–4, pp. 153–159.
Tsuru, K. 2000. Finance and growth. Some theoretical considerations, and a review of
empirical literature, Economics Department Working Papers No. 228 (Paris, OECD).
Ulgenerk, E.; Zlaoui, L. 2000. From transition to accession: Developing stable and
competitive financial markets in Bulgaria (Washington, DC, World Bank).
United Nations (UN). 1968. A System of National Accounts (New York).
—. 1993. World Population Prospects, The 1992 Revision (New York).
—. 1995. World Population Prospects, The 1994 Revision (New York).
—. 1998. World Population Prospects, The 1996 Revision (New York).
—. 1999. World Population Prospects, The 1998 revision (New York)
—. 2001a. World Population Prospects, The 2000 Revision (New York).
—. 2001b. World Population Prospects, The 2000 Revision, vol. II: The sex and age
distribution of the world population (New York).
—. 2001c. Replacement migration: Is it a solution to declining and ageing populations?
Population Division, Department of Economic and Social Affairs (New York).
640
Financing social protection

—. 2001d. Report of the High-level Panel on Financing for Development (the Zedillo
Report), A/55/1000 (New York).
UNAIDS. 2000. Guidelines for studies of the social and economic impact of HIV/AIDS,
UNAIDS Best Practice Collection (Geneva).
United Nations International Children’s Fund (UNICEF). 1994. Central and Eastern Europe
in transition: Crisis in mortality, health and nutrition, Regional Monitoring Report, No. 2
(Florence).
United Nations International Children’s Fund (UNICEF) and United Nations Development
Programme (UNDP). 1998. Country experiences in assessing the adequacy, equity and
efficiency of public spending on basic social services, Paper prepared for the Hanoi
Meeting on the 20/20 Initiative, 27–29 Oct.
USAID. 2001. The Bulgarian pension model: One year after the start (Sofia).
Useem, M.; Mitchell, O.S. 2000. Holders of the purse strings: Governance and performance
of public retirement systems, Pension Research Council Working Paper 2000–3
(Philadelphia, PA, Pension Research Council).
Uvalic, M.; Vaugham-Whitehead, D. 1997. ‘‘Introduction: Creating employee capitalism
in Central and Eastern Europe’’, in M. Uvalic and D. Vaugham-Whitehead (eds.),
Privatization surprises in transition economies: employee-ownership in Central and
Eastern Europe (Lyme, NH, Edward Elgar).
van de Meerendonk, A. 1998. ‘‘Benchmarking the German and Dutch welfare states’’, in
L. Delsen and E. de Jong (eds.), The German and Dutch economies: Who follows whom?
(Heidelberg, Physica Verlag).
—. 1999. Pension systems in advanced industrial countries, Working document, Ministry of
Social Affairs and Employment (The Hague).
—. 2000. Pension systems in industrialised countries, performance and affordability in
an ageing society, Ministry of Social Affairs and Employment Working Paper No. 152
(The Hague).
—. 2003. ‘‘Maak reıntegratie lonend’’, in Economisch Statistische Berichten, Jaargang 88,
No. 4403, pp. 230–232.
van den Noord, P.; Heady, C. 2001. Surveillance of tax policies: A synthesis of findings in
economic surveys, Economics Department Working Paper No. 303 (Paris, OECD).
van Waarden, F. 1997. Institutions of socio-economic coordination?, Study for and lecture at
EU Conference on Social Policy and Economic Performance, Amsterdam, Ministry of
Social Affairs and Employment (The Hague).
Vittas, D. 1998. Institutional investors and securities markets: Which comes first?, Policy
Research Working Paper No. WPS 2032 (Washington, DC, World Bank).
von Hagen, J.; von Stein J.H. (eds.). 2000. Obst/Hintner – Geld-, Bank-und Borsenwesen
(Stuttgart, Schaffer-Poeschel Verlag, 40th ed.).
641
Bibliography

Williamson, O.E. 1998. ‘‘Transaction cost economics: How it works; where it is headed’’, in
De Economist, Vol. 146, No. 1, pp. 23–58.
Wood, A. 1995. ‘‘How trade hurt unskilled workers’’, in Journal of economic perspectives,
Vol. 9, Issue 3, pp. 57–80.
World Bank. 1994. Averting the old age crisis: policies to protect the old and promote
growth (New York, Oxford University Press).
—. 1996. World Development Report 1996: From plan to market (New York, Oxford
University Press).
—. 1997. Confronting AIDS: Public Priorities in a Global Epidemic (New York, Oxford
University Press).
—. 2000. World Development Report 2000/2001: Attacking poverty (New York, Oxford
University Press/World Bank).
—. 2001a. Social Protection Sector Strategy: From safety net to springboard (Washington,
DC).
—. 2001b. Bulgaria: The dual challenge of transition and accession, A World Bank country
study (Washington, DC).
World Health Organization (WHO). 2000. The World Health Report 2000: Health systems:
Improving performance (Geneva).
World Health Organization (WHO); UNAIDS. 2000a. AIDS epidemic update: December
2000 (Geneva).
—. 2000b. Cote d’Ivoire: Epidemiological fact sheets on HIV/AIDS and sexually transmitted
infections (Geneva).
642
Financing social protection

INDEX
Note: Page numbers in bold refer to major text sections, those in italic to tables, figuresand boxes. Subscript numbers appended to page numbers indicate endnotes, the letter ga glossary entry.
Aaron, H.J. 115, 1767
Aarts, L.J.M. 114, 141accounting
framework for a national socialinsurance scheme 419–29,420–23, 424–5, 427
pension funds 411social protection in national and
government accounts178–81, 423
acquired immune deficiency syndromesee HIV/AIDS pandemic
active insured person 609gactive-age
formal social transfers 19informal income transfers 17
actuarial balance 609gactuarial equilibrium 227–32, 609gactuarial liability 609gactuarial valuation
as planning instrument 429–30,430–35
Panama 434–5Adema, W. 115, 141–2, 17722
administrative costsnational pension schemes or provident
funds 444–5, 444welfare state 113
adverse selection 119, 152, 17611
advertising regulationspension funds 411
affordability of the welfare state 50–1,163–72, 165, 170, 171
demographic challenge 164–8, 165Africa
family and pension benefits 65health services 66HIV/AIDS pandemic 89
issue brief on managing the financialconsequences of the HIV/AIDSpandemic 495–522
projection model demonstrating costdevelopment of a young pensionscheme 326–9
social expenditure 65–6, 1025
age of entry into labour marketgovernance, impact of 90, 91–2see also retirement age
ageing population 83–4, 86–8, 87,88, 89
ageing crisis, debate over 92–6, 93–5issue brief on migration and higher
labour force participation asfactors on social protectionfinancing 523–47
pension financing, effects on 532–8pensions sustainability 166–7
Aghion, P. 120, 155agriculture
subsidies 55AIDS see HIV/AIDS pandemicAIMR (Association for Investment
Management and Research)performance standards 359, 39942
Akerlof, A.K. 151, 152, 17611
Albert, M. 122Alesina, A. 117–18, 121Allen, R. 46710
annuity 609gregulation of technical bases 412
Antolin, P. 17719
Arab Statespensions 66social expenditure 66, 1026
Argentinadefined-benefit scheme 68
643

Asiasocial expenditure 67–8unemployment benefits 67
assessment of constituent capital 609gasset price bubble 609gAssociation for Investment Management
and Research (AIMR)performance standards 359, 39942
asymmetrical information 114, 119, 120,152, 359, 372
Atkinson, A.B. 527, 111, 148, 149, 157,1768, 17724
auditsfinancial markets 415state-operated protection systems 407United Kingdom National Audit Office
(NAO) 407Auer, P. 171, 1769
Auerbach, A.J. 164Australia
social expenditure projections 78, 79Aylward, A. 380, 381, 39822, 39964,70
Bahamassocial reinsurance arrangement for the
private health insurance system262–3
Bahrainsocial expenditure 66
Bailey, C. 67, 4676
Baker, D. 293balance sheet
framework for a national socialinsurance scheme 421–2
stock valuation 361–2, 362balances
formulae for calculating 550Bangladesh
social security provisions 67banking regulations 417–18
capital requirements 417corporate governance 417
Barr, Nicholas 20, 527, 111, 119, 291Barrientos, A. 18basic income (BI) 308–12, 310, 311–12,
313–15, 609gfinancing 310pros and cons 311–12
Baumol, W.J. 118Bell, B. 118Benabou, R. 121benchmarking 161–2
investment performance 357–9, 358performance indicators 441–2, 46713
types 442beneficiary ratio 609gbenefit maturity 70benefit replacement rate 609–10gbenefits
conditional and unconditionalbenefits 57
income-tested, effect on workincentives 133–9, 134, 135, 138
low-paid labour and tax/benefitsystems 130–9, 133, 135, 136–7,138
means-tested and non-means-testedbenefits 57, 130, 137–8, 150
see also benefits in kind; cash benefits;income transfers
benefits in kind 12, 15distinct from cash benefits 57
Beninfamily and pension benefits 65social expenditure 65–6
Bertranou, Fabio xxviiBesharov, D.J. 200Blank, R.M. 155Blondal, S. 139, 140–1Bodie, Z. 356, 366, 372, 39947,51,52,53,54
Boliviasocial security contributions 268social security systems 68
Bolton, P. 120bond yield 366–8, 368, 39954,55,56
bonds 610gdebt instrument performance
indicators 366Bonilla Garcia, A. 2, 4Borjas, G.J. 121Botswana
basic universal pension 86Bovenberg, A.L. 154, 155, 156, 157, 158,
159, 166Braithwaite, J. 306Brandolini, A. 120
644
Financing social protection

Brazilbasic universal pension 18, 86social security contributions 270
Brown, R.L. 291budget
government 161impact of HIV/AIDS 514–16
budgeting formulae 548–50Bulgaria
fully funded second-tier pension386–7
social security contributions 269Burkina Faso
consumption and distributionequity 18
Burtless, G. 354
Calmfors, L. 117, 118capital markets 558, 562, 610gcapital mobility
internationalization, challenge of 169capital stock 336–7, 39820, 610gcarbon tax, proposal for international 318Carling, K. 1766
cash benefits 12, 15distinct from benefits in kind 57short-term 315
cash flowsvaluation of future 362–6
Catalan, M. 39976
catchment ratio 610gCentral Europe
social expenditure 63, 63–4, 65social expenditure projections 75–8,
76, 80, 81, 1028
childrenformal social transfers 19informal income transfers 17
Chiledefined-benefit scheme 68defined-contribution scheme,
conversion to 188, 189–90regulation of social insurance 408social security contributions 268,
269, 270social security systems 68
Chinahealth care financing 258, 259–61
health care system compared with theUnited States 259–61
social security reform 68Cichon, Michael xxv, 46, 47–9, 65,
92, 97, 131–2, 243, 245, 258, 402,419, 420
citizen’s income see basic income (BI)Citro, C.F. 528
Claessens, S. 388claw-back ratio 610gCoase, R.H. 151, 154, 157cohort 610gcollective financial equivalence
610gColombia
defined-contribution schemecontributions 280–1
social security systems 68combined demographic dependency ratio
see demographic dependency ratiocommunity-based social schemes 203,
249bad debt, problem of 252coverage 223, 253for the informal economy 249–57,
3246, 3257
health care provision 252–7, 3246,3257
management deficiencies 253, 3257
‘‘poverty wall’’ 253recovery gap 256reinsurance considered 257systemic financial disequilibrium 254,
254–6, 256–7, 3258
competitionpublic versus private social protection
provision 161–2competitive tendering 161–2compliance costs
welfare state 113–14conflicts of interest
financial regulation 409–11, 415consumption
adequate level 41food 18minimum level 12, 14, 303
contingenciesdefinition 3
645
Index

contingency social protection reserves300, 32513, 342–3
contribution ceiling 610gcontribution rate 610gcontributors’ ratio 610gcorporate governance 408, 417
banks 417corruption
socially responsible investment 374,39960
cost developmentprojection model demonstrating a
young African scheme 326–9cost rate 610gcoupon payments 366–8, 368, 39954,55,56
coverage rate 610gCox, D. 18crowding out 610gCummins, B. 377Cyprus
link between government budget andthe social insurance scheme185–6
DAX index 360, 361, 372Day, J.G. 343DDM see dividend discount modelsde Jong, P.H. 114, 141de Neubourg, C. 125de Vos, K. 140deadweight loss 115–16, 116, 610gdebt instruments
capital market instruments 558, 562examples 554, 558money market instruments 558, 561,
561performance indicators 366primary markets 553–7
defined-benefit 611gdefined-benefit schemes 331, 3961, 611g
characteristics of 277definition 228, 229–30impact of HIV/AIDS 503–9Latin America 68United States 140
defined-contribution 611gdefined-contribution schemes 330–1,
611g
characteristics of 277Chile’s conversion to 188, 189–90definition 228, 229–30impact of HIV/AIDS 521–2
deflator 611gDel Valle Borraez, C. 39969
Demarco, G. 414demographic maturity 69–70demographic ratio 611–12gdemography
ageing population 524–5challenge to the welfare state 164–8,
165social expenditure, impact on 83–9,
83, 84–7, 88, 89, 99, 221–2, 222Demoland 563–608
financing a social assistance scheme582–5
investment plan/portfolio 598–603performance evaluation system 603–8projecting social expenditure 566–72social assistance scheme 578–81social health insurance 593–7universal pension scheme 586–92welfare state debate 573–7
Denmarkpension fund management 370–2social protection benefits 74
density of contributions 612gdeveloping countries
education benefits 55food and nutrition benefits 55functions to be included in social
protection systems 54–5social expenditure 65–9social expenditure projections 81–2see also emerging markets; transition
countriesDiamond, P.A. 394disposable income
definition 337dividend discount models (DDM) 363–4dividends
valuing future 362–4domestic income 612gDominica
performance indicators for the socialsecurity fund 439–40, 440
646
Financing social protection

Doudeijns, M. 149, 17613
Dow Jones Industrial Average 359, 360,372, 394, 39945
Driffill, J. 117Dror, D. 249, 3259
early retirement 139–41, 17719,20,21
accrual rate influencing 139age when retirement is possible 139funding versus PAYG debate 292–8industrial relations, link with 140The Netherlands 140
earnings dispersions 126–8, 127, 17614
earnings inequality see income inequalityearnings mobility 129–30, 129Eastern Europe
social expenditure 63, 63–4, 65social expenditure projections 75–8,
76, 80, 81, 1028
economic growth 612geconomically active population 612geconomy
Germany and interaction with thewelfare state 122–5
interaction with NSPS 106–77, 107,1761
The Netherlands and interaction withthe welfare state 122–5
social expenditure, impact on 83,96–9, 97–8, 10216, 221–2, 222
Sweden and interaction with thewelfare state 122–5
Ecuadorsocial security contributions 270social security systems 68
educationexpansion during the 1960s and 1970s
118–19student numbers, determinants
affecting 83unemployment by educational
attainment 128, 128welfare state permits access 120
education benefitsdeveloping countries 55
Egyptsocial security contributions 269, 270
Eichengreen, B. 108
El Salvadorsocial security contributions 268social security systems 68
eligibility conditions 612gElmeskov, J. 172emerging markets 612g
characteristics 379, 382equity issuances by type of economy
1990–95 381investment of pension funds 379–82,
39964,65,66
long-term private sector debt issuances380
see also developing countriesemployed persons 612gemployment
age of entry into labour market 90,91–2
welfare state, effect of 114–15, 1766,7
workfare 309, 32515
employment injury benefitsfinancing systems 316
employment protection regulationeffect on unemployment 117
Enron collapse 347, 39937, 409equity 612g
markets 560–1performance indicators 359–63, 370–2valuation 361–6, 365, 39947
equity claimsexamples 554–5
Esping-Anderson, G. 109–11ESSPROS see European System of
Integrated Social Protection Statisticsethical investment 374–6, 39960,61,62,63
see also socially responsibleinvestment
Europesocial benefits by function 73, 74social expenditure 62–5, 63–4, 69, 72,
73, 74welfare state compared with the
American model 131–2European System of Integrated Social
Protection Statistics (ESSPROS) 20,54–5, 423, 613g
European UnionEUROSTAT social indicators 55, 426
647
Index

performance indicators 447, 448–50excess burden see deadweight loss
Fabozzi, F.J. 332, 334, 388, 3973
familiesinformal intra-family income transfers
17–19family benefits
Africa 65farmers
social security schemes 55Feldstein, M. 116, 150finance
Demoland social assistance scheme582–5
indirect government subsidies andcontingent liabilities 191–3
sources for social protection schemes181–2, 203, 232–9, 233
strategies for social protection andpublic financing 198–201, 200,21815
financial assets 613gfinancial equilibrium 613gfinancial equivalence 613gfinancial governance
actuarial valuation 429–30, 430–35analytical and performance-monitoring
instruments 436–64definition 402descriptive instruments 419–29,
420–423, 424–5, 427hierarchy of quantitative governance
instruments 418–9, 419mandatory private insurance 408–15planning instruments 429–30,
430–35social budget 429–30, 430–35social insurance 408social protection legal framework
404–18state-operated protection systems
405–8use of performance indicators 418
financial instruments 613gfinancial investments 613gfinancial management
health services 246
financial marketsbanking regulations 417–18capital markets 558, 562characteristics of formal markets
333–5, 3976,7,8,9,10,11,12,13
classification 552, 553debt markets 558definition 332, 613gefficient 334–5equity markets 560–1general characteristics 331–3, 3962,
3973,4
introducing pension systems in anenvironment of underdevelopedmarkets 391–3
investment in 372–3investment problems in countries with
underdeveloped 378–91macro-economic flow-of-funds context
335–8, 336, 39715
main instruments 552–62money markets 558, 561, 561organization 552–62primary markets 553–7regulations 415–18secondary markets 557–8
financial reportingframework for a national social
insurance scheme 419–29, 420–23,424–5, 427
financial solidarity rule 613gfinancing systems
actuarial equilibrium and the level offunding 227–32
application of different types 240,241–2
collective financial equivalence rule226
community-based 249definition 220, 613gemployment injury benefits 316financial solidarity rule 226, 3245
France 234–7, 234health care benefits 240–61intergenerational equity rule
226–7international instruments 317–21, 318,
319–21
648
Financing social protection

long-term care 316–17objectives 220–2policy considerations 322–3, 324rules 225–7short-term cash benefits 315size of covered group 223–5, 224–5social security pensions 261–302, 264,
326–9tax versus contribution financing of
mandatory pension schemes237–9
fixed assets 336–7, 39716
see also non-produced assets;produced assets
Fogel, R.W. 151food
benefits in developing countries 55consumption and distribution equity 18
formal sector 613gformulae
balances 550budgeting 548–50contribution rates 550–1full funding 280general average premium (GAP) 280pay-as-you-go (PAYG) 279reserves 550scaled premium 279–80
Forster, M.F. 529
Francesocial protection benefits 74social protection financing 234–7, 234
Franzmeyer, F. 128, 17730
Freeman, R. 121, 168FTSE index 360, 361, 372full funding 613g
formulae 280funding ratio 614g
Galor, O. 120GAP (general average premium) 280,
614gGDP (gross domestic product) 336–7,
39717, 614ggender bias
Pakistan 18gender difference
retirement 91
general average premium (GAP) 280,614g
generational accounts 164–6, 165Germany
flow-of-funds in the NSPS in 1998 23,24
interaction between welfare state andeconomic performance 122–5
minimum wage level 118retirement age 140social protection benefits 74unemployment 126, 128
Ghananational health insurance proposals
210–11, 211–15Gillion, C. 115, 322Gini coefficient 30–2, 614gGlenn, J.D. 380, 381, 39822, 39964,70
Gordon formula 364, 39951
Gottschalk, P. 39, 127governance 614g
definition 402public sector 150–6social expenditure, impact on 83,
89–96, 91, 92, 93–5, 99, 100,10216, 221–2, 222
see also corporate governance; financialgovernance; social governance
government accountseffect of social protection financing on
public deficits and debts 193–8,197, 198, 21414
financial flows from social securityschemes 182, 185, 185–6
financial links with social protectionschemes 181–93, 183–4, 185–6,188, 189–90, 2189,10,11,12
flows and links with social protectionschemes 186–8, 189–90, 21810
indirect subsidies and contingentliabilities 191–3
social protection 178–81, 423government debt instruments 553, 555,
556, 558grandfather clause 614gGrenada
performance indicators for the nationalinsurance scheme 439
649
Index

gross domestic product (GDP) 336–7,39717, 614g
Gruat, J-V. 2, 4Gruber, J. 119, 139, 140Guatemala
social security contributions 270social security systems 68
Hagemejer, Krzysztof xxvi–xxvii, 46,47–9, 522, 65
Haitisocial security contributions 269
Hamid, S. 18Hart, O. 155health care see health serviceshealth insurance
Bahamas reinsurance arrangement262–3
Demoland social health insuranceexercise 593–7
Medicare in the United States 140private 257–8Switzerland 258United States 140
health services 39Africa 66characteristics of the market 243–4China 258, 259–61community-based health insurance in
Uganda 252, 3257
community-based schemes 252–7,3246, 3257
coverage in Thailand 207–10, 208disability-adjusted life expectancy
(DALE) indicator 457, 458,46714
expansion during the 1960s and 1970s118–19
expenditure in selected countries 457expenditure projections 77, 1029
financial management 246financing benefits 240–61Ghana’s proposals for national health
insurance 210–11, 211–15impact of HIV/AIDS 509–10informal economy fail to receive 247instruments used for financing 247,
248–9
national health care financing systems245–9, 246, 248–9, 250–1
payment methods 244–5private insurance 257–8public-private mix in financing 246social expenditure 72, 77United States and China compared
259–61Hehn, E. 356, 359, 39938
Heller, P.S. 195HIV/AIDS pandemic
impact on the national social protectionscheme 89
issue brief on managing the financialconsequences 495–522
Holmlund, B. 115Holmstrom, B. 152, 153Holzmann, R. 164Hong Kong (China)
social expenditure 67unemployment benefits 67
Hoskins, D. 310household income inequality 143–4human rights
socially responsible investment 375Hurst, J. 46710
ILO (International Labour Office)core labour standards 374–5Decent Work indicators 426, 428, 428global performance indicators 458–64,
460–64, 46715,16,17,18
Global Social Transfer initiative 40073
Labour Statistics Convention 1985 428,4663
Social Protection Expenditure and Per-formance Reviews (SPERs)55, 450
Social Re project 256, 3259
Social Security (Minimum Standards)Convention 1952 54, 62, 1013, 428,46713, 468
statistical indicators 426, 427–8, 428IMF (International Monetary Fund)
financial statistics 179, 180, 2183, 423imperfect information see information
imperfectionsinactive insured person 614g
650
Financing social protection

incentives to retire early 139incentives to work
income-tested benefits, effect of133–9, 134, 135, 138
net retained income 134–9, 135,17718
taxation 150income and expenditure account
framework for a national socialinsurance scheme 420–22
income distributioneffect of social protection schemes 14,
25–41, 31, 34, 36, 37, 38, 39income effect
taxation 114income inequality
earnings mobility 129–30, 129increase during the 1980s 39measurement 26, 30–2, 31measuring transfer efficiency to reduce
34–7, 36trends 127
income supportmeans testing 303
income transferscash 12, 15formal and informal transfers 14–16,
15, 17, 19, 202–3in-kind 12, 15insurance benefits as 12, 13ratio of private to public in the United
States 1935–80 16, 17types 12types of informal systems 17–19
Indiasocial expenditure 67social security contributions 299
individual equivalence 614gindustrial relations
early retirement, link with 140industries
International Standard Industry Classi-fication of all Economic Activities369
investment in 369–72inequality gap 614ginequality target efficiency rate 35–7, 37inequality target efficiency ratio 614g
inflationrisk affecting pension payments 355
informal economycommunity-based schemes 249,
252–7, 3246, 3257
health care fails to reach 247problem for the State 247, 249
informal sector 614ginformation economics 151–3information imperfections 119, 151–2,
157–8see also asymmetrical information
initial public offerings (IPOs) 555–6, 557,614g
innovative entrepreneurs 338, 39823,24
INPRS (International Network of PensionRegulators and Supervisors)
Fifteen principles for the regulation ofprivate occupational pension
schemes 409insider information
financial regulation 409–11insider trading 614–15ginstitutional investment
pension funds 340–2procedures for selecting socially
responsible investment portfolio377–8
social protection reserves 330–99socially responsible investment 374–6strategies 369–78
institutionsdefinition 153governing social protection 20, 57new institutional economics 151,
153–6transaction cost economics 154
insurable earnings 615ginsurable risk 3insurance benefits
as income transfers 12, 13insurance credits 615ginsurance policies
model clauses 413prices 413selling 413
insured person 615gintangible assets 336–7, 39716
651
Index

intergenerational equity 615gInternational Labour Office see ILOInternational Monetary Fund (IMF)
financial statistics 179, 180,2183, 423
International Network of Pension Regu-lators and Supervisors (INPRS)
Fifteen principles for the regulation ofprivate occupational pensionschemes 409
International Standard Industry Classifi-cation of all Economic Activities(ISIC) 369, 39957
internationalization, challenge of 168–72financing systems 317–21, 318,
319–21intrinsic value 615ginvestment
analytical tools 359–71, 39943
benchmarking 357–9, 358contingency reserves 342–3Demoland exercise 598–603financial market 372–3financial market risks affecting pension
payments 354–5industry 369–72liquidity 345maximizing return 347–9, 348minimizing risk 349–54, 354–5optimizing the time horizon 355–6pension funds 340–2portfolio efficiency 351–4, 352, 353,
39938,39,40
problems in countries with underdeve-loped financial markets 378–91
regional 373, 39959
safety and control 344social and economic utility 345–6social protection reserves 330–99socially responsible 374–6strategies 369–78supporting national development plans
389–91yield 345
investment departmentorganization 343–4, 343
investmentssocial security, effect of 115
IPOs (initial public offerings) 555–6, 557,614g
Iranunemployment benefits 67
Irelandsocial protection benefits 74
ISIC (International Standard IndustryClassification of all EconomicActivities) 372, 39957
Jacquier, C. 249Jakubson, G. 18Jamiesom, A.T. 343Japan
retirement age 91social expenditure projections 78, 79social security contributions 269, 270
Jee-Hughes, M. 46710
Jordansocial security contributions 270, 299
Jung, Y.-T. 202
Kapteyn, A. 140Kar, D. 293Katz, L.F. 149, 1766
Keefer, P. 121Keynes, J.M. 108Knack, S. 121Kohl, R. 115Korea (Republic of)
social expenditure 67social protection system 202
Korpi, W. 111Kotlikoff, L.J. 165Kurtz, L. 376Kuwait
fully funded pension scheme 282, 299social expenditure 66
La Porta, R. 333, 3978
labour 615glabour market
55–65 age group 139–41, 17719
age of entry into 90, 91–2ILO Labour Statistics Convention
1985 428, 4663
taxes and benefits increases, effectof 117
652
Financing social protection

unemployment benefit levels, effect ofgenerous 117
welfare state, effect of 126–30labour mobility
internationalization, challenge of168–9
labour shortageprojections 528–9
labour standardssocially responsible investment
374–5labour supply
welfare state, effect of 114–15, 1766,7
Laffer curve 204–7, 615gLaffont, J.J. 17725,26
Lampman, R. 16, 17Lapin, L. 72Latin America
pensions 68–9, 268, 415regulation of private mandatory pension
systems 409–11regulation of social protection 408,
414, 415social security schemes 68–9
Latulippe, Denis 5210, 73, 90, 97, 350Layard, R. 115, 149Leger, Florian 237leisure
effect of welfare state in increasing114
Liebfritz, W. 165life expectancy 91, 10213
life insurance companiesinsurance selling 413investment limits 412–13model policies and clauses 413prices 413regulation 411–13solvency 412state guarantees 413–14supervision 414–15technical bases 412
Lindbeck, A. 114, 122, 150, 1764,10
Lindeboom, M. 140liquidity ratio 615gLithuania
social protection expenditure 199826, 27
Ljungqvist, L. 117Lloyd-Sherlock, P. 18logistical maturation curve 615glong-term care
financing benefits 316insurance 303, 317
Lorenz curve 26, 31, 35, 615glow-paid workers
earnings mobility 129–30, 129Family Credit in the United Kingdom
135net retained income 134–9, 135, 17718
tax/benefit systems, effect of 130–9,133, 135, 136–7, 138
United States Earned Income TaxCredit 134, 135, 136, 136–7,142, 17722
Lucas, R.E. 119Lundsgaard, J. 161–2
Maastricht process 171, 17729
machine tax 616gMalcolmson, J.M. 159management risk
state-operated social protectionsystems 407
mandatory private insuranceadvertising regulations 411financial regulation 409–11regulatory framework 408–15
Mandatory Retirement Savings (MRS)schemes 225, 258
Manning, A. 118Mansley, M. 374market capitalization 387–9, 40071,
616gmarket index 616gMathiesen, D.J. 40066
maturity 616gmeans testing
criticism of 304means-tested benefits 57, 130, 137–8,
150Medicare 140Mexico
social security systems 68Meyer, B.D. 149, 1766
Michael, R.T. 528
653
Index

Micklewright, J. 149micro-insurance schemes see community-
based social schemesmigration
issue brief on ageing societies andsocial protection financing523–47
replacement 167–8Milgrom, P. 152, 153minimum wage levels
effect of 118Germany 118rigidity arising from 116–17
minority shareholdersregulations to protect 417
Mitchell, O.S. 409Modigliani, F. 332, 334, 388, 3973
Moffit, R. 115money markets 558, 561, 561, 616gmonopolies
market failure, source of 156Moore, J. 155moral hazard 616g
welfare state 114, 119, 120, 1764
Mouton, P. 4668
MRS (Mandatory Retirement Savings)schemes 225, 258
Muller, K. 391
Namibiabasic universal pension 18, 86
national accountssocial protection 178–81, 423
national development plansinvestment supporting 389–91
national income 337, 616gnational social protection system
(NSPS) 20accounting framework 424–5definition 20developmental patterns 69–70, 71–2expenditure and performance reviews
447–64expenditure trends 61–70, 62,
63, 64, 69, 1024
financial architecture 22–5, 24financial governance 402flow-of-funds 22–3, 23, 24
functions 21, 21Germany 23, 24governance 402income effects 25–41, 31, 34, 36, 37
38, 39interaction with the economy 106–77,
107, 1761
legal framework and instruments404–18
origin of financing resources 22performance indicators 61, 418social protection expenditure in
Lithuania 1998 26, 27structural patterns 70, 72, 73see also state-operated protection
systems; welfare stateNazli, H. 18The Netherlands
early retirement 140interaction between welfare state and
economic performance 122–5retirement age 140social protection benefits 74unemployment 126unemployment benefits 138
Neubourg de, C. 125new entrant 616gnew institutional economics 151, 153–6
property rights approach 154–5transaction cost approach 154
New Zealandsocial expenditure projections 78, 79
Nickell, S. 117, 118Niger
family and pension benefits 65Nikkei index 360, 361non-produced assets 616gNorth America
retirement age 91social expenditure projections 78, 79see also United States
North, D.C. 151, 153Norway
social security contributions 269notional defined-contribution (NDC)
scheme 616gNSPS see national social protection
system
654
Financing social protection

O’Brien, P. 115occupational schemes
regulatory framework 408–15OECD (Organisation for Economic
Co-operation and Development)Anti-Bribery Convention 374, 39960
Fifteen principles for the regulationof private occupational pensionschemes 409
social indicators 426, 427, 4662
OECD countriesdemographic dependency versus
system dependency in pensionschemes 83–6, 84–6
interaction between welfare state andeconomic performance 126
social expenditure 62–5, 63–4, 69social expenditure projections 75–8,
76, 79, 1028
Okun, A.M. 111, 17612
old-ageformal social transfers 19informal income transfers 17see also retirees
old-age dependency ratio seedemographic ratio
Organisation for Economic Co-operationand Development see OECD
Pakistanfood consumption and distribution
equity 18Panama
actuarial valuation and social budgetprojections 430–35
social security contributions of self-employed 269
pay-as-you-go (PAYG) 281, 281contingency reserves 300, 32513
effect of schemes on savings 115formula 279funding versus PAYG debate 283–91rate setting 300–2
pay-as-you-go (PAYG) rate 617gPAYG see pay-as-you-goPellizzari, M. 529
pension financingageing population, effects of 532–8
arguments against funding schemes284–6
arguments in favour of fundingschemes 283
funding versus PAYG debate 283–91,292–8, 299–300, 32512
rate setting in fully funded schemes282, 299–300, 32512
rate setting in PAYG or scaledpremium regimes 300–2
pension fund management 340–2, 341Bulgaria establishes fully funded
second-tier pension 386–7Denmark 370–2funding pensions in transition countries
383–7, 384–5, 386–7,40071
investing reserves 340–2investment in emerging markets
379–82, 40064,65,66
pension schemesdemographic dependency versus
system dependency in pensionschemes 83–6, 84–6
early retirement schemes 139–41funding versus non-funding debate 14pay-as-you-go schemes, effect on
savings 115private contractual schemes, negative
effect on savings 115projection model demonstrating cost
development of a young Africanscheme 326–9
typical expenditure life cycle 261,263–8, 266
see also defined-benefit schemes;defined-contribution schemes
pensionsadequacy 145–7, 146, 147, 17723
Africa 65Arab States 66basic 18, 39–40contracting-out 268contribution base 270–2, 273–7financing social security pensions
261–302, 264, 326–9Hong Kong (China) 67impact of HIV/AIDS 503–9
655
Index

implicit debt 194–8, 197, 198, 21813,14
incidence of contributions 268–70,32511
Latin America 68–9, 268, 415social expenditure 65, 72socialist countries 65sustainability 164tax versus contribution financing 237–9types of contributions 272, 277, 278,
281–2universal 18, 39–40, 86Value Added Contribution (VAC)
273–7pensions accounting
national and government accounts179–80
pensions advertisingregulations 411
pensions supervision 414–15performance indicators 617g
aggregate indicator of efficiency ofsocial protection proposed458–64, 460–64, 46715,16,17,18
benefit indicators 469–71characteristics required 441–6, 46712
comprehensiveness 445consistency 445coverage 452–6, 454debt instruments 366Dominica social security fund 439–40,
440effectiveness 451–2efficiency 456–7equity 359–63,European Union 447, 448–50examples of scheme-based 475–88expenditure 456–7financial governance 418financial indicators 473–4financing 456–7governance indicators 471–3Grenada national insurance
scheme 440intelligent benchmarks 441–2, 46713
investment performance analysis 358legal indicators 468–9quantifiability 446relevance 445–6
scheme-based 439–46, 46711
social expenditure ratio (SER) 60–1,1012
social protection 436–64, 4667,8
performance measurementbenchmarking 357–9, 358social protection 436–64
Perotti, R. 117–18Persson, T. 121Peru
social security contributions 268social security systems 68
Phelan, C. 17721
Pierson, P. 112Pissarides, C.A. 150Plamandon, Pierre xxvii, 73, 1011, 316,
350, 420, 429plowback rate 617gPopper, K.R. 125population
effect of social transfers 15portfolio 618gportfolio efficiency 351–4, 352, 353,
39938,39,40
poverty 143–5absolute 32–3groups at risk 143–4informal economy 249measurement 32–4, 34measuring income inequality 26,
30–2, 31relative 32–3, 528
Russian Federation in the late 1990s305–7
poverty gap 32, 33–4, 34, 307, 617gmeasuring transfer efficiency to close
34–7, 36poverty headcount index 32, 33, 617gpoverty line 32–4, 303, 617gpoverty rate 617gpoverty target efficiency rate 35–7, 37poverty target efficiency ratio 617gpoverty trap 137, 304Preker, A. 3259
price distortion 617gprice index 617gprice-earnings ratio 364–6, 365,
39953, 617g
656
Financing social protection

priceswages, effect of 117
primary market 553–7, 617gprincipal-agent framework
asymmetrical information 152, 359,372
multi-tasking 152–3privatization 154–6, 158, 17725,26
arguments against 155–6procurement
government 161, 17725,26
produced assets 617gproduction factor 617–18gproductivity 618gproperty rights
institutional framework 154–5provident fund 65, 67, 618gpublic debt
effect of social protection financing193–8, 197, 198, 21414
explicit debt 193–4implicit debt 194–8, 197, 198,
21813,14
public financemobilizing resources 202–15strategies for resourcing 198–201, 200,
21815
tax and contribution maximizationproblem 204–7
public pension scheme 618gpublic sector
contracting out activities to the privatesector 154–5, 158, 17725,26
governance 150–6transaction cost approach 154
public sector borrowing requirement 179
rating agencies 347, 39937
emerging markets’ assets 382, 40067
re-entrant 618grecognition bond 618greference earnings 618gregional investment 373, 39959
reinsuranceBahamas private health insurance
system 262–3community-based social schemes
257
replacement migration 167–8issue brief on ageing societies and
social protection financing523–47
replacement rate 618greservation wage 115, 117, 1765, 618greserve 618g
see also social security reservesreserve ratio 618gretirees
definition 90duration of retirement 91, 10212
life expectancy 91, 10213
numbers, determinants affecting83–4
see also old-ageretirement age
effective 90–1, 91Germany 140governance, impact of 90–1, 10211
inactivity ratio 91–2, 92, 10214
increase of 92, 93–5, 100, 166, 198Japan 91lower 91The Netherlands 140North America 91United States 140see also age of entry into labour
market; early retirementretirement burden 164retirement schemes
early retirement 139–41see also pension schemes
riskdefinition 3investment 349–54, 354–5
risk avoidance 3risk coping 2, 3risk identification 2risk management 2
investment 350–5risk mitigation 2, 3risk prevention 2, 3risk reduction 2, 3risk-free asset 618gRodrik, D. 120–1Rofman, R. 414Romer, P.M. 119
657
Index

Rossi, N. 120Ruigrok, W. 168rural population
subsidies 55Russian Federation
poverty in the late 1990s 305–6Rust, J. 17721
Rutkowski, M. 306
Sachs, J.D. 168SAIL (social assistance intervention line)
303–4, 304, 619gSala-i-Martin, X. 131–2salary scale 618gSamuel, L. 402Samuelson, P.A. 283Sargent, T.J. 117SAS see social accounting systemSaudi Arabia
social expenditure 66Sauerborn, R. 18savings 39719
definition 337pay-as-you-go pension schemes, effect
of 115private pension schemes, negative
effect of 115social security, effect of 115
savings rate 618gscaled premium system 618–19gScarpetta, S. 139, 140–1, 17719
Schinasi, G.J. 40066
Schleifer, A. 155Scholz, Wolfgang xxv-xxvi, 25, 526, 73,
1011, 246, 423, 424, 429schools
welfare state permits access 120see also education
Schumpeter, Joseph A. 39824
secondary markets 557–8, 619gself-employed workers
pension contributions 268social security contributions
269–70voluntary contributions 268, 269
Sen’s poverty index 34, 529
SER (social expenditure ratio) 60–1,1012, 619g
share valuationbalance sheet 361–2, 362price-earnings ratio 364–6, 365
sharesmarkets 560–1performance indicators 359–63,
370–2valuation 361–6, 365, 39947
Shatz, H.J. 168Shin, D.-M. 202Shleifer, A. 155short-term benefits 315
impact of HIV/AIDS 511Singapore
social expenditure 67Sinn, H.W. 120Slemrod, J. 116Smeeding, T.M. 16, 17, 39, 127Smith, Adam 156SNA see United Nations System of
National AccountsSnower, D.J. 17610
social accountingdefinition of a social accounting
system (SAS) 424–5effect of social protection financing on
public deficits and debts 193–8,197, 198, 21414
financial links between social protec-tion schemes and governmentaccounts 181–93, 183–4, 185–6,188, 189–90, 2189,10,11,12
framework for a national social insur-ance scheme 419–29, 420–23,424–5, 427
indirect government subsidies andcontingent liabilities 191–3
national and government accounts178–81, 423
social accounting system (SAS) 25,424–5, 619g
from institutional accounts 28–30social assistance
categorical targeting 305, 307Demoland exercise 578–81financing 302–7, 308, 310guaranteed minimum income 303–4,
304
658
Financing social protection

impact of HIV/AIDS 511income support 303means-tested 303–4relationship with rights-based benefit
systems 307universal basic minimum income
308–12, 310, 311–12, 313–15social assistance intervention line (SAIL)
303–4, 304, 619gsocial budget 28–30, 180–1, 2185,6,7, 419,
423, 424–5as planning instrument 429–30,
430–35impact of HIV/AIDS 512–14models 73Panama 430–3Thailand 207–10, 210
social contribution ratesformulae for calculating 550–1
social exclusion 54, 249social expenditure 619g
Africa 65–6, 1025
Arab States 66, 1026
as a percentage of GDP 108, 141–3,141–2
Asia 67–8by major function internationally
103–5demographic environment, impact of
83–9, 83, 84–7, 88, 89, 99,221–2, 222
Demoland exercise 566–72developing countries 65–9economy, impact of 83, 96–9, 97–8,
10216, 221–2, 222Europe 62–5, 63–4, 69, 72, 73, 74governance, impact of 83, 89–96, 91,
92, 93–5, 99, 100, 221–2, 222health services 72, 77Hong Kong (China) 67India 67input, measure of 141–3Latin America 68–9Lithuania 1998 26, 27maturation 69–70, 71–2, 99OECD countries 62–5, 63–4, 69outcome, measure of 141–3pensions 65, 72
projections 59–61, 72–82, 1012
regions 62–70, 62–4, 1024
Singapore 67trends and patterns 61–70, 62, 63, 64,
69, 1024
unemployment benefits 77social expenditure ratio (SER) 60–1,
1012, 619gsocial governance
use of performance indicators 61social insurance
accounting framework for a nationalscheme 419–29, 420–423,424–5, 427
need for 119regulatory framework 408accounting see social accountingaffordability 50–1, 163–72, 165, 170,
171benefit maturity 70benefits by function 73, 74classification of functions 56–7coverage 207–15, 208definition 1–2, 11, 19–21, 54–8demographic maturity 69–70Demoland exercise 573–7effect on income distribution 14,
25–41, 31, 34, 36, 37 38, 39efficient public sector governance
150–6elements composing 20entitlements regardless of need
39–40estimating minimum levels of formal
46, 47–9financing in France 234–7, 234global international instruments
317–21, 318, 319–21government failures 158–63, 17725,26
health services 39impact of HIV/AIDS 503–11institutions governing 20, 57internationalization, challenge of
168–72legal framework and instruments
404–18market failures 156–8methods of delivery 181
659
Index

minimum list of needs and functions54–5
performance indicators 436–64, 4667,8
public versus private provision 156–63quasi mature state 70, 72, 99redistributive failures 158–9, 17725,26
scope of term 19–20social expenditure maturation 69–70,
71–2, 99sources of finance 181–2, 203, 232–9,
233statistics 425–9Thailand 207–10, 208, 210waste 150see also national social protection
system (NSPS); welfare stateSocial Protection Expenditure and Perfor-
mance Reviews (SPERs) 55, 450,619g
social protection reservesanalytical tools for investing 359–71,
39943
contingency reserves 300, 32513, 342–3long-term funds versus transitory
reserves 339–43management 338–44pension funds 340–2, 341rate-of-return benchmarks 358
social risk management 2, 3social security 619gsocial security contributions
actuarial formulae for main systems279–80
contribution base 270–2determining the level 282, 283–91full funding formula 280, 281, 281general average premium (GAP)
formula 280, 281, 281incidence 268–70, 32511
pay-as-you-go (PAYG) regimes 279,281, 281
scaled premium regimes 279–80, 281,281, 300–2
self-employed 269–70socially responsible investment 375–6,
39962
terminal funding formula 280,281, 281
types 272, 277, 278, 281–2Value Added Contribution (VAC)
273–7social security reserves
basic investment principles 344–6criteria of asset management in practice
346–59formulae for calculating 550institutional organization 343–4, 343investing 330–99investment strategies 369–78PAYG scheme 300, 32513
social transfers 2–4affordability 50–1, 163–72, 165, 170,
171community-based 203, 223effect on population 15efficiency 40–1, 50–1, 151–6entitlements regardless of need 39–40estimating overall normal level 41,
42–4, 45–6, 5210–12
factual evidence on the redistributiveeffects 37–41, 38, 39
formal and informal transfers 14–16,15, 17, 19, 202–3
health services 39income effects of national systems
14, 25–41, 31, 34, 36, 37 38, 39income transfers see income transfersinefficient 40, 61, 150–1market failures 156–8measuring efficiency 26, 34–7, 36, 526
mobilizing resources 202–15normal levels and the affordability
debate 50–1resource mobilization strategy 207–15sources of finance 181–2, 203, 232–9,
233tax breaks and subsidies 37, 142
social unrestwelfare state prevents 121
socialist countriesimplicit social expenditure 63, 65pensions social expenditure 65unemployment benefits 65
socially responsible investment (SRI)374–6, 39960,61,62, 63
corruption 374, 39960
660
Financing social protection

human rights 375labour standards 374–5procedures for selecting investment
portfolio 377–8social security contributions 375–6,
39962
South Africabasic income concept 309basic universal pension 18, 86
Spence, A.M. 151SPERs (Social Protection Expenditure
and Performance Reviews) 55, 450,619g
SRI see socially responsible investmentStandard & Poor’s
indices 360Standing, G. 310, 311–12, 32515
state-operated protection systemsaudits and controls 407regulatory framework 405–8see also national social protection
system (NSPS)statistics
EUROSTAT social indicators 55, 425ILO indicators 426, 428, 428OECD social indicators 426, 427, 4662
social protection 425–9Stiglitz, J.E. 151, 154, 157, 1768, 204–7stock
intrinsic value 362–3performance indicators 359–63, 370–2price-earnings ratio 364–6, 365, 39953
valuation 361–6, 365, 39947
stock exchange 619gmarkets 557–8worldwide list 559–60
stock market regulations 333, 415students
numbers, determinants affecting 83Summers, L. 117Sweden
interaction between welfare state andeconomic performance 122–5
social protection benefits 74unemployment 126
Switzerlandhealth insurance 258social protection benefits 74
social security contributions 269system dependency ratio 619g
Tabellini, G. 121take-up ratio 619gTamburi, G. 4668
tangible assets 336–7, 39716
see also non-produced assets;produced assets
Tanzi, V. 21816
tax benefits 57social transfers 37, 142United States Earned Income Tax
Credit 134, 135, 136, 136–7,142, 17722
tax competitioninternationalization, challenge of
169–71, 170, 171, 17727
taxationaverage effective tax rates (AETRs)
169, 170, 171, 17727
deadweight loss 115–16, 116incentives to work 150income effect 114low-paid labour and tax/benefit systems
130–9, 133, 135, 136–7, 138Ter Rele, H. 166terminal funding 620gTeulings, C.N. 114, 156Thailand
health care scheme 207–10, 208social budget 209–10, 210social protection 207–10, 208, 210
Thompson, L. 164time horizon 355–6, 620gTirole, J. 155, 17725,26
Titmuss, Richard 20, 109Tobin tax 318, 319–21, 620gTobin’s ‘‘q’’ 620gTogo
social expenditure 66Tommasi, D. 46710
tradeinternationalization, challenge of 168
trade unionsbargaining power 117–18‘‘insider-outsider’’ effect aggravated by
powerful 117, 17610
661
Index

transaction costsinstitutional framework 154
transfer dependency ratio 620gtransition countries 620g
funding pensions 383–7, 384–5,386–7, 40071
trickle-down effect 620gTsuru, K. 415Turkey
social security contributions 270
Ugandacommunity-based health insurance
252, 3257
Ulgenerk, E. 386–7unemployed persons 620gunemployment
by educational attainment 128, 128effects of higher benefits on 115employment protection regulation,
effect of 117Germany 126, 128impact of HIV/AIDS 502, 510, 510,
5172, 519‘‘insider-outsider’’ theory 117The Netherlands 126numbers unemployed, determinants
affecting 83projections 97Sweden 126United Kingdom 126, 128United States 126welfare state, effect on 126
unemployment benefitsAfrica 65Asia 67expenditure projections 77financing 315–17generous levels, effect of 117Hong Kong (China) 67Iran 67The Netherlands 138socialist countries 65
unemployment insurance 149impact of HIV/AIDS 510–11
unemployment trap 130, 133, 137, 150unfunded liability 620gunit cost 621g
United KingdomDepartment for Work and Pensions
(DWP) 406Family Credit 135Government Actuary’s Department
(GAD) 406National Audit Office (NAO) 407social protection benefits 74Social Security Act 1980 406social security contributions 269–70unemployment 126, 128
United Nations System of NationalAccounts (SNA) 25
public social benefits 178–9, 180, 2182
social accounting system (SAS) linkswith 425
United Nations Universal Declaration ofHuman Rights 1948 375
United Statesaudit and control of social protection
scheme 407defined-benefit schemes 140Earned Income Tax Credit (EITC)
134, 135, 136, 136–7, 142,17722
health care system compared withChina 259–61
health insurance 140Medicare health insurance 140ratio of private to public transfers
1935–80 16, 17retirement age 140Social Security Act 1935 404Social Security Administration (SSA)
406, 407unemployment 126welfare state compared with the
European model 131–2see also North America
universal benefits 621gbasic income 308–12, 310, 311–12,
313–15Demoland pension scheme 586–92pensions 18, 39–40, 86
Uruguaysocial security systems 68
Useem, M. 409utilization frequency 621g
662
Financing social protection

valuationequity 361–6, 365, 39947
future cash flows 362–6pension fund assets 411
van de Meerendonk, Arthur xxvi, 158,17613
van Tulder, R. 168Van Waarden, F. 110–11Vishny, R.W. 155Vittas, D. 392, 40074
von Hagen, J. 39821
von Steyn, J.H. 39821
wage differentials 126–7, 17614
wage formationrigidities arising from 117–18
wage share of GDP 621gwages
prices, effect on 117welfare (means-tested social assistance)
financing 302–7welfare state 51
affordability 50–1, 163–72, 165,170, 171
builds trust and prevents social unrest121
categories of regimes 109–10compliance costs as argument against
113–14conservative regime 109–10corporatist regime 109–10deadweight loss of taxation 115–16,
116definition 20Demoland exercise 573–7efficient in providing insurance 119enables economic subjects to take risks
120, 17612
European and American modelscompared 131–2
excessive administrative costs asargument against 113
facilitates economic restructuring120–1
Germany 122–5internationalization, challenge of
168–72labour market, effect on 126–30
labour supply, effect on 114–15, 1766,7
liberal regimes 109–10link with earnings distributions 127–8moral hazard 114, 119, 120, 1764
negative effects on economicperformance 112–19
The Netherlands 122–5permit access to schooling facilities
120positive effects on economic
performance 119–21poverty alleviation 119–21productivity growth slowed down by
118–19retrenchments 111, 112rigidities caused by, criticism of
116–17social democratic regime 109–10Sweden 122–5unemployment, effect on 126welfare outcome of different
types 143–7see also national social protection
system (NSPS); socialprotection
WHO see World Health OrganizationWilliamson, O.E. 153, 154Wise, D. 139, 140women
control of household income 18educational level 18, 521
Pakistan 18see also gender difference
Wood, A. 168workfare 308, 309, 32515
World Bankinternational comparison of primary
financial market developments379
social risk management 2, 3World Health Organization (WHO)
disability-adjusted life expectancy(DALE) indicator 457, 458,46714
Zedillo Report 318Zeira, J. 120Zlaoui, L. 386–7
663
Index

Q U A N T I T A T I V E M E T H O D S I N S O C I A L P R O T E C T I O N S E R I E S
Financing social protectionDesigning social protection systems that are effective andequitable, and fiscally, financially and economically efficient,has been a challenge for many countries as well as a source ofsubstantive debate the world over. Formal social protectionsystems (through transfers in cash and in kind) redistributebetween 5 per cent (in developing countries) and 35 per cent(in OECD countries) of their gross domestic product. Oneof the first volumes of its kind, this book addresses thesechallenges by offering a comprehensive overview of the manyfinancing options available, while also providing a thoroughanalysis of their advantages and disadvantages and theirfinancial and economic implications.
The most important task of social protection systems is toalleviate and prevent poverty – with this in mind, the bookpresents a “methodological toolbox” from which socialprotection planners, managers and social policy analysts canwork. Written by practitioners for practitioners, the bookdiscusses the design and maintenance of national socialprotection systems that ensure an effective and efficient useof available resources at the community, national andinternational levels, while supporting long-term economicdevelopment. Each chapter includes stylized real-lifeexamples that deal with the theory, as well as practical policyquestions. The book also guides readers through the policy process that determines the affordable levels of, andscope of, social protection in a given country.
INTERNATIONAL LABOUR OFFICE • GENEVA
INTERNATIONAL SOCIAL SECURITY ASSOCIATION
Price:100 Swiss francs9 789221 151227
ISBN 92-2-115122-0
FinancingsocialprotectionMichael CichonWolfgang ScholzArthur van de MeerendonkKrzysztof HagemejerFabio BertranouPierre Plamondon
International SocialSecurity Association
International Labour OfficeGeneva
Financing social protection
Q U A N T I T A T I V E M E T H O D S I N S O C I A L P R O T E C T I O N S E R I E S
Financing Cover 5/19/04 10:02 AM Page 1


![Adnane CNOPS [Mode de compatibilité] - Social Protection](https://img.dokumen.tips/doc/110x75/633fa577e7f8aecbec02586c/adnane-cnops-mode-de-compatibilite-social-protection.jpg)


