Embed Size (px)
Citation preview
econstorMake Your Publications Visible.
A Service of
zbwLeibniz-InformationszentrumWirtschaftLeibniz Information Centrefor Economics
Manasan, Rosario G.
Working Paper
Financing the Millennium Development Goals: ThePhilippines
PIDS Discussion Paper Series, No. 2007-06
Provided in Cooperation with:Philippine Institute for Development Studies (PIDS), Philippines
Suggested Citation: Manasan, Rosario G. (2007) : Financing the Millennium DevelopmentGoals: The Philippines, PIDS Discussion Paper Series, No. 2007-06, Philippine Institute forDevelopment Studies (PIDS), Makati City
This Version is available at:http://hdl.handle.net/10419/127943
Standard-Nutzungsbedingungen:
Die Dokumente auf EconStor dürfen zu eigenen wissenschaftlichenZwecken und zum Privatgebrauch gespeichert und kopiert werden.
Sie dürfen die Dokumente nicht für öffentliche oder kommerzielleZwecke vervielfältigen, öffentlich ausstellen, öffentlich zugänglichmachen, vertreiben oder anderweitig nutzen.
Sofern die Verfasser die Dokumente unter Open-Content-Lizenzen(insbesondere CC-Lizenzen) zur Verfügung gestellt haben sollten,gelten abweichend von diesen Nutzungsbedingungen die in der dortgenannten Lizenz gewährten Nutzungsrechte.
Terms of use:
Documents in EconStor may be saved and copied for yourpersonal and scholarly purposes.
You are not to copy documents for public or commercialpurposes, to exhibit the documents publicly, to make thempublicly available on the internet, or to distribute or otherwiseuse the documents in public.
If the documents have been made available under an OpenContent Licence (especially Creative Commons Licences), youmay exercise further usage rights as specified in the indicatedlicence.
www.econstor.eu
For comments, suggestions or further inquiries please contact:
Philippine Institute for Development StudiesSurian sa mga Pag-aaral Pangkaunlaran ng Pilipinas
The PIDS Discussion Paper Seriesconstitutes studies that are preliminary andsubject to further revisions. They are be-ing circulated in a limited number of cop-ies only for purposes of soliciting com-ments and suggestions for further refine-ments. The studies under the Series areunedited and unreviewed.
The views and opinions expressedare those of the author(s) and do not neces-sarily reflect those of the Institute.
Not for quotation without permissionfrom the author(s) and the Institute.
The Research Information Staff, Philippine Institute for Development Studies
5th Floor, NEDA sa Makati Building, 106 Amorsolo Street, Legaspi Village, Makati City, Philippines
Tel Nos: (63-2) 8942584 and 8935705; Fax No: (63-2) 8939589; E-mail: [email protected]
Or visit our website at http://www.pids.gov.ph
June 2007
DISCUSSION PAPER SERIES NO. 2007-06
Rosario G. Manasan
Financing the MillenniumDevelopment Goals: The Philippines
Financing the Millennium Development Goals:
The Philippines (Final Report)
Rosario G. Manasan
April 2007
Table of Contents Page 1. INTRODUCTION 1 1.1 The Context 2 1.2 Objective of the Study 5 1.3 Limitation 6 2. APPROACH AND METHODOLOGY 6 2.1 Estimating Resource Requirements for Basic Social Services 7 2.2 Estimating Resource Availability 9 3. RESOURCE REQUIREMENTS AND RESOURCE GAPS 11 3.1 Goal 1 – Reducing Poverty 11 3.2 Goal 2 – Universal Access to Basic Education 14 3.3 Goals 4, 5, and 6 – Health-Related MDGs 24 4. CONCLUSIONS 41 REFERENCE 51
i
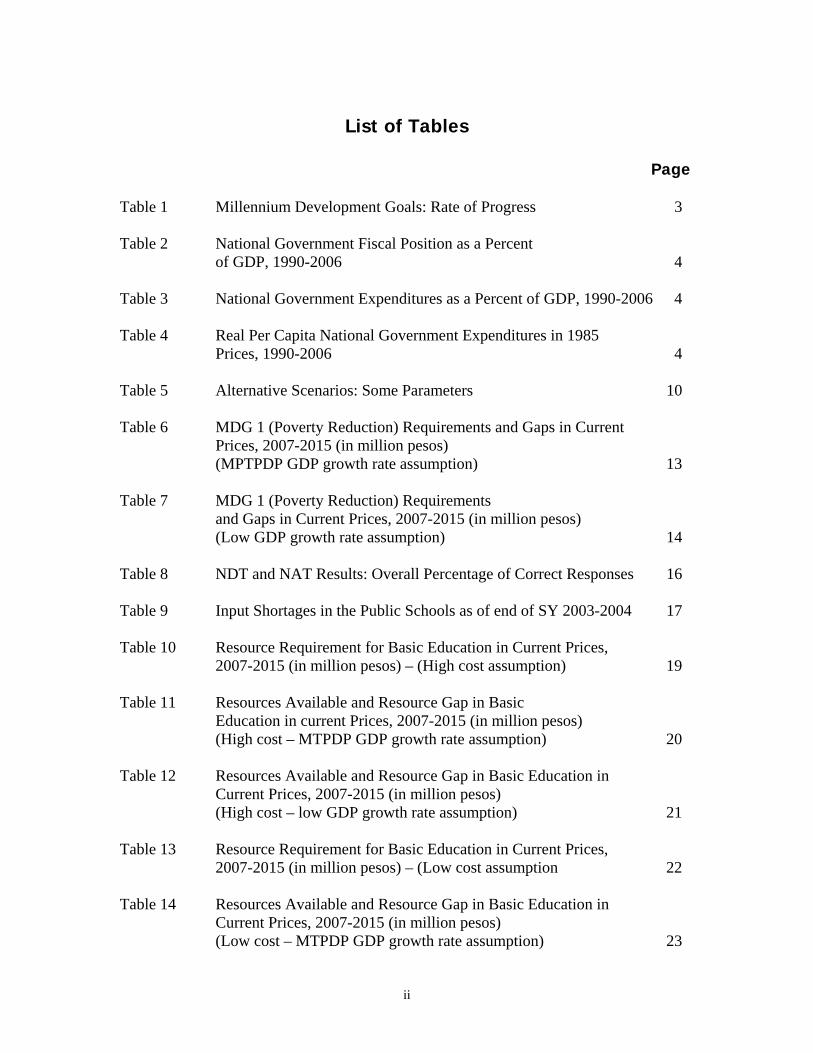
List of Tables
Page Table 1 Millennium Development Goals: Rate of Progress 3 Table 2 National Government Fiscal Position as a Percent of GDP, 1990-2006 4 Table 3 National Government Expenditures as a Percent of GDP, 1990-2006 4 Table 4 Real Per Capita National Government Expenditures in 1985 Prices, 1990-2006 4 Table 5 Alternative Scenarios: Some Parameters 10 Table 6 MDG 1 (Poverty Reduction) Requirements and Gaps in Current Prices, 2007-2015 (in million pesos) (MPTPDP GDP growth rate assumption) 13 Table 7 MDG 1 (Poverty Reduction) Requirements and Gaps in Current Prices, 2007-2015 (in million pesos) (Low GDP growth rate assumption) 14 Table 8 NDT and NAT Results: Overall Percentage of Correct Responses 16 Table 9 Input Shortages in the Public Schools as of end of SY 2003-2004 17 Table 10 Resource Requirement for Basic Education in Current Prices, 2007-2015 (in million pesos) – (High cost assumption) 19 Table 11 Resources Available and Resource Gap in Basic Education in current Prices, 2007-2015 (in million pesos) (High cost – MTPDP GDP growth rate assumption) 20 Table 12 Resources Available and Resource Gap in Basic Education in Current Prices, 2007-2015 (in million pesos) (High cost – low GDP growth rate assumption) 21 Table 13 Resource Requirement for Basic Education in Current Prices, 2007-2015 (in million pesos) – (Low cost assumption 22 Table 14 Resources Available and Resource Gap in Basic Education in Current Prices, 2007-2015 (in million pesos) (Low cost – MTPDP GDP growth rate assumption) 23
ii

Page Table 15 Resource Available and Resource Gap in Basic Education in Current Prices, 2007-2015 (in million pesos) (Low cost – low GDP growth rate assumption) 24 Table 16 Maternal Health Indicators 26 Table 17 Notifiable Diseases: Reported Cases Number and Rate/ 100,000 Population 27 Table 18 Resource Requirement for Basic Health in Current Prices at the Central Government Level, 20017-2015 (in million pesos) (High cost assumption) 31 Table 19 Resources Available and Resource Gap in Basic Health in Current Prices at the Central Government Level, 2007-2015 (in million pesos) – (High cost – MTPDP GDP growth rate assumption) 32 Table 20 Resources Available and Resource Gap in Basic Health in Current Prices at the Central Government Level, 2007-2015 (in million pesos) – (High cost – low GDP growth rate assumption) 33 Table 21 LGU Resource Requirement for Health MDGs in Current Prices, 2007-2015 (in million pesos) – (High cost assumption) 34 Table 22 LGU Resource Gap for Health MDGs in Current Prices, 2007-2015 (in million pesos) – (High cost assumption) 34 Table 23 Resource Requirement for Basic Health in Current Prices at the Central Government Level, 2007-2015 (in million pesos) (Low cost assumption) 35 Table 24 Resource Available and Resource Gap in Basic Health in Current Prices at the Central Government Level, 2007-2015 (in million pesos) – (Low cost – MTPDP GDP growth rate assumption) 36 Table 25 Resource Available and Resource Gap in Basic Health in Current Prices at the Central Government Level, 2007-2015 (in million pesos) – (Low cost – low GDP growth rate assumption) 37
iii
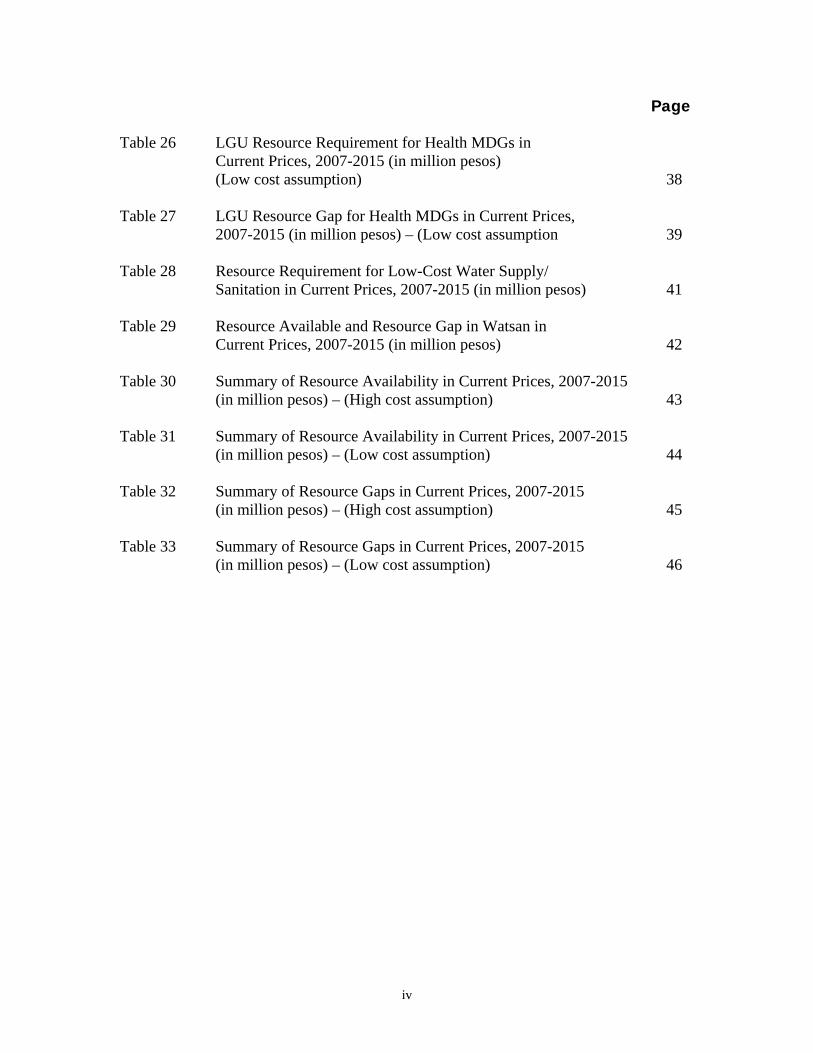
Page Table 26 LGU Resource Requirement for Health MDGs in Current Prices, 2007-2015 (in million pesos) (Low cost assumption) 38 Table 27 LGU Resource Gap for Health MDGs in Current Prices, 2007-2015 (in million pesos) – (Low cost assumption 39 Table 28 Resource Requirement for Low-Cost Water Supply/ Sanitation in Current Prices, 2007-2015 (in million pesos) 41 Table 29 Resource Available and Resource Gap in Watsan in Current Prices, 2007-2015 (in million pesos) 42 Table 30 Summary of Resource Availability in Current Prices, 2007-2015
(in million pesos) – (High cost assumption) 43 Table 31 Summary of Resource Availability in Current Prices, 2007-2015 (in million pesos) – (Low cost assumption) 44 Table 32 Summary of Resource Gaps in Current Prices, 2007-2015 (in million pesos) – (High cost assumption) 45 Table 33 Summary of Resource Gaps in Current Prices, 2007-2015 (in million pesos) – (Low cost assumption) 46
iv
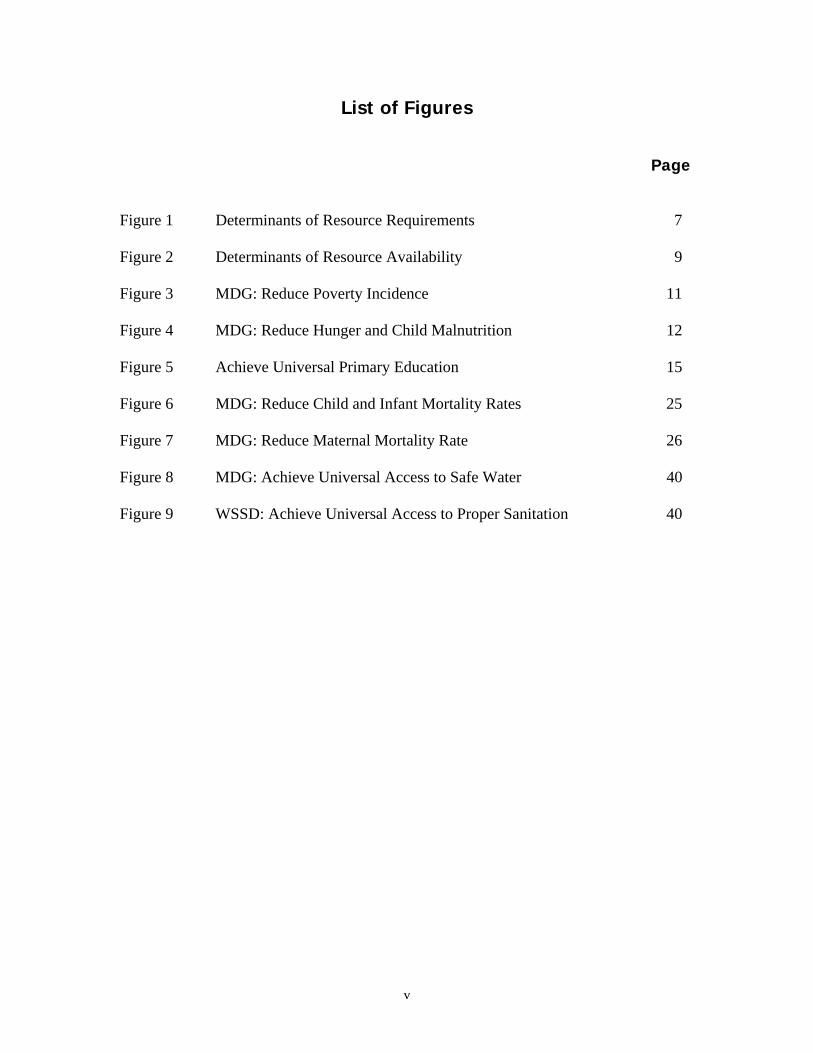
List of Figures Page Figure 1 Determinants of Resource Requirements 7 Figure 2 Determinants of Resource Availability 9 Figure 3 MDG: Reduce Poverty Incidence 11 Figure 4 MDG: Reduce Hunger and Child Malnutrition 12 Figure 5 Achieve Universal Primary Education 15 Figure 6 MDG: Reduce Child and Infant Mortality Rates 25 Figure 7 MDG: Reduce Maternal Mortality Rate 26 Figure 8 MDG: Achieve Universal Access to Safe Water 40 Figure 9 WSSD: Achieve Universal Access to Proper Sanitation 40
v
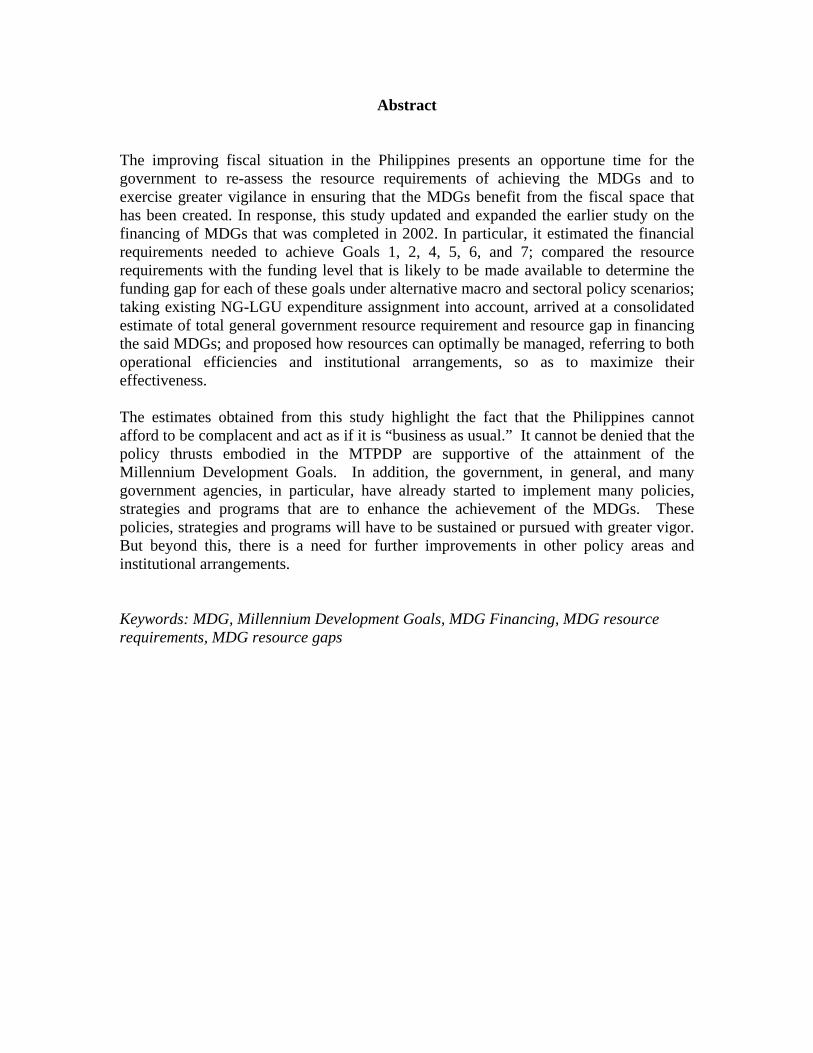
Abstract The improving fiscal situation in the Philippines presents an opportune time for the government to re-assess the resource requirements of achieving the MDGs and to exercise greater vigilance in ensuring that the MDGs benefit from the fiscal space that has been created. In response, this study updated and expanded the earlier study on the financing of MDGs that was completed in 2002. In particular, it estimated the financial requirements needed to achieve Goals 1, 2, 4, 5, 6, and 7; compared the resource requirements with the funding level that is likely to be made available to determine the funding gap for each of these goals under alternative macro and sectoral policy scenarios; taking existing NG-LGU expenditure assignment into account, arrived at a consolidated estimate of total general government resource requirement and resource gap in financing the said MDGs; and proposed how resources can optimally be managed, referring to both operational efficiencies and institutional arrangements, so as to maximize their effectiveness. The estimates obtained from this study highlight the fact that the Philippines cannot afford to be complacent and act as if it is “business as usual.” It cannot be denied that the policy thrusts embodied in the MTPDP are supportive of the attainment of the Millennium Development Goals. In addition, the government, in general, and many government agencies, in particular, have already started to implement many policies, strategies and programs that are to enhance the achievement of the MDGs. These policies, strategies and programs will have to be sustained or pursued with greater vigor. But beyond this, there is a need for further improvements in other policy areas and institutional arrangements. Keywords: MDG, Millennium Development Goals, MDG Financing, MDG resource requirements, MDG resource gaps
FINANCING THE MILLENNIUM DEVELOPMENT GOALS: THE PHILIPPINES
Rosario G. Manasan
1. INTRODUCTION In September 2000, member states of the United Nations, including the Philippines, gathered at the Millennium Summit and adopted the Millennium Declaration which affirmed their commitment to the Millennium Development Goals (MDGs): Goal 1: Eradicate extreme poverty and hunger
• Halve the proportion of population living below the food threshold between 1990 and 2015 below the overall poverty threshold between 1990 and 2015
• Halve the proportion of households with per capita intake below 100% of the dietary energy requirement between 1990 and 2015
• Halve the prevalence of malnutrition among 0-5 year old children between 1990 and 2015
Goal 2: Achieve universal primary education
• Achieve 100% participation rate by 2015 • Achieve 100% cohort survival rate at the elementary level by 2015
Goal 3: Promote gender equality and empower women
• Achieve a 1:1 ratio of girls to boys elementary level by 2015 secondary level by 2015
Goal 4: Reduce child mortality
• Reduce by two-thirds the infant mortality rate by 2015 • Reduce by two-thirds the under-5 mortality rate by 2015
Goal 5: Improve maternal health • Reduce the maternal mortality rate by three-quarters by 2015 • Increase the prevalence of couples practicing responsible parenthood to
70% by 2015 Goal 6: Combat HIV/ AIDS, malaria and other diseases
• Maintain prevalence of HIV/ AIDS at less than 1 up to 2015 • Reduce malaria morbidity rate from 123 per 100,000 population in 1990 to
24 per 100,000 in 2015
1
Goal 7: Ensure environmental sustainability • Halve the proportion of households with no access to safe drinking water
and basic sanitation from 26% in 1991 to 13% in 2015
Goal 8: Develop a global partnership for development • Develop further an open, rules-based, predictable, non-discriminatory
trading and financial system, including a commitment to good governance • Deal comprehensively with debt problems of developing countries through
national and international measures in order to make debts sustainable in the long-term
1.1. The Context Table 1 summarizes the rate of progress toward the achievement of the MDGs and compares average rate of progress to date (1990-2002/3) with the rate of progress that is required in 2002/3-2015 if the MDG targets are to be met. A comparison of the average rate of progress in 1990-202/3 with the rate needed to achieve the MDGs for the reduction of poverty, the reduction in the infant and under-5 mortality rates, and the increase in the access to safe water and sanitation indicates that maintaining the current rate of progress is adequate to bring about the achievement of said goals by 2015. In contrast, Table 1 shows that the rate of progress required to meet the MDG targets with respect to under-5 malnutrition rate, the per capita dietary energy requirement, elementary participation rate, the cohort survival rate at the elementary level, maternal mortality rate and the contraceptive prevalence rate are all higher than the actual rate of progress to date. In other words, the country has to do better than its historical performance to date in certain aspects of three out of the seven quantifiable goals, At the same time, the severe fiscal constraints that the Philippines has had to contend in the years following the Asian financial crisis had constricted the flow of resources aimed at meeting the MDGs. Table 2 shows the weakening of national government’s fiscal position as a result of the deterioration of tax effort in 1998-2004. Some fiscal consolidation is evident in 2003-2006.1 However, most of the improvement in the national government’s fiscal position, particularly in 2003-2005, came about at the expense of productive expenditures. Also, the size of the national government’s debt stock and debt service continue to be a major cause of concern. Table 3 shows how the social services (including education and health) and the infrastructure sectors bore the burden of the adjustment. Total social sector spending of the national government declined from 5.5% of GDP in 1998 to 3.4% in 2004 and 3.7% in 2006 while infrastructure spending went down from 2.8% in 1994 to 1.4% in 2006. Also, the national government’s real per capita spending on social services fell from PhP 678 in 1997 to PhP 470 in 2004 and PhP 528 in 2006 (Table 4). As a consequence, the social services sectors suffered huge backlogs in financing the input requirements and/or in achieving the intermediate output targets in support of the MDGs. 1 This trend has been strengthened with the higher government revenue collection following the increase in the VAT rate in 2006.
2
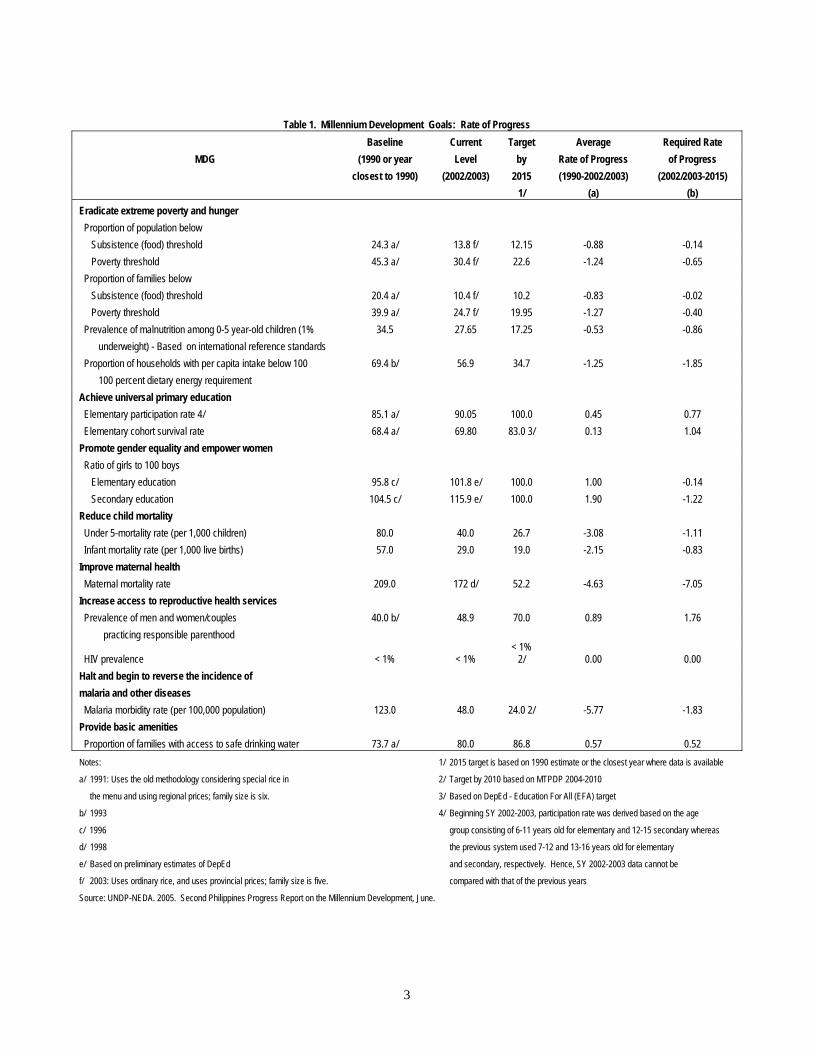
Table 1. Millennium Development Goals: Rate of Progress
Baseline Current Target Average Required Rate MDG (1990 or year Level by Rate of Progress of Progress
closest to 1990) (2002/2003) 2015 (1990-2002/2003) (2002/2003-2015) 1/ (a) (b) Eradicate extreme poverty and hunger Proportion of population below Subsistence (food) threshold 24.3 a/ 13.8 f/ 12.15 -0.88 -0.14 Poverty threshold 45.3 a/ 30.4 f/ 22.6 -1.24 -0.65 Proportion of families below Subsistence (food) threshold 20.4 a/ 10.4 f/ 10.2 -0.83 -0.02 Poverty threshold 39.9 a/ 24.7 f/ 19.95 -1.27 -0.40 Prevalence of malnutrition among 0-5 year-old children (1% 34.5 27.65 17.25 -0.53 -0.86 underweight) - Based on international reference standards Proportion of households with per capita intake below 100 69.4 b/ 56.9 34.7 -1.25 -1.85 100 percent dietary energy requirement Achieve universal primary education Elementary participation rate 4/ 85.1 a/ 90.05 100.0 0.45 0.77 Elementary cohort survival rate 68.4 a/ 69.80 83.0 3/ 0.13 1.04 Promote gender equality and empower women Ratio of girls to 100 boys Elementary education 95.8 c/ 101.8 e/ 100.0 1.00 -0.14 Secondary education 104.5 c/ 115.9 e/ 100.0 1.90 -1.22 Reduce child mortality Under 5-mortality rate (per 1,000 children) 80.0 40.0 26.7 -3.08 -1.11 Infant mortality rate (per 1,000 live births) 57.0 29.0 19.0 -2.15 -0.83 Improve maternal health Maternal mortality rate 209.0 172 d/ 52.2 -4.63 -7.05 Increase access to reproductive health services Prevalence of men and women/couples 40.0 b/ 48.9 70.0 0.89 1.76 practicing responsible parenthood
HIV prevalence < 1% < 1% < 1%
2/ 0.00 0.00 Halt and begin to reverse the incidence of malaria and other diseases Malaria morbidity rate (per 100,000 population) 123.0 48.0 24.0 2/ -5.77 -1.83 Provide basic amenities Proportion of families with access to safe drinking water 73.7 a/ 80.0 86.8 0.57 0.52 Notes: 1/ 2015 target is based on 1990 estimate or the closest year where data is available
a/ 1991: Uses the old methodology considering special rice in 2/ Target by 2010 based on MTPDP 2004-2010
the menu and using regional prices; family size is six. 3/ Based on DepEd - Education For All (EFA) target
b/ 1993 4/ Beginning SY 2002-2003, participation rate was derived based on the age
c/ 1996 group consisting of 6-11 years old for elementary and 12-15 secondary whereas
d/ 1998 the previous system used 7-12 and 13-16 years old for elementary
e/ Based on preliminary estimates of DepEd and secondary, respectively. Hence, SY 2002-2003 data cannot be
f/ 2003: Uses ordinary rice, and uses provincial prices; family size is five. compared with that of the previous years
Source: UNDP-NEDA. 2005. Second Philippines Progress Report on the Millennium Development, June.
3
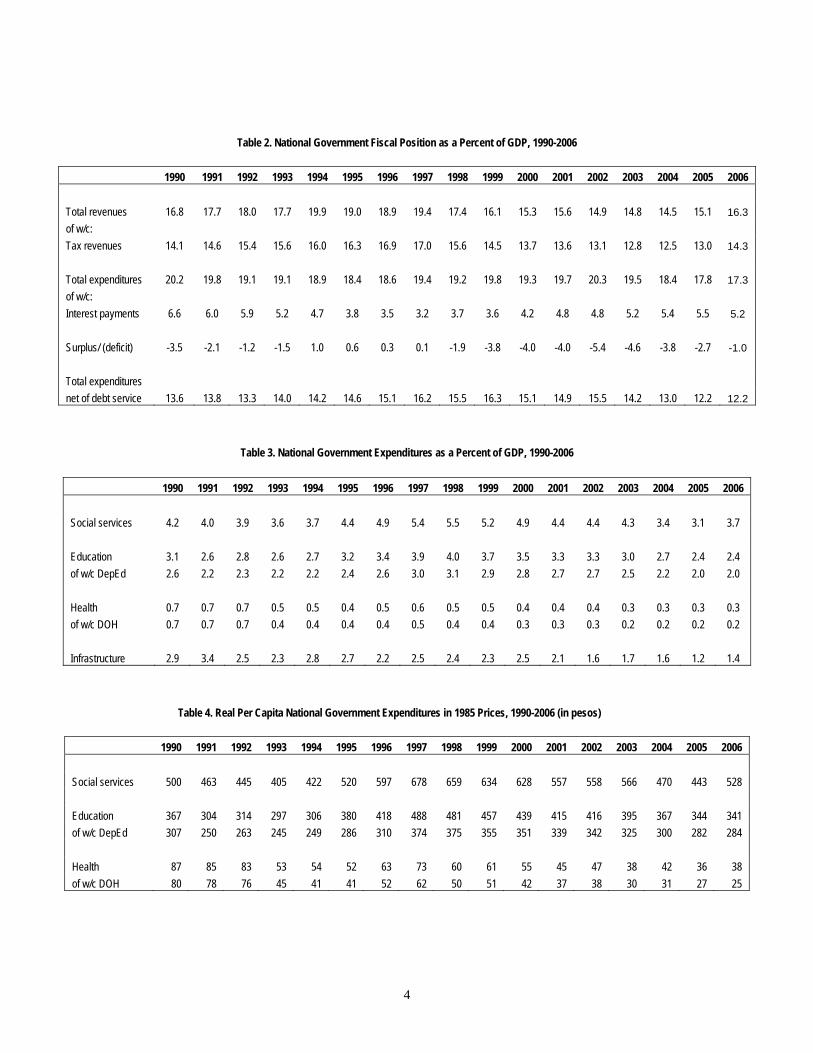
Table 2. National Government Fiscal Position as a Percent of GDP, 1990-2006 1990 1991 1992 1993 1994 1995 1996 1997 1998 1999 2000 2001 2002 2003 2004 2005 2006 Total revenues 16.8 17.7 18.0 17.7 19.9 19.0 18.9 19.4 17.4 16.1 15.3 15.6 14.9 14.8 14.5 15.1 16.3 of w/c: Tax revenues 14.1 14.6 15.4 15.6 16.0 16.3 16.9 17.0 15.6 14.5 13.7 13.6 13.1 12.8 12.5 13.0 14.3 Total expenditures 20.2 19.8 19.1 19.1 18.9 18.4 18.6 19.4 19.2 19.8 19.3 19.7 20.3 19.5 18.4 17.8 17.3 of w/c: Interest payments 6.6 6.0 5.9 5.2 4.7 3.8 3.5 3.2 3.7 3.6 4.2 4.8 4.8 5.2 5.4 5.5 5.2 Surplus/ (deficit) -3.5 -2.1 -1.2 -1.5 1.0 0.6 0.3 0.1 -1.9 -3.8 -4.0 -4.0 -5.4 -4.6 -3.8 -2.7 -1.0 Total expenditures net of debt service 13.6 13.8 13.3 14.0 14.2 14.6 15.1 16.2 15.5 16.3 15.1 14.9 15.5 14.2 13.0 12.2 12.2
Table 3. National Government Expenditures as a Percent of GDP, 1990-2006 1990 1991 1992 1993 1994 1995 1996 1997 1998 1999 2000 2001 2002 2003 2004 2005 2006 Social services 4.2 4.0 3.9 3.6 3.7 4.4 4.9 5.4 5.5 5.2 4.9 4.4 4.4 4.3 3.4 3.1 3.7 Education 3.1 2.6 2.8 2.6 2.7 3.2 3.4 3.9 4.0 3.7 3.5 3.3 3.3 3.0 2.7 2.4 2.4 of w/c DepEd 2.6 2.2 2.3 2.2 2.2 2.4 2.6 3.0 3.1 2.9 2.8 2.7 2.7 2.5 2.2 2.0 2.0 Health 0.7 0.7 0.7 0.5 0.5 0.4 0.5 0.6 0.5 0.5 0.4 0.4 0.4 0.3 0.3 0.3 0.3 of w/c DOH 0.7 0.7 0.7 0.4 0.4 0.4 0.4 0.5 0.4 0.4 0.3 0.3 0.3 0.2 0.2 0.2 0.2 Infrastructure 2.9 3.4 2.5 2.3 2.8 2.7 2.2 2.5 2.4 2.3 2.5 2.1 1.6 1.7 1.6 1.2 1.4
Table 4. Real Per Capita National Government Expenditures in 1985 Prices, 1990-2006 (in pesos) 1990 1991 1992 1993 1994 1995 1996 1997 1998 1999 2000 2001 2002 2003 2004 2005 2006 Social services 500 463 445 405 422 520 597 678 659 634 628 557 558 566 470 443 528 Education 367 304 314 297 306 380 418 488 481 457 439 415 416 395 367 344 341 of w/c DepEd 307 250 263 245 249 286 310 374 375 355 351 339 342 325 300 282 284 Health 87 85 83 53 54 52 63 73 60 61 55 45 47 38 42 36 38 of w/c DOH 80 78 76 45 41 41 52 62 50 51 42 37 38 30 31 27 25
4
For instance, the public school system has a backlog of 37,587 teachers in schools with severe teacher deficits as of the end of SY 2003-2004. Similarly, the system lacks 4,999 classrooms in double-shift schools that have severe classroom-deficits and another 26,953 classrooms in single-shift schools with severe deficits. In 2005, three new tax measures were passed by Congress: (i) amendments to the excise taxes on sin products, (ii) reformed VAT law that not only limits exemptions but also raises the VAT rate, and (iii) the lateral attrition law which provides incentives to the tax collection agencies to improve their performance. The additional revenues that are forthcoming from these measures have enabled the government not only to reduce its fiscal deficit but also to increase its capacity to finance the MDGs. 1.2. Objectives of the Study Given this perspective, the improving fiscal situation in the Philippines presents an opportune time for the government to re-assess the resource requirements of achieving the MDGs and to exercise greater vigilance in ensuring that the MDGs benefit from the fiscal space that has been created. This study aims to support this initiative by updating and expanding the earlier study on the financing of MDGs that was completed in 2002. That study generated estimates of the financing gaps and the needed policy measures for the attainment of the MDGs. It should be emphasized that reaching the development goals require not only additional financial resources (from both domestic and external sources) but also enabling policies and institutional environment that will ensure that said resources are utilized efficiently and effectively.
Specifically, the study will: (1) estimate the financial requirements needed to achieve Goals 1, 2, 4, 5, 6, and 7; (2) compare the resource requirements with the funding level that is likely to be made
available to determine the funding gap for each of these goals under alternative macro and sectoral policy scenarios;
(3) taking existing NG-LGU expenditure assignment into account, arrive at a consolidated estimate of total general government resource requirement and resource gap in financing the said MDGs; and
(4) propose how resources can optimally be managed, referring to both operational efficiencies and institutional arrangements, so as to maximize their effectiveness.
This study essentially brings up to date the estimates made earlier in 2002 of the resource requirements and resource gaps that are pertinent to the attainment of the MDGs on primary education, child mortality, maternal health, HIV/AIDS, malaria and other diseases, and environmental sustainability given the backlogs in inputs and/or intermediate outputs existing to date. However, it introduces three new items for consideration. First, the present paper provides estimates of the resource requirements and resource gaps with respect to the achievement of the MDG on poverty reduction. Second, it specifically addresses the role of LGUs in financing the MDGs and presents estimates of the amount of resources that are likely to be made available by LGUs in the financing Goal 1 (poverty reduction) and Goal 2 (universal access to primary education).
5
It also presents estimates of the resource requirements and resource gaps at the LGU level with respect to Goal 4 (child health), Goal 5 (maternal health), and Goal 6 (control of HIV/ AIDS and other diseases). Third, the estimate of the amount of resources that is likely to be generated by the national government takes into account the additional revenues that are likely to be forthcoming from the new tax measures that were legislated in 2005/6. 1.3. Limitation The estimate of the resource requirement for meeting Goal 1 refers only to the investments needed for pro-poor growth and, as such, focuses only on poverty reduction. Said estimate does not include the funding support needed for addressing hunger per se. In the medium/ long-term, poverty reduction should translate to reducing hunger. In the short run, however, hunger might persist even with declining poverty incidence. On the other hand, the estimate of the resource requirement for meeting Goal 7 (environmental sustainability) only includes the cost of improving access to safe water and sanitation. It does not cover the cost of prevention and control of environmental degradation nor the cost of managing natural resources in a sustainable manner. In contrast, Goal 3 (gender equality) is addressed indirectly and only in a limited fashion in this paper. To the extent that resource requirement estimates for basic education (Goal 2) and the health-related MDGs (Goals 4, 5 and 6) aim to ensure that there will be enough resources for both boys and girls, both men and women, gender equality is enhanced. However, this paper does not provide estimates of the funding needed for remedial actions that are meant to respond to various sources of gender inequality and/ or interventions that are aimed at promoting gender equality more directly. 2. APPROACH AND METHODOLOGY This study draws heavily from the results of the Edillon (2006) in estimating the amount of resources needed to halve poverty incidence by 2015 relative to its 1990 level. She explicitly modeled the relationship between poverty reduction and economic growth in the Philippines. Her results show that asset distribution (i.e., land reform) and investments in infrastructure (roads and electrification, in particular) are significant determinants of poverty reduction. More importantly, her study reveals that the distribution of the same investments in favor of lagging regions contributes significantly to make growth more pro-poor. Her study also shows that reducing poverty requires additional investments on roads, electrification and the completion of the land redistribution under the Comprehensive Agrarian Reform Program (CARP). This paper uses these results to arrive at estimates of the resource requirements for achieving the MDG goal on poverty reduction. On the other hand, the approach followed in this paper in estimating the resource requirements for the provision of the basic social services that are needed to meet the
6
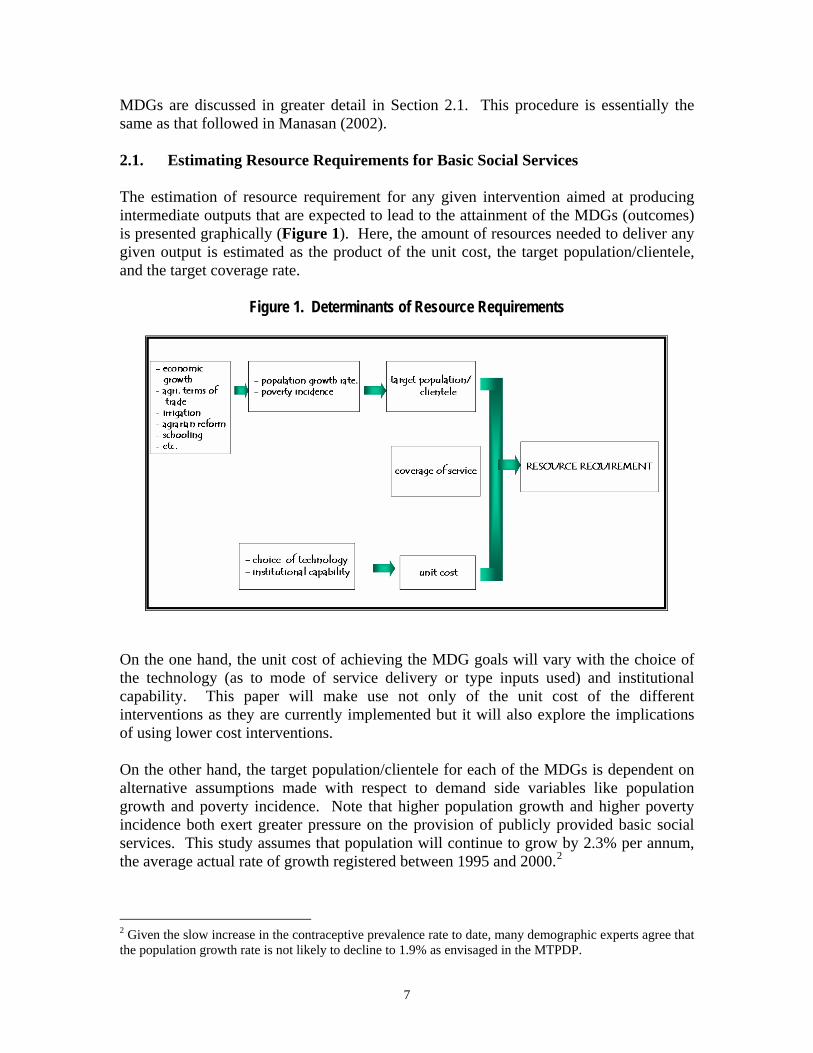
MDGs are discussed in greater detail in Section 2.1. This procedure is essentially the same as that followed in Manasan (2002). 2.1. Estimating Resource Requirements for Basic Social Services The estimation of resource requirement for any given intervention aimed at producing intermediate outputs that are expected to lead to the attainment of the MDGs (outcomes) is presented graphically (Figure 1). Here, the amount of resources needed to deliver any given output is estimated as the product of the unit cost, the target population/clientele, and the target coverage rate.
Figure 1. Determinants of Resource Requirements
On the one hand, the unit cost of achieving the MDG goals will vary with the choice of the technology (as to mode of service delivery or type inputs used) and institutional capability. This paper will make use not only of the unit cost of the different interventions as they are currently implemented but it will also explore the implications of using lower cost interventions. On the other hand, the target population/clientele for each of the MDGs is dependent on alternative assumptions made with respect to demand side variables like population growth and poverty incidence. Note that higher population growth and higher poverty incidence both exert greater pressure on the provision of publicly provided basic social services. This study assumes that population will continue to grow by 2.3% per annum, the average actual rate of growth registered between 1995 and 2000.2
2 Given the slow increase in the contraceptive prevalence rate to date, many demographic experts agree that the population growth rate is not likely to decline to 1.9% as envisaged in the MTPDP.
7
In turn, the poverty incidence in any given year depends on the level and quality of economic growth. In this study, it is assumed that all of the investment measures required to meet the MDG on poverty reduction will be financed and that poverty incidence will in fact be halved between 1990 and 2015. This study assumes that intermediate output targets (on elementary participation rates and immunization coverage rates, for example) as programmed in the Medium Term Philippine Development Plan (MTPDP) are sufficient to effect the desired results in terms of the MDG outcome indicators. It should be emphasized that the relationship between the outputs of specific interventions and the MDG outcomes is not well defined. Although there is widespread agreement on the specific interventions (in terms of programs, activities and projects) that contribute the most to the attainment of the targeted outcomes, there is no well established “dose response” function that defines how increases in the amount of services/interventions funded and delivered will result in improvements in human development outcomes. Because of data constraints, detailed unit costs are derived for selected key interventions/programs only, i.e., those that are considered critical for the attainment of MDG targets. In particular, in the education sector, it is assumed that the critical ingredients in the achievement of the MDG targets are (1) teachers, (2) textbooks, and (3) classrooms. In the health sector, the critical interventions that are specifically costed included the following: (1) expanded program of immunization, (2) tetanus toxoid vaccination for mothers, (3) control of HIV/AIDS, tuberculosis, and malaria, (4) micronutrient supplementation, (5) provision of contraceptive supplies) and (6) enrollment of indigent population in the national health insurance program (PhilHealth). In the water and sanitation sector, the provision of level 1 water supply (through the installation of deepwells) and sanitation (latrine) are costed individually.
While other programs are also considered important (e.g., performance of the quality assurance function by DepEd’s division offices in the education sector or control of degenerative diseases3 in the health sector), no detailed costing was made for said programs. Instead, what is done is simply to allow the per capita expenditure level in some benchmark year (e.g., 2006) for these items combined to grow in tandem with inflation and the growth of the target clientele. Implicitly, this approach ensures that expenditures on these “other” items are maintained in real per capita terms at their levels during the benchmark years.4 It should be emphasized that while the approach followed for the estimation of the resource requirements for the achievement of the MDG in basic education explicitly takes into account the additional personnel needed to cope with increasing enrollment levels, the approach used in the estimation of resource needs in the health sector focused only on recurrent non-personnel cost of essential package of basic health services. This implies
3 Note that in recent years degenerative diseases have emerged as a major cause of morbidity and mortality. 4 It should be emphasized that this approach does not allow for the expansion of coverage (assuming that these interventions do not quite reach full coverage) nor the improvement in the quality of these interventions.
8
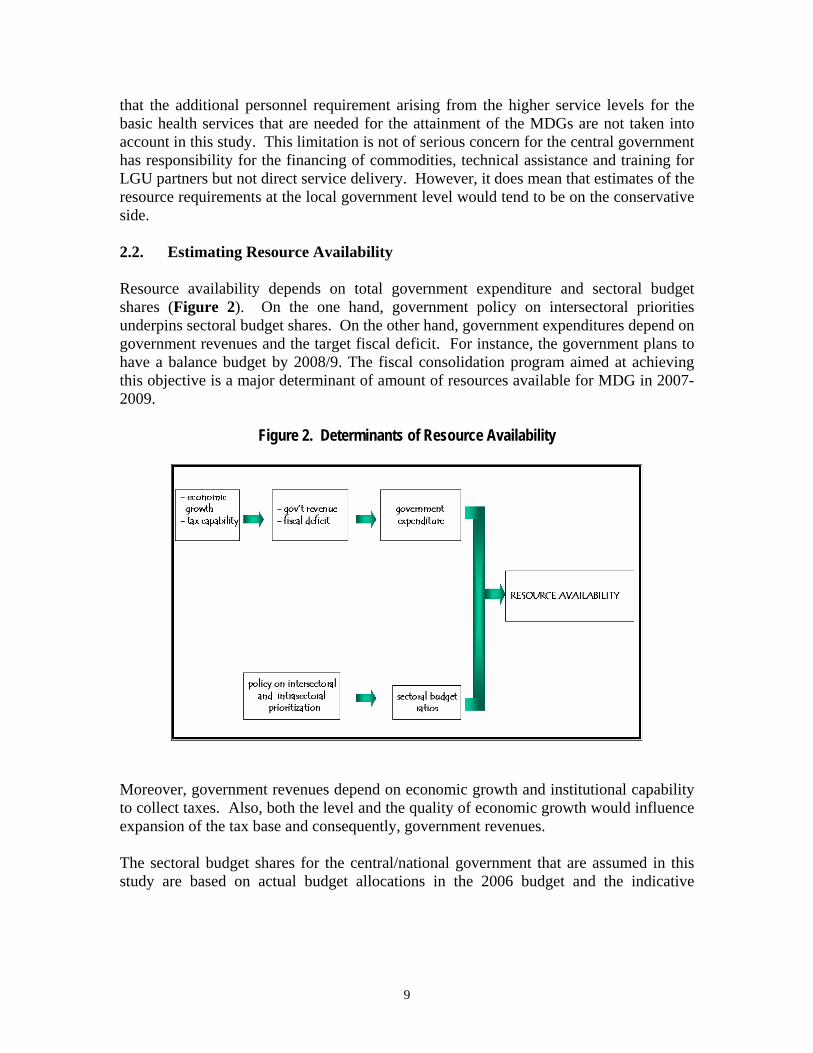
that the additional personnel requirement arising from the higher service levels for the basic health services that are needed for the attainment of the MDGs are not taken into account in this study. This limitation is not of serious concern for the central government has responsibility for the financing of commodities, technical assistance and training for LGU partners but not direct service delivery. However, it does mean that estimates of the resource requirements at the local government level would tend to be on the conservative side. 2.2. Estimating Resource Availability Resource availability depends on total government expenditure and sectoral budget shares (Figure 2). On the one hand, government policy on intersectoral priorities underpins sectoral budget shares. On the other hand, government expenditures depend on government revenues and the target fiscal deficit. For instance, the government plans to have a balance budget by 2008/9. The fiscal consolidation program aimed at achieving this objective is a major determinant of amount of resources available for MDG in 2007-2009.
Figure 2. Determinants of Resource Availability
Moreover, government revenues depend on economic growth and institutional capability to collect taxes. Also, both the level and the quality of economic growth would influence expansion of the tax base and consequently, government revenues.
The sectoral budget shares for the central/national government that are assumed in this study are based on actual budget allocations in the 2006 budget and the indicative
9
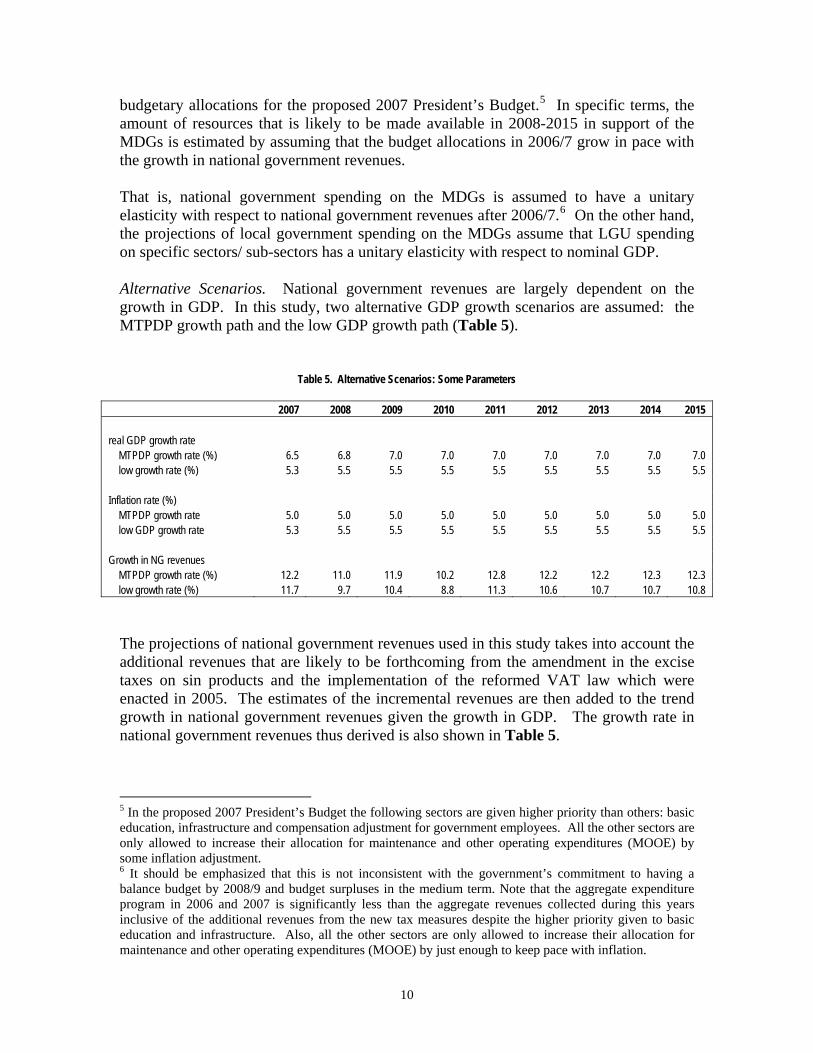
budgetary allocations for the proposed 2007 President’s Budget.5 In specific terms, the amount of resources that is likely to be made available in 2008-2015 in support of the MDGs is estimated by assuming that the budget allocations in 2006/7 grow in pace with the growth in national government revenues. That is, national government spending on the MDGs is assumed to have a unitary elasticity with respect to national government revenues after 2006/7.6 On the other hand, the projections of local government spending on the MDGs assume that LGU spending on specific sectors/ sub-sectors has a unitary elasticity with respect to nominal GDP. Alternative Scenarios. National government revenues are largely dependent on the growth in GDP. In this study, two alternative GDP growth scenarios are assumed: the MTPDP growth path and the low GDP growth path (Table 5).
Table 5. Alternative Scenarios: Some Parameters 2007 2008 2009 2010 2011 2012 2013 2014 2015 real GDP growth rate MTPDP growth rate (%) 6.5 6.8 7.0 7.0 7.0 7.0 7.0 7.0 7.0 low growth rate (%) 5.3 5.5 5.5 5.5 5.5 5.5 5.5 5.5 5.5 Inflation rate (%) MTPDP growth rate 5.0 5.0 5.0 5.0 5.0 5.0 5.0 5.0 5.0 low GDP growth rate 5.3 5.5 5.5 5.5 5.5 5.5 5.5 5.5 5.5 Growth in NG revenues MTPDP growth rate (%) 12.2 11.0 11.9 10.2 12.8 12.2 12.2 12.3 12.3 low growth rate (%) 11.7 9.7 10.4 8.8 11.3 10.6 10.7 10.7 10.8
The projections of national government revenues used in this study takes into account the additional revenues that are likely to be forthcoming from the amendment in the excise taxes on sin products and the implementation of the reformed VAT law which were enacted in 2005. The estimates of the incremental revenues are then added to the trend growth in national government revenues given the growth in GDP. The growth rate in national government revenues thus derived is also shown in Table 5.
5 In the proposed 2007 President’s Budget the following sectors are given higher priority than others: basic education, infrastructure and compensation adjustment for government employees. All the other sectors are only allowed to increase their allocation for maintenance and other operating expenditures (MOOE) by some inflation adjustment. 6 It should be emphasized that this is not inconsistent with the government’s commitment to having a balance budget by 2008/9 and budget surpluses in the medium term. Note that the aggregate expenditure program in 2006 and 2007 is significantly less than the aggregate revenues collected during this years inclusive of the additional revenues from the new tax measures despite the higher priority given to basic education and infrastructure. Also, all the other sectors are only allowed to increase their allocation for maintenance and other operating expenditures (MOOE) by just enough to keep pace with inflation.
10
Treatment of ODA. Foreign Assisted Projects (FAPs) are typically viewed as a facility providing extra support to the government. However, because proceeds from Official Development Assistance (ODA), unless explicitly coursed through non-government organizations, have to be appropriated as part of the General Appropriations Act (GAA), FAPs can only be accommodated by crowding out other items in the budget of the departments/ agencies. In this sense, therefore, the estimates of resources that are likely to be made available from the budget already includes ODA. 3. RESOURCE REQUIREMENTS AND RESOURCE GAPS 3.1. Goal 1 - Reducing Poverty
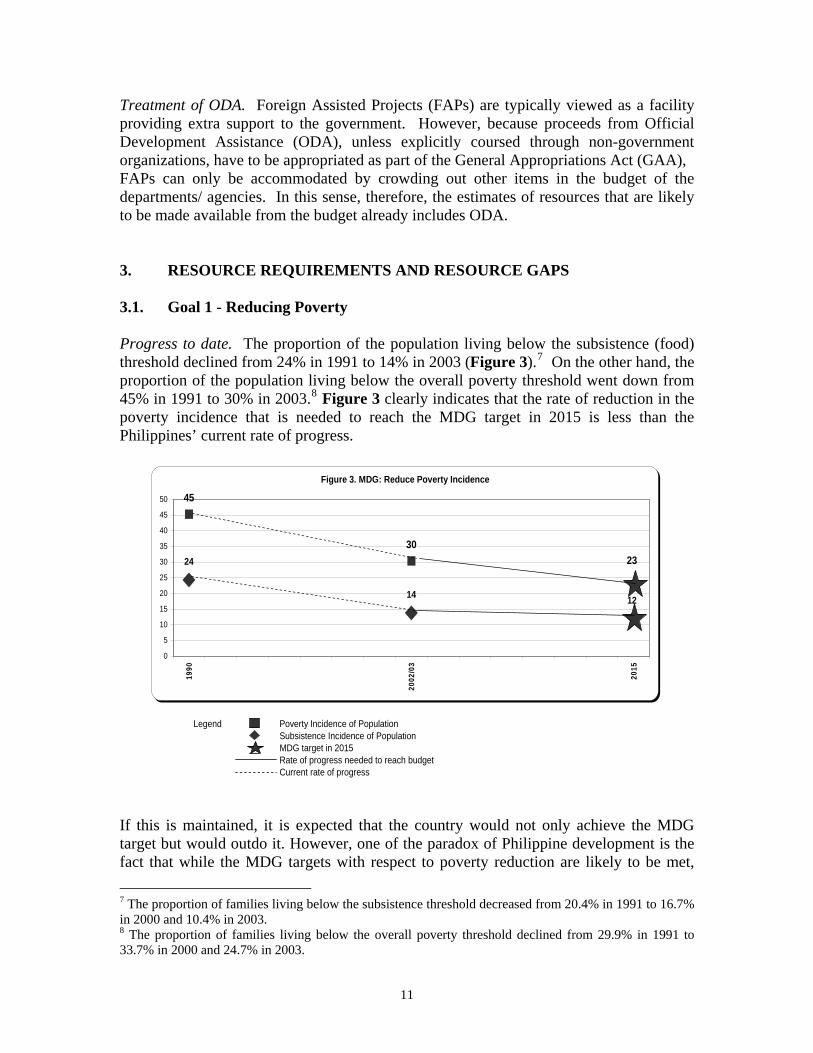
Progress to date. The proportion of the population living below the subsistence (food) threshold declined from 24% in 1991 to 14% in 2003 (Figure 3).7 On the other hand, the proportion of the population living below the overall poverty threshold went down from 45% in 1991 to 30% in 2003.8 Figure 3 clearly indicates that the rate of reduction in the poverty incidence that is needed to reach the MDG target in 2015 is less than the Philippines’ current rate of progress.
Legend Poverty Incidence of PopulationSubsistence Incidence of PopulationMDG target in 2015Rate of progress needed to reach budgetCurrent rate of progress
Figure 3. MDG: Reduce Poverty Incidence
24
14
45
30
12
23
0
5
10
15
20
25
30
35
40
45
50
1990
2002
/03
2015
If this is maintained, it is expected that the country would not only achieve the MDG target but would outdo it. However, one of the paradox of Philippine development is the fact that while the MDG targets with respect to poverty reduction are likely to be met, 7 The proportion of families living below the subsistence threshold decreased from 20.4% in 1991 to 16.7% in 2000 and 10.4% in 2003. 8 The proportion of families living below the overall poverty threshold declined from 29.9% in 1991 to 33.7% in 2000 and 24.7% in 2003.
11
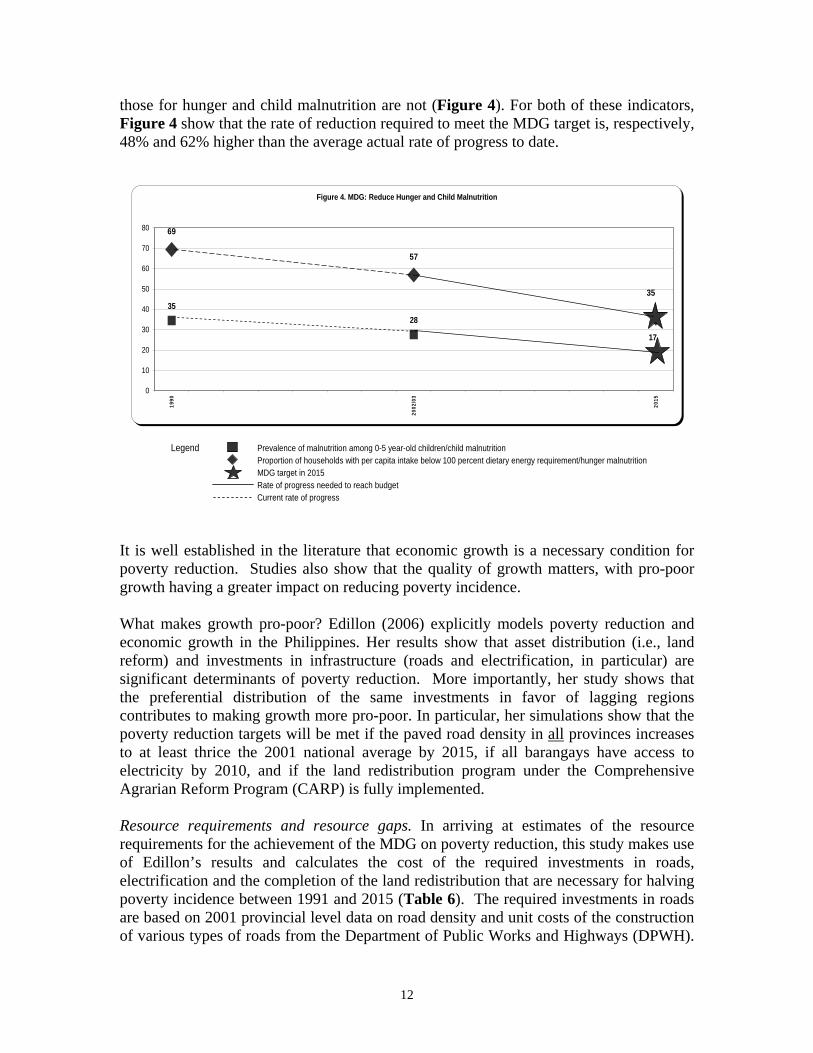
those for hunger and child malnutrition are not (Figure 4). For both of these indicators, Figure 4 show that the rate of reduction required to meet the MDG target is, respectively, 48% and 62% higher than the average actual rate of progress to date.
Legend Prevalence of malnutrition among 0-5 year-old children/child malnutritionProportion of households with per capita intake below 100 percent dietary energy requirement/hunger malnutritionMDG target in 2015Rate of progress needed to reach budgetCurrent rate of progress
Figure 4. MDG: Reduce Hunger and Child Malnutrition
69
57
3528
35
17
0
10
20
30
40
50
60
70
80
1990
2002
/03
2015
It is well established in the literature that economic growth is a necessary condition for poverty reduction. Studies also show that the quality of growth matters, with pro-poor growth having a greater impact on reducing poverty incidence. What makes growth pro-poor? Edillon (2006) explicitly models poverty reduction and economic growth in the Philippines. Her results show that asset distribution (i.e., land reform) and investments in infrastructure (roads and electrification, in particular) are significant determinants of poverty reduction. More importantly, her study shows that the preferential distribution of the same investments in favor of lagging regions contributes to making growth more pro-poor. In particular, her simulations show that the poverty reduction targets will be met if the paved road density in all provinces increases to at least thrice the 2001 national average by 2015, if all barangays have access to electricity by 2010, and if the land redistribution program under the Comprehensive Agrarian Reform Program (CARP) is fully implemented. Resource requirements and resource gaps. In arriving at estimates of the resource requirements for the achievement of the MDG on poverty reduction, this study makes use of Edillon’s results and calculates the cost of the required investments in roads, electrification and the completion of the land redistribution that are necessary for halving poverty incidence between 1991 and 2015 (Table 6). The required investments in roads are based on 2001 provincial level data on road density and unit costs of the construction of various types of roads from the Department of Public Works and Highways (DPWH).
12
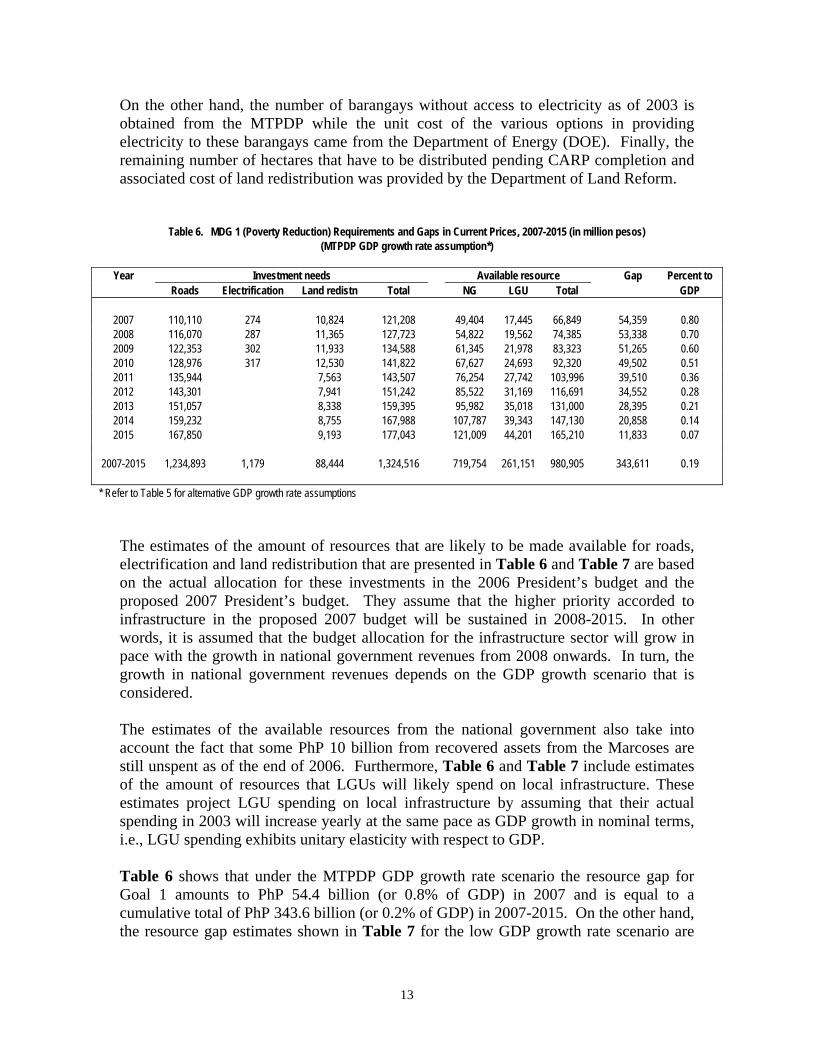
On the other hand, the number of barangays without access to electricity as of 2003 is obtained from the MTPDP while the unit cost of the various options in providing electricity to these barangays came from the Department of Energy (DOE). Finally, the remaining number of hectares that have to be distributed pending CARP completion and associated cost of land redistribution was provided by the Department of Land Reform.
Table 6. MDG 1 (Poverty Reduction) Requirements and Gaps in Current Prices, 2007-2015 (in million pesos) (MTPDP GDP growth rate assumption*)
Year Investment needs Available resource Gap Percent to
Roads Electrification Land redistn Total NG LGU Total GDP
2007 110,110 274 10,824 121,208 49,404 17,445 66,849 54,359 0.80 2008 116,070 287 11,365 127,723 54,822 19,562 74,385 53,338 0.70 2009 122,353 302 11,933 134,588 61,345 21,978 83,323 51,265 0.60 2010 128,976 317 12,530 141,822 67,627 24,693 92,320 49,502 0.51 2011 135,944 7,563 143,507 76,254 27,742 103,996 39,510 0.36 2012 143,301 7,941 151,242 85,522 31,169 116,691 34,552 0.28 2013 151,057 8,338 159,395 95,982 35,018 131,000 28,395 0.21 2014 159,232 8,755 167,988 107,787 39,343 147,130 20,858 0.14 2015 167,850 9,193 177,043 121,009 44,201 165,210 11,833 0.07
2007-2015 1,234,893 1,179 88,444 1,324,516 719,754 261,151 980,905 343,611 0.19 * Refer to Table 5 for alternative GDP growth rate assumptions
The estimates of the amount of resources that are likely to be made available for roads, electrification and land redistribution that are presented in Table 6 and Table 7 are based on the actual allocation for these investments in the 2006 President’s budget and the proposed 2007 President’s budget. They assume that the higher priority accorded to infrastructure in the proposed 2007 budget will be sustained in 2008-2015. In other words, it is assumed that the budget allocation for the infrastructure sector will grow in pace with the growth in national government revenues from 2008 onwards. In turn, the growth in national government revenues depends on the GDP growth scenario that is considered. The estimates of the available resources from the national government also take into account the fact that some PhP 10 billion from recovered assets from the Marcoses are still unspent as of the end of 2006. Furthermore, Table 6 and Table 7 include estimates of the amount of resources that LGUs will likely spend on local infrastructure. These estimates project LGU spending on local infrastructure by assuming that their actual spending in 2003 will increase yearly at the same pace as GDP growth in nominal terms, i.e., LGU spending exhibits unitary elasticity with respect to GDP. Table 6 shows that under the MTPDP GDP growth rate scenario the resource gap for Goal 1 amounts to PhP 54.4 billion (or 0.8% of GDP) in 2007 and is equal to a cumulative total of PhP 343.6 billion (or 0.2% of GDP) in 2007-2015. On the other hand, the resource gap estimates shown in Table 7 for the low GDP growth rate scenario are
13
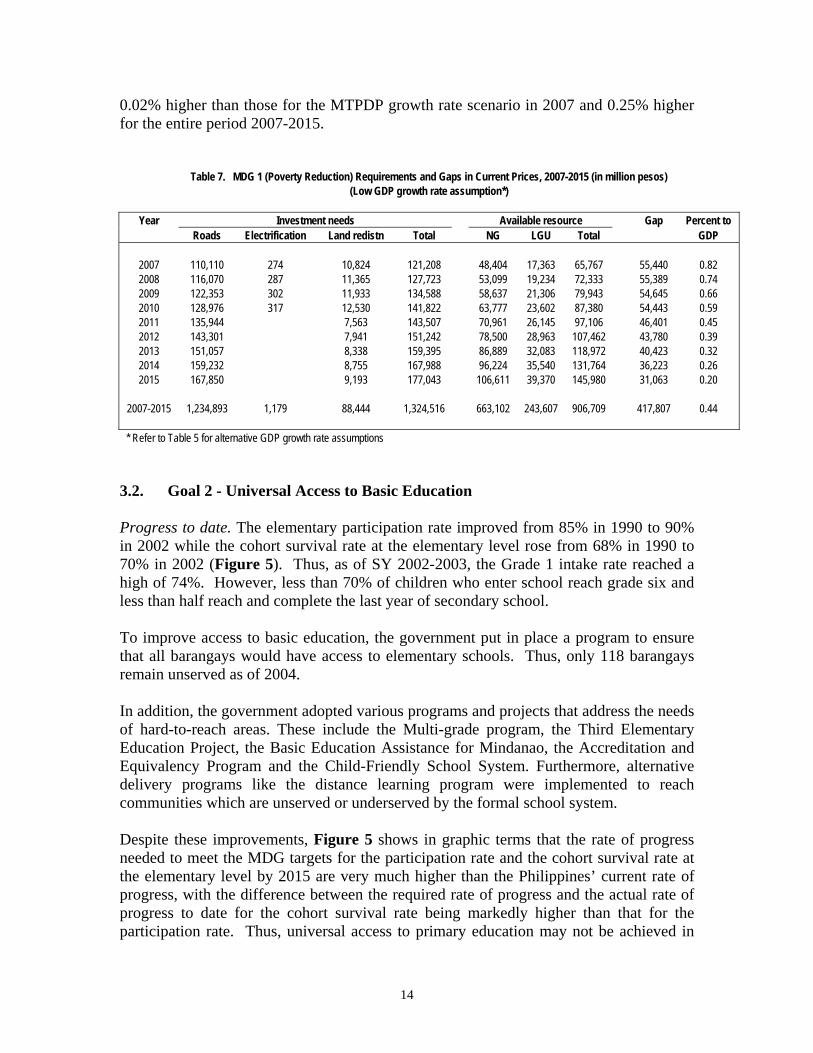
0.02% higher than those for the MTPDP growth rate scenario in 2007 and 0.25% higher for the entire period 2007-2015.
Table 7. MDG 1 (Poverty Reduction) Requirements and Gaps in Current Prices, 2007-2015 (in million pesos) (Low GDP growth rate assumption*)
Year Investment needs Available resource Gap Percent to
Roads Electrification Land redistn Total NG LGU Total GDP
2007 110,110 274 10,824 121,208 48,404 17,363 65,767 55,440 0.82 2008 116,070 287 11,365 127,723 53,099 19,234 72,333 55,389 0.74 2009 122,353 302 11,933 134,588 58,637 21,306 79,943 54,645 0.66 2010 128,976 317 12,530 141,822 63,777 23,602 87,380 54,443 0.59 2011 135,944 7,563 143,507 70,961 26,145 97,106 46,401 0.45 2012 143,301 7,941 151,242 78,500 28,963 107,462 43,780 0.39 2013 151,057 8,338 159,395 86,889 32,083 118,972 40,423 0.32 2014 159,232 8,755 167,988 96,224 35,540 131,764 36,223 0.26 2015 167,850 9,193 177,043 106,611 39,370 145,980 31,063 0.20
2007-2015 1,234,893 1,179 88,444 1,324,516 663,102 243,607 906,709 417,807 0.44 * Refer to Table 5 for alternative GDP growth rate assumptions
3.2. Goal 2 - Universal Access to Basic Education
Progress to date. The elementary participation rate improved from 85% in 1990 to 90% in 2002 while the cohort survival rate at the elementary level rose from 68% in 1990 to 70% in 2002 (Figure 5). Thus, as of SY 2002-2003, the Grade 1 intake rate reached a high of 74%. However, less than 70% of children who enter school reach grade six and less than half reach and complete the last year of secondary school. To improve access to basic education, the government put in place a program to ensure that all barangays would have access to elementary schools. Thus, only 118 barangays remain unserved as of 2004. In addition, the government adopted various programs and projects that address the needs of hard-to-reach areas. These include the Multi-grade program, the Third Elementary Education Project, the Basic Education Assistance for Mindanao, the Accreditation and Equivalency Program and the Child-Friendly School System. Furthermore, alternative delivery programs like the distance learning program were implemented to reach communities which are unserved or underserved by the formal school system. Despite these improvements, Figure 5 shows in graphic terms that the rate of progress needed to meet the MDG targets for the participation rate and the cohort survival rate at the elementary level by 2015 are very much higher than the Philippines’ current rate of progress, with the difference between the required rate of progress and the actual rate of progress to date for the cohort survival rate being markedly higher than that for the participation rate. Thus, universal access to primary education may not be achieved in
14
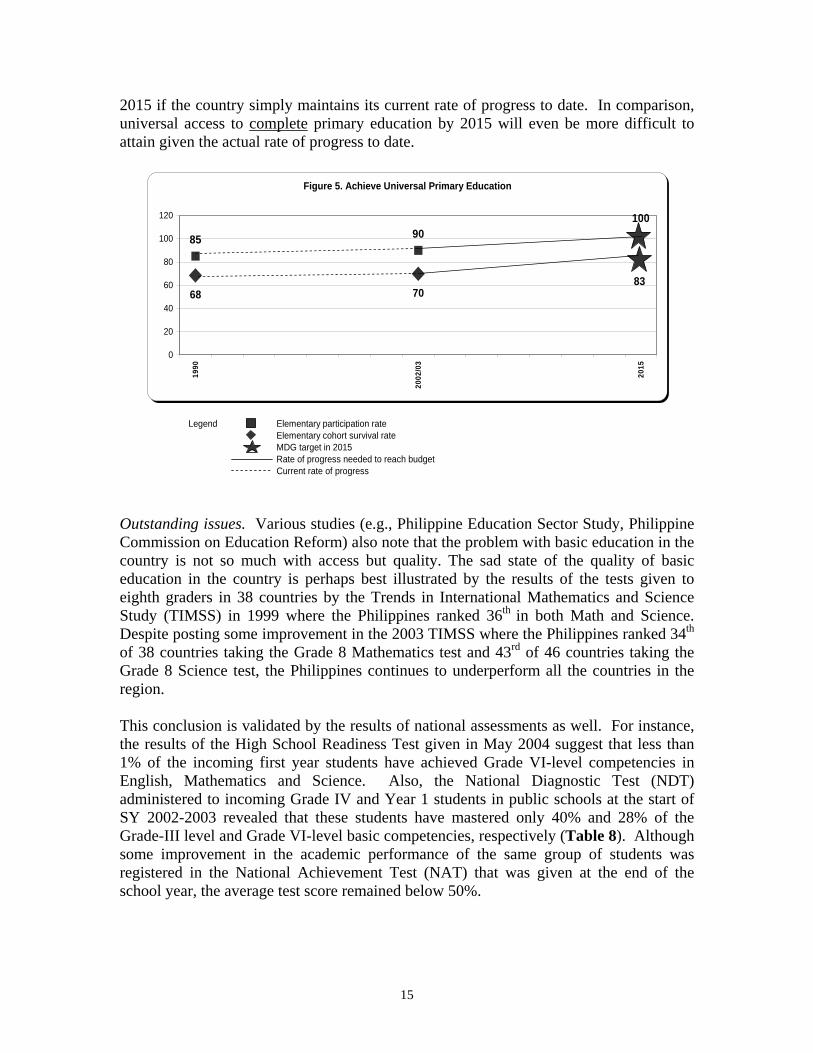
2015 if the country simply maintains its current rate of progress to date. In comparison, universal access to complete primary education by 2015 will even be more difficult to attain given the actual rate of progress to date.
Legend Elementary participation rateElementary cohort survival rateMDG target in 2015Rate of progress needed to reach budgetCurrent rate of progress
Figure 5. Achieve Universal Primary Education
68 70
85 90
83
100
0
20
40
60
80
100
120
1990
2002
/03
2015
Outstanding issues. Various studies (e.g., Philippine Education Sector Study, Philippine Commission on Education Reform) also note that the problem with basic education in the country is not so much with access but quality. The sad state of the quality of basic education in the country is perhaps best illustrated by the results of the tests given to eighth graders in 38 countries by the Trends in International Mathematics and Science Study (TIMSS) in 1999 where the Philippines ranked 36th in both Math and Science. Despite posting some improvement in the 2003 TIMSS where the Philippines ranked 34th of 38 countries taking the Grade 8 Mathematics test and 43rd of 46 countries taking the Grade 8 Science test, the Philippines continues to underperform all the countries in the region. This conclusion is validated by the results of national assessments as well. For instance, the results of the High School Readiness Test given in May 2004 suggest that less than 1% of the incoming first year students have achieved Grade VI-level competencies in English, Mathematics and Science. Also, the National Diagnostic Test (NDT) administered to incoming Grade IV and Year 1 students in public schools at the start of SY 2002-2003 revealed that these students have mastered only 40% and 28% of the Grade-III level and Grade VI-level basic competencies, respectively (Table 8). Although some improvement in the academic performance of the same group of students was registered in the National Achievement Test (NAT) that was given at the end of the school year, the average test score remained below 50%.
15
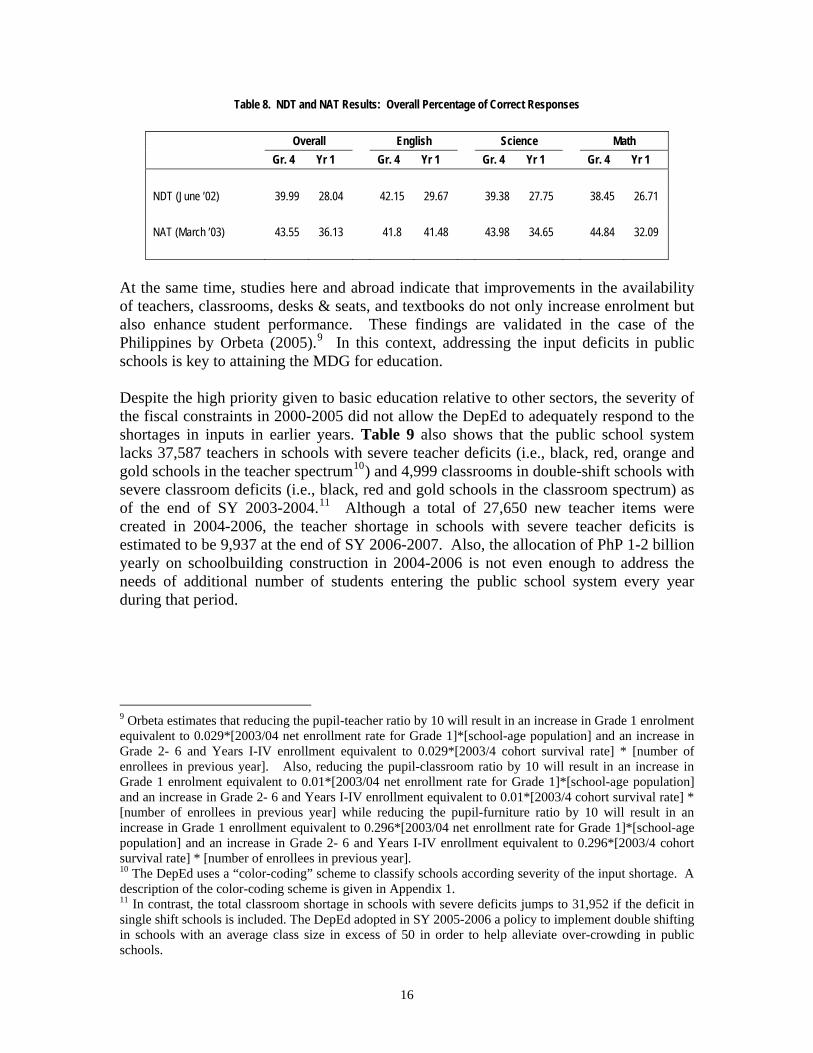
Table 8. NDT and NAT Results: Overall Percentage of Correct Responses Overall English Science Math Gr. 4 Yr 1 Gr. 4 Yr 1 Gr. 4 Yr 1 Gr. 4 Yr 1 NDT (June ’02) 39.99 28.04 42.15 29.67 39.38 27.75 38.45 26.71 NAT (March ’03) 43.55 36.13 41.8 41.48 43.98 34.65 44.84 32.09
At the same time, studies here and abroad indicate that improvements in the availability of teachers, classrooms, desks & seats, and textbooks do not only increase enrolment but also enhance student performance. These findings are validated in the case of the Philippines by Orbeta (2005).9 In this context, addressing the input deficits in public schools is key to attaining the MDG for education. Despite the high priority given to basic education relative to other sectors, the severity of the fiscal constraints in 2000-2005 did not allow the DepEd to adequately respond to the shortages in inputs in earlier years. Table 9 also shows that the public school system lacks 37,587 teachers in schools with severe teacher deficits (i.e., black, red, orange and gold schools in the teacher spectrum10) and 4,999 classrooms in double-shift schools with severe classroom deficits (i.e., black, red and gold schools in the classroom spectrum) as of the end of SY 2003-2004.11 Although a total of 27,650 new teacher items were created in 2004-2006, the teacher shortage in schools with severe teacher deficits is estimated to be 9,937 at the end of SY 2006-2007. Also, the allocation of PhP 1-2 billion yearly on schoolbuilding construction in 2004-2006 is not even enough to address the needs of additional number of students entering the public school system every year during that period.
9 Orbeta estimates that reducing the pupil-teacher ratio by 10 will result in an increase in Grade 1 enrolment equivalent to 0.029*[2003/04 net enrollment rate for Grade 1]*[school-age population] and an increase in Grade 2- 6 and Years I-IV enrollment equivalent to 0.029*[2003/4 cohort survival rate] * [number of enrollees in previous year]. Also, reducing the pupil-classroom ratio by 10 will result in an increase in Grade 1 enrolment equivalent to 0.01*[2003/04 net enrollment rate for Grade 1]*[school-age population] and an increase in Grade 2- 6 and Years I-IV enrollment equivalent to 0.01*[2003/4 cohort survival rate] * [number of enrollees in previous year] while reducing the pupil-furniture ratio by 10 will result in an increase in Grade 1 enrollment equivalent to 0.296*[2003/04 net enrollment rate for Grade 1]*[school-age population] and an increase in Grade 2- 6 and Years I-IV enrollment equivalent to 0.296*[2003/4 cohort survival rate] * [number of enrollees in previous year]. 10 The DepEd uses a “color-coding” scheme to classify schools according severity of the input shortage. A description of the color-coding scheme is given in Appendix 1. 11 In contrast, the total classroom shortage in schools with severe deficits jumps to 31,952 if the deficit in single shift schools is included. The DepEd adopted in SY 2005-2006 a policy to implement double shifting in schools with an average class size in excess of 50 in order to help alleviate over-crowding in public schools.
16
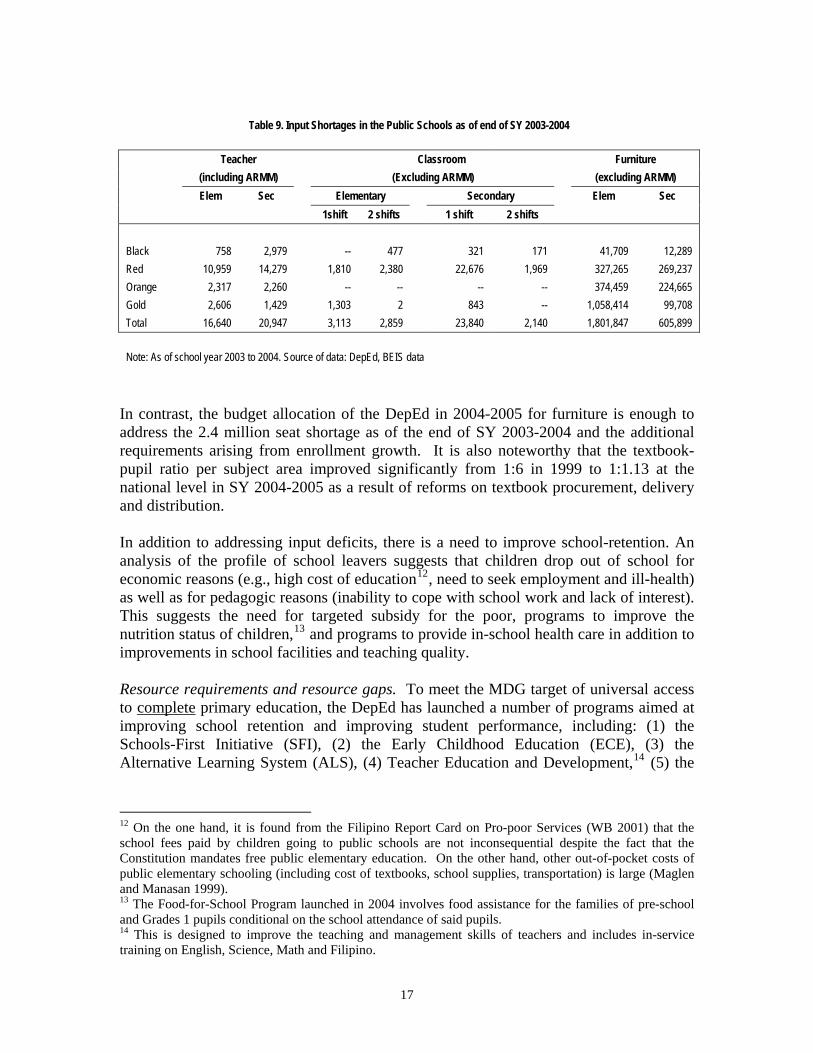
Table 9. Input Shortages in the Public Schools as of end of SY 2003-2004
Teacher Classroom Furniture (including ARMM) (Excluding ARMM) (excluding ARMM) Elem Sec Elementary Secondary Elem Sec 1shift 2 shifts 1 shift 2 shifts
Black 758 2,979 -- 477 321 171 41,709 12,289 Red 10,959 14,279 1,810 2,380 22,676 1,969 327,265 269,237 Orange 2,317 2,260 -- -- -- -- 374,459 224,665 Gold 2,606 1,429 1,303 2 843 -- 1,058,414 99,708 Total 16,640 20,947 3,113 2,859 23,840 2,140 1,801,847 605,899 Note: As of school year 2003 to 2004. Source of data: DepEd, BEIS data
In contrast, the budget allocation of the DepEd in 2004-2005 for furniture is enough to address the 2.4 million seat shortage as of the end of SY 2003-2004 and the additional requirements arising from enrollment growth. It is also noteworthy that the textbook-pupil ratio per subject area improved significantly from 1:6 in 1999 to 1:1.13 at the national level in SY 2004-2005 as a result of reforms on textbook procurement, delivery and distribution. In addition to addressing input deficits, there is a need to improve school-retention. An analysis of the profile of school leavers suggests that children drop out of school for economic reasons (e.g., high cost of education12, need to seek employment and ill-health) as well as for pedagogic reasons (inability to cope with school work and lack of interest). This suggests the need for targeted subsidy for the poor, programs to improve the nutrition status of children,13 and programs to provide in-school health care in addition to improvements in school facilities and teaching quality.
Resource requirements and resource gaps. To meet the MDG target of universal access to complete primary education, the DepEd has launched a number of programs aimed at improving school retention and improving student performance, including: (1) the Schools-First Initiative (SFI), (2) the Early Childhood Education (ECE), (3) the Alternative Learning System (ALS), (4) Teacher Education and Development,14 (5) the
12 On the one hand, it is found from the Filipino Report Card on Pro-poor Services (WB 2001) that the school fees paid by children going to public schools are not inconsequential despite the fact that the Constitution mandates free public elementary education. On the other hand, other out-of-pocket costs of public elementary schooling (including cost of textbooks, school supplies, transportation) is large (Maglen and Manasan 1999). 13 The Food-for-School Program launched in 2004 involves food assistance for the families of pre-school and Grades 1 pupils conditional on the school attendance of said pupils. 14 This is designed to improve the teaching and management skills of teachers and includes in-service training on English, Science, Math and Filipino.
17
High School Bridge Program,15 and (6) Madrasah Education. The costs of these programs as well as the costs of the inputs needed to serve the higher enrollment numbers implied by the MDG on basic education are thus considered in the projections of the resource requirement for meeting MDG 2. The other assumptions used in projecting said resource requirement includes: • Grade 1 intake will increase from 74% of cohort in SY 2003-2004 to 100% in
2010-2015. Note that this target is higher than the EFA target (which is also the MTPDP target) of 84.6% in 2010 and 95% in 2015.
• Elementary completion rate (based on Grade 1 entrants) will increase from 68.32% in 2006 to 100% in 2015. This target is higher than EFA target of 77.6% in 2010 and 82.6% in 2015.
• Lack of teachers in schools that have severe shortages will gradually be addressed between 2007 and 2010.
• In addition to addressing the teacher backlog, enough new teacher positions will be created so that the teacher requirements of new entrants are met. The target teacher-pupil ratio is set at 1:45 in 2007-2009 and 1:40 in 2010-2015.
• Lack of classroom in schools that have severe shortages will gradually be addressed in 2007-2013.
• In addition to addressing the classroom backlog, enough new classroom will be built so that classroom requirements of new entrants are met. The target classroom-pupil ratio is set at 1:45 in 2007-2015.
• Classrooms will be rehabilitated every 15 years at 80% of the replacement cost; furniture will be replaced once every 10 years; and textbooks will be replaced once every 5 years.
• Textbook requirement is 5 per pupil in grade school and 6 per student in high school.
• Per student school MOOE in 2007 prices is projected to increase from PhP 200 in 2007-2009, PhP 250 in 2010-2011, PhP 300 in 2012-2013 and PhP 350 in 2014-2015. 16
Based on these assumptions, enrollment in public elementary schools is projected to increase from 12.1 million in SY 2003-2004 to 16.5 million in SY 2010-2011 and 18.4 million SY 2015-2016. Providing the projected number of students with adequate teachers, textbooks and classrooms implies that by 2015, an additional 394,111 teachers will have to be hired, an additional 285,614 new classrooms will have to be constructed, an additional 11.4 million seats and an additional 65.8 million textbooks will have to be procured between 2004 and 2015. The financial requirements for meeting MDG 2 thus estimated are presented in Table 10. In specific terms, Table 10 projects the amount of resources needed to meet the MDG in basic education to be equal to PhP 176.2 billion (or 2.7% of GDP) in 2007 and a cumulative total of PhP 2,454.8 billion (or 3.2% of GDP) in 2007-2015.
15 The High School Bridge Program was designed to improve elementary school graduates’ preparedness for high school. 16 The increase is aimed at allowing per student MOOE to gradually increase to its 1997 level in real terms.
18
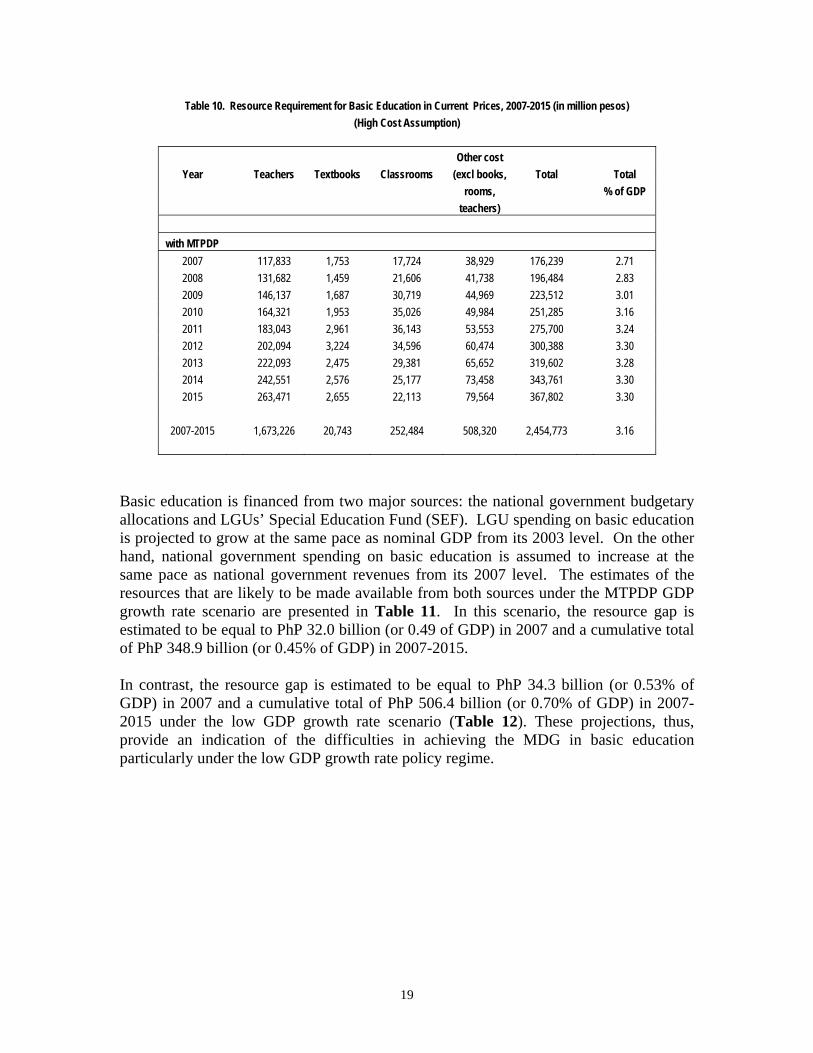
Table 10. Resource Requirement for Basic Education in Current Prices, 2007-2015 (in million pesos) (High Cost Assumption)
Other cost
Year Teachers Textbooks Classrooms (excl books, Total Total rooms, % of GDP teachers)
with MTPDP 2007 117,833 1,753 17,724 38,929 176,239 2.71 2008 131,682 1,459 21,606 41,738 196,484 2.83 2009 146,137 1,687 30,719 44,969 223,512 3.01 2010 164,321 1,953 35,026 49,984 251,285 3.16 2011 183,043 2,961 36,143 53,553 275,700 3.24 2012 202,094 3,224 34,596 60,474 300,388 3.30 2013 222,093 2,475 29,381 65,652 319,602 3.28 2014 242,551 2,576 25,177 73,458 343,761 3.30 2015 263,471 2,655 22,113 79,564 367,802 3.30
2007-2015 1,673,226 20,743 252,484 508,320 2,454,773 3.16
Basic education is financed from two major sources: the national government budgetary allocations and LGUs’ Special Education Fund (SEF). LGU spending on basic education is projected to grow at the same pace as nominal GDP from its 2003 level. On the other hand, national government spending on basic education is assumed to increase at the same pace as national government revenues from its 2007 level. The estimates of the resources that are likely to be made available from both sources under the MTPDP GDP growth rate scenario are presented in Table 11. In this scenario, the resource gap is estimated to be equal to PhP 32.0 billion (or 0.49 of GDP) in 2007 and a cumulative total of PhP 348.9 billion (or 0.45% of GDP) in 2007-2015. In contrast, the resource gap is estimated to be equal to PhP 34.3 billion (or 0.53% of GDP) in 2007 and a cumulative total of PhP 506.4 billion (or 0.70% of GDP) in 2007-2015 under the low GDP growth rate scenario (Table 12). These projections, thus, provide an indication of the difficulties in achieving the MDG in basic education particularly under the low GDP growth rate policy regime.
19
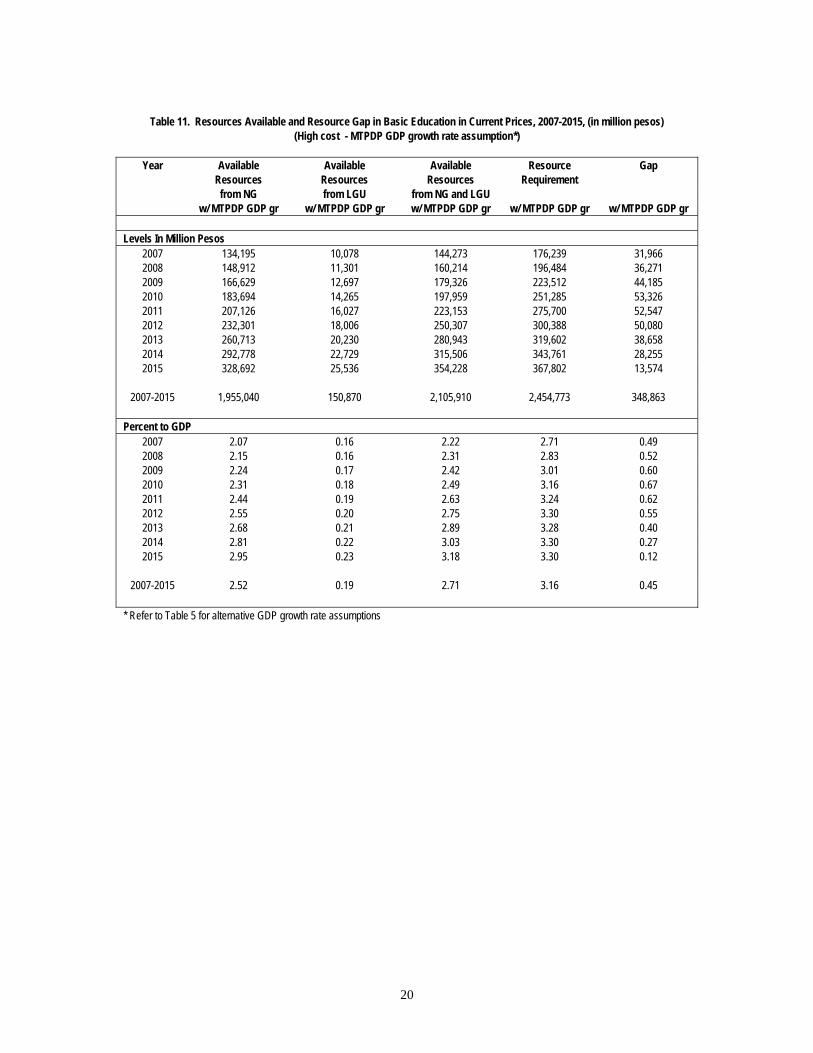
Table 11. Resources Available and Resource Gap in Basic Education in Current Prices, 2007-2015, (in million pesos)
(High cost - MTPDP GDP growth rate assumption*)
Year Available Available Available Resource Gap Resources Resources Resources Requirement from NG from LGU from NG and LGU w/ MTPDP GDP gr w/ MTPDP GDP gr w/ MTPDP GDP gr w/ MTPDP GDP gr w/ MTPDP GDP gr Levels In Million Pesos
2007 134,195 10,078 144,273 176,239 31,966 2008 148,912 11,301 160,214 196,484 36,271 2009 166,629 12,697 179,326 223,512 44,185 2010 183,694 14,265 197,959 251,285 53,326 2011 207,126 16,027 223,153 275,700 52,547 2012 232,301 18,006 250,307 300,388 50,080 2013 260,713 20,230 280,943 319,602 38,658 2014 292,778 22,729 315,506 343,761 28,255 2015 328,692 25,536 354,228 367,802 13,574
2007-2015 1,955,040 150,870 2,105,910 2,454,773 348,863
Percent to GDP
2007 2.07 0.16 2.22 2.71 0.49 2008 2.15 0.16 2.31 2.83 0.52 2009 2.24 0.17 2.42 3.01 0.60 2010 2.31 0.18 2.49 3.16 0.67 2011 2.44 0.19 2.63 3.24 0.62 2012 2.55 0.20 2.75 3.30 0.55 2013 2.68 0.21 2.89 3.28 0.40 2014 2.81 0.22 3.03 3.30 0.27 2015 2.95 0.23 3.18 3.30 0.12
2007-2015 2.52 0.19 2.71 3.16 0.45
* Refer to Table 5 for alternative GDP growth rate assumptions
20
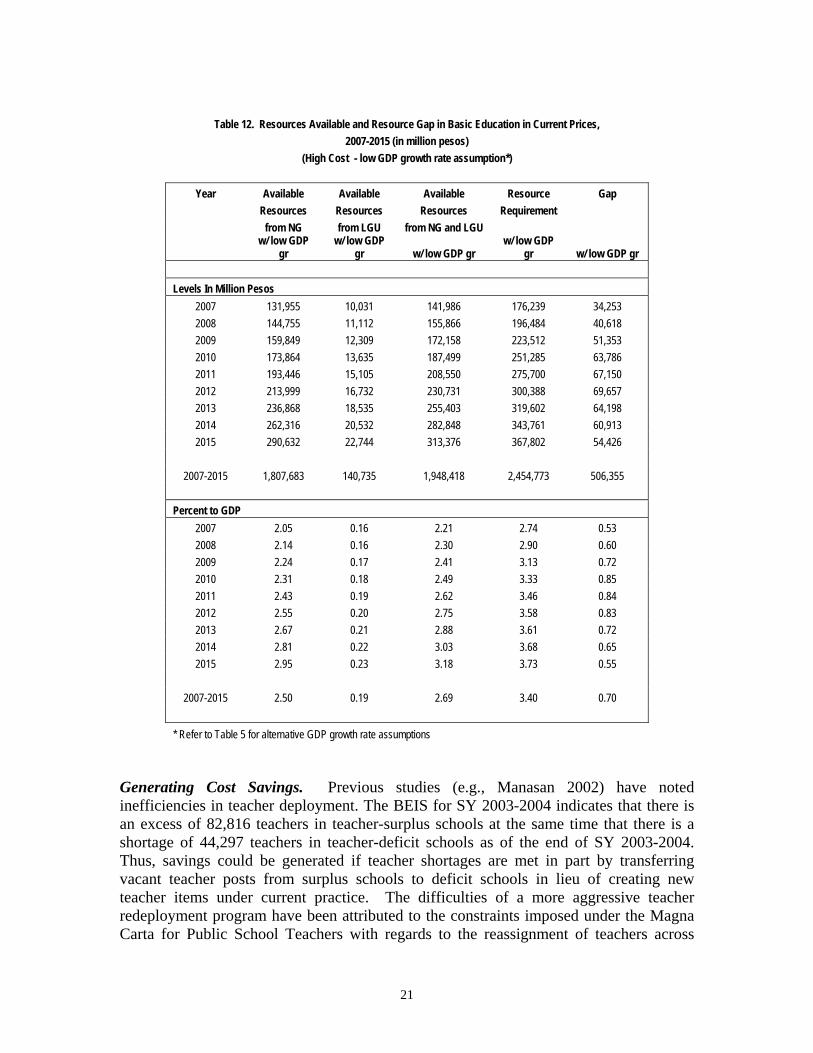
Table 12. Resources Available and Resource Gap in Basic Education in Current Prices,
2007-2015 (in million pesos) (High Cost - low GDP growth rate assumption*)
Year Available Available Available Resource Gap
Resources Resources Resources Requirement from NG from LGU from NG and LGU
w/ low GDP
gr w/ low GDP
gr w/ low GDP gr w/ low GDP
gr w/ low GDP gr Levels In Million Pesos
2007 131,955 10,031 141,986 176,239 34,253 2008 144,755 11,112 155,866 196,484 40,618 2009 159,849 12,309 172,158 223,512 51,353 2010 173,864 13,635 187,499 251,285 63,786 2011 193,446 15,105 208,550 275,700 67,150 2012 213,999 16,732 230,731 300,388 69,657 2013 236,868 18,535 255,403 319,602 64,198 2014 262,316 20,532 282,848 343,761 60,913 2015 290,632 22,744 313,376 367,802 54,426
2007-2015 1,807,683 140,735 1,948,418 2,454,773 506,355
Percent to GDP
2007 2.05 0.16 2.21 2.74 0.53 2008 2.14 0.16 2.30 2.90 0.60 2009 2.24 0.17 2.41 3.13 0.72 2010 2.31 0.18 2.49 3.33 0.85 2011 2.43 0.19 2.62 3.46 0.84 2012 2.55 0.20 2.75 3.58 0.83 2013 2.67 0.21 2.88 3.61 0.72 2014 2.81 0.22 3.03 3.68 0.65 2015 2.95 0.23 3.18 3.73 0.55
2007-2015 2.50 0.19 2.69 3.40 0.70
* Refer to Table 5 for alternative GDP growth rate assumptions
Generating Cost Savings. Previous studies (e.g., Manasan 2002) have noted inefficiencies in teacher deployment. The BEIS for SY 2003-2004 indicates that there is an excess of 82,816 teachers in teacher-surplus schools at the same time that there is a shortage of 44,297 teachers in teacher-deficit schools as of the end of SY 2003-2004. Thus, savings could be generated if teacher shortages are met in part by transferring vacant teacher posts from surplus schools to deficit schools in lieu of creating new teacher items under current practice. The difficulties of a more aggressive teacher redeployment program have been attributed to the constraints imposed under the Magna Carta for Public School Teachers with regards to the reassignment of teachers across
21
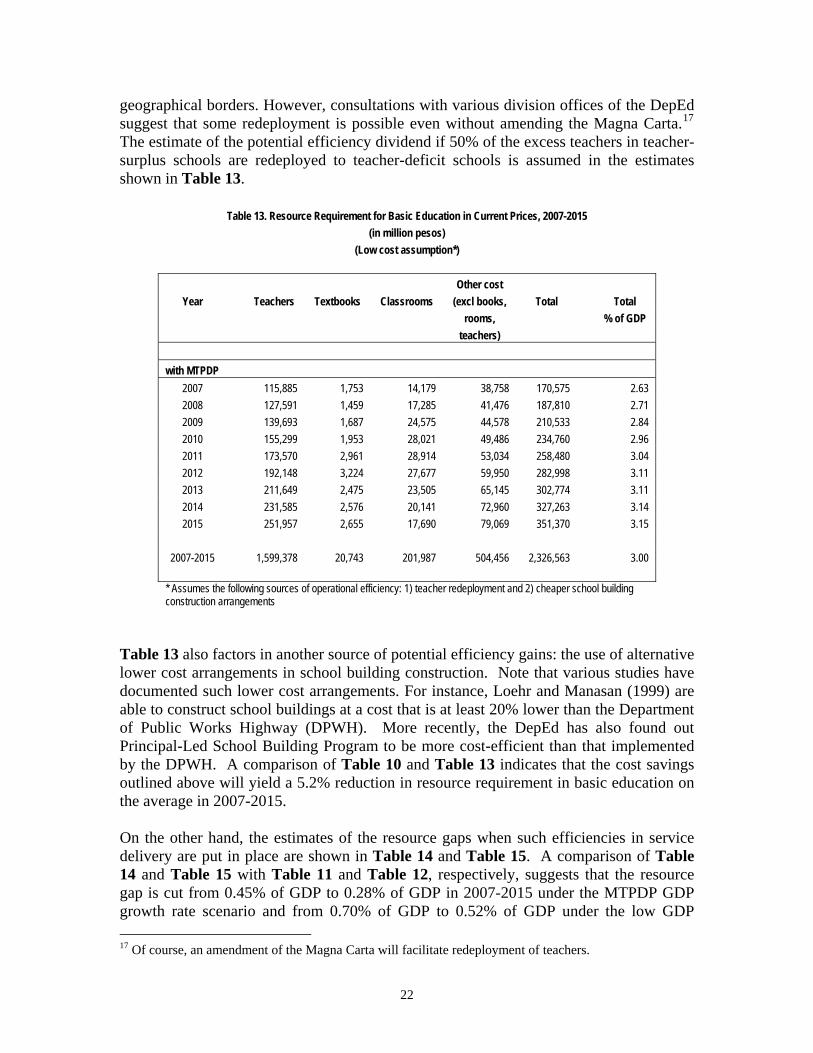
geographical borders. However, consultations with various division offices of the DepEd suggest that some redeployment is possible even without amending the Magna Carta.17 The estimate of the potential efficiency dividend if 50% of the excess teachers in teacher-surplus schools are redeployed to teacher-deficit schools is assumed in the estimates shown in Table 13.
Table 13. Resource Requirement for Basic Education in Current Prices, 2007-2015 (in million pesos)
(Low cost assumption*)
Other cost Year Teachers Textbooks Classrooms (excl books, Total Total
rooms, % of GDP teachers)
with MTPDP
2007 115,885 1,753 14,179 38,758 170,575 2.63 2008 127,591 1,459 17,285 41,476 187,810 2.71 2009 139,693 1,687 24,575 44,578 210,533 2.84 2010 155,299 1,953 28,021 49,486 234,760 2.96 2011 173,570 2,961 28,914 53,034 258,480 3.04 2012 192,148 3,224 27,677 59,950 282,998 3.11 2013 211,649 2,475 23,505 65,145 302,774 3.11 2014 231,585 2,576 20,141 72,960 327,263 3.14 2015 251,957 2,655 17,690 79,069 351,370 3.15
2007-2015 1,599,378 20,743 201,987 504,456 2,326,563 3.00
* Assumes the following sources of operational efficiency: 1) teacher redeployment and 2) cheaper school building construction arrangements
Table 13 also factors in another source of potential efficiency gains: the use of alternative lower cost arrangements in school building construction. Note that various studies have documented such lower cost arrangements. For instance, Loehr and Manasan (1999) are able to construct school buildings at a cost that is at least 20% lower than the Department of Public Works Highway (DPWH). More recently, the DepEd has also found out Principal-Led School Building Program to be more cost-efficient than that implemented by the DPWH. A comparison of Table 10 and Table 13 indicates that the cost savings outlined above will yield a 5.2% reduction in resource requirement in basic education on the average in 2007-2015. On the other hand, the estimates of the resource gaps when such efficiencies in service delivery are put in place are shown in Table 14 and Table 15. A comparison of Table 14 and Table 15 with Table 11 and Table 12, respectively, suggests that the resource gap is cut from 0.45% of GDP to 0.28% of GDP in 2007-2015 under the MTPDP GDP growth rate scenario and from 0.70% of GDP to 0.52% of GDP under the low GDP 17 Of course, an amendment of the Magna Carta will facilitate redeployment of teachers.
22
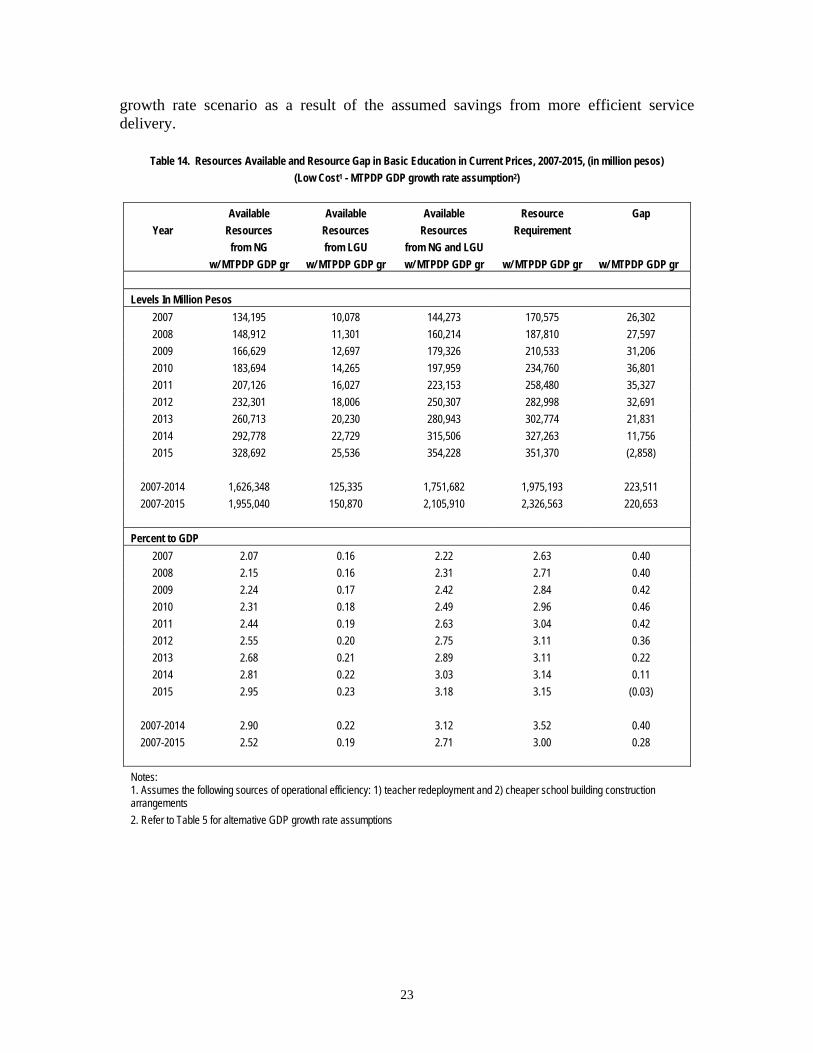
growth rate scenario as a result of the assumed savings from more efficient service delivery.
Table 14. Resources Available and Resource Gap in Basic Education in Current Prices, 2007-2015, (in million pesos) (Low Cost1 - MTPDP GDP growth rate assumption2)
Available Available Available Resource Gap
Year Resources Resources Resources Requirement from NG from LGU from NG and LGU w/ MTPDP GDP gr w/ MTPDP GDP gr w/ MTPDP GDP gr w/ MTPDP GDP gr w/ MTPDP GDP gr Levels In Million Pesos
2007 134,195 10,078 144,273 170,575 26,302 2008 148,912 11,301 160,214 187,810 27,597 2009 166,629 12,697 179,326 210,533 31,206 2010 183,694 14,265 197,959 234,760 36,801 2011 207,126 16,027 223,153 258,480 35,327 2012 232,301 18,006 250,307 282,998 32,691 2013 260,713 20,230 280,943 302,774 21,831 2014 292,778 22,729 315,506 327,263 11,756 2015 328,692 25,536 354,228 351,370 (2,858)
2007-2014 1,626,348 125,335 1,751,682 1,975,193 223,511 2007-2015 1,955,040 150,870 2,105,910 2,326,563 220,653
Percent to GDP
2007 2.07 0.16 2.22 2.63 0.40 2008 2.15 0.16 2.31 2.71 0.40 2009 2.24 0.17 2.42 2.84 0.42 2010 2.31 0.18 2.49 2.96 0.46 2011 2.44 0.19 2.63 3.04 0.42 2012 2.55 0.20 2.75 3.11 0.36 2013 2.68 0.21 2.89 3.11 0.22 2014 2.81 0.22 3.03 3.14 0.11 2015 2.95 0.23 3.18 3.15 (0.03)
2007-2014 2.90 0.22 3.12 3.52 0.40 2007-2015 2.52 0.19 2.71 3.00 0.28
Notes: 1. Assumes the following sources of operational efficiency: 1) teacher redeployment and 2) cheaper school building construction arrangements 2. Refer to Table 5 for alternative GDP growth rate assumptions
23
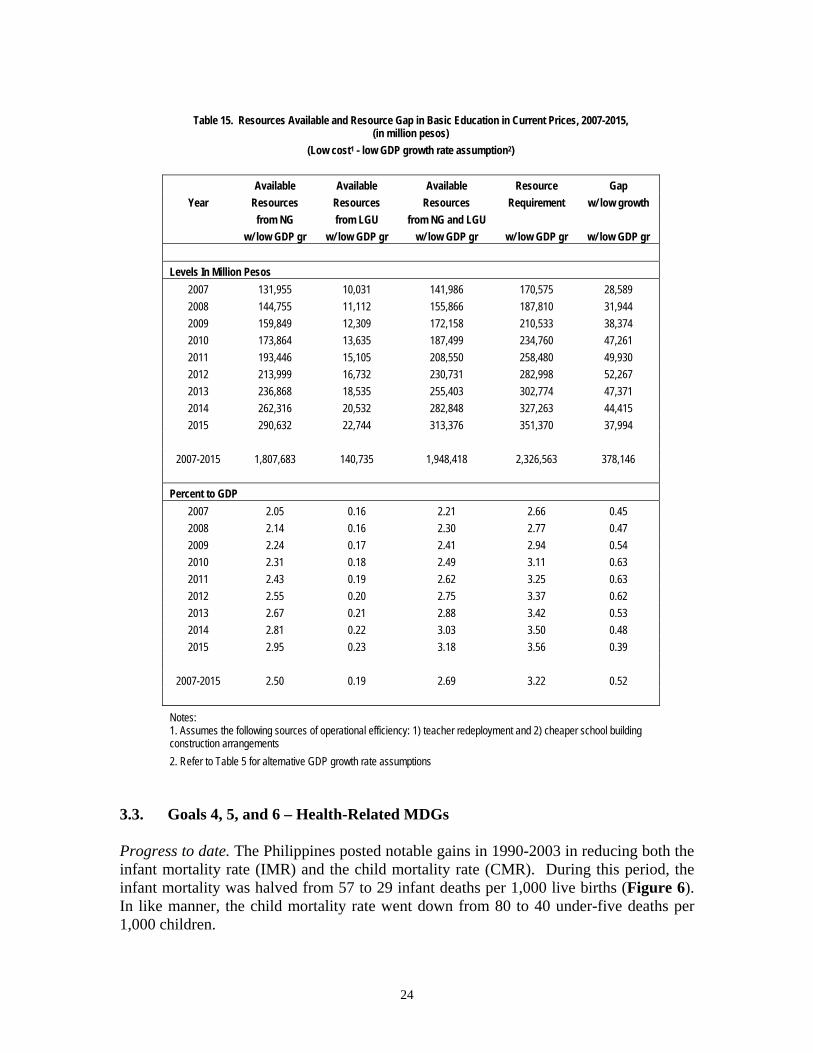
Table 15. Resources Available and Resource Gap in Basic Education in Current Prices, 2007-2015,
(in million pesos) (Low cost1 - low GDP growth rate assumption2)
Available Available Available Resource Gap
Year Resources Resources Resources Requirement w/ low growth from NG from LGU from NG and LGU w/ low GDP gr w/ low GDP gr w/ low GDP gr w/ low GDP gr w/ low GDP gr Levels In Million Pesos
2007 131,955 10,031 141,986 170,575 28,589 2008 144,755 11,112 155,866 187,810 31,944 2009 159,849 12,309 172,158 210,533 38,374 2010 173,864 13,635 187,499 234,760 47,261 2011 193,446 15,105 208,550 258,480 49,930 2012 213,999 16,732 230,731 282,998 52,267 2013 236,868 18,535 255,403 302,774 47,371 2014 262,316 20,532 282,848 327,263 44,415 2015 290,632 22,744 313,376 351,370 37,994
2007-2015 1,807,683 140,735 1,948,418 2,326,563 378,146
Percent to GDP
2007 2.05 0.16 2.21 2.66 0.45 2008 2.14 0.16 2.30 2.77 0.47 2009 2.24 0.17 2.41 2.94 0.54 2010 2.31 0.18 2.49 3.11 0.63 2011 2.43 0.19 2.62 3.25 0.63 2012 2.55 0.20 2.75 3.37 0.62 2013 2.67 0.21 2.88 3.42 0.53 2014 2.81 0.22 3.03 3.50 0.48 2015 2.95 0.23 3.18 3.56 0.39
2007-2015 2.50 0.19 2.69 3.22 0.52
Notes: 1. Assumes the following sources of operational efficiency: 1) teacher redeployment and 2) cheaper school building construction arrangements 2. Refer to Table 5 for alternative GDP growth rate assumptions
3.3. Goals 4, 5, and 6 – Health-Related MDGs Progress to date. The Philippines posted notable gains in 1990-2003 in reducing both the infant mortality rate (IMR) and the child mortality rate (CMR). During this period, the infant mortality was halved from 57 to 29 infant deaths per 1,000 live births (Figure 6). In like manner, the child mortality rate went down from 80 to 40 under-five deaths per 1,000 children.
24
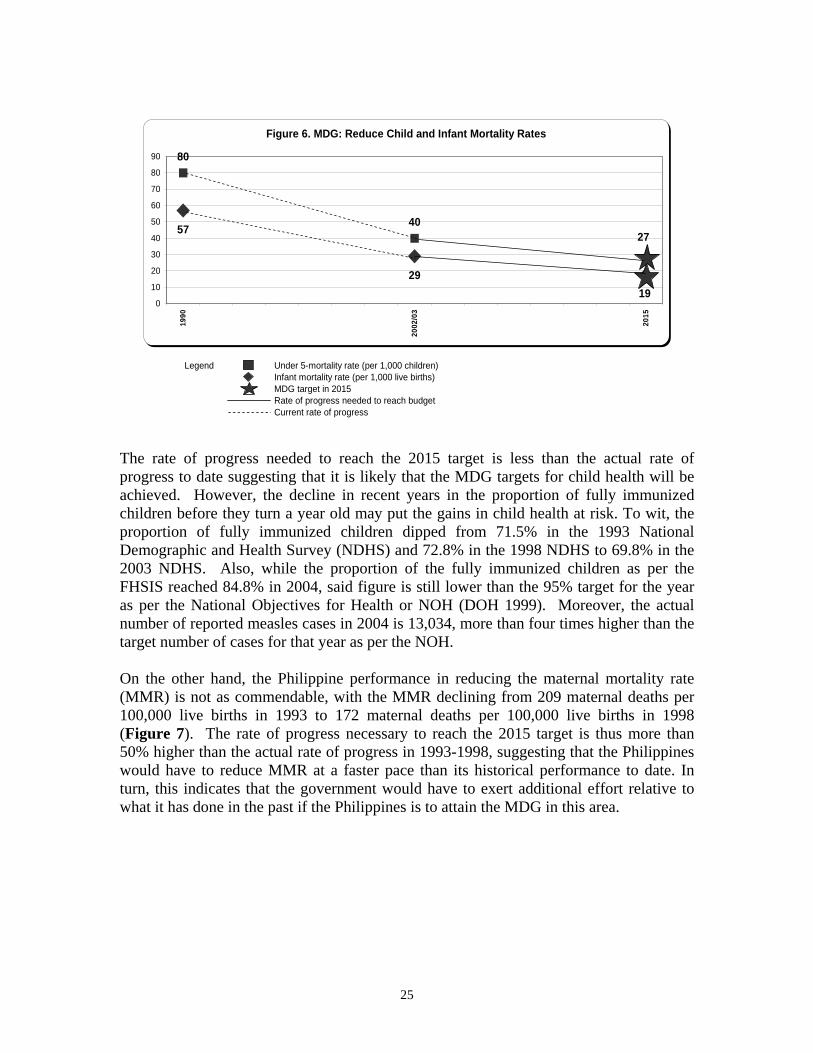
Legend Under 5-mortality rate (per 1,000 children)Infant mortality rate (per 1,000 live births)MDG target in 2015Rate of progress needed to reach budgetCurrent rate of progress
Figure 6. MDG: Reduce Child and Infant Mortality Rates
57
29
80
40
19
27
0
10
20
30
40
50
60
70
80
90
1990
2002
/03
2015
The rate of progress needed to reach the 2015 target is less than the actual rate of progress to date suggesting that it is likely that the MDG targets for child health will be achieved. However, the decline in recent years in the proportion of fully immunized children before they turn a year old may put the gains in child health at risk. To wit, the proportion of fully immunized children dipped from 71.5% in the 1993 National Demographic and Health Survey (NDHS) and 72.8% in the 1998 NDHS to 69.8% in the 2003 NDHS. Also, while the proportion of the fully immunized children as per the FHSIS reached 84.8% in 2004, said figure is still lower than the 95% target for the year as per the National Objectives for Health or NOH (DOH 1999). Moreover, the actual number of reported measles cases in 2004 is 13,034, more than four times higher than the target number of cases for that year as per the NOH. On the other hand, the Philippine performance in reducing the maternal mortality rate (MMR) is not as commendable, with the MMR declining from 209 maternal deaths per 100,000 live births in 1993 to 172 maternal deaths per 100,000 live births in 1998 (Figure 7). The rate of progress necessary to reach the 2015 target is thus more than 50% higher than the actual rate of progress in 1993-1998, suggesting that the Philippines would have to reduce MMR at a faster pace than its historical performance to date. In turn, this indicates that the government would have to exert additional effort relative to what it has done in the past if the Philippines is to attain the MDG in this area.
25
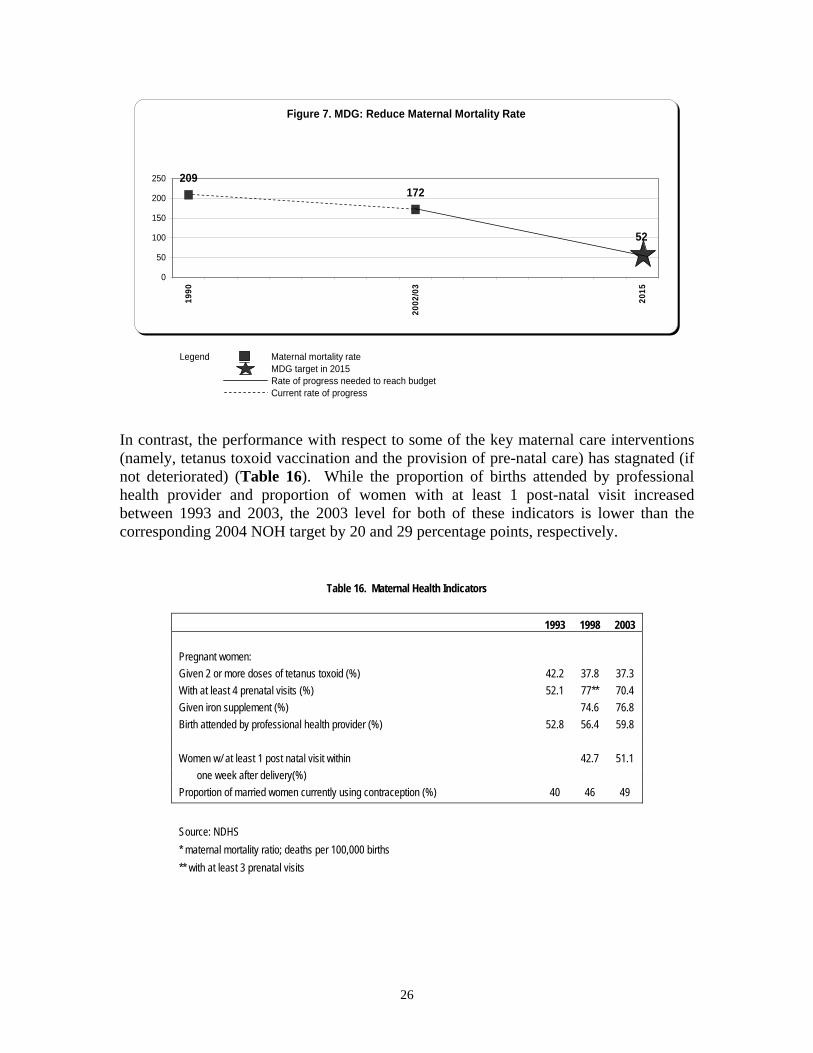
Legend Maternal mortality rateMDG target in 2015Rate of progress needed to reach budgetCurrent rate of progress
Figure 7. MDG: Reduce Maternal Mortality Rate
209172
52
0
50
100
150
200
25019
90
2002
/03
2015
In contrast, the performance with respect to some of the key maternal care interventions (namely, tetanus toxoid vaccination and the provision of pre-natal care) has stagnated (if not deteriorated) (Table 16). While the proportion of births attended by professional health provider and proportion of women with at least 1 post-natal visit increased between 1993 and 2003, the 2003 level for both of these indicators is lower than the corresponding 2004 NOH target by 20 and 29 percentage points, respectively.
Table 16. Maternal Health Indicators 1993 1998 2003 Pregnant women: Given 2 or more doses of tetanus toxoid (%) 42.2 37.8 37.3 With at least 4 prenatal visits (%) 52.1 77** 70.4 Given iron supplement (%) 74.6 76.8 Birth attended by professional health provider (%) 52.8 56.4 59.8 Women w/ at least 1 post natal visit within 42.7 51.1 one week after delivery(%) Proportion of married women currently using contraception (%) 40 46 49
Source: NDHS * maternal mortality ratio; deaths per 100,000 births ** with at least 3 prenatal visits
26
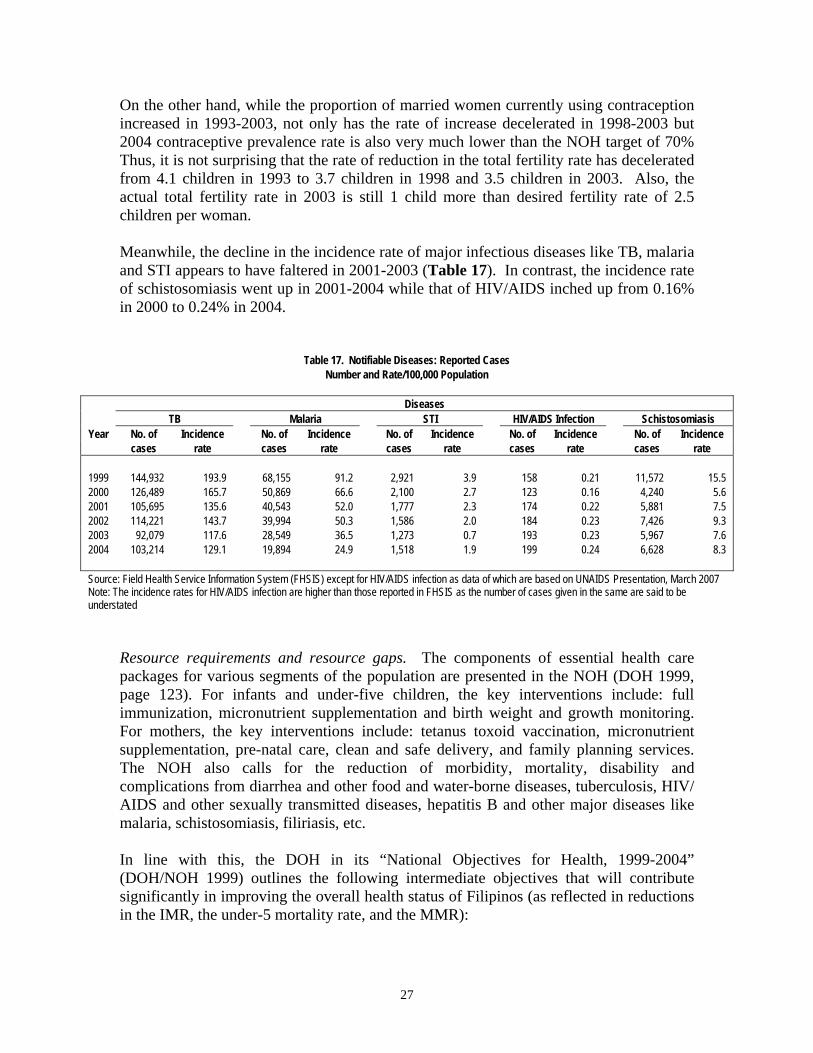
On the other hand, while the proportion of married women currently using contraception increased in 1993-2003, not only has the rate of increase decelerated in 1998-2003 but 2004 contraceptive prevalence rate is also very much lower than the NOH target of 70% Thus, it is not surprising that the rate of reduction in the total fertility rate has decelerated from 4.1 children in 1993 to 3.7 children in 1998 and 3.5 children in 2003. Also, the actual total fertility rate in 2003 is still 1 child more than desired fertility rate of 2.5 children per woman. Meanwhile, the decline in the incidence rate of major infectious diseases like TB, malaria and STI appears to have faltered in 2001-2003 (Table 17). In contrast, the incidence rate of schistosomiasis went up in 2001-2004 while that of HIV/AIDS inched up from 0.16% in 2000 to 0.24% in 2004.
Table 17. Notifiable Diseases: Reported Cases Number and Rate/100,000 Population
Diseases TB Malaria STI HIV/AIDS Infection Schistosomiasis Year No. of Incidence No. of Incidence No. of Incidence No. of Incidence No. of Incidence cases rate cases rate cases rate cases rate cases rate 1999 144,932 193.9 68,155 91.2 2,921 3.9 158 0.21 11,572 15.5 2000 126,489 165.7 50,869 66.6 2,100 2.7 123 0.16 4,240 5.6 2001 105,695 135.6 40,543 52.0 1,777 2.3 174 0.22 5,881 7.5 2002 114,221 143.7 39,994 50.3 1,586 2.0 184 0.23 7,426 9.3 2003 92,079 117.6 28,549 36.5 1,273 0.7 193 0.23 5,967 7.6 2004 103,214 129.1 19,894 24.9 1,518 1.9 199 0.24 6,628 8.3
Source: Field Health Service Information System (FHSIS) except for HIV/AIDS infection as data of which are based on UNAIDS Presentation, March 2007 Note: The incidence rates for HIV/AIDS infection are higher than those reported in FHSIS as the number of cases given in the same are said to be understated
Resource requirements and resource gaps. The components of essential health care packages for various segments of the population are presented in the NOH (DOH 1999, page 123). For infants and under-five children, the key interventions include: full immunization, micronutrient supplementation and birth weight and growth monitoring. For mothers, the key interventions include: tetanus toxoid vaccination, micronutrient supplementation, pre-natal care, clean and safe delivery, and family planning services. The NOH also calls for the reduction of morbidity, mortality, disability and complications from diarrhea and other food and water-borne diseases, tuberculosis, HIV/ AIDS and other sexually transmitted diseases, hepatitis B and other major diseases like malaria, schistosomiasis, filiriasis, etc. In line with this, the DOH in its “National Objectives for Health, 1999-2004” (DOH/NOH 1999) outlines the following intermediate objectives that will contribute significantly in improving the overall health status of Filipinos (as reflected in reductions in the IMR, the under-5 mortality rate, and the MMR):
27
• increase the proportion of fully immunized infants from 89% in 1998 to 95% in 2004;
• increase the proportion of infants immunized against hepatitis B from 37% in 1998 to 95% in 2004;
• increase the proportion of pregnant women receiving 2 doses of tetanus toxoid vaccine from 50% in 1998 (FHSIS) to 80% in 2004;
• increase the proportion of children given Vitamin A supplement from 90% in 1998 to 100% from 2004 onwards so as to reduce the prevalence of Vitamin A deficiency from 38% in 1993 to 15% in 2004;18
• increase the proportion of lactating women given Vitamin A supplement from 49% in 1998 (FHSIS) to 56% in 2004 so as reduce prevalence of vitamin A deficiency from 1% in 1993 to 0.3% in 2004 amongst lactating women and from 0.5% to 0.2% amongst pregnant women;
• increase the proportion of pregnant and lactating women given iron supplement from 64% in 1998 to 74% in 2004 so as to reduce prevalence of anemia from 51% in 1998 to 40% in 2004 amongst pregnant women and from 46% to 37% amongst lactating women;
• increase the proportion of women aged 15-40 given iodine supplement from 21% in 1998 to 35% in 2004 so as to reduce the prevalence of iodine deficiency from 36% in 1994 to 20% in 2004;
• reduce the prevalence of smear positive TB cases from 310 per 100,000 population in 1997 to 280 in 2004; increase the case detection rate (i.e., number of new smear positive cases detected relative to proportion of smear positives) from 45% in 1998 to 70% in 2004; increase the proportion of identified TB cases given the Directly Observed Treatment Shortcourse (DOTS) from 50% in 1997 to 100% in 2004 onwards;
• increase the proportion of clinically diagnosed malaria cases given treatment from 17% in 2001 to 40% in 2004, increasing to 5 percentage points yearly to reach 95% in 2015; sustain proportion of malaria A and B houses sprayed at 100% in 2002-2004;
• increase proportion of exposed population in schistosomiasis areas given stool exam from 20% in 1999 (FHSIS) to 62% in 2004; maintain proportion of those with positive stool exam given treatment at 100%;
• provide assistance to 18 provinces/cities each year from 2002-2010 to help them improve health facilities and allow them to be accredited providers under the NHIP;
18 This target as well as those for vitamin A supplementation for lactating women, iron supplementation for pregnant and lactating women and iodine supplementation for women aged 15-40 refer to the high cost estimate. Under the low cost assumption, the coverage of Vitamin A micronutrient supplementation for children is assumed to decline to about 10 percentage points above the poverty incidence as food fortification takes effect from 2005 onwards. Moreover, poverty incidence is assumed to decrease from 32% in 2002 to 31% in 2003 and 30% in 2004, and by 1 percentage point per year every year thereafter up to 19% in 2015.
28
• sustain per capita expenditures in other public health programs at their 2002 levels; and
• increase indigent households enrolled in NHIP from .3% of total number of poor households in 2001 to 22.5% in 2004.
In line with these, the estimates of the resource requirements needed to meet the health-related MDGs extrapolated the intermediate outputs in the NOH so as to deliver the following intermediate outputs by 2015:
Child health • Fully immunized child coverage will increase from 84.5% in 2005 to 100% in
2015. • Hepatitis B coverage will increase from 45.6% in 2005 to 100% in 2015. • The proportion of children aged 0-5 years of age who are given Vitamin A
will increase from 79% in 2004 to 100% in 2015. • All under-five children will be given micronutrient supplementation.
Maternal health
• Coverage of tetanus toxoid vaccination will increase from 80% in 2005 to 100% in 2015.
• The proportion of pregnant women and lactating mothers given Vitamin A will increase from 53% in 2004 to 100% in 2015.
• Contraceptive prevalence rate (modern users) will increase from 48.9% in 2004 to 70% in 2015.
On the other hand, the estimates of the resource requirements to combat HIV/AIDS, malaria and TB take into account that the DOH aims to reduce the STI prevalence rate from 5% of the general population in 2006 to 1% in 2010 and 0.5% in 2015; the TB morbidity rate from 310 per 100,000 population in 1999 to 290 in 2006, 250 in 2010 and 190 in 2015; the malaria morbidity rate from 455 per 100,000 population in 1999 to 269 in 2006, 138 in 2010 and 1 in 2015. To achieve this, the DOH MDG report calls for the: • Mass treatment of commercial sex workers; • Clinical care for HIV/AIDS case; • Treatment of malaria cases; • Prophylaxis of pregnant women and non-immune visitors; • Provision of laboratory supplies, insecticides and mosquito nets; • Treatment of TB cases, including children; • Provision of laboratory logistics; and • Training of health frontline workers.
Detailed information on the unit cost of the following critical public health interventions were obtained from the DOH: (1) expanded program of immunization, (2) tetanus toxoid vaccination for mothers, (3) micronutrient supplementation, and (4) treatment and control of tuberculosis, malaria, and STI. Next, the financial requirement for the achievement of the MDG targets is computed as the product of the unit cost, the target population/clientele and the target coverage rate.
29
It is worth emphasizing that the delivery of basic health services has been devolved to LGUs under the Local Government Code. However, the public good nature of public health services suggests that the central government cannot fully abdicate its role in this sub-sector despite devolution. It should also be recalled that when health services were actually devolved to LGUs in 1992/1993, the estimate of the cost of devolved health services (which was netted out of the DOH budget at that time and which is the basis of all subsequent analysis regarding the adequacy of the IRA to fund devolved services) only included the PS cost of personnel who were actually transferred to LGUs and the MOOE of the operation of devolved facilities. The cost of public health commodities that was retained in the DOH budget (amounting to PhP 1 billion in 1993) was not included in this reckoning. The estimates of the resource requirements for the attainment of the health-related MDGs take into account the de facto division of responsibilities in basic health services: • In child and maternal health, the central government finances procurement of
antigens for vaccination while LGUs takes care of the provision of syringes and safety boxes as well as health staff (including training cost) who actually administer the vaccines.
• Procurement of supplies for iron supplementation and drugs for the control of acute respiratory illness and control of diarrhea is an LGU responsibility.
• Procurement of contraceptive supplies is lodged almost 100% with LGUs. • Health staff who delivers services relating to the treatment and control of
HIV/AIDS, TB and malaria are financed by LGUs while the central government provides the drugs and medicines.
• Travel cost to training venue of LGU health personnel is the responsibility of the LGU while the cost of facilitators, resource persons, training materials and accommodations is the responsibility of the central government.
At the central government level Table 18 presents the estimates of the amount of resources needed to meet the health-related MDGs at the central government level. It shows that the amount of resources needed to support the attainment of the MDG on basic health is equal to PhP 10.4 billion (or 0.15% of GDP) in 2007 and equal to a cumulative total of PhP 123.5 billion (0.12% of GDP) in 2007-2015.
30
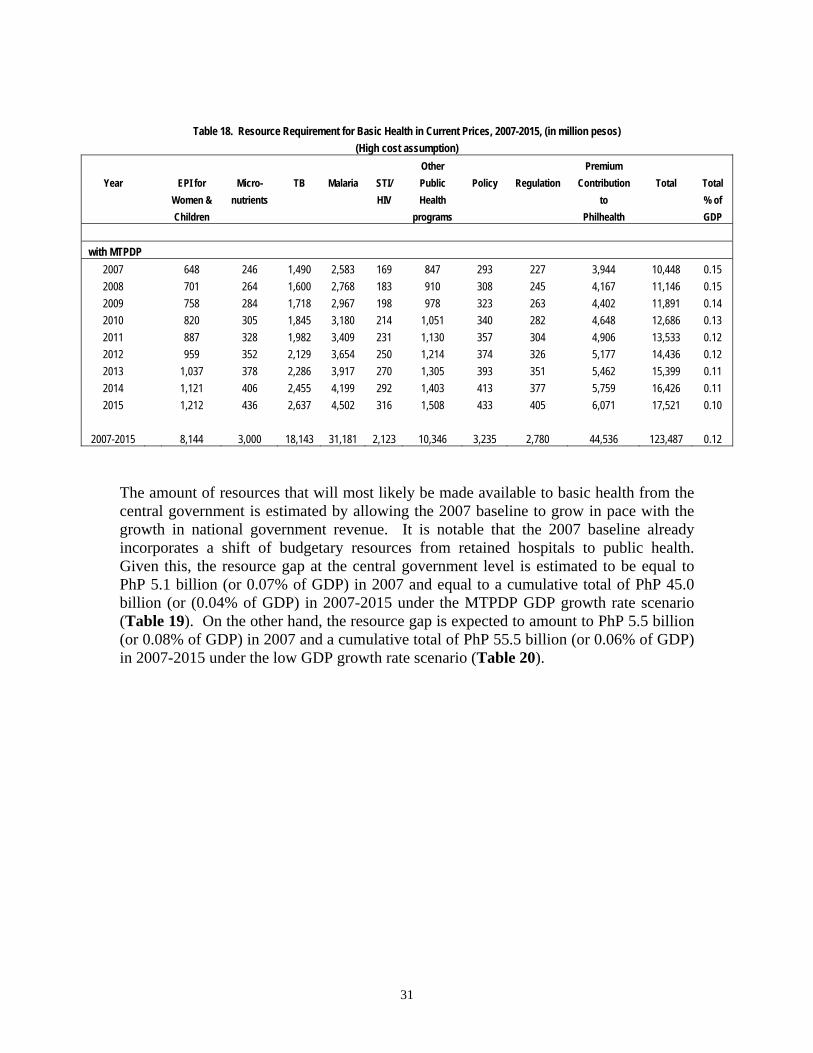
Table 18. Resource Requirement for Basic Health in Current Prices, 2007-2015, (in million pesos)
(High cost assumption) Other Premium
Year EPI for Micro- TB Malaria STI/ Public Policy Regulation Contribution Total Total Women & nutrients HIV Health to % of
Children programs Philhealth GDP with MTPDP
2007 648 246 1,490 2,583 169 847 293 227 3,944 10,448 0.15 2008 701 264 1,600 2,768 183 910 308 245 4,167 11,146 0.15 2009 758 284 1,718 2,967 198 978 323 263 4,402 11,891 0.14 2010 820 305 1,845 3,180 214 1,051 340 282 4,648 12,686 0.13 2011 887 328 1,982 3,409 231 1,130 357 304 4,906 13,533 0.12 2012 959 352 2,129 3,654 250 1,214 374 326 5,177 14,436 0.12 2013 1,037 378 2,286 3,917 270 1,305 393 351 5,462 15,399 0.11 2014 1,121 406 2,455 4,199 292 1,403 413 377 5,759 16,426 0.11 2015 1,212 436 2,637 4,502 316 1,508 433 405 6,071 17,521 0.10
2007-2015 8,144 3,000 18,143 31,181 2,123 10,346 3,235 2,780 44,536 123,487 0.12
The amount of resources that will most likely be made available to basic health from the central government is estimated by allowing the 2007 baseline to grow in pace with the growth in national government revenue. It is notable that the 2007 baseline already incorporates a shift of budgetary resources from retained hospitals to public health. Given this, the resource gap at the central government level is estimated to be equal to PhP 5.1 billion (or 0.07% of GDP) in 2007 and equal to a cumulative total of PhP 45.0 billion (or (0.04% of GDP) in 2007-2015 under the MTPDP GDP growth rate scenario (Table 19). On the other hand, the resource gap is expected to amount to PhP 5.5 billion (or 0.08% of GDP) in 2007 and a cumulative total of PhP 55.5 billion (or 0.06% of GDP) in 2007-2015 under the low GDP growth rate scenario (Table 20).
31
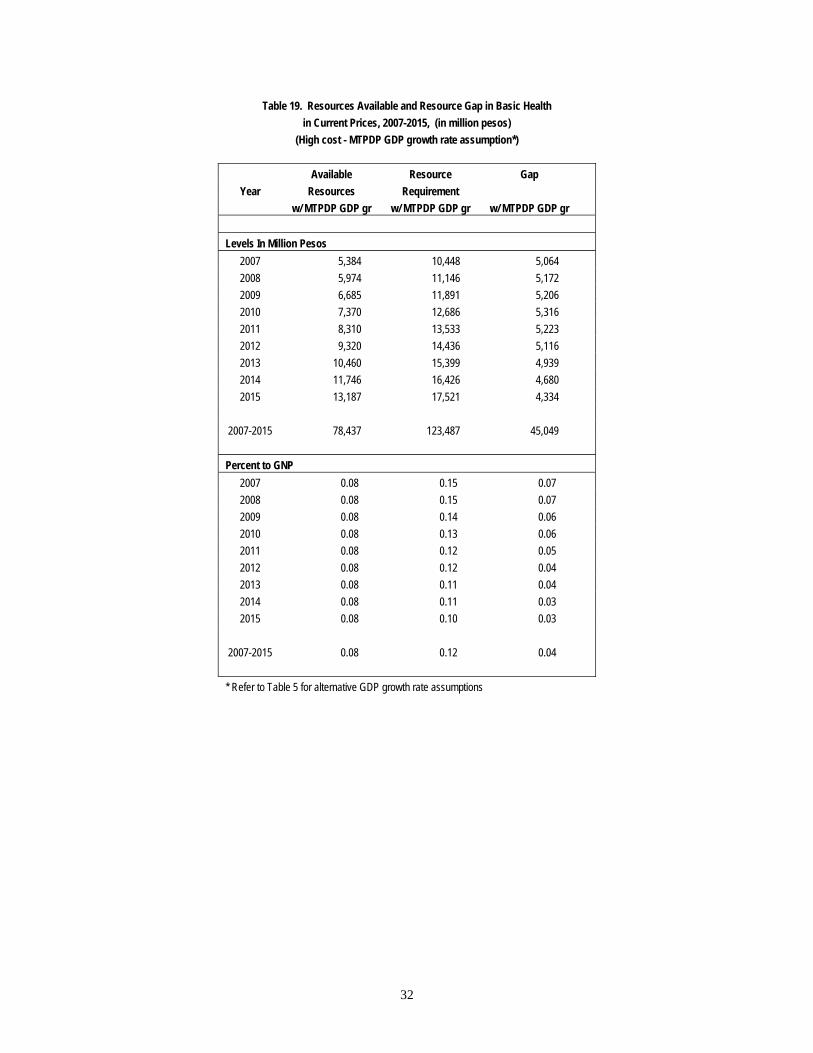
Table 19. Resources Available and Resource Gap in Basic Health in Current Prices, 2007-2015, (in million pesos)
(High cost - MTPDP GDP growth rate assumption*)
Available Resource Gap Year Resources Requirement
w/ MTPDP GDP gr w/ MTPDP GDP gr w/ MTPDP GDP gr Levels In Million Pesos
2007 5,384 10,448 5,064 2008 5,974 11,146 5,172 2009 6,685 11,891 5,206 2010 7,370 12,686 5,316 2011 8,310 13,533 5,223 2012 9,320 14,436 5,116 2013 10,460 15,399 4,939 2014 11,746 16,426 4,680 2015 13,187 17,521 4,334
2007-2015 78,437 123,487 45,049
Percent to GNP
2007 0.08 0.15 0.07 2008 0.08 0.15 0.07 2009 0.08 0.14 0.06 2010 0.08 0.13 0.06 2011 0.08 0.12 0.05 2012 0.08 0.12 0.04 2013 0.08 0.11 0.04 2014 0.08 0.11 0.03 2015 0.08 0.10 0.03
2007-2015 0.08 0.12 0.04 * Refer to Table 5 for alternative GDP growth rate assumptions
32
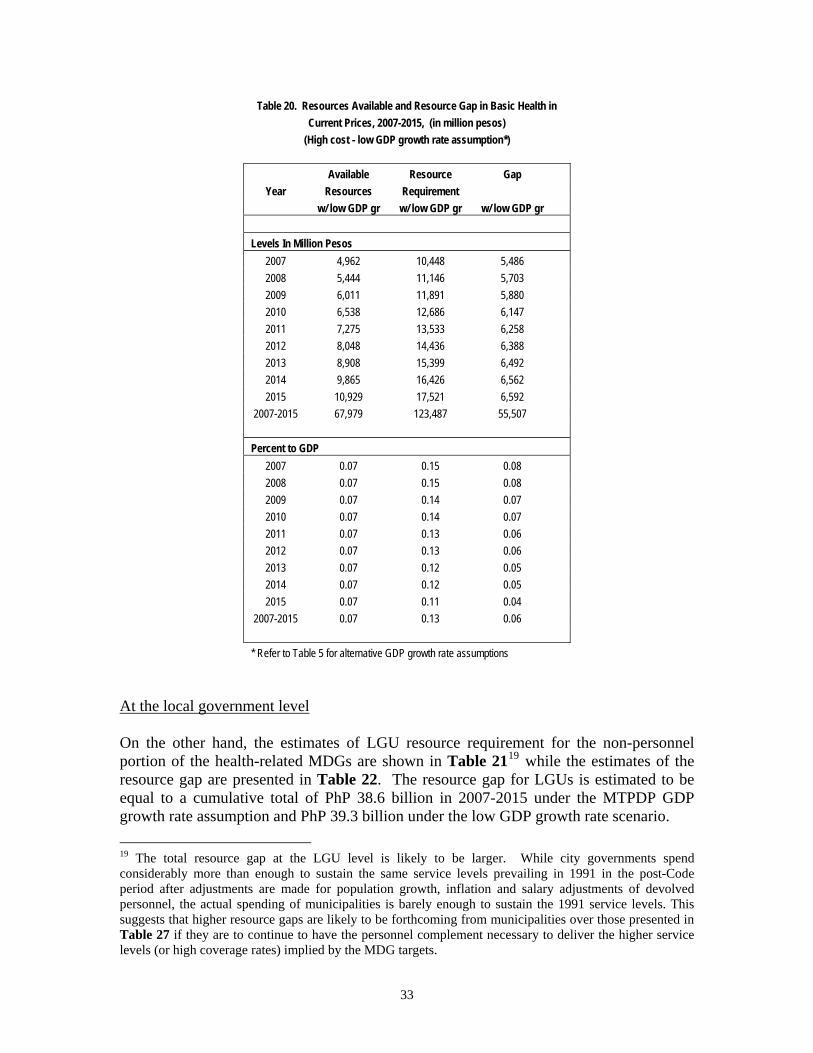
Table 20. Resources Available and Resource Gap in Basic Health in Current Prices, 2007-2015, (in million pesos)
(High cost - low GDP growth rate assumption*)
Available Resource Gap Year Resources Requirement
w/ low GDP gr w/ low GDP gr w/ low GDP gr Levels In Million Pesos
2007 4,962 10,448 5,486 2008 5,444 11,146 5,703 2009 6,011 11,891 5,880 2010 6,538 12,686 6,147 2011 7,275 13,533 6,258 2012 8,048 14,436 6,388 2013 8,908 15,399 6,492 2014 9,865 16,426 6,562 2015 10,929 17,521 6,592
2007-2015 67,979 123,487 55,507
Percent to GDP 2007 0.07 0.15 0.08 2008 0.07 0.15 0.08 2009 0.07 0.14 0.07 2010 0.07 0.14 0.07 2011 0.07 0.13 0.06 2012 0.07 0.13 0.06 2013 0.07 0.12 0.05 2014 0.07 0.12 0.05 2015 0.07 0.11 0.04
2007-2015 0.07 0.13 0.06 * Refer to Table 5 for alternative GDP growth rate assumptions
At the local government level On the other hand, the estimates of LGU resource requirement for the non-personnel portion of the health-related MDGs are shown in Table 2119 while the estimates of the resource gap are presented in Table 22. The resource gap for LGUs is estimated to be equal to a cumulative total of PhP 38.6 billion in 2007-2015 under the MTPDP GDP growth rate assumption and PhP 39.3 billion under the low GDP growth rate scenario. 19 The total resource gap at the LGU level is likely to be larger. While city governments spend considerably more than enough to sustain the same service levels prevailing in 1991 in the post-Code period after adjustments are made for population growth, inflation and salary adjustments of devolved personnel, the actual spending of municipalities is barely enough to sustain the 1991 service levels. This suggests that higher resource gaps are likely to be forthcoming from municipalities over those presented in Table 27 if they are to continue to have the personnel complement necessary to deliver the higher service levels (or high coverage rates) implied by the MDG targets.
33
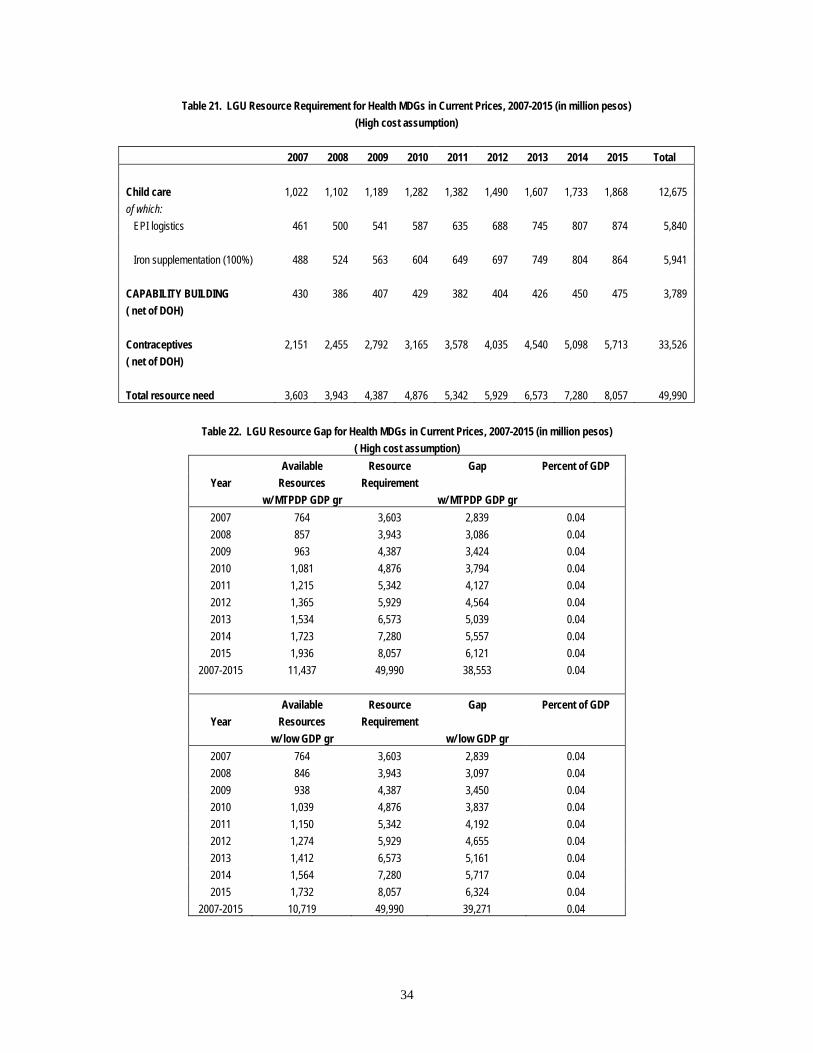
Table 21. LGU Resource Requirement for Health MDGs in Current Prices, 2007-2015 (in million pesos) (High cost assumption)
2007 2008 2009 2010 2011 2012 2013 2014 2015 Total Child care 1,022 1,102 1,189 1,282 1,382 1,490 1,607 1,733 1,868 12,675 of which: EPI logistics 461 500 541 587 635 688 745 807 874 5,840 Iron supplementation (100%) 488 524 563 604 649 697 749 804 864 5,941 CAPABILITY BUILDING 430 386 407 429 382 404 426 450 475 3,789 ( net of DOH) Contraceptives 2,151 2,455 2,792 3,165 3,578 4,035 4,540 5,098 5,713 33,526 ( net of DOH) Total resource need 3,603 3,943 4,387 4,876 5,342 5,929 6,573 7,280 8,057 49,990
Table 22. LGU Resource Gap for Health MDGs in Current Prices, 2007-2015 (in million pesos)
( High cost assumption) Available Resource Gap Percent of GDP
Year Resources Requirement w/ MTPDP GDP gr w/ MTPDP GDP gr
2007 764 3,603 2,839 0.04 2008 857 3,943 3,086 0.04 2009 963 4,387 3,424 0.04 2010 1,081 4,876 3,794 0.04 2011 1,215 5,342 4,127 0.04 2012 1,365 5,929 4,564 0.04 2013 1,534 6,573 5,039 0.04 2014 1,723 7,280 5,557 0.04 2015 1,936 8,057 6,121 0.04
2007-2015 11,437 49,990 38,553 0.04 Available Resource Gap Percent of GDP
Year Resources Requirement w/ low GDP gr w/ low GDP gr
2007 764 3,603 2,839 0.04 2008 846 3,943 3,097 0.04 2009 938 4,387 3,450 0.04 2010 1,039 4,876 3,837 0.04 2011 1,150 5,342 4,192 0.04 2012 1,274 5,929 4,655 0.04 2013 1,412 6,573 5,161 0.04 2014 1,564 7,280 5,717 0.04 2015 1,732 8,057 6,324 0.04
2007-2015 10,719 49,990 39,271 0.04
34
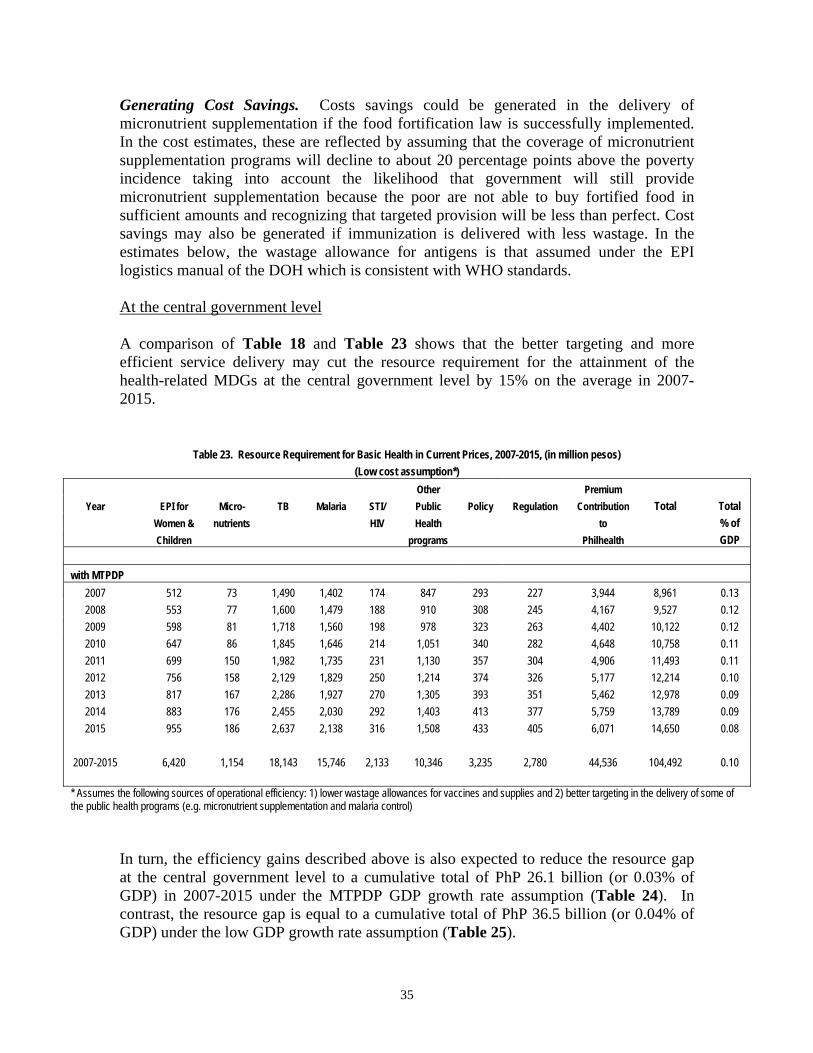
Generating Cost Savings. Costs savings could be generated in the delivery of micronutrient supplementation if the food fortification law is successfully implemented. In the cost estimates, these are reflected by assuming that the coverage of micronutrient supplementation programs will decline to about 20 percentage points above the poverty incidence taking into account the likelihood that government will still provide micronutrient supplementation because the poor are not able to buy fortified food in sufficient amounts and recognizing that targeted provision will be less than perfect. Cost savings may also be generated if immunization is delivered with less wastage. In the estimates below, the wastage allowance for antigens is that assumed under the EPI logistics manual of the DOH which is consistent with WHO standards. At the central government level A comparison of Table 18 and Table 23 shows that the better targeting and more efficient service delivery may cut the resource requirement for the attainment of the health-related MDGs at the central government level by 15% on the average in 2007-2015.
Table 23. Resource Requirement for Basic Health in Current Prices, 2007-2015, (in million pesos) (Low cost assumption*)
Other Premium Year EPI for Micro- TB Malaria STI/ Public Policy Regulation Contribution Total Total
Women & nutrients HIV Health to % of Children programs Philhealth GDP with MTPDP
2007 512 73 1,490 1,402 174 847 293 227 3,944 8,961 0.13 2008 553 77 1,600 1,479 188 910 308 245 4,167 9,527 0.12 2009 598 81 1,718 1,560 198 978 323 263 4,402 10,122 0.12 2010 647 86 1,845 1,646 214 1,051 340 282 4,648 10,758 0.11 2011 699 150 1,982 1,735 231 1,130 357 304 4,906 11,493 0.11 2012 756 158 2,129 1,829 250 1,214 374 326 5,177 12,214 0.10 2013 817 167 2,286 1,927 270 1,305 393 351 5,462 12,978 0.09 2014 883 176 2,455 2,030 292 1,403 413 377 5,759 13,789 0.09 2015 955 186 2,637 2,138 316 1,508 433 405 6,071 14,650 0.08
2007-2015 6,420 1,154 18,143 15,746 2,133 10,346 3,235 2,780 44,536 104,492 0.10
* Assumes the following sources of operational efficiency: 1) lower wastage allowances for vaccines and supplies and 2) better targeting in the delivery of some of the public health programs (e.g. micronutrient supplementation and malaria control)
In turn, the efficiency gains described above is also expected to reduce the resource gap at the central government level to a cumulative total of PhP 26.1 billion (or 0.03% of GDP) in 2007-2015 under the MTPDP GDP growth rate assumption (Table 24). In contrast, the resource gap is equal to a cumulative total of PhP 36.5 billion (or 0.04% of GDP) under the low GDP growth rate assumption (Table 25).
35
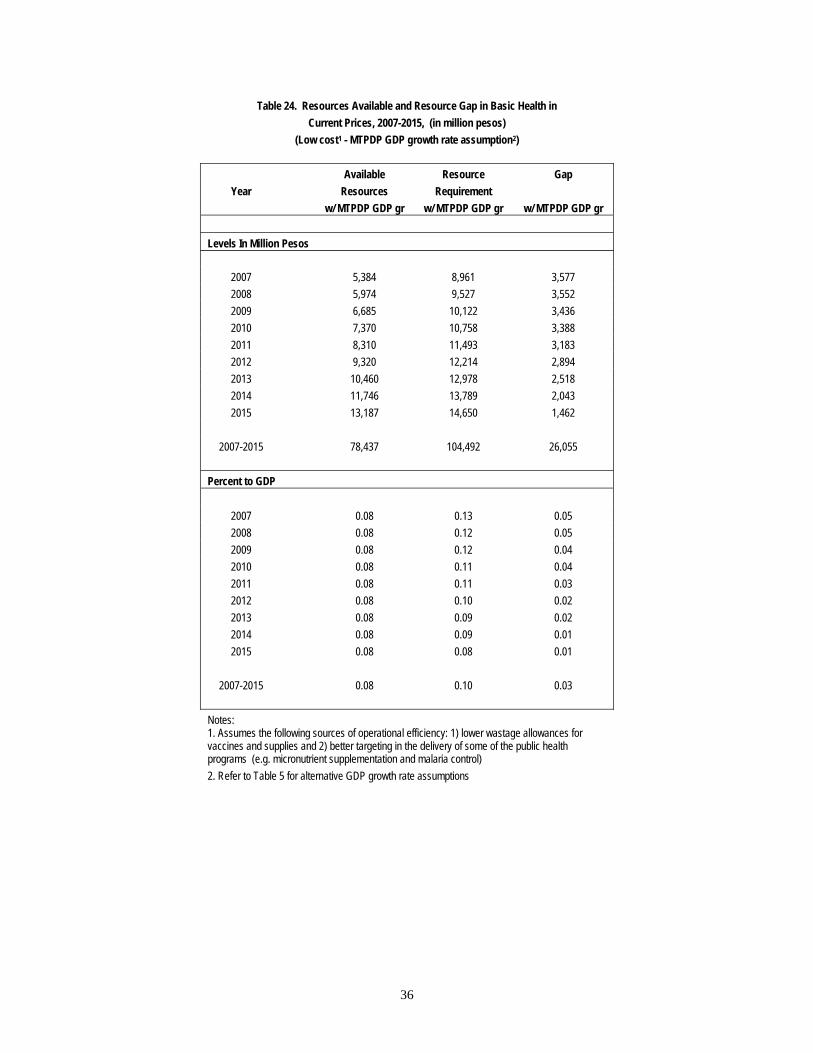
Table 24. Resources Available and Resource Gap in Basic Health in Current Prices, 2007-2015, (in million pesos)
(Low cost1 - MTPDP GDP growth rate assumption2)
Available Resource Gap Year Resources Requirement
w/ MTPDP GDP gr w/ MTPDP GDP gr w/ MTPDP GDP gr Levels In Million Pesos
2007 5,384 8,961 3,577 2008 5,974 9,527 3,552 2009 6,685 10,122 3,436 2010 7,370 10,758 3,388 2011 8,310 11,493 3,183 2012 9,320 12,214 2,894 2013 10,460 12,978 2,518 2014 11,746 13,789 2,043 2015 13,187 14,650 1,462
2007-2015 78,437 104,492 26,055
Percent to GDP
2007 0.08 0.13 0.05 2008 0.08 0.12 0.05 2009 0.08 0.12 0.04 2010 0.08 0.11 0.04 2011 0.08 0.11 0.03 2012 0.08 0.10 0.02 2013 0.08 0.09 0.02 2014 0.08 0.09 0.01 2015 0.08 0.08 0.01
2007-2015 0.08 0.10 0.03
Notes: 1. Assumes the following sources of operational efficiency: 1) lower wastage allowances for vaccines and supplies and 2) better targeting in the delivery of some of the public health programs (e.g. micronutrient supplementation and malaria control) 2. Refer to Table 5 for alternative GDP growth rate assumptions
36
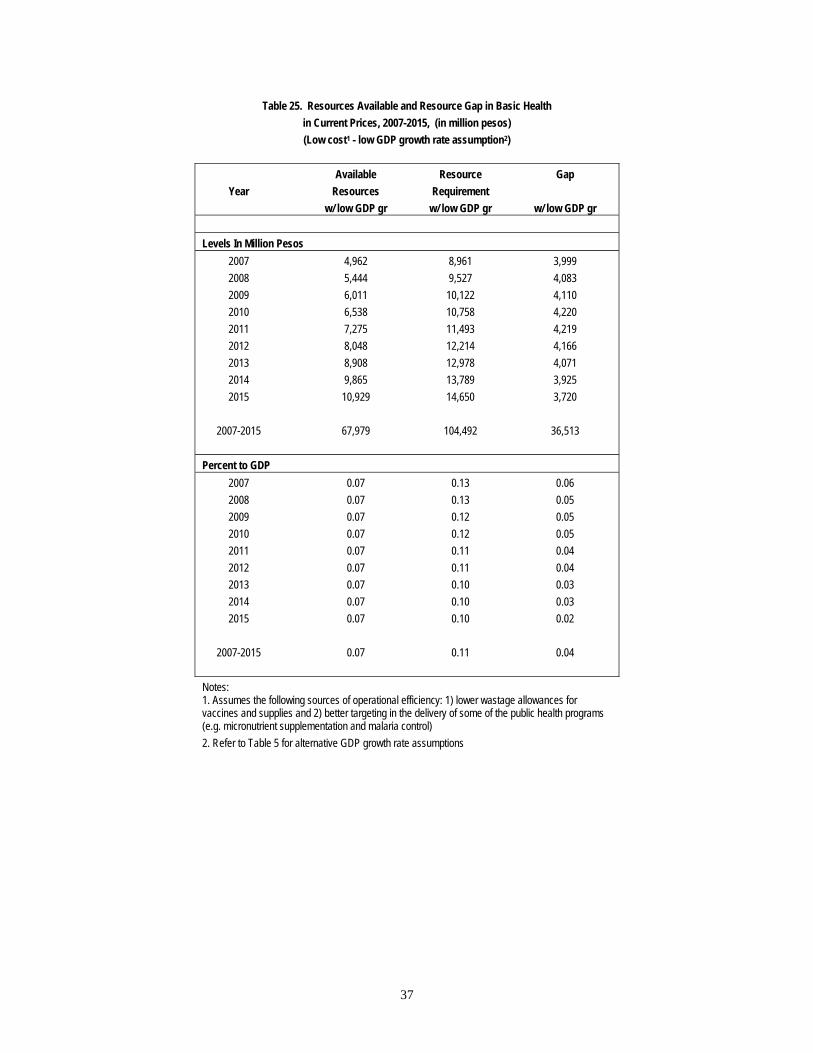
Table 25. Resources Available and Resource Gap in Basic Health in Current Prices, 2007-2015, (in million pesos) (Low cost1 - low GDP growth rate assumption2)
Available Resource Gap
Year Resources Requirement w/ low GDP gr w/ low GDP gr w/ low GDP gr Levels In Million Pesos
2007 4,962 8,961 3,999 2008 5,444 9,527 4,083 2009 6,011 10,122 4,110 2010 6,538 10,758 4,220 2011 7,275 11,493 4,219 2012 8,048 12,214 4,166 2013 8,908 12,978 4,071 2014 9,865 13,789 3,925 2015 10,929 14,650 3,720
2007-2015 67,979 104,492 36,513
Percent to GDP
2007 0.07 0.13 0.06 2008 0.07 0.13 0.05 2009 0.07 0.12 0.05 2010 0.07 0.12 0.05 2011 0.07 0.11 0.04 2012 0.07 0.11 0.04 2013 0.07 0.10 0.03 2014 0.07 0.10 0.03 2015 0.07 0.10 0.02
2007-2015 0.07 0.11 0.04
Notes: 1. Assumes the following sources of operational efficiency: 1) lower wastage allowances for vaccines and supplies and 2) better targeting in the delivery of some of the public health programs (e.g. micronutrient supplementation and malaria control) 2. Refer to Table 5 for alternative GDP growth rate assumptions
37
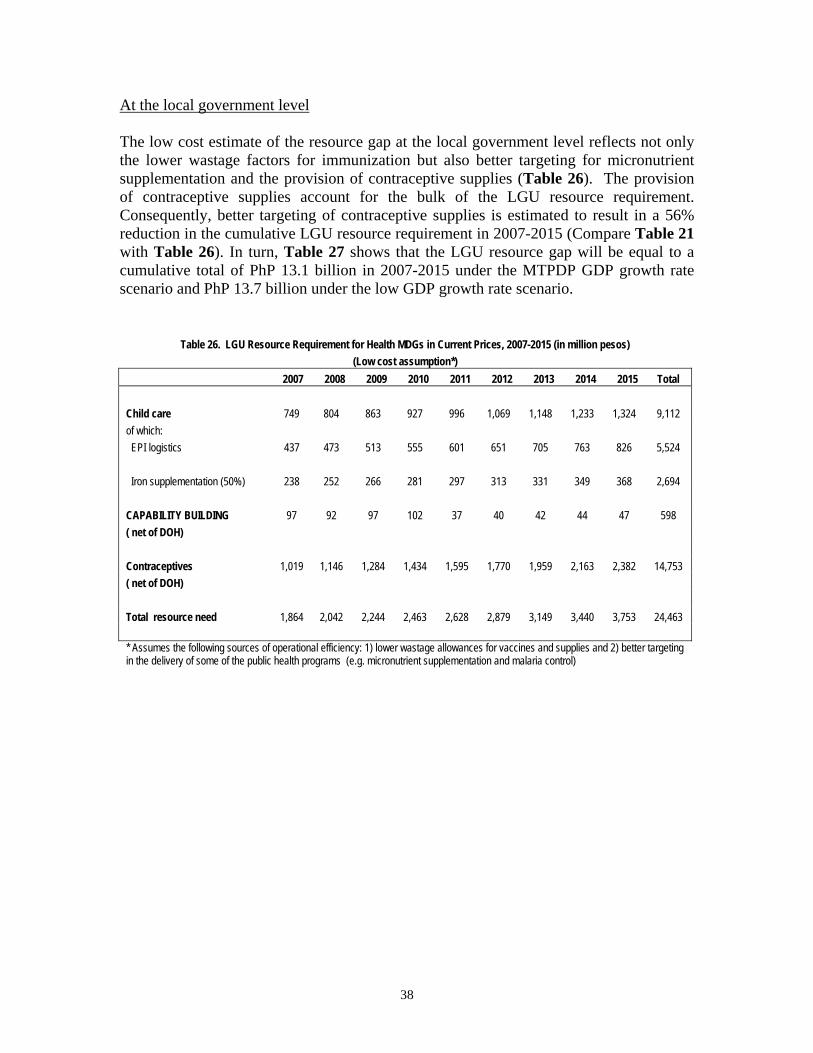
At the local government level The low cost estimate of the resource gap at the local government level reflects not only the lower wastage factors for immunization but also better targeting for micronutrient supplementation and the provision of contraceptive supplies (Table 26). The provision of contraceptive supplies account for the bulk of the LGU resource requirement. Consequently, better targeting of contraceptive supplies is estimated to result in a 56% reduction in the cumulative LGU resource requirement in 2007-2015 (Compare Table 21 with Table 26). In turn, Table 27 shows that the LGU resource gap will be equal to a cumulative total of PhP 13.1 billion in 2007-2015 under the MTPDP GDP growth rate scenario and PhP 13.7 billion under the low GDP growth rate scenario.
Table 26. LGU Resource Requirement for Health MDGs in Current Prices, 2007-2015 (in million pesos) (Low cost assumption*)
2007 2008 2009 2010 2011 2012 2013 2014 2015 Total Child care 749 804 863 927 996 1,069 1,148 1,233 1,324 9,112 of which: EPI logistics 437 473 513 555 601 651 705 763 826 5,524 Iron supplementation (50%) 238 252 266 281 297 313 331 349 368 2,694 CAPABILITY BUILDING 97 92 97 102 37 40 42 44 47 598 ( net of DOH) Contraceptives 1,019 1,146 1,284 1,434 1,595 1,770 1,959 2,163 2,382 14,753 ( net of DOH) Total resource need 1,864 2,042 2,244 2,463 2,628 2,879 3,149 3,440 3,753 24,463 * Assumes the following sources of operational efficiency: 1) lower wastage allowances for vaccines and supplies and 2) better targeting in the delivery of some of the public health programs (e.g. micronutrient supplementation and malaria control)
38
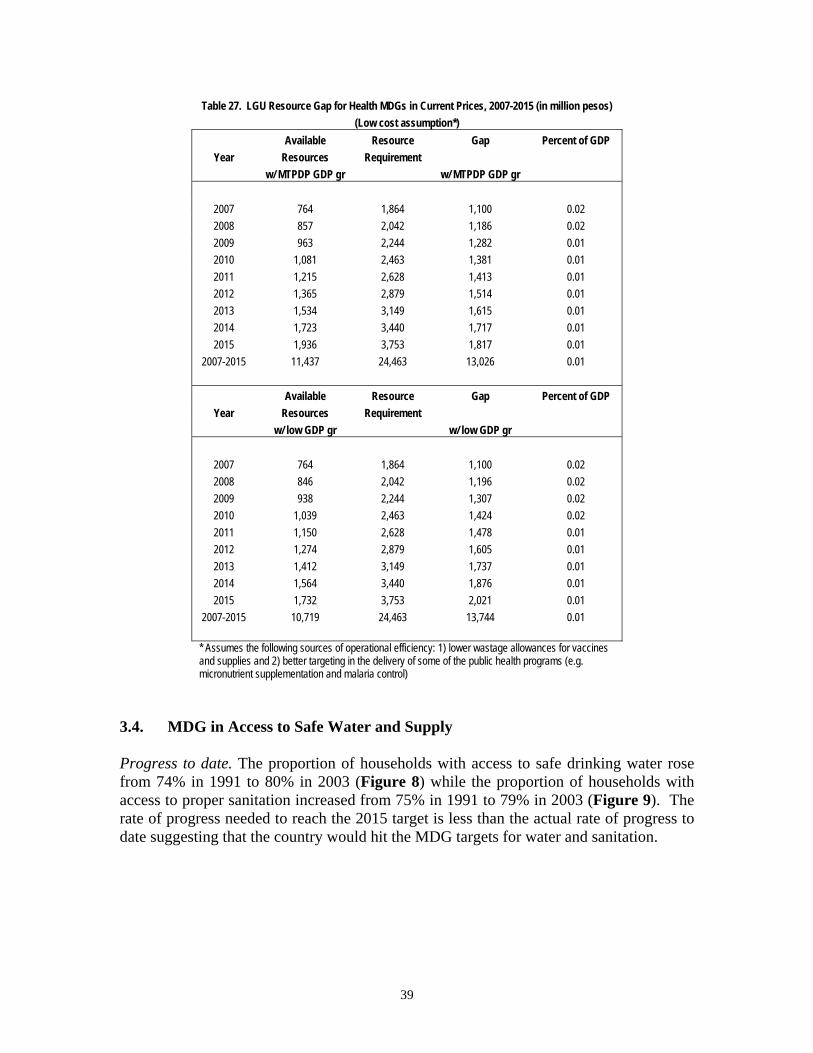
Table 27. LGU Resource Gap for Health MDGs in Current Prices, 2007-2015 (in million pesos) (Low cost assumption*)
Available Resource Gap Percent of GDP Year Resources Requirement
w/ MTPDP GDP gr w/ MTPDP GDP gr
2007 764 1,864 1,100 0.02 2008 857 2,042 1,186 0.02 2009 963 2,244 1,282 0.01 2010 1,081 2,463 1,381 0.01 2011 1,215 2,628 1,413 0.01 2012 1,365 2,879 1,514 0.01 2013 1,534 3,149 1,615 0.01 2014 1,723 3,440 1,717 0.01 2015 1,936 3,753 1,817 0.01
2007-2015 11,437 24,463 13,026 0.01 Available Resource Gap Percent of GDP
Year Resources Requirement w/ low GDP gr w/ low GDP gr
2007 764 1,864 1,100 0.02 2008 846 2,042 1,196 0.02 2009 938 2,244 1,307 0.02 2010 1,039 2,463 1,424 0.02 2011 1,150 2,628 1,478 0.01 2012 1,274 2,879 1,605 0.01 2013 1,412 3,149 1,737 0.01 2014 1,564 3,440 1,876 0.01 2015 1,732 3,753 2,021 0.01
2007-2015 10,719 24,463 13,744 0.01
* Assumes the following sources of operational efficiency: 1) lower wastage allowances for vaccines and supplies and 2) better targeting in the delivery of some of the public health programs (e.g. micronutrient supplementation and malaria control)
3.4. MDG in Access to Safe Water and Supply
Progress to date. The proportion of households with access to safe drinking water rose from 74% in 1991 to 80% in 2003 (Figure 8) while the proportion of households with access to proper sanitation increased from 75% in 1991 to 79% in 2003 (Figure 9). The rate of progress needed to reach the 2015 target is less than the actual rate of progress to date suggesting that the country would hit the MDG targets for water and sanitation.
39
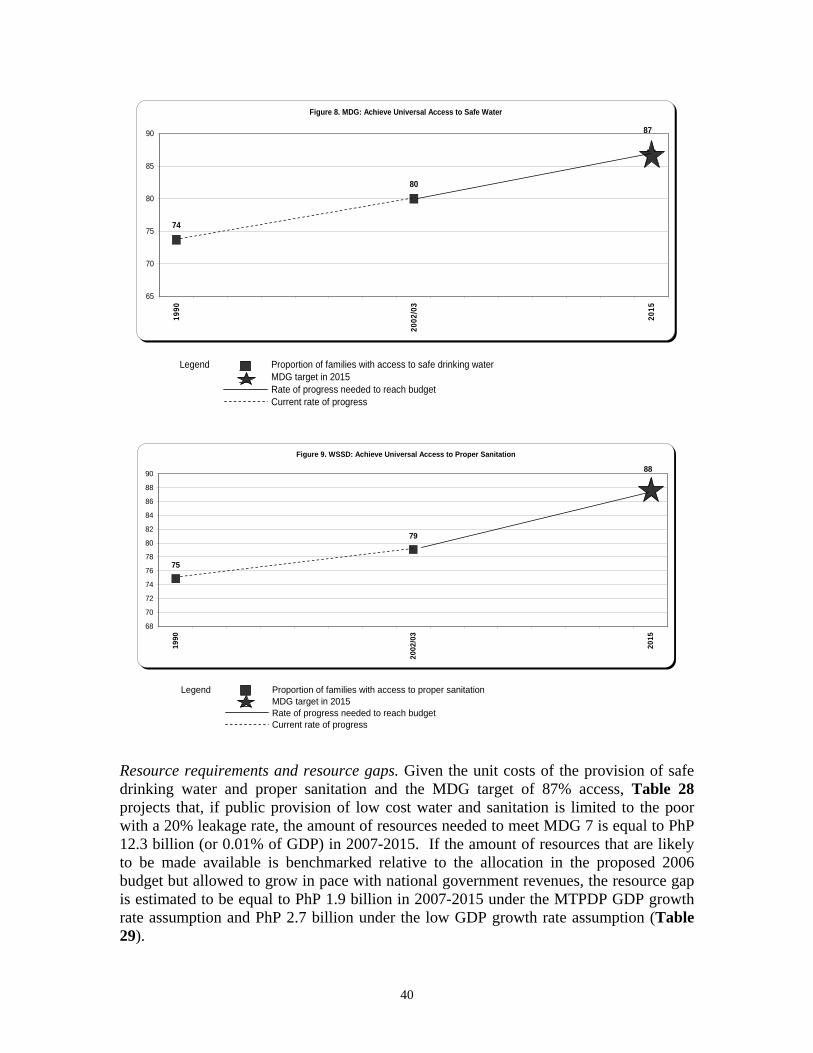
Legend Proportion of families with access to safe drinking waterMDG target in 2015Rate of progress needed to reach budgetCurrent rate of progress
Figure 8. MDG: Achieve Universal Access to Safe Water
74
80
87
65
70
75
80
85
90
1990
2002
/03
2015
Legend Proportion of families with access to proper sanitationMDG target in 2015Rate of progress needed to reach budgetCurrent rate of progress
Figure 9. WSSD: Achieve Universal Access to Proper Sanitation
75
79
88
68
70
72
74
76
78
80
82
84
86
88
90
1990
2002
/03
2015
Resource requirements and resource gaps. Given the unit costs of the provision of safe drinking water and proper sanitation and the MDG target of 87% access, Table 28 projects that, if public provision of low cost water and sanitation is limited to the poor with a 20% leakage rate, the amount of resources needed to meet MDG 7 is equal to PhP 12.3 billion (or 0.01% of GDP) in 2007-2015. If the amount of resources that are likely to be made available is benchmarked relative to the allocation in the proposed 2006 budget but allowed to grow in pace with national government revenues, the resource gap is estimated to be equal to PhP 1.9 billion in 2007-2015 under the MTPDP GDP growth rate assumption and PhP 2.7 billion under the low GDP growth rate assumption (Table 29).
40
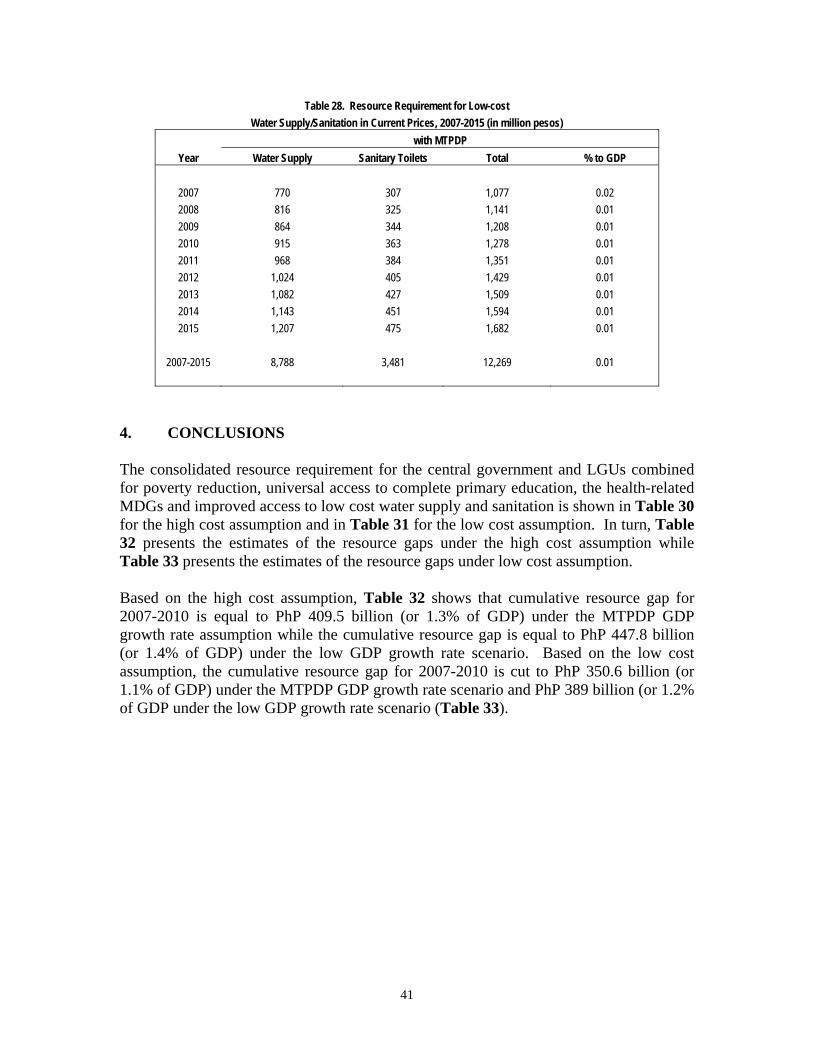
Table 28. Resource Requirement for Low-cost Water Supply/Sanitation in Current Prices, 2007-2015 (in million pesos)
with MTPDP Year Water Supply Sanitary Toilets Total % to GDP
2007 770 307 1,077 0.02 2008 816 325 1,141 0.01 2009 864 344 1,208 0.01 2010 915 363 1,278 0.01 2011 968 384 1,351 0.01 2012 1,024 405 1,429 0.01 2013 1,082 427 1,509 0.01 2014 1,143 451 1,594 0.01 2015 1,207 475 1,682 0.01
2007-2015 8,788 3,481 12,269 0.01
4. CONCLUSIONS
The consolidated resource requirement for the central government and LGUs combined for poverty reduction, universal access to complete primary education, the health-related MDGs and improved access to low cost water supply and sanitation is shown in Table 30 for the high cost assumption and in Table 31 for the low cost assumption. In turn, Table 32 presents the estimates of the resource gaps under the high cost assumption while Table 33 presents the estimates of the resource gaps under low cost assumption. Based on the high cost assumption, Table 32 shows that cumulative resource gap for 2007-2010 is equal to PhP 409.5 billion (or 1.3% of GDP) under the MTPDP GDP growth rate assumption while the cumulative resource gap is equal to PhP 447.8 billion (or 1.4% of GDP) under the low GDP growth rate scenario. Based on the low cost assumption, the cumulative resource gap for 2007-2010 is cut to PhP 350.6 billion (or 1.1% of GDP) under the MTPDP GDP growth rate scenario and PhP 389 billion (or 1.2% of GDP under the low GDP growth rate scenario (Table 33).
41
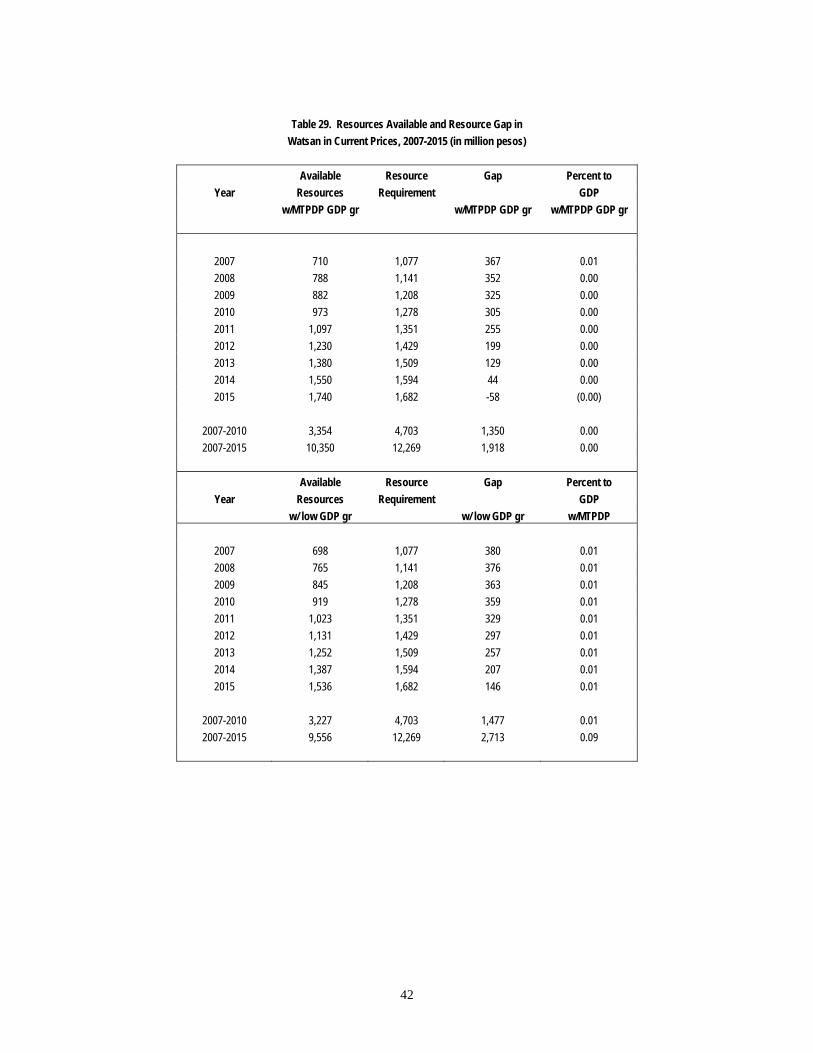
Table 29. Resources Available and Resource Gap in
Watsan in Current Prices, 2007-2015 (in million pesos)
Available Resource Gap Percent to Year Resources Requirement GDP
w/MTPDP GDP gr w/MTPDP GDP gr w/MTPDP GDP gr
2007 710 1,077 367 0.01 2008 788 1,141 352 0.00 2009 882 1,208 325 0.00 2010 973 1,278 305 0.00 2011 1,097 1,351 255 0.00 2012 1,230 1,429 199 0.00 2013 1,380 1,509 129 0.00 2014 1,550 1,594 44 0.00 2015 1,740 1,682 -58 (0.00)
2007-2010 3,354 4,703 1,350 0.00 2007-2015 10,350 12,269 1,918 0.00
Available Resource Gap Percent to
Year Resources Requirement GDP w/ low GDP gr w/ low GDP gr w/MTPDP
2007 698 1,077 380 0.01 2008 765 1,141 376 0.01 2009 845 1,208 363 0.01 2010 919 1,278 359 0.01 2011 1,023 1,351 329 0.01 2012 1,131 1,429 297 0.01 2013 1,252 1,509 257 0.01 2014 1,387 1,594 207 0.01 2015 1,536 1,682 146 0.01
2007-2010 3,227 4,703 1,477 0.01 2007-2015 9,556 12,269 2,713 0.09
42
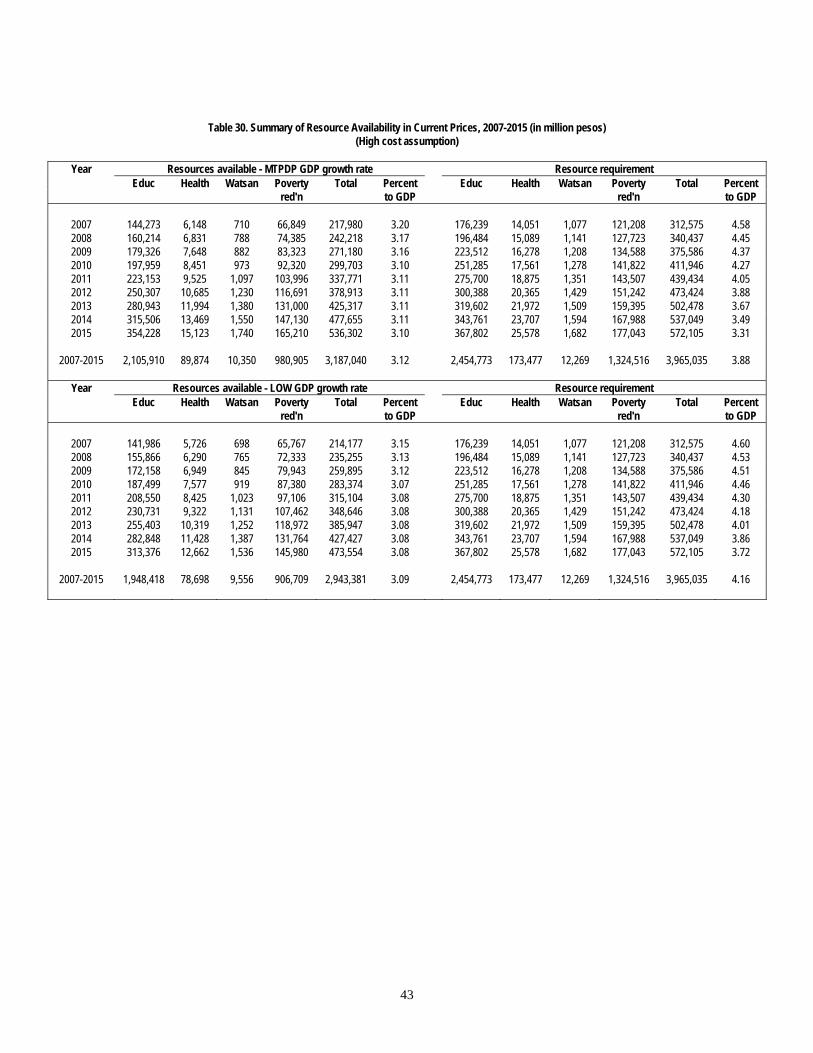
Table 30. Summary of Resource Availability in Current Prices, 2007-2015 (in million pesos) (High cost assumption)
Year Resources available - MTPDP GDP growth rate Resource requirement
Educ Health Watsan Poverty Total Percent Educ Health Watsan Poverty Total Percent red'n to GDP red'n to GDP
2007 144,273 6,148 710 66,849 217,980 3.20 176,239 14,051 1,077 121,208 312,575 4.58 2008 160,214 6,831 788 74,385 242,218 3.17 196,484 15,089 1,141 127,723 340,437 4.45 2009 179,326 7,648 882 83,323 271,180 3.16 223,512 16,278 1,208 134,588 375,586 4.37 2010 197,959 8,451 973 92,320 299,703 3.10 251,285 17,561 1,278 141,822 411,946 4.27 2011 223,153 9,525 1,097 103,996 337,771 3.11 275,700 18,875 1,351 143,507 439,434 4.05 2012 250,307 10,685 1,230 116,691 378,913 3.11 300,388 20,365 1,429 151,242 473,424 3.88 2013 280,943 11,994 1,380 131,000 425,317 3.11 319,602 21,972 1,509 159,395 502,478 3.67 2014 315,506 13,469 1,550 147,130 477,655 3.11 343,761 23,707 1,594 167,988 537,049 3.49 2015 354,228 15,123 1,740 165,210 536,302 3.10 367,802 25,578 1,682 177,043 572,105 3.31
2007-2015 2,105,910 89,874 10,350 980,905 3,187,040 3.12 2,454,773 173,477 12,269 1,324,516 3,965,035 3.88
Year Resources available - LOW GDP growth rate Resource requirement
Educ Health Watsan Poverty Total Percent Educ Health Watsan Poverty Total Percent red'n to GDP red'n to GDP
2007 141,986 5,726 698 65,767 214,177 3.15 176,239 14,051 1,077 121,208 312,575 4.60 2008 155,866 6,290 765 72,333 235,255 3.13 196,484 15,089 1,141 127,723 340,437 4.53 2009 172,158 6,949 845 79,943 259,895 3.12 223,512 16,278 1,208 134,588 375,586 4.51 2010 187,499 7,577 919 87,380 283,374 3.07 251,285 17,561 1,278 141,822 411,946 4.46 2011 208,550 8,425 1,023 97,106 315,104 3.08 275,700 18,875 1,351 143,507 439,434 4.30 2012 230,731 9,322 1,131 107,462 348,646 3.08 300,388 20,365 1,429 151,242 473,424 4.18 2013 255,403 10,319 1,252 118,972 385,947 3.08 319,602 21,972 1,509 159,395 502,478 4.01 2014 282,848 11,428 1,387 131,764 427,427 3.08 343,761 23,707 1,594 167,988 537,049 3.86 2015 313,376 12,662 1,536 145,980 473,554 3.08 367,802 25,578 1,682 177,043 572,105 3.72
2007-2015 1,948,418 78,698 9,556 906,709 2,943,381 3.09 2,454,773 173,477 12,269 1,324,516 3,965,035 4.16
43
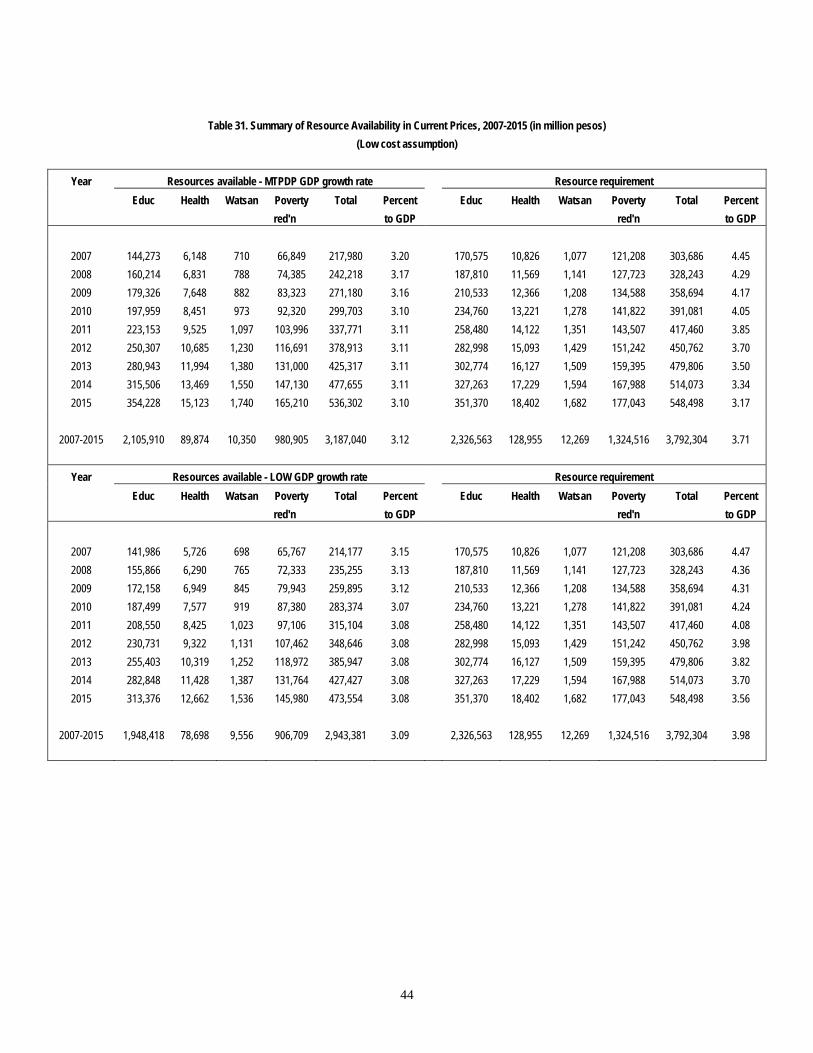
Table 31. Summary of Resource Availability in Current Prices, 2007-2015 (in million pesos)
(Low cost assumption)
Year Resources available - MTPDP GDP growth rate Resource requirement Educ Health Watsan Poverty Total Percent Educ Health Watsan Poverty Total Percent red'n to GDP red'n to GDP
2007 144,273 6,148 710 66,849 217,980 3.20 170,575 10,826 1,077 121,208 303,686 4.45 2008 160,214 6,831 788 74,385 242,218 3.17 187,810 11,569 1,141 127,723 328,243 4.29 2009 179,326 7,648 882 83,323 271,180 3.16 210,533 12,366 1,208 134,588 358,694 4.17 2010 197,959 8,451 973 92,320 299,703 3.10 234,760 13,221 1,278 141,822 391,081 4.05 2011 223,153 9,525 1,097 103,996 337,771 3.11 258,480 14,122 1,351 143,507 417,460 3.85 2012 250,307 10,685 1,230 116,691 378,913 3.11 282,998 15,093 1,429 151,242 450,762 3.70 2013 280,943 11,994 1,380 131,000 425,317 3.11 302,774 16,127 1,509 159,395 479,806 3.50 2014 315,506 13,469 1,550 147,130 477,655 3.11 327,263 17,229 1,594 167,988 514,073 3.34 2015 354,228 15,123 1,740 165,210 536,302 3.10 351,370 18,402 1,682 177,043 548,498 3.17
2007-2015 2,105,910 89,874 10,350 980,905 3,187,040 3.12 2,326,563 128,955 12,269 1,324,516 3,792,304 3.71
Year Resources available - LOW GDP growth rate Resource requirement
Educ Health Watsan Poverty Total Percent Educ Health Watsan Poverty Total Percent red'n to GDP red'n to GDP
2007 141,986 5,726 698 65,767 214,177 3.15 170,575 10,826 1,077 121,208 303,686 4.47 2008 155,866 6,290 765 72,333 235,255 3.13 187,810 11,569 1,141 127,723 328,243 4.36 2009 172,158 6,949 845 79,943 259,895 3.12 210,533 12,366 1,208 134,588 358,694 4.31 2010 187,499 7,577 919 87,380 283,374 3.07 234,760 13,221 1,278 141,822 391,081 4.24 2011 208,550 8,425 1,023 97,106 315,104 3.08 258,480 14,122 1,351 143,507 417,460 4.08 2012 230,731 9,322 1,131 107,462 348,646 3.08 282,998 15,093 1,429 151,242 450,762 3.98 2013 255,403 10,319 1,252 118,972 385,947 3.08 302,774 16,127 1,509 159,395 479,806 3.82 2014 282,848 11,428 1,387 131,764 427,427 3.08 327,263 17,229 1,594 167,988 514,073 3.70 2015 313,376 12,662 1,536 145,980 473,554 3.08 351,370 18,402 1,682 177,043 548,498 3.56
2007-2015 1,948,418 78,698 9,556 906,709 2,943,381 3.09 2,326,563 128,955 12,269 1,324,516 3,792,304 3.98
44
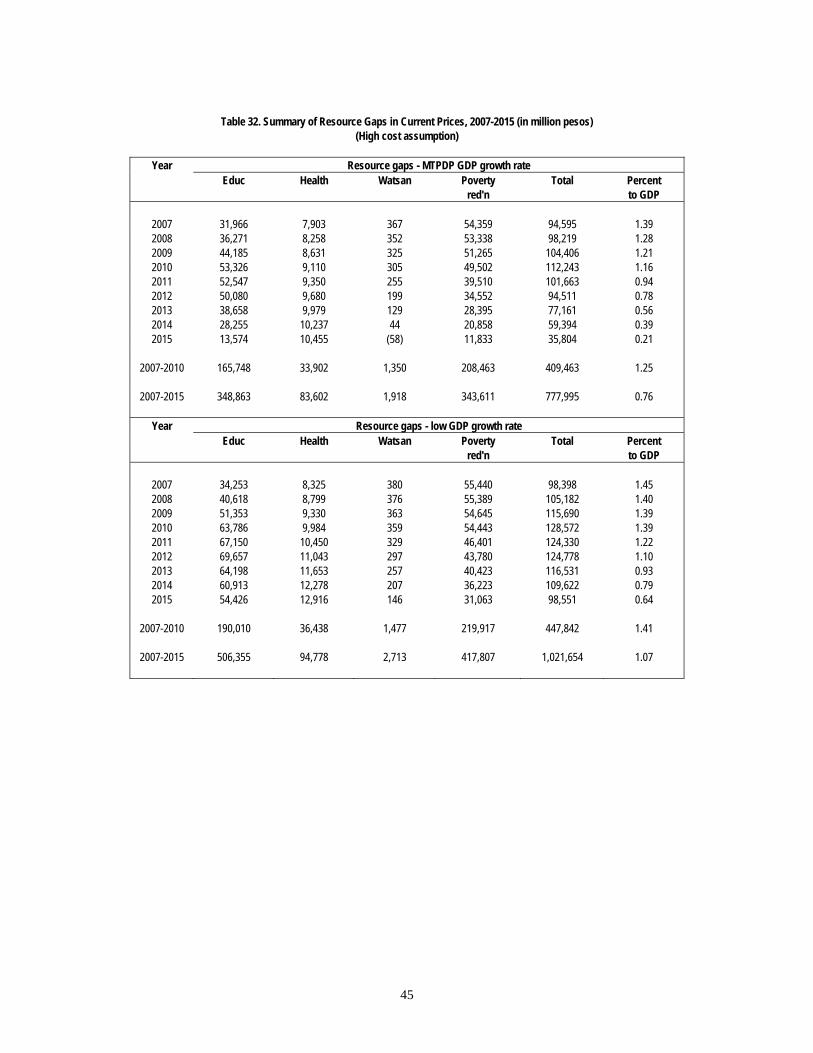
Table 32. Summary of Resource Gaps in Current Prices, 2007-2015 (in million pesos)
(High cost assumption)
Year Resource gaps - MTPDP GDP growth rate Educ Health Watsan Poverty Total Percent red'n to GDP
2007 31,966 7,903 367 54,359 94,595 1.39 2008 36,271 8,258 352 53,338 98,219 1.28 2009 44,185 8,631 325 51,265 104,406 1.21 2010 53,326 9,110 305 49,502 112,243 1.16 2011 52,547 9,350 255 39,510 101,663 0.94 2012 50,080 9,680 199 34,552 94,511 0.78 2013 38,658 9,979 129 28,395 77,161 0.56 2014 28,255 10,237 44 20,858 59,394 0.39 2015 13,574 10,455 (58) 11,833 35,804 0.21
2007-2010 165,748 33,902 1,350 208,463 409,463 1.25
2007-2015 348,863 83,602 1,918 343,611 777,995 0.76
Year Resource gaps - low GDP growth rate
Educ Health Watsan Poverty Total Percent red'n to GDP
2007 34,253 8,325 380 55,440 98,398 1.45 2008 40,618 8,799 376 55,389 105,182 1.40 2009 51,353 9,330 363 54,645 115,690 1.39 2010 63,786 9,984 359 54,443 128,572 1.39 2011 67,150 10,450 329 46,401 124,330 1.22 2012 69,657 11,043 297 43,780 124,778 1.10 2013 64,198 11,653 257 40,423 116,531 0.93 2014 60,913 12,278 207 36,223 109,622 0.79 2015 54,426 12,916 146 31,063 98,551 0.64
2007-2010 190,010 36,438 1,477 219,917 447,842 1.41
2007-2015 506,355 94,778 2,713 417,807 1,021,654 1.07
45
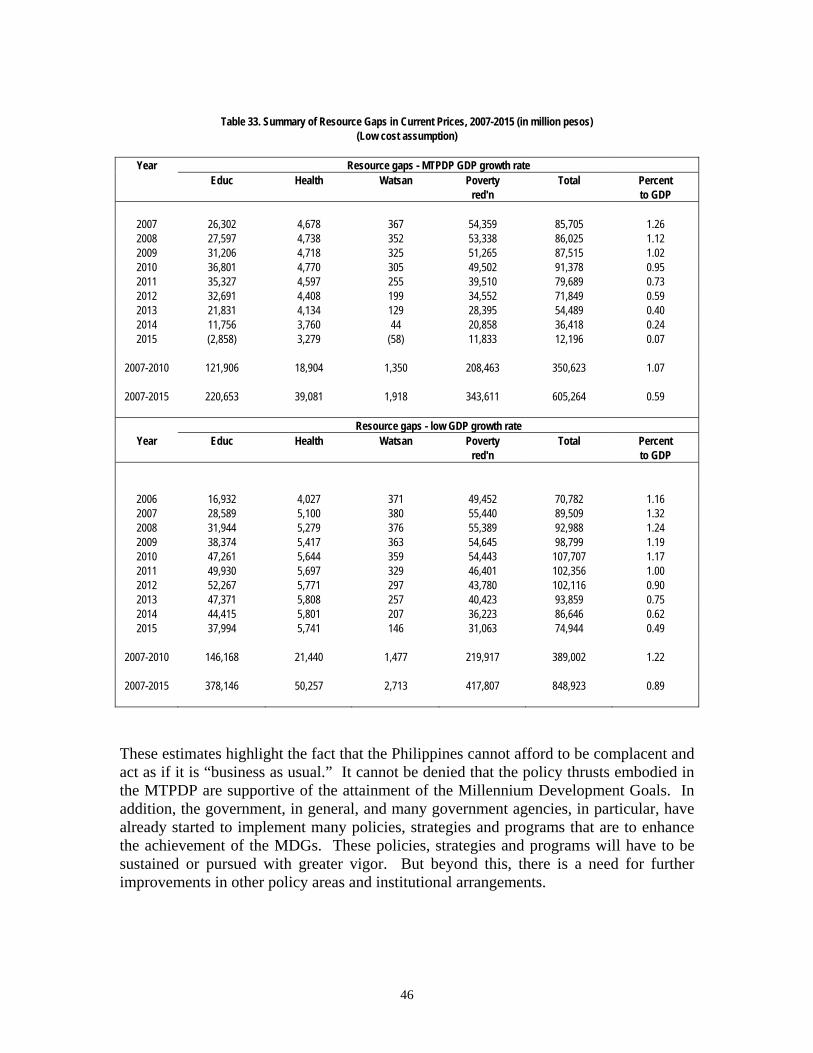
Table 33. Summary of Resource Gaps in Current Prices, 2007-2015 (in million pesos)
(Low cost assumption)
Year Resource gaps - MTPDP GDP growth rate Educ Health Watsan Poverty Total Percent red'n to GDP
2007 26,302 4,678 367 54,359 85,705 1.26 2008 27,597 4,738 352 53,338 86,025 1.12 2009 31,206 4,718 325 51,265 87,515 1.02 2010 36,801 4,770 305 49,502 91,378 0.95 2011 35,327 4,597 255 39,510 79,689 0.73 2012 32,691 4,408 199 34,552 71,849 0.59 2013 21,831 4,134 129 28,395 54,489 0.40 2014 11,756 3,760 44 20,858 36,418 0.24 2015 (2,858) 3,279 (58) 11,833 12,196 0.07
2007-2010 121,906 18,904 1,350 208,463 350,623 1.07
2007-2015 220,653 39,081 1,918 343,611 605,264 0.59
Resource gaps - low GDP growth rate
Year Educ Health Watsan Poverty Total Percent red'n to GDP
2006 16,932 4,027 371 49,452 70,782 1.16 2007 28,589 5,100 380 55,440 89,509 1.32 2008 31,944 5,279 376 55,389 92,988 1.24 2009 38,374 5,417 363 54,645 98,799 1.19 2010 47,261 5,644 359 54,443 107,707 1.17 2011 49,930 5,697 329 46,401 102,356 1.00 2012 52,267 5,771 297 43,780 102,116 0.90 2013 47,371 5,808 257 40,423 93,859 0.75 2014 44,415 5,801 207 36,223 86,646 0.62 2015 37,994 5,741 146 31,063 74,944 0.49
2007-2010 146,168 21,440 1,477 219,917 389,002 1.22
2007-2015 378,146 50,257 2,713 417,807 848,923 0.89 These estimates highlight the fact that the Philippines cannot afford to be complacent and act as if it is “business as usual.” It cannot be denied that the policy thrusts embodied in the MTPDP are supportive of the attainment of the Millennium Development Goals. In addition, the government, in general, and many government agencies, in particular, have already started to implement many policies, strategies and programs that are to enhance the achievement of the MDGs. These policies, strategies and programs will have to be sustained or pursued with greater vigor. But beyond this, there is a need for further improvements in other policy areas and institutional arrangements.
46

Eleven major challenges face the government if it is to finance the resource gaps in basic social services. One, the government has to further improve its tax effort to enable it to increase the allocation for MDG-related programs while at the same time balancing the budget by 2008/9. Three new tax measures were legislated in 2005/6. Prospectively, further improvements in the tax effort will have to come from improved tax administration. In this regard, there is a need to sustain the Bureau of Internal Revenue’s Run After Tax Evaders (RATE), the Bureau of Custom’s Run After the Smugglers (RATS) and the Department of Finance’s Revenue Integrity Protection Service (RIPS). There is also a need to strengthen the systems and procedures in the revenue collection agencies so as to improve their capability to collect taxes more efficiently. Two, given that the internal revenue allotment (which represents the share of LGUs in the central government revenues) accounts for an increasing share of the central government budget, it is critical that LGUs are mobilized as effective partners in meeting the MDGs. However, because of the public good nature of basic social services (i.e., not all of the benefits arising from the provision of basic social services can be internalized by local residents), it might be necessary to design matching grants programs to encourage LGUs to spend more on the provision of said services. Three, although some LGUs may have enough resources to support the attainment of the MDGs, the wide disparity in the distribution of the LGU tax base suggests that there might be a need to explicitly take into account the equalization objective (i.e., equalization relative to LGUs’ capacity to provide minimum service standards) in the distribution formula of the IRA. Four, on-going budget reform initiatives in the public sector should be sustained and supported. These reforms augur well for a more effective allocation of scarce government resources by shifting the focus of the budget process from inputs and rules-based compliance to outputs/ outcomes and results/ performance orientation, and by promoting greater flexibility, transparency, and accountability. Two of the more important strands of this reform agenda are the institutionalization of the Organizational Performance Indicator Framework (OPIF) and the Medium Term Expenditure Framework (MTEF). The OPIF is an approach that focuses budget decision making and accountability on three core items: outcomes – what impacts on society the government wishes to achieve; outputs – what goods and services government delivers to attain said outcomes; and performance indicators – how the government and society know whether the desired outcome is being achieved in an efficient and effective manner. As such, the OPIF aims to allocate resources in line with the results that government seeks to achieve. On the other hand, the MTEF is a budget formulation process which provides government decision makers with mechanisms to assist them in allocating public resources to their strategic priorities while ensuring overall fiscal discipline. “The MTEF consists of a top-down resource envelope, a bottom-up estimation of the current and medium-term costs of existing policy and, ultimately, the matching of these costs with
47
available resources. The matching of costs should normally occur in the context of the annual budget process, which should focus on the need for policy change to reflect changing macroeconomic conditions as well as changes in strategic priorities of the government. … The MTEF aims (i) to improve macroeconomic balance by developing a consistent and realistic resource framework (through the development of a macro framework for making projections of revenues and expenditures), (ii) to improve the allocation of resources to strategic priorities between and within sectors (through the formulation of a budget policy statement by the Cabinet), (iii) to increase commitment to predictability of both policy and funding so that departments can plan ahead and programs can be sustained; and (iv) to provide line agencies with a hard budget constraint and increased autonomy, thereby increasing incentives for efficient and effective use of funds” (Schick 1998). Five, all sectors should support budget reform initiatives that favor the basic social services. In the education sector, this involves the sustained reallocation of resources away from tertiary education in favor of basic education. However, this can only be achieved if certain reforms take place in the higher education sub-sector. First, state universities and colleges (SUCs) have to become more efficient operationally. In this regard, the Commission on Higher Education (CHED) piloted the use of a normative financing model in allocating central government subsidy to SUCs in 2005. This model proposes to finance higher education student places based on norms or standards where the standard is based on the pricing of full-time equivalent students differentiated by field of study, level of education and priority factors assigned by CHED (including quality indicators, government priorities for national development and sanctions for duplication of private sector provision). On the other hand, normative allocations for research are based on the potential of the SUC to do research as evidenced by the size of graduate enrollment, the number of advanced degree holders among the faculty, the number of senior research staff and the number of national research centers at the SUC while normative financing of extension services is based on graduate enrollment in selected fields, the number of senior extension services staff, graduate degree holders and number of training centers at the SUC. The plan of CHED and DBM to phase in the full application of this model to SUCs MOOE by 2008 should be supported. Second, cost recovery in SUCs is low. The fees charged by SUCs continue to be minimal. For instance, the average tuition and other fees charged by SUCs in 2003 is just about a third of the average school fees in private institutions. Clearly, increasing tuition fees in the SUCs would not only reduce their continued dependence on national government budgets, but it would also impose the discipline of the market place on their operations. In this regard, it is notable that the share of tuition and other school fees expanded markedly between 2002 and 2003 with the reduction of NG subsidy during those years. This movement is consistent with the recommendations in both the Philippine Commission on Education Reforms (PCER) to increase cost recovery in SUCs but much still remains to be done.
48
Third, increased cost recovery in SUCs through tuition fee increases should be implemented hand in hand with a higher budget for targeted scholarship program in higher education if equity and efficiency goals are to be addressed simultaneously. However, the coverage of scholarship and financial aid programs to college level students continues to be low despite some increments in more recent years. Also, the program is not well targeted on the poor. Prospectively, the coverage of these programs should be broadened some more and their administration streamlined. In the health subsector, intra-sectoral budget re-allocation involves the increasing allocations for public health by freeing up of resources from retained hospitals by encouraging increased cost recovery while ensuring that the poor are protected with the allocation of sufficient amounts for the central government subsidy for the premiums of indigents in social health insurance program. This initiative has already been adopted by the DOH with the issuance of Administrative Order No. 2006-0023 dated 30 June 2006. Moreover, the DOH has already started to rationalize the allocations for retained hospitals in the 2007 budget. The challenge is to make this reform stick and to explore the possibility of further extending it. Six, cost savings can be realized by using more cost-efficient modes of service delivery and by targeting some of the MDG services to the poor. In the education sector, this may involve improvements in teacher deployment and the pursuit of alternative arrangements for the construction of school buildings, (e.g., Principal-led construction, NGO-led construction, or LGU-implemented construction). While the Magna Carta for Public School Teachers does not necessarily prohibit teacher redeployment, its amendment will facilitate the movement of teachers across divisions and schools. In the health sector, the pursuit of greater cost efficiency involves reducing the wastage allowances for the delivery of the immunization program. It also involves better targeting of micronutrient supplementation and the provision of contraceptive supplies. In consonance with this, the DOH has also issued Administrative Order No. 2006-002 dated 12 July 2006 which calls for allocation of critical commodities on the basis of performance-based criteria and more effective targeting to specific population groups.
Seven, the government should continue to exert maximum effort to ensure that resources are used efficiently. Initiatives to improve governance through procurement system reform have already been launched and should be sustained. Eight, there is a need to exert greater effort in mobilizing resources for basic education from local government units. In this regard, it is imperative that LGUs are capacitated to collect the real property tax more efficiently so that more resources will flow into the Special Education Fund. It is also important that SEF resources are allocated towards the strategic needs of the basic education sector and that they are utilized more efficiently. Nine, there is a need to exert greater effort in mobilizing resources from the private sector. The DepEd has already made some headway in this regard. It has established partnership arrangements with the business sector and communities through its Brigada
49
Eskwela and its Adopt-a-School Program, among others. However, given the enormity of the financial challenge of meeting the education demands in the next decade, more such programs need to be established. Ten, the government should promote a policy environment that is not only conducive to sustained growth but also allows the poor to participate in and benefit from such growth. Studies have shown that the quality of growth is important if poverty is to be reduced at an accelerated pace (Balisacan and Pernia 2001). It is not enough that more resources are put in building up the country’s infrastructure stock, it is just important that new investments address the need of lagging regions (Edillon 2006).
Eleven, it is imperative that the government pursues a stronger population management program. The estimates of the resource needs and resource gaps for MDGs presented in this paper assumes that population will continue to grow by 2.3% yearly. With a smaller population, the financial cost of meeting the MDGs will be less prohibitive.
50
References Balisacan, Arsenio M. and Ernesto M. Pernia. 2001. Probing Beneath Cross-National
Averages: Poverty, Inequality, and Growth in the Philippines, Asian Development Bank, October.
DOH, 1999. National Objectives for Health. Department of Health, Manila. Edillon, Rosemarie. 2006. “Meeting Goal 1 Are We on the Right Track?” Analysis of
the Millennium Development Goals Progress and Project Methodology Improvements Background, Report submitted to UNDP-NEDA, 18 November.
Fabella, R.V. 1994. “Investment and the allocation of resources under macroeconomic
instability,” in Fabella R.V. and H. Sakai. (eds.) Resource mobilization and resource use in the Philippines. Tokyo: IDE.
Human Capital in the Emerging Economy. 2001. “Challenges in the Labor Market,” A
Congressional Report, House of Congress, Quezon City. Loehr, William and Rosario Manasan 1999. “Fiscal Decentralization and Economic
Efficiency: Measurement and Evaluation,” IMCC-USAID. Maglen, Leo and Rosario G. Manasan. 1999. Education Costs and Financing in the
Philippines, Technical Background Paper No. 2, Asian Development Bank and World Bank.
Manasan, Rosario. 2002. “Philippines Country Study on Meeting the Millennium
Development Goals.” United Nations Development Programme. Orbeta, Aniceto. 2005. “Achievement Tests Scores and School Characteristics: Evidence
from Philippine Public Elementary and Secondary Schools (unpublished) Schick, Allen. 1998. A Contemporary Approach to Public Expenditure Management.
Washington D.C.: World Bank Institute World Bank. 2000. “Philippines Growth with Equity: The Remaining Agenda,” A
World Bank Social and Structural Review, The World Bank. World Bank. 2001. “Filipino Report card on Pro-poor Services”, The World Bank, May
30.
51


