Embed Size (px)
Citation preview

Capital Structure, Environmental Dynamism, Innovation Strategy, and Strategic Risk Management
Torben J. Andersen SMG WP 2/2005
September 2005

Center for Strategic Management and Globalization Copenhagen Business School Porcelænshaven 24 2000 Frederiksberg Denmark www.cbs.dk/smg
Capital Structure, Environmental Dynamism, Innovation Strategy, and
Strategic Risk Management
Torben Juul Andersen Copenhagen Business School
Center for Strategic Management & Globalization Porcelænshaven 24, 2.53
2000 Frederiksberg Denmark
Phone: +45 3815-2514 Email: [email protected]
September 2005
Keywords: Financial leverage, Derivatives, Real options
Capital Structure, Environmental Dynamism, Innovation Strategy, and Strategic Risk Management
Abstract Previous research found that capital structure affects performance when it is adapted to the level of environmental dynamism and pursuit of an innovation strategy. The current study reproduces some of these relationships in a more recent dataset but also identifies significant nuances across industrial environments. Analyses of a large cross sectional sample and various industry sub-samples suggest that other factors have influenced capital structure effects in recent years including flexibilities in multinational organization and effective strategic risk management capabilities.
1

INTRODUCTION
Recent strategy research on capital structure effects (Simerly and Li, 2000) found empirical
evidence of interactive performance relationships between environmental dynamism and financial
leverage. A subsequent study demonstrated that capital structure has a comparable influence on
the performance of innovation strategy (O’Brien; 2003). These findings are highly relevant in the
context of the ‘hypercompetitive’ conditions that seem to permeate contemporary business
environments (D’Avenie, 1994; Thomas, 1996). To pursue these issues further, the current paper
presents the results of a study based on more recent data covering the period 1996-2000 across
firms operating in different industrial environments.
The study replicates some of the effects of dynamism and innovation found in the previous
studies but also identifies differences across sub-samples of specific industry segments where
expected effects are subdued or even show inverse relationships. This has urged the
consideration of other potential influencers on the strategic effects of capital structure deriving
from the firm’s ability to respond to changes in environmental conditions. Given the considerable
emphasis on potential advantages from flexibilities embedded in multinational organizations
(Kogut and Kulatilaka, 1994) and risk management capabilities (Miller, 1998), this research
considered potential confounding effects from these factors in addition to dynamism and
innovation on the relationship between capital structure and performance.
The paper is structured as follows. First, there is a brief overview of the basic finance and
strategic management literatures on the choice of capital structure. Then aspects of agency
theory, transaction cost economics, the resource-based view, and real options theory are
incorporated in the development of hypotheses. Following this, the paper describes an empirical
study performed to test the hypotheses and the results of the study are presented. Finally, the
paper offers a discussion of the findings and provides tentative conclusions.
2

LITERATURE AND THEORY
The seminal study by Modigliani and Miller (1958) argued that the value of the firm is
independent of capital structure under certain conditions. One important condition was perfect
capital markets, i.e., no taxes, no transaction costs, and no bankruptcy costs. Another condition
was information symmetry, i.e., investors and managers have equal information about the firm’s
investment potential. In a subsequent paper Modigliani and Miller (1963) eased the conditions
and showed that under a capital market imperfection where interest expenses are tax deductable,
firm value will increase with higher financial leverage. In this situation, the optimal capital
structure will be determined by a trade-off between increased bankruptcy risk from a higher debt
load and the tax advantage associated with debt.
Myers and Majluf (1984) analyzed the effects of asymmetric information where internal
managers know more about the firm’s prospective investments than investors in the market. In
this situation, the capital structure may be determined in accordance with a ‘pecking order’
approach whereby firms prefer internal sources to fund good projects and only assume debt when
there is a need for additional funds to finance less attractive projects. The two perspectives on
optimal capital structure reach different conclusions. The ‘trade-off’ perspective argues for a
proportional relationship between economic performance and leverage due to the tax advantage
of debt. In contrast, the ‘pecking order’ perspective, if anything, is more likely to cause an
inverse relationship between performance and leverage as internal funds are reserved for projects
with the highest return potentials.
The agency costs associated with equity financing relate to management’s potential divergence of
productive resources toward employment benefits with no or limited returns to the shareholders
(Jensen and Meckling, 1976). This discrepancy between management and shareholder interests
3
may have implications for the firm’s investment decisions. Management could obtain financing
through issuance of new equity to gain flexibility in pursuit of their own objectives and engage in
questionable investments some of which might represent negative net present values (Jensen,
1986; Stulz, 1990), that is, it could lead to an ‘over investment’ problem. Assuming more debt
might arguably solve this problem. On the other hand, excessive financial leverage can create an
‘under investment’ problem as high debt service commitments limit the discretion to engage in
new business propositions and thereby discourage investment in positive NPV projects (Myers,
1977).
In an analysis of capital structure decisions, Ward (1993) draws a distinction between business
risk and financial risk. Business risk is associated with managing the uncertainty of the firm’s
business environment whereas financial risk relates to the trade-offs between providers of funds
(lenders, investors, and shareholders) and the users of funds (firm management). Here, debt is
considered riskier to firm management because the regular repayment claims can be enforced.
Conversely, equity is considered riskier to the investing shareholders because it constitutes
residual claims that serve as a buffer to ensure the servicing of senior debt obligations in case of
bankruptcy. Hence, from the perspective of firm management, the lower financial risk associated
with equity should be a better way to fund ventures with high business risk because the
underlying financial buffer to cope with uncertainties in the business environment is larger.
Conversely, the higher financial risk associated with debt instruments would be better suited to
fund more stable business activities where the need for a financial buffer is considerably lower.
This analysis would argue for an inverse relationship between business risk and financial
leverage, a phenomenon that has been confirmed in some empirical studies using different
conceptualizations of business risk, such as, variance in sales growth (Thies and Klock, 1992) and
volatility of demand (Chung, 1993).
4

The choice of the firm’s capital structure is generally considered a central strategic issue and
Balakrishnan and Fox (1993) argue that strategic management can improve our understanding of
the capital structure decisions. In this spirit, the following sections provide a brief overview of
strategy analyses aimed at developing these insights.
Environmental dynamism
Simerly and Li (2000) integrate agency theory, transaction cost economics, and the resource-
based view in strategic management to explain the environmental contingencies of capital
structure and provide a comprehensive overview of the related literatures. From a resource-based
view, sustainable competitive advantage reflected in excess rents or Shumpeterian returns can be
achieved through deployment of valuable, rare, unsubstitutable, inimitable, firm specific assets
(Barney, 1991). This implies that firms operating in environments characterized by dynamic
competition must engage in innovative ventures and consider more risky actions to create
superior performance. This in turn will impose a higher level of business risk on organizational
activities, which argues for lower financial leverage.
From the perspective of transaction cost economics, transaction costs are lower when they are
carried out on the basis of standardized assets with low specificity whereas transaction costs are
higher in the case of firm specific assets. Therefore, the higher the asset specificity, the more
economical internal hierarchical coordination should be compared to market clearance of
transactions. A higher equity base supports internal hierarchical control whereas a higher debt
load imposes more market discipline on organizational activities. That is, equity should be the
preferred source of financing when asset specificity is high (Harris, 1994). Since dynamic
environments arguably are associated with deployment of assets with high specificity, equity
funding will tend to lower the firm’s transaction costs in this situation and, therefore, should
constitute a more suitable funding alternative. Conversely, debt should be more appropriate to
5

fund assets with a low degree of specificity as they pertain to relatively stable environmental
conditions.
From the perspective of agency theory, debt can be used as a disciplinary tool to ensure that
managers give preference to wealth creation for the equity holders (Jensen, 1986, 1989). In this
set-up, lenders are the prime governance constituents because debt payment obligations and
restrictive covenants make it more difficult for indebted firms to engage in peripheral and riskier
business ventures. Conversely, it will also reduce the number of strategic options available to the
firm and hence make it more difficult for management to maneuver in a dynamic market
environment. In other words, debt can become too restrictive for firms operating in rapidly
changing industries that require a high degree of strategic responsiveness. Together, these
arguments imply that the appropriate financial strategy for firms operating in dynamic industries
is to reduce leverage to economize on transaction cost and ensure sufficient flexibility to respond
to environmental change and higher levels of business risk.
Innovation strategy
The resource-based view can be extended to argue that contemporary hypercompetitive
environments characterized by ongoing innovation require a strategy driven by idiosyncratic and
firm specific assets and processes (Barney, 1991). A transaction cost perspective further argues
that the higher specificity of assets employed in R&D activities makes equity financing more
economical and constitutes a better market signal (Santorelli, 1991; Banerjee and Wihlborg,
2003). Since information asymmetry between firm managers and external investors is higher in
R&D intensive organizations, the level of financial slack will also tend to increase (Opler and
Titman, 1994; Opler, Pinkowitz, Stulz and Williamson, 1999). Hence, to succeed with an
innovation strategy it is necessary for the firm to maintain a certain level of financial slack to
ensure sufficient and uninterrupted funding sources for R&D investment, new product launches,
6
and ongoing knowledge expansion (O’Brien, 2003). Therefore, a certain level of equity funding
that provides a financial buffer will be critical for firms following an innovation strategy and if
the firms assume too high financial leverage they are expected to perform relatively poorly. The
empirical evidence seems to confirm the existence of an inverse relationship between above
industry average R&D intensity and leverage (Titman and Wessels, 1988; Opler and Titman,
1994; Hovakimian, Opler and Titman, 2001; O’Brien, 2003).
Multinational organization
The wider array of business opportunities across many different national markets should provide
flexibility to firms that maintain a multinational organization and thereby increase the ability to
respond to changing environmental conditions. It has specifically been argued that operational
flexibilities can allow the corporation to restructure in response to changes in international price
relations by shifting activities between national entities controlled by the multinational enterprise
(Kogut, 1985; Rangan, 1998). The ability to switch business activities across international assets
can be conceived as a particular real option structure where the value of the implied flexibility
can be determined on the basis of option pricing theory (Kogut and Kulatilaka, 1994). The
flexibility of a multinational organization should allow the corporation to mitigate effects of
major economic exposures, e.g., associated with changes in relative demand conditions and factor
costs across national environments (Allen and Pantzalis, 1996; Kogut and Chang, 1996).
Furthermore, a multinational organization may also provide opportunities to exchange diverse
knowledge between national environments where different insights and perspectives enhance the
ability to innovate and develop new growth options (Kogut and Zander, 1992, 1993; Grant,
1996). So, multinationality might be linked to the innovative capacity of multinational diversity
that forms the basis for strategic opportunities that can increase maneuverability in an uncertain
global environment (e.g., Mang, 1998; Foss and Pedersen, 2002; Desouza and Evaristo, 2003).
7

This particular view of multinationality has some resemblance to innovation strategy as the firm
expends resources towards the creation of a more innovative multinational organization. In either
case, the multinational organization should increase flexibility and strategic responsiveness and
thereby improve economic performance.
Risk management
Strategic risk management practices have evolved in conjunction with the rapid growth of
derivative instruments traded in financial markets (Rawls and Smithson, 1990) and new product
enhancements bridging the conventional insurance and capital markets (Shimpi, 1999)1. These
instruments cover a wide array of financial markets that allow users to hedge against fluctuations
in foreign exchange rates, interest rates, commodity prices, credit exposures, commercial risk, etc.
At the same time new types of performance related insurance contracts and contingent capital
instruments have emerged that serve to reduce the expected cost of financial distress beyond the
cushion provided by the firm’s equity position (e.g., Colarossi, 2001). Many of the new risk
management techniques have been developed within the financial industry, which by definition is
engaged in the risk management business (e.g., Saunders, 2003).
Effective risk management practices should reduce the volatility of the firm’s earnings and
thereby reduce the costs associated with potential financial distress. Another effect of improved
risk management capabilities would be to reduce ‘under investment’ in the firm caused by debt
overhang because better risk management will reduce the need for a financial buffer. If the
volatility of the firm’s cash flows is reduced and the firm maintains a certain financial cushion in
the form liquid financial assets and committed credit facilities then funding should always be
available for positive NPV projects, all the while the lower performance volatility will reduce the
1 According to data assembled by the Bank for International Settlement (BIS), the use of derivative instruments has been growing exponentially over the past decade.
8

firm’s average cost of funding. To the extent an organization is able to manage the uncertainties
imposed by dynamic environmental conditions that expose business activities and reduce
variability in firm earnings, the ‘under investment’ problem could be reduced, which provides a
basic argument for financial hedging (Froot, Scharfstein and Stein, 1993, 1994).
By introducing an ‘insurative model’ that incorporates both insurance contracts and equity
funding as residual claims on the firm, Shimpi (1999) shows that capital management and risk
management are two sides of the same coin. A firm needs equity capital to fund its operations
and establish a certain financial cushion against adverse economic performance, and thereby
assure different stakeholders about the stability, strength, and soundness of the firm as a going
concern. Insurance contracts and financial derivatives serve the same purpose by transferring risk
exposures that are beyond the discretionary control of firm management. Hence, insurance
contracts and alternative risk-transfer instruments constitute important sources of financial capital
for the firm (Culp, 2002).
Miller (1998) argues that a general strategic management perspective requires that all risk factors
exposing the firm be considered, such as, competition, sourcing, customers, demand conditions,
etc. In other words, the risk management perspective should be extended well beyond a focus on
foreign exchange and other price risks in the financial markets. Furthermore, it can be important
to improve risk management capabilities relating to firm specific strategic exposures because
many stakeholders are unable to diversify investments that are geared specifically to cater to the
firm, e.g., buyer and supplier relationships, business partnerships, management and employment
contracts, etc. (Miller, 1998). Since competitive exposures often require strategic responses that
are unique to the firm there is a limit to how far traded financial derivatives can accomplish this
task. Financial derivatives exist for many fairly standardized and hence tradable asset classes, but
do not extend to firm specific competitive factors including environmental contingencies in
9

technology, sourcing, distribution, etc. To deal with these risk factors, a firm may try to invest in
the creation of real options that can enhance the firm’s ability to respond to competitive risk
exposures. Hence, strategic risk management can be extended to include a real options
perspective where firms are able to develop opportunities and claims on the future that can be
evaluated based of assumptions about the underlying risk factors (Leiblein, 2003). The real
options differ from financial options in the way the option value is tied to idiosyncratic conditions
in the firm (McGrath, 1997) as well as firm specific strategy processes may differ in unique ways
that influence the firm’s ability to exploit the options. Hence, the presence of real options can
enhance sustainable value creation since they are based on firm specific assets and processes not
readily available in the market (Barney, 1991).
HYPOTHESES
Environmental dynamism imposes higher business risk on organizational activities and therefore
firm management will impose a higher equity ratio to create a financial buffer of sufficient size to
absorb the associated performance volatility (Ward, 1993). Furthermore, firms need a stronger
equity position to deal with the higher specificity of firm assets required to create excess rents in
dynamic environments (Harris, 1994; Simerly and Li, 2000), all the while excessive leverage can
cause ‘under investment’ problems (Myers, 1977). These arguments lead to the following
hypothesis.
HYPOTHESIS 1: Firms operating in dynamic environments (a) have lower financial leverage and (b) if they assume a high level of financial leverage it is associated with lower economic performance Firms pursuing an innovation strategy require a certain level of equity that provide a financial
buffer to ensure stability and availability of funds for research efforts, new product launches, and
on-going development of knowledge based capabilities (O’Brien, 2003). Innovation is associated
with the creation of new growth options for the firm including potential process improvements
10
and product introductions (Myers, 1984). The implied real options give the firm flexibilities that
can be exploited through a wider choice of alternative actions and better timing of responsive
strategic moves to the firm’s economic advantage. This argues for the following hypothesis.
HYPOTHESIS 2: Firms pursuing an innovation strategy are (a) associated with higher economic performance and (b) lower financial leverage, and (c) if they assume a high level of financial leverage it is associated with lower economic performance The multinational organization can create flexibilities, e.g., in the form of switching options that
enable the firm to respond to and manage risks associated with changes in international demand
and price relations (Kogut and Kulatilaka, 1994). Within a flexible multinational structure the
enhanced risk management capabilities should reduce the need for an equity funded financial
buffer. On the other hand, building a multinational organization across diverse national settings
can often be costly (Christophe, 1996) and associated with incremental business risk (Reeb,
Kwok and Baek, 1998), which argues for equity financing. Multinationality can also be
conceived as a form of innovation strategy where international diversity is used to create new
growth options that extend the strategic opportunities available in different national markets
(Grant, 1996; Foss and Pedersen, 2002). In this case, the associated strategic opportunities can be
exploited to the firm’s economic advantage but development of innovative growth options
requires a certain level of organizational slack as does the ability to exercise them when
conditions are favorable. This reasoning leads to the following hypothesis.
HYPOTHESIS 3: Firms with a multinational organization are (a) associated with higher economic performance and (b) lower financial leverage, and (c) if they assume a high level of financial leverage it is associated with lower economic performance
A firm displaying effective risk management capabilities has lower cash flow volatility, which
should reduce potential ‘under investment’ problems (Froot, Scharfstein and Stein, 1993, 1994)
and hence improve the firm’s economic performance. Effective risk management capabilities
11
reduce the need for an equity-based financial buffer and therefore should increase the debt
capacity of the firm because the cash flow volatility associated with a given business environment
is reduced (Ward, 1993). To the extent that real options constitute an element of the firm’s risk
management processes, there might be a need to maintain some financial slack to ensure that
option structures continue to be developed and that funding is available for underlying projects if
and when the real options are exercised. However, risk management capabilities may also derive
from use of traded financial derivatives, insurance contracts, and contingent capital arrangements
as well as more process related flexibilities as opposed to relatively asset intensive real option
structures. In this case, the need for a financial buffer is reduced and effective risk management
should result in higher financial leverage. If financial derivatives and other traded risk-transfer
instruments are correctly priced they should not generate excess returns to firms that acquire them
for hedging purposes. In contrast, real options have the potential to shield against downside risk
and exploit upside potential and thereby generate excess returns. However, there is a need to
maintain a certain level of financial slack to exploit the potential economic advantages associated
with real options (Miller, 1998; Leiblein, 2003) and ensure that the underlying business
opportunities can be realized. These arguments lead to the following hypothesis.
HYPOTHESIS 4: Firms with effective risk management capabilities are (a) associated with higher economic performance and (b) higher financial leverage, but (c) if they assume a high level of financial leverage it is associated with lower economic performance The subsequent section describes an empirical study devised to test the hypotheses.
METHODS
Sources
The empirical study is based on a sample consisting of large US firms operating across industries
identified by their four-digit SIC-codes. The sample includes the Fortune 500 companies, the
Stern-Stewart Performance Top 1000 companies, and the 1000 largest companies in Compustat
12
selected on the basis of their market capitalization reported as of May 2001. These three sources
produced a total sample of 1357 companies with financial information available from Compustat.
Data on overseas establishments was obtained from America’s Corporate Families and
International Affiliates (Dun & Bradstreet), Vol. III, 2001.
Variables
Organizational performance
Performance was measured by two financial ratios, return on assets and return on investment.
Return on assets (ROA) was calculated as income before extraordinary items divided by total
assets (including current assets, net property, plant and equipment, and other non-current assets).
Return on investment (ROI) was calculated as income before extraordinary items divided by total
invested capital (including total long term debt, preferred stock, minority interest, and total
common equity). The financial ratios were averaged over the 5-year period 1996-2000 to assess
longer-term relations as opposed to short-term effects and avoid influences by potential spurious
events. This approach is consistent with Simerli and Li (2000) and updates their study, which
used data for the period 1989-1993. The analysis defined performance as reported economic
results as opposed to indicative markets returns, e.g., reflected in market to book value. Market
returns are influenced by investor behaviors and therefore could lead to skewed performance
indicators in the inflated market of the late 1990s (Schleifer, 2000).
Financial leverage
The firm’s financial leverage was measured as the ratio of debt to equity calculated as all fixed
charge debt obligations and preferred stock divided by common equity. The debt to equity ratio
was averaged over the 5-year period 1996-2000 to control for spurious effects (Simerly and Li,
2000). The study assessed leverage based on realized economic performance rather than the
13

market value of equity, which is influenced by investor expectations about the firm’s future
financial performance and general market prospects.
Environmental dynamism
Environmental dynamism was measured by an instability index calculated as the standard error of
the regression coefficient in the regression of total industry sales over the 5-year period 1996-
2000 against a time variable divided by the average value of industry sales to reach a standardized
indicator of dynamism (Dess and Beard, 1984; Keats and Hitt, 1988; Simerly and Li, 2000). To
get more consistent measures of environmental dynamism, the instability indexes were calculated
on the basis of aggregate industry data identified by the two-digit SIC codes from the complete
Compustat database and were not limited to the sampled firms.
Innovation strategy
Innovation was measured by R&D intensity calculated as all costs incurred by the firm to develop
new products and services divided by total sales. The firm’s R&D intensity was then compared
to its industry peers to capture a distinct strategy dimension indicating the importance the firm
assigns to innovation (O’Brien, 2003). Hence, we calculated the R&D intensity for each firm in
the sample, averaged the ratio over the 5-year period 1996-2000, and standardized the firm
measures within the industries identified by their two-digit SIC codes. This procedure captured
the relative emphasis the firms put on innovation as a strategic approach compared to peers within
their own industries.
Multinational organization
Multinationality was measured on the basis of the number of foreign subsidiaries and the number
of foreign countries in which the firm’s subsidiaries are situated (Kogut and Singh, 1988; Reuer
and Leiblein, 2000). The measure was calculated as the natural logarithm of one plus the number
14

of foreign subsidiaries the firm has and the natural logarithm of one plus the number of countries
with subsidiaries. The two numbers were added to indicate diversity in term of national
environments as well as operational knowledge. The natural logarithm was applied to adjust for
skewness and ensure normality.
Risk management
Risk management was conceived as the extent to which the firm was able to cope with
uncertainties in the external environment and stabilize the earnings development. Hence, the
firm’s adherence to risk management was calculated in two ways. First, we calculated the
standard deviation of the firm’s net sales during 1996-2000, which reflects the level of
uncertainty in the firm’s business environment, and divided it by the standard deviation of the
firm’s ROA during the same period. Second, we calculated the standard deviation of net sales
divided by the standard deviation of ROI during the same period. The ratios provide direct
indications of the firm’s ability to adapt to the influence of environmental risk factors and manage
the associated exposures so as to reduce variability in economic performance.
Analyses
The hypotheses were tested in multiple regression analyses. One set of regressions used the
economic performance measures, i.e., 5-year average ROA and 5-year average ROI, as dependent
variables and measures of environmental dynamism, innovation strategy, multinational
organization, risk management, and their interaction terms with financial leverage as independent
variables. Another set of regressions used financial leverage as dependent variable and
dynamism, innovation, multinationality, and risk management as independent variables. This
approach is comparable to previous strategic capital structure studies (Simerly and Li, 2000;
O’Brien, 2003).
15

The relative R&D intensity was used as a measure of the extent to which the firms pursue an
innovation strategy (O’Brien, 2003), which can be looked upon as the firm’s ability to create
future growth options (Myers, 1977). As discussed, the same real options perspective can be
adopted to the multinational organization (Grant, 1996) and strategic risk management (Miller,
1998). To assess this, two indicators were developed as the natural logarithm of one plus the
number of announced product introductions made by the firms during the 5-year period and the
number of patents registered by the firms at the US Patent Office, which have been used to
measure real options (McGrath and Nerkar, 2004). The correlation coefficient between the
innovation and multinationality measures and the two options indicators calculated on the total
sample were statistically significant and ranged between 0.35 and 0.45 and hence provided some
credence to the real options perspective applied on these two measures. The risk management
measure did not show high correlations with the real options indicators, which seems to indicate
that the risk management construct captured here reflect use of traded financial derivatives,
alternative risk-transfer instruments, and supportive management processes as much as potential
flexibilities associated with real options.
The regressions considered a number of control variables. The size of the firm reflects past
success and hence may represent resource availability that could affect the choice of capital
structure (Aldrich and Auster, 1986; Aldrich, 2000). Hence, firm size was included in the
regressions (measured as the natural logarithm of total assets to correct for positive skew in the
data). Consistent with Simerli and Li (2000) we included two variables reflecting potential
exposures to agency and transaction cost problems. Firm dummy 1 indicated firms with average
annual returns on capital ranging between –2.5 and +2.5 percent and growth in capital below 25
percent during the 5-year period, with return on capital calculated as operating profit after tax
divided by outstanding capital at the beginning of the year. Firm dummy 2 indicated firms with
returns on capital below –2.5 percent and capital growth below 25 percent. The dummy variables
16

were assigned a value of 1 for firms belonging to the specific subgroup while all other firms were
given a value of 0. Firms belonging to these subgroups have not been able to create returns in
excess of the cost of capital during the period of study and, therefore, are likely to have agency or
transaction cost problems that could affect the choice of capital structure. The market to book
ratio reflects the potential issue price of new equity in the firm, which might influence capital
structure decisions (Hovakimian, Opler and Titman, 2001). The market to book ratio has also
been identified as a potential predictor of market returns (Fama and French, 1992, 1993) and
hence could influence the economic performance measures used as dependent variables in the
regressions.
The regression analyses were tested for possible outlier effects and multicollinearity. Data sets
causing excessive prediction errors were excluded from the sample in a sequential manner to
observe potential chages in regression coefficients. The final sample excluded 34 observations
where prediction errors exceeded three times the standard deviation, but no material changes were
observed in regression coefficients compared to calculations based on the full sample. No
multicollinearity problems were registered and VIF factors did not exceed 3.4 in any of the
reported regressions, i.e., well below the level indicating potential multicollinearity problems
(Kleinbaum, Kupper, Muller and Nizam, 1998; Lomax, 1992).
RESULTS
Statistics and correlation coefficients on the full sample are reported in Tables 1 and 2.
____________________________________________________________________________ Please insert Table 1 about here. ____________________________________________________________________________
____________________________________________________________________________ Please insert Table 2 about here. ____________________________________________________________________________
17

Average leverage showed a negative association with performance and vice versa (Table 3) and
seemed to indicate a prevalence for the ‘pecking order’ model in the choice of capital structure.
Dynamism had a significant positive association with leverage in contradiction with hypothesis
1a (Table 3). That is, firms operating in dynamic environments do not seem to reduce financial
leverage. The interaction term between dynamism and leverage indicated a negative relationship
to performance and showed statistical significance in the case of 5-year average ROI. This
provides support for hypothesis 1b. Hence, when firms in dynamic environments assume high
financial leverage it seems to be associated with lower economic performance.
____________________________________________________________________________ Please insert Table 3 about here. ____________________________________________________________________________
Innovation had a positive relationship to performance and showed statistical significance against
5-year average ROA. This provides support for hypothesis 2a, i.e., firms pursuing an innovation
strategy appear associated with higher economic performance. Innovation had a negative
relationship to leverage and showed statistical significance against 5-year average ROI. This
provides support for hypothesis 2b, i.e., firms pursuing an innovation strategy seem to be
associated with lower financial leverage. The interaction term between innovation and leverage
did not seem to have any discernible relationship to performance, i.e., there is no support for
hypothesis 2c.
Multinational organization had a significant positive relationship to both performance measures,
which supports hypothesis 3a, i.e., multinationality seems to be associated with higher economic
performance. A multinational organization indicated a negative relationship to leverage but the
regression coefficients were not statistically significant, so there is no support for hypothesis 3b.
The interaction term between multinational organization and leverage had a negative relationship
18
to performance and showed statistical significance against 5-year ROA, i.e., there is some support
for hypothesis 3c. Hence, multinational firms with a relatively high level of financial leverage
may be associated with lower economic performance.
Risk management had significant positive relationships to both performance measures, which
supports hypothesis 4a. Hence, firms with effective risk management capabilities are associated
with higher economic performance. Risk management had a positive relationship to leverage.
This provides support for hypothesis 4b, i.e., it seems like effective risk management increases
the debt capacity of the firm and reduces the need for an equity-based financial buffer. The
interaction term between risk management and leverage had a significant negative relationship to
performance, which supports hypothesis 4c. Therefore, if firms with effective risk management
capabilities assume a relatively high level of financial leverage it appears associated with lower
economic performance.
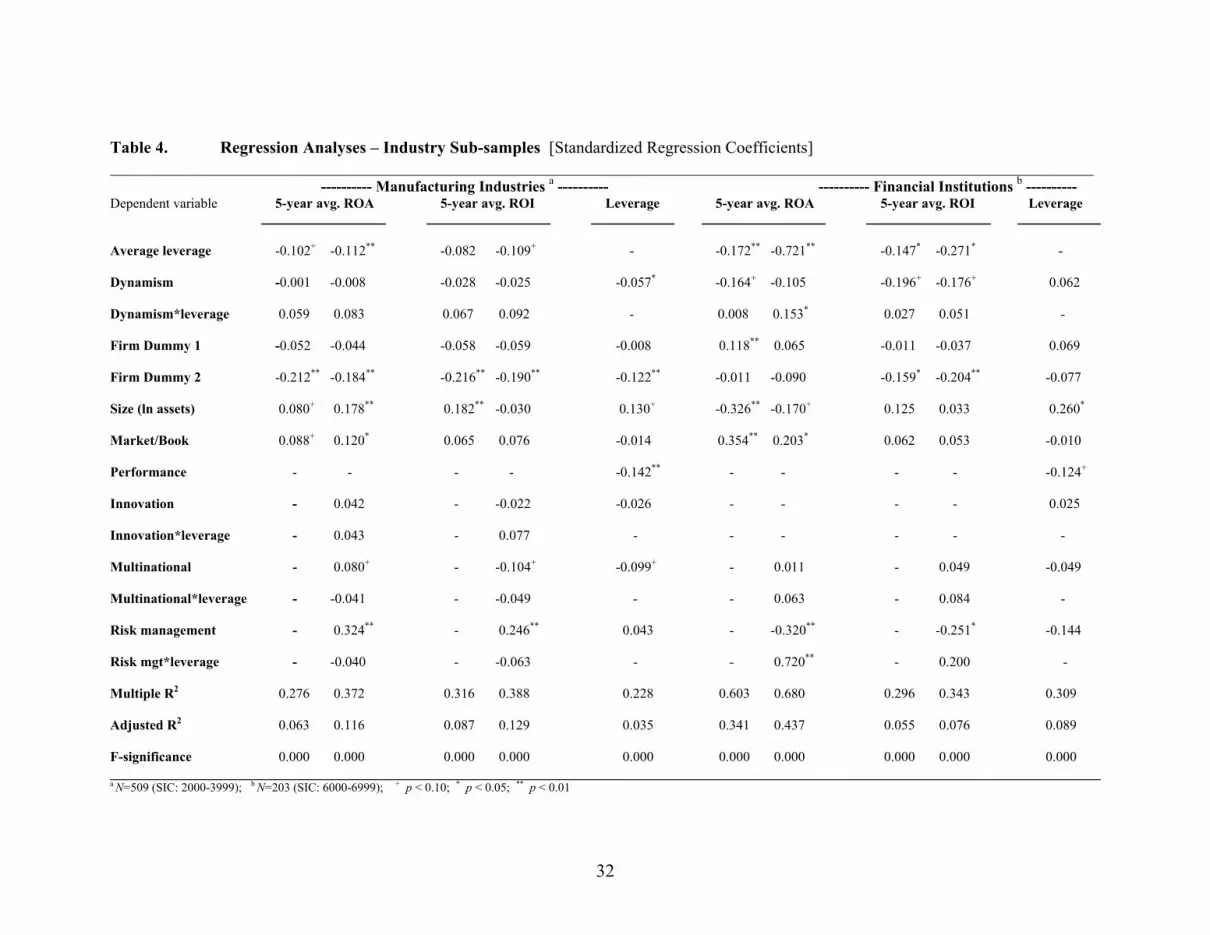
We performed the same regression analyses on different industry sub-samples to investigate
potential discrepancies across industrial settings. In manufacturing industries (SIC: 2000-3999)
we found that dynamism is negatively associated with financial leverage (Table 4), i.e., in this
sub-sample hypothesis 1a is supported. However, the interaction between dynamism and
leverage indicated a positive performance relationship, i.e., there is no support for hypothesis 1b
in this sub-sample.
____________________________________________________________________________ Please insert Table 4 about here. ____________________________________________________________________________
The multinational organization and risk management relationships were largely reproduced in the
manufacturing industries, but risk management showed inverse relationships in the financial
institutions sub-sample (Table 4). Among financial institutions risk management showed a
19
negative relationship to performance and was enhanced only in firms with higher financial
leverage.
DISCUSSION
Whereas the regressions on the full sample provide support for most of the hypotheses and
thereby give some credence to the underlying theoretical reasoning, the analyses of specific
industry sub-samples indicate that there are some discrepancies across industrial settings. The
study fails to show that firms operating in dynamic environments pursue lower financial leverage
possibly because there is a certain reliance on venture capital in emerging industries. Firms
pursuing an innovation strategy do seem to perform better and maintain lower financial leverage,
but the study cannot demonstrate that innovation strategy combined with leverage has adverse
effects on economic performance. Again, these findings could relate to a situation where
innovative ventures are financed as levered investments. In general, a multinational organization
is associated with superior economic performance, although this finding cannot be reproduced in
the manufacturing industry by itself. There are no significant indications that multinationality is
associated with lower financial leverage or that a multinational organization with high financial
leverage is associated with poorer economic performance. Risk management is associated with
higher economic performance, lower financial leverage, and the combination of risk management
and high financial leverage is associated with lower economic performance. However, among the
credit intermediating financial institutions the positive performance effect only materializes when
effective risk management capabilities are used to increase the financial leverage, which provides
a basis to expand the credit multiplier.
Whereas Simerli and Li (2000) consistently found strong adverse economic effects from higher
financial leverage in dynamic environments during the period 1989-1993, the results in this study
are not as apparent, and in certain industry sub-samples, e.g., manufacturing industries, the effects
20

actually turns out to be positive if anything. The study also fails to show adverse performance
effects when innovation strategy is debt financed, which is inconsistent with O’Brien’s (2003)
results covering the period 1980-1999. O’Brien’s (2003) study used annual firm observations and
performance measures based on market capitalization as opposed to reported economic results,
which could partially explain the inconsistent results. Another reason could relate to changes in
the managerial imperatives from the 1980s to the second half of the 1990s, which is the period
covered by the current study. Firms have continued to compete in increasingly open global
markets often by establishing a multinational organization (e.g., Govingarajan and Gupta, 2001).
The emphasis on strategic risk management has also increased considerably throughout this
period (e.g., Rawls and Smithson, 1990; Froot, Scharfstein and Stein, 1993). Hence, it is not
inconceivable that firms have been able to utilize financial derivatives and alternative risk-
transfer instruments as well as real options related flexibilities to better cope with the
uncertainties surrounding business activities in dynamic environments (Miller, 1998). Hence, the
results from this study seem to confirm that both multinational organization and risk management
have had significant influences on the choice of capital structure in recent years.
The dramatic increase in the use of derivative instruments and the recognition of real options,
e.g., embedded in new business opportunities and multinational organization, reflects increased
attention to strategic risk management issues. The proliferation of financial derivatives, insurance
contracts, alternative risk-transfer instruments, and real options should enhance the firm’s ability
to increase its responsiveness to environmental change and thereby reduce variability in its
economic performance (Froot, Sharfstein and Stein, 1993, 1994; Miller, 1998; Culp, 2002).
However, there seems to be two opposing effects at play that need further scrutiny in future
research. The ‘slack resources’ argument for pursuing an innovation strategy (O’Brien, 2003)
was adopted in this study to explain the capital structure rationale in conjunction with exploitation
of real options embedded in innovations, multinational organization, and strategic risk
21

management. On the other hand, effective use of real option structures to manage risk exposures
should reduce the need for an equity based financial buffer.
We argued that the firm needs slack resources in the form of an equity based financial buffer, to
ensure that real options are continuously developed and to make sure they can be executed
effectively when market circumstances warrant it. The ability to develop real options will usually
require a certain amount of slack resources and the existence of real options is, therefore, likely to
have an inverse relationship to financial leverage. Furthermore, the eventual exercise of real
options implies that the firm invests in the project that represents the growth option as the
investment constitutes the ‘exercise price’ in the options jargon (e.g., Dixit and Pindyck, 1994;
Leuhrman, 1998). Hence, to fully exploit the flexibilities embedded in real options, the firm must
have a certain level of financial slack that allows it to execute the underlying business
propositions in response to changing conditions. This is in contrast to the use of traded financial
derivatives that often are used to hedge and smooth cash flows from underlying positions and
where the premium typically is paid up front and, therefore, constitutes a ‘sunk cost’ at the time
of exercise.
The fact that multinational organization and effective risk management seem to matter in the
choice of optimal capital structure may be partially explained by a real options perspective as the
associated flexibilities increases the firms’ maneuverability and strategic responsiveness (Bettis
and Hitt, 1995; Miller, 1998). In contrast, real options seem less important among financial
institutions where major risk factors relate to the price volatility of financial assets and credit
exposures that can be hedged in the market through trading in derivative instruments. However,
more research is needed to investigate how the strategic risk management effects spill over into
improved economic performance, and how an explanation based on firm specific real options
relate to conventional perspectives of innovation strategy and multinational opportunities.
22
CONCLUSIONS
The results of this study based on analyses of a large cross sectional sample of firms operating in
different industries demonstrate that innovation, multinationality, and risk management all have
positive associations with economic performance. However, the evidence does not clarify what
the optimal capital structure is for each of these strategic approaches although it seems pretty
clear that effective risk management practices outside the financial industry requires some
financial slack. Hence, to achieve economic performance effects from effective risk
management, financial leverage should not be excessive. One reason presumably is that that it
takes a financial buffer to develop real options that underpin effective management of firm
specific risk exposures as well as financial resources are needed to exercise the options when
conditions suggest it is opportune to do so. The study also finds differences between the capital
structure decisions in specific industrial settings, e.g., manufacturing companies and financial
institutions, partially affected by differences in financing practices, regulatory constraints, and use
of traded financial derivatives in the risk management process.
23

REFERENCES Aldrich HE. 2000. Organizations Evolving. Newbury Park, CA, Sage. Aldrich HE, Auster E. 1986. Even dwarfs started small: Liabilities of age and size and their strategic implications, in Staw B, Cummings, LL (eds.). Research in Organizational Behavior, VIII. Grenwich, CT, JAI Press. Allen L, Pantzalis C. 1996. Valuation of the operating flexibility of multinational corporations. Journal of International Business Studies 27, 633-653. Balakrisnan S, Fox I. 1993. Asset specificity, firm heterogeneity and capital structure. Strategic Management Journal 14: 3-16. Banerjee S, Wihlborg C. 2003. Irreversibilities, assets specificity and capital structure. Working Paper, Copenhagen Business School. Barney JB. 1991. Firm resources and sustained competitive advantage. Journal of Management 17: 99-120. Barton SL, Gordon PJ. 1987. Corporate strategy: useful perspectives for the study of capital structure. Academy of Management Review 12: 67-75. Barton SL, Gordon PJ. 1988. Corporate strategy and capital structure. Strategic Management Journal 9: 623-632. Berger P, Ofek E, Yermack D. 1997. Managerial entrenchment and capital structure decisions. Journal of Finance, 52: 1411-1438. Bettis RA, Hitt MA. 1995. The new competitive landscape. Strategic Management Journal 16: 7-19. Bowman EH, Hurry D. 1993. Strategy through the option lens: an integrated view of resource investments and the incremental-choice process. Academy of Management Review 18: 760-782. Bradley M, Jarrell GA, Kim EH. 1984. On the existence of an optimal capital structure: theory and evidence. Journal of Finance 39: 857-878. Christophe SE. 1996. Hysteresis and the value of the U.S. multinational corporation, Journal of Business 75: 67-93. Chung KH. 1993. Asset characteristics and corporate debt policy: An empirical test. Journal of Business Finance 20: 83-98. Colarossi, D. (2000). Capitalizing on innovation in the use of contingent capital. Swiss Re New Markets, New York. Culp CL. 2002. The ART of Risk Management: Alternative Risk Transfer, Capital Structure, and the Convergence of Insurance and Capital Markets. Wiley, New York. Davis R, Duhaime IM. 1992. Diversification, vertical integration, and industry analysis: new perspectives and measurement. Strategic Management Journal 13: 511-524.
24

D’Aveni R. 1994. Hypercompetition. New York, Free Press. DeAngelo H, Masulis R. 1980. Optimal capital structure under corporate and personal taxation. Journal of Financial Economics 8: 3-29. Dess GG, Beard DW. 1984. Dimensions of organizational task environments. Administrative Science Quarterly 29: 52-73. Desouza K, Evaristo R. 2003. Global knowledge management strategies. European Management Journal 21, 62-67. Dierickx I, Cool K. 1989. Asset stock accumulation and sustainability of competitive advantage. Management Science 35: 1504-1511. Dixit A, Pindyck RS. 1994. Investment Under Uncertainty. New Jersey, Princeton University Press. Fama EF, French KR. 1992. The cross-section of expected stock returns. Journal of Finance 47, 427-465. Fama EF, French KR. 1993. Common risk factors in returns on stocks and bonds. Journal of Financial Economics 33, 3-56. Foss NJ, Pedersen T. 2002. Transferring knowledge in MNCs: The role of subsidiary knowledge and organizational context. Journal of International Management 8, 49-67. Froot KA, Scharfstein DS, Stein JC. 1993. Risk management: coordinating corporate investment and financiang policies. Journal of Finance 48: 1629-1658. Froot KA, Scharfstein DS, Stein JC. 1994. A framework for risk management. Harvard Business Review 72(6): 91-102. Gardner JC, Trzcinka CA. 1992. All-equity firms and the balancing theory of capital structure. Journal of Financial Research 15: 77-90. Ghosh DK. 1992. Optimum capital structure redefined. Financial Review 27: 411-429. Govingarajan V, Gupta AK. 2001. The quest for global dominance: Transforming global presence into global competitive advantage. San Francisco, Jossey-Bass. Grant RM. 1996. Toward a knowledge-based theory of the firm. Strategic Management Journal 17, 109-122. Harris M, Raviv A. 1991. The theory of capital structure. Journal of Finance 46: 297-355. Hovakimian A, Opler T, Titman S. 2001. The debt-equity choice. Journal of Financial and Quantitative Analysis 36: 1-24.
25

Jensen MC. 1986. Agency costs of free cash flow, corporate finance, and takeovers. American Economic Review 76: 323-329. Jensen MC. 1989. Eclipse of the public corporation. Harvard Business Review. 67 (5), 61-74. Jensen MC, Meckling WH. 1976. Theory of the firm: managerial behavior, agency costs and ownership structure. Journal of Financial Economics 76: 323-329. Keats BW, Hitt MA. 1988. A causal model of linkages among environmental dimensions, macro organizational characteristics, and performance. Academy of Management Journal 31: 570-598. Kleinbaum DG, Kupper LK, Mullerm KE, Nizam A. 1998. Applied Regression Analysis and Other Multivariate Methods. Thrid Edition. Pacific Grove, CA, Duxbury Press. Kochar R. 1996. Explaining firm capital structure: The role of agency theory vs. transaction cost economics. Strategic Management Journal 17: 713-728. Kochar R, Hitt MA. 1998. Linking corporate strategy to capital structure: diversification strategy, type and source of financing. Strategic Management Journal 19: 601-610. Kogut B. 1985. Designing global strategies: Profiting from operational flexibility. MIT Sloan Management Review 27(4), 27-38. Kogut B, Chang SJ. 1996. Platform investments and volatile exchange rates: Direct investment in the U.S. by Japanese electronic companies. Review of Economics and Statistics 78, 221-231. Kogut B, Kulatilaka N. 1994. Operating flexibility, global manufacturing and the option value of a multinational network. Management Science 40, 123-138. Kogut B, Singh H. 1988. The effect of national culture on the choice of entry mode. Journal of International Business Studies 19, 411-432. Kogut B, Zander U. 1992. Knowledge of the firm, combinative capabilities, and the replication of technology. Organization Science 3:383-397. Kogut B, Zander U. 1993. Knowledge of the firm and the evolutionary theory of the multinational corporation. Journal of International Business Studies 15, 151-168. Leiblein MJ. 2003. The choice of organizational governance form and performance: Predictions from transaction cost, resource-based, and real options theories. Journal of Management 29: 937-961. Leuhrman TA. 1998. Investment opportunities as real options: Getting started on the numbers. Harvard Business Review, July-August: 51-67. Lomax RG. 1992. Statistical Concepts: A Second Course for Education and the Behavioral Sciences. Longman, New York. Mang PL. 1998. Exploiting innovation options: An empirical analysis of R&D intensive firms. Journal of Economic Behavior and Organization 35, 229-242.
26
McGrath RG. 1997. A real options logic for initiating technology positioning investments. Academy of Management Review 22: 974-996. McGrath RG, Nerkar A. 2004. Real options reasoning and a new look at the R&D investment strategies of pharmaceutical firms. Strategic Management Journal 25: 1-21. Miller KD. 1998. Economic exposure and integrated risk management. Strategic Management Journal 19: 497-514. Modigliani F, Miller MH. 1958. The cost of capital, corporate finance and the theory of investment. American Economic Review 48: 261-297. Modigliani F, Miller MH. 1963. Corporate income taxes and the cost of capital: a correction. American Economic Review 53: 433-443. Myers SC. 1977. Determinants of corporate borrowing. Journal of Financial Economics 5, 147-175. Myers SC. 1984. The capital structure puzzle. Journal of Finance 39: 575-592. Myers SC, Majluf NS. 1984. Corporate financing and investment decisions when firms have information that investors do not have. Journal of Financial Economics 13, 187-221. O’Brien JP. 2003. The capital structure implications of pursuing a strategy of innovation. Strategic Management Journal 24: 415-432. Opler TC, Pinkowitz L, Stulz R, Williamson R. 1999. The determinants and implications of corporate cash holdings. Journal of Financial Economics 52, 3-46. Opler TC, Titman S. 1994. Financial distress and corporate performance. Journal of Finance 49, 1015-1040. Rangan S. 1998. Do multinationals operate flexibly? Theory and evidence. Journal of International Business Studies 29, 217-237. Rawls SW, Smithson CW. 1990. Strategic risk management. Journal of Applied Corporate Finance 2(2): 6-18. Reeb DM, Kwok CCY, Baek HY. 1998. Systematic risk of the multinational corporation. Journal of International Business Studies 29, 263-279. Reuer JJ, Leiblen MJ. 2000. Downside risk implications of multinationality and international joint ventures. Academy of Management Journal 43, 203-214. Sandberg CM, Lewellen WG, Stanley KL. 1987. Financial strategy: planning and managing the corporate leverage position. Strategic Management Journal 8: 15-24. Santarelli E. 1991. Asset specificity, R and D financing, and the signaling properties of the firm’s financial structure. Economics of Innovation and New Technology 1(4): 279-294.
27
Saunders A, Cornett MM. 2003. Financial Institutions Management: Risk Management Approach. McGraw-Hill Irwin, New York. Shimpi PA. 1999. Integrating risk management and capital management, in Shimpi PA. (Ed.) Integrating Corporate Risk Management. Swiss Re New Markets, New York. Simerly RL, Li M. 2000. Environmental dynamism, capital structure and performance: a theoretical integration and an empirical test. Strategic Management Journal 21: 31-50. Stulz R. 1990. Managerial discretion and optimal financing policies. Journal of Financial Economics 26, 3-27. Taylor P, Lowe J. 1995. A note on corporate strategy and capital structure. Strategic Management Journal 16: 411-414. Thies CF, Klock MS. 1992. Determinants of capital structure. Review of Financial Economics 1: 40-52. Thomas LG. 1996. Dynamic resourcefulness and the hypercompetitive shift. Organization Science 7: 221-242. Titman S, Wessels R. 1988. The determinants of capital structure choice. Journal of Finance 43: 1-19. Ward K. 1993. Corporate Financial Strategy. Butterworth Heinemann, Oxford, UK. Williamson O. 1988. Corporate finance and corporate governance. Journal of Finance 43: 567-591
28

Table 1. Descriptive Statistics and Correlation Coefficientsa _________________________________________________________________________________________________________________________________ Mean S.D. 1 2 3 4 5 6 7 8 9 10 11 12 13 1 Average 5-year ROA 4.254 5.687 2 Average leverage 113.237 207.858 -0.144** 3 Dynamism 0.007 0.021 -0.033 0.045* 4 Firm Dummy 1 0.081 0.273 -0.015 0.031+ -0.004 5 Firm Dummy 2 0.108 0.311 -0.110** -0.111** 0.024 -0.107**
6 Size (ln assets) 7.847 1.599 -0.020 0.236** -0.103** 0.005 -0.075**
7 Market/Book 1.821 1.576 0.083** -0.151** -0.092** -0.037+ -0.038+ -0.405**
8 Innovation 1.707 2.441 0.111** -0.100** -0.070** -0.004 -0.054* -0.053* 0.252**
9 Multinational 0.861 1.059 0.165** 0.039+ -0.103** -0.001 -0.050* 0.204** 0.213** 0.307**
10 Risk management 5.449 1.946 0.074** 0.223** -0.083** -0.028 -0.142** 0.735** -0.358** -0.189** 0.105**
11 Dynamism*leverage 0.202 6.279 -0.040+ -0.043 0.374** 0.021 -0.005 -0.046* 0.040 -0.021 -0.024 -0.056* 12 Innovation*leverage -52.223 518.215 0.015 -0.045+ -0.039 -0.006 0.016 -0.056* 0.006 -0.023 -0.021 -0.062* -0.100** 13 Multinational*leverage -7.546 211.945 -0.033 -0.118** -0.033 0.006 0.015 0.004 -0.010 -0.026 0.035+ 0.024 -0.080** -0.033 14 Risk mgt.*leverage 90.775 494.287 -0.098** 0.2869** -0.059* 0.017 0.018 0.205** -0.062* -0.051* -0.008 0.196** -0.109** -0.258** 0.252** _________________________________________________________________________________________________________________________________ a N=1323, + p < 0.10; * p < 0.05; ** p < 0.01
29

Table 2. Descriptive Statistics and Correlation Coefficientsa _________________________________________________________________________________________________________________________________ Mean S.D. 1 2 3 4 5 6 7 8 9 10 11 12 13 1 Average 5-year ROI 7.547 8.735 2 Average leverage 113.237 207.858 -0.098** 3 Dynamism 0.007 0.021 -0.038* 0.045* 4 Firm Dummy 1 0.081 0.273 -0.035+ 0.031+ -0.004 5 Firm Dummy 2 0.108 0.311 -0.128** -0.111** 0.024 -0.107**
6 Size (ln assets) 7.847 1.599 0.095** 0.236** -0.103** 0.005 -0.075**
7 Market/Book 1.821 1.576 0.061* -0.151** -0.092** -0.037+ -0.038+ -0.405**
8 Innovation 1.707 2.441 0.075** -0.100** -0.070** -0.004 -0.054* -0.053* 0.252**
9 Multinational 0.861 1.059 0.170** 0.039+ -0.103** -0.001 -0.050* 0.204** 0.213** 0.307**
10 Risk management 4.795 1.750 0.170** 0.166** -0.076** 0.015 -0.141** 0.653** -0.286** -0.155** 0.122**
11 Dynamism*leverage 0.202 6.279 -0.061* -0.043 0.374** 0.021 -0.005 -0.046* 0.040 -0.021 -0.024 -0.056* 12 Innovation*leverage -52.223 518.215 0.011 -0.045+ -0.039 -0.006 0.016 -0.056* 0.006 -0.023 -0.021 -0.062* -0.100** 13 Multinational*leverage -7.546 211.945 -0.019 -0.118** -0.033 0.006 0.015 0.004 -0.010 -0.026 0.035+ 0.024 -0.080** -0.033 14 Risk mgt.*leverage 61.816 376.713 -0.051* 0.219** -0.043+ 0.030 0.024 0.166** -0.041+ -0.038+ 0.001 0.086** -0.114** -0.203** 0.274** _________________________________________________________________________________________________________________________________ a N=1323, + p < 0.10; * p < 0.05; ** p < 0.01
30
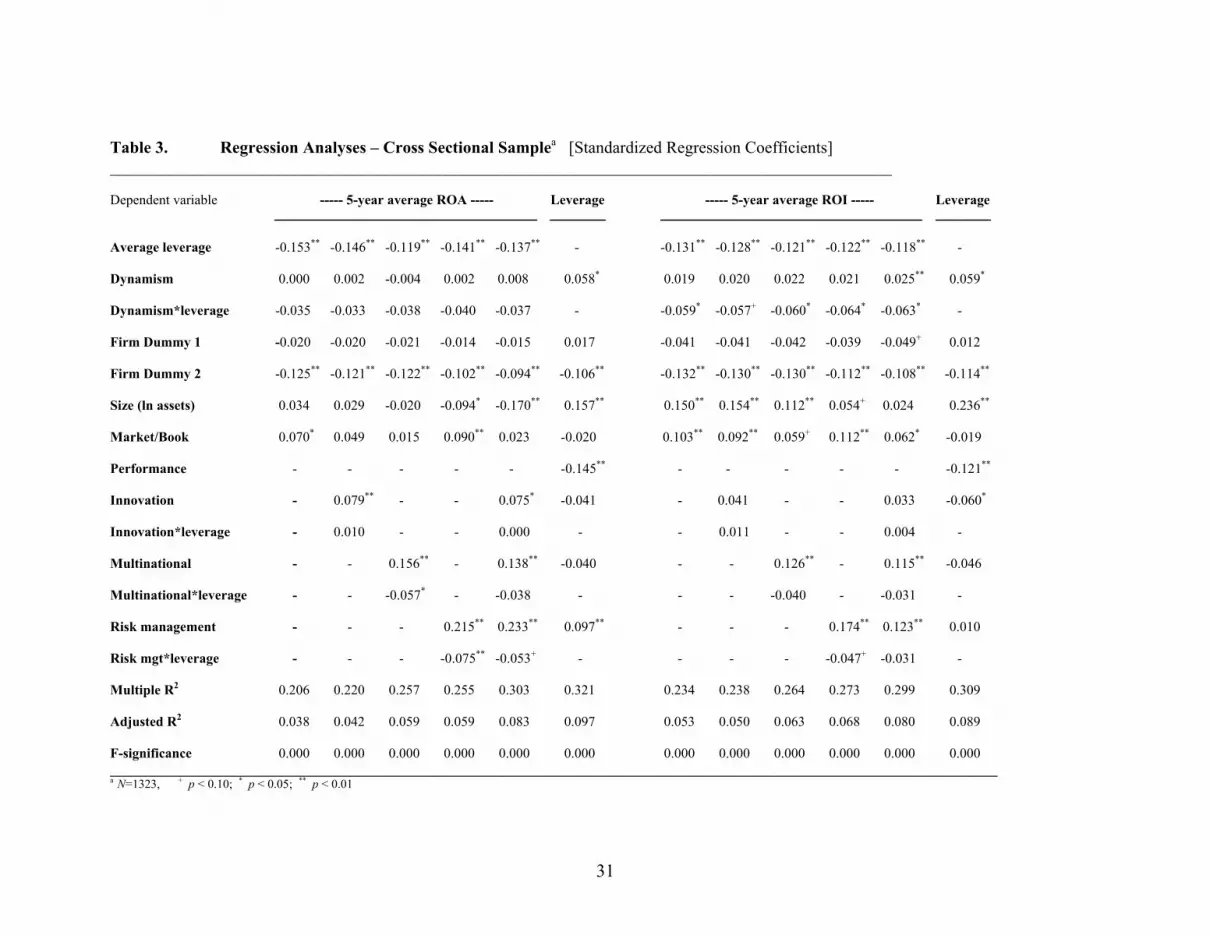
Table 3. Regression Analyses – Cross Sectional Samplea [Standardized Regression Coefficients] _____________________________________________________________________________________________ Dependent variable ----- 5-year average ROA ----- Leverage ----- 5-year average ROI ----- Leverage
Average leverage -0.153** -0.146** -0.119** -0.141** -0.137** - -0.131** -0.128** -0.121** -0.122** -0.118** -
Dynamism 0.000 0.002 -0.004 0.002 0.008 0.058* 0.019 0.020 0.022 0.021 0.025** 0.059* Dynamism*leverage -0.035 -0.033 -0.038 -0.040 -0.037 - -0.059* -0.057+ -0.060* -0.064* -0.063* -
Firm Dummy 1 -0.020 -0.020 -0.021 -0.014 -0.015 0.017 -0.041 -0.041 -0.042 -0.039 -0.049+ 0.012
Firm Dummy 2 -0.125** -0.121** -0.122** -0.102** -0.094** -0.106** -0.132** -0.130** -0.130** -0.112** -0.108** -0.114** Size (ln assets) 0.034 0.029 -0.020 -0.094* -0.170** 0.157** 0.150** 0.154** 0.112** 0.054+ 0.024 0.236** Market/Book 0.070* 0.049 0.015 0.090** 0.023 -0.020 0.103** 0.092** 0.059+ 0.112** 0.062* -0.019 Performance - - - - - -0.145** - - - - - -0.121** Innovation - 0.079** - - 0.075* -0.041 - 0.041 - - 0.033 -0.060* Innovation*leverage - 0.010 - - 0.000 - - 0.011 - - 0.004 -
Multinational - - 0.156** - 0.138** -0.040 - - 0.126** - 0.115** -0.046
Multinational*leverage - - -0.057* - -0.038 - - - -0.040 - -0.031 - Risk management - - - 0.215** 0.233** 0.097** - - - 0.174** 0.123** 0.010
Risk mgt*leverage - - - -0.075** -0.053+ - - - - -0.047+ -0.031 - Multiple R2 0.206 0.220 0.257 0.255 0.303 0.321 0.234 0.238 0.264 0.273 0.299 0.309 Adjusted R2 0.038 0.042 0.059 0.059 0.083 0.097 0.053 0.050 0.063 0.068 0.080 0.089 F-significance 0.000 0.000 0.000 0.000 0.000 0.000 0.000 0.000 0.000 0.000 0.000 0.000 _________________________________________________________________________________________________________________________________
01 a N=1323, + p < 0.10; * p < 0.05; ** p < 0.
31
32
Table 4. Regression Analyses – Industry Sub-samples [Standardized Regression Coefficients] _____________________________________________________________________________________________________________________ ---------- Manufacturing Industries a ---------- ---------- Financial Institutions b ---------- Dependent variable 5-year avg. ROA 5-year avg. ROI Leverage 5-year avg. ROA 5-year avg. ROI Leverage
Average leverage -0.102+ -0.112** -0.082 -0.109+ - -0.172** -0.721** -0.147* -0.271* -
Dynamism -0.001 -0.008 -0.028 -0.025 -0.057* -0.164+ -0.105 -0.196+ -0.176+ 0.062 Dynamism*leverage 0.059 0.083 0.067 0.092 - 0.008 0.153* 0.027 0.051 -
Firm Dummy 1 -0.052 -0.044 -0.058 -0.059 -0.008 0.118** 0.065 -0.011 -0.037 0.069
Firm Dummy 2 -0.212** -0.184** -0.216** -0.190** -0.122** -0.011 -0.090 -0.159* -0.204** -0.077 Size (ln assets) 0.080+ 0.178** 0.182** -0.030 0.130+ -0.326** -0.170+ 0.125 0.033 0.260* Market/Book 0.088+ 0.120* 0.065 0.076 -0.014 0.354** 0.203* 0.062 0.053 -0.010 Performance - - - - -0.142** - - - - -0.124+ Innovation - 0.042 - -0.022 -0.026 - - - - 0.025 Innovation*leverage - 0.043 - 0.077 - - - - - -
Multinational - 0.080+ - -0.104+ -0.099+ - 0.011 - 0.049 -0.049
Multinational*leverage - -0.041 - -0.049 - - 0.063 - 0.084 - Risk management - 0.324** - 0.246** 0.043 - -0.320** - -0.251* -0.144
Risk mgt*leverage - -0.040 - -0.063 - - 0.720** - 0.200 - Multiple R2 0.276 0.372 0.316 0.388 0.228 0.603 0.680 0.296 0.343 0.309 Adjusted R2 0.063 0.116 0.087 0.129 0.035 0.341 0.437 0.055 0.076 0.089 F-significance 0.000 0.000 0.000 0.000 0.000 0.000 0.000 0.000 0.000 0.000 ________________________________________________________________________________________________________________________________________________
a N=509 (SIC: 2000-3999); b N=203 (SIC: 6000-6999); + p < 0.10; * p < 0.05; ** p < 0.01

SMG – Working Papers www.cbs.dk/smg
2003 2003-1: Nicolai J. Foss, Kenneth Husted, Snejina Michailova, and Torben Pedersen:
Governing Knowledge Processes: Theoretical Foundations and Research Opportunities.
2003-2: Yves Doz, Nicolai J. Foss, Stefanie Lenway, Marjorie Lyles, Silvia Massini, Thomas P. Murtha and Torben Pedersen: Future Frontiers in International Management Research: Innovation, Knowledge Creation, and Change in Multinational Companies.
2003-3: Snejina Michailova and Kate Hutchings: The Impact of In-Groups and Out-Groups on Knowledge Sharing in Russia and China CKG Working Paper.
2003-4: Nicolai J. Foss and Torben Pedersen : The MNC as a Knowledge Structure: The Roles of Knowledge Sources and Organizational Instruments in MNC Knowledge Management CKG Working Paper.
2003-5: Kirsten Foss, Nicolai J. Foss and Xosé H. Vázquez-Vicente: “Tying the Manager’s Hands”: How Firms Can Make Credible Commitments That Make Opportunistic Managerial Intervention Less Likely CKG Working Paper.
2003-6: Marjorie Lyles, Torben Pedersen and Bent Petersen: Knowledge Gaps: The Case of Knowledge about Foreign Entry.
2003-7: Kirsten Foss and Nicolai J. Foss: The Limits to Designed Orders: Authority under “Distributed Knowledge” CKG Working Paper.
2003-8: Jens Gammelgaard and Torben Pedersen: Internal versus External Knowledge Sourcing of Subsidiaries - An Organizational Trade-Off.
2003-9: Kate Hutchings and Snejina Michailova: Facilitating Knowledge Sharing in Russian and Chinese Subsidiaries: The Importance of Groups and Personal Networks Accepted for publication in Journal of Knowledge Management.
2003-10: Volker Mahnke, Torben Pedersen and Markus Verzin: The impact of knowledge management on MNC subsidiary performance: the role of absorptive capacity CKG Working Paper.
2003-11: Tomas Hellström and Kenneth Husted: Mapping Knowledge and Intellectual Capital in Academic Environments: A Focus Group Study Accepted for publication in Journal of Intellectual Capital CKG Working Paper.
2003-12: Nicolai J Foss: Cognition and Motivation in the Theory of the Firm: Interaction or “Never the Twain Shall Meet”? Accepted for publication in Journal des Economistes et des Etudes Humaines CKG Working Paper.
2003-13: Dana Minbaeva and Snejina Michailova: Knowledge transfer and expatriation practices in MNCs: The role of disseminative capacity.
2003-14: Christian Vintergaard and Kenneth Husted: Enhancing selective capacity through venture bases.
2004 2004-1: Nicolai J. Foss: Knowledge and Organization in the Theory of the Multinational
Corporation: Some Foundational Issues
2004-2: Dana B. Minbaeva: HRM practices and MNC knowledge transfer
2004-3: Bo Bernhard Nielsen and Snejina Michailova: Toward a phase-model of global knowledge management systems in multinational corporations
2004-4: Kirsten Foss & Nicolai J Foss: The Next Step in the Evolution of the RBV: Integration with Transaction Cost Economics
2004-5: Teppo Felin & Nicolai J. Foss: Methodological Individualism and the Organizational Capabilities Approach
2004-6: Jens Gammelgaard, Kenneth Husted, Snejina Michailova: Knowledge-sharing Behavior and Post-acquisition Integration Failure
2004-7: Jens Gammelgaard: Multinational Exploration of Acquired R&D Activities
2004-8: Christoph Dörrenbächer & Jens Gammelgaard: Subsidiary Upgrading? Strategic Inertia in the Development of German-owned Subsidiaries in Hungary
2004-9: Kirsten Foss & Nicolai J. Foss: Resources and Transaction Costs: How the Economics of Property Rights Furthers the Resource-based View
2004-10: Jens Gammelgaard & Thomas Ritter: The Knowledge Retrieval Matrix: Codification and Personification as Separate Strategies
2004-11: Nicolai J. Foss & Peter G. Klein: Entrepreneurship and the Economic Theory of the Firm: Any Gains from Trade?
2004-12: Akshey Gupta & Snejina Michailova: Knowledge Sharing in Knowledge-Intensive Firms: Opportunities and Limitations of Knowledge Codification
2004-13: Snejina Michailova & Kate Hutchings: Knowledge Sharing and National Culture: A Comparison Between China and Russia
2005 2005-1: Keld Laursen & Ammon Salter: My Precious - The Role of Appropriability
Strategies in Shaping Innovative Performance
2005-2: Nicolai J. Foss & Peter G. Klein: The Theory of the Firm and Its Critics: A Stocktaking and Assessment
2005-3: Lars Bo Jeppesen & Lars Frederiksen: Why Firm-Established User Communities Work for Innovation: The Personal Attributes of Innovative Users in the Case of Computer-Controlled Music
2005-4: Dana B. Minbaeva: Negative Impact of Hrm Complementarity on Knowledge Transfer in Mncs
2005-5: Kirsten Foss, Nicolai J. Foss, Peter G. Klein & Sandra K. Klein: Austrian Capital Theory and the Link Between Entrepreneurship and the Theory of the Firm

2005-1: Nicolai J. Foss: The Knowledge Governance Approach
2005-2: Torben J. Andersen: Capital Structure, Environmental Dynamism, Innovation Strategy, and Strategic Risk Management