Embed Size (px)
Citation preview

Tools and Data for Enrollment Projections
2003-2013
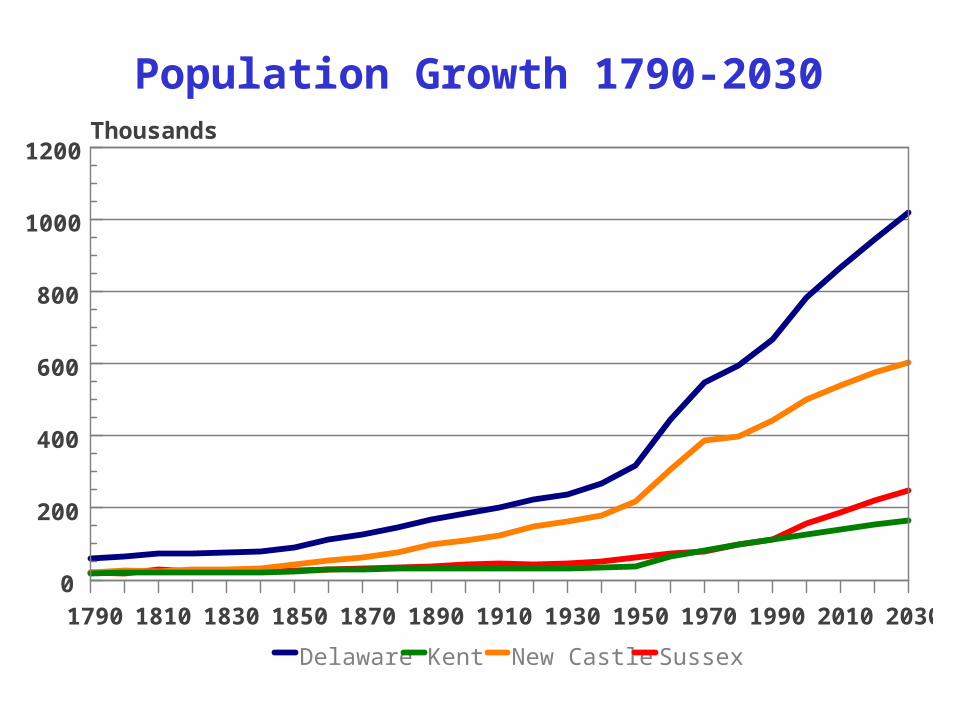
Population Growth 1790-2030
1790 1810 1830 1850 1870 1890 1910 1930 1950 1970 1990 2010 20300
200
400
600
800
1000
1200Thousands
Delaware Kent New Castle Sussex
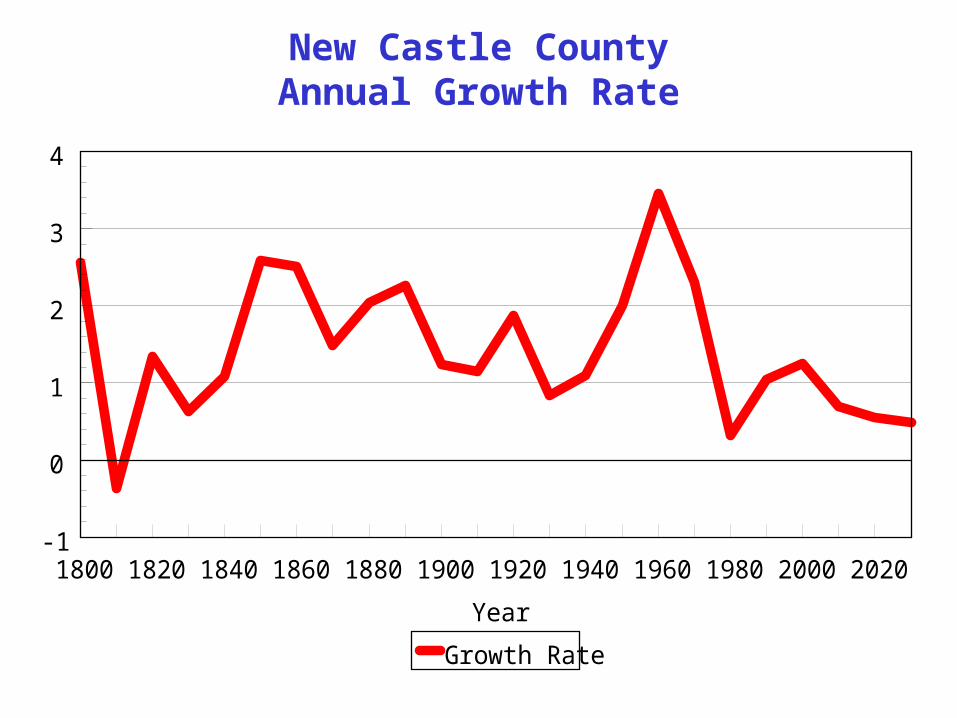
New Castle CountyAnnual Growth Rate
1800 1820 1840 1860 1880 1900 1920 1940 1960 1980 2000 2020
Year
0
1
2
3
4
-1
Growth Rate
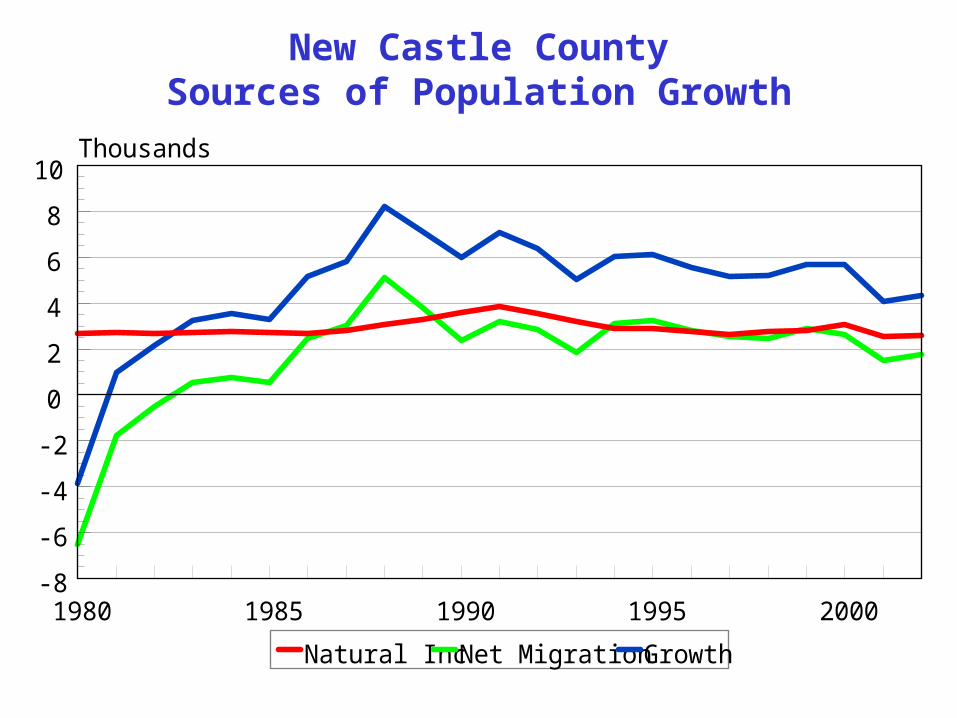
New Castle CountySources of Population Growth
1980 1985 1990 1995 2000
0
2
4
6
8
10
-2
-4
-6
-8
Thousands
Natural Inc Net Migration Growth
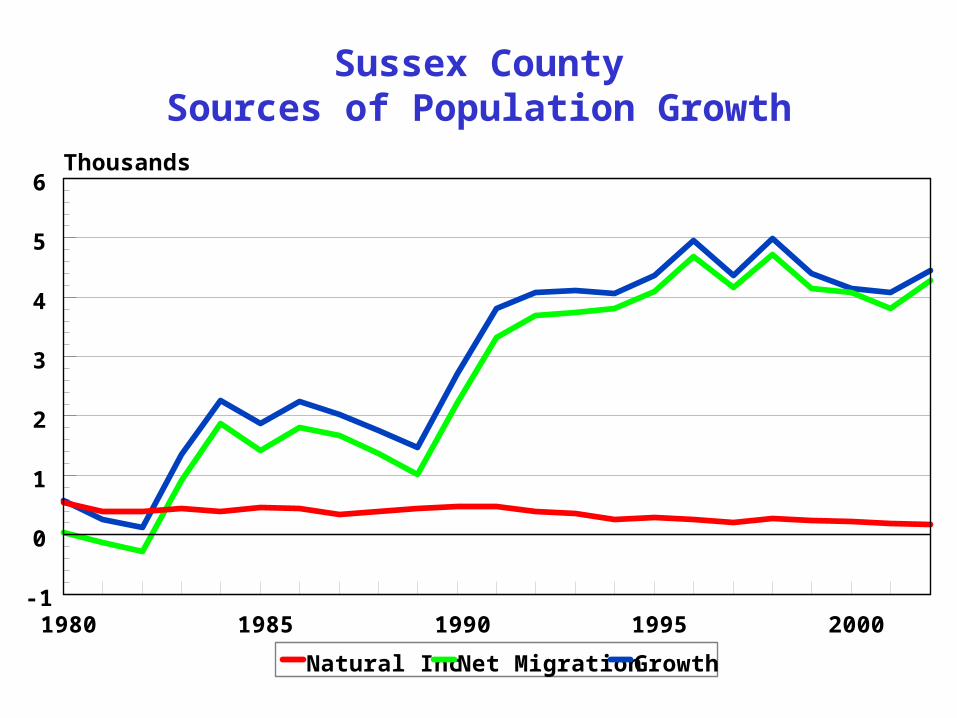
Sussex CountySources of Population Growth
1980 1985 1990 1995 2000
0
1
2
3
4
5
6
-1
Thousands
Natural Inc Net Migration Growth

New Castle County Household and Population Growth Rates
1950 1960 1970 1980 1990 2000 2010 2020 20300
1
2
3
4Percent/Persons per Household
Pop Growth HH Growth POP/HH
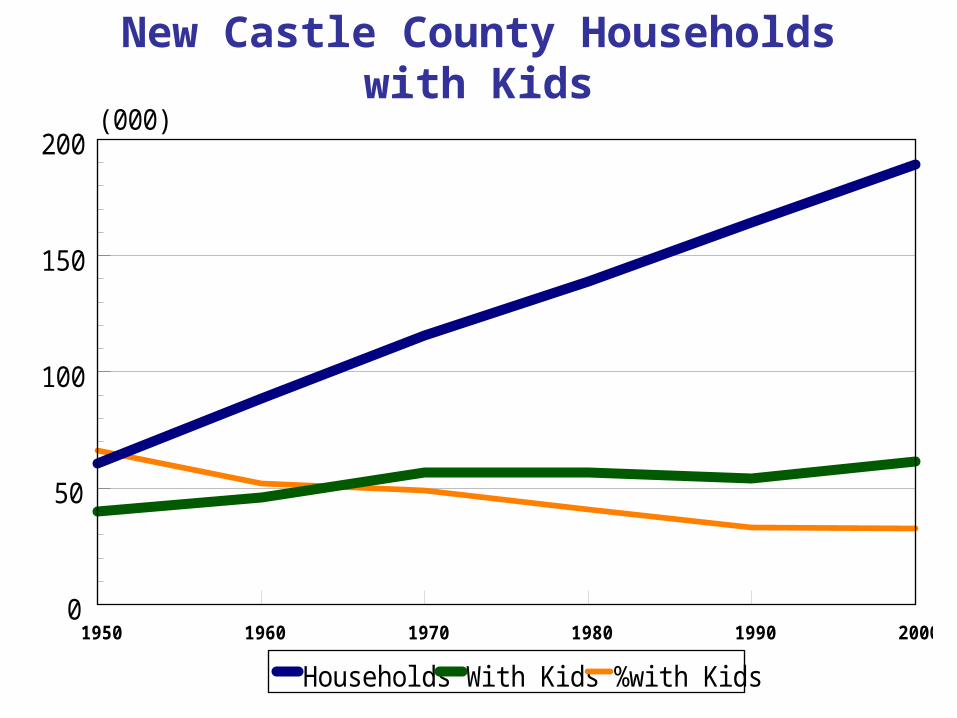
New Castle County Households with Kids
1950 1960 1970 1980 1990 20000
50
100
150
200(000)
Households With Kids %with Kids
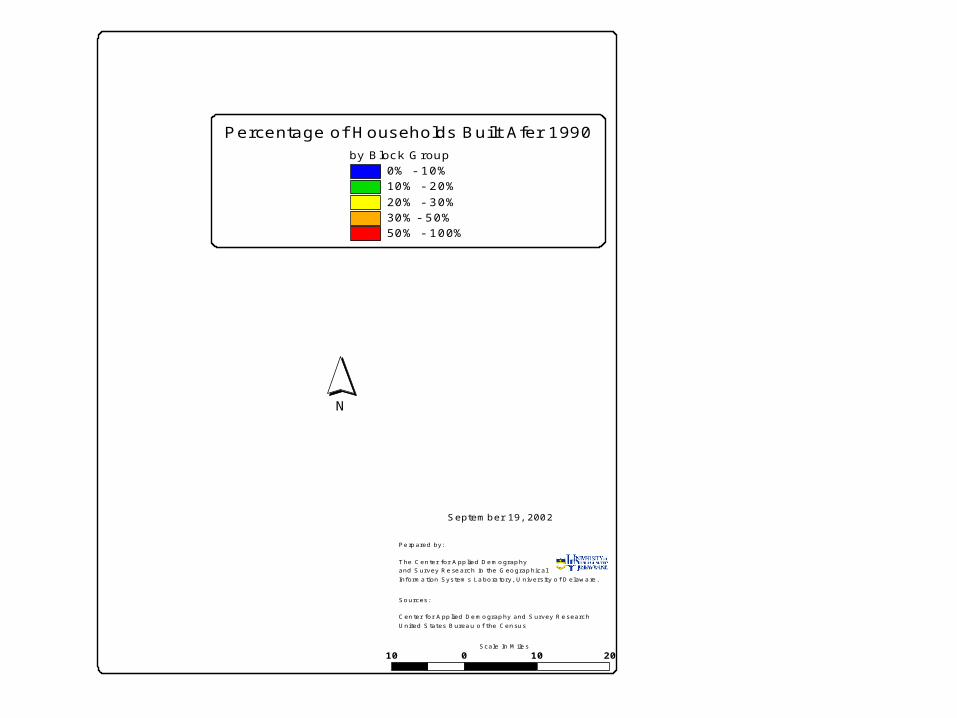
by Block Group0% - 10%10% - 20%20% - 30%30%- 50%50% - 100%
N
Percentage of Households Built Afer 1990
Scale In Miles
10 0 10 20 Miles
Perpared by:
The Center for Applied Demography and Survey Research in the Geographical Information Systems Laboratory, University of Delaware.
September 19, 2002
Sources:
Center for Applied Demography and Survey ResearchUnited States Bureau of the Census
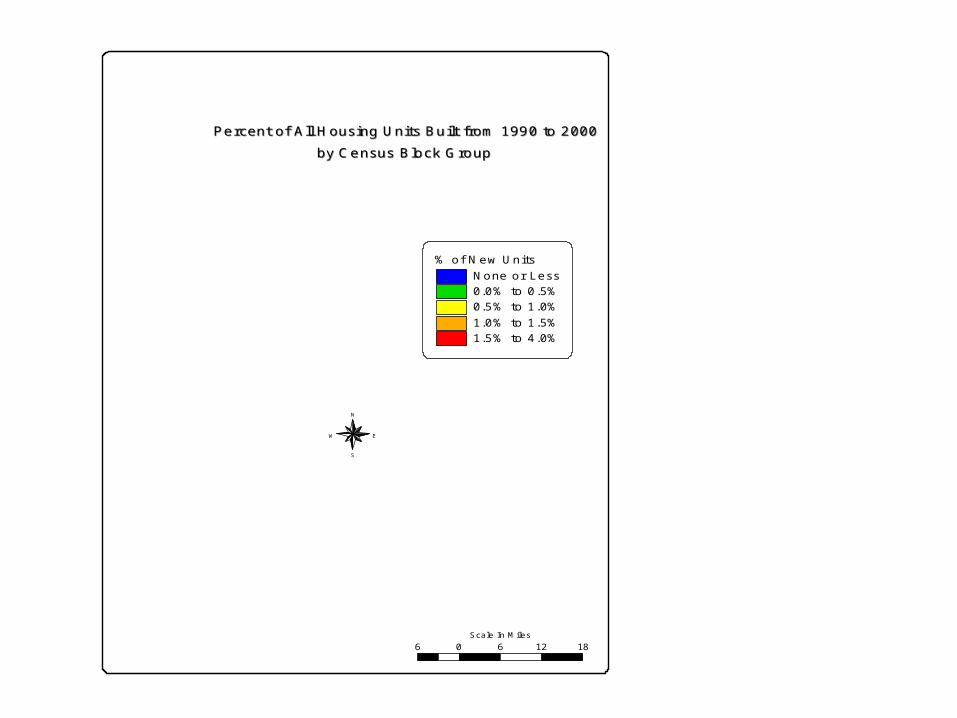
6 0 6 12 18 MilesScale In Miles
N
EW
S
by Census Block Groupby Census Block Group
% of New UnitsNone or Less0.0% to 0.5%0.5% to 1.0%1.0% to 1.5%1.5% to 4.0%
Percent of All Housing Units Built from 1990 to 2000Percent of All Housing Units Built from 1990 to 2000
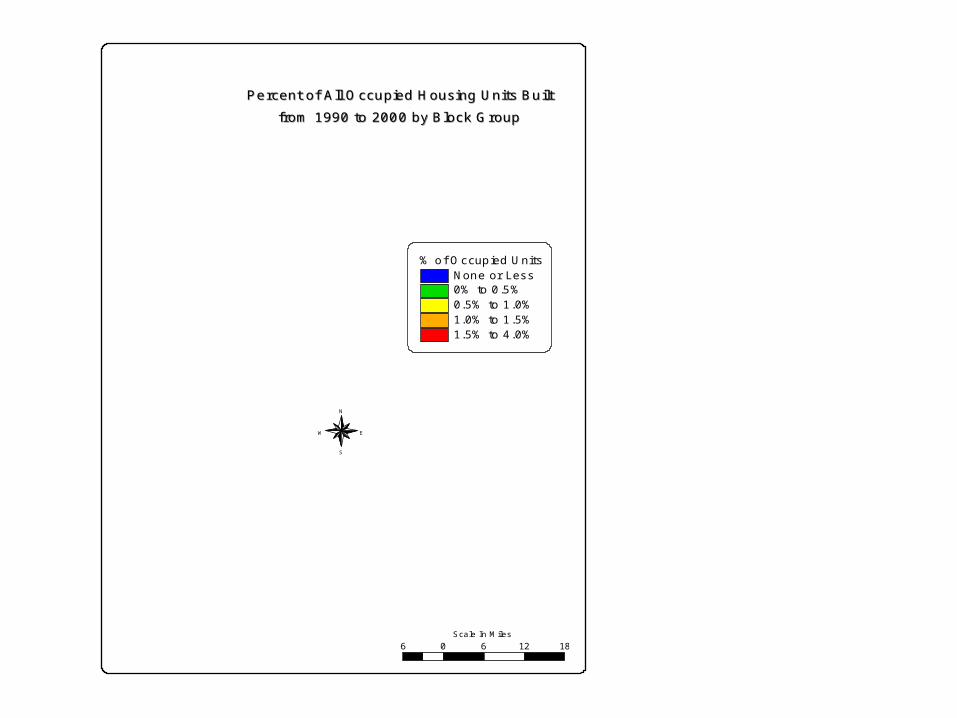
% of Occupied UnitsNone or Less0% to 0.5%0.5% to 1.0%1.0% to 1.5%1.5% to 4.0%
N
EW
S
Scale In Miles6 0 6 12 18 Miles
Percent of All Occupied Housing Units BuiltPercent of All Occupied Housing Units Built
from 1990 to 2000 by Block Groupfrom 1990 to 2000 by Block Group
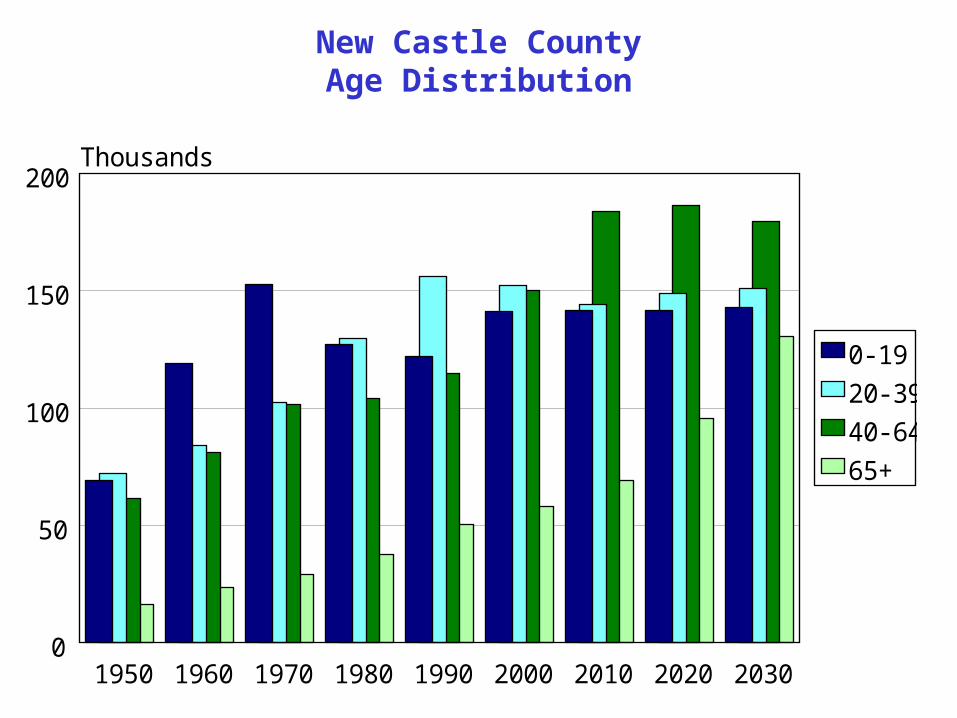
New Castle CountyAge Distribution
1950 1960 1970 1980 1990 2000 2010 2020 20300
50
100
150
200Thousands
0-19
20-39
40-64
65+
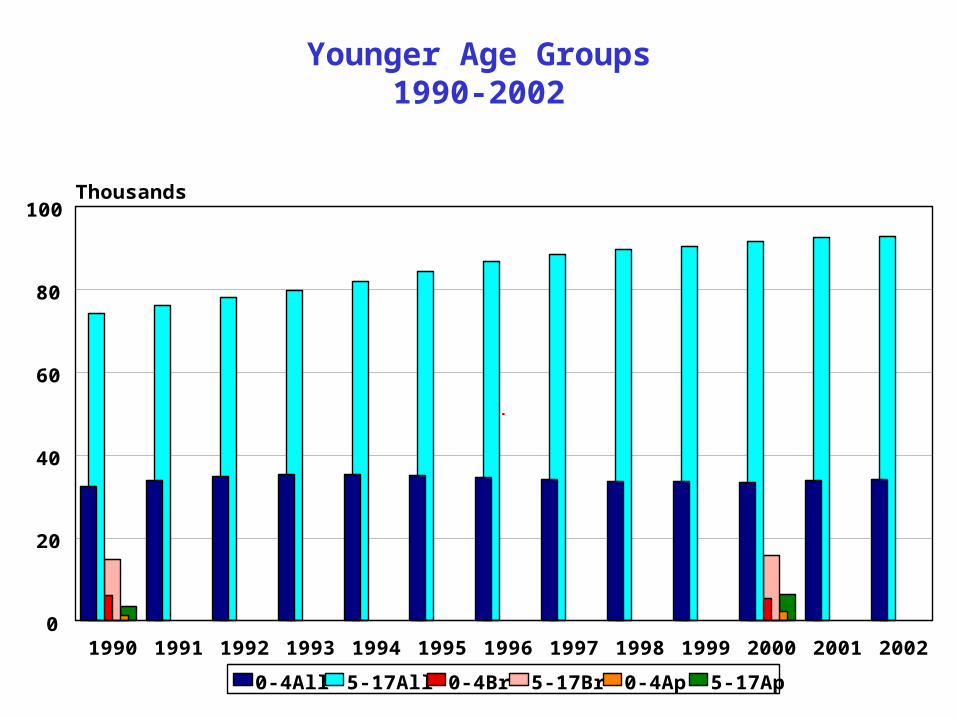
Younger Age Groups1990-2002
1990 1991 1992 1993 1994 1995 1996 1997 1998 1999 2000 2001 20020
20
40
60
80
100Thousands
0-4All 5-17All 0-4Br 5-17Br 0-4Ap 5-17Ap
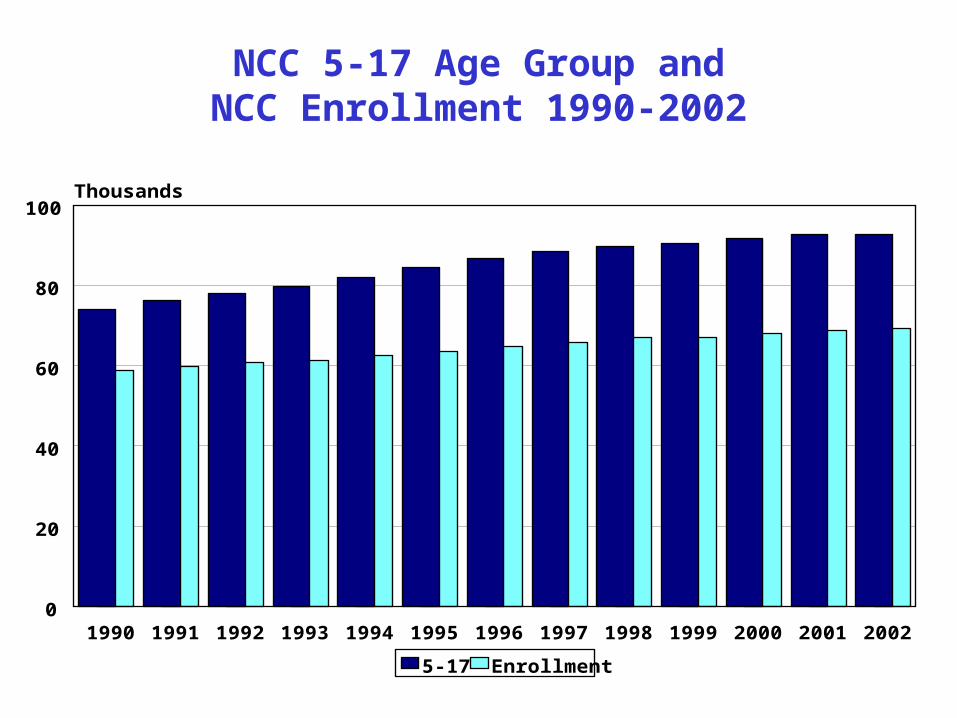
NCC 5-17 Age Group andNCC Enrollment 1990-2002
1990 1991 1992 1993 1994 1995 1996 1997 1998 1999 2000 2001 20020
20
40
60
80
100Thousands
5-17 Enrollment
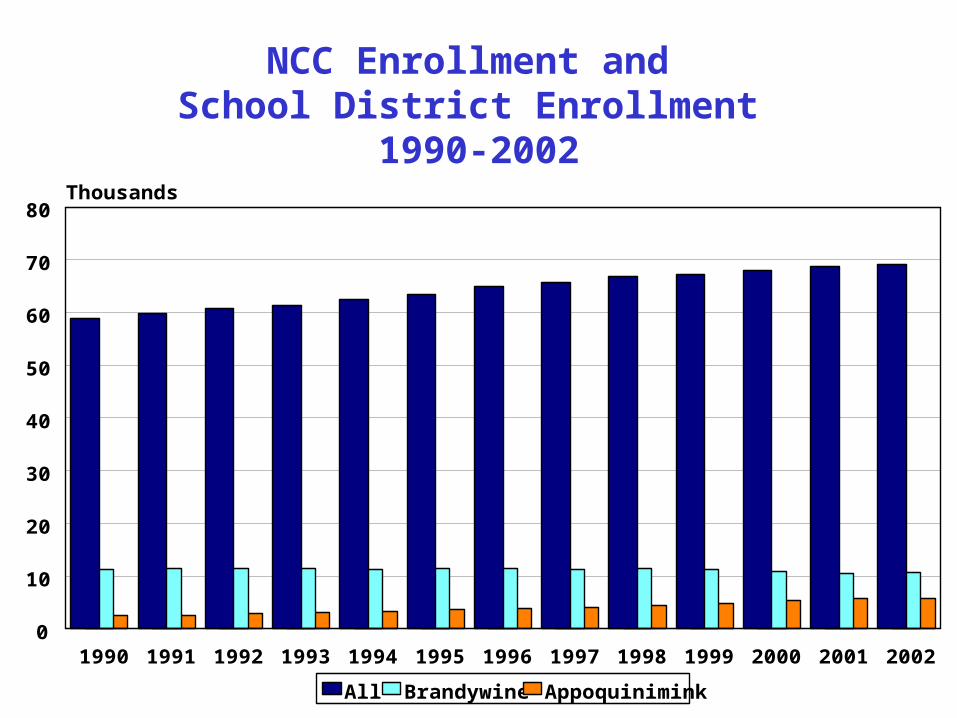
NCC Enrollment and School District Enrollment
1990-2002
1990 1991 1992 1993 1994 1995 1996 1997 1998 1999 2000 2001 20020
10
20
30
40
50
60
70
80Thousands
All Brandywine Appoquinimink
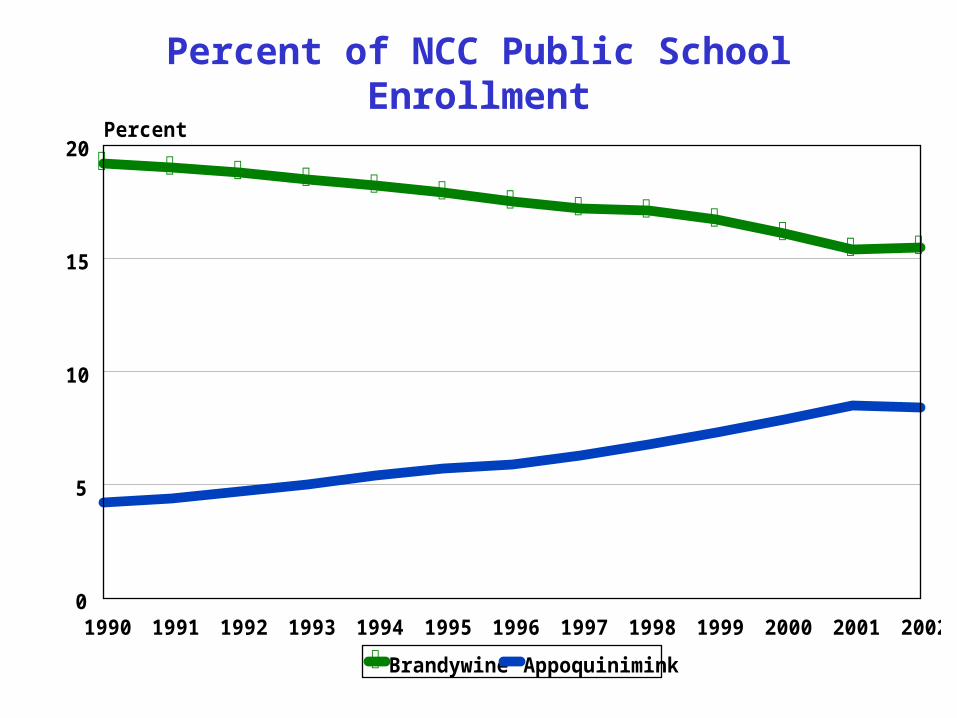
Percent of NCC Public School Enrollment
1990 1991 1992 1993 1994 1995 1996 1997 1998 1999 2000 2001 20020
5
10
15
20Percent
Brandywine Appoquinimink
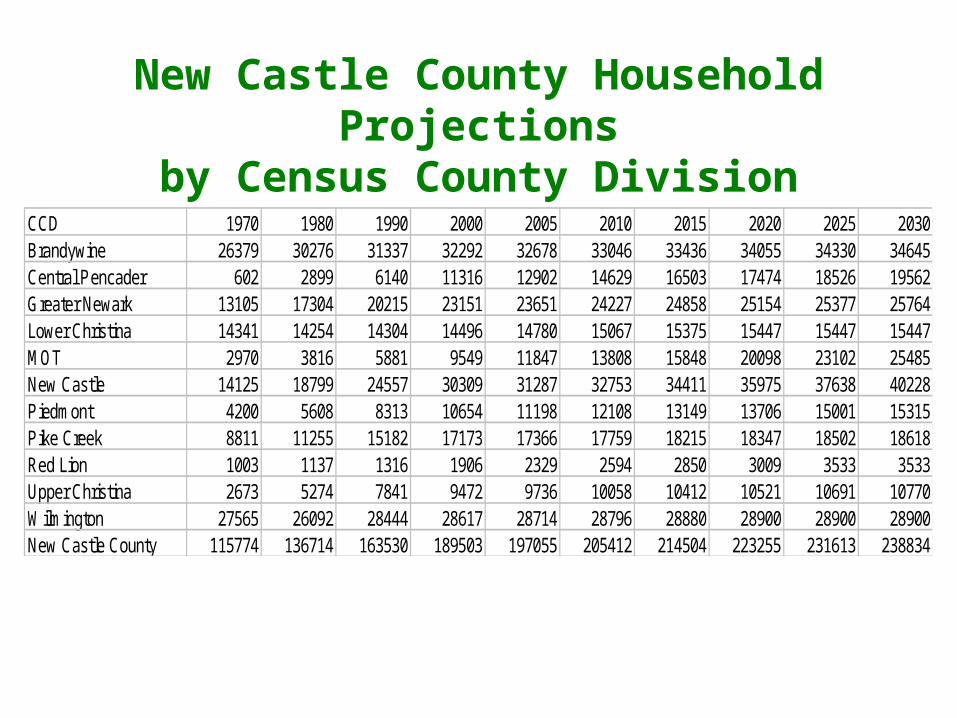
New Castle County Household Projectionsby Census County Division
CCD 1970 1980 1990 2000 2005 2010 2015 2020 2025 2030Brandywine 26379 30276 31337 32292 32678 33046 33436 34055 34330 34645Central Pencader 602 2899 6140 11316 12902 14629 16503 17474 18526 19562Greater Newark 13105 17304 20215 23151 23651 24227 24858 25154 25377 25764Lower Christina 14341 14254 14304 14496 14780 15067 15375 15447 15447 15447MOT 2970 3816 5881 9549 11847 13808 15848 20098 23102 25485New Castle 14125 18799 24557 30309 31287 32753 34411 35975 37638 40228Piedmont 4200 5608 8313 10654 11198 12108 13149 13706 15001 15315Pike Creek 8811 11255 15182 17173 17366 17759 18215 18347 18502 18618Red Lion 1003 1137 1316 1906 2329 2594 2850 3009 3533 3533Upper Christina 2673 5274 7841 9472 9736 10058 10412 10521 10691 10770Wilmington 27565 26092 28444 28617 28714 28796 28880 28900 28900 28900New Castle County 115774 136714 163530 189503 197055 205412 214504 223255 231613 238834
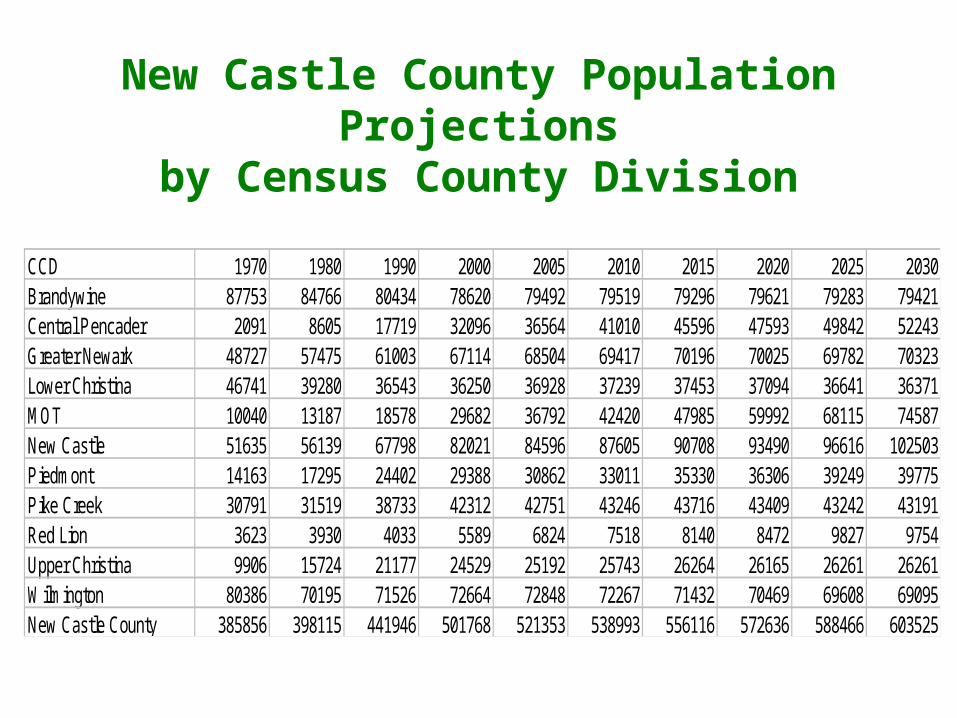
New Castle County Population Projectionsby Census County Division
CCD 1970 1980 1990 2000 2005 2010 2015 2020 2025 2030Brandywine 87753 84766 80434 78620 79492 79519 79296 79621 79283 79421Central Pencader 2091 8605 17719 32096 36564 41010 45596 47593 49842 52243Greater Newark 48727 57475 61003 67114 68504 69417 70196 70025 69782 70323Lower Christina 46741 39280 36543 36250 36928 37239 37453 37094 36641 36371MOT 10040 13187 18578 29682 36792 42420 47985 59992 68115 74587New Castle 51635 56139 67798 82021 84596 87605 90708 93490 96616 102503Piedmont 14163 17295 24402 29388 30862 33011 35330 36306 39249 39775Pike Creek 30791 31519 38733 42312 42751 43246 43716 43409 43242 43191Red Lion 3623 3930 4033 5589 6824 7518 8140 8472 9827 9754Upper Christina 9906 15724 21177 24529 25192 25743 26264 26165 26261 26261Wilmington 80386 70195 71526 72664 72848 72267 71432 70469 69608 69095New Castle County 385856 398115 441946 501768 521353 538993 556116 572636 588466 603525
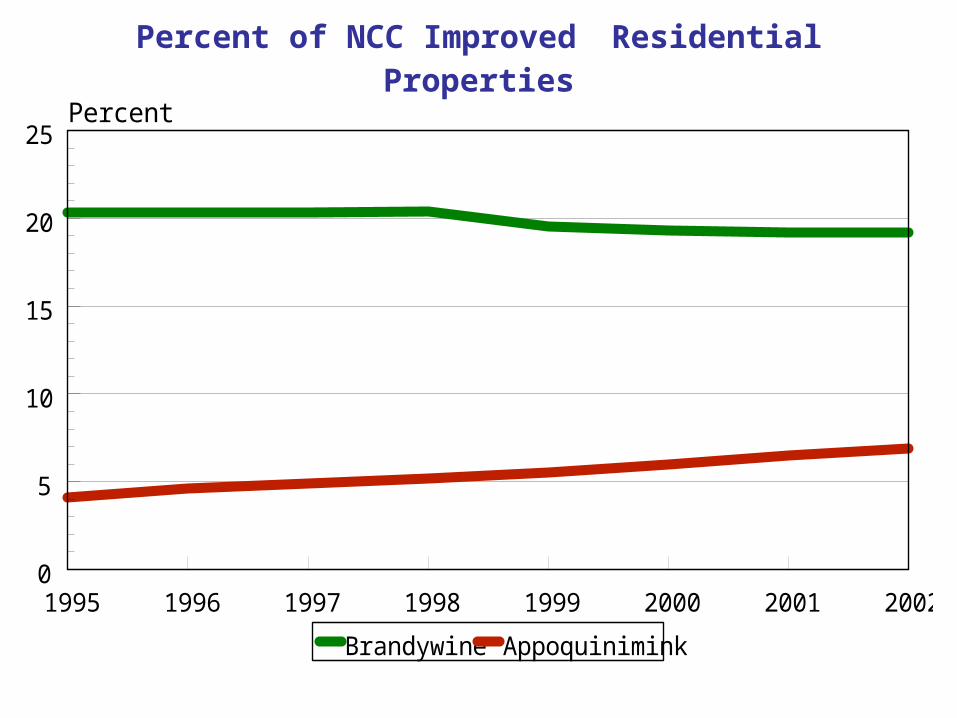
Percent of NCC Improved Residential Properties
1995 1996 1997 1998 1999 2000 2001 20020
5
10
15
20
25Percent
Brandywine Appoquinimink
Modified Grids for the State of Delaware
8 0 8 16 MilesScale In Miles
N
Modified Grid
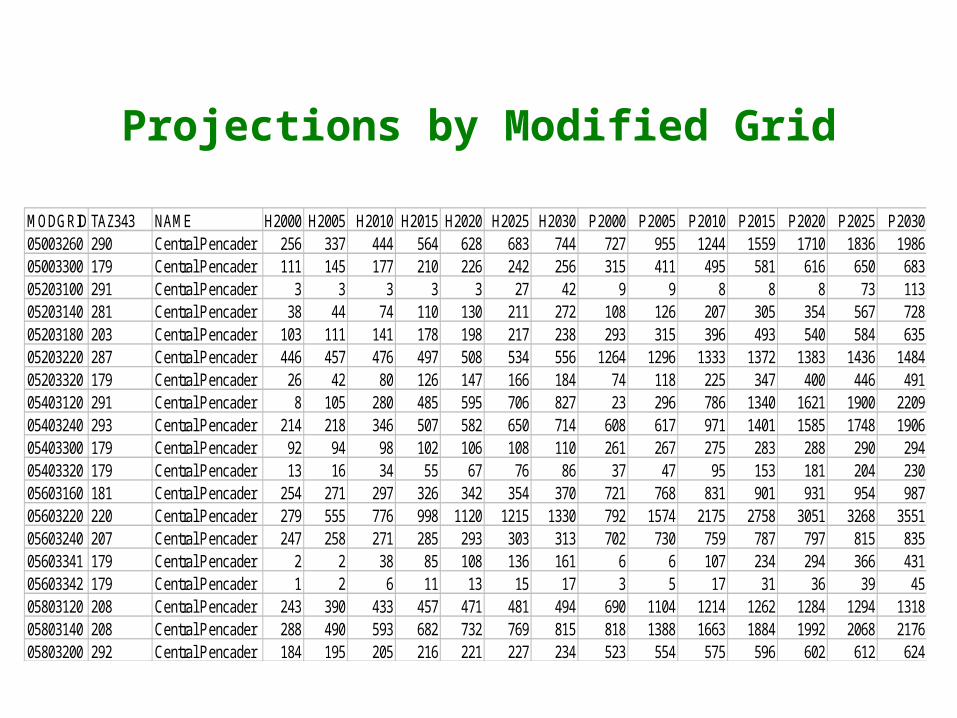
Projections by Modified Grid
MODGRID TAZ343 NAME H2000 H2005 H2010 H2015 H2020 H2025 H2030 P2000 P2005 P2010 P2015 P2020 P2025 P203005003260 290 Central Pencader 256 337 444 564 628 683 744 727 955 1244 1559 1710 1836 198605003300 179 Central Pencader 111 145 177 210 226 242 256 315 411 495 581 616 650 68305203100 291 Central Pencader 3 3 3 3 3 27 42 9 9 8 8 8 73 11305203140 281 Central Pencader 38 44 74 110 130 211 272 108 126 207 305 354 567 72805203180 203 Central Pencader 103 111 141 178 198 217 238 293 315 396 493 540 584 63505203220 287 Central Pencader 446 457 476 497 508 534 556 1264 1296 1333 1372 1383 1436 148405203320 179 Central Pencader 26 42 80 126 147 166 184 74 118 225 347 400 446 49105403120 291 Central Pencader 8 105 280 485 595 706 827 23 296 786 1340 1621 1900 220905403240 293 Central Pencader 214 218 346 507 582 650 714 608 617 971 1401 1585 1748 190605403300 179 Central Pencader 92 94 98 102 106 108 110 261 267 275 283 288 290 29405403320 179 Central Pencader 13 16 34 55 67 76 86 37 47 95 153 181 204 23005603160 181 Central Pencader 254 271 297 326 342 354 370 721 768 831 901 931 954 98705603220 220 Central Pencader 279 555 776 998 1120 1215 1330 792 1574 2175 2758 3051 3268 355105603240 207 Central Pencader 247 258 271 285 293 303 313 702 730 759 787 797 815 83505603341 179 Central Pencader 2 2 38 85 108 136 161 6 6 107 234 294 366 43105603342 179 Central Pencader 1 2 6 11 13 15 17 3 5 17 31 36 39 4505803120 208 Central Pencader 243 390 433 457 471 481 494 690 1104 1214 1262 1284 1294 131805803140 208 Central Pencader 288 490 593 682 732 769 815 818 1388 1663 1884 1992 2068 217605803200 292 Central Pencader 184 195 205 216 221 227 234 523 554 575 596 602 612 624
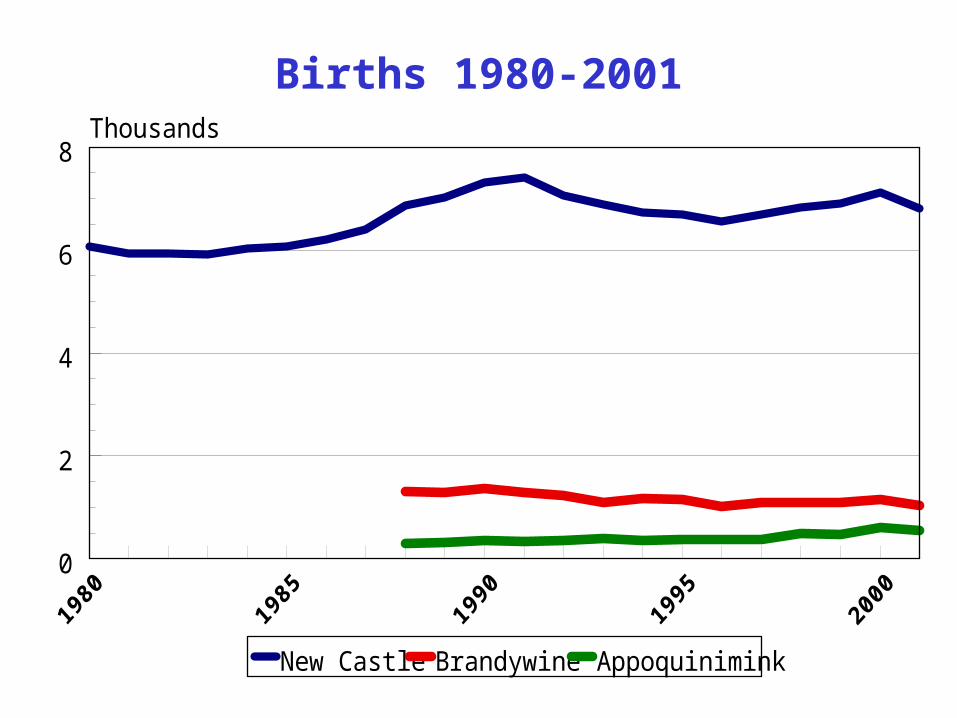
Births 1980-2001
0
2
4
6
8Thousands
New Castle Brandywine Appoquinimink
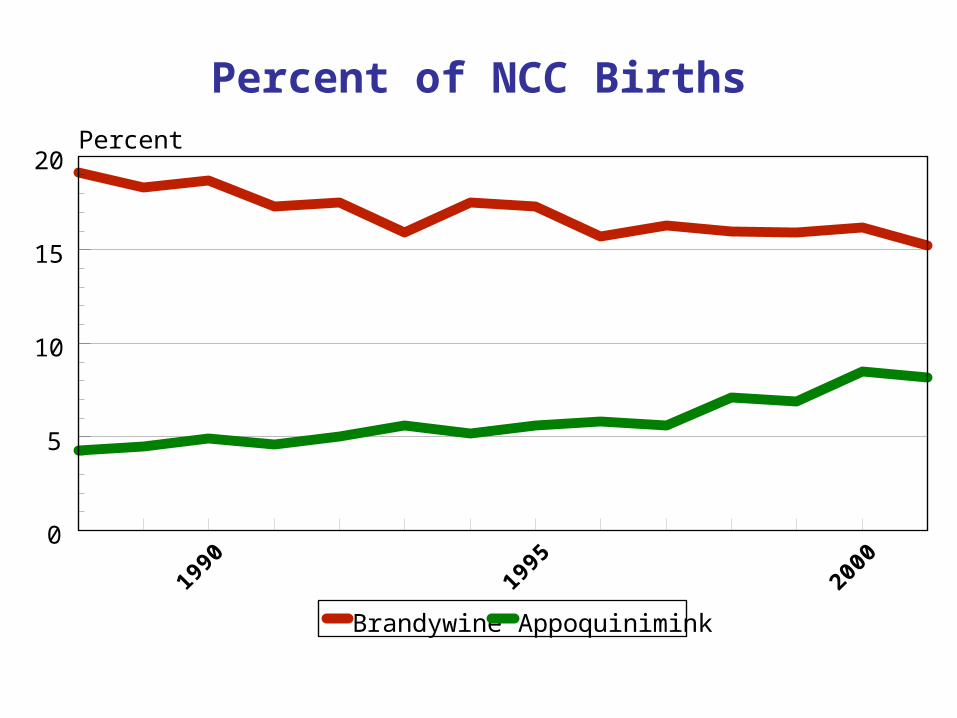
Percent of NCC Births
0
5
10
15
20Percent
Brandywine Appoquinimink
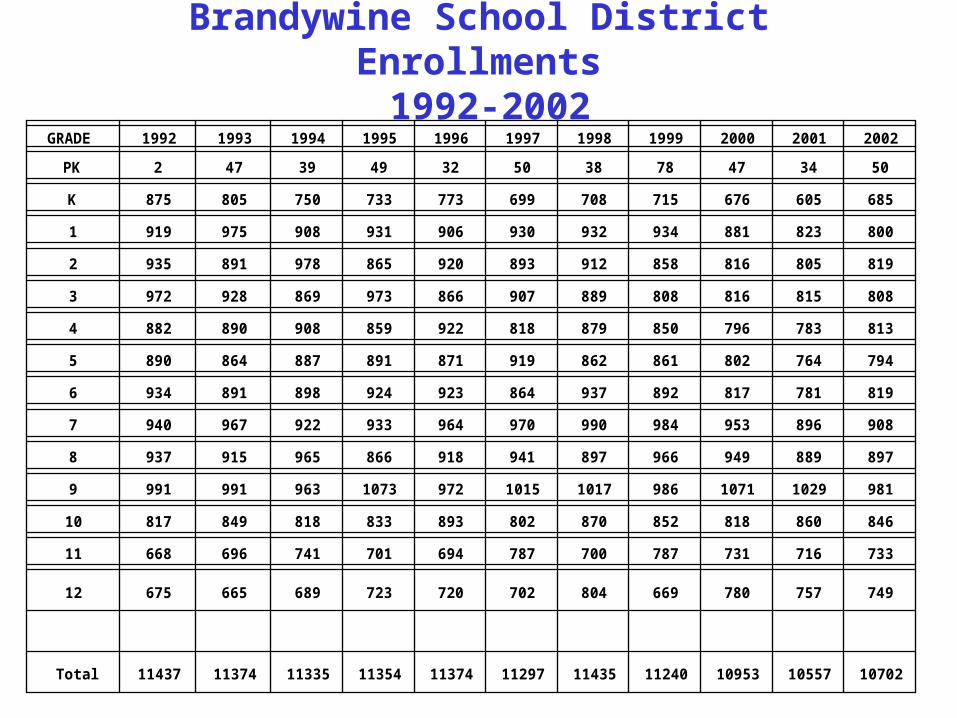
Brandywine School District Enrollments 1992-2002
GRADE 1992 1993 1994 1995 1996 1997 1998 1999 2000 2001 2002
PK 2 47 39 49 32 50 38 78 47 34 50
K 875 805 750 733 773 699 708 715 676 605 685
1 919 975 908 931 906 930 932 934 881 823 800
2 935 891 978 865 920 893 912 858 816 805 819
3 972 928 869 973 866 907 889 808 816 815 808
4 882 890 908 859 922 818 879 850 796 783 813
5 890 864 887 891 871 919 862 861 802 764 794
6 934 891 898 924 923 864 937 892 817 781 819
7 940 967 922 933 964 970 990 984 953 896 908
8 937 915 965 866 918 941 897 966 949 889 897
9 991 991 963 1073 972 1015 1017 986 1071 1029 981
10 817 849 818 833 893 802 870 852 818 860 846
11 668 696 741 701 694 787 700 787 731 716 733
12 675 665 689 723 720 702 804 669 780 757 749
Total 11437 11374 11335 11354 11374 11297 11435 11240 10953 10557 10702
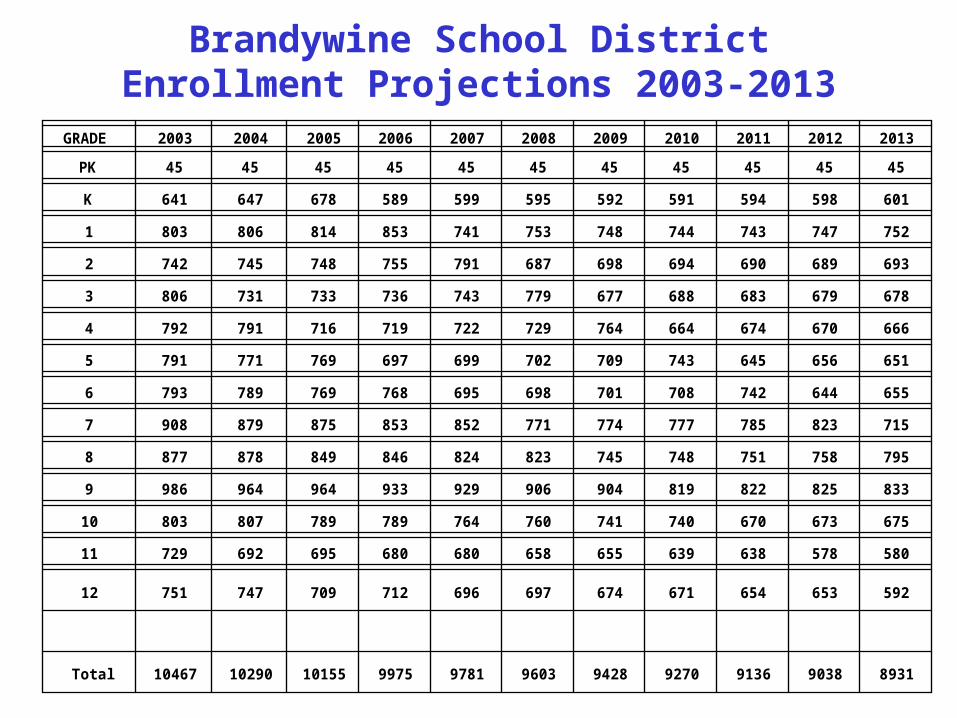
Brandywine School DistrictEnrollment Projections 2003-2013
GRADE 2003 2004 2005 2006 2007 2008 2009 2010 2011 2012 2013
PK 45 45 45 45 45 45 45 45 45 45 45
K 641 647 678 589 599 595 592 591 594 598 601
1 803 806 814 853 741 753 748 744 743 747 752
2 742 745 748 755 791 687 698 694 690 689 693
3 806 731 733 736 743 779 677 688 683 679 678
4 792 791 716 719 722 729 764 664 674 670 666
5 791 771 769 697 699 702 709 743 645 656 651
6 793 789 769 768 695 698 701 708 742 644 655
7 908 879 875 853 852 771 774 777 785 823 715
8 877 878 849 846 824 823 745 748 751 758 795
9 986 964 964 933 929 906 904 819 822 825 833
10 803 807 789 789 764 760 741 740 670 673 675
11 729 692 695 680 680 658 655 639 638 578 580
12 751 747 709 712 696 697 674 671 654 653 592
Total 10467 10290 10155 9975 9781 9603 9428 9270 9136 9038 8931
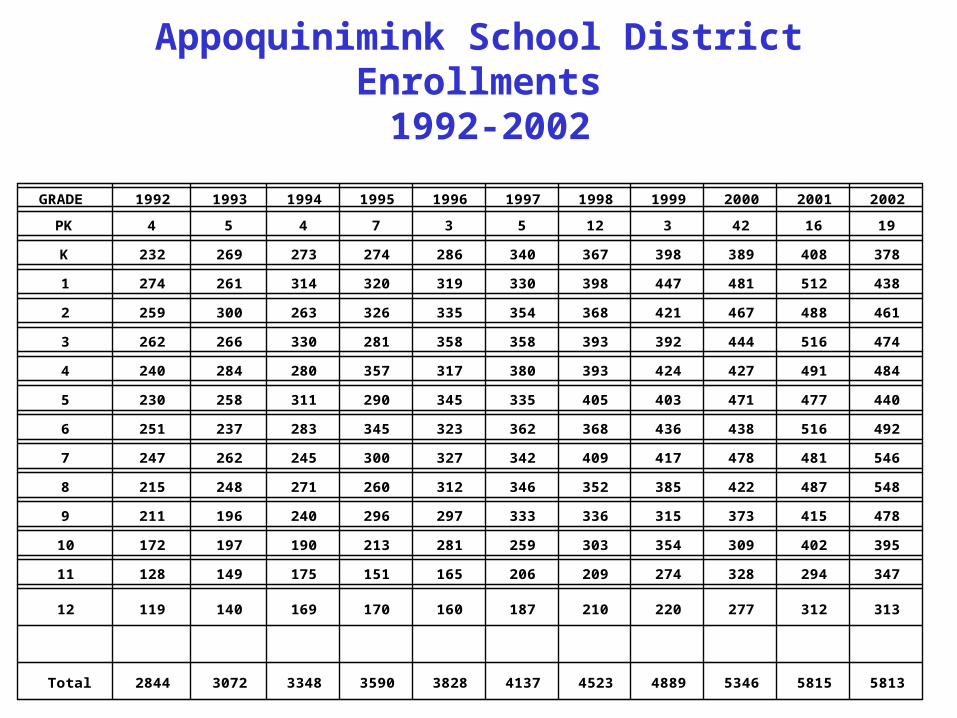
Appoquinimink School District Enrollments 1992-2002
GRADE 1992 1993 1994 1995 1996 1997 1998 1999 2000 2001 2002
PK 4 5 4 7 3 5 12 3 42 16 19
K 232 269 273 274 286 340 367 398 389 408 378
1 274 261 314 320 319 330 398 447 481 512 438
2 259 300 263 326 335 354 368 421 467 488 461
3 262 266 330 281 358 358 393 392 444 516 474
4 240 284 280 357 317 380 393 424 427 491 484
5 230 258 311 290 345 335 405 403 471 477 440
6 251 237 283 345 323 362 368 436 438 516 492
7 247 262 245 300 327 342 409 417 478 481 546
8 215 248 271 260 312 346 352 385 422 487 548
9 211 196 240 296 297 333 336 315 373 415 478
10 172 197 190 213 281 259 303 354 309 402 395
11 128 149 175 151 165 206 209 274 328 294 347
12 119 140 169 170 160 187 210 220 277 312 313
Total 2844 3072 3348 3590 3828 4137 4523 4889 5346 5815 5813
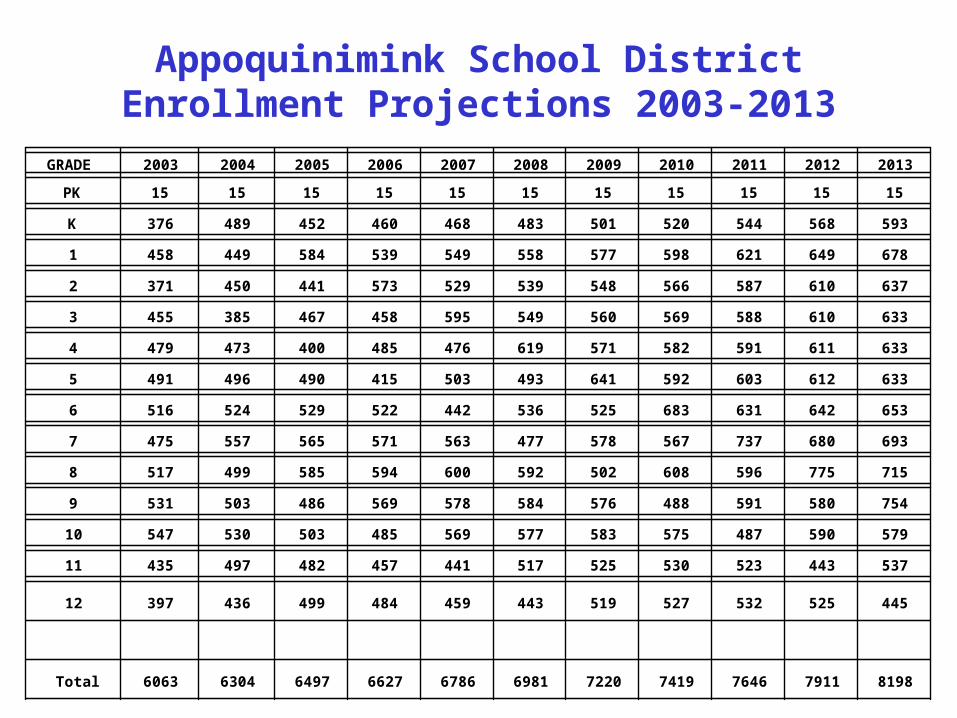
Appoquinimink School DistrictEnrollment Projections 2003-2013
GRADE 2003 2004 2005 2006 2007 2008 2009 2010 2011 2012 2013
PK 15 15 15 15 15 15 15 15 15 15 15
K 376 489 452 460 468 483 501 520 544 568 593
1 458 449 584 539 549 558 577 598 621 649 678
2 371 450 441 573 529 539 548 566 587 610 637
3 455 385 467 458 595 549 560 569 588 610 633
4 479 473 400 485 476 619 571 582 591 611 633
5 491 496 490 415 503 493 641 592 603 612 633
6 516 524 529 522 442 536 525 683 631 642 653
7 475 557 565 571 563 477 578 567 737 680 693
8 517 499 585 594 600 592 502 608 596 775 715
9 531 503 486 569 578 584 576 488 591 580 754
10 547 530 503 485 569 577 583 575 487 590 579
11 435 497 482 457 441 517 525 530 523 443 537
12 397 436 499 484 459 443 519 527 532 525 445
Total 6063 6304 6497 6627 6786 6981 7220 7419 7646 7911 8198