Embed Size (px)
DESCRIPTION
Web Tools for Enrollment Management. By Ken Meehan, Research, Fullerton College Bob Hughes, I.S. NOCCCD Deborah Ludford, I. S. NOCCCD. Agenda. Welcome and Introductions - Deborah History and Development - Deborah Demonstration of Product – Ken Technical Aspects of Development – Bob - PowerPoint PPT Presentation
Citation preview

Building an Information Community: IT and Research Working Together
Web Tools for Enrollment
ManagementBy
Ken Meehan, Research, Fullerton College
Bob Hughes, I.S. NOCCCDDeborah Ludford, I. S. NOCCCD

Agenda
• Welcome and Introductions - Deborah
• History and Development - Deborah
• Demonstration of Product – Ken • Technical Aspects of Development
– Bob• Questions and Answers – Deborah

History & Development
• Identified a need to track FTES at the campus level – Fullerton College– Identifying Essential Information– Defining the domain– Specification of Variables
• Meeting with Information Services - 2001• Hired consultants to work with
Information Services and campus researchers to develop a set of tools beginning with Current Enrollments

History and Development
• Refinement of Current Enrollment– Cross-listed sections– Shared FTEF– Census enrollment
• Enrollment Projection Report– Projecting positive attendance– Choice of appropriate terms
• Five Year Comparison Report

Training
• Presentation at Presidents Staff• Demonstration at Deans Council• Annual Updates and New Deans• Development of ER Light• Use by Deans and Chairs• Correction of Contact Hours• Evaluation at End of Term• Current Focus on Maximizing FTES

Demonstration
• Current enrollment Reporthttps://www.banner-forms.nocccd.cc.ca.us/reports/researchers/currentenrollment/index.jsp
• Projected enrollment Reporthttps://www.banner-forms.nocccd.cc.ca.us/reports/researchers/enrollmentprojection/index.jsp
• Five –Year Comparison Reporthttps://www.banner-forms.nocccd.cc.ca.us/reports/researchers/fiveyear/index.jsp
• Capturing in Excel and SPSS• Daily Reporting to President and CIO

Current Enrollment

Current Enrollment

Enrollment Projections

Enrollment Projections

Five-Year Trends
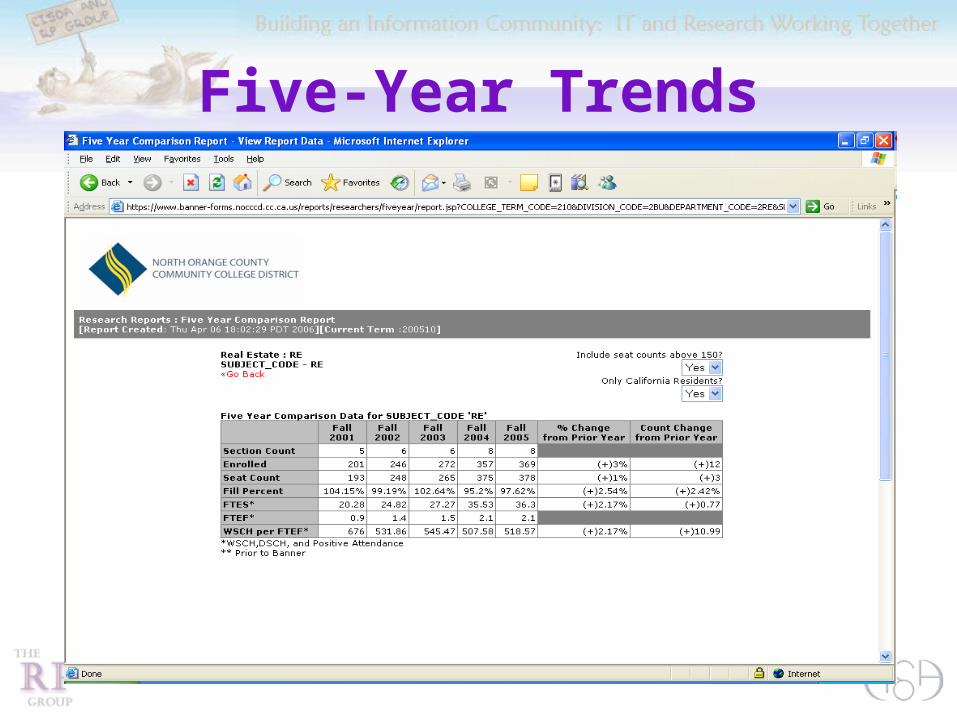
Five-Year Trends

Project Timeline
• April 2003 – project design approved• July 2003 – Current Enrollment in
production• Nov 2003 – Historical trends delivered;
(performance issues needed to be addressed)
• April 2004 – Historical Trends in production
• May 2004 – Projected Enrollment in production

Technical Details
• PL/SQL procedures run to populate 3 tables:– CurrentEnrollment– FiveYear– EnrollmentProjection
• JavaServer Pages are used to display the results
• PL/SQL functions provide aggregate data made up of elements within the underlying table

Current Enrollment
• Up to 2 weeks of daily enrollment activity is captured per college, per term
• PL/SQL procedure run automatically on a nightly basis to populate a single table
• 86 columns, 104,827 rows (3 terms)
• Data captured at the CRN (section) level

Enrollment Projection
• Current term, 2 future terms, and 4 past terms are captured per college
• PL/SQL procedure run automatically on a nightly basis to populate a single table
• 86 columns, 20,884 rows
• Data captured at the CRN (section) level

Five Year Comparison
• One row per course for each college and term is stored following MIS reporting for the prior term
• 84 columns, 61,604 rows (29 terms)
• Data captured at the course level

Issue 1 – Attendance Methods
• Handling various attendance methods (Weekly, Daily, Positive Attendance)
• Aggregate totals needed separate functions to keep PA courses from being calculated in FTES
• Attendance methods for some courses changed from term to term

Issue 2 – Cross Listed Courses
• Some cross-listed courses would be entered with max seats at each CRN:– Cross List group has 45 seats
• Class 1 has 45 seats• Class 2 has 45 seats• Class 3 has 45 seats
• Some cross-listed courses would be entered with counts unique to each CRN– Cross List group has 45 seats
• Class 1 has 20 seats• Class 2 has 15 seats• Class 3 has 10 seats

Cross List Compromise
• We ended up using the class in the cross-list group scheduled with the highest number of seats
• Doesn’t work well when courses cross departments

Issue 3 – Projection Basis
• Enrollment Projection report uses a ‘projected FTES’ at the class (CRN) level
• Populated by a function based on averages from previous terms
• Which terms to include?– X number of prior terms?– X number of prior “like” terms?– Exclude “unique” terms due to construction,
other issues?– How to project Summer?

Requested Future Enhancements
• Ability to see historical trends alongside current enrollment
• Display data graphically
• Allow projections to be entered at the CRN level