Embed Size (px)
Citation preview
CPEC
Community College Enrollment Demand Projections, 2009–2019
www.cpec.ca.gov Report 09-28 December 2009 by Stacy Wilson, Ryan Fuller, and Mallory Newell
READY OR NOT, HERE THEY COME
CPEC conducts policy research and analysis to support long-range planning and student success. In 1995, CPEC estimated correctly that more than 455,000 additional students would seek enrollment at California public col-leges and universities by 2005. During the following seven consecutive years of economic expansion, the state made good on its commitment of providing educational opportunity to all qualified prospective students, most of whom enrolled in a community college.
Today, California is confronting unprecedented economic and fiscal challenges, and the state’s Master Plan com-mitment of educational opportunity is being tested again. In this report, CPEC estimates that the state should prepare for 313,000 additional community college students by 2019. Community colleges currently serve nearly 3 million students annually. Beginning in fall 2011, the system will be asked for the first time to serve more than 2 million students each fall term. If the system finds it necessary to reduce enrollments because of reduced fund-ing, over 365,000 prospective students might be denied access to community college education by fall 2010.
Each person here represents 16,000 additional community college students of all backgrounds expected between 2009 and 2019, if the state provides adequate funding.
2 • California Postsecondary Education Commission
Contents
Community College Forecast Summary 4
Impetus for the Report 5
Community College Enrollment Demand Analysis 7
Community College Classroom Capacity Analysis 11 Background 11 State Classroom Space and Utilization Standards 12
Appendix A 18
Appendix B 20
List of Displays
Display 1 Mid-Range Forecast of Community College Enrollment Demand, 2008–2019 by Ethnicity 7
Display 2 Population Projections by Ethnic Group, 2008–2019, Ages 14 and over 8
Display 3 Population Projections by Ethnic Group, 2008–2019, Ages 14 to 49 8
Display 4 Baseline Forecast, 2008–2019 by Ethnicity 11
Display 5 State-Adopted Space and Utilization Standards for Lecture Classrooms 12
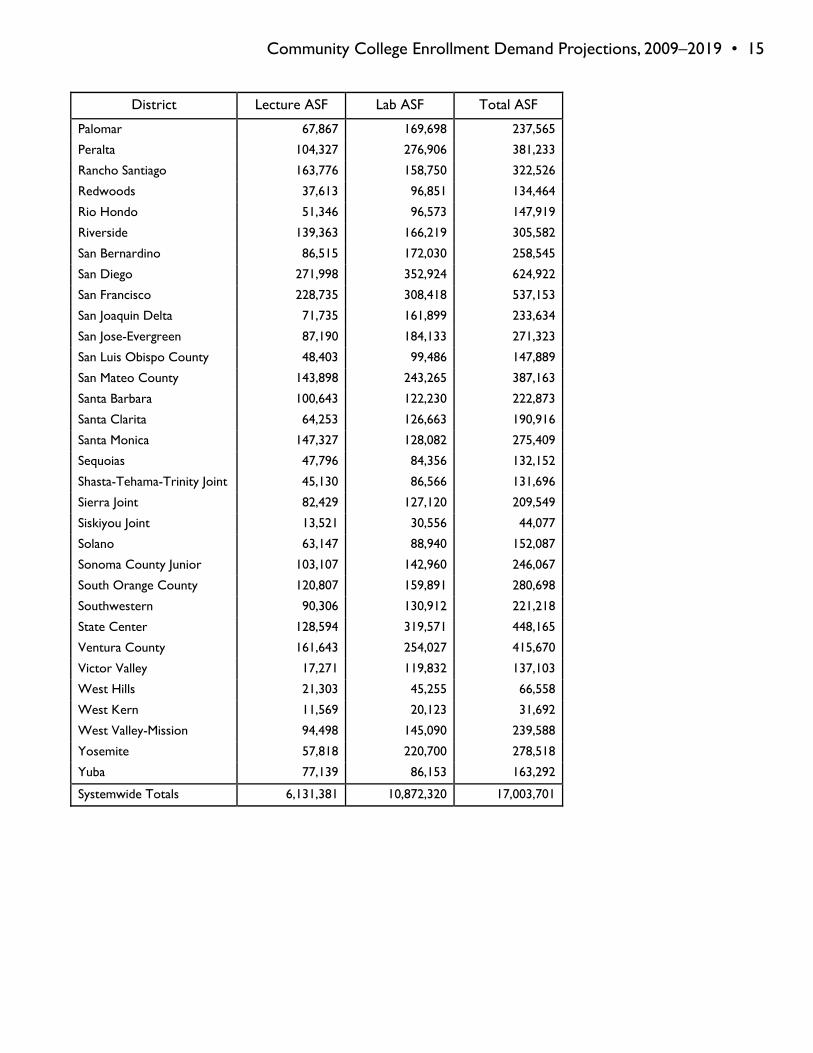
Display 6 Current Lecture and Laboratory ASF by District 14
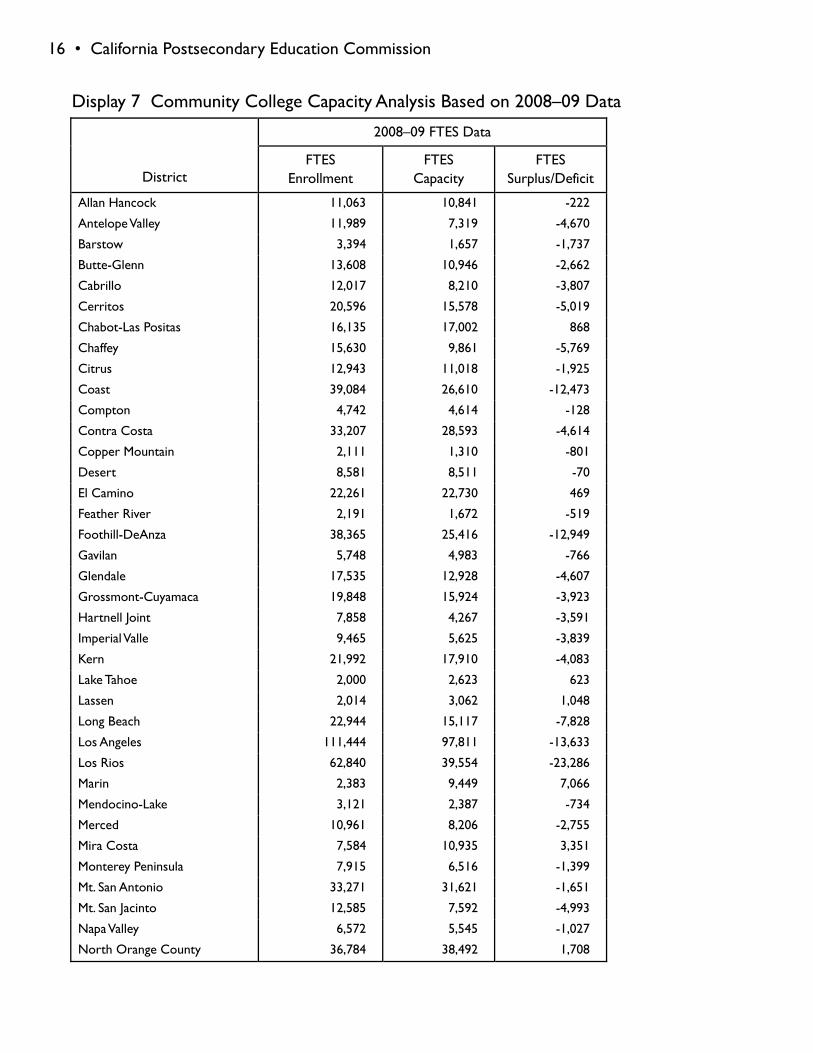
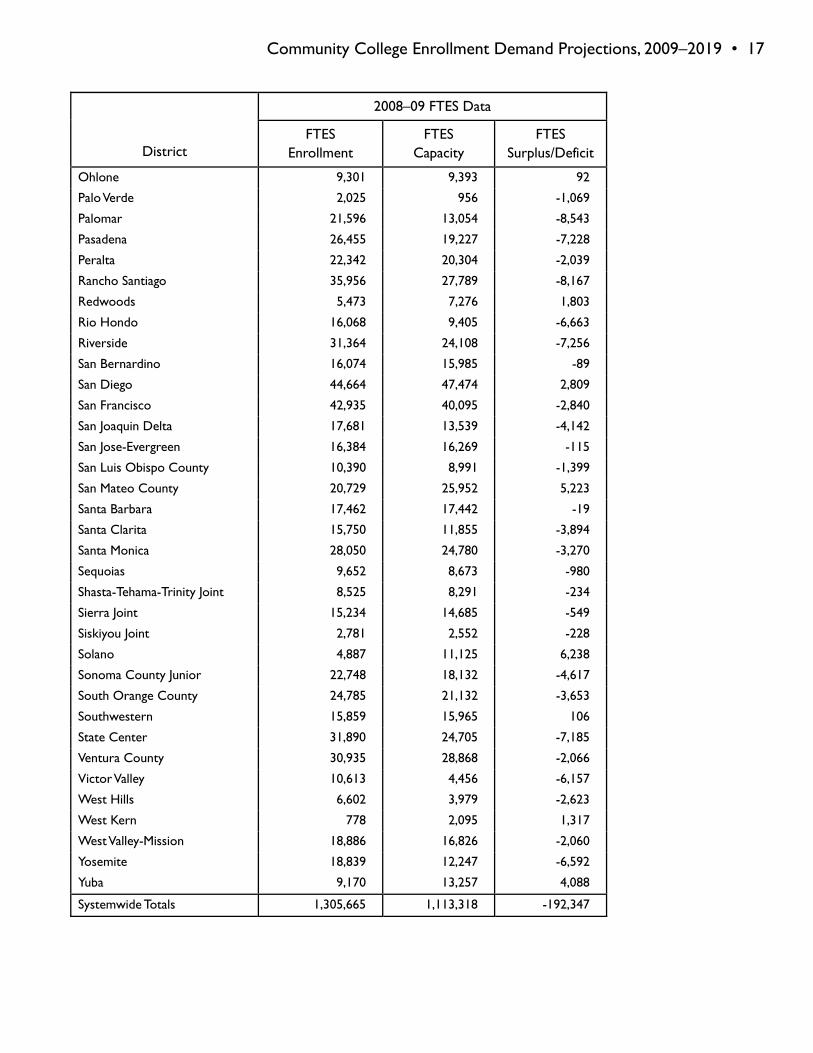
Display 7 Community College Capacity Analysis Based on 2008–09 Data 16
List of Figures
Figure 1 CPEC Mid-Range and Baseline Enrollment Demand, 2009–2019 4
Figure 2 Community College Enrollment by Age Group, 2008 9
Figure 3 Loss in College Opportunity Worksheet 10
Community College Enrollment Demand Projections, 2009–2019 • 3
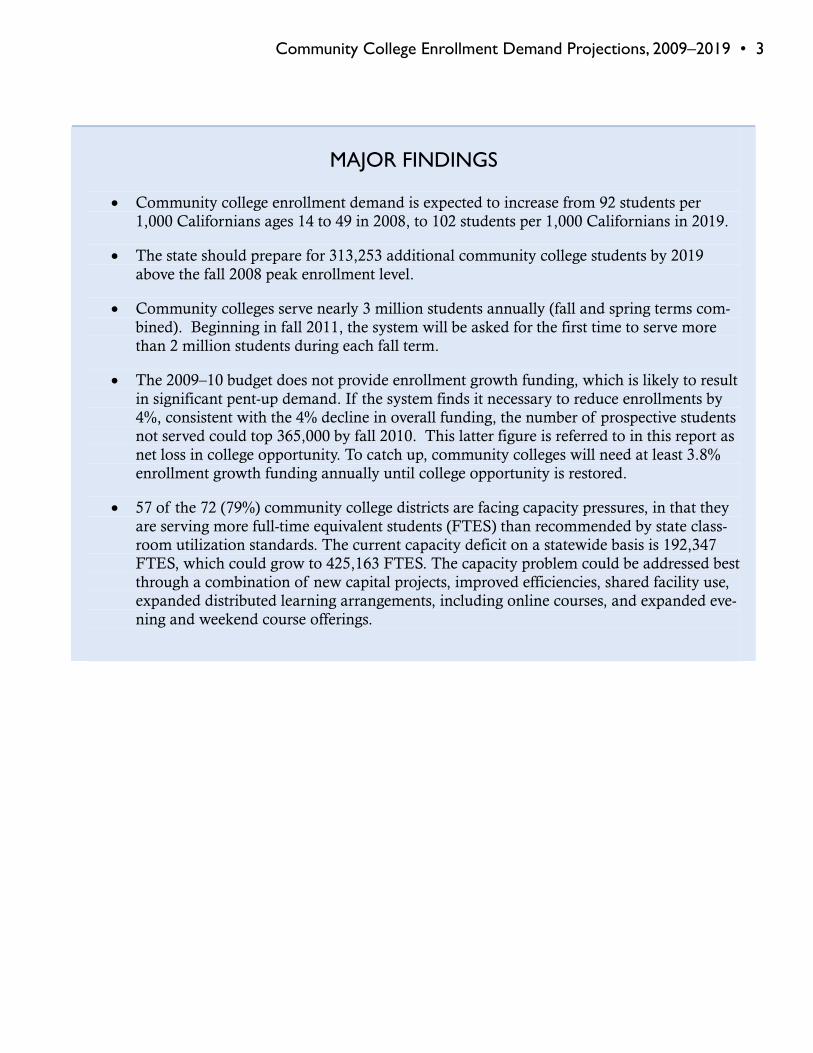
MAJOR FINDINGS
Community college enrollment demand is expected to increase from 92 students per 1,000 Californians ages 14 to 49 in 2008, to 102 students per 1,000 Californians in 2019.
The state should prepare for 313,253 additional community college students by 2019 above the fall 2008 peak enrollment level.
Community colleges serve nearly 3 million students annually (fall and spring terms com-bined). Beginning in fall 2011, the system will be asked for the first time to serve more than 2 million students during each fall term.
The 2009–10 budget does not provide enrollment growth funding, which is likely to result in significant pent-up demand. If the system finds it necessary to reduce enrollments by 4%, consistent with the 4% decline in overall funding, the number of prospective students not served could top 365,000 by fall 2010. This latter figure is referred to in this report as net loss in college opportunity. To catch up, community colleges will need at least 3.8% enrollment growth funding annually until college opportunity is restored.
57 of the 72 (79%) community college districts are facing capacity pressures, in that they are serving more full-time equivalent students (FTES) than recommended by state class-room utilization standards. The current capacity deficit on a statewide basis is 192,347 FTES, which could grow to 425,163 FTES. The capacity problem could be addressed best through a combination of new capital projects, improved efficiencies, shared facility use, expanded distributed learning arrangements, including online courses, and expanded eve-ning and weekend course offerings.
4 • California Postsecondary Education Commission
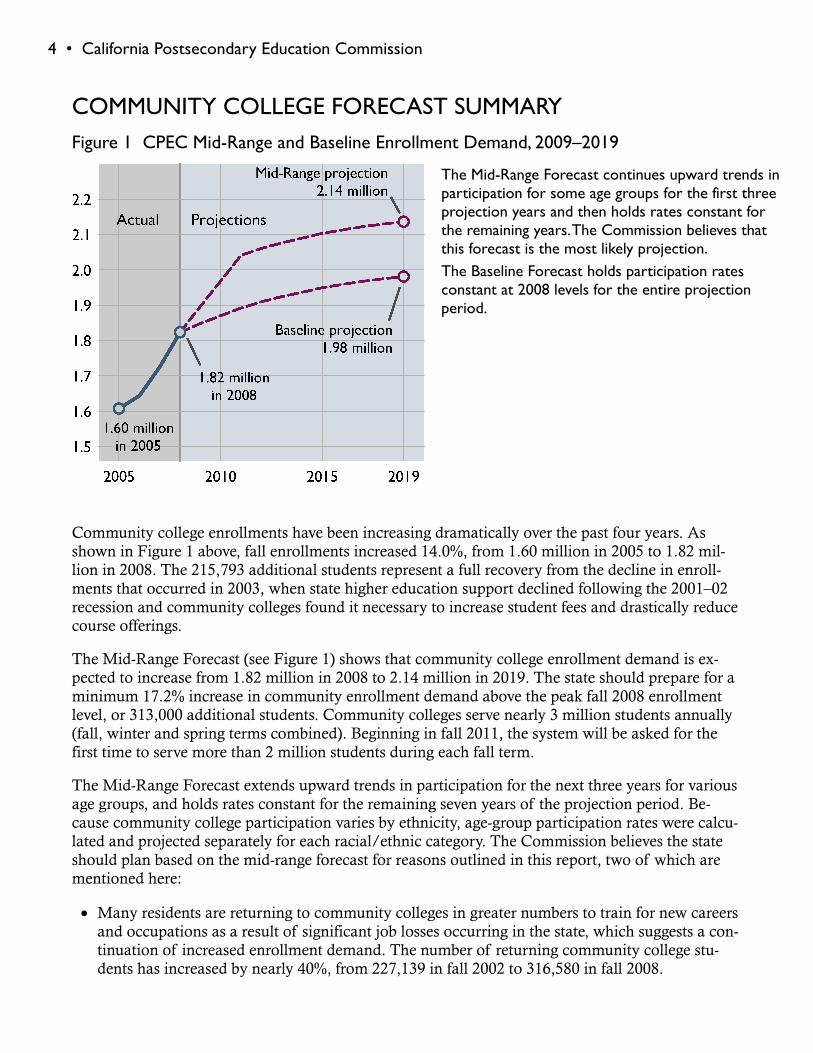
COMMUNITY COLLEGE FORECAST SUMMARY Figure 1 CPEC Mid-Range and Baseline Enrollment Demand, 2009–2019
The Mid-Range Forecast continues upward trends in participation for some age groups for the first three projection years and then holds rates constant for the remaining years. The Commission believes that this forecast is the most likely projection. The Baseline Forecast holds participation rates constant at 2008 levels for the entire projection period.
Community college enrollments have been increasing dramatically over the past four years. As shown in Figure 1 above, fall enrollments increased 14.0%, from 1.60 million in 2005 to 1.82 mil-lion in 2008. The 215,793 additional students represent a full recovery from the decline in enroll-ments that occurred in 2003, when state higher education support declined following the 2001–02 recession and community colleges found it necessary to increase student fees and drastically reduce course offerings.
The Mid-Range Forecast (see Figure 1) shows that community college enrollment demand is ex-pected to increase from 1.82 million in 2008 to 2.14 million in 2019. The state should prepare for a minimum 17.2% increase in community enrollment demand above the peak fall 2008 enrollment level, or 313,000 additional students. Community colleges serve nearly 3 million students annually (fall, winter and spring terms combined). Beginning in fall 2011, the system will be asked for the first time to serve more than 2 million students during each fall term.
The Mid-Range Forecast extends upward trends in participation for the next three years for various age groups, and holds rates constant for the remaining seven years of the projection period. Be-cause community college participation varies by ethnicity, age-group participation rates were calcu-lated and projected separately for each racial/ethnic category. The Commission believes the state should plan based on the mid-range forecast for reasons outlined in this report, two of which are mentioned here:
Many residents are returning to community colleges in greater numbers to train for new careers and occupations as a result of significant job losses occurring in the state, which suggests a con-tinuation of increased enrollment demand. The number of returning community college stu-dents has increased by nearly 40%, from 227,139 in fall 2002 to 316,580 in fall 2008.
Community College Enrollment Demand Projections, 2009–2019 • 5
UC and CSU are finding it necessary to increase fees, furlough faculty, and limit future enroll-ments, which suggests that many students may have to complete their first two years of instruc-tion at community colleges before transferring to four-year institutions.
The greatest challenge will be in the near term, when enrollments are expected to increase by 3.8% annually, before tapering off significantly during the latter projection period. If economic condi-tions were more favorable, then funding this level of enrollment growth would be manageable. Be-cause the community college system is scheduled to receive a 4% decline in funding, the loss in community college opportunity and access could be substantial if the system finds it necessary to reduce enrollment by a like percentage. Reducing enrollments by 4% results in a net decline of col-lege opportunity of 364,000 students by fall 2010. However, preliminary fall 2009 data indicate that district enrollments generally exceeded budgeted FTE enrollment allocations, which means that the loss in college opportunity will not be as large as estimated here.
The Baseline Forecast should be regarded as a low alternative because it holds participation rates constant at 2008 levels. It estimates the increase in community college enrollment demand due solely to population growth. The forecast shows community college demand increasing from 1.82 million students in 2008 to 1.98 million in 2019. The growth represents an 8.7% increase in enroll-ment demand, or 157,981 additional students.
Analyses of lecture and laboratory capacity indicate that 57 of 72 (79%) community college dis-tricts are experiencing physical capacity pressures by serving more full-time equivalent students (FTES) than implied by state-adopted utilization standards. statewide, the system is experiencing a net capacity deficit of 192,000 FTES. If the system is unable to increase classroom capacity, the net capacity deficit would grow to 425,163 FTES in 2019. This report includes strategies for enhancing institutional capacity.
IMPETUS FOR THE REPORT The community college enrollment projection is the first in the Ready or Not, Here They Come series that will be developed over the next six months. Community college projections were derived first because the system is the largest in the state, and it accounts for about 75% of undergraduate de-mand in any given year.
The complete series will update CPEC’s statewide enrollment demand and institutional capacity reports published in 1995 and 2000. It is intended to support higher education long-range planning and assist the Governor and the Legislature during budgetary and policy deliberations. It will pro-vide informed and valid projections of the demand for public undergraduate higher education over the next ten years and estimates of classroom lecture and laboratory capacity needed to maximize student success.
More specifically, enrollment and capacity data will be used to address the following questions:
What level of public investment is required to fully fund undergraduate enrollment demand over the next ten years?
What level of capital outlay investment is needed to expand the physical capacity of institutions to meet enrollment demand?
6 • California Postsecondary Education Commission
What cost-cutting efficiencies should be explored as viable alternatives to constructing new classroom facilities?
What is the magnitude of the educational opportunity gap that might result if the state is un-able or unwilling to fully fund undergraduate enrollment demand in the near term? The impli-cations associated with reduced access will be fully explored as CPEC staff continue with this series of reports.
If the University of California and California State University implement plans to reduce first-time freshman enrollment in the near term, what additional funding would the community col-lege system need to accommodate redirected students?
The next several planning years will be challenging for both the state and public colleges and uni-versities. To say that California’s public higher education systems will find it difficult to meet stu-dent demand in the near term while faced with reduced state support could be considered an un-derstatement. Although preliminary signs indicate that the national economy is poised to grow again, albeit slowly, those signs are not yet as pronounced in the Golden State, and higher educa-tion institutions are being asked to stretch dollars to compensate for reduced public funding.
The October 2009 budget update released by the Legislative Analyst’s Office indicates that the $10.4 billion in state higher education support for 2009–10 is approximately $1.3 billion less than provided in 2007–08. Because of the decline, and because of uncertainties in funds forthcoming from the federal American Recovery and Reinvestment Act, student fees were increased 9.3% at UC, 32% at CSU, and 30% at the community colleges. The fee revenue is expected to generate $166 million for UC, $64 million for CSU, and $80 million for the community colleges. The UC Board of Regents recently authorized an additional 15% mid-year increase in fees that will generate $117.3 million.
Unlike UC and CSU, the community colleges receive substantial revenue from other sources, including local property tax funds. According to LAO, when all sources are considered, 2009–10 funding is about $287 million (4.2%) less than provided in 2008–09 and $189 million (2.8%) less than provided in 2007–08. The budget package also defers $163 million owed to 2010–11. Because community colleges have yet to receive funds deferred in previous budget years, the total amount now owed the system exceeds $700 million. According to LAO, it is unclear when, if ever, this money will be made available.
Given current economic conditions, the public higher education systems are raising student fees, furloughing faculty and staff, reducing course offerings, accepting fewer students in the near future, and reducing overhead costs by eliminating or consolidating staff positions. While the challenges are enormous, they are not entirely new. Higher education institutions faced similar challenges and circumstances during the recessions of the early 1990s and 2000s. CPEC believes that attention to the enrollment and capacity questions outlined above is the best way to promote student success as California recovers from the current recession.

Community College Enrollment Demand Projections, 2009–2019 • 7
COMMUNITY COLLEGE ENROLLMENT DEMAND ANALYSIS The California Community Colleges is the nation’s largest higher education system, serving 1.82 million adults and high school seniors. In the 1950s, the community college mission began to evolve to meet California’s changing educational, workforce, and economic needs. Presently, the community colleges are responsible for lower-division academic instruction, occupational and ca-reer technical training, adult education, remedial and basic skills education, and community service and vocational programs. The system has fully recovered from the decline in enrollments that oc-curred in 2003, when state support for higher education declined following the 2001–02 recession and community colleges had to increase student fees and drastically reduce course offerings.
Community college enrollments have been increasing dramatically for the past five years. Between 2005 and 2008, fall enrollments grew 14.0%, from 1.6 million in 2005 to 1.82 million in 2008. The Mid-Range Forecast indicates that demand will increase from 1.82 million to 2.14 million in 2019. This means that the state should prepare at a minimum for 313,000 additional students above the fall 2008 peak enrollment level. Although the community colleges serve nearly 3 million students annually (fall, winter and spring terms combined), beginning in 2011 campuses will be asked collec-tively to serve more than 2 million students during each fall term.
Display 1 Mid-Range Forecast of Community College Enrollment Demand, 2008–2019 by Ethnicity
Fall American
Indian Asian Black Latino White, Other
Total Demand
2008 17,045 317,639 146,976 610,403 731,453 1,823,516
2009 17,711 327,918 154,263 648,941 748,365 1,897,197
2010 18,301 338,047 161,129 688,087 763,579 1,969,143
2011 18,914 348,694 167,778 729,434 776,845 2,041,666
2012 19,249 351,454 167,661 749,642 772,949 2,060,953
2013 19,547 353,465 167,078 768,479 767,990 2,076,558
2014 19,797 355,403 166,051 786,478 762,422 2,090,152
2015 19,781 358,757 164,496 804,535 756,251 2,103,820
2016 19,757 361,682 162,750 819,669 749,826 2,113,684
2017 19,716 365,128 161,015 832,943 744,111 2,122,914
2018 19,645 368,254 159,149 844,461 738,664 2,130,174
2019 19,572 371,272 157,262 855,939 732,734 2,136,779
Percent Change 14.8% 16.9% 7.0% 40.2% 0.2% 17.2%
Asian includes Filipinos and Pacific Islanders.
8 • California Postsecondary Education Commission
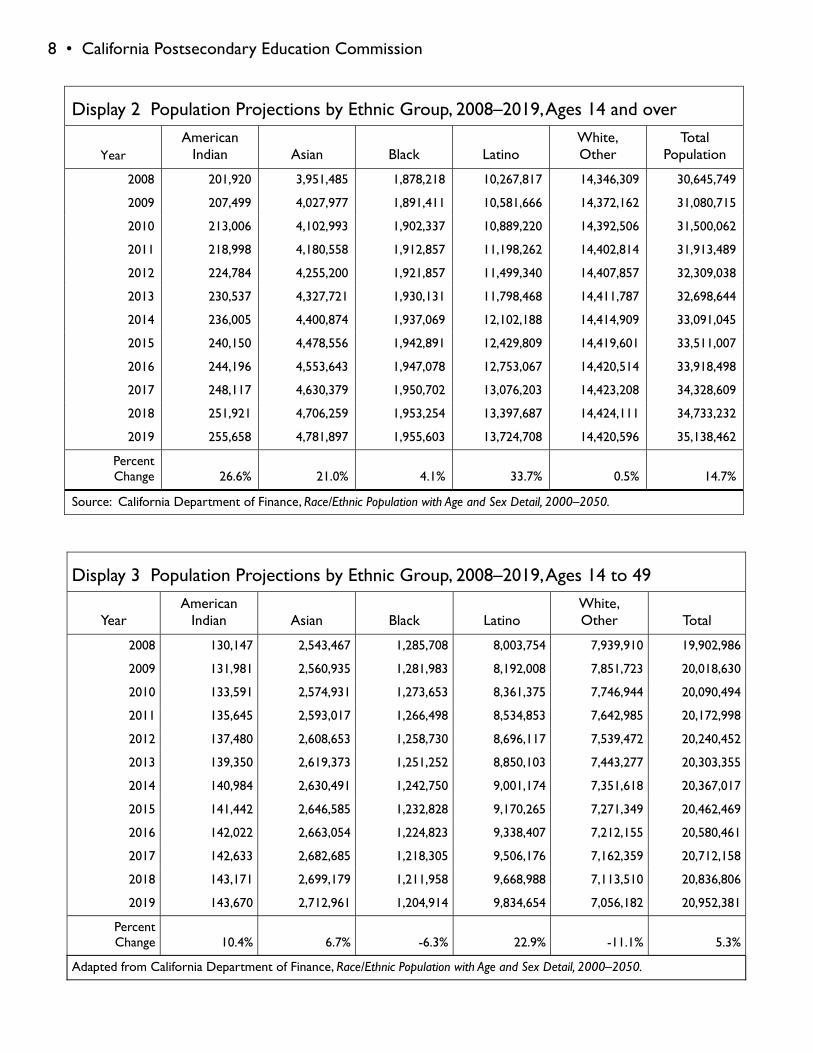
Display 3 Population Projections by Ethnic Group, 2008–2019, Ages 14 to 49
Year American
Indian Asian Black Latino White, Other Total
2008 130,147 2,543,467 1,285,708 8,003,754 7,939,910 19,902,986
2009 131,981 2,560,935 1,281,983 8,192,008 7,851,723 20,018,630
2010 133,591 2,574,931 1,273,653 8,361,375 7,746,944 20,090,494
2011 135,645 2,593,017 1,266,498 8,534,853 7,642,985 20,172,998
2012 137,480 2,608,653 1,258,730 8,696,117 7,539,472 20,240,452
2013 139,350 2,619,373 1,251,252 8,850,103 7,443,277 20,303,355
2014 140,984 2,630,491 1,242,750 9,001,174 7,351,618 20,367,017
2015 141,442 2,646,585 1,232,828 9,170,265 7,271,349 20,462,469
2016 142,022 2,663,054 1,224,823 9,338,407 7,212,155 20,580,461
2017 142,633 2,682,685 1,218,305 9,506,176 7,162,359 20,712,158
2018 143,171 2,699,179 1,211,958 9,668,988 7,113,510 20,836,806
2019 143,670 2,712,961 1,204,914 9,834,654 7,056,182 20,952,381
Percent Change 10.4% 6.7% -6.3% 22.9% -11.1% 5.3%
Adapted from California Department of Finance, Race/Ethnic Population with Age and Sex Detail, 2000–2050.
Display 2 Population Projections by Ethnic Group, 2008–2019, Ages 14 and over
Year American
Indian Asian Black Latino White, Other
Total Population
2008 201,920 3,951,485 1,878,218 10,267,817 14,346,309 30,645,749
2009 207,499 4,027,977 1,891,411 10,581,666 14,372,162 31,080,715
2010 213,006 4,102,993 1,902,337 10,889,220 14,392,506 31,500,062
2011 218,998 4,180,558 1,912,857 11,198,262 14,402,814 31,913,489
2012 224,784 4,255,200 1,921,857 11,499,340 14,407,857 32,309,038
2013 230,537 4,327,721 1,930,131 11,798,468 14,411,787 32,698,644
2014 236,005 4,400,874 1,937,069 12,102,188 14,414,909 33,091,045
2015 240,150 4,478,556 1,942,891 12,429,809 14,419,601 33,511,007
2016 244,196 4,553,643 1,947,078 12,753,067 14,420,514 33,918,498
2017 248,117 4,630,379 1,950,702 13,076,203 14,423,208 34,328,609
2018 251,921 4,706,259 1,953,254 13,397,687 14,424,111 34,733,232
2019 255,658 4,781,897 1,955,603 13,724,708 14,420,596 35,138,462
Percent Change 26.6% 21.0% 4.1% 33.7% 0.5% 14.7%
Source: California Department of Finance, Race/Ethnic Population with Age and Sex Detail, 2000–2050.
Community College Enrollment Demand Projections, 2009–2019 • 9
CPEC’s community college demand model is a demographic model and uses observed changes in population and other relevant factors and assumptions to project changes in enrollment demand. Enrollment Demand is an estimate of the total number of qualified prospective and continuing students that would enroll in the community college system in a given year at a prevailing student fee level if enrollments were not constrained by State funding. In contrast, an enrollment projection is an estimate of enrollment the State is able and willing to fund based on budgetary, economic, and fiscal circumstances. When circumstances are favorable, enrollment demand and enrollment projection estimates will yield very similar results. When circumstances are less favorable, as during economic recessions, demand estimates will be higher than projection estimates, because by defini-tion, state resources are insufficient to fully meet demand.
The Demographic Research Unit of the Department of Finance and the Legislative Analyst’s Office use similar demographic models. Displays 2 and 3 on the opposite page show population projections by ethnicity and age. About 88% of people who enroll in community college are in the 14–49 age group, which is expected to grow at a much slower pace than the population as a whole, because it excludes the baby boom generation.
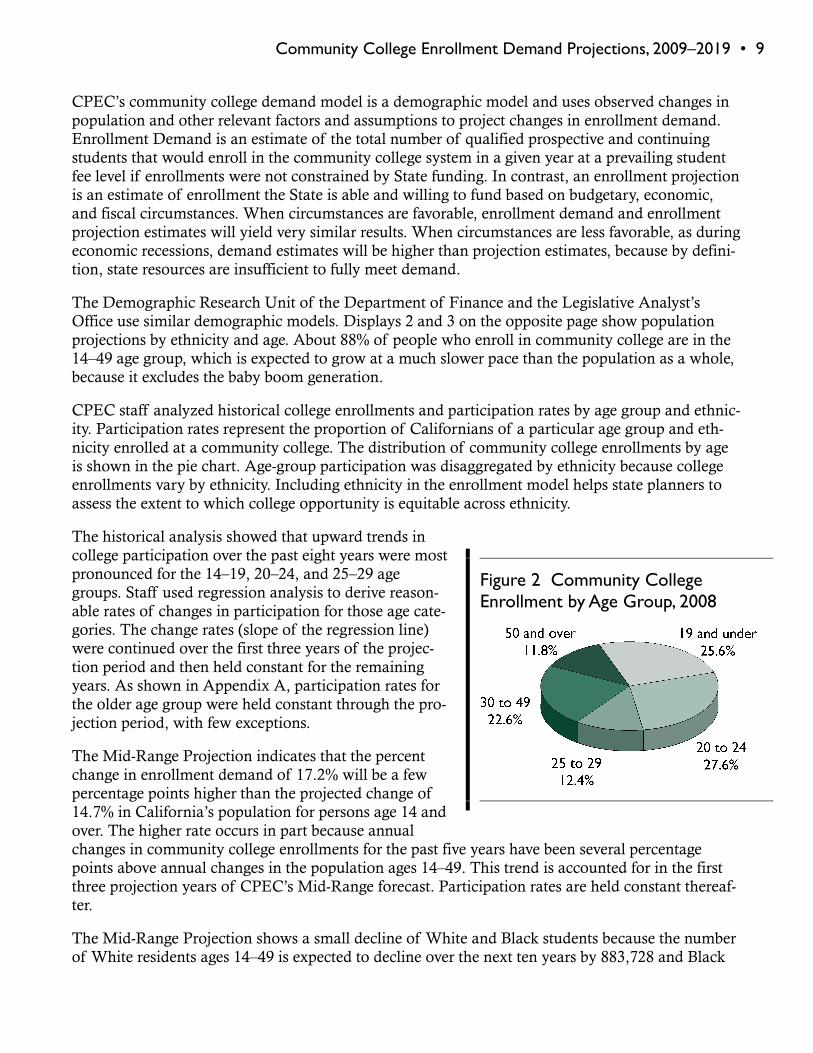
CPEC staff analyzed historical college enrollments and participation rates by age group and ethnic-ity. Participation rates represent the proportion of Californians of a particular age group and eth-nicity enrolled at a community college. The distribution of community college enrollments by age is shown in the pie chart. Age-group participation was disaggregated by ethnicity because college enrollments vary by ethnicity. Including ethnicity in the enrollment model helps state planners to assess the extent to which college opportunity is equitable across ethnicity.
The historical analysis showed that upward trends in college participation over the past eight years were most pronounced for the 14–19, 20–24, and 25–29 age groups. Staff used regression analysis to derive reason-able rates of changes in participation for those age cate-gories. The change rates (slope of the regression line) were continued over the first three years of the projec-tion period and then held constant for the remaining years. As shown in Appendix A, participation rates for the older age group were held constant through the pro-jection period, with few exceptions.
The Mid-Range Projection indicates that the percent change in enrollment demand of 17.2% will be a few percentage points higher than the projected change of 14.7% in California’s population for persons age 14 and over. The higher rate occurs in part because annual changes in community college enrollments for the past five years have been several percentage points above annual changes in the population ages 14–49. This trend is accounted for in the first three projection years of CPEC’s Mid-Range forecast. Participation rates are held constant thereaf-ter.
The Mid-Range Projection shows a small decline of White and Black students because the number of White residents ages 14–49 is expected to decline over the next ten years by 883,728 and Black
Figure 2 Community College Enrollment by Age Group, 2008
10 • California Postsecondary Education Commission
residents by 80,794. The decline is due principally to lower birth rates and migration patterns. While CPEC projects increased participation rates for all ethnic groups, increases for Whites and Blacks will be partially offset by declines in the general population.
CPEC believes that it is reasonable to expect college participation rates to continue to increase at least for the next three years for reasons outlined here.
An increasing number of residents are returning to the community colleges to train for new careers and occupations as a result of significant job losses occurring in the state, which suggests a continuation of increased enrollment demand.
Expansion of California’s green economy will spur growth in community college training programs that will prepare prospective workers for green jobs.
According to many economists, a gradual job recovery beginning in 2010 that will foster en-rollment growth in occupational training programs for which the community colleges are a ma-jor provider.
UC and CSU are finding it necessary to increase fees, furlough faculty, and limit future enroll-ments, which suggests that many students may have to complete their first two years of instruc-tion at a community college before transferring to a university campus.
The Obama Administration has made higher education a priority and is in the process of im-plementing federal programs to boost college participation.
If economic conditions were more favorable, funding the level of enrollment demand es-timated by the Mid-Range Fore-cast would be manageable. Be-cause the community college system is scheduled to receive a 4% decline in funding in 2010–11, the loss in community col-lege opportunity and access could be substantial if the sys-tem finds it necessary to reduce enrollment by a like percentage. This would mean a net decline in college opportunity of 365,000 students by fall 2010, as shown by the worksheet in Fig-ure 3. However, preliminary fall 2009 data indicate that district enrollments generally exceeded budgeted FTE enrollment alloca-tions, which means that the loss in college opportunity will not be as large as estimated here. Even so, the greatest funding challenge will be in the near term, when enrollments are expected to in-crease at an annual rate of about 3.7%, before tapering off substantially during the latter projection period.
The Baseline Forecast, shown on the next page in Display 4, is provided as a low alternative de-mand forecast in that it holds all participation rates constant at fall 2008 observed levels for the en-
Figure 3 Loss in College Opportunity Worksheet
Fall 2008 Headcount Enrollment 1,823,516
2009–10 Net Percentage Decline in State Funding 4.0 %
Target Headcount Enrollment if Colleges Find it Necessary to Reduce Fall Enrollments by 4% 1,750,575
Fall 2009 Mid-Range Enrollment Demand Forecast 1,897,197
Loss in College Opportunity Fall 2009 (Mid-Range 2009 forecast minus Fall 2009 Target Enrollment) -146,622
Fall 2010 Mid-Range Enrollment Demand Forecast 1,969,143
Loss in College Opportunity Fall 2010 (Mid-Range 2010 forecast minus Fall 2009 Target Enrollment) -218,568
Combined Loss in College Opportunity Fall 2009–Fall 2010 -365,190
Community College Enrollment Demand Projections, 2009–2019 • 11
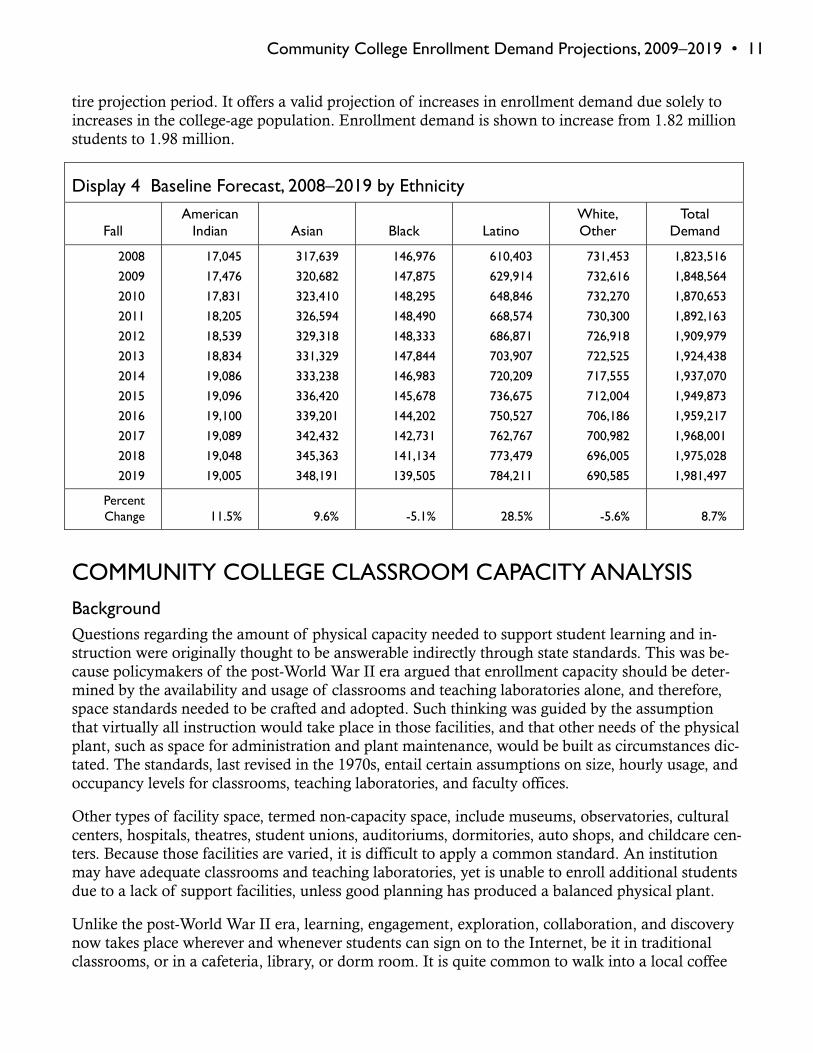
tire projection period. It offers a valid projection of increases in enrollment demand due solely to increases in the college-age population. Enrollment demand is shown to increase from 1.82 million students to 1.98 million.
Display 4 Baseline Forecast, 2008–2019 by Ethnicity
Fall American
Indian Asian Black Latino White, Other
Total Demand
2008
2009
2010
2011
2012
2013
2014
2015
2016
2017
2018
2019
17,045
17,476
17,831
18,205
18,539
18,834
19,086
19,096
19,100
19,089
19,048
19,005
317,639
320,682
323,410
326,594
329,318
331,329
333,238
336,420
339,201
342,432
345,363
348,191
146,976
147,875
148,295
148,490
148,333
147,844
146,983
145,678
144,202
142,731
141,134
139,505
610,403
629,914
648,846
668,574
686,871
703,907
720,209
736,675
750,527
762,767
773,479
784,211
731,453
732,616
732,270
730,300
726,918
722,525
717,555
712,004
706,186
700,982
696,005
690,585
1,823,516
1,848,564
1,870,653
1,892,163
1,909,979
1,924,438
1,937,070
1,949,873
1,959,217
1,968,001
1,975,028
1,981,497
Percent Change 11.5% 9.6% -5.1% 28.5% -5.6% 8.7%
COMMUNITY COLLEGE CLASSROOM CAPACITY ANALYSIS Background Questions regarding the amount of physical capacity needed to support student learning and in-struction were originally thought to be answerable indirectly through state standards. This was be-cause policymakers of the post-World War II era argued that enrollment capacity should be deter-mined by the availability and usage of classrooms and teaching laboratories alone, and therefore, space standards needed to be crafted and adopted. Such thinking was guided by the assumption that virtually all instruction would take place in those facilities, and that other needs of the physical plant, such as space for administration and plant maintenance, would be built as circumstances dic-tated. The standards, last revised in the 1970s, entail certain assumptions on size, hourly usage, and occupancy levels for classrooms, teaching laboratories, and faculty offices.
Other types of facility space, termed non-capacity space, include museums, observatories, cultural centers, hospitals, theatres, student unions, auditoriums, dormitories, auto shops, and childcare cen-ters. Because those facilities are varied, it is difficult to apply a common standard. An institution may have adequate classrooms and teaching laboratories, yet is unable to enroll additional students due to a lack of support facilities, unless good planning has produced a balanced physical plant.
Unlike the post-World War II era, learning, engagement, exploration, collaboration, and discovery now takes place wherever and whenever students can sign on to the Internet, be it in traditional classrooms, or in a cafeteria, library, or dorm room. It is quite common to walk into a local coffee
12 • California Postsecondary Education Commission
house and find students engaged in learning while sipping a café latté. Still, the classroom will al-ways be a major component of higher education, and an analysis of classroom capacity is central to higher education planning.
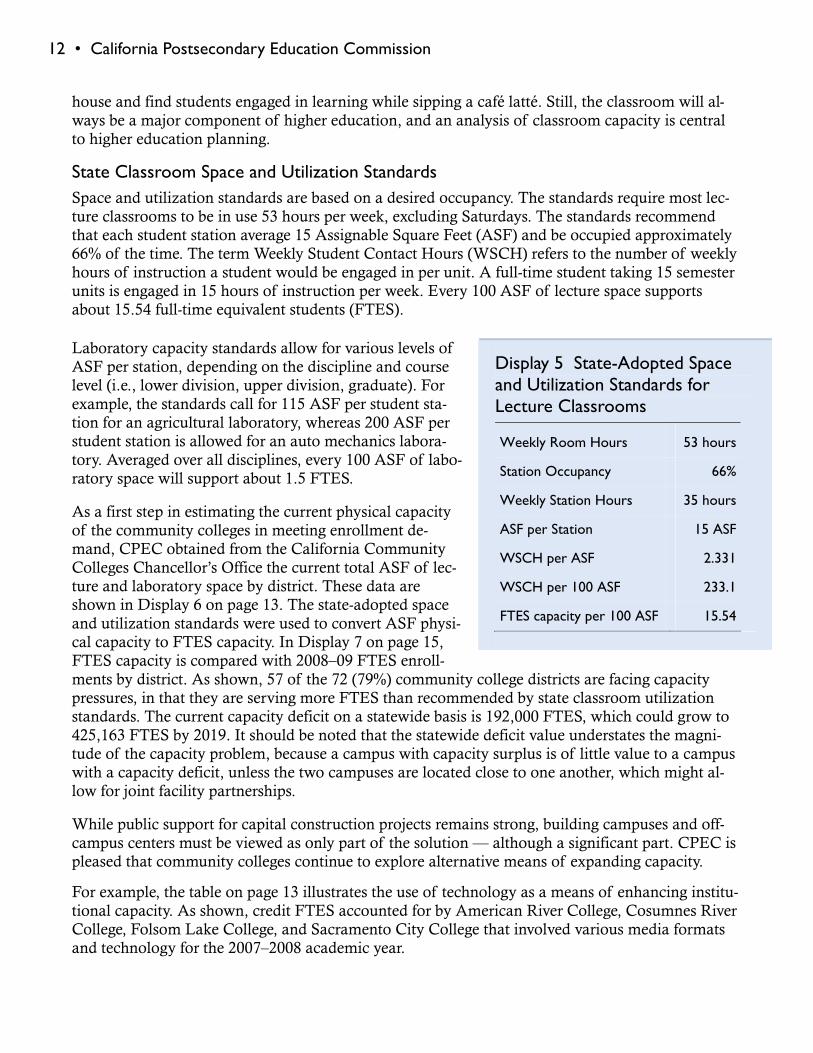
State Classroom Space and Utilization Standards Space and utilization standards are based on a desired occupancy. The standards require most lec-ture classrooms to be in use 53 hours per week, excluding Saturdays. The standards recommend that each student station average 15 Assignable Square Feet (ASF) and be occupied approximately 66% of the time. The term Weekly Student Contact Hours (WSCH) refers to the number of weekly hours of instruction a student would be engaged in per unit. A full-time student taking 15 semester units is engaged in 15 hours of instruction per week. Every 100 ASF of lecture space supports about 15.54 full-time equivalent students (FTES).
Laboratory capacity standards allow for various levels of ASF per station, depending on the discipline and course level (i.e., lower division, upper division, graduate). For example, the standards call for 115 ASF per student sta-tion for an agricultural laboratory, whereas 200 ASF per student station is allowed for an auto mechanics labora-tory. Averaged over all disciplines, every 100 ASF of labo-ratory space will support about 1.5 FTES.
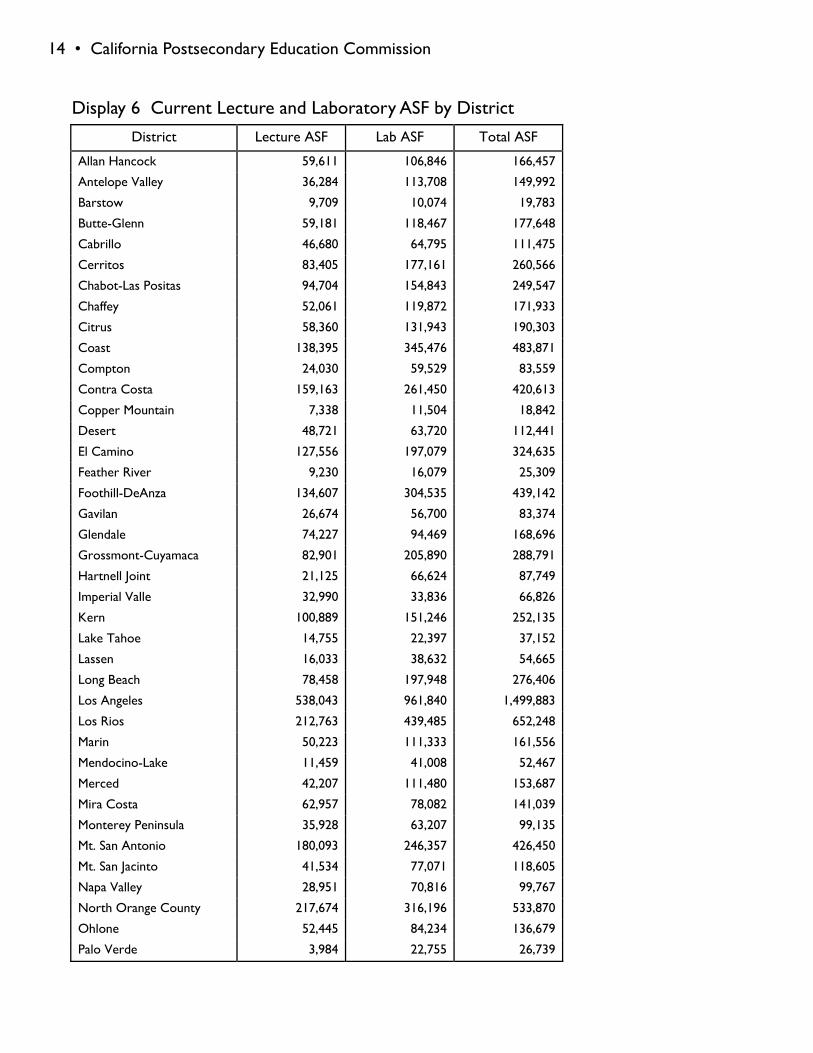
As a first step in estimating the current physical capacity of the community colleges in meeting enrollment de-mand, CPEC obtained from the California Community Colleges Chancellor’s Office the current total ASF of lec-ture and laboratory space by district. These data are shown in Display 6 on page 13. The state-adopted space and utilization standards were used to convert ASF physi-cal capacity to FTES capacity. In Display 7 on page 15, FTES capacity is compared with 2008–09 FTES enroll-ments by district. As shown, 57 of the 72 (79%) community college districts are facing capacity pressures, in that they are serving more FTES than recommended by state classroom utilization standards. The current capacity deficit on a statewide basis is 192,000 FTES, which could grow to 425,163 FTES by 2019. It should be noted that the statewide deficit value understates the magni-tude of the capacity problem, because a campus with capacity surplus is of little value to a campus with a capacity deficit, unless the two campuses are located close to one another, which might al-low for joint facility partnerships.
While public support for capital construction projects remains strong, building campuses and off-campus centers must be viewed as only part of the solution — although a significant part. CPEC is pleased that community colleges continue to explore alternative means of expanding capacity.
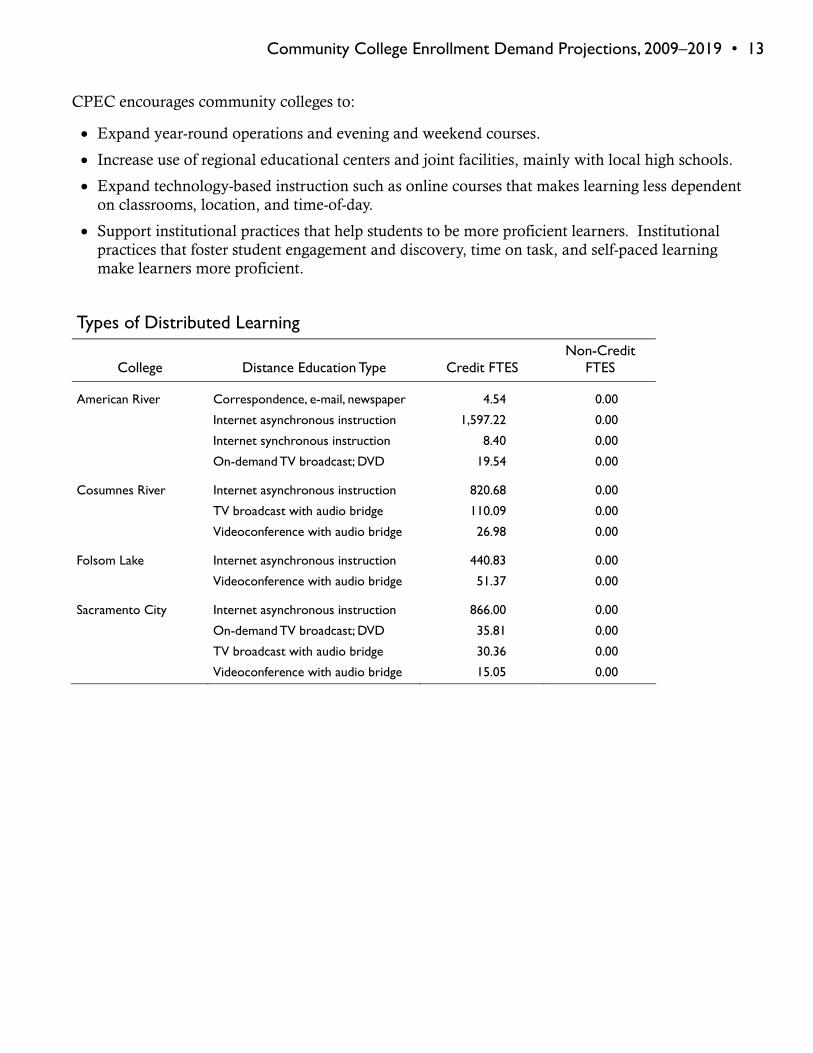
For example, the table on page 13 illustrates the use of technology as a means of enhancing institu-tional capacity. As shown, credit FTES accounted for by American River College, Cosumnes River College, Folsom Lake College, and Sacramento City College that involved various media formats and technology for the 2007–2008 academic year.
Display 5 State-Adopted Space and Utilization Standards for Lecture Classrooms
Weekly Room Hours 53 hours
Station Occupancy 66%
Weekly Station Hours 35 hours
ASF per Station 15 ASF
WSCH per ASF 2.331
WSCH per 100 ASF 233.1
FTES capacity per 100 ASF 15.54
Community College Enrollment Demand Projections, 2009–2019 • 13
CPEC encourages community colleges to:
Expand year-round operations and evening and weekend courses.
Increase use of regional educational centers and joint facilities, mainly with local high schools.
Expand technology-based instruction such as online courses that makes learning less dependent on classrooms, location, and time-of-day.
Support institutional practices that help students to be more proficient learners. Institutional practices that foster student engagement and discovery, time on task, and self-paced learning make learners more proficient.
Types of Distributed Learning
College Distance Education Type Credit FTES Non-Credit
FTES
American River Correspondence, e-mail, newspaper 4.54 0.00
Internet asynchronous instruction 1,597.22 0.00
Internet synchronous instruction 8.40 0.00
On-demand TV broadcast; DVD 19.54 0.00
Cosumnes River Internet asynchronous instruction 820.68 0.00
TV broadcast with audio bridge 110.09 0.00
Videoconference with audio bridge 26.98 0.00
Folsom Lake Internet asynchronous instruction 440.83 0.00
Videoconference with audio bridge 51.37 0.00
Sacramento City Internet asynchronous instruction 866.00 0.00
On-demand TV broadcast; DVD 35.81 0.00
TV broadcast with audio bridge 30.36 0.00
Videoconference with audio bridge 15.05 0.00
14 • California Postsecondary Education Commission
Display 6 Current Lecture and Laboratory ASF by District
District Lecture ASF Lab ASF Total ASF
Allan Hancock 59,611 106,846 166,457
Antelope Valley 36,284 113,708 149,992
Barstow 9,709 10,074 19,783
Butte-Glenn 59,181 118,467 177,648
Cabrillo 46,680 64,795 111,475
Cerritos 83,405 177,161 260,566
Chabot-Las Positas 94,704 154,843 249,547
Chaffey 52,061 119,872 171,933
Citrus 58,360 131,943 190,303
Coast 138,395 345,476 483,871
Compton 24,030 59,529 83,559
Contra Costa 159,163 261,450 420,613
Copper Mountain 7,338 11,504 18,842
Desert 48,721 63,720 112,441
El Camino 127,556 197,079 324,635
Feather River 9,230 16,079 25,309
Foothill-DeAnza 134,607 304,535 439,142
Gavilan 26,674 56,700 83,374
Glendale 74,227 94,469 168,696
Grossmont-Cuyamaca 82,901 205,890 288,791
Hartnell Joint 21,125 66,624 87,749
Imperial Valle 32,990 33,836 66,826
Kern 100,889 151,246 252,135
Lake Tahoe 14,755 22,397 37,152
Lassen 16,033 38,632 54,665
Long Beach 78,458 197,948 276,406
Los Angeles 538,043 961,840 1,499,883
Los Rios 212,763 439,485 652,248
Marin 50,223 111,333 161,556
Mendocino-Lake 11,459 41,008 52,467
Merced 42,207 111,480 153,687
Mira Costa 62,957 78,082 141,039
Monterey Peninsula 35,928 63,207 99,135
Mt. San Antonio 180,093 246,357 426,450
Mt. San Jacinto 41,534 77,071 118,605
Napa Valley 28,951 70,816 99,767
North Orange County 217,674 316,196 533,870
Ohlone 52,445 84,234 136,679
Palo Verde 3,984 22,755 26,739
Community College Enrollment Demand Projections, 2009–2019 • 15
District Lecture ASF Lab ASF Total ASF
Palomar 67,867 169,698 237,565
Peralta 104,327 276,906 381,233
Rancho Santiago 163,776 158,750 322,526
Redwoods 37,613 96,851 134,464
Rio Hondo 51,346 96,573 147,919
Riverside 139,363 166,219 305,582
San Bernardino 86,515 172,030 258,545
San Diego 271,998 352,924 624,922
San Francisco 228,735 308,418 537,153
San Joaquin Delta 71,735 161,899 233,634
San Jose-Evergreen 87,190 184,133 271,323
San Luis Obispo County 48,403 99,486 147,889
San Mateo County 143,898 243,265 387,163
Santa Barbara 100,643 122,230 222,873
Santa Clarita 64,253 126,663 190,916
Santa Monica 147,327 128,082 275,409
Sequoias 47,796 84,356 132,152
Shasta-Tehama-Trinity Joint 45,130 86,566 131,696
Sierra Joint 82,429 127,120 209,549
Siskiyou Joint 13,521 30,556 44,077
Solano 63,147 88,940 152,087
Sonoma County Junior 103,107 142,960 246,067
South Orange County 120,807 159,891 280,698
Southwestern 90,306 130,912 221,218
State Center 128,594 319,571 448,165
Ventura County 161,643 254,027 415,670
Victor Valley 17,271 119,832 137,103
West Hills 21,303 45,255 66,558
West Kern 11,569 20,123 31,692
West Valley-Mission 94,498 145,090 239,588
Yosemite 57,818 220,700 278,518
Yuba 77,139 86,153 163,292
Systemwide Totals 6,131,381 10,872,320 17,003,701
16 • California Postsecondary Education Commission
Display 7 Community College Capacity Analysis Based on 2008–09 Data
2008–09 FTES Data
District FTES
Enrollment FTES
Capacity FTES
Surplus/Deficit
Allan Hancock 11,063 10,841 -222
Antelope Valley 11,989 7,319 -4,670
Barstow 3,394 1,657 -1,737
Butte-Glenn 13,608 10,946 -2,662
Cabrillo 12,017 8,210 -3,807
Cerritos 20,596 15,578 -5,019
Chabot-Las Positas 16,135 17,002 868
Chaffey 15,630 9,861 -5,769
Citrus 12,943 11,018 -1,925
Coast 39,084 26,610 -12,473
Compton 4,742 4,614 -128
Contra Costa 33,207 28,593 -4,614
Copper Mountain 2,111 1,310 -801
Desert 8,581 8,511 -70
El Camino 22,261 22,730 469
Feather River 2,191 1,672 -519
Foothill-DeAnza 38,365 25,416 -12,949
Gavilan 5,748 4,983 -766
Glendale 17,535 12,928 -4,607
Grossmont-Cuyamaca 19,848 15,924 -3,923
Hartnell Joint 7,858 4,267 -3,591
Imperial Valle 9,465 5,625 -3,839
Kern 21,992 17,910 -4,083
Lake Tahoe 2,000 2,623 623
Lassen 2,014 3,062 1,048
Long Beach 22,944 15,117 -7,828
Los Angeles 111,444 97,811 -13,633
Los Rios 62,840 39,554 -23,286
Marin 2,383 9,449 7,066
Mendocino-Lake 3,121 2,387 -734
Merced 10,961 8,206 -2,755
Mira Costa 7,584 10,935 3,351
Monterey Peninsula 7,915 6,516 -1,399
Mt. San Antonio 33,271 31,621 -1,651
Mt. San Jacinto 12,585 7,592 -4,993
Napa Valley 6,572 5,545 -1,027
North Orange County 36,784 38,492 1,708
Community College Enrollment Demand Projections, 2009–2019 • 17
2008–09 FTES Data
District FTES
Enrollment FTES
Capacity FTES
Surplus/Deficit
Ohlone 9,301 9,393 92
Palo Verde 2,025 956 -1,069
Palomar 21,596 13,054 -8,543
Pasadena 26,455 19,227 -7,228
Peralta 22,342 20,304 -2,039
Rancho Santiago 35,956 27,789 -8,167
Redwoods 5,473 7,276 1,803
Rio Hondo 16,068 9,405 -6,663
Riverside 31,364 24,108 -7,256
San Bernardino 16,074 15,985 -89
San Diego 44,664 47,474 2,809
San Francisco 42,935 40,095 -2,840
San Joaquin Delta 17,681 13,539 -4,142
San Jose-Evergreen 16,384 16,269 -115
San Luis Obispo County 10,390 8,991 -1,399
San Mateo County 20,729 25,952 5,223
Santa Barbara 17,462 17,442 -19
Santa Clarita 15,750 11,855 -3,894
Santa Monica 28,050 24,780 -3,270
Sequoias 9,652 8,673 -980
Shasta-Tehama-Trinity Joint 8,525 8,291 -234
Sierra Joint 15,234 14,685 -549
Siskiyou Joint 2,781 2,552 -228
Solano 4,887 11,125 6,238
Sonoma County Junior 22,748 18,132 -4,617
South Orange County 24,785 21,132 -3,653
Southwestern 15,859 15,965 106
State Center 31,890 24,705 -7,185
Ventura County 30,935 28,868 -2,066
Victor Valley 10,613 4,456 -6,157
West Hills 6,602 3,979 -2,623
West Kern 778 2,095 1,317
West Valley-Mission 18,886 16,826 -2,060
Yosemite 18,839 12,247 -6,592
Yuba 9,170 13,257 4,088
Systemwide Totals 1,305,665 1,113,318 -192,347
18 • California Postsecondary Education Commission
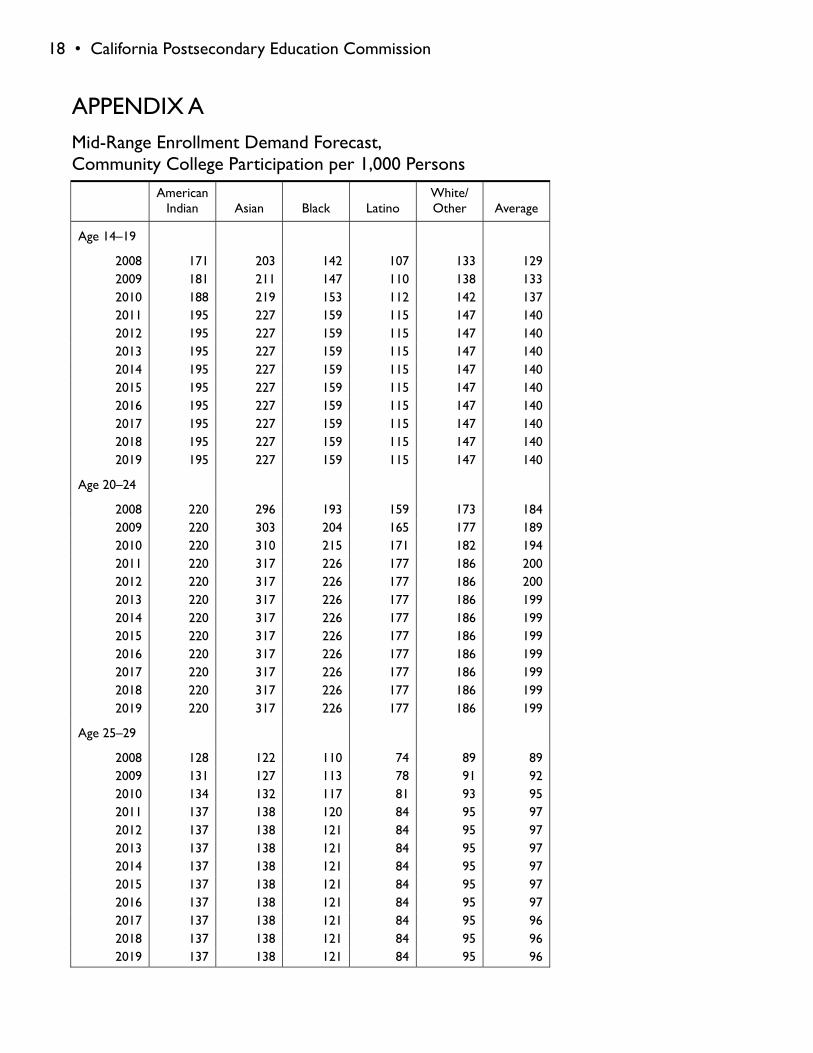
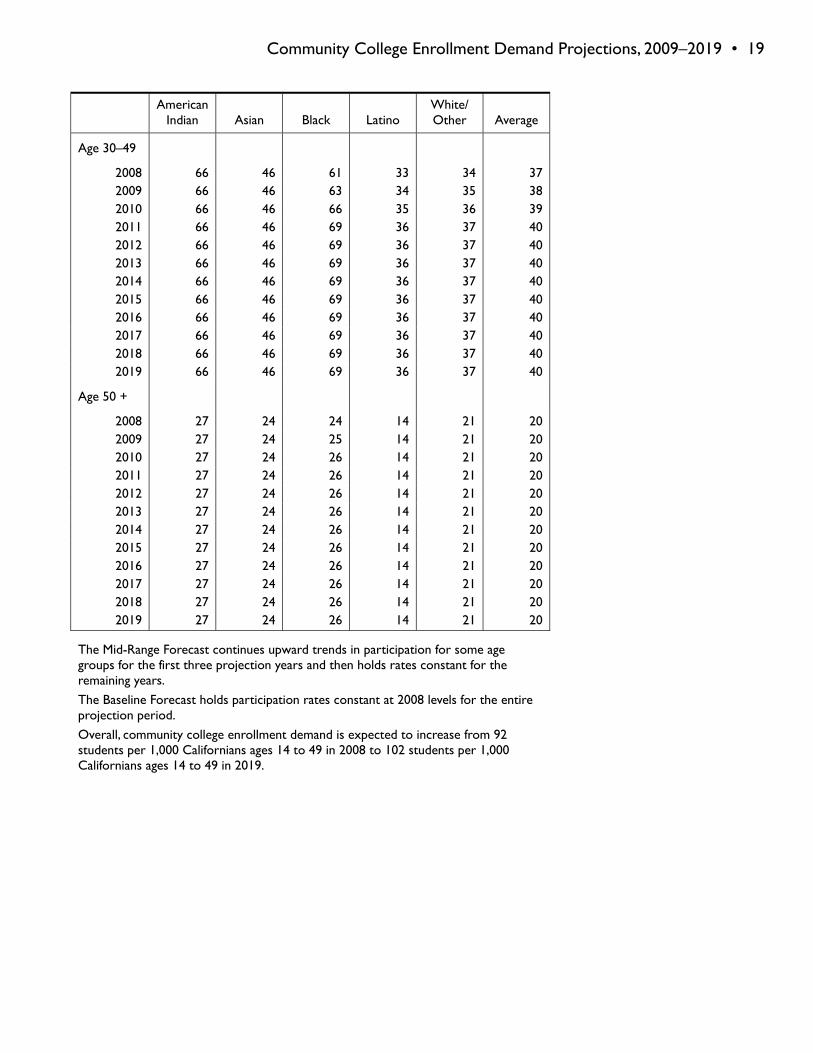
APPENDIX A Mid-Range Enrollment Demand Forecast, Community College Participation per 1,000 Persons
American
Indian Asian Black Latino White/ Other Average
Age 14–19
2008 171 203 142 107 133 129 2009 181 211 147 110 138 133 2010 188 219 153 112 142 137 2011 195 227 159 115 147 140 2012 195 227 159 115 147 140 2013 195 227 159 115 147 140 2014 195 227 159 115 147 140 2015 195 227 159 115 147 140 2016 195 227 159 115 147 140 2017 195 227 159 115 147 140 2018 195 227 159 115 147 140 2019 195 227 159 115 147 140
Age 20–24
2008 220 296 193 159 173 184 2009 220 303 204 165 177 189 2010 220 310 215 171 182 194 2011 220 317 226 177 186 200 2012 220 317 226 177 186 200 2013 220 317 226 177 186 199 2014 220 317 226 177 186 199 2015 220 317 226 177 186 199 2016 220 317 226 177 186 199 2017 220 317 226 177 186 199 2018 220 317 226 177 186 199 2019 220 317 226 177 186 199
Age 25–29
2008 128 122 110 74 89 89 2009 131 127 113 78 91 92 2010 134 132 117 81 93 95 2011 137 138 120 84 95 97 2012 137 138 121 84 95 97 2013 137 138 121 84 95 97 2014 137 138 121 84 95 97 2015 137 138 121 84 95 97 2016 137 138 121 84 95 97 2017 137 138 121 84 95 96 2018 137 138 121 84 95 96 2019 137 138 121 84 95 96
Community College Enrollment Demand Projections, 2009–2019 • 19
American
Indian Asian Black Latino White/ Other Average
Age 30–49
2008 66 46 61 33 34 37 2009 66 46 63 34 35 38 2010 66 46 66 35 36 39 2011 66 46 69 36 37 40 2012 66 46 69 36 37 40 2013 66 46 69 36 37 40 2014 66 46 69 36 37 40 2015 66 46 69 36 37 40 2016 66 46 69 36 37 40 2017 66 46 69 36 37 40 2018 66 46 69 36 37 40 2019 66 46 69 36 37 40
Age 50 +
2008 27 24 24 14 21 20 2009 27 24 25 14 21 20 2010 27 24 26 14 21 20 2011 27 24 26 14 21 20 2012 27 24 26 14 21 20 2013 27 24 26 14 21 20 2014 27 24 26 14 21 20 2015 27 24 26 14 21 20 2016 27 24 26 14 21 20 2017 27 24 26 14 21 20 2018 27 24 26 14 21 20 2019 27 24 26 14 21 20
The Mid-Range Forecast continues upward trends in participation for some age groups for the first three projection years and then holds rates constant for the remaining years.
The Baseline Forecast holds participation rates constant at 2008 levels for the entire projection period.
Overall, community college enrollment demand is expected to increase from 92 students per 1,000 Californians ages 14 to 49 in 2008 to 102 students per 1,000 Californians ages 14 to 49 in 2019.

20 • California Postsecondary Education Commission
APPENDIX B Enrollment Demand Method Enrollment demand is an estimate of the total number of qualified prospective and continuing stu-dents that would enroll in the community college system in a given year at a prevailing student fee level if enrollments were not constrained by state funding. In contrast, an enrollment projection is an estimate of enrollment the state is able and willing to fund based on budgetary, economic, and fis-cal circumstances. When circumstances are favorable, enrollment demand and enrollment projec-tion estimates will yield very similar results. When circumstances are less favorable, as during eco-nomic recessions, demand estimates will be higher than projection estimates, because by definition state resources are insufficient to fully meet demand.
To estimate enrollment demand, staff used historical fall headcount enrollments by age group and ethnicity. Cases with an unknown ethnicity were prorated proportionately. Within ethnicity, cases with an unknown age group were prorated proportionately. Historical participation rates were de-rived by dividing community college fall enrollments by the corresponding California population estimates prepared by the Demographic Research Unit of the Department of Finance.
The historical data showed that upward trends in college participation over the past eight years were most pronounced for the 14–19, 20–24, and 25–29 age groups. Staff used regression analysis to derive a mean rate of change in participation for those age categories. The regression slope represents a linear average change rate and is defined symbolically as:
byx= n ∑ xy – ( ∑ x) ( ∑ y) / n ∑ x2 – ( ∑ x)2
where n = number of cases x = year y = participation rate
The change rates for the age groups stated above were continued over the first three years of the projection period and then held constant for the remaining years (see Appendix A). With few ex-ceptions, participation rates for the older age groups were held constant through the projection pe-riod. Enrollment demand headcounts were derived by multiplying the participation rates by the population estimates.
Classroom Capacity Method To estimate the current physical capacity of the community colleges, CPEC obtained from the Cali-fornia Community Colleges Chancellor’s Office the current total assignable square feet (ASF) of lecture and laboratory space by district. State-adopted space and utilization standards, described on page 12, were used to convert ASF classroom capacity to FTES capacity. A capacity deficit/surplus value was obtained by subtracting FTES capacity from fall 2008 FTES enrollment. A positive value indicates a surplus and a negative indicates a deficit. District values were summed to derive a state-wide net value. The current statewide capacity deficit is 192,347 FTES. It should be noted that the statewide deficit value understates the magnitude of the capacity problem, because a campus with capacity surplus is of little value to a campus with a capacity deficit, unless the two campuses are located close to one another, which might allow for joint facility partnerships. Based on the CPEC fall 2019 demand estimates, a 425,163 FTES capacity deficit would result in the absence of correc-tive actions outlined in the report.


![ENROLLMENT ANALYSIS JANUARY 9, 2017 · ENROLLMENT PROJECTION DISTRICTWIDE STUDENT ENROLLMENT PROJECTIONS BY SCHOOL YEAR[2] Projection Window [1] School Year 2016/2017 Enrollment is](https://img.dokumen.tips/doc/110x75/5f8b9146b2f36505874904a0/enrollment-analysis-january-9-2017-enrollment-projection-districtwide-student-enrollment.jpg)