Embed Size (px)
Citation preview

. . . . . .. . . .
College of Lake County 19351 West Washington Street Grayslake Illinois 60030-1198 Voice (847) 543-2096 Fax (847) 223-9371
Office of Institutional Effectiveness, Planning and Research
Enrollment Projections
. . . . . . . . . .
FY2005-2007
Credit Hours by Division and Department
October 2004
Nancy McNerney, Assistant Vice President Arlene Santos-George, Research Coordinator Carrie Zack, Research Assistant Marilyn Vancrey-Schambari, Administrative Secretary Sam del Pozo, Research Assistant
T:\Enrollment Projections\ProjFY05-07\cover.doc

Enrollment Projections FY 2005-2007
This report presents the enrollment projections for each division and their departments for the next three fiscal years—FY2005-2007. Projections are based on mid-term credit hours for the individual departments. Part 1 of the report presents the projections for FY05-07. Part 2 presents a variance analysis of the projected FY04 and actual FY04 enrollment for: 1) the original model projections; and 2) model projections with deans’ revisions. It explains the accuracy of the College’s projections of credit hours. Lastly, Part 3 of the report explains the data and methodology used for the projections, and the process of dean’s review.
Part I
Enrollment Projections College Projections The tables and charts on pages 5-17 show actual and projected credit hours from FY 1997-2007. Overall, the College is projecting annual percentage increases of 1.6% in FY05, 2.2% in FY06 and 2.5% in FY07 (Table 1, page 5). This would mean an increase of 3,668 credit hours from 232,885 in FY04 to 236,553 in FY05. Credit hours are forecast at 241,848 and 247,815 in FY06 and FY07, respectively. The forecasts for the next three years reflect a continuing upward trend since FY95 but at a slower rate of growth.1 The growth rate in FY04 dropped to 2% from higher rates of growth (6.8% and 5.6%) in the previous two fiscal years. Due to revisions by a couple of deans, the enrollment projections were higher than the original model projections. The rationale for the revisions are indicated in the tables for each division (pp.6-12). Projections for the degree and non-degree areas are as follows: •
•
In the degree-credit area, the College is projecting a 1.8% (+3,667) increase from 205,861 credit hours in FY04 to 209,528 credit hours in FY05 (Table 1, page 5). Credit hours are forecast at 213,332 (1.8% increase) in FY06 and 217,728 (2.1% increase) in FY07. For purposes of projecting tuition revenue, only the degree-credit hours should be used since nearly all of the hours in Adult and Community Education do not carry tuition or fee charges.
In the non-degree credit area, revisions by the Dean of Adult and Community Education Division resulted in 0% growth in FY05 but a strong 5.5% growth each in
1 Except for FY 1999 when the College experienced a drop of 0.5% in credit hours, enrollment was on an upward trend since FY95. Enrollment in degree-credit divisions declined by 0.3% while the ACE division declined by 2.4% in FY99.
1

FY06 and FY07. Credit hours are expected to stay at 27,025 in FY05, 28,516 in FY06, and 30,087 in FY07 (Table 1, page 5).
Division and Department Projections The following summarizes the projected enrollments for FY05-07 for the divisions and their departments.
Among the degree-credit divisions, the Engineering, Mathematics & Physical Sciences Division is expected to have 43,671 credit hours in FY05—the highest numerical growth of 1,397 credit hours or 3.3% increase from the previous year (Table 1, page 5). Growth slows down to 2.1% and 2.5% in FY06 and FY07, respectively resulting in 44,591 credit hours in FY06 and 45,701 in FY07. The largest increases in credit hours in FY05 are in Auto Body Repair (+412), Automotive Technology (+398), and Mathematics (+326) as shown in Table 6, page 10).
•
•
•
•
•
The Communication Arts, Humanities & Fine Arts Division is forecast to have the second highest numerical growth (+1,252) to reach 63,193 credit hours in FY05 (Table 1, page 5). This is a 2% increase over the previous year and a steady increase of about 2% each year is expected through FY06 and FY07. The largest increase increases in credit hours are in English (+444), Humanities (+180), and Art (+156) in FY05 (Table 5, page 9). This division has the highest number of credit hours in the entire college.
The next highest numerical increase is in the Social Sciences Division, where an increase of 560 credit hours or 1.2% is forecast for FY05 (Table 1, page 5). The Division is projected to have 45,520 credit hours in FY05, 46,122 credit hours (+601, +1.3%) in FY06, and 46,722 credit hours (+600, +1.3%) in FY07. The largest increase in credit hours is expected for Psychology (+154), Criminal Justice (+130), and History (+120) as shown in Table 7, page 11.
The Biological and Health Sciences Division is projected to have 33,659 credit hours in FY05. This is an increase of 343 credit hours or 1% over last year (Table 1, page 5). However, higher growth of 3% (+1,013 credit hours) in FY06 and 4.8% (+1,656) in FY07 are expected. The highest numerical increases are forecast for Biology (+519 or 4%), Chemistry (+179, 4%) and Nursing (+147, 2.8%) in FY05 (Table 3, page 7).
Based on model projections (i.e., no revisions were made by the dean), the Business Division is projected to have 22,439 credit hours in FY05 for a marginal 0.5% increase. However, model forecasts indicate a decline of 0.6% in FY06 and a decline of 1.5% in FY07 (Table 1, page 5). Enrollment in Administrative Office Systems is expected to have the largest numerical increase of 126 credit hours in FY05 to reach 4,382 credit hours (Table 4, page 8).
2

•
•
•
•
Student Development is forecast to have less than 1,100 credit hours in the next three years. Growth of 1% are forecast for FY05 and FY06 which drops to 0.2% in FY07 (Table 1, page 5). Cooperative Education is forecast to have 484 credit hours or a 1.1% decline in FY05 while Personal Development is predicted to have 562 hours or +2.8% in FY05 (Table 8, page 12).
In the non-degree area, the Adult and Continuing Education Division is expected to have no increase in FY05 according to the dean’s revised projections. Credit hours are expected to be 27,025 in FY05, 28,516 (+5.5%) in FY06, and 30,087 (+5.5%) in FY07 (Table 1, page 5). Revisions were made to the original model projections because of fluctuations in funding which results in classes being offered or cut. While no increase is forecast for all the departments in FY05, forecasts for FY06 (Table 2, page 6) show that ESL has the largest increase (+1,269 or 7%). Growth in ESL continues in FY07 to reach 20,770 (+1,359 or 7%). In FY06, ABE is expected to reach 4,010 credit hours (+68, 1.7%); GED is expected to generate 2,140 credit hours (+42, 2%); and Vocational Education is forecast to have 1,989 credit hours (+57, 3%).2
Table 9 on pages 14-15 presents the projections at the department level, sorted from highest to lowest projected percent increase in FY05. The highest increase of 3% is projected for many departments. 3 Meanwhile, the largest percent declines are in Industrial Electrician (-10%), Human Services (-8.6%), Physical Education (-8.4%), Medical Laboratory Technician (-7.3%), and Drafting (-6.7%).
Table 10 on pages 17-19 presents the projections at the department level, sorted from highest to lowest projected numeric change in FY05. Biology is forecast to have the largest numeric increase in credit hours (+519), followed by English (+444), Auto Body Repair (+412), Automotive Technology (+398), Mathematics (+326). The largest numeric decline are projected in Dental Hygiene (-592), Physical Education (-103), Human Services (-101), Business (-88), and Accounting (-86).
2 General Studies is no longer reported. It is replaced by Vocational Education, which includes all courses with the PCS code 1.6. These include VST, VPET, VALH, VVOC, etc. 3 The maximum percent increase was capped at 3% for the model projections due to the past year’s slower rate of growth as well as data for Summer 2004 and Fall 2004. For a complete explanation of the methodology, refer to Part III of the report on page 25.
3

Part I Tables and Charts
4

Table 1College of Lake CountyMidterm Credit Hours
Actual and Projected FY97-07(Based on Moving Eight-Year Average of Annual Percent Change Adjusted for Available FY05 Data)
Projected Credit Hours Projected Number Change Projected Percent ChangeDivision FY97 FY98 FY99 FY00 FY01 FY02 FY03 FY04 FY05 FY06 FY07 FY05 FY06 FY07 FY04 FY05 FY06BIO 24,007 23,677 22,474 23,342 24,810 28,047 30,142 33,316 33,659 34,671 36,327 343 1,013 1,656 1.0% 3.0% 4.8%BUS 23,557 25,123 26,276 26,738 25,463 24,782 24,766 22,334 22,439 22,305 21,977 105 -134 -328 0.5% -0.6% -1.5%COM 47,157 48,402 48,993 50,663 50,140 54,838 59,716 61,941 63,193 64,586 65,942 1,252 1,393 1,356 2.0% 2.2% 2.1%EMPS 35,199 34,964 35,651 37,177 36,993 39,417 41,190 42,274 43,671 44,591 45,701 1,397 920 1,110 3.3% 2.1% 2.5%SD 1,000 1,074 861 970 825 776 1,021 1,036 1,046 1,057 1,059 10 11 2 1.0% 1.0% 0.2%SOC 36,737 37,022 35,547 35,637 36,040 38,936 42,696 44,960 45,520 46,122 46,722 560 601 600 1.2% 1.3% 1.3%Sub-total 167,657 170,262 169,802 174,527 174,271 186,796 199,531 205,861 209,528 213,332 217,728 3,667 3,804 4,396 1.8% 1.8% 2.1%Annual Change 1,701 2,605 -460 4,725 -256 12,525 12,735 6,330 3,667 3,804 4,396Annual % Chge 1.0% 1.6% -0.3% 2.8% -0.1% 7.2% 6.8% 3.2% 1.8% 1.8% 2.1%
ACE 19,357 23,717 23,191 26,120 28,123 29,451 28,811 27,024 27,025 28,516 30,087 1 1,491 1,571 0.0% 5.5% 5.5%Annual Change 1,864 4,360 -526 2,929 2,003 1,328 -641 -1,786 1 1,491 1,571Annual % Chge 10.7% 22.5% -2.2% 12.6% 7.7% 4.7% -2.2% -6.2% 0.0% 5.5% 5.5%
Total College 187,014 193,979 192,993 200,647 202,394 216,247 228,341 232,885 236,553 241,848 247,815 3,668 5,295 5,967 1.6% 2.2% 2.5%Annual Change 3,565 6,965 -986 7,654 1,747 13,853 12,094 4,544 3,668 5,295 5,967Annual % Chge 1.9% 3.7% -0.5% 4.0% 0.9% 6.8% 5.6% 2.0% 1.6% 2.2% 2.5%
10/11/2004 5 Proj_FY05-07_final_deansrevisions.xls

Table 2Adult and Community Education Division
Midterm Credit HoursActual and Projected FY97-07
(Based on Moving Eight-Year Average of Annual Percent Change Adjusted for Available FY05 Data)
Department FY97 FY98 FY99 FY00 FY01 FY02 FY03 FY04Projected
FY05Projected
FY06Projected
FY07Projected
FY05Projected
FY06Projected
FY07Projected
FY05Projected
FY06Projected
FY07
ABE 3,825 3,765 3,099 3,125 2,787 3,069 3,429 3,942 3,942 4,010 4,090 0 68 80 0.0% 1.7% 2.0%
ADE 138 576 524 624 894 1,016 815 911 911 966 995 1 55 29 0.1% 6.0% 3.0%
ESL 13,206 16,727 17,088 19,298 20,569 21,424 20,687 18,142 18,142 19,411 20,770 0 1,269 1,359 0.0% 7.0% 7.0%
GED 1,792 2,390 2,350 2,232 2,265 2,470 2,033 2,098 2,098 2,140 2,183 0 42 43 0.0% 2.0% 2.0%
VED (1.6) 1/ 396 259 130 841 1,608 1,472 1,847 1,932 1,932 1,989 2,049 1 57 60 0.0% 3.0% 3.0%
TOTAL 19,357 23,717 23,191 26,120 28,123 29,451 28,811 27,024 27,025 28,516 30,087 1 1,491 1,571 0.0% 5.5% 5.5%
Annual Change 1,864 4,360 (526) 2,929 2,003 1,328 -641 -1,786 1 1,491 1,571
% Change YTY 10.7% 22.5% -2.2% 12.6% 7.7% 4.7% -2.2% -6.2% 0.0% 5.5% 5.5%
Notes:1/ Vocational Education includes all vocational programs under the PCS Code 1.6 in the Continuing Education department. Prior to FY00, VED was reported for VST--Vocational Skills Training and General Studies.2/ The model's projections were revised by the Dean of Adult Education Division. Over the past 2 years, ACEDV funding has fluctuated widely. This has resulted in constantly changing the numbers of sections offered at extension sites. This unpredictability resulted in drops in student enrollment. With additional funds from the Educational Fund account, the division can schedule their classes and promote them earlier. In Fall 2004, ACEDV has already seen a 5% increase and expect more with late starting classes.
Projected Number Change Projected Percent ChangeProjected Credit Hours 2/
10/11/2004 6 Proj_FY05-07_final_deansrevisions.xls
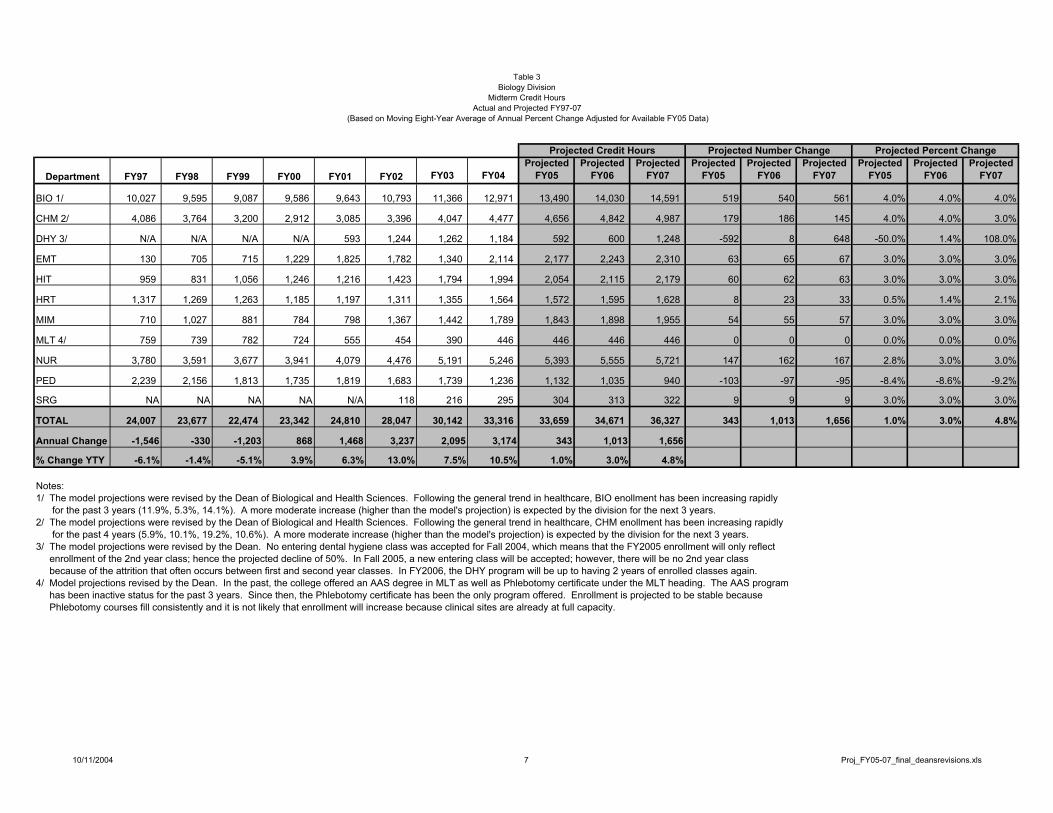
Table 3Biology Division
Midterm Credit HoursActual and Projected FY97-07
(Based on Moving Eight-Year Average of Annual Percent Change Adjusted for Available FY05 Data)
Department FY97 FY98 FY99 FY00 FY01 FY02 FY03 FY04Projected
FY05Projected
FY06Projected
FY07Projected
FY05Projected
FY06Projected
FY07Projected
FY05Projected
FY06Projected
FY07
BIO 1/ 10,027 9,595 9,087 9,586 9,643 10,793 11,366 12,971 13,490 14,030 14,591 519 540 561 4.0% 4.0% 4.0%
CHM 2/ 4,086 3,764 3,200 2,912 3,085 3,396 4,047 4,477 4,656 4,842 4,987 179 186 145 4.0% 4.0% 3.0%
DHY 3/ N/A N/A N/A N/A 593 1,244 1,262 1,184 592 600 1,248 -592 8 648 -50.0% 1.4% 108.0%
EMT 130 705 715 1,229 1,825 1,782 1,340 2,114 2,177 2,243 2,310 63 65 67 3.0% 3.0% 3.0%
HIT 959 831 1,056 1,246 1,216 1,423 1,794 1,994 2,054 2,115 2,179 60 62 63 3.0% 3.0% 3.0%
HRT 1,317 1,269 1,263 1,185 1,197 1,311 1,355 1,564 1,572 1,595 1,628 8 23 33 0.5% 1.4% 2.1%
MIM 710 1,027 881 784 798 1,367 1,442 1,789 1,843 1,898 1,955 54 55 57 3.0% 3.0% 3.0%
MLT 4/ 759 739 782 724 555 454 390 446 446 446 446 0 0 0 0.0% 0.0% 0.0%
NUR 3,780 3,591 3,677 3,941 4,079 4,476 5,191 5,246 5,393 5,555 5,721 147 162 167 2.8% 3.0% 3.0%
PED 2,239 2,156 1,813 1,735 1,819 1,683 1,739 1,236 1,132 1,035 940 -103 -97 -95 -8.4% -8.6% -9.2%
SRG NA NA NA NA N/A 118 216 295 304 313 322 9 9 9 3.0% 3.0% 3.0%
TOTAL 24,007 23,677 22,474 23,342 24,810 28,047 30,142 33,316 33,659 34,671 36,327 343 1,013 1,656 1.0% 3.0% 4.8%
Annual Change -1,546 -330 -1,203 868 1,468 3,237 2,095 3,174 343 1,013 1,656
% Change YTY -6.1% -1.4% -5.1% 3.9% 6.3% 13.0% 7.5% 10.5% 1.0% 3.0% 4.8%
Notes:1/ The model projections were revised by the Dean of Biological and Health Sciences. Following the general trend in healthcare, BIO enollment has been increasing rapidly for the past 3 years (11.9%, 5.3%, 14.1%). A more moderate increase (higher than the model's projection) is expected by the division for the next 3 years.2/ The model projections were revised by the Dean of Biological and Health Sciences. Following the general trend in healthcare, CHM enollment has been increasing rapidly for the past 4 years (5.9%, 10.1%, 19.2%, 10.6%). A more moderate increase (higher than the model's projection) is expected by the division for the next 3 years.3/ The model projections were revised by the Dean. No entering dental hygiene class was accepted for Fall 2004, which means that the FY2005 enrollment will only reflect enrollment of the 2nd year class; hence the projected decline of 50%. In Fall 2005, a new entering class will be accepted; however, there will be no 2nd year class because of the attrition that often occurs between first and second year classes. In FY2006, the DHY program will be up to having 2 years of enrolled classes again.4/ Model projections revised by the Dean. In the past, the college offered an AAS degree in MLT as well as Phlebotomy certificate under the MLT heading. The AAS program has been inactive status for the past 3 years. Since then, the Phlebotomy certificate has been the only program offered. Enrollment is projected to be stable because Phlebotomy courses fill consistently and it is not likely that enrollment will increase because clinical sites are already at full capacity.
Projected Number Change Projected Percent ChangeProjected Credit Hours
10/11/2004 7 Proj_FY05-07_final_deansrevisions.xls

Table 4Business Division
Midterm Credit HoursActual and Projected FY97-07
(Based on Moving Eight-Year Average of Annual Percent Change Adjusted for Available FY05 Data)
Department FY97 FY98 FY99 FY00 FY01 FY02 FY03 FY04Projected
FY05Projected
FY06Projected
FY07Projected
FY05Projected
FY06Projected
FY07Projected
FY05Projected
FY06Projected
FY07
ACC 4,385 4,220 3,763 3,438 3,387 3,916 4,224 3,827 3,741 3,643 3,554 -86 -98 -90 -2.2% -2.6% -2.5%
AOS 3,995 3,260 3,351 3,096 3,345 3,468 4,280 4,256 4,382 4,417 4,550 126 35 133 3.0% 0.8% 3.0%
BUS 6,105 6,315 5,940 5,817 5,766 6,243 6,555 6,228 6,140 6,089 6,007 -88 -51 -83 -1.4% -0.8% -1.4%
CIS 7,724 9,986 11,827 13,012 11,778 10,212 8,739 6,975 7,096 7,044 6,727 121 -52 -316 1.7% -0.7% -4.5%
FSM 758 874 804 800 893 943 968 1,048 1,079 1,112 1,140 31 32 28 3.0% 3.0% 2.5%
Total 23,557 25,123 26,276 26,738 25,463 24,782 24,766 22,334 22,439 22,305 21,977 105 -134 -328 0.5% -0.6% -1.5%
Annual Change 1,655 1,566 1,153 462 -1,275 -681 -16 -2,432 105 -134 -328
% Change YTY 7.6% 6.6% 4.6% 1.8% -4.8% -2.7% -0.1% -9.8% 0.5% -0.6% -1.5%
Notes:1/ No revisions on the model projections were made by the Dean of Business Division.
Projected Credit Hours 1/ Projected Percent ChangeProjected Number Change
10/11/2004 8 Proj_FY05-07_final_deansrevisions.xls

Table 5Communication Arts, Humanities and Fine Arts Division
Midterm Credit HoursActual and Projected FY97-07
(Based on Moving Eight-Year Average of Annual Percent Change Adjusted for Available FY05 Data)
Department FY97 FY98 FY99 FY00 FY01 FY02 FY03 FY04 Projected
FY05Projected
FY06Projected
FY07Projected
FY05Projected
FY06Projected
FY07Projected
FY05Projected
FY06Projected
FY07
ARA N/A N/A N/A 40 104 72 64 56 58 59 61 2 2 2 3.0% 3.0% 3.0%ART 4,088 4,313 4,502 4,486 4,974 5,123 5,342 5,209 5,365 5,511 5,641 156 146 130 3.0% 2.7% 2.4%CHI 160 172 112 92 124 120 164 216 222 229 236 6 7 7 3.0% 3.0% 3.0%COM 1,089 1,584 1,713 2,015 1,895 1,371 1,421 1,407 1,449 1,493 1,505 42 43 12 3.0% 3.0% 0.8%CSS 204 234 273 258 291 372 285 297 306 315 325 9 9 9 3.0% 3.0% 3.0%DNC N/A N/A 411 558 654 738 858 1,038 1,069 1,101 1,134 31 32 33 3.0% 3.0% 3.0%ENG 18,846 19,319 19,468 19,863 19,146 21,188 22,580 23,380 23,824 24,312 24,796 444 488 484 1.9% 2.0% 2.0%FRN 427 423 483 401 292 523 615 548 564 581 599 16 17 17 3.0% 3.0% 3.0%GER 224 156 200 276 272 264 270 368 379 390 402 11 11 12 3.0% 3.0% 3.0%HUM 3,115 3,072 3,254 3,612 4,185 4,803 5,577 6,003 6,183 6,369 6,560 180 185 191 3.0% 3.0% 3.0%ITL 108 148 160 207 236 196 184 256 264 272 280 8 8 8 3.0% 3.0% 3.0%JPN 184 252 280 340 332 288 316 516 531 547 564 15 16 16 3.0% 3.0% 3.0%LAS 33 81 - - 42 - - - - - - - - - NA NA NALMT (LTA) 261 126 205 230 162 243 311 244 248 256 263 4 7 8 1.7% 3.0% 3.0%MUS 2,139 2,090 2,121 2,261 1,962 2,227 2,282 2,339 2,361 2,372 2,392 22 12 20 0.9% 0.5% 0.8%PHI 5,766 6,057 5,868 6,114 5,988 6,456 7,038 7,173 7,304 7,456 7,583 131 152 127 1.8% 2.1% 1.7%RUS N/A 72 N/A 48 36 108 112 188 194 199 205 6 6 6 3.0% 3.0% 3.0%SPA 4,036 3,919 3,511 3,427 3,246 3,334 4,208 4,089 4,121 4,110 4,113 32 (11) 3 0.8% -0.3% 0.1%CMM (SPE) 5,952 5,757 5,934 5,853 5,718 6,762 7,539 7,899 8,014 8,254 8,502 115 240 248 1.5% 3.0% 3.0%THE 525 627 498 582 481 650 550 715 736 759 781 21 22 23 3.0% 3.0% 3.0%
Total 47,157 48,402 48,993 50,663 50,140 54,838 59,716 61,941 63,193 64,586 65,942 1,252 1,393 1,356 2.0% 2.2% 2.1%
Annual Change 1,502 1,245 591 1,670 -523 4,698 4,878 2,225 1,252 1,393 1,356
% Change YTY 3.3% 2.6% 1.2% 3.4% -1.0% 9.4% 8.9% 3.7% 2.0% 2.2% 2.1%Notes:1/ No revisions on the model projections were made by the Dean of Communication Arts, Humanities and Fine Arts Division.
Projected Credit Hours 1/ Projected Percent ChangeProjected Number Change
10/11/2004 9 Proj_FY05-07_final_deansrevisions.xls

Table 6Engineering, Math, Physical Sciences Division
Midterm Credit HoursActual and Projected FY97-07
(Based on Moving Eight-Year Average of Annual Percent Change Adjusted for Available FY05 Data)
Department FY97 FY98 FY99 FY00 FY01 1/ FY02 FY03 FY04Projected
FY05Projected
FY06Projected
FY07Projected
FY05Projected
FY06Projected
FY07Projected
FY05Projected
FY06Projected
FY07ABR 1/ 290 290 220 230 199 340 426 397 809 921 984 412 112 63 103.8% 13.8% 6.8%ARC 273 240 270 375 327 387 384 420 433 446 459 13 13 13 3.0% 3.0% 3.0%AST 2/ 240 232 220 244 176 204 224 204 241 239 244 37 -2 5 18.1% -0.8% 2.1%AUT 3/ 1,592 2,152 1,937 1,814 1,911 2,449 2,822 3,277 3,675 3,777 3,881 398 102 104 12.1% 2.8% 2.8%BCT 501 459 477 576 474 507 492 525 534 536 544 9 2 8 1.8% 0.4% 1.5%CAD 4/ 1,614 1,635 1,620 1,593 1,392 1,539 1,204 1,101 1,138 1,176 1,209 37 38 33 3.4% 3.3% 2.8%CIV 166 123 75 165 196 129 102 138 142 146 151 4 4 4 3.0% 3.0% 3.0%CNA N/A N/A N/A 354 2,037 2,307 1,329 882 908 936 964 26 27 28 3.0% 3.0% 3.0%CNC N/A N/A N/A N/A 201 186 231 277 285 294 303 8 9 9 3.0% 3.0% 3.0%DFT 292 298 270 280 155 125 235 100 103 108 120 3 5 12 3.0% 4.9% 11.1%EGR 5/ 500 520 392 510 401 400 432 418 420 422 424 2 2 2 0.5% 0.5% 0.5%EL 1,115 N/A N/A N/A N/A N/A N/A N/A N/A N/A N/A N/A N/A N/A N/A N/A N/AEIT N/A N/A N/A N/A N/A N/A 75 185 191 196 202 6 6 6 3.0% 3.0% 3.0%ELC 6/ N/A 441 298 351 321 226 250 282 285 290 294 3 5 4 1.1% 1.8% 1.4%ELT N/A 611 596 1,187 1,426 1,272 1,027 983 1,012 1,043 1,074 29 30 31 3.0% 3.0% 3.0%FLU 57 N/A N/A N/A N/A N/A N/A N/A N/A N/A N/A N/A N/A N/A N/A N/A N/AGEO 7/ 2,533 2,613 2,546 2,294 2,341 2,394 2,507 2,505 2,510 2,530 2,550 5 20 20 0.2% 0.8% 0.8%IS 8/ 885 661 570 573 52 N/A 34 30 30 32 34 0 2 2 0.0% 6.7% 6.3%IMR N/A 216 237 210 147 207 198 231 238 245 252 7 7 7 3.0% 3.0% 3.0%MCD 9/ 299 295 305 201 239 191 173 165 167 170 175 2 3 5 1.2% 1.8% 2.9%MCS 10/ 277 289 290 278 280 214 237 213 216 220 230 3 4 10 1.4% 1.9% 4.5%MFG 27 0 0 27 12 0 0 0 0 0 0 0 0 0 0.0% 0.0% 0.0%MTH 20,593 19,916 21,354 21,918 21,233 22,530 24,382 24,976 25,302 25,730 26,325 326 428 595 1.3% 1.7% 2.3%MTT N/A N/A N/A N/A 234 258 351 249 256 264 272 7 8 8 3.0% 3.0% 3.0%PHY 1,848 1,902 1,936 1,940 1,523 1,717 1,940 2,083 2,096 2,120 2,139 13 24 20 0.6% 1.1% 0.9%RAC 1,509 1,341 1,411 1,446 1,319 1,477 1,780 2,066 2,105 2,168 2,233 39 63 65 1.9% 3.0% 3.0%WLD 11/ 474 595 489 497 349 307 313 387 388 391 441 1 3 50 0.3% 0.8% 12.8%WWW 114 135 138 114 48 51 42 180 185 191 197 5 6 6 3.0% 3.0% 3.0%
Total 35,199 34,964 35,651 37,177 36,993 39,417 41,190 42,274 43,671 44,591 45,701 1,397 920 1,110 3.3% 2.1% 2.5%
Annual Change -102 -235 687 1,526 -184 2,424 1,773 1,084 1,397 920 1,110
% Change YTY -0.3% -0.7% 2.0% 4.3% -0.5% 6.6% 4.5% 2.6% 3.3% 2.1% 2.5%
Notes:1/ Model's projections were revised by the Dean based on actual Fall 2004 enrollments. Enrollment should be steady for the next few semesters.2/ Model's projections were revised by the Dean because there is a plan to offer 2 sections in the fall semester and to develop a new course AST II in the spring.3/ Model's projections were revised by the Dean based on actual Fall 2004 enrollments. Enrollment should be steady for the next few semesters. The division will also offer more sections after the division moves to the Technology Building.4/ Model's projections were revised by the Dean based on actual Fall 2004 enrollment. Enrollment should be steady for the next few semesters. There will be new curriculum offerings after the division moves to the Technology Building.5/ Model's projections were revised by the Dean based on actual Fall 2004 enrollment. New recruitment activities are being initiated for this program.6/ Model's projections were revised by the Dean because a new EST program is planned to be offered in spring 2005 with the Navy.7/ Model's projections were revised by the Dean based on actual Fall 2004 enrollment. Additional sections are being offered at the Lakeshore campus and Southlake Center. With the addition of a new classroom/laboratory area in reference to the remodeling project, new sections will be offered at the Grayslake campus.8/ Model's projections were revised by the Dean because there is only one course offered now. Enrollments vary based on the need.9/ Model's projections were revised by the Dean because new curriculum is being developed and will be offered in spring 2005. New recruitment activities are being implemented in fall 2004.10/ Model's projections were revised by the Dean because a new course is being offered this fall 2004.11/ Model's projections were revised by the Dean based on actual Fall 2004 enrollments. Enrollment should be steady for the next few semesters.
Projected Number ChangeProjected Number ChangeProjected Credit Hours
10/11/2004 10 Proj_FY05-07_final_deansrevisions.xls

Table 7Social Sciences Division
Midterm Credit HoursActual and Projected FY97-07
(Based on Moving Eight-Year Average of Annual Percent Change Adjusted for Available FY05 Data)
Department 1/ FY97 FY98 FY99 FY00 FY01 FY02 FY03 FY04 Projected
FY05Projected
FY06Projected
FY07Projected
FY05Projected
FY06Projected
FY07Projected
FY05Projected
FY06Projected
FY07
ANT 1,665 1,776 1,542 1,380 1,533 1,632 1,599 2,055 2,104 2,160 2,207 49 56 47 2.4% 2.7% 2.2%
CRJ 2,799 2,616 2,541 3,018 2,745 3,354 3,918 4,332 4,462 4,596 4,734 130 134 138 3.0% 3.0% 3.0%
ECE N/A N/A N/A N/A 640 944 1,295 1,470 1,514 1,560 1,606 44 45 47 3.0% 3.0% 3.0%
ECO 2,949 3,012 3,000 2,862 2,964 3,456 3,792 3,858 3,974 4,092 4,215 116 118 123 3.0% 3.0% 3.0%
EDU 414 474 402 516 902 1,223 1,385 1,573 1,620 1,669 1,719 47 49 50 3.0% 3.0% 3.0%
FST 711 687 471 366 357 468 408 411 408 382 357 (3) (25) (25) -0.8% -6.2% -6.5%
GEG 1,692 1,881 1,923 1,842 1,830 1,905 1,947 1,959 1,985 2,007 2,003 26 22 (3) 1.3% 1.1% -0.2%
HST 5,673 5,982 5,856 5,514 5,739 5,760 6,588 6,549 6,669 6,749 6,794 120 80 45 1.8% 1.2% 0.7%
HUS 2,492 2,387 2,556 2,676 1,459 1,157 1,196 1,168 1,067 968 872 (101) (99) (96) -8.6% -9.3% -9.9%
PSC 2,508 2,679 2,232 2,109 2,004 2,421 2,586 2,619 2,599 2,598 2,575 (20) (1) (23) -0.8% 0.0% -0.9%
PSY 9,600 9,459 9,180 9,630 10,074 10,554 11,427 11,697 11,851 12,055 12,311 154 205 256 1.3% 1.7% 2.1%
SOC 6,234 6,069 5,844 5,724 5,751 5,952 6,477 6,789 6,780 6,789 6,822 (9) 9 33 -0.1% 0.1% 0.5%
SSI N/A N/A N/A N/A N/A 86 0 0 0 0 0 0 0 0 N/A N/A N/A
SST N/A N/A N/A N/A 42 24 78 282 290 299 308 8 9 9 3.0% 3.0% 3.0%
SWK N/A N/A N/A N/A N/A N/A N/A 198 198 198 198 - - - 0.0% 0.0% 0.0%
TOTAL 36,737 37,022 35,547 35,637 36,040 38,936 42,696 44,960 45,520 46,122 46,722 560 601 600 1.2% 1.3% 1.3%
Annual Change 194 285 -1,475 90 403 2,896 3,760 2,264 560 601 600
% Change YTY 0.5% 0.8% -4.0% 0.3% 1.1% 8.0% 9.7% 5.3% 1.2% 1.3% 1.3%
Notes:1/ No revisions were made on the model's projections by the Dean.
Projected Credit Hours 1/ Projected Percent ChangeProjected Number Change
10/11/2004 11 Proj_FY05-07_final_deansrevisions.xls

Table 8Student DevelopmentMidterm Credit Hours
Actual and Projected FY97-07(Based on Moving Eight-Year Average of Annual Percent Change Adjusted for Available FY05 Data)
Department FY97 FY98 FY99 FY00 FY01 FY02 FY03 FY04Projected
FY05Projected
FY06Projected
FY07Projected
FY05Projected
FY06Projected
FY07Projected
FY05Projected
FY06Projected
FY07
PDS 450 496 444 526 432 425 508 547 562 577 586 15 15 9 2.8% 2.6% 1.6%
EWE 550 578 417 444 393 351 513 489 484 480 473 -5 -4 -7 -1.1% -0.8% -1.5%
Total 1,000 1,074 861 970 825 776 1,021 1,036 1,046 1,057 1,059 10 11 2 1.0% 1.0% 0.2%
Annual Change -2 74 -213 109 -145 -49 245 15 10 11 2
% Change YTY -0.2% 7.4% -19.8% 12.7% -14.9% -5.9% 31.6% 1.5% 1.0% 1.0% 0.2%
Notes:1/ No revisions were made on the model's projections by the Directors of Counseling and Career and Placement Services.
Projected Credit Hours 1/ Projected Percent ChangeProjected Number Change
10/11/2004 12 Proj_FY05-07_final_deansrevisions.xls

Figure 1Midterm Credit HoursActual and Projected
FY93-07
Total College
0
50,000
100,000
150,000
200,000
250,000
300,000
FY93FY94FY95FY96FY97FY98FY99FY00FY01FY02FY03FY04FY05FY06FY07
Projected
SOC
0
5,000
10,000
15,000
20,000
25,000
30,000
35,000
40,000
45,000
50,000
FY93
FY95
FY97
FY99
FY01
FY03
FY05
FY07
Projected
BIO
0
5,000
10,000
15,000
20,000
25,000
30,000
35,000
40,000
FY93
FY95
FY97
FY99
FY01
FY03
FY05
FY07
Projected
COM
0
10,000
20,000
30,000
40,000
50,000
60,000
70,000
FY93FY95FY97FY99FY01FY03FY05FY07
Projected
EMPS
0
5,000
10,000
15,000
20,000
25,000
30,000
35,000
40,000
45,000
50,000
FY93
FY95
FY97
FY99
FY01
FY03
FY05
FY07
Projected
BUS
-
5,000
10,000
15,000
20,000
25,000
30,000
FY93
FY95
FY97
FY99
FY01
FY03
FY05
FY07
Projected
ACE
0
5,000
10,000
15,000
20,000
25,000
30,000
35,000
FY95FY96FY97FY98FY99FY00FY01FY02FY03FY04FY05FY06FY07
Projected
10/11/2004 13 Proj_FY05-07_final_deansrevisions.xls

Division Departme FY93 FY94 FY95 FY96 FY97 FY98 FY99 FY00 1/ FY01 2/ FY02 FY03 FY04 FY05 FY06 FY07% Chg. FY05
BUS RLE 1391 1102 910 672 590 468 591 575 294 N/A NA NA NA NA NA NACOM LAS 0 39 30 219 33 81 0 0 42 0 0 0 0 0 0 NAEMPS EL 1,023 1,400 1,142 1,205 1,115 N/A N/A N/A N/A N/A N/A N/A N/A N/A N/A NAEMPS FLU 78 60 81 N/A 57 N/A N/A N/A N/A N/A N/A N/A N/A N/A N/A NAEMPS MFG N/A N/A N/A N/A 27 N/A N/A 27 12 N/A 0 0 0 0 0 NASOC SSI N/A N/A N/A N/A N/A N/A N/A N/A N/A 86 0 0 0 0 0 NABIO DHY N/A N/A N/A N/A N/A N/A N/A N/A 593 1,244 1,262 1,184 592 600 1,248 3.0%BIO EMT (FST N/A N/A N/A N/A 130 705 715 1229 1,825 1,782 1,340 2,114 2,177 2,243 2,310 3.0%BIO HIT 998 917 1144 1083 959 831 1056 1246 1,216 1,423 1,794 1,994 2,054 2,115 2,179 3.0%BIO MIM 1152 1294 1272 977 710 1027 881 784 798 1,367 1,442 1,789 1,843 1,898 1,955 3.0%BIO SRG N/A N/A N/A N/A N/A N/A N/A N/A N/A 118 216 295 304 313 322 3.0%BUS FSM 861 884 608 693 758 874 804 800 893 943 968 1,048 1,079 1,112 1,140 3.0%COM ARA N/A N/A N/A N/A N/A N/A N/A 40 104 72 64 56 58 59 61 3.0%COM ART 3141 2975 3127 3434 4088 4313 4502 4486 4,974 5,123 5,342 5,209 5,365 5,511 5,641 3.0%COM CHI 28 100 196 136 160 172 112 92 124 120 164 216 222 229 236 3.0%COM COM N/A N/A N/A N/A 1089 1584 1713 2015 1,895 1,371 1,421 1,407 1,449 1,493 1,505 3.0%COM CSS 267 187 134 225 204 234 273 258 291 372 285 297 306 315 325 3.0%COM DNC N/A N/A N/A N/A N/A N/A 411 558 654 738 858 1,038 1,069 1,101 1,134 3.0%COM FRN 712 628 589 419 427 423 483 401 292 523 615 548 564 581 599 3.0%COM GER 483 372 360 256 224 156 200 276 272 264 270 368 379 390 402 3.0%COM HUM 2838 2955 3166 3213 3115 3072 3254 3612 4,185 4,803 5,577 6,003 6,183 6,369 6,560 3.0%COM ITL N/A N/A 224 184 108 148 160 207 236 196 184 256 264 272 280 3.0%COM JPN 204 264 268 228 184 252 280 340 332 288 316 516 531 547 564 3.0%COM RUS N/A N/A 56 52 N/A 72 N/A 48 36 108 112 188 194 199 205 3.0%COM THE N/A N/A N/A N/A 525 627 498 582 481 650 550 715 736 759 781 3.0%EMPS ABR 260 270 245 255 290 290 220 230 199 340 426 397 809 921 984 3.0%EMPS ARC 459 417 243 345 273 240 270 375 327 387 384 420 433 446 459 3.0%EMPS AUT 1830 1942 1435 1366 1592 2152 1937 1814 1,911 2,449 2,822 3,277 3,675 3,777 3,881 3.0%EMPS CIV 182 231 190 105 166 123 75 165 196 129 102 138 142 146 151 3.0%EMPS CNA N/A N/A N/A N/A N/A N/A N/A 354 2,037 2,307 1,329 882 908 936 964 3.0%EMPS CNC N/A N/A N/A N/A N/A N/A N/A N/A 201 186 231 277 285 294 303 3.0%EMPS EIT N/A N/A N/A N/A N/A N/A N/A N/A N/A N/A 75 185 191 196 202 3.0%EMPS ELT N/A N/A N/A N/A N/A 611 596 1187 1,426 1,272 1,027 983 1,012 1,043 1,074 3.0%EMPS IMR N/A N/A N/A N/A N/A 216 237 210 147 207 198 231 238 245 252 3.0%EMPS MTT N/A N/A N/A N/A N/A N/A N/A N/A 234 258 351 249 256 264 272 3.0%
Table 9. Actual and Projected Mid-term Credit Hours, With Dean's Revisions FY04-06 Sorted by Percent Change for FY05Projected (With Dean's Revisions)Actual
10/11/2004 14 Proj_FY05-07_final_deansrevisions.xls

Division Departme FY93 FY94 FY95 FY96 FY97 FY98 FY99 FY00 1/ FY01 2/ FY02 FY03 FY04 FY05 FY06 FY07% Chg. FY05
Table 9. Actual and Projected Mid-term Credit Hours, With Dean's Revisions FY04-06 Sorted by Percent Change for FY05Projected (With Dean's Revisions)Actual
EMPS WWW 327 258 207 246 114 135 138 114 48 51 42 180 185 191 197 3.0%SOC CRJ 3339 3315 3054 2784 2799 2616 2541 3018 2,745 3,354 3,918 4,332 4,462 4,596 4,734 3.0%SOC ECE N/A N/A N/A N/A N/A N/A N/A N/A 640 944 1,295 1,470 1,514 1,560 1,606 3.0%SOC ECO 3024 3012 2679 2841 2949 3012 3000 2862 2,964 3,456 3,792 3,858 3,974 4,092 4,215 3.0%SOC EDU 384 372 369 363 414 474 402 516 902 1,223 1,385 1,573 1,620 1,669 1,719 3.0%SOC SST N/A N/A N/A N/A N/A N/A N/A N/A 42 24 78 282 290 299 308 3.0%ACE ADE N/A N/A 184 287 138 576 524 624 894 1,016 815 911 911 966 995 3.0%ACE ESL N/A N/A 10625 11351 13206 16727 17088 19298 20,569 21,424 20,687 18,142 18,142 19,411 20,770 3.0%ACE VED(1.6) N/A N/A N/A N/A N/A N/A N/A 841 1,608 1,472 1,847 1,932 1,932 1,989 2,049 3.0%BUS AOS (BSS 3859 3590 3481 3318 3995 3260 3351 3096 3,345 3,468 4,280 4,256 4,382 4,417 4,550 3.0%BIO NUR 4696 4192 4564 3955 3780 3591 3677 3941 4,079 4,476 5,191 5,246 5,393 5,555 5,721 2.8%SD PDS 406 N/A 382 432 450 496 444 526 432 425 508 547 562 577 586 2.8%SOC ANT 1374 1518 1497 1665 1665 1776 1542 1380 1,533 1,632 1,599 2,055 2,104 2,160 2,207 2.4%BIO BIO 10989 10912 10430 10332 10027 9595 9087 9586 9,643 10,793 11,366 12,971 13,490 14,030 14,591 2.1%COM ENG 17507 17460 18520 18710 18846 19319 19468 19863 19,146 21,188 22,580 23,380 23,824 24,312 24,796 1.9%EMPS RAC 1581 1496 1230 1741 1509 1341 1411 1446 1,319 1,477 1,780 2,066 2,105 2,168 2,233 1.9%SOC HST 5136 4812 5031 5304 5673 5982 5856 5514 5,739 5,760 6,588 6,549 6,669 6,749 6,794 1.8%COM PHI 5199 5064 5331 5778 5766 6057 5868 6114 5,988 6,456 7,038 7,173 7,304 7,456 7,583 1.8%EMPS BCT 765 753 582 444 501 459 477 576 474 507 492 525 534 536 544 1.8%COM LTA (LM 255 261 290 363 261 126 205 230 162 243 311 244 248 256 263 1.7%BUS CIS (DPR 6911 6632 6093 6356 7724 9986 11827 13012 11,778 10,212 8,739 6,975 7,096 7,044 6,727 1.7%ACE ABE N/A N/A 2751 3348 3825 3765 3099 3125 2,787 3,069 3,429 3,942 3,942 4,010 4,090 1.7%COM CMM (SP 6408 6271 6219 6690 5952 5757 5934 5853 5,718 6,762 7,539 7,899 8,014 8,254 8,502 1.5%SOC GEG 1908 1758 1638 1641 1692 1881 1923 1842 1,830 1,905 1,947 1,959 1,985 2,007 2,003 1.3%SOC PSY 10659 9891 9717 9795 9600 9459 9180 9630 10,074 10,554 11,427 11,697 11,851 12,055 12,311 1.3%EMPS MTH 19646 19956 20725 20962 20593 19916 21354 21918 21,233 22,530 24,382 24,976 25,302 25,730 26,325 1.3%COM MUS 2257 1986 2045 2050 2139 2090 2121 2261 1,962 2,227 2,282 2,339 2,361 2,372 2,392 0.9%COM SPA 2557 2551 3104 3698 4036 3919 3511 3427 3,246 3,334 4,208 4,089 4,121 4,110 4,113 0.8%EMPS PHY 1953 1904 1896 1916 1848 1902 1936 1940 1,523 1,717 1,940 2,083 2,096 2,120 2,139 0.6%BIO HRT 1464 1659 1359 1416 1317 1269 1263 1185 1,197 1,311 1,355 1,564 1,572 1,595 1,628 0.5%SOC SWK N/A N/A N/A N/A N/A N/A N/A N/A N/A N/A N/A 198 198 198 198 0.0%ACE GED N/A N/A 1755 2111 1792 2390 2350 2232 2,265 2,470 2,033 2,098 2,098 2,140 2,183 -0.1%SOC SOC 6495 6144 6150 6378 6234 6069 5844 5724 5,751 5,952 6,477 6,789 6,780 6,789 6,822 -0.1%BIO CHM 4569 4993 4904 4587 4086 3764 3200 2912 3,085 3,396 4,047 4,477 4,656 4,842 4,987 -0.6%SOC PSC 2874 2664 2721 2691 2508 2679 2232 2109 2,004 2,421 2,586 2,619 2,599 2,598 2,575 -0.8%
10/11/2004 15 Proj_FY05-07_final_deansrevisions.xls

Division Departme FY93 FY94 FY95 FY96 FY97 FY98 FY99 FY00 1/ FY01 2/ FY02 FY03 FY04 FY05 FY06 FY07% Chg. FY05
Table 9. Actual and Projected Mid-term Credit Hours, With Dean's Revisions FY04-06 Sorted by Percent Change for FY05Projected (With Dean's Revisions)Actual
SOC FST 339 282 276 501 711 687 471 366 357 468 408 411 408 382 357 -0.8%EMPS GEO 2476 2623 2551 2518 2533 2613 2546 2294 2,341 2,394 2,507 2,505 2,510 2,530 2,550 -1.0%SD EWE 599 N/A 551 570 550 578 417 444 393 351 513 489 484 480 473 -1.1%EMPS AST N/A N/A N/A N/A 240 232 220 244 176 204 224 204 241 239 244 -1.2%BUS BUS 7774 6936 6432 6507 6105 6315 5940 5817 5,766 6,243 6,555 6,228 6,140 6,089 6,007 -1.4%BUS ACC 5950 5214 4411 4356 4385 4220 3763 3438 3,387 3,916 4,224 3,827 3,741 3,643 3,554 -2.2%EMPS EGR 661 579 607 540 500 520 392 510 401 400 432 418 420 422 424 -2.8%EMPS MCS N/A N/A N/A N/A 277 289 290 278 280 214 237 213 216 220 230 -3.1%EMPS MCD 300 422 305 240 299 295 305 201 239 191 173 165 167 170 175 -3.8%EMPS WLD 618 710 581 578 474 595 489 497 349 307 313 387 388 391 441 -4.1%EMPS ELC N/A N/A N/A N/A N/A 441 298 351 321 226 250 282 285 290 294 -4.9%EMPS CAD 1594 1773 1455 1689 1614 1635 1620 1593 1,392 1,539 1,204 1,101 1,138 1,176 1,209 -5.8%EMPS DFT 424 340 354 319 292 298 270 280 155 125 235 100 103 108 120 -6.7%BIO MLT 605 968 946 801 759 739 782 724 555 454 390 446 446 446 446 -7.3%BIO PED 2543 2533 2368 2402 2239 2156 1813 1735 1,819 1,683 1,739 1,236 1,132 1,035 940 -8.4%SOC HUS (HUX 2596 2617 2603 2580 2492 2387 2556 2676 1,459 1,157 1,196 1,168 1,067 968 872 -8.6%EMPS IS (ISE, IS 1010 964 832 832 885 661 570 573 52 N/A 34 30 30 32 34 -10.0%Total 169938 165422 179225 183053 186618 193720 192863 200647 202,394 216,247 228,341 232,885 236,553 241,848 247,815 1.5%
Source: EECA Enrollment Analysis Various years (from SIMS4170) and S3 term files.
NOTES:1/ Revised to include the vocational courses VED with PCS code 1.6. These include Vocational Allied Health, Vocational Cosmetoogy, Vocational Arts and Crafts, Vocational Animal Care and Training, Vocational Photography, Vocational Skills Training, and Vocational-Vocational Training.2/ Revised based on revised S3 FY01 datafile. Revisions were made to correct for out of state students.
10/11/2004 16 Proj_FY05-07_final_deansrevisions.xls

Division Departme FY93 FY94 FY95 FY96 FY97 FY98 FY99 FY00 1/ FY01 2/ FY02 FY03 FY04 FY05 FY06 FY07Number
Chg FY05BUS RLE 1391 1102 910 672 590 468 591 575 294 N/A NA NA NA NA NA NACOM LAS 0 39 30 219 33 81 0 0 42 0 0 0 0 0 0 NAEMPS EL 1,023 1,400 1,142 1,205 1,115 N/A N/A N/A N/A N/A N/A N/A N/A N/A N/A NAEMPS FLU 78 60 81 N/A 57 N/A N/A N/A N/A N/A N/A N/A N/A N/A N/A NAEMPS MFG N/A N/A N/A N/A 27 N/A N/A 27 12 N/A 0 0 0 0 0 NASOC SSI N/A N/A N/A N/A N/A N/A N/A N/A N/A 86 0 0 0 0 0 NABIO BIO 10989 10912 10430 10332 10027 9595 9087 9586 9,643 10,793 11,366 12,971 13,490 14,030 14,591 519COM ENG 17507 17460 18520 18710 18846 19319 19468 19863 19,146 21,188 22,580 23,380 23,824 24,312 24,796 444EMPS ABR 260 270 245 255 290 290 220 230 199 340 426 397 809 921 984 412EMPS AUT 1830 1942 1435 1366 1592 2152 1937 1814 1,911 2,449 2,822 3,277 3,675 3,777 3,881 398EMPS MTH 19646 19956 20725 20962 20593 19916 21354 21918 21,233 22,530 24,382 24,976 25,302 25,730 26,325 326COM HUM 2838 2955 3166 3213 3115 3072 3254 3612 4,185 4,803 5,577 6,003 6,183 6,369 6,560 180BIO CHM 4569 4993 4904 4587 4086 3764 3200 2912 3,085 3,396 4,047 4,477 4,656 4,842 4,987 179COM ART 3141 2975 3127 3434 4088 4313 4502 4486 4,974 5,123 5,342 5,209 5,365 5,511 5,641 156SOC PSY 10659 9891 9717 9795 9600 9459 9180 9630 10,074 10,554 11,427 11,697 11,851 12,055 12,311 154BIO NUR 4696 4192 4564 3955 3780 3591 3677 3941 4,079 4,476 5,191 5,246 5,393 5,555 5,721 147COM PHI 5199 5064 5331 5778 5766 6057 5868 6114 5,988 6,456 7,038 7,173 7,304 7,456 7,583 131SOC CRJ 3339 3315 3054 2784 2799 2616 2541 3018 2,745 3,354 3,918 4,332 4,462 4,596 4,734 130BUS AOS (BSS 3859 3590 3481 3318 3995 3260 3351 3096 3,345 3,468 4,280 4,256 4,382 4,417 4,550 126BUS CIS (DPR 6911 6632 6093 6356 7724 9986 11827 13012 11,778 10,212 8,739 6,975 7,096 7,044 6,727 121SOC HST 5136 4812 5031 5304 5673 5982 5856 5514 5,739 5,760 6,588 6,549 6,669 6,749 6,794 120SOC ECO 3024 3012 2679 2841 2949 3012 3000 2862 2,964 3,456 3,792 3,858 3,974 4,092 4,215 116COM CMM (SP 6408 6271 6219 6690 5952 5757 5934 5853 5,718 6,762 7,539 7,899 8,014 8,254 8,502 115BIO EMT (FST N/A N/A N/A N/A 130 705 715 1229 1,825 1,782 1,340 2,114 2,177 2,243 2,310 63BIO HIT 998 917 1144 1083 959 831 1056 1246 1,216 1,423 1,794 1,994 2,054 2,115 2,179 60BIO MIM 1152 1294 1272 977 710 1027 881 784 798 1,367 1,442 1,789 1,843 1,898 1,955 54SOC ANT 1374 1518 1497 1665 1665 1776 1542 1380 1,533 1,632 1,599 2,055 2,104 2,160 2,207 49SOC EDU 384 372 369 363 414 474 402 516 902 1,223 1,385 1,573 1,620 1,669 1,719 47SOC ECE N/A N/A N/A N/A N/A N/A N/A N/A 640 944 1,295 1,470 1,514 1,560 1,606 44COM COM N/A N/A N/A N/A 1089 1584 1713 2015 1,895 1,371 1,421 1,407 1,449 1,493 1,505 42EMPS RAC 1581 1496 1230 1741 1509 1341 1411 1446 1,319 1,477 1,780 2,066 2,105 2,168 2,233 39EMPS AST N/A N/A N/A N/A 240 232 220 244 176 204 224 204 241 239 244 37EMPS CAD 1594 1773 1455 1689 1614 1635 1620 1593 1,392 1,539 1,204 1,101 1,138 1,176 1,209 37COM SPA 2557 2551 3104 3698 4036 3919 3511 3427 3,246 3,334 4,208 4,089 4,121 4,110 4,113 32BUS FSM 861 884 608 693 758 874 804 800 893 943 968 1,048 1,079 1,112 1,140 31
Table 10. Actual and Projected Mid-term Credit Hours, With Dean's Revisions FY05-07 Sorted by Numeric Change for FY05Actual Projected (With Dean's Revisions)
10/11/2004 17 Proj_FY05-07_final_deansrevisions.xls

Division Departme FY93 FY94 FY95 FY96 FY97 FY98 FY99 FY00 1/ FY01 2/ FY02 FY03 FY04 FY05 FY06 FY07Number
Chg FY05
Table 10. Actual and Projected Mid-term Credit Hours, With Dean's Revisions FY05-07 Sorted by Numeric Change for FY05Actual Projected (With Dean's Revisions)
COM DNC N/A N/A N/A N/A N/A N/A 411 558 654 738 858 1,038 1,069 1,101 1,134 31EMPS ELT N/A N/A N/A N/A N/A 611 596 1187 1,426 1,272 1,027 983 1,012 1,043 1,074 29EMPS CNA N/A N/A N/A N/A N/A N/A N/A 354 2,037 2,307 1,329 882 908 936 964 26SOC GEG 1908 1758 1638 1641 1692 1881 1923 1842 1,830 1,905 1,947 1,959 1,985 2,007 2,003 26COM MUS 2257 1986 2045 2050 2139 2090 2121 2261 1,962 2,227 2,282 2,339 2,361 2,372 2,392 22COM THE N/A N/A N/A N/A 525 627 498 582 481 650 550 715 736 759 781 21COM FRN 712 628 589 419 427 423 483 401 292 523 615 548 564 581 599 16COM JPN 204 264 268 228 184 252 280 340 332 288 316 516 531 547 564 15SD PDS 406 N/A 382 432 450 496 444 526 432 425 508 547 562 577 586 15EMPS PHY 1953 1904 1896 1916 1848 1902 1936 1940 1,523 1,717 1,940 2,083 2,096 2,120 2,139 13EMPS ARC 459 417 243 345 273 240 270 375 327 387 384 420 433 446 459 13COM GER 483 372 360 256 224 156 200 276 272 264 270 368 379 390 402 11EMPS BCT 765 753 582 444 501 459 477 576 474 507 492 525 534 536 544 9COM CSS 267 187 134 225 204 234 273 258 291 372 285 297 306 315 325 9BIO SRG N/A N/A N/A N/A N/A N/A N/A N/A N/A 118 216 295 304 313 322 9SOC SST N/A N/A N/A N/A N/A N/A N/A N/A 42 24 78 282 290 299 308 8EMPS CNC N/A N/A N/A N/A N/A N/A N/A N/A 201 186 231 277 285 294 303 8BIO HRT 1464 1659 1359 1416 1317 1269 1263 1185 1,197 1,311 1,355 1,564 1,572 1,595 1,628 8COM ITL N/A N/A 224 184 108 148 160 207 236 196 184 256 264 272 280 8EMPS MTT N/A N/A N/A N/A N/A N/A N/A N/A 234 258 351 249 256 264 272 7EMPS IMR N/A N/A N/A N/A N/A 216 237 210 147 207 198 231 238 245 252 7COM CHI 28 100 196 136 160 172 112 92 124 120 164 216 222 229 236 6COM RUS N/A N/A 56 52 N/A 72 N/A 48 36 108 112 188 194 199 205 6EMPS EIT N/A N/A N/A N/A N/A N/A N/A N/A N/A N/A 75 185 191 196 202 6EMPS WWW 327 258 207 246 114 135 138 114 48 51 42 180 185 191 197 5EMPS GEO 2476 2623 2551 2518 2533 2613 2546 2294 2,341 2,394 2,507 2,505 2,510 2,530 2,550 5COM LTA (LM 255 261 290 363 261 126 205 230 162 243 311 244 248 256 263 4EMPS CIV 182 231 190 105 166 123 75 165 196 129 102 138 142 146 151 4EMPS DFT 424 340 354 319 292 298 270 280 155 125 235 100 103 108 120 3EMPS ELC N/A N/A N/A N/A N/A 441 298 351 321 226 250 282 285 290 294 3EMPS MCS N/A N/A N/A N/A 277 289 290 278 280 214 237 213 216 220 230 3EMPS EGR 661 579 607 540 500 520 392 510 401 400 432 418 420 422 424 2EMPS MCD 300 422 305 240 299 295 305 201 239 191 173 165 167 170 175 2COM ARA N/A N/A N/A N/A N/A N/A N/A 40 104 72 64 56 58 59 61 2EMPS WLD 618 710 581 578 474 595 489 497 349 307 313 387 388 391 441 1
10/11/2004 18 Proj_FY05-07_final_deansrevisions.xls

Division Departme FY93 FY94 FY95 FY96 FY97 FY98 FY99 FY00 1/ FY01 2/ FY02 FY03 FY04 FY05 FY06 FY07Number
Chg FY05
Table 10. Actual and Projected Mid-term Credit Hours, With Dean's Revisions FY05-07 Sorted by Numeric Change for FY05Actual Projected (With Dean's Revisions)
ACE ADE N/A N/A 184 287 138 576 524 624 894 1,016 815 911 911 966 995 1ACE VED(1.6) N/A N/A N/A N/A N/A N/A N/A 841 1,608 1,472 1,847 1,932 1,932 1,989 2,049 1BIO MLT 605 968 946 801 759 739 782 724 555 454 390 446 446 446 446 0EMPS IS (ISE, IS 1010 964 832 832 885 661 570 573 52 N/A 34 30 30 32 34 0SOC SWK N/A N/A N/A N/A N/A N/A N/A N/A N/A N/A N/A 198 198 198 198 0ACE ABE N/A N/A 2751 3348 3825 3765 3099 3125 2,787 3,069 3,429 3,942 3,942 4,010 4,090 0ACE GED N/A N/A 1755 2111 1792 2390 2350 2232 2,265 2,470 2,033 2,098 2,098 2,140 2,183 0ACE ESL N/A N/A 10625 11351 13206 16727 17088 19298 20,569 21,424 20,687 18,142 18,142 19,411 20,770 0SOC FST 339 282 276 501 711 687 471 366 357 468 408 411 408 382 357 -3SD EWE 599 N/A 551 570 550 578 417 444 393 351 513 489 484 480 473 -5SOC SOC 6495 6144 6150 6378 6234 6069 5844 5724 5,751 5,952 6,477 6,789 6,780 6,789 6,822 -9SOC PSC 2874 2664 2721 2691 2508 2679 2232 2109 2,004 2,421 2,586 2,619 2,599 2,598 2,575 -20BUS ACC 5950 5214 4411 4356 4385 4220 3763 3438 3,387 3,916 4,224 3,827 3,741 3,643 3,554 -86BUS BUS 7774 6936 6432 6507 6105 6315 5940 5817 5,766 6,243 6,555 6,228 6,140 6,089 6,007 -88SOC HUS (HUX 2596 2617 2603 2580 2492 2387 2556 2676 1,459 1,157 1,196 1,168 1,067 968 872 -101BIO PED 2543 2533 2368 2402 2239 2156 1813 1735 1,819 1,683 1,739 1,236 1,132 1,035 940 -103BIO DHY N/A N/A N/A N/A N/A N/A N/A N/A 593 1,244 1,262 1,184 592 600 1,248 -592Total 169938 165422 179225 183053 186618 193720 192863 200647 202,394 216,247 228,341 232,885 236,553 241,848 247,815 3668
Source: EECA Enrollment Analysis Various years (from SIMS4170) and S3 term files.
NOTES:1/ Revised to include the vocational courses VED with PCS code 1.6. These include Vocational Allied Health, Vocational Cosmetoogy, Vocational Arts and Crafts, Vocational Animal Care and Training, Vocational Photography, Vocational Skills Training, and Vocational-Vocational Training.2/ Revised based on revised S3 FY01 datafile. Revisions were made to correct for out of state students.
10/11/2004 19 Proj_FY05-07_final_deansrevisions.xls

PART II
A Comparison of Projected and Actual FY04
Credit Hours
20

Part II A Comparison of Projected and Actual FY03 Credit Hours
For this part of the report, the projected credit hours and the actual credit hours for FY04 are compared for the results of: 1) the model projections; and 2) the revised deans’ projections. The charts and tables on pages 23-28 show the predicted and actual mid-term credit hours for each division and department. The model projections versus the actual credit hours are presented in Tables 11-12 and Figure 2 on pp. 23-25. The revised deans’ projections versus the actual credit hours are presented in Tables 13-14 and Figure 3 on pp. 26-28. The data used in projecting FY03 credit hours and actual FY03 credit hours data were obtained from the same source indicated in Part 1 of the report. Tables 11 and 13 and Figures 2 and 3 show the comparison of projected and actual enrollments for each division; and Tables 12 and 14 present the comparison at the department level. The difference between the projected FY04 and the actual FY04 mid-term credit hours is presented in the variance columns in each table. A positive variance indicates an over-estimation of credit hours, while a negative variance indicates an under-estimation. For new departments resulting from new initiatives or curriculum revisions, a comparison between predicted and actual data was not possible due to unavailable and/or not comparable data. The following summarizes the analysis. • As shown in Table 11, actual total College credit hours were overprojected by the
model projections by 1.2% (better than the revised deans’ projections). For the degree credit area, actual credit hours were greater than model projections by 0.5%. The model predictions were very close to the actual credit hours. However, the model forecast for the non-degree credit area was over actual credit hours by 14.5%.
• Table 11 shows that model forecasts for the divisions tend to have relatively larger
variances than the forecast for the College. The model projections for Communication Arts Division, Engineering Division, Student Development, and Social Sciences were close to the actual credit hours by + or – 3%. Model projections for Biology Division was under-projected by 8.3%; over-projected for Business Division by 11.9%; over-projected for Adult Education Division by 14.5%.
Table 12 provides a detailed comparison of the model projections to actual credit hours at the department level. It is important to note that projections at the department level tend to be less precise; hence, the variances range from –79% to +135%. However, some of the projections for the departments were within + or –3% of actual credit hours (e.g., Adult Education, Nursing, Humanities, Music, Philosophy, Speech, Architecture, Engineering, Geology, Mathematics, Geography, Political Science, and Psychology).
•
• The revised projections (with the deans’ revisions) show that, overall for the College,
credit hours were over-projected by 3.2% as shown in Table 13. For the degree credit area, the revised projections were over by 1.7% while the projections for the non-
21

degree credit area were over-projected by 14.5%. In the case of the non-degree credit area, the Adult Education Division dean did not have any revisions to the model projections.
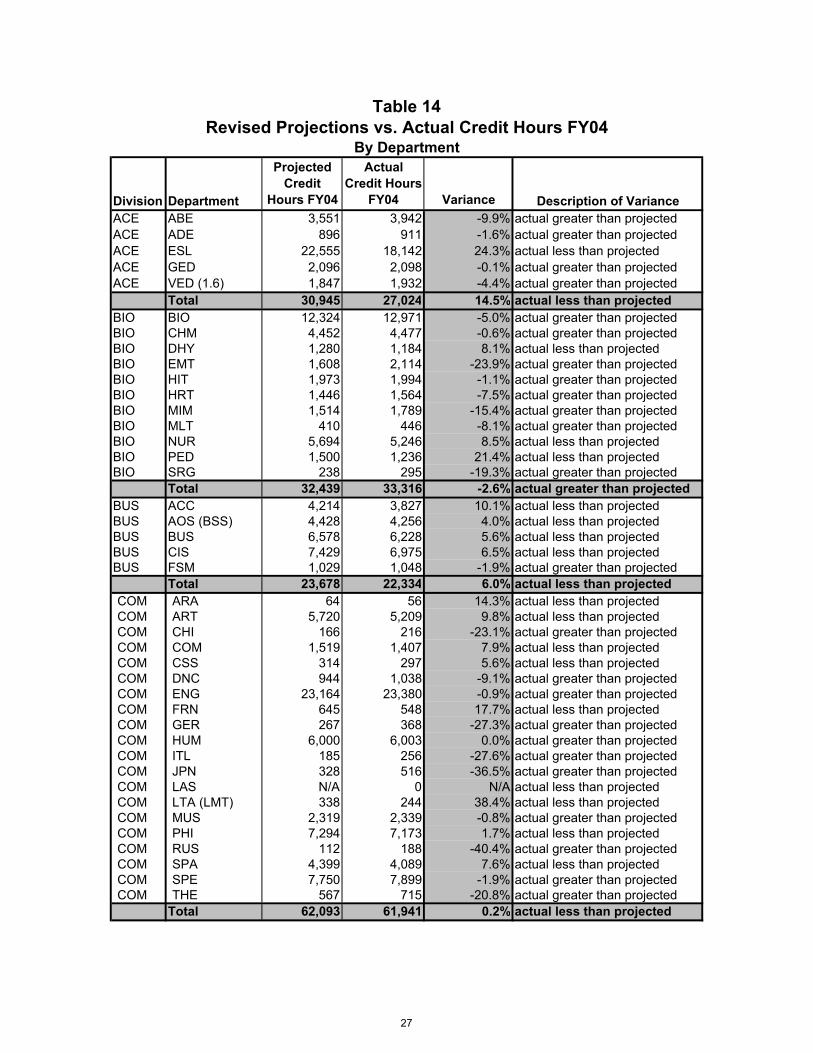
• Revisions to the model projections were made by the Business Division, Biology
Division, and Social Sciences Division. The deans’ revised projections for these areas resulted in: over-projection by 2.6% for the Biology Division, over-projection by 6% for the Business Division, and over-projection by 6.3% for the Social Sciences Division.
• Table 14 shows the variances for projected credit hours and actual credit hours for the
revised projections.
22

Division Projected Actual Variance Description of VarianceBIO 30,558 33,316 -8.3% actual greater than projectedBUS 24,988 22,334 11.9% actual less than projectedCOM 62,093 61,941 0.2% actual less than projectedEMPS 42,202 42,274 -0.2% actual greater than projectedSD 1,048 1,021 2.7% actual less than projectedSOC 43,830 44,960 -2.5% actual greater than projectedSub-total 204,721 205,846 -0.5% actual greater than projected
ACE 30,945 27,024 14.5% actual less than projected
Total College 235,666 232,870 1.2% actual less than projected
Table 11Model Projections vs. Actual Credit Hours FY04
By Division
Figure 2Model Projections vs. Actual Credit Hours FY04
By Division
-
10,000
20,000
30,000
40,000
50,000
60,000
70,000
BIO BUS COM EMPS SD SOC ACE
Division
Projected Actual
23

Division Department
Projected Credit
Hours FY04
Actual Credit Hours
FY04 Variance Description of VarianceACE ABE 3,551 3,942 -9.9% actual greater than projectedACE ADE 896 911 -1.6% actual greater than projectedACE ESL 22,555 18,142 24.3% actual less than projectedACE GED 2,096 2,098 -0.1% actual greater than projectedACE VED (1.6) 1,847 1,932 -4.4% actual greater than projected
Total 30,945 27,024 14.5% actual less than projectedBIO BIO 11,506 12,971 -11.3% actual greater than projectedBIO CHM 3,976 4,477 -11.2% actual greater than projectedBIO DHY 1,262 1,184 6.6% actual less than projectedBIO EMT 1,474 2,114 -30.3% actual greater than projectedBIO HIT 1,919 1,994 -3.8% actual greater than projectedBIO HRT 1,356 1,564 -13.3% actual greater than projectedBIO MIM 1,528 1,789 -14.6% actual greater than projectedBIO MLT 351 446 -21.3% actual greater than projectedBIO NUR 5,295 5,246 0.9% actual less than projectedBIO PED 1,676 1,236 35.7% actual less than projectedBIO SRG 216 295 -26.8% actual greater than projected
Total 30,558 33,316 -8.3% actual greater than projectedBUS ACC 4,214 3,827 10.1% actual less than projectedBUS AOS (BSS) 4,428 4,256 4.0% actual less than projectedBUS BUS 6,578 6,228 5.6% actual less than projectedBUS CIS 8,739 6,975 25.3% actual less than projectedBUS FSM 1,029 1,048 -1.9% actual greater than projected
Total 24,988 22,334 11.9% actual less than projectedCOM ARA 64 56 14.3% actual less than projectedCOM ART 5,720 5,209 9.8% actual less than projectedCOM CHI 166 216 -23.1% actual greater than projectedCOM COM 1,519 1,407 7.9% actual less than projectedCOM CSS 314 297 5.6% actual less than projectedCOM DNC 944 1,038 -9.1% actual greater than projectedCOM ENG 23,164 23,380 -0.9% actual greater than projectedCOM FRN 645 548 17.7% actual less than projectedCOM GER 267 368 -27.3% actual greater than projectedCOM HUM 6,000 6,003 0.0% actual greater than projectedCOM ITL 185 256 -27.6% actual greater than projectedCOM JPN 328 516 -36.5% actual greater than projectedCOM LAS N/A N/A N/A Not applicable.COM LTA (LMT) 338 244 38.4% actual less than projectedCOM MUS 2,319 2,339 -0.8% actual greater than projectedCOM PHI 7,294 7,173 1.7% actual less than projectedCOM RUS 112 188 -40.4% actual greater than projectedCOM SPA 4,399 4,089 7.6% actual less than projectedCOM SPE 7,750 7,899 -1.9% actual greater than projectedCOM THE 567 715 -20.8% actual greater than projected
Total 62,093 61,941 0.2% actual less than projected
Table 12Model Projections vs. Actual Credit Hours FY04
By Department
24

Division Department
Projected Credit
Hours FY04
Actual Credit Hours
FY04 Variance Description of Variance
Table 12Model Projections vs. Actual Credit Hours FY04
By Department
EMPS ABR 469 397 18.0% actual less than projectedEMPS ARC 415 420 -1.1% actual greater than projectedEMPS AST 224 204 9.8% actual less than projectedEMPS AUT 3,102 3,277 -5.3% actual greater than projectedEMPS BCT 487 525 -7.3% actual greater than projectedEMPS CAD 1,184 1,101 7.5% actual less than projectedEMPS CIV 106 138 -23.1% actual greater than projectedEMPS CNA 1,329 882 50.7% actual less than projectedEMPS CNC 231 277 -16.6% actual greater than projectedEMPS DFT 236 100 135.6% actual less than projectedEMPS EGR 420 418 0.4% actual less than projectedEMPS EIT 75 185 -59.5% actual greater than projectedEMPS ELC 229 282 -18.8% actual greater than projectedEMPS ELT 1,130 983 14.9% actual less than projectedEMPS FLU N/A N/A N/A Not applicable.EMPS GEO 2,504 2,505 0.0% actual greater than projectedEMPS IS 34 30 13.3% actual less than projectedEMPS IMR 200 231 -13.5% actual greater than projectedEMPS MCD 164 165 -0.3% actual greater than projectedEMPS MCS 232 213 9.1% actual less than projectedEMPS MFG 0 0 0.0% Not applicable.EMPS MTH 24,905 24,976 -0.3% actual greater than projectedEMPS MTT 351 249 41.0% actual less than projectedEMPS PHY 1,956 2083 -6.1% actual greater than projectedEMPS RAC 1,888 2066 -8.6% actual greater than projectedEMPS WLD 294 387 -24.1% actual greater than projectedEMPS WWW 38 180 -79.0% actual greater than projected
Total 42,202 42,274 -0.2% actual greater than projectedSD PDS 531 508 4.4% actual less than projectedSD EWE 518 513 1.0% actual less than projected
Total 1,048 1,021 2.7% actual less than projectedSOC ANT 1,618 2,055 -21.2% actual greater than projectedSOC CRJ 4,070 4,332 -6.0% actual greater than projectedSOC ECE 1,295 1,470 -11.9% actual greater than projectedSOC ECO 4,097 3,858 6.2% actual less than projectedSOC EDU 1,524 1,573 -3.1% actual greater than projectedSOC FST 449 411 9.2% actual less than projectedSOC GEG 1,991 1,959 1.6% actual less than projectedSOC HST 6,824 6,549 4.2% actual less than projectedSOC HUS 1,107 1,168 -5.2% actual greater than projectedSOC PSC 2,584 2,619 -1.3% actual greater than projectedSOC PSY 11,669 11,697 -0.2% actual greater than projectedSOC SOC 6,524 6,789 -3.9% actual greater than projectedSOC SSI 0 0 0.0% Not applicable.SOC SST 78 282 -72.3% actual greater than projectedSOC SWK 0 198 -100.0% actual greater than projected
Total 43,830 44,960 -2.5% actual greater than projected
25

Division Projected Actual Variance Description of VarianceBIO 32,439 33,316 -2.6% actual greater than projectedBUS 23,678 22,334 6.0% actual less than projectedCOM 62,093 61,941 0.2% actual less than projectedEMPS 42,201 42,274 -0.2% actual greater than projectedSD 1,108 1,021 8.5% actual less than projectedSOC 47,789 44,960 6.3% actual less than projectedSub-total 209,308 205,846 1.7% actual less than projected
ACE 30,945 27,024 14.5% actual less than projected
Total College 240,253 232,870 3.2% actual less than projected
Revised Projections vs. Actual Credit Hours FY04By Division
Table 13
Figure 3Revised Projections vs. Actual Credit Hours FY04,
By Division
-
10,000
20,000
30,000
40,000
50,000
60,000
70,000
BIO BUS COM EMPS SD SOC ACE
Division
Projected Actual
26
Division Department
Projected Credit
Hours FY04
Actual Credit Hours
FY04 Variance Description of VarianceACE ABE 3,551 3,942 -9.9% actual greater than projectedACE ADE 896 911 -1.6% actual greater than projectedACE ESL 22,555 18,142 24.3% actual less than projectedACE GED 2,096 2,098 -0.1% actual greater than projectedACE VED (1.6) 1,847 1,932 -4.4% actual greater than projected
Total 30,945 27,024 14.5% actual less than projectedBIO BIO 12,324 12,971 -5.0% actual greater than projectedBIO CHM 4,452 4,477 -0.6% actual greater than projectedBIO DHY 1,280 1,184 8.1% actual less than projectedBIO EMT 1,608 2,114 -23.9% actual greater than projectedBIO HIT 1,973 1,994 -1.1% actual greater than projectedBIO HRT 1,446 1,564 -7.5% actual greater than projectedBIO MIM 1,514 1,789 -15.4% actual greater than projectedBIO MLT 410 446 -8.1% actual greater than projectedBIO NUR 5,694 5,246 8.5% actual less than projectedBIO PED 1,500 1,236 21.4% actual less than projectedBIO SRG 238 295 -19.3% actual greater than projected
Total 32,439 33,316 -2.6% actual greater than projectedBUS ACC 4,214 3,827 10.1% actual less than projectedBUS AOS (BSS) 4,428 4,256 4.0% actual less than projectedBUS BUS 6,578 6,228 5.6% actual less than projectedBUS CIS 7,429 6,975 6.5% actual less than projectedBUS FSM 1,029 1,048 -1.9% actual greater than projected
Total 23,678 22,334 6.0% actual less than projectedCOM ARA 64 56 14.3% actual less than projectedCOM ART 5,720 5,209 9.8% actual less than projectedCOM CHI 166 216 -23.1% actual greater than projectedCOM COM 1,519 1,407 7.9% actual less than projectedCOM CSS 314 297 5.6% actual less than projectedCOM DNC 944 1,038 -9.1% actual greater than projectedCOM ENG 23,164 23,380 -0.9% actual greater than projectedCOM FRN 645 548 17.7% actual less than projectedCOM GER 267 368 -27.3% actual greater than projectedCOM HUM 6,000 6,003 0.0% actual greater than projectedCOM ITL 185 256 -27.6% actual greater than projectedCOM JPN 328 516 -36.5% actual greater than projectedCOM LAS N/A 0 N/A actual less than projectedCOM LTA (LMT) 338 244 38.4% actual less than projectedCOM MUS 2,319 2,339 -0.8% actual greater than projectedCOM PHI 7,294 7,173 1.7% actual less than projectedCOM RUS 112 188 -40.4% actual greater than projectedCOM SPA 4,399 4,089 7.6% actual less than projectedCOM SPE 7,750 7,899 -1.9% actual greater than projectedCOM THE 567 715 -20.8% actual greater than projected
Total 62,093 61,941 0.2% actual less than projected
Revised Projections vs. Actual Credit Hours FY04Table 14
By Department
27

Division Department
Projected Credit
Hours FY04
Actual Credit Hours
FY04 Variance Description of Variance
Revised Projections vs. Actual Credit Hours FY04Table 14
By Department
EMPS ABR 469 397 18.0% actual less than projectedEMPS ARC 415 420 -1.1% actual greater than projectedEMPS AST 224 204 9.8% actual less than projectedEMPS AUT 3,102 3,277 -5.3% actual greater than projectedEMPS BCT 487 525 -7.3% actual greater than projectedEMPS CAD 1,184 1,101 7.5% actual less than projectedEMPS CIV 106 138 -23.1% actual greater than projectedEMPS CNA 1,329 882 50.7% actual less than projectedEMPS CNC 231 277 -16.6% actual greater than projectedEMPS DFT 236 100 135.6% actual less than projectedEMPS EGR 420 418 0.4% actual less than projectedEMPS EIT 75 185 -59.5% actual greater than projectedEMPS ELC 229 282 -18.8% actual greater than projectedEMPS ELT 1,130 983 14.9% actual less than projectedEMPS FLU N/A N/A NA Not applicable.EMPS GEO 2,504 2,505 0.0% actual greater than projectedEMPS IS 34 30 13.3% actual less than projectedEMPS IMR 200 231 -13.5% actual greater than projectedEMPS MCD 164 165 -0.6% actual greater than projectedEMPS MCS 232 213 8.9% actual less than projectedEMPS MFG 0 0 0.0% Not applicable.EMPS MTH 24,905 24,976 -0.3% actual greater than projectedEMPS MTT 351 249 41.0% actual less than projectedEMPS PHY 1,956 2083 -6.1% actual greater than projectedEMPS RAC 1,888 2066 -8.6% actual greater than projectedEMPS WLD 294 387 -24.1% actual greater than projectedEMPS WWW 38 180 -79.0% actual greater than projected
Total 42,201 42,274 -0.2% actual greater than projectedSD PDS 531 508 4.4% actual less than projectedSD EWE 577 513 12.5% actual less than projected
Total 1,108 1,021 8.5% actual less than projectedSOC ANT 2,000 2,055 -2.7% actual greater than projectedSOC CRJ 4,450 4,332 2.7% actual less than projectedSOC ECE 1,500 1,470 2.0% actual less than projectedSOC ECO 4,200 3,858 8.9% actual less than projectedSOC EDU 1,650 1,573 4.9% actual less than projectedSOC FST 449 411 9.2% actual less than projectedSOC GEG 2,050 1,959 4.6% actual less than projectedSOC HST 7,500 6,549 14.5% actual less than projectedSOC HUS 1,290 1,168 10.4% actual less than projectedSOC PSC 2,650 2,619 1.2% actual less than projectedSOC PSY 12,800 11,697 9.4% actual less than projectedSOC SOC 7,100 6,789 4.6% actual less than projectedSOC SSI N/A 0 N/A actual less than projectedSOC SST 150 282 -46.8% actual greater than projectedSOC SWK 0 198 -100.0% actual greater than projected
Total 47,789 44,960 6.3% actual less than projected
28

Part III Data and Methodology
Data and Methodology Data for mid-term credit hours were used to project enrollment in the next three fiscal years. The mid-term credit hours were derived from course-level data on total number of students enrolled and the course credit hours. Course-level data came from the Course Section Enrollment (S3) files submitted to the Illinois Community College Board for each fiscal year. The method used in this projection was an eight-year moving average of annual percent changes. Annual percent changes (APC) were calculated for the last eight years (FY97-FY04). These were then averaged to predict FY05 enrollment; thereafter, the last eight years APCs—including the forecast year’s APC—were averaged to predict enrollment in the two remaining forecast years. Projected years 2006 and 2007, therefore, incorporated the last eight years’ increases including the last year’s projected increase. After carefully analyzing the data, the 8-year moving average methodology was used for the projections for two reasons: 1) it yielded more conservative annual percentage growths and declines; and 2) it accounted for the cyclical trends in many programs that can be observed in the past eight years. An extra step of ensuring that the projections for FY05 are reasonable was taken to account for the available Summer 2004 and Fall 2004 data. Since the growth rate for the past year has slowed down to only 2% in FY04 and actual growth in Summer and Fall 2004 data were also not as strong as previous years, each department’s projected percent change was cut by 1%. To minimize the risks of over-projecting and under-projecting, percent increases higher than 3 percent were capped at 3% and those lower than –10% were capped at –10%. For programs with less than eight years, the percent changes between the available years were averaged. If a program only existed for three years or less, the last FY enrollment was carried forward for the projected three years. Deans’ Review The dean of each of the major divisions reviewed the preliminary projections for departments in their area and made revisions they believed appropriate. This mathematical model assumes that if everything else is constant, then enrollment will continue along current trend lines. For the FY05-07 projections, however, the deans revised many of the department level projections upwards with their own rationale. Revisions by the deans considered certain factors that can influence change or limit enrollment. Deans were asked to revise projections where they knew of planned changes
29

that the model would not predict (e.g., new programs, new promotional efforts, revised scheduling, program elimination, etc.).4 In certain cases, these planned changes resulted in more than the maximum 3% annual increase imposed by the methodology. Deans also were aware of changes in demand for their programs due to changing local job market conditions. Lastly, deans can revise the projections where they know that there are facility, faculty, equipment, and other constraints. Hence, in certain cases, some departments can have projections subject to supply constraints.
4 The deans of the Business, Social Science, Biology, and Cooperative Education Divisions submitted revisions.
30


![ENROLLMENT ANALYSIS JANUARY 9, 2017 · ENROLLMENT PROJECTION DISTRICTWIDE STUDENT ENROLLMENT PROJECTIONS BY SCHOOL YEAR[2] Projection Window [1] School Year 2016/2017 Enrollment is](https://img.dokumen.tips/doc/110x75/5f8b9146b2f36505874904a0/enrollment-analysis-january-9-2017-enrollment-projection-districtwide-student-enrollment.jpg)