Embed Size (px)
Citation preview

Demographic Analysis and Enrollment Projections for the
College Station ISD
2013-2014 Update
February 18, 2014
Principal Investigator:Dennis D. Harner, Ph.D.Harner and Associates
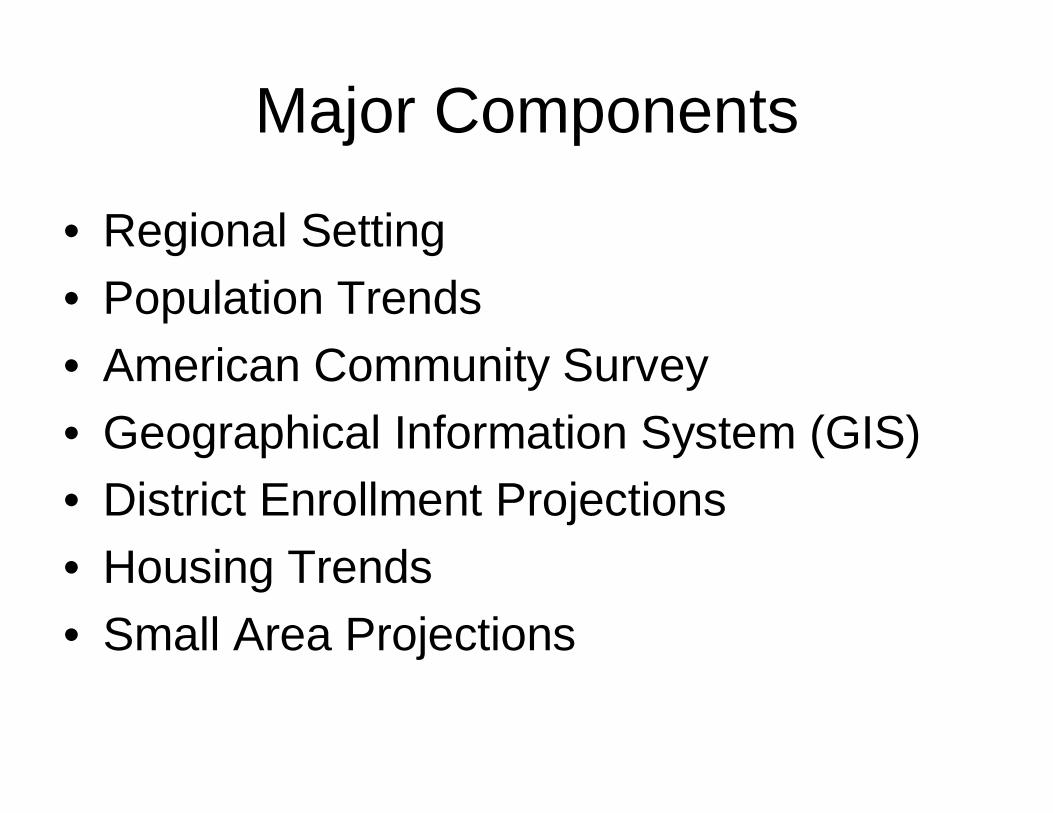
Major Components
• Regional Setting• Population Trends • American Community Survey• Geographical Information System (GIS)• District Enrollment Projections• Housing Trends• Small Area Projections
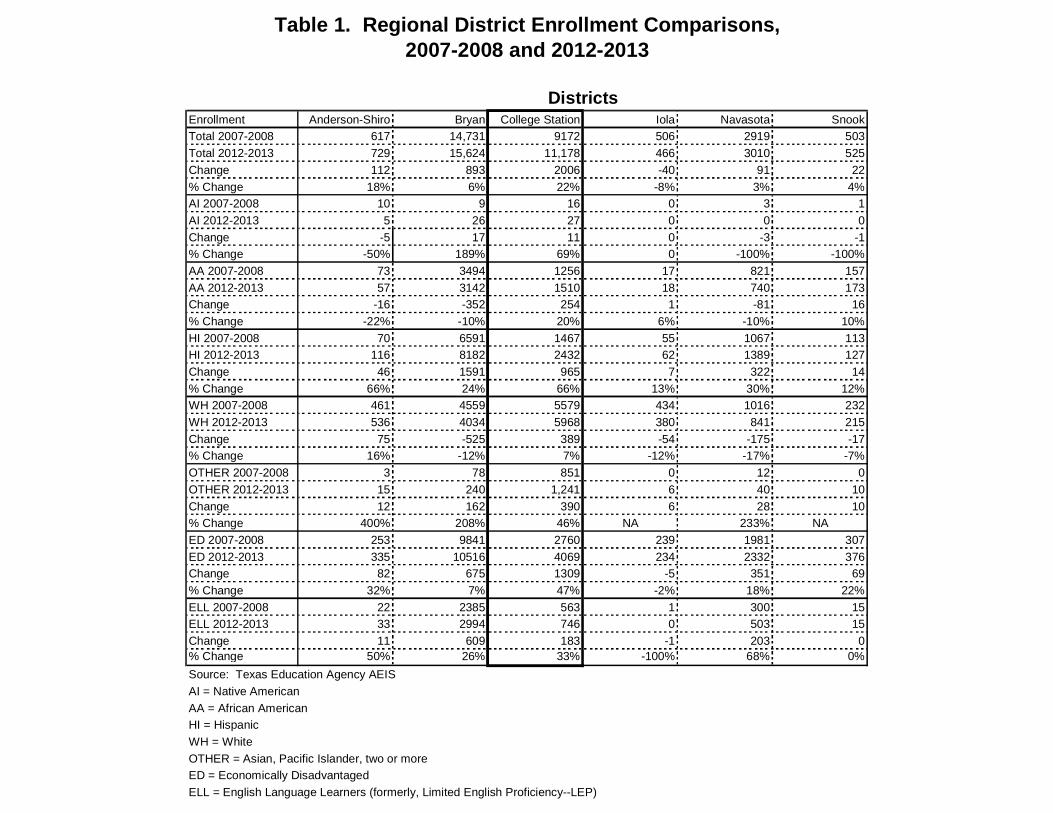
Table 1. Regional District Enrollment Comparisons,2007-2008 and 2012-2013
DistrictsEnrollment Anderson-Shiro Bryan College Station Iola Navasota SnookTotal 2007-2008 617 14,731 9172 506 2919 503Total 2012-2013 729 15,624 11,178 466 3010 525Change 112 893 2006 -40 91 22% Change 18% 6% 22% -8% 3% 4%AI 2007-2008 10 9 16 0 3 1AI 2012-2013 5 26 27 0 0 0Change -5 17 11 0 -3 -1% Change -50% 189% 69% 0 -100% -100%AA 2007-2008 73 3494 1256 17 821 157AA 2012-2013 57 3142 1510 18 740 173Change -16 -352 254 1 -81 16% Change -22% -10% 20% 6% -10% 10%HI 2007-2008 70 6591 1467 55 1067 113HI 2012-2013 116 8182 2432 62 1389 127Change 46 1591 965 7 322 14% Change 66% 24% 66% 13% 30% 12%WH 2007-2008 461 4559 5579 434 1016 232WH 2012-2013 536 4034 5968 380 841 215Change 75 -525 389 -54 -175 -17% Change 16% -12% 7% -12% -17% -7%OTHER 2007-2008 3 78 851 0 12 0OTHER 2012-2013 15 240 1,241 6 40 10Change 12 162 390 6 28 10% Change 400% 208% 46% NA 233% NAED 2007-2008 253 9841 2760 239 1981 307ED 2012-2013 335 10516 4069 234 2332 376Change 82 675 1309 -5 351 69% Change 32% 7% 47% -2% 18% 22%ELL 2007-2008 22 2385 563 1 300 15ELL 2012-2013 33 2994 746 0 503 15Change 11 609 183 -1 203 0% Change 50% 26% 33% -100% 68% 0%Source: Texas Education Agency AEISAI = Native AmericanAA = African AmericanHI = HispanicWH = WhiteOTHER = Asian, Pacific Islander, two or moreED = Economically DisadvantagedELL = English Language Learners (formerly, Limited English Proficiency--LEP)
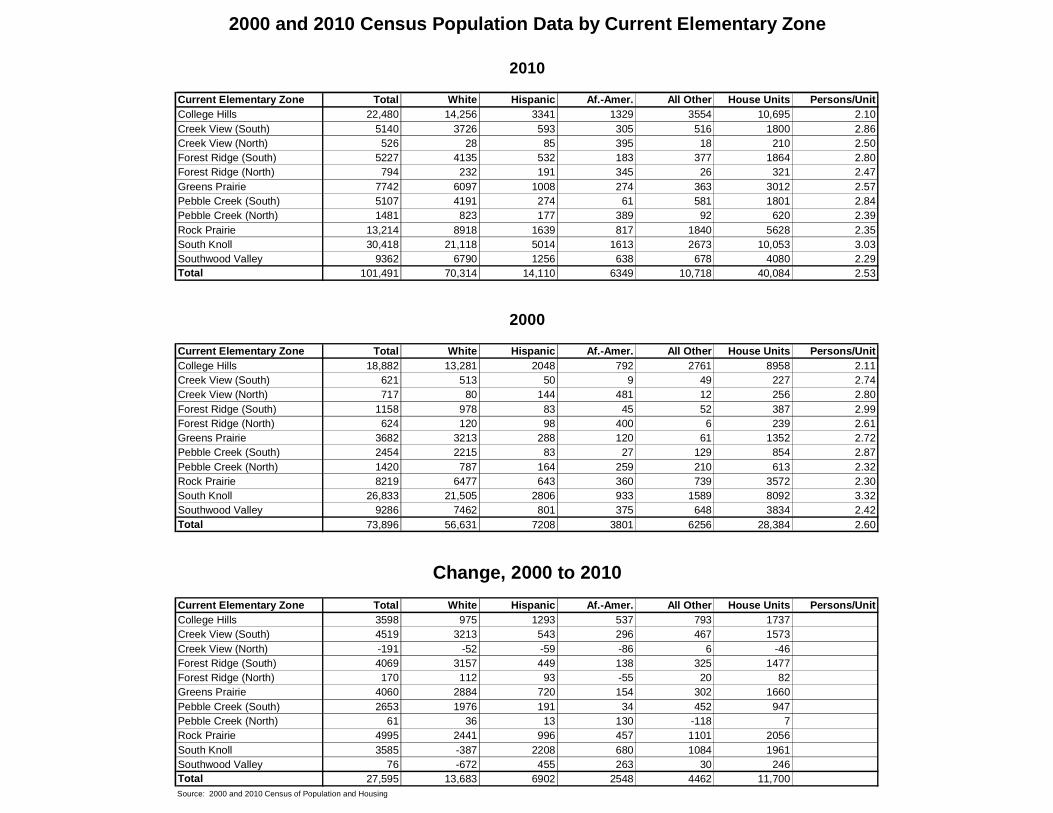
2000 and 2010 Census Population Data by Current Elementary Zone
2010
Current Elementary Zone Total White Hispanic Af.-Amer. All Other House Units Persons/UnitCollege Hills 22,480 14,256 3341 1329 3554 10,695 2.10Creek View (South) 5140 3726 593 305 516 1800 2.86Creek View (North) 526 28 85 395 18 210 2.50Forest Ridge (South) 5227 4135 532 183 377 1864 2.80Forest Ridge (North) 794 232 191 345 26 321 2.47Greens Prairie 7742 6097 1008 274 363 3012 2.57Pebble Creek (South) 5107 4191 274 61 581 1801 2.84Pebble Creek (North) 1481 823 177 389 92 620 2.39Rock Prairie 13,214 8918 1639 817 1840 5628 2.35South Knoll 30,418 21,118 5014 1613 2673 10,053 3.03Southwood Valley 9362 6790 1256 638 678 4080 2.29Total 101,491 70,314 14,110 6349 10,718 40,084 2.53
2000
Current Elementary Zone Total White Hispanic Af.-Amer. All Other House Units Persons/UnitCollege Hills 18,882 13,281 2048 792 2761 8958 2.11Creek View (South) 621 513 50 9 49 227 2.74Creek View (North) 717 80 144 481 12 256 2.80Forest Ridge (South) 1158 978 83 45 52 387 2.99Forest Ridge (North) 624 120 98 400 6 239 2.61Greens Prairie 3682 3213 288 120 61 1352 2.72Pebble Creek (South) 2454 2215 83 27 129 854 2.87Pebble Creek (North) 1420 787 164 259 210 613 2.32Rock Prairie 8219 6477 643 360 739 3572 2.30South Knoll 26,833 21,505 2806 933 1589 8092 3.32Southwood Valley 9286 7462 801 375 648 3834 2.42Total 73,896 56,631 7208 3801 6256 28,384 2.60
Change, 2000 to 2010Current Elementary Zone Total White Hispanic Af.-Amer. All Other House Units Persons/UnitCollege Hills 3598 975 1293 537 793 1737Creek View (South) 4519 3213 543 296 467 1573Creek View (North) -191 -52 -59 -86 6 -46Forest Ridge (South) 4069 3157 449 138 325 1477Forest Ridge (North) 170 112 93 -55 20 82Greens Prairie 4060 2884 720 154 302 1660Pebble Creek (South) 2653 1976 191 34 452 947Pebble Creek (North) 61 36 13 130 -118 7Rock Prairie 4995 2441 996 457 1101 2056South Knoll 3585 -387 2208 680 1084 1961Southwood Valley 76 -672 455 263 30 246Total 27,595 13,683 6902 2548 4462 11,700Source: 2000 and 2010 Census of Population and Housing

American Community Survey ACS)
• Replaced “long form” (survey of 1 in 6 persons). “Long form” dropped after 2000.
• ACS is a sample of approximately 1% of the population every year.
• Released annually for geographical areas with over 65,000 people (Table 2).
• Small areas require 5 years of data to get large enough sample size.
• Maps in report at census tract level and represent the period 2008 through 2012.

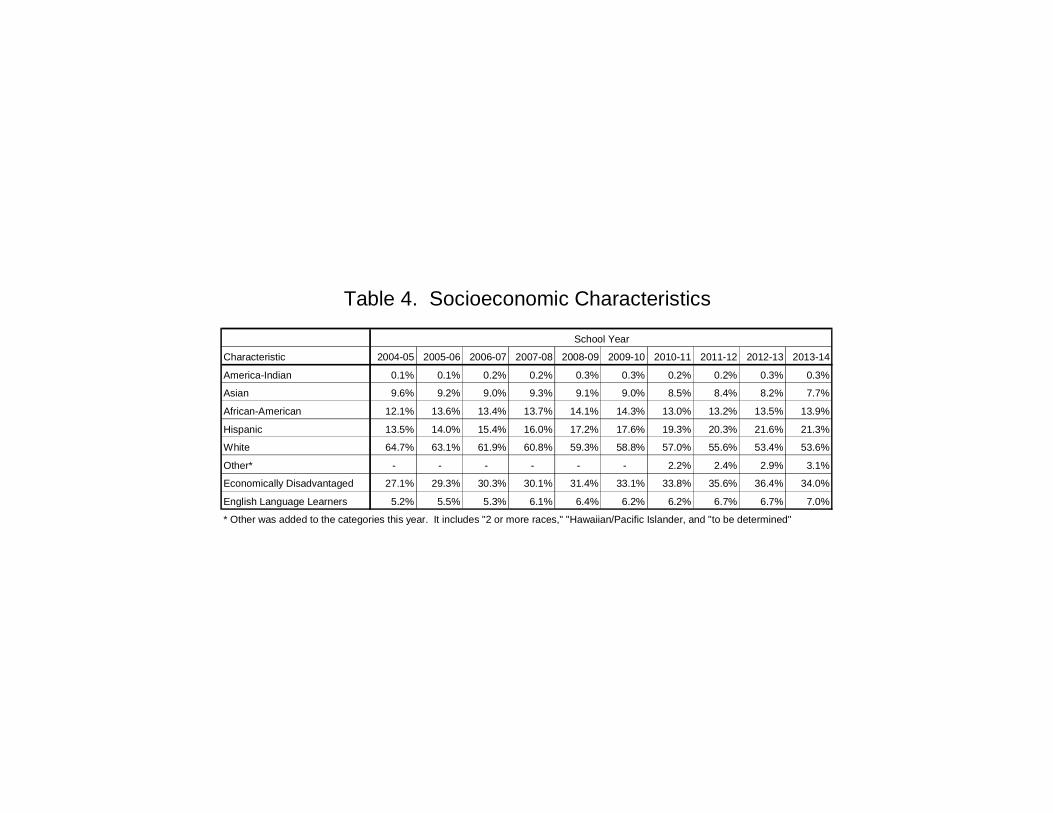
Table 4. Socioeconomic Characteristics
School Year
Characteristic 2004-05 2005-06 2006-07 2007-08 2008-09 2009-10 2010-11 2011-12 2012-13 2013-14
America-Indian 0.1% 0.1% 0.2% 0.2% 0.3% 0.3% 0.2% 0.2% 0.3% 0.3%
Asian 9.6% 9.2% 9.0% 9.3% 9.1% 9.0% 8.5% 8.4% 8.2% 7.7%
African-American 12.1% 13.6% 13.4% 13.7% 14.1% 14.3% 13.0% 13.2% 13.5% 13.9%
Hispanic 13.5% 14.0% 15.4% 16.0% 17.2% 17.6% 19.3% 20.3% 21.6% 21.3%
White 64.7% 63.1% 61.9% 60.8% 59.3% 58.8% 57.0% 55.6% 53.4% 53.6%
Other* - - - - - - 2.2% 2.4% 2.9% 3.1%
Economically Disadvantaged 27.1% 29.3% 30.3% 30.1% 31.4% 33.1% 33.8% 35.6% 36.4% 34.0%
English Language Learners 5.2% 5.5% 5.3% 6.1% 6.4% 6.2% 6.2% 6.7% 6.7% 7.0%
* Other was added to the categories this year. It includes "2 or more races," "Hawaiian/Pacific Islander, and "to be determined"
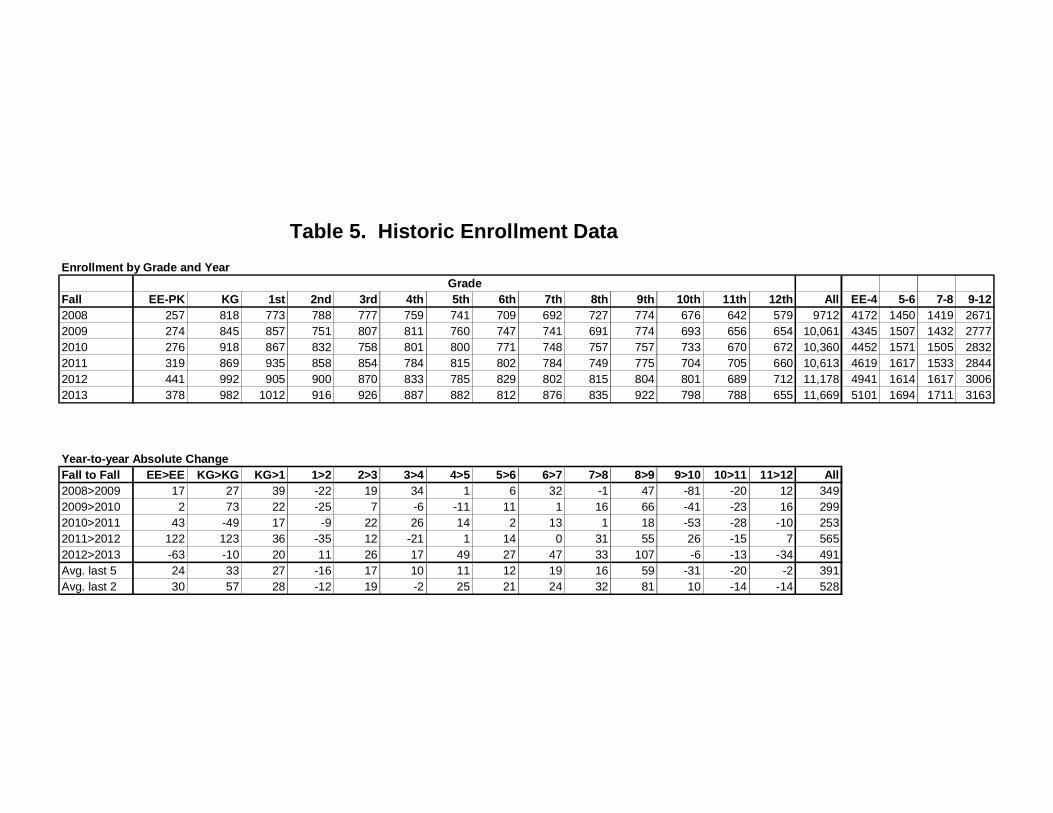
Table 5. Historic Enrollment DataEnrollment by Grade and Year
GradeFall EE-PK KG 1st 2nd 3rd 4th 5th 6th 7th 8th 9th 10th 11th 12th All EE-4 5-6 7-8 9-122008 257 818 773 788 777 759 741 709 692 727 774 676 642 579 9712 4172 1450 1419 26712009 274 845 857 751 807 811 760 747 741 691 774 693 656 654 10,061 4345 1507 1432 27772010 276 918 867 832 758 801 800 771 748 757 757 733 670 672 10,360 4452 1571 1505 28322011 319 869 935 858 854 784 815 802 784 749 775 704 705 660 10,613 4619 1617 1533 28442012 441 992 905 900 870 833 785 829 802 815 804 801 689 712 11,178 4941 1614 1617 30062013 378 982 1012 916 926 887 882 812 876 835 922 798 788 655 11,669 5101 1694 1711 3163
Year-to-year Absolute ChangeFall to Fall EE>EE KG>KG KG>1 1>2 2>3 3>4 4>5 5>6 6>7 7>8 8>9 9>10 10>11 11>12 All2008>2009 17 27 39 -22 19 34 1 6 32 -1 47 -81 -20 12 3492009>2010 2 73 22 -25 7 -6 -11 11 1 16 66 -41 -23 16 2992010>2011 43 -49 17 -9 22 26 14 2 13 1 18 -53 -28 -10 2532011>2012 122 123 36 -35 12 -21 1 14 0 31 55 26 -15 7 5652012>2013 -63 -10 20 11 26 17 49 27 47 33 107 -6 -13 -34 491Avg. last 5 24 33 27 -16 17 10 11 12 19 16 59 -31 -20 -2 391Avg. last 2 30 57 28 -12 19 -2 25 21 24 32 81 10 -14 -14 528
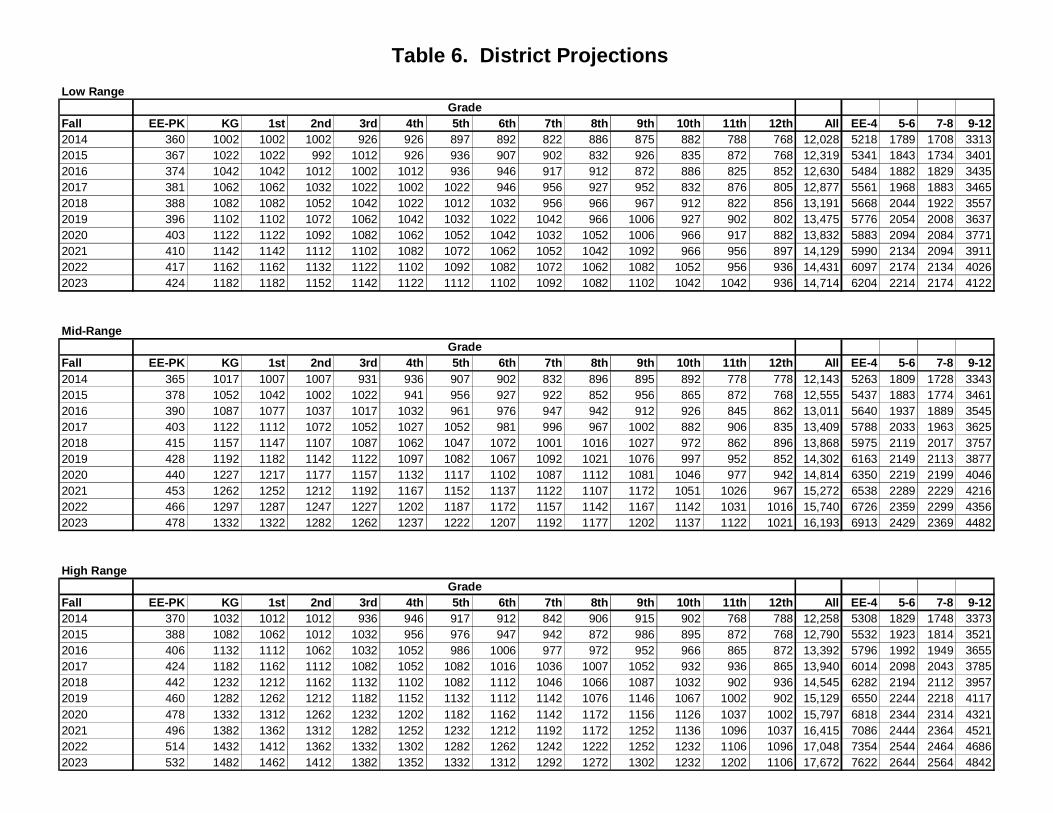
Table 6. District ProjectionsLow Range
GradeFall EE-PK KG 1st 2nd 3rd 4th 5th 6th 7th 8th 9th 10th 11th 12th All EE-4 5-6 7-8 9-122014 360 1002 1002 1002 926 926 897 892 822 886 875 882 788 768 12,028 5218 1789 1708 33132015 367 1022 1022 992 1012 926 936 907 902 832 926 835 872 768 12,319 5341 1843 1734 34012016 374 1042 1042 1012 1002 1012 936 946 917 912 872 886 825 852 12,630 5484 1882 1829 34352017 381 1062 1062 1032 1022 1002 1022 946 956 927 952 832 876 805 12,877 5561 1968 1883 34652018 388 1082 1082 1052 1042 1022 1012 1032 956 966 967 912 822 856 13,191 5668 2044 1922 35572019 396 1102 1102 1072 1062 1042 1032 1022 1042 966 1006 927 902 802 13,475 5776 2054 2008 36372020 403 1122 1122 1092 1082 1062 1052 1042 1032 1052 1006 966 917 882 13,832 5883 2094 2084 37712021 410 1142 1142 1112 1102 1082 1072 1062 1052 1042 1092 966 956 897 14,129 5990 2134 2094 39112022 417 1162 1162 1132 1122 1102 1092 1082 1072 1062 1082 1052 956 936 14,431 6097 2174 2134 40262023 424 1182 1182 1152 1142 1122 1112 1102 1092 1082 1102 1042 1042 936 14,714 6204 2214 2174 4122
Mid-RangeGrade
Fall EE-PK KG 1st 2nd 3rd 4th 5th 6th 7th 8th 9th 10th 11th 12th All EE-4 5-6 7-8 9-122014 365 1017 1007 1007 931 936 907 902 832 896 895 892 778 778 12,143 5263 1809 1728 33432015 378 1052 1042 1002 1022 941 956 927 922 852 956 865 872 768 12,555 5437 1883 1774 34612016 390 1087 1077 1037 1017 1032 961 976 947 942 912 926 845 862 13,011 5640 1937 1889 35452017 403 1122 1112 1072 1052 1027 1052 981 996 967 1002 882 906 835 13,409 5788 2033 1963 36252018 415 1157 1147 1107 1087 1062 1047 1072 1001 1016 1027 972 862 896 13,868 5975 2119 2017 37572019 428 1192 1182 1142 1122 1097 1082 1067 1092 1021 1076 997 952 852 14,302 6163 2149 2113 38772020 440 1227 1217 1177 1157 1132 1117 1102 1087 1112 1081 1046 977 942 14,814 6350 2219 2199 40462021 453 1262 1252 1212 1192 1167 1152 1137 1122 1107 1172 1051 1026 967 15,272 6538 2289 2229 42162022 466 1297 1287 1247 1227 1202 1187 1172 1157 1142 1167 1142 1031 1016 15,740 6726 2359 2299 43562023 478 1332 1322 1282 1262 1237 1222 1207 1192 1177 1202 1137 1122 1021 16,193 6913 2429 2369 4482
High RangeGrade
Fall EE-PK KG 1st 2nd 3rd 4th 5th 6th 7th 8th 9th 10th 11th 12th All EE-4 5-6 7-8 9-122014 370 1032 1012 1012 936 946 917 912 842 906 915 902 768 788 12,258 5308 1829 1748 33732015 388 1082 1062 1012 1032 956 976 947 942 872 986 895 872 768 12,790 5532 1923 1814 35212016 406 1132 1112 1062 1032 1052 986 1006 977 972 952 966 865 872 13,392 5796 1992 1949 36552017 424 1182 1162 1112 1082 1052 1082 1016 1036 1007 1052 932 936 865 13,940 6014 2098 2043 37852018 442 1232 1212 1162 1132 1102 1082 1112 1046 1066 1087 1032 902 936 14,545 6282 2194 2112 39572019 460 1282 1262 1212 1182 1152 1132 1112 1142 1076 1146 1067 1002 902 15,129 6550 2244 2218 41172020 478 1332 1312 1262 1232 1202 1182 1162 1142 1172 1156 1126 1037 1002 15,797 6818 2344 2314 43212021 496 1382 1362 1312 1282 1252 1232 1212 1192 1172 1252 1136 1096 1037 16,415 7086 2444 2364 45212022 514 1432 1412 1362 1332 1302 1282 1262 1242 1222 1252 1232 1106 1096 17,048 7354 2544 2464 46862023 532 1482 1462 1412 1382 1352 1332 1312 1292 1272 1302 1232 1202 1106 17,672 7622 2644 2564 4842
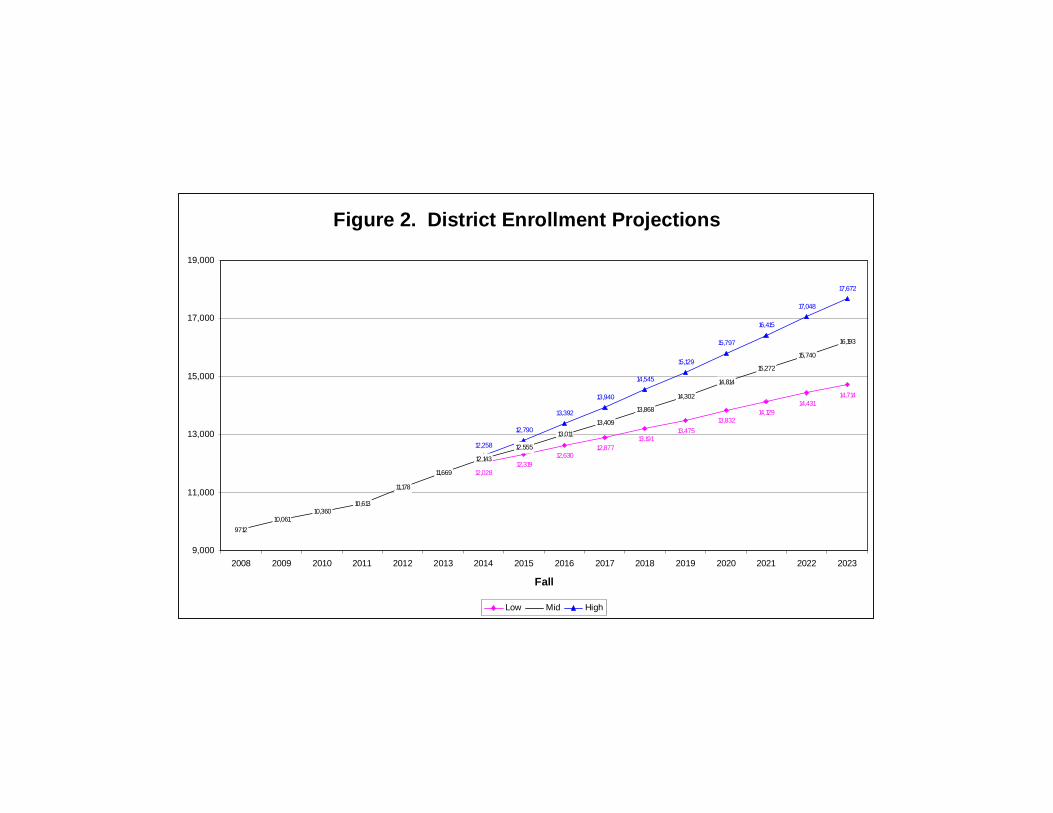
Figure 2. District Enrollment Projections
12,02812,319
12,63012,877
13,19113,475
13,83214,129
14,43114,714
971210,061
10,36010,613
11,178
11,669
12,143
12,555
13,011
13,409
13,868
14,302
14,814
15,272
15,740
16,193
12,258
12,790
13,392
13,940
14,545
15,129
15,797
16,415
17,048
17,672
9,000
11,000
13,000
15,000
17,000
19,000
2008 2009 2010 2011 2012 2013 2014 2015 2016 2017 2018 2019 2020 2021 2022 2023
Fall
Low Mid High
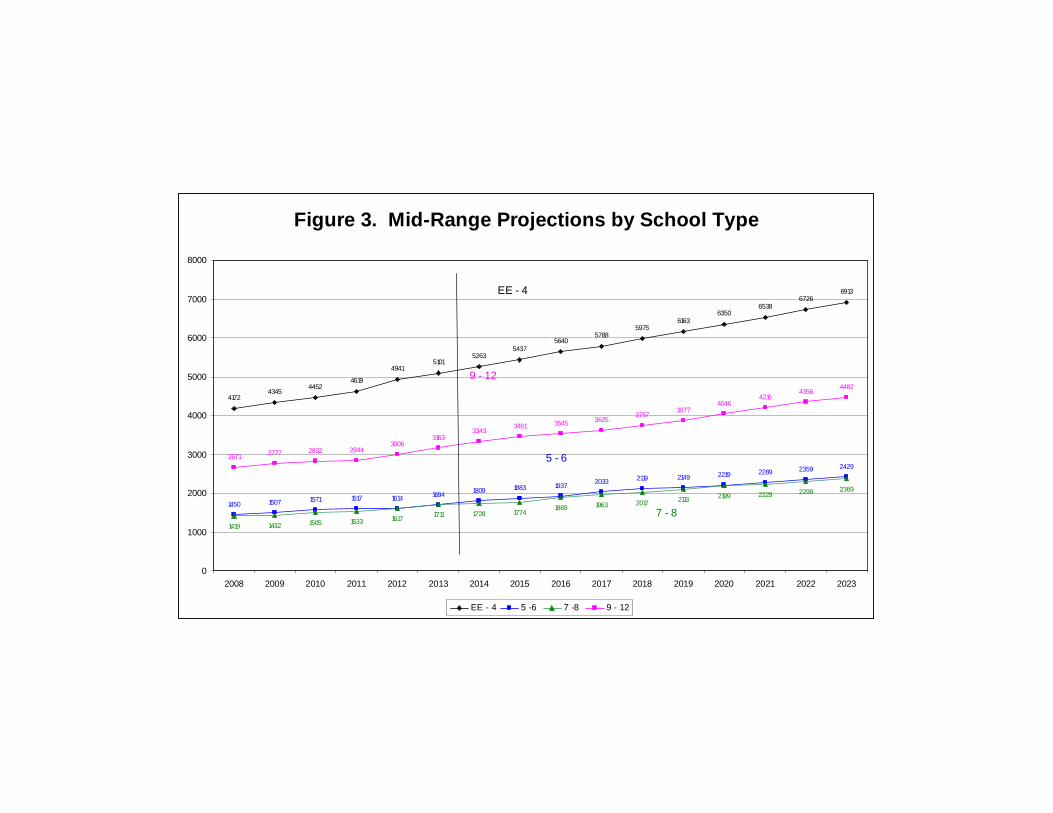
Figure 3. Mid-Range Projections by School Type
41724345
44524619
49415101
52635437
56405788
59756163
63506538
67266913
1450 1507 1571 1617 1614 1694 1809 1883 1937 2033 2119 2149 2219 2289 2359 2429
1419 1432 1505 1533 1617 1711 1728 17741889 1963 2017 2113 2199 2229 2299 2369
2671 2777 2832 28443006
31633343
3461 3545 36253757
38774046
42164356
4482
0
1000
2000
3000
4000
5000
6000
7000
8000
2008 2009 2010 2011 2012 2013 2014 2015 2016 2017 2018 2019 2020 2021 2022 2023
EE - 4 5 -6 7 -8 9 - 12
7 - 8
5 - 6
9 - 12
EE - 4
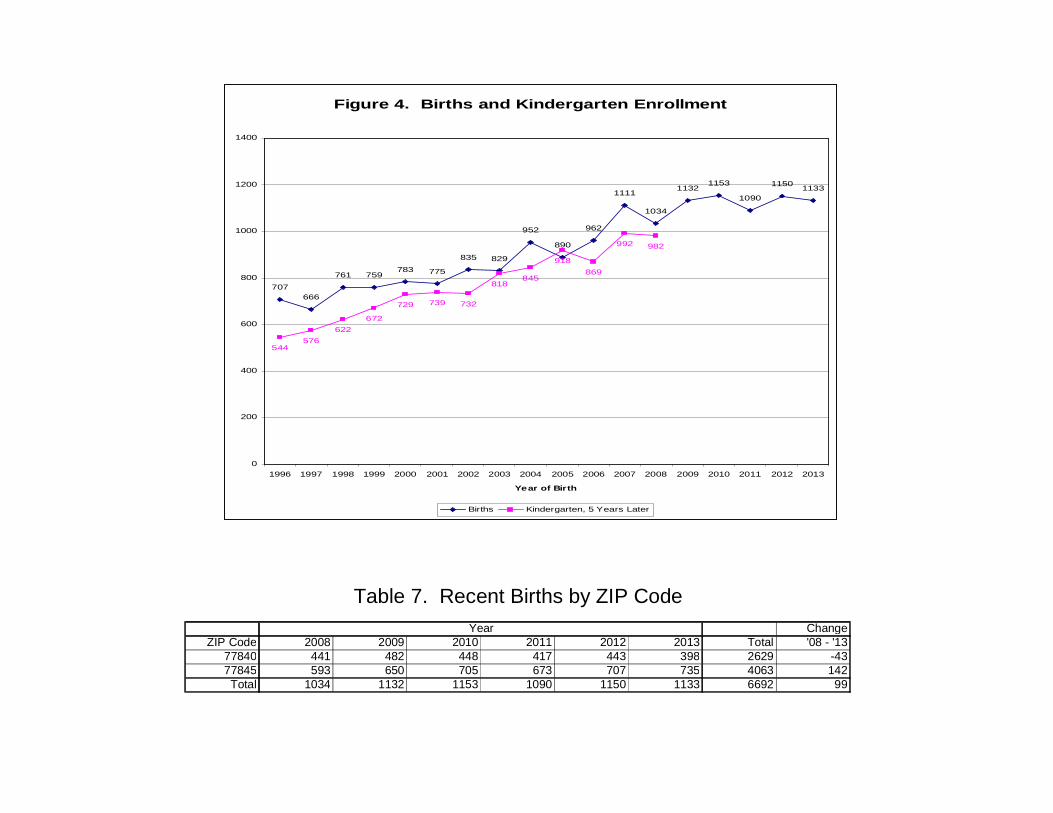
Figure 4. Births and Kindergarten Enrollment
707666
761 759783 775
835 829
952
890
962
1111
1034
11321153
1090
1150 1133
544576
622672
729 739 732
818845
918869
992 982
0
200
400
600
800
1000
1200
1400
1996 1997 1998 1999 2000 2001 2002 2003 2004 2005 2006 2007 2008 2009 2010 2011 2012 2013
Year of Birth
Births Kindergarten, 5 Years Later
Table 7. Recent Births by ZIP CodeYear Change
ZIP Code 2008 2009 2010 2011 2012 2013 Total '08 - '1377840 441 482 448 417 443 398 2629 -4377845 593 650 705 673 707 735 4063 142Total 1034 1132 1153 1090 1150 1133 6692 99

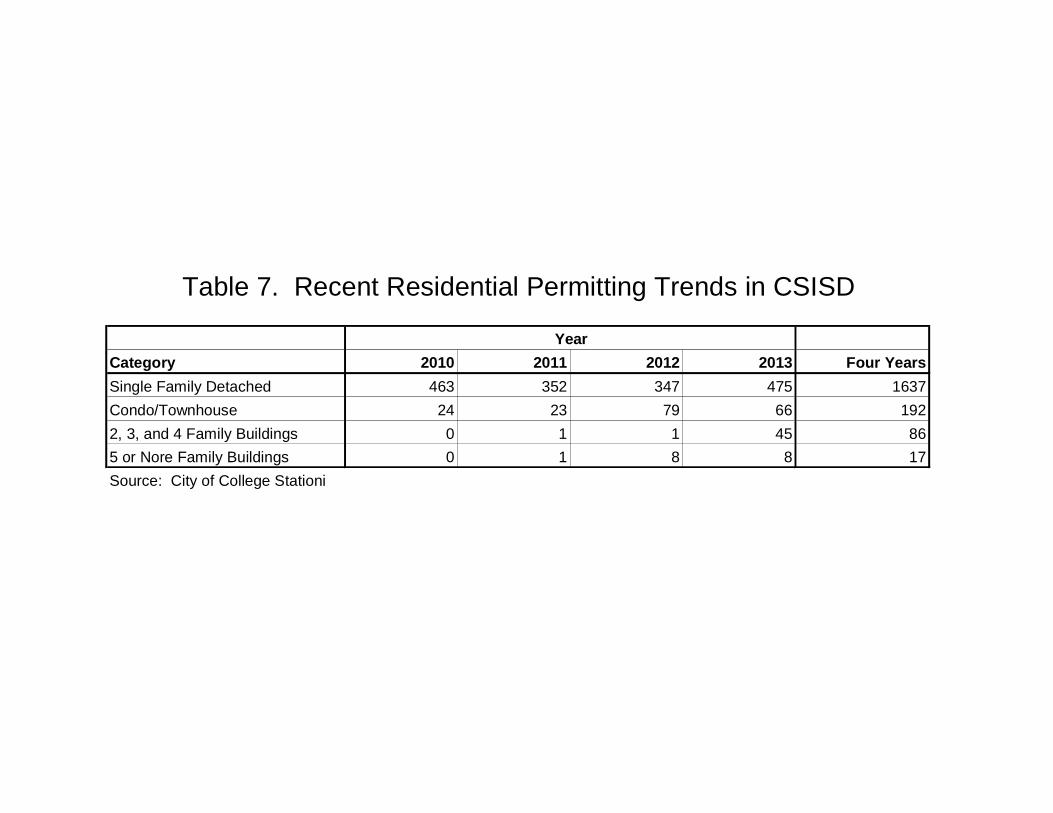
Table 7. Recent Residential Permitting Trends in CSISD
YearCategory 2010 2011 2012 2013 Four YearsSingle Family Detached 463 352 347 475 1637Condo/Townhouse 24 23 79 66 1922, 3, and 4 Family Buildings 0 1 1 45 865 or Nore Family Buildings 0 1 8 8 17Source: City of College Stationi

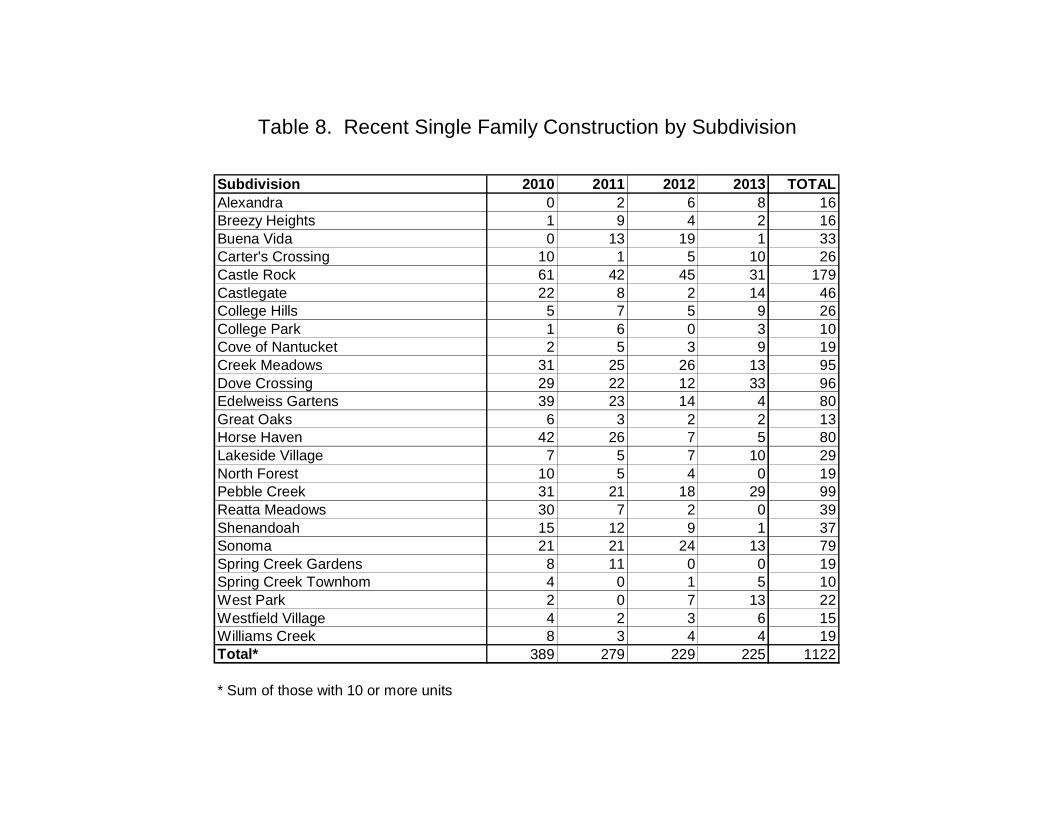
Table 8. Recent Single Family Construction by Subdivision
Subdivision 2010 2011 2012 2013 TOTALAlexandra 0 2 6 8 16Breezy Heights 1 9 4 2 16Buena Vida 0 13 19 1 33Carter's Crossing 10 1 5 10 26Castle Rock 61 42 45 31 179Castlegate 22 8 2 14 46College Hills 5 7 5 9 26College Park 1 6 0 3 10Cove of Nantucket 2 5 3 9 19Creek Meadows 31 25 26 13 95Dove Crossing 29 22 12 33 96Edelweiss Gartens 39 23 14 4 80Great Oaks 6 3 2 2 13Horse Haven 42 26 7 5 80Lakeside Village 7 5 7 10 29North Forest 10 5 4 0 19Pebble Creek 31 21 18 29 99Reatta Meadows 30 7 2 0 39Shenandoah 15 12 9 1 37Sonoma 21 21 24 13 79Spring Creek Gardens 8 11 0 0 19Spring Creek Townhom 4 0 1 5 10West Park 2 0 7 13 22Westfield Village 4 2 3 6 15Williams Creek 8 3 4 4 19Total* 389 279 229 225 1122
* Sum of those with 10 or more units
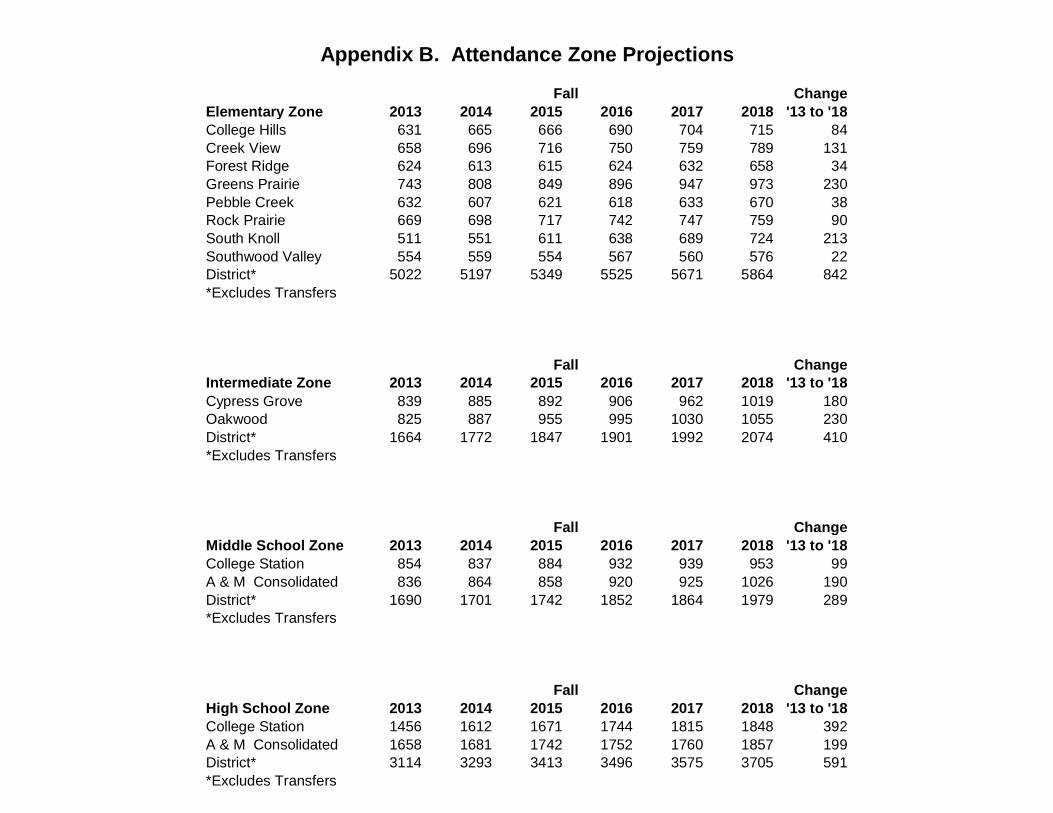
Appendix B. Attendance Zone Projections
Fall ChangeElementary Zone 2013 2014 2015 2016 2017 2018 '13 to '18College Hills 631 665 666 690 704 715 84Creek View 658 696 716 750 759 789 131Forest Ridge 624 613 615 624 632 658 34Greens Prairie 743 808 849 896 947 973 230Pebble Creek 632 607 621 618 633 670 38Rock Prairie 669 698 717 742 747 759 90South Knoll 511 551 611 638 689 724 213Southwood Valley 554 559 554 567 560 576 22District* 5022 5197 5349 5525 5671 5864 842*Excludes Transfers
Fall ChangeIntermediate Zone 2013 2014 2015 2016 2017 2018 '13 to '18Cypress Grove 839 885 892 906 962 1019 180Oakwood 825 887 955 995 1030 1055 230District* 1664 1772 1847 1901 1992 2074 410*Excludes Transfers
Fall ChangeMiddle School Zone 2013 2014 2015 2016 2017 2018 '13 to '18College Station 854 837 884 932 939 953 99A & M Consolidated 836 864 858 920 925 1026 190District* 1690 1701 1742 1852 1864 1979 289*Excludes Transfers
Fall ChangeHigh School Zone 2013 2014 2015 2016 2017 2018 '13 to '18College Station 1456 1612 1671 1744 1815 1848 392A & M Consolidated 1658 1681 1742 1752 1760 1857 199District* 3114 3293 3413 3496 3575 3705 591*Excludes Transfers