Embed Size (px)
Citation preview
Economic
& Fiscal Immpact
GRA
FACILITY
G
Demogra
ANDVIEW C
Y UTILIZAT
FIN
PREP
GRANDVIEW C13015
GRANDVIEW
JUN
aphic Analy
C-4 SCHOO
TION & PLA
NAL REPOR
PARED FOR:
C-4 SCHOOL 5 10TH STREEW, MISSOUR
E 15, 2015
sis
OL DISTRIC
ANNING AN
RT
DISTRICT ET
RI 64030
Econom
CT
NALYSIS
mic Developpment

1
TABLE OF CONTENTS 1.0 INTRODUCTION .......................................................................................................... 1 2.0 FACILITY INVENTORY AND CAPACITY ................................................................ 2 3.0 FACILITY ANALYSIS AND RECOMMENDATIONS ............................................... 4 APPENDIX A: FACILITY INVENTORY DATA ................................................................. 8 BELVIDERE ELEMENTARY SCHOOL ...................................................................... 9 BUTCHER-GREENE ELMENTARY SCHOOL .......................................................... 13 CENTER FOR ALTERNATIVE INSTRUCTION ........................................................ 17 CONN-WEST ELEMENTARY SCHOOL .................................................................... 20 HIGH GROVE EARLY CHILDHOOD CENTER ........................................................ 24 MEADOWMERE ELEMENTARY SCHOOL .............................................................. 26 MARTIN CITY ELEMENTARY ................................................................................... 29 MARTIN CITY MIDDLE SCHOOL ............................................................................. 31 GRANDVIEW MIDDLE SCHOOL ............................................................................... 35 GRANDVIEW HIGH SCHOOL .................................................................................... 39

1
1.0 INTRODUCTION This report presents the findings of the Facility Utilization and Planning Analysis performed for the Grandview C-4 School District by Applied Economics. The purpose of this analysis is to assess the current program capacity and utilization at each of the District’s schools, analyze the goals and available resources and develop options and recommendations to maintain equity and prepare for future changes in enrollment. The data, as well as the final recommendations are intended as input to the Long-term Facilities Master Plan. The analysis for the future is based on the small-area enrollment projections developed for the Demographic Analysis phase of the study. To begin this task we meet with District staff and key stakeholders to learn about the challenges and opportunities facing the District from a facility/operations standpoint, and performed a walk-through of all of the facilities to prepare an inventory of teaching stations and other spaces. The inventory information, detailed in section 2.0, provides the basis for calculating program capacity that is then compared to current and projected enrollment. The utilization analysis in section 3.0 begins with reviewing the enrollment projections by school, and looking at the distribution of students within the District using the system of small-area geographies created for the Demographic and Enrollment Analysis as shown in Map 1, below. Based on the projections and program capacities at set of findings and recommendations are included that addresses potential issues at each of the schools. This includes determining if additional space will be needed in the future, or if boundary adjustments and program relocations can be used to balance enrollment and capacity.
MAP 1 GRANDVIEW SCHOOL DISTRICT SMALL-AREA PLANNING GEOGRAPHIES

2
2.0 FACILITY INVENTORY & CAPACITY The facility inventory begins with assembling basic information about each facility including the age and size of the buildings, the current enrollment, and the number of teachers and total staff. As shown in Table 1, the District’s ten facilities were generally built between 1950 and 1970 and have combined floor area of over 760,000 square feet. Although older, the facilities were found to be in good condition and very well maintained. The elementary schools range from 45,000 to 54,000 square feet with enrollment of between 360 and 460 students, and a student-teacher ratio of about 21 students. The overall rate of 125 square feet per student at the elementary level represents a very reasonable density level.
TABLE 1 K-12 ENROLLMENT AND ENROLLMENT CHANGE: 1999/00 – 2014/15
Appendix A of this report details the inventory prepared of each school from the facility walk-throughs, including the identification of the number of available teaching stations, which is used to determine program capacity – not square footage. This inventory shows the current use of the space in each school on floor-plan drawings, and summarizes that information in a standard format for each school. This is not only useful in calculating capacity it also provides a check on the parity of the non-classroom space available at each facility. To calculate program capacity, the number of teaching stations is multiplied by the desired number of students per classroom. The capacity used in this analysis is based on the Grandview Desired standard (as shown in Table 2), although other standards could be applied to evaluating the level of facility utilization.
Year Square Current Sq. Ft./ Total Students/Constructed Feet Enrollment Student Staff Teachers Teacher
Elementary Schools
Belvidere 1960 45,000 362 124 32 18 20.1Butcher-Greene 1965 50,000 394 127 34 19 20.7CAIR * 1948 53,000 81 14 5 16.2Conn-West 1951 53,272 399 134 32 20 20.0High Grove 1956 50,000 141 10 10 14.1Meadowmere 1970 54,000 459 118 37 21 21.9Martin City (K-5) 1955 50,000 402 124 36 19 21.2
Middle Schools
Martin City (6-8) 1955 39,000 316 123 26 19 16.6Grandview 1967 110,000 605 182 45 34 17.8
Grandview High School 1962 258,000 1,156 223 83 63 18.3
District Total 762,272 4,315 177 349 228 18.9* Enrollment excludes half-day students.

3
TABLE 2 ALTERNATIVE CLASS SIZE STANDARDS
The result of applying the Grandview Desirable standard to the inventory of teaching stations results in the program capacities shown in Table 3. Note that this is based on the number of available teaching stations, and not the number of teachers, and that capacity can be different with the same number of teaching stations depending on the number of sections by grade level. The data shows that all Grandview schools are currently operating at less than full capacity, but the overall rate of utilization at the elementary school is high at nearly 90 percent. Excess space appears to exist at the middle school level, while the high school is well-utilized but has space for some additional growth in the future.
TABLE 3 SCHOOL CAPACITY AND UTILIZATION
Grandview Desirable State Desirable State MaxK 21.0 20.0 25.01 21.0 20.0 25.02 21.0 20.0 25.03 23.0 22.0 27.04 23.0 22.0 27.05 26.0 25.0 30.06 26.0 25.0 30.0
7-8 28.0 28.0 33.09-12 28.0 28.0 33.0
SchoolTeaching Stations
Grandview Desired
Missouri Desired
Missouri Maximum
Actual Enrollment Utilization
Belvidere 18 405 387 477 361 89%Butcher-Greene 20 444 424 524 392 88%CAIR n/a n/a n/a n/a n/a n/aConn-West 20 470 449 554 397 84%High Grove n/a n/a n/a n/a n/a n/aMartin City Elementary 20 449 429 529 400 89%Martin City Middle 20 493 490 580 312 63%Meadowmere 22 493 471 581 457 93%Grandview Middle 37 925 921 1,088 597 65%Grandview High 63 1,353 1,353 1,595 1,157 85%Teaching stations includes classrooms not currently being used.Utilization Based on Grandview Desired standard.

4
3.0 FACILITY ANALYSIS & RECOMMENDATIONS In this section the enrollment projections from the demographic study are combined with the facility capacity information to identify current and future utilization issues. As shown in Table 4, all of the District’s schools will be under their program capacity in 2015-16 and 2016-17. Note that the yellow highlighting on the table indicates enrollment above 95 percent of program capacity, while the red is above 100 percent. However, looking further out at the projections, it appears that both Butcher-Greene Elementary and Martin City Elementary may experience capacity issues within the next three to five years. It will also be necessary to monitor development in the Belvidere Elementary area since new residential projects are planned and more are likely to emerge in the future. Neither of the middle schools nor the high school is projected to reach the capacity thresholds in the next 10 years. In developing potential solutions for the future over-crowding we considered the possibility of adding classroom space, moving special programs and shifting school attendance areas. The planning grid data was used to identify parts of attendance areas that could be shifted from one school to another. In doing so, it is important to realize that parts of the District contain no or very few students, so moving those areas does little to change enrollment. Map 2, and the exact figures it is based on, is used to identify specific portions of some of the attendance areas that could be relocated to level enrollment across the facilities.
MAP 2 2014/15 STUDENT COUNT BY GRID WITH ATTENDANCE AREAS
The sections that follow summarize the findings and recommendations for the facilities on a school-by-school basis. It is expected that these recommendations will be reviewed in detail, revised and vetted with the public over time, but they provide a good starting point for the long-term facility plan. Note that no immediate changes are indicated from the analysis, which will allow some time to evaluate solutions to the potential over-crowding at Butcher-Greene and Martin City Elementary Schools.

5
TABLE 4 LONG-RANGE ENROLLMENT AND FACILITY PROJECTION
SCHOOL BUILDING Avail Program 95% Actual Actual Actual Estimate % Capacity Projection Projection Projection Projection Projection Projection Projection Projection Projection % CapacitySITES: Inst Room Capacity Program 2012-13 2013-14 2014-15 2015-16 2015-16 2016-17 2017-18 2018-19 2019-20 2020-21 2021-22 2022-23 2023-24 2024-25 2024-25ELEMENTARY SCHOOLS: Capacity
Belvidere 18 0 405 385 334 346 362 351 87% 335 327 330 329 331 330 331 333 335 83%
Butcher Greene 19 1 444 422 393 373 394 422 95% 439 455 463 464 463 466 470 475 480 108%
Conn-West 20 1 470 447 334 355 399 400 85% 412 424 429 429 430 432 435 440 445 95%
Martin City 19 1 449 427 403 440 402 415 92% 403 408 423 431 448 454 471 489 500 111%
Meadowmere 21 1 493 468 424 448 459 456 92% 455 458 458 463 461 461 463 466 469 95%
TOTAL 97 4 2,261 2,148 1,888 1,962 2,016 2,044 90% 2,044 2,072 2,103 2,116 2,133 2,143 2,170 2,203 2,229 99%
MIDDLE SCHOOLS: 26/1.36% 74/3.92% 54/2.75% 28/1.39% seats +217 0/0.00% 28/1.37% 31/1.50% 13/0.62% 17/0.80% 10/0.47% 27/1.26% 33/1.52% 26/1.18% seats +32
Grandview 34 3 925 879 571 594 605 601 65% 561 546 534 541 557 565 562 558 557 60%
Martin City 19 1 493 469 319 297 316 319 65% 364 364 372 363 374 398 403 402 403 82%
TOTAL 53 4 1,419 1,348 890 891 921 920 65% 925 910 906 904 931 963 965 960 960 68%
HIGH SCHOOL: 32/3.73% 1/0.11% 30/3.37% 1/0.11% seats +499 5/0.54% 15/1.62% 4/0.44% 2/0.22% 27/2.99% 32/3.44% 2/0.21% 5/0.52% 0/0.00% seats +449
Grandview 63 0 1,353 1,286 972 1,079 1,156 1,163 86% 1,201 1,205 1,183 1,222 1,202 1,169 1,204 1,215 1,233 91%
TOTAL 63 0 1,353 1,286 972 1,079 1,156 1,163 86% 1,201 1,205 1,183 1,222 1,202 1,169 1,204 1,215 1,233 91%
OTHER SCHOOLS: 35/3.74% 107/11.01% 77/7.14% 7/0.61% seats +190 38/3.27% 4/0.33% 22/1.83% 39/3.30% 20/1.64% 33/2.75% 35/2.99% 11/0.91% 18/1.48% seats +120
CAIR * 10 0 230 219 73 86 81 81 35% 81 81 81 81 81 81 81 81 81 35%
High Grove 10 15 575 546 131 140 141 141 25% 141 141 141 141 141 141 141 141 141 25%
TOTAL 20 15 805 765 204 226 222 222 28% 222 222 222 222 222 222 222 222 222 28%
44/27.5% 22/10.78% 4/1.77% seats +580 *2014/15 enrollment carried through 2024/25 seats +583
DISTRICT K-12 TOTAL 233 23 5,838 5,546 3,954 4,158 4,315 4,349 74% 4,392 4,409 4,414 4,464 4,488 4,497 4,561 4,600 4,644 80%
STUDENTS +/- 85 204 157 34 seats +1,486 43 17 5 50 24 9 64 39 83 seats +1,194
GROWTH % 2.20% 5.16% 3.78% 0.79% 0.99% 0.39% 0.11% 1.13% 0.54% 0.20% 1.42% 0.86% 0.96% 0.96%
* Enrollment excludes half-day students.

6
ELEMENTARY SCHOOLS Closure of High Grove Elementary School coupled with recent enrollment increases have resulted in high rates of utilization across the District – 90 percent overall utilization with only about 200 available seats. This level of utilization is based on capacity derived from an inventory of available classrooms and the application of Grandview desired class sizes by grade level. Alternative class size standards could also be applied to the utilization analysis. Since recent enrollment increases are largely due to the (one-time) impact of the stabilization of housing vacancy rates, and large-scale growth is not imminent, it seems that relatively small adjustments could be made to balance facility utilization in the near to mid-term. In general, the District should consider moving additional special education programs to the High Grove Center or the CAIR facility to free up space at the elementary schools. Belvidere – Current utilization rate of 89 percent with about 40 available seats and 362 students. The school will receive students from the new youth sports village development. How many and how soon are very much unknown, but the 150 corridor is likely to experience long term growth none-the-less. Could consider moving grid 24D to Butcher Greene (60 students) with offsetting adjustment from Butcher Greene to Martin City (with expansion of Martin City as described below). Butcher-Greene – Current utilization rate of 89 percent with about 50 seats available and 394 students. Projected to grow by about 80 students over the next 10 years. Could move grids 5D (zero students), 13B (zero students), 14A (43 students) and 14C (25 students) to Martin City (with expansion of Martin City as described below). Conn-West – Current utilization rate of 85 percent with about 70 seats available and 399 students. Not projected to grow beyond program capacity in the projection period. However, some additional increases are expected due to continued stabilization of the housing market. Could move in grid 15A (65 students) from Meadowmere to help relive high utilization rates there. Martin City – Current utilization rate of 90 percent with about 45 seats available and 402 students. The attendance area is projected to continue to experience growth, especially later in the projection period. This, in addition to isolated location and the potential need to relieve over-crowding at Butcher-Greene may make adding classroom space at Martin City desirable. This could include the addition of a 4 to 6 classroom wing, perhaps to house pre-school and kindergarten, making additional space available for the other grades. Could consider moving grid 15A (65 students) to Conn-West Meadowmere – Current utilization rate of 95 and 459 students making it the largest, and highest-utilized school in the District with only about 30 available seats. That said, the attendance area is not projected to experience significant increases in enrollment during the projection period, and some of the current perceived over-crowding is being caused by students from outside the attendance area being allowed to attend the school. Therefore, it may be desirable to restrict students from outside the attendance area and/or seek to relocate any special education program there to avoid having to modify the attendance area at this time.
MIDDLE SCHOOLS Due to middle students being distributed across both Martin City (K-8) and Grandview Middle School there is ample space available with a utilization rate of 65 percent and nearly 500 available seats. The fact that Grandview Middle School has nearly enough space to service all of the 6th to 8th graders in the District makes changing middle school boundaries an option to the expansion of Martin City. However,

7
the geographic and psychological separation between the Martin City area and Grandview Middle School is an issue in serving the middle school students, with consolidation not being acceptable to either the parents or the community at large. It would also be difficult to adjust the middle school attendance area for Martin City without exaggerating the difference in the socioeconomic profile of families between the two attendance areas. Perhaps a special program, such as STEM or a language emersion, could be added at Grandview Middle School (with District-wide transportation access) to entice more Martin City students to choose Grandview Middle School. If successful, this may free up enough space at Martin City to accommodate growth in the near term, although care must be taken to maintain “critical mass” for the Martin City middle school program.
HIGH SCHOOL Grandview High School has a current utilization rate of about 85 percent with about 200 available seats. The modernized facility appears to be sufficient to meet the needs of the District’s population throughout the projection period.
OTHER SCHOOLS In addition to the facilities described above, the District has the CAIR and High Grove Early Education Center with available capacity for special programs, or even regular education if necessary. The CAIR facility would be more difficult to utilize, but contains a number of large classrooms and other spaces that could potentially house a special program. We estimate the capacity to be at least 200 students with only 100 students currently enrolled in the facility. In the case of High Grove, the capacity is estimated at about 575 students while only some 140 students are housed there. This facility creates a safety net to accommodate any sudden enrollment growth that may occur.

8
APPENDIX A: FACILITY INVENTORY & UTILIZATION

9
Belvidere Elementary School15200 White Avenue, Grandview MO 64030
Classrooms Building Stats
General Enrollment: 362 (K‐5)SF/Student 124
Specialized
Students per Teacher: 20.1
Total Staffing: 32
Computer Lab
Music
Art
Library
Gym
33
Regular Teachers:
Teacher ‐ K‐2 Trans
Teacher ‐ Kindergarten
Teacher ‐ Music Vocal
Teacher ‐ P.E.
Principal
School Improvement Specialist
Other Facilities
20
5
Year Built:Size:
196045,000 SF
Certified Staff
Counselor
Instrictional Coach
Librarian
18
Teacher ‐ 5th
Teacher ‐ Art
Teacher ‐ Reading
Teacher ‐ SPED CC
Teacher ‐ Speech Pathologist
1
1
1
1
1
3
3
Teacher ‐ 1st
Teacher ‐ 2nd
Teacher ‐ 3rdTeacher ‐ 4th
1
2
1
3
1
2
3
1
1
C
S
G
M
L
A
Co

10

Belvidere –First F
loor
CC
CC
CC
CA
CC
C
C C C
S CoL
S S
23
3
5 5 5
22
34
44
Storage
?
11

Belvidere –Groun
d Floo
r
CC
C
CC
CG
M
11
1
KK
K
S
SC
Language Arts Lab
(4 Teachers)
12

13
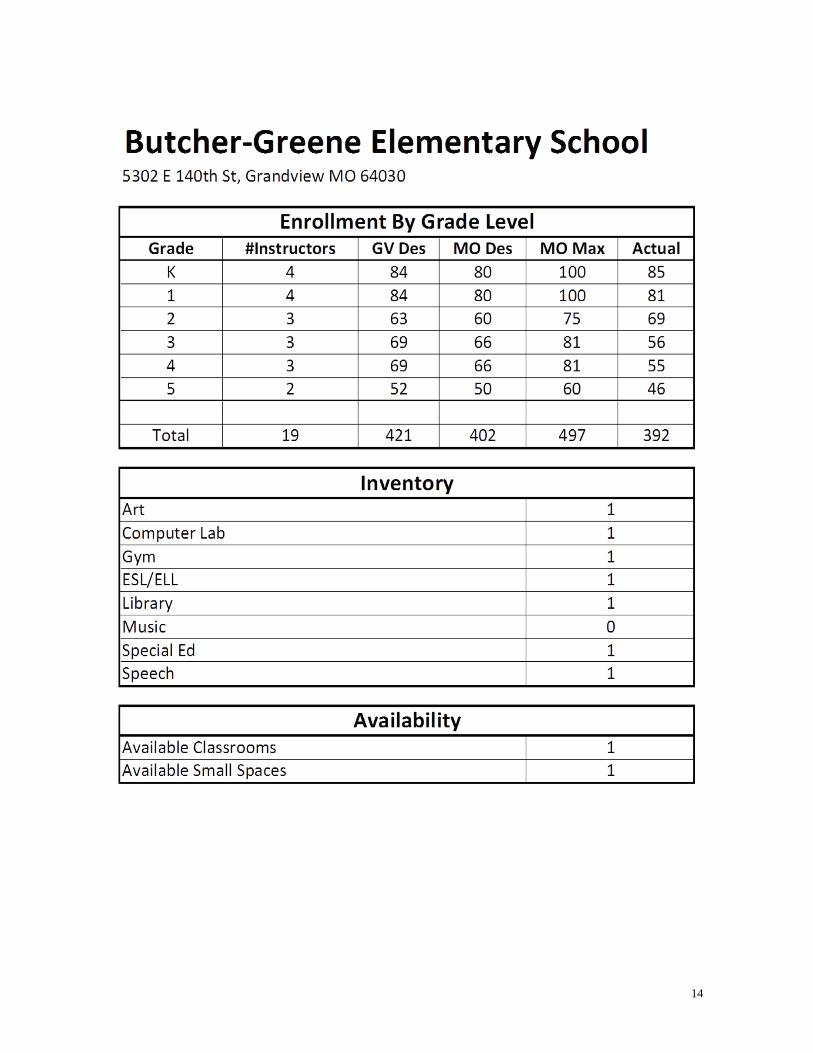
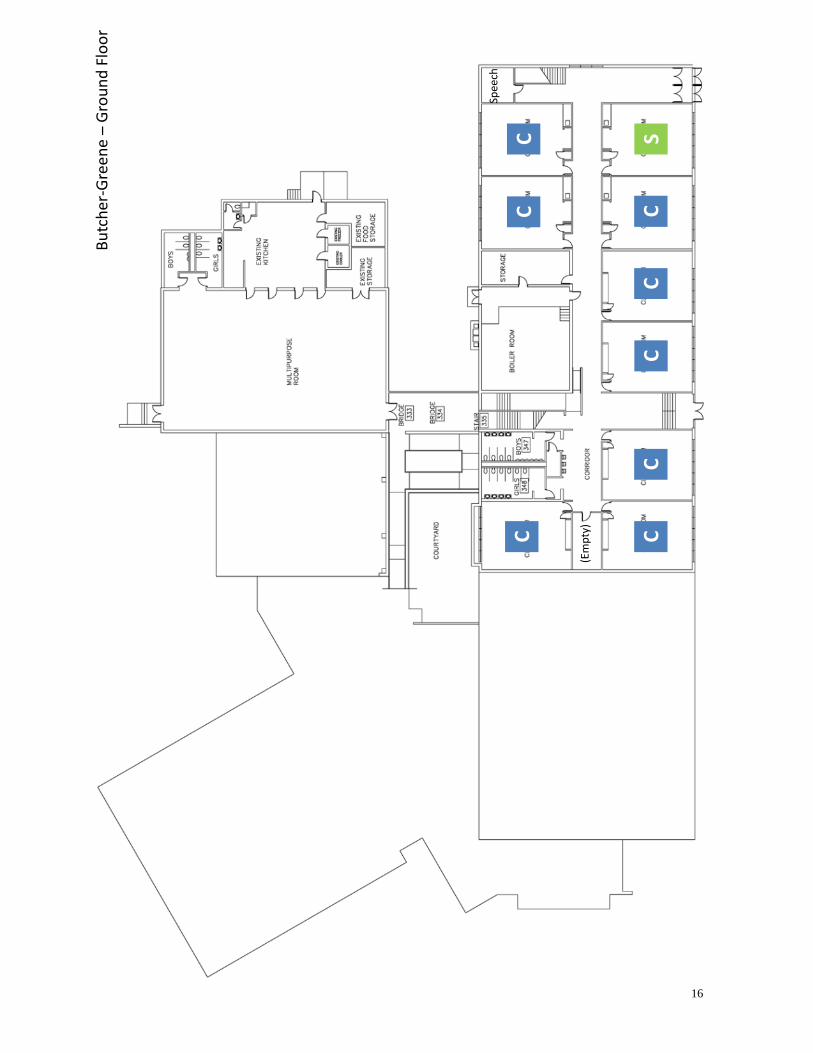
Butcher‐Greene Elementary School5302 E 140th St, Grandview MO 64030
Classrooms Building Stats
General Enrollment: 394 (K‐5)SF/Student 127
Specialized
Regular Teachers: 1920.7
24 Year Built: 1965Size: 50,000 SF
2Certified Staff
Counselor 1
Instrictional Coach 1
Other Facilities Librarian 1
Principal 1
School Improvement Specialist 1
Teacher ‐ 1st 4Computer Lab Teacher ‐ 2nd 3
Teacher ‐ 3rd 3
Teacher ‐ 4th 3
Teacher ‐ 5th 2
Teacher ‐ Reading 1
GymTeacher ‐ Art 1
Teacher ‐ K‐2 Trans 2
Teacher ‐ Kindergarten 4Library Teacher ‐ Music Vocal 1
Teacher ‐ P.E. 1
Teacher ‐ SPED ED 1Music
Teacher ‐ Speech Pathologist 1
Students per Teacher:
Total Staffing: 34Art
Summer School Teacher ‐ 4th 1
Teacher ‐ ESOL 1
C
S
G
M
L
A
Co
14

C
Butche
r‐Green
e –First F
loor
C
C
C
CC
C
CC
CC
CC
CoC
CAC
L
K
K
K
K
Link/M
isc
C
Staff
SStorage
G
15
Butche
r‐Green
e –Groun
d Floo
r
C CC
CC
CS
CC
(Empty)
Speech
16

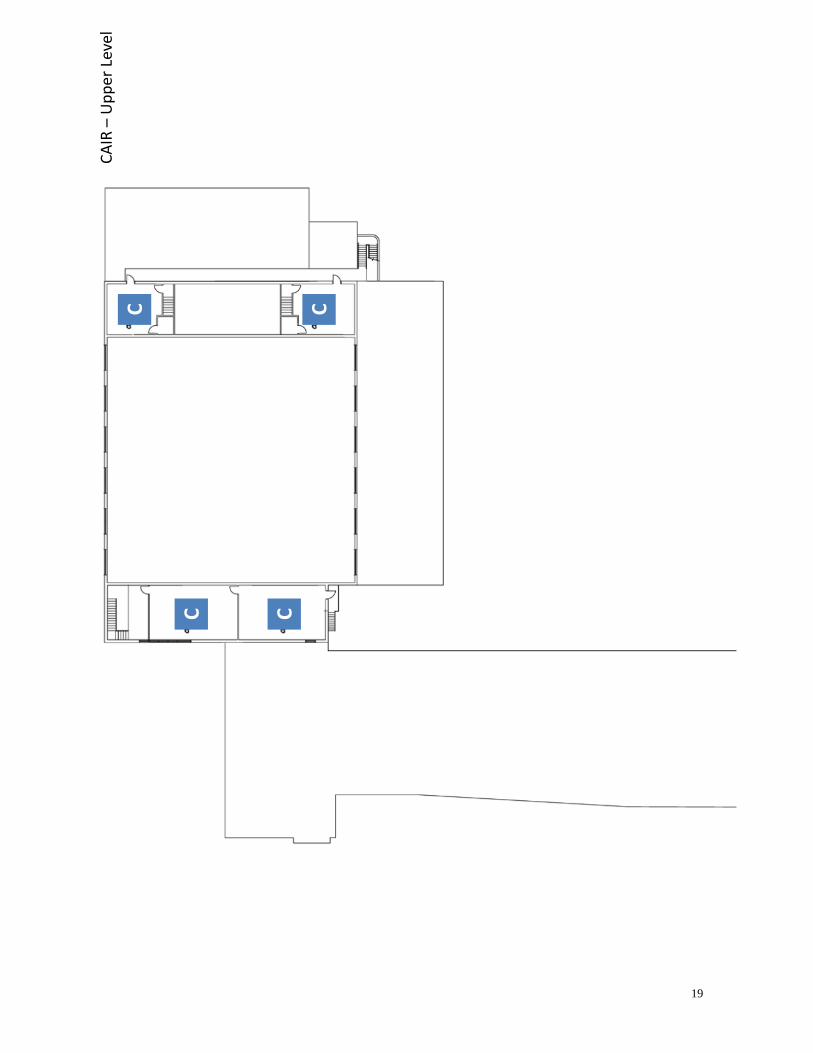
Center For Alternative Instruction (CAIR)1001 Main St, Grandview MO 64030
Classrooms Building Stats
General Enrollment: Grades?SF/Student
Specialized
Art
Music
Gym
Library
Teacher ‐ Gifted 3
Teacher ‐ SPED CC 5Computer Lab Total Staffing: 14
Principal 1
Other Facilities Teacher ‐ At Risk 1
Teacher ‐ At Risk/Crossroads 1
‐Certified Staff
Counselor 3
10 Year Built: 1948Size: 53,000 SFC
S
G
M
L
A
Co
17

CAIR –Main Level
C
C
C
C
C
C
G
18
C
CC
CCA
IR –Upp
er Level
19

20
Conn‐West Elementary School1100 High Grove Rd, Grandview MO 64030
Classrooms Building Stats
General Enrollment: 399 (K‐5)SF/Student 134
Specialized
21 Year Built: 1951Size: 53,272 SF
5Certified Staff
Counselor 1
Instrictional Coach 1
Other Facilities Librarian 1
Principal 1
School Improvement Specialist 1
Teacher ‐ 1st 4Computer Lab Teacher ‐ 2nd 3
Teacher ‐ 3rd 3
Teacher ‐ 4th 3
Teacher ‐ 5th 3
Teacher ‐ Reading 1
GymTeacher ‐ Art 1
Teacher ‐ ESOL 1
Teacher ‐ Kindergarten 4Library Teacher ‐ Music Vocal 1
Teacher ‐ P.E. 1
Regular Teachers: 20Art
Teacher ‐ SPED CC 1Music
Teacher ‐ Speech Pathologist 1
Total Staffing 32
Students per Teacher: 20.0
C
S
G
M
L
A
Co

21

Conn
‐West –
Main Level
CC
CC
C
CC
C
CC C
C CC
CC
Co
Co A
L
Art
Office
G
Cafeteria
Empty
C
22

Conn
‐West –
Upp
er Level
SS
SS
S
Co
CM
C
CC
C
Copy
Room
CAIR?
G(Upp
er)
Food
Service
Office
Storage
District O
ffice
23

High Grove Early Childhood Center (HGECC)2500 High Grove Rd, Grandview MO 64030
Classrooms Building Stats
General Enrollment: (PS)SF/Student
Specialized
Art
Music
Gym
Library
Teacher ‐ Speech Pathologist 2
Teacher ‐ Title I EC 1Computer Lab
Coordinator ‐ Process 1
Other Facilities Psychologist 1
Teacher ‐ SPED EC 3
‐Certified Staff
Head Start Teacher 2
25 Year Built: 1956Size: 50,000 SFC
S
G
M
L
A
Co
24

High
Grove & M
ainten
ance Facility
C
CC
C
CC
CC
CC
C
CCCC C C
C CC
C
M
C C
C C
L
G
25

26
Meadowmere Elementary School7010 E 136th St, Grandview MO 64030
Classrooms Building Stats
General Enrollment: 459 (K‐5)SF/Student 118
Specialized
Students per Teacher: 21.9
Principal 1
School Improvement Specialist 1
Teacher ‐ 2nd 3
23 Year Built: 1970Size: 54,000
3Certified Staff
Counselor ‐ Special Education 1
Counselor 1
Other Facilities Instructional Coach 1
Librarian 1
Computer Lab Teacher 1
Teacher ‐ 1st 4
GymTeacher ‐ 4th 3
Teacher ‐ 5th 3
Teacher ‐ 3rd 4
Teacher ‐ Art 1Library Teacher ‐ ESOL 1
Teacher ‐ Kindergarten 4
Art
Teacher ‐ Physical Education 1Music
Teacher ‐ Reading 2
Regular Teachers: 21
Teacher ‐ SPED 2
Teacher ‐ Speech Pathologist 1
Teacher ‐ Music Vocal 1
C
S
G
M
L
A
Co

27

Meado
wmere
S C C C C C
CC
A
CC
CC C
C
C C C
G
L
C C Co
C C CS
CS
C
C
KK
K
K
Conf. Roo
m
28
29
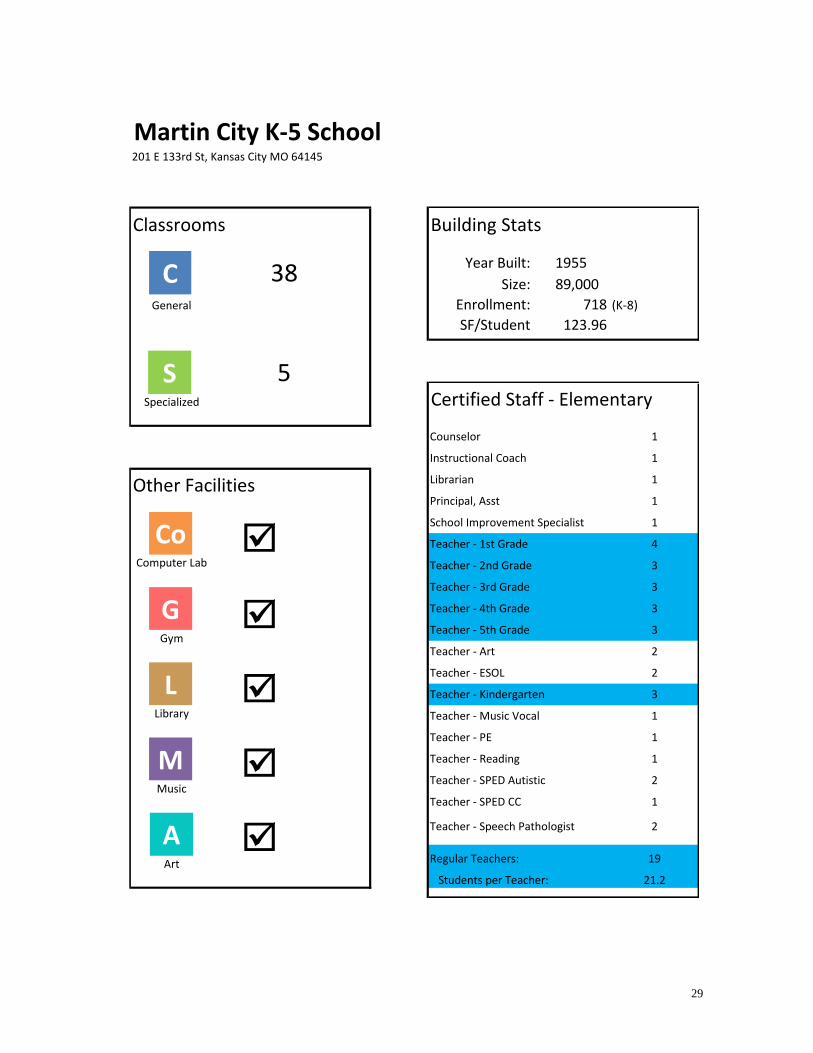
Martin City K‐5 School201 E 133rd St, Kansas City MO 64145
Classrooms Building Stats
General Enrollment: 718 (K‐8)SF/Student 123.96
Specialized
Regular Teachers: 19Art
Teacher ‐ Speech Pathologist
Students per Teacher: 21.2
2
Teacher ‐ SPED Autistic 2Music
Teacher ‐ SPED CC 1
Teacher ‐ Reading 1
GymTeacher ‐ Art 2
Teacher ‐ ESOL 2
Teacher ‐ Kindergarten 3Library Teacher ‐ Music Vocal 1
Teacher ‐ PE 1
Teacher ‐ 3rd Grade 3
Teacher ‐ 4th Grade 3
Teacher ‐ 5th Grade 3
School Improvement Specialist 1
Teacher ‐ 1st Grade 4Computer Lab Teacher ‐ 2nd Grade 3
Counselor 1
Instructional Coach 1
Other Facilities Librarian 1
Principal, Asst 1
5Certified Staff ‐ Elementary
38 Year Built: 1955Size: 89,000C
S
G
M
L
A
Co

30

31

32

Martin
City
–Main Level
SS S
CC C
C
CC
?
CC
CC
CC
C
GCo S
A
MM
CC
CC S
CC C
Language Arts L
ab
11
FACS
KK
K1
1
Vocal
Band
Girls
Locker
Room
Boys
Locker
Room
C5
66
6
C
55
C
MS
MS
C
CC
C
C
L
33

Martin
City
–Upp
er Level @
Elementary W
ing
CC
CC
C
CC
CC
?3 3
34
4
42
2
C
2
Copy
Room
34

35

36

Middle Scho
ol –Main Level
S
G
SS
S S
CC
CoA
CC
CC
Storage
Storage
Kitche
n
CC
C
CC
ISS?
C
Coun
selors
Office
Prep
CUnu
sed
Unu
sed
TSC?
PTA
CC
C
CStud
ent
Services
Center
M
C
CC
C
CoC
C
C
CC C
C
C
CC
M
M Choir
Band
Music
C
L
37

Middle Scho
ol –Ba
sement
Music Equ
ipmen
t Storage
Boys Lockers
Girls L
ockers
Boiler R
oom
38

39

40

High
Schoo
l –Main Level
CC
CC
C
CC
CM
C
CC
CC
CC
C
C
CC
CC
C
CC
CC
CC
C
C
C
G
G
L
41

High
Schoo
l –Upp
er Level
CC
CC
CC
CC
CC
CC
CC
CC
CC
C CC
CC
CC
C
CC
CC
CC
C C
C
CC
G
42

High
Schoo
l –Library Ba
sement
43

High
Schoo
l –Vo
Tech
Basement
SS
44