Embed Size (px)
Citation preview

03.19.13Prepared by: Manuel Pastor, Jennifer Ito, Jared P. Sanchez, Madeline Wander, and Anthony Perez
GETTING TO WHERE YOU WANT TO GO:DEMOGRAPHY, ECONOMY, AND THE REGION

RICHMOND

Changing Demographics

Prepared by USC PERE | March 19, 2013 | 4
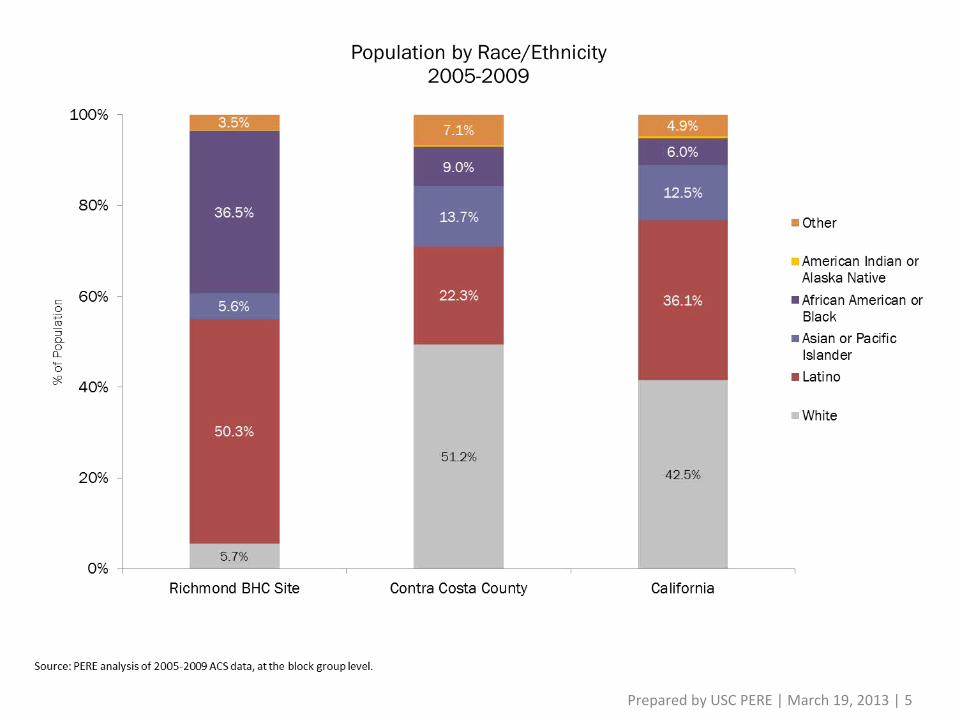
Prepared by USC PERE | March 19, 2013 | 5

Prepared by USC PERE | March 19, 2013 | 6

Prepared by USC PERE | March 19, 2013 | 7

Immigrant Integration

Prepared by USC PERE | March 19, 2013 | 9

Prepared by USC PERE | March 19, 2013 | 10

Prepared by USC PERE | March 19, 2013 | 11

Prepared by USC PERE | March 19, 2013 | 12 Prepared by USC PERE | March 19, 2013 | 12
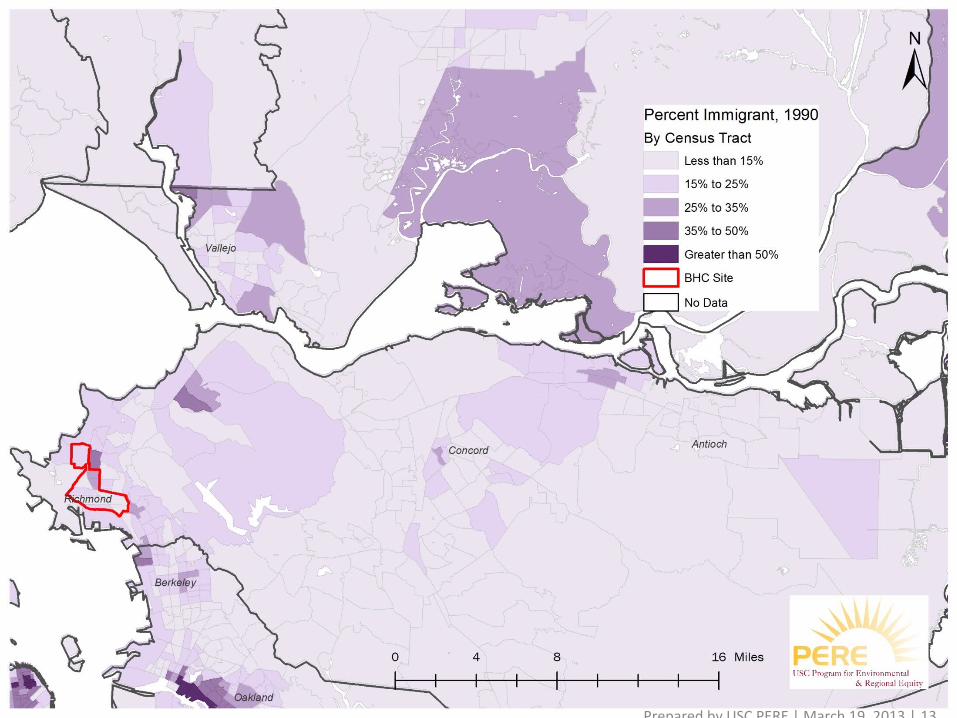
Prepared by USC PERE | March 19, 2013 | 13 Prepared by USC PERE | March 19, 2013 | 13

Prepared by USC PERE | March 19, 2013 | 14 Prepared by USC PERE | March 19, 2013 | 14

Prepared by USC PERE | March 19, 2013 | 15 Prepared by USC PERE | March 19, 2013 | 15

Geography of Change

Prepared by USC PERE | March 19, 2013 | 17

Prepared by USC PERE | March 19, 2013 | 18

Prepared by USC PERE | March 19, 2013 | 19
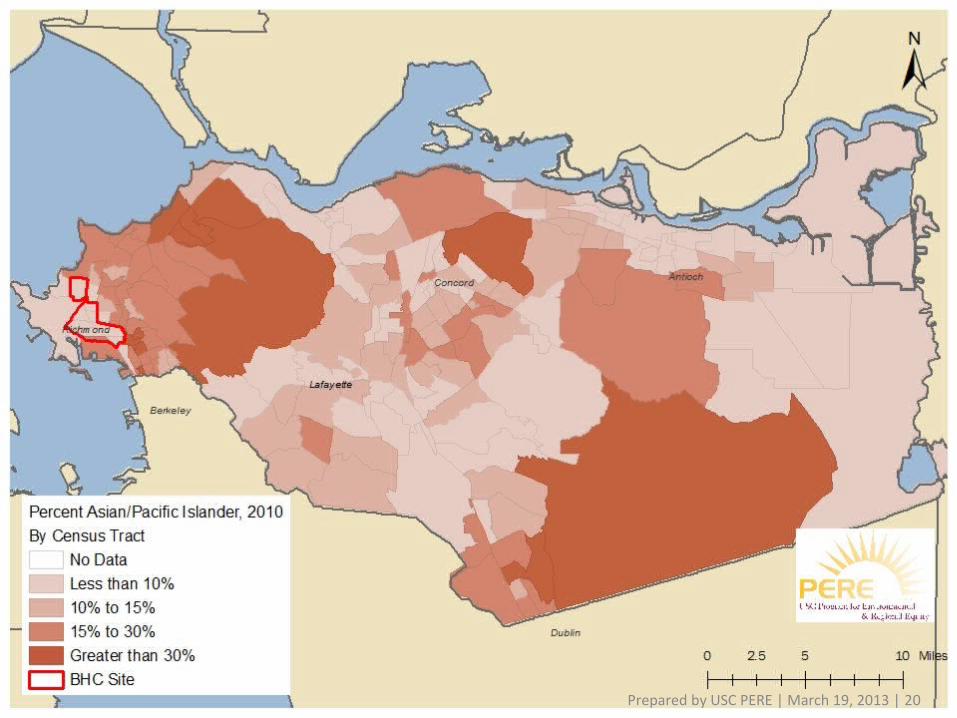
Prepared by USC PERE | March 19, 2013 | 20

Prepared by USC PERE | March 19, 2013 | 21

Prepared by USC PERE | March 19, 2013 | 22

Prepared by USC PERE | March 19, 2013 | 23

Prepared by USC PERE | March 19, 2013 | 24

Prepared by USC PERE | March 19, 2013 | 25

Prepared by USC PERE | March 19, 2013 | 26

Prepared by USC PERE | March 19, 2013 | 27

Prepared by USC PERE | March 19, 2013 | 28

Prepared by USC PERE | March 19, 2013 | 29

Prepared by USC PERE | March 19, 2013 | 30

Prepared by USC PERE | March 19, 2013 | 31

Prepared by USC PERE | March 19, 2013 | 32

Generational Trends

Prepared by USC PERE | March 19, 2013 | 34
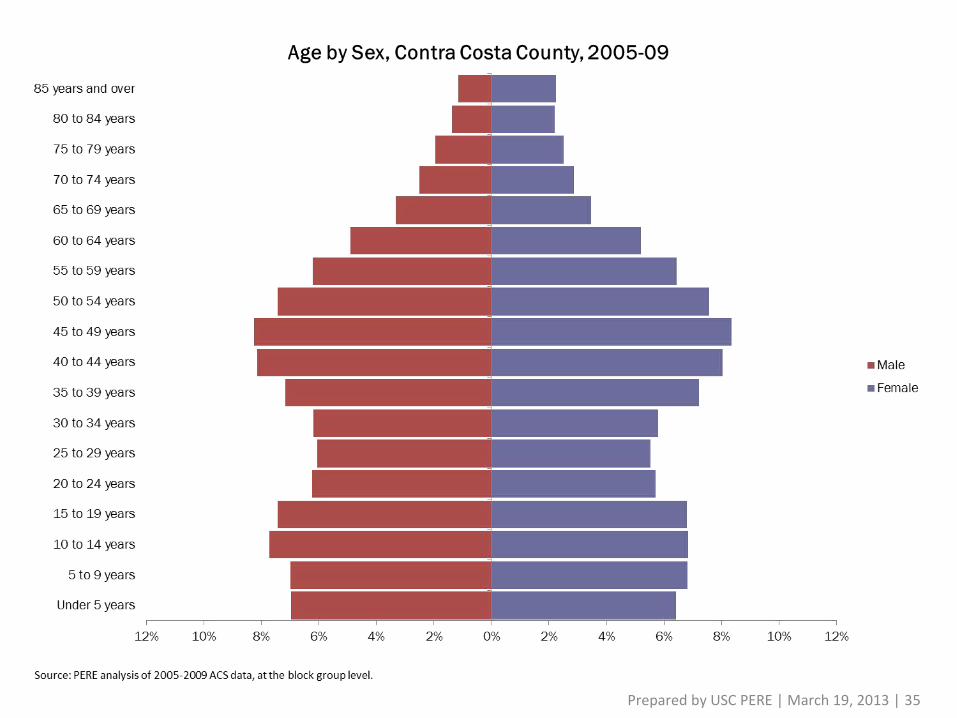
Prepared by USC PERE | March 19, 2013 | 35

Prepared by USC PERE | March 19, 2013 | 36

Prepared by USC PERE | March 19, 2013 | 37
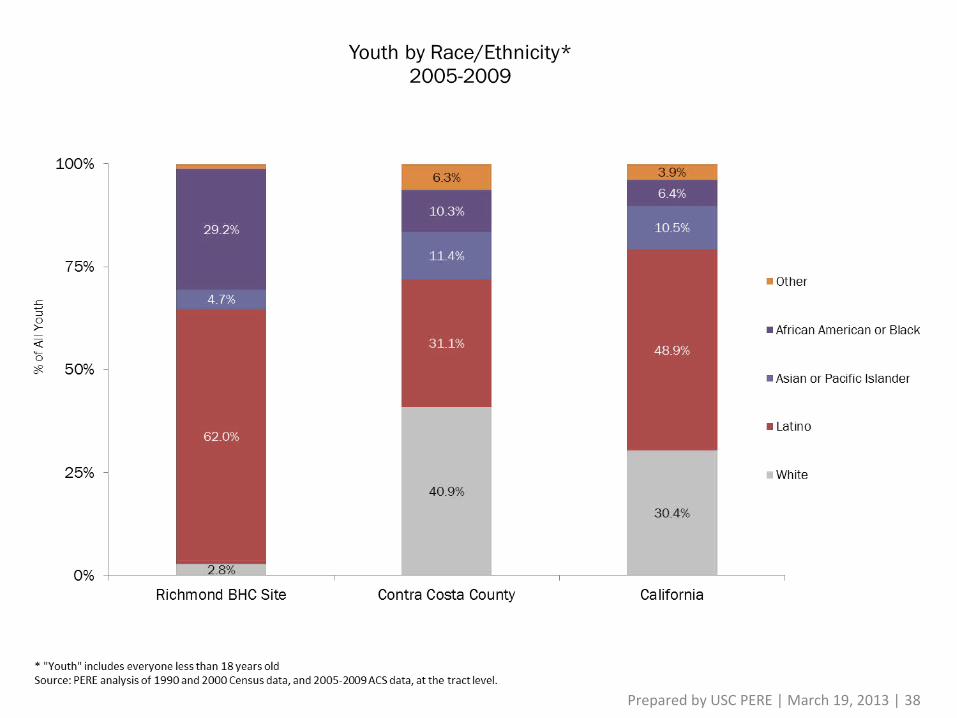
Prepared by USC PERE | March 19, 2013 | 38

Prepared by USC PERE | March 19, 2013 | 39

Prepared by USC PERE | March 19, 2013 | 40

Prepared by USC PERE | March 19, 2013 | 41

From Regional Inequity to Regional Equity

Prepared by USC PERE | March 19, 2013 | 43

Prepared by USC PERE | March 19, 2013 | 44
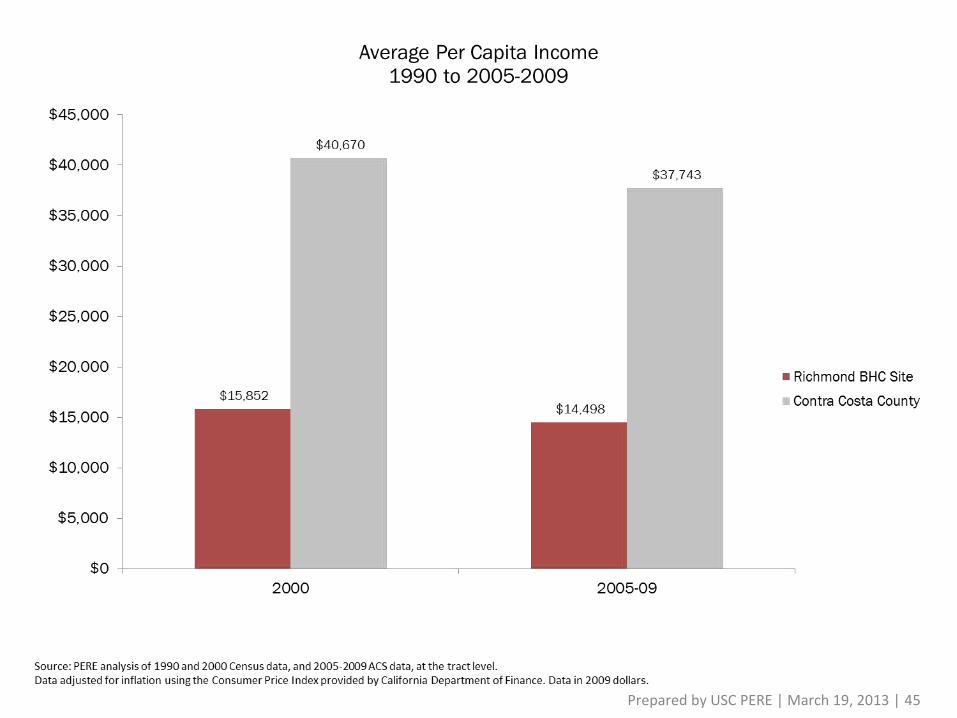
Prepared by USC PERE | March 19, 2013 | 45

Health Equity Indicators

RICHMOND BHC
Source: California Health Interview Survey. CHIS 2009 BHC Health Profile. Los Angeles, CA: UCLA Center for Health Policy Research, 2011.
• 26% of adults are uninsured versus 17% in Contra Costa County & 22% in CA
• 52% of adults are insured by private coverage / employer versus 73%* in Contra Costa County & 61% in CA
• 3% of children are uninsured versus 1% in Contra Costa County & 5% in CA* Denotes statistically significant difference from BHC site estimate.
Prepared by USC PERE | March 19, 2013 | 47

Regional Economic Trends

Prepared by USC PERE | March 19, 2013 | 49
54%66%
52%43%
65% 67%
88%
32%38%
54%
15%
24%
8%
9%
12% 12%
3%
9%7%
10%
30%
10%
39%48%
23% 21%9%
59% 55%
36%
0%
10%
20%
30%
40%
50%
60%
70%
80%
90%
100%
Contra Costa County & Richmond BHC SiteEducational Requirements for New Jobs in the Region &
Educational Attainment by Race/EthnicityPopulation 25+
(2008-2010)
Less than an Associates Degree Associates degree and/or occupational program Bachelors degree or higher
EducationalRequirements
(Projected, 2008-2018)Educational Attainment
(2008-10)

OCCUPATIONS AND INDUSTRIES – CONTRA COSTA COUNTY
Growth in Jobs and Earnings by Wage Level, 1990-2010
Prepared by USC PERE | March 19, 2013 | 50

Industry
Average Annual
Earnings in 1990($2010)
Wage Category
Share of Jobs, 1990
Share of Jobs, 2010
Mining $108,846Utilities $82,559Information $70,007Manufacturing $62,028Professional, Scientific, and Technical Services $59,465Management of Companies and Enterprises $56,764Wholesale Trade $56,527Construction $55,580Finance and Insurance $51,803Transportation and Warehousing $46,078Health Care and Social Assistance $43,908Real Estate and Rental and Leasing $43,325Administrative and Support and Waste Management and Remediation Services$32,035Retail Trade $31,402Education Services $27,500Other Services (except Public Administration) $27,254Agriculture, Forestry, Fishing and Hunting $25,111Arts, Entertainment, and Recreation $19,215Accommodation and Food Services $15,291
Low 22% 26%
High 22% 23%
Medium 55% 51%
OCCUPATIONS AND INDUSTRIES – CONTRA COSTA COUNTY
Prepared by USC PERE | March 19, 2013 | 51

EMPLOYMENT GROWTH – CONTRA COSTA COUNTY
Industry Size, Pay, and Growth(Bubble size represents total employment in 2010)
Prepared by USC PERE | March 19, 2013 | 52