Embed Size (px)
Citation preview

CTU Cartech, Czech Technical University in Prague, Formula Student/SAE Team 1
CTU CARTECH CFD REPORT
Team CTU Cartech has taken part in this year Formula Student competitions with third car-prototype
called FS.03. Our intension was to reach the top ten at least in one competition. In order to achieve
our goals we aimed to improve our overall team performance trough disciplines.
We are sure that CFD simulations are important part of the design process, because they can
improve the car performance at the track and team presentation during the design event. CFD can be
used in Formula Student for the following areas
• Aerodynamics
• Engine performance
• Heat transfer.
With the help of STAR-CCM+, we have been able to perform CFD simulations for the first time in our
teams history. We will now review the work done with STAR-CCM+ software during the last year.
AIR INTAKE SYTEM
The design of Formula Student air intake system has to fulfill specific Formula Student/SAE rules,
which have significant effect on the engine performance, because they influence negatively the
amount of air aspired by cylinders compared to unrestricted engine. Therefore it is important to
simulate airflow in air intake system in order to optimize engine performance.
CTU Cartech cars are powered by YAMAHA R6 four cylinder engine with displacement volume of
599 ���.
RESTRICTOR FLOW
Starting with STAR-CCM+ we performed simulations to explore its possibilities, settings and
preferences. The purpose of the simulation was to set the mass flow/ pressure drop dependence in
order to calibrate the 1D engine simulation model in GT-Power.
In STAR-CCM+ we focused mainly on mesh, solver and different turbulence settings. In CFD
simulations it is very desirable to achieve mesh independent solutions and that was exactly our goal
in that particular problem. In mesh independency test we created meshes containing from 50 000 up
to 3 million polyhedral cells. Figure 1 shows plot of mass flow throughout the restrictor/number of
cells in chocking conditions. The solution is mesh-independent when the domain contains about 1.5
million cells. The most important and useful fact is that the results are very accurate even when the
domain contains about 400 thousand cells. This number of cells was used later in air intake system
domain for unsteady flow simulations.

CTU Cartech, Czech Technical University in Prague, Formula Student/SAE Team 2
Figure 1
Figure 2 shows flow through the restrictor in chocking conditions (Velocity Mach 1 in the throat) with
shock wave in the diffuser. The coupled flow solver can accurately predict chocking conditions and
shock waves, which affect maximal engine performance.
Figure 2

CTU Cartech, Czech Technical University in Prague, Formula Student/SAE Team 3
Table 1 summarizes the setup of restrictor flow and also air intake system simulation.
Table 1 – Simulation setup
Mesh
Type Polyhedral
Number of cells 50 000 – 3 milion
Number of prism layers 3 – 6
Solver Type Coupled Implicit, Flow, Energy
Physics
Turbulence model Realizable k-e, SST k-w, RSM
Wall functions All �� wall treatment
Max wall �� ~ 50
AIR INTAKE SIMULATION
Putting of throttle body, restrictor, airbox, injection and runner pipes together results in a complete
assembly of air intake system (see figure 3).
Figure 3
Because the nature of engine flow is inherently unsteady, we decided to perform unsteady
computation in order to understand the flow behavior in air intake system. Firstly boundary
conditions and domain geometry had to be set. Some simplifications in geometry have been made.
The throttle plate was removed in order to reduce mesh size because fully opened throttle body´s
wake should have minimal influence on engine performance. Cylinder runner pipes have been
modeled up to engine head, therefore no valve opening and closing needed to be simulated. In
addition time dependent boundary conditions have been gained from 1D engine model in GT-Power,
because the flow at the inlet to the induction ports can be assumed as one-dimensional. Static
pressure, temperature and turbulence parameters have been applied to the domain outlets and
stagnation pressure and temperature on the inlet, simulating suction from atmosphere. The
simulation has been carried at 12000 crankshaft rpm.

CTU Cartech, Czech Technical University in Prague, Formula Student/SAE Team 4
The domain has been divided into approximately 380 000 polyhedral cells and one engine cycle
period into 540 intervals. Second order discretization schemes have been used for both flow and
time. 6 cycles needed to be run in order to achieve converged solution.
The outputs of the simulation are mass flows at domain outlets throughout one engine cycle. The
mean mass flows at outlets during one cycle and suction phase have been computed. The former
serves as verification the simulation is right, because the sum of mean mass flows per cycle at outlets
has to be the same as the mean mass flow through inlet or restrictor throat. The latter serves as
performance parameter of particular cylinders.
Output of the unsteady simulation of FS.03 air intake system and different airbox shape as a possible
concept for next season are summarized in table 2.
Table 2 – Unsteady simulation
Mean mass flow during suction phase � ∙ ���
Cylinder 1 Cylinder 2 Cylinder 3 Cylinder 4 Sum
FS.03 50 53,3 53,3 50,3 206,9
Different airbox 52,7 51,6 52 51,5 207,8
Table 2 shows that there is potential to improve the uniformity of mass flow distribution for
particular cylinders (firs line). Simulations done for the next race season with different airbox shape
show, that it is possible to achieve more uniform distribution of mass flows. But the total sum of
mass flow doesn´t increases. We have also worked out that there is some connection between
steady and unsteady simulation. In steady state case we opened just one runner pipe, applied
backpressure to its outlet and measured mass flow. Inner cylinders (cylinder 2 and 3) have greater
mass flow both in unsteady and steady state for the FS.03 while for different airbox shape mass flows
are more equal for both states (see table 3).
Table 3 - Steady state
Mass flow [g/s]
Inner cylinder Outher cylinder Difference [%]
FS.03 59,5 57 4,2
Different airbox 57,5 58 0,8
In addition for the coming year we would like to do 1D/3D engine simulation and explore the airbox
flow parameters (response) in transient engine simulations (car acceleration).
EXTERNAL AERODYNAMICS
In Formula Student the aerodynamic forces don´t play so high role like in Formula 1, because cars
speed at the track is significantly lower. Nevertheless aerodynamics plays important part of car
performance, because while the car is moving the drag is still present and the engine has to be
cooled. In our aerodynamics calculations we primarily focused on resolving the flow through heat
exchanger in an entire aerodynamic model of the car.
Our cooling assembly consists of a heat exchanger, an upstream and downstream duct with a fan.
The addition of upstream duct to present car prevents the air leakage throughout the system while
the downstream duct improves the flow uniformity through heat exchanger honeycomb (see fig. 5).

CTU Cartech, Czech Technical University in Prague, Formula Student/SAE Team 5
Figure 5
The computational domain for the aerodynamic calculation consist of a large box (40 × 6 × 6 �),
where half of the car is placed (see appendix). Velocity is prescribed at Velocity Inlet boundary while
zero gauge pressure is defined at Pressure Outlet boundary. Vehicle ride is simulated by means of
moving ground and rotating wheels. The fan on the car is switched on when the water temperature
crosses some specified value (e.g. 85℃). Simulations have been carried out with the fan switched off
by higher velocities and switched on by lover velocities and when the car is standing. The fan
pressure rise was modeled the simplest way possible as an internal interface and it´s characteristics
was defined by polynomials. The heat exchanger flow was modeled by porous media just setting the
inertial and viscous resistance coefficients gained from pressure drop curve measured by our heat
exchanger manufacturer.
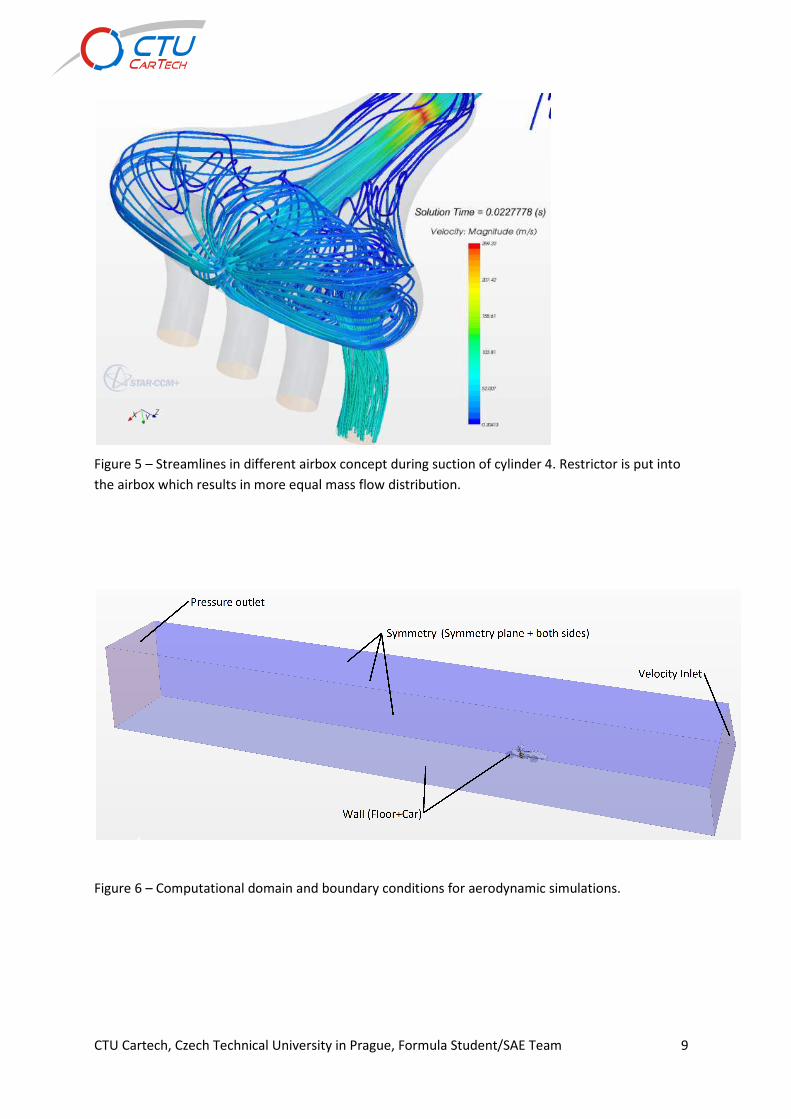
For aerodynamic simulations we have use both polyhedral and trimmed meshes. The final results are
obtained on meshes containing 5.5 million polyhedral cells (see table 4).
Table 4-Aerodynamic simulation setup summary
Mesh
Type Polyhedral, Trimmer
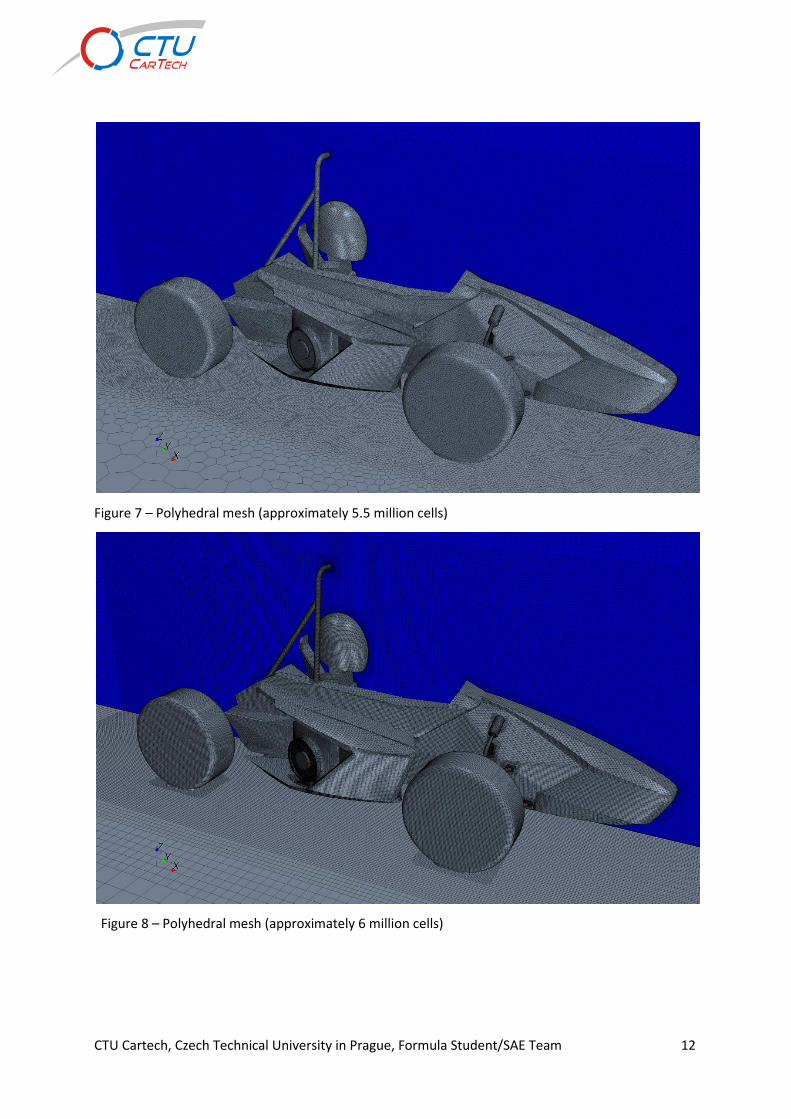
Number of cells (Max) 5,5 millions (Poly) 6 (Trim)
Number of prism layers 3
Solver Type Segragated
Physics
Turbulence model SST k-w
Wall functions All �� wall treatment
Max wall �� ~ 45
The main outputs of the simulations are aerodynamic forces acting on the car and mass flow through
heat exchanger. Low value of downforce coefficients �� in table 5 confirms that our car doesn´t
produce significant downforce. This is due to lack of diffuser and wings. The usage of diffuser can
increase the amount of downforce and also reduce the drag of the car because it changes the wake
structure behind it. The fitting of the diffuser is the biggest problem because the rear suspension is
quite low, there is also exhaust system and jacking rod in possible diffuser location.

CTU Cartech, Czech Technical University in Prague, Formula Student/SAE Team 6
Table 5 -Aerodynamic forces
Car velocity
[kmh]
Drag
[N]
Downforce
[N]
�� ��
30 18.6 0.6 0.54 0.017
50 50 4.6 0.48 0.044
80 120 8 0.46 0.033
Mass flows through heat exchanger in different regimes are summarized in table 6.
Table 6 - Cooing system mass flows
For the next season we would like to improve simulations by adding heat transfer, more realistic fan
model, more cells in the domain, e.g.
Compared to previous years we didn´t have any problems concerning the cooling of the car. We have
been able to finish every endurance race even in very hot temperatures like in Italy and Spain. We
are sure we can improve the cooling system further.
Conclusion
Using STAR-CCM+ we have been able to design parts of cooling and air intake system. STAR-CCM+
allow us to understand and analyze the car´s parameters linked to fluid flow systems. It is helping us
to apply the results during the design stage of the car components and for presentation within
competitions program. For the next year we intend to use STAR-CCM+ even more for the design of
the car´s components in order to improve the performance of the car.
This year we have attended the races in Silversone (United Kingdom), Varano (Italy) and Barcelona
(Spain). In Silverstone we finished 7 th, in Varano 6
th and in Barcelona 2 th. The first application of
STAR-CCM+ in actual season is one of the factors which generated the positive results related to the
passed races in 2011.
Car velocity
[kmh]
Cooler mass flow
[kg/s]
Fan switched on
0 0,21 Yes
30 0,23 Yes
30 0,101 No
50 0,2 No
80 0,36 No

CTU Cartech, Czech Technical University in Prague, Formula Student/SAE Team 7
APPENDIX
Figure 1 - Streamlines in FS.03 airbox during suction of cylinder 1.
Figure 2 – Polyhedral mesh for unsteady simulation (approximately 380 000 cells).

CTU Cartech, Czech Technical University in Prague, Formula Student/SAE Team 8
Figure 3 – Absolute pressures gained from GT-Power at air intake outlets.
Figure 4 – STAR-CCM+ mass flows through one engine cycle.
CTU Cartech, Czech Technical University in Prague, Formula Student/SAE Team 9
Figure 5 – Streamlines in different airbox concept during suction of cylinder 4. Restrictor is put into
the airbox which results in more equal mass flow distribution.
Figure 6 – Computational domain and boundary conditions for aerodynamic simulations.

CTU Cartech, Czech Technical University in Prague, Formula Student/SAE Team 10
Figure 7 – Pressure distribution on the car and streamlines in 80 kmh.
Figure 8 – Streamlines while the car is standing and fan switched on. Fan is modeled as internal
interface, therefore no swirl is included.

CTU Cartech, Czech Technical University in Prague, Formula Student/SAE Team 11
Figure 9 – Streamlines containing mass flow through cooling system. It is possible to analyze flow
interaction with a car.
Figure 10 – Pressure distribution on plane cut through computational domain. Pressure rise can be
observed before upstream duct of cooling system after that pressure drop through cooler (porous
medium). Fan is switched off (otherwise there would be pressure rise).
CTU Cartech, Czech Technical University in Prague, Formula Student/SAE Team 12
Figure 7 – Polyhedral mesh (approximately 5.5 million cells)
Figure 8 – Polyhedral mesh (approximately 6 million cells)
CTU Cartech, Czech Technical University in Prague, Formula Student/SAE Team 13
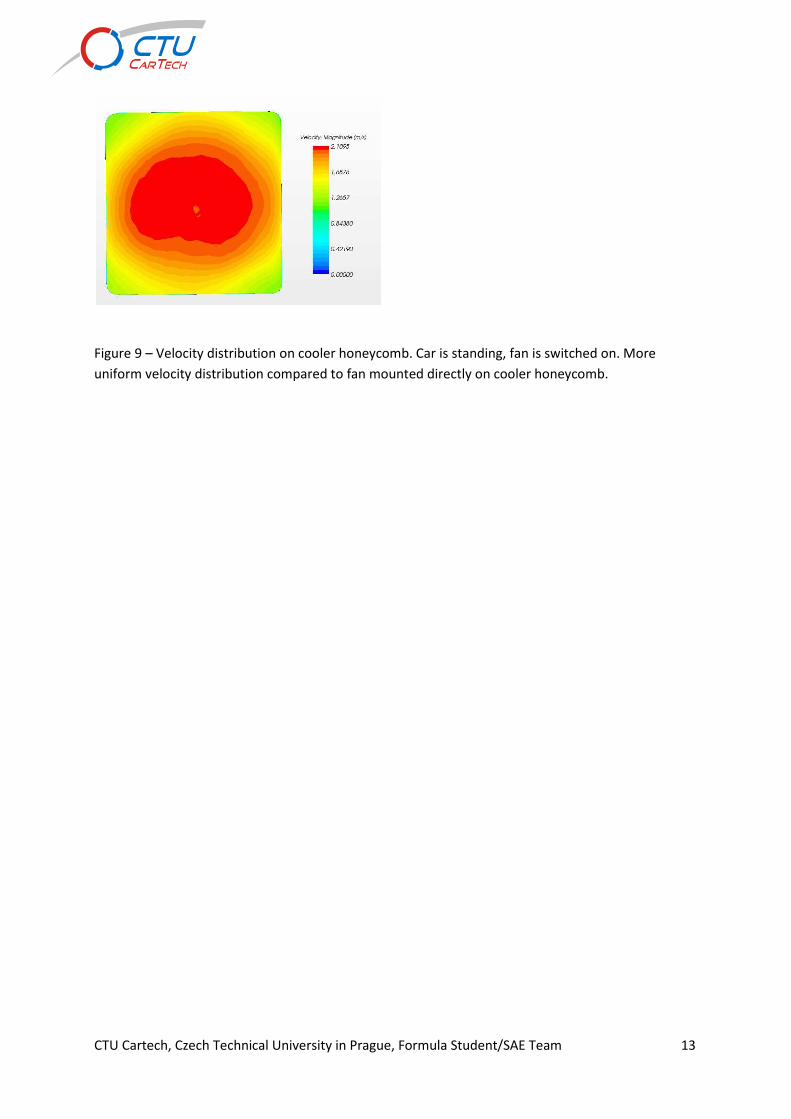
Figure 9 – Velocity distribution on cooler honeycomb. Car is standing, fan is switched on. More
uniform velocity distribution compared to fan mounted directly on cooler honeycomb.