Embed Size (px)
Citation preview
Biophysical Chemistry, 44 (1992) 163-173 Elsevier Science Publishers B.V., Amsterdam
163
BIOCHE 01686
Time-resolved intrinsic fluorescence of Enzyme I.
The monomer/ dimer transition
F. Chauvin r, D. Toptygin, S. Roseman ’ and L. Brand 3
Department of Biology and McColltim-Pratt Institute, The Johns Hopkins Clnicersity, Baltimore, MD 21218 (USA)
(Received 10 July 1991; accepted in revised form 30 April 1992)
Abstract
Enzyme I of the bacterial phosphotransferase system can exist in a munomer/dimer equilibrium which may have functional significance. Each monomer contains two tryptophan residues. It is demonstrated that the decay of both the monomer and the dimer can be described by a biexponential. The decay times depend on the temperature and at 6°C the decay times are 7, = 0.4 ns and T* = 3.2 ns for the monomer and ra = 3.2 ns and r4 = 7.2 ns for the dimer form of the enzyme. The changes in the fluorescence decay parameters can be utilized to measure the equilibrium constant for the monomer/dimer transition.
Keywords: Phosphotransferase system enzyme I; Time-resolved fluorescence: Monomer/dimer equilibrium
1. Introduction
The bacterial phosphoenolpyruvate : glycose phosphotransferase system (PTS) is responsible for the uptake and concomitant phosphorylation
Correspondence to: Dr. L. Brand, Department of Biology and McCollum-Pratt Institute, The Johns Hopkins University, Bal- timore, MD 21218 (USA). Fax: 410-516 5213, Tel.: 410-516 7298, Email: [email protected]. ’ Supported by NSF grant number DIR 8721059. ’ Supported by NIH grant number GM38759. 3 Supported by NIH grant number GM11632. The abbreviations used are: PTS, the phosphoenol- pyruvate: glycose phosphotransferase system; PEP, phospho- enolpyruvate; HPr, the histidine-containing phosphocarrier protein; BIG”, the phosphocarrier protein of the PTS, spe- cific for glucose and methyl cu-o-glucoside; IIG”, the integral membrane protein of the PTS, specific for glucose and methyl cu-o-glucoside; DTT, dithiothreitol; KP,, potassium phosphate.
of sugar nutrients. The reaction involves a chain of phosphocarrier proteins (four for glucose entry into E. coli), the first two being soluble [1,2]. The functioning of this system is crucial for bacterial metabolism and physiology. The best example of the stringent regulation of this system is the di- auxic growth reported by Monod [3].
Enzyme I has been postulated to be involved in regulation of the PTS because of the following properties: (i) It is the first enzyme of the chain of phosphocarrier proteins. (ii) It is the only known direct external phosphorylation site of the PTS. It thus controls the activity of IIIG’“, thereby that of adenylate cyclase and membrane perme- ases. (iii) Enzyme I itself is known to interact with other cellular proteins: acetate kinase (Fox and Roseman, [41) and a kinase linked to the isoci- trate lyase (DannelIy et al., [5]1. This could pro- vide a link with other branches of the bacterial metabolism. (iv) Enzyme I undergoes a mono-
0301-4622/92/$05.00 0 1992 - Elsevier Science Publishers B.V. All rights reserved
164 F. Chauoin et al. / Biophys. Chm. 44 (1992) 163-173
mer/dimer transition with the dimer being the active species.
The properties of the monomer/dimer transi- tion have been actively studied because this phe- nomenon could be involved in PTS regulation. (i) Kukuruzinska et al. [6] showed that the aggrega- tion yielded specifically dimers (no higher order aggregates) of identical subunits. (ii) The dimer- ization phenomenon is linked to enzymatic activ- ity: only the dimer seems enzymatically active, as reported by Weigel et al. [7], Misset et al. [S] and Hoving et al. [9,101. (iii) The temperature depen- dence of the monomer/ dimer equilibrium shows that both the enthalpy and entropy changes are positive upon dimerization (Kukuruzinska et al. [Ill, Neyroz et al. [12] which indicates that the dimerization is entropically driven. (iv) The monomer/dimer equilibrium is regulated by the phosphorylation state of the protein and by lig- and binding (Kukuruzinska et al. [ill. (v) The kinetics of monomer/dimer interconversion is slow (Chauvin unpublished results).
The tertiary structure of the protein has been investigated by LiCaIsi et al. [13] by a combina- tion of differential scanning calorimetry and pro- tease digestion. Their results indicate that the N-terminal half of the protein constitutes a sta- ble, tightly packed domain, whose compactness seems similar in different experimental condi- tions. In contrast, the C-terminal domain appears more flexible and its conformation seems to vary with the solution conditions such as pH.
In the present study we investigate the influ- ence of the monomer/dimer transition, in&pen- dent of the temperature, on the time-resolved fluo- rescence properties of the enzyme. It is shown that the decay times of the two tryptophans are sensitive to changes in the microenvironments of these residues which are different in the monomer and dimer forms of the enzyme. A new global analysis procedure is described which makes it possible to determine the monomer/dimer equi- librium.
2. Materiats and methods
Enzyme I from E, coli was purified from the overproducer strain described by Saffen et al. [14]
according to a procedure previously described (Weigel et al. [71 and Beneski et al. [151. The protein concentration was determined by the Lowry method [161 using BSA as a standard, and by absorbance at 280 nm as in weigel et al. [7]. In all cases, the ‘dimer fraction’ (f,) and ‘monomer fraction’ (f,> relate to the proportion of pro- tomers involved in the species, so that: f,,, +fd = 1. The enzyme was phosphorylated by incubation at 37°C in the presence of 2 mM PEP for 30 minutes. Unless otherwise indicated experiments were done in Buffer A which contained: 10 mM IQ,, 100 mM KCI, 5 mM MgCl,, 1 mM EDTA, 2 mM PEP, 0.2 mM DTT, pH 6.5.
2.1 Fluorescence measurements
The time-resolved intensity decay of the tryp- tophan fluorescence of Enzyme I was studied by the pulse method, using a single photon counting technique. The excitation was accomplished by a cavity dumped dye laser pumped with a mode locked Nd : Yag laser (Spectra-Physics). The exci- tation wavelength was 295 nm. The fluorescence was excited by vertically polarized light. It was observed at the magic angle (54.7”) in order to avoid any polarization artifact. The emitted pho- tons were detected either by a photomultiplier or a microchannel plate detector. Depending on the experiment, the time calibration was 0.04 ns or 0.1051 ns per channel (511 or 800 channels were used for the collection, depending on the timing calibration). For all the experiments, melatonin was used as a standard to check for the instru- ment performance, as in Han et al. [19].
The data collection was automated, making use of a collection program written by Professor R.P. DeToma. Three samples were excited in turn: the Enzyme I sample under investigation, a ludox scattering solution (in order to obtain the ‘lamp profile’) and a melatonin solution, to verify the functioning of the instrument. For building a given decay curve, these three samples were con- temporaneously excited for times not exceeding 15 s. The data were collected to a constant peak count (20,000 for the equilibrium measurements and 2,500 for the kinetic measurements).

F. Chauuin et al. /Biophys. Chem. 44 (1992) 163-173 165
The data were initially analyzed by the proce- dure described by Badea and Brand 1171. In addi- tion, global analysis procedures (Knutson et al. [18] were used for further analysis.
2.2 Equilibtium studies
For the determination of the equilibrium con- stant, all the samples were preincubated at 6°C (temperature of the experiment) for at least 2 hours prior to the data collection.
2.3 Kinetics of dissociation
A concentration jump was used for perturbing the monomer/ dimer equilibrium. The transition was studied at 6°C. The temperature was regu- lated at +_OS”C. A data collection program writ- ten by R. DeToma (KINDK) was used to record the successive decay curves. The time necessary to obtain one decay curve was approximately 2.5 minutes. In comparison, the relaxation required 30 minutes for completion at this temperature. The transition kinetics were analyzed according
to Bernasconi [201. The curves of fraction of the short decay component as a function of the reac- tion time were fitted to an exponential decay.
3. Results
3.1 Fluorescence intensity decay model and the monomer /dimer content
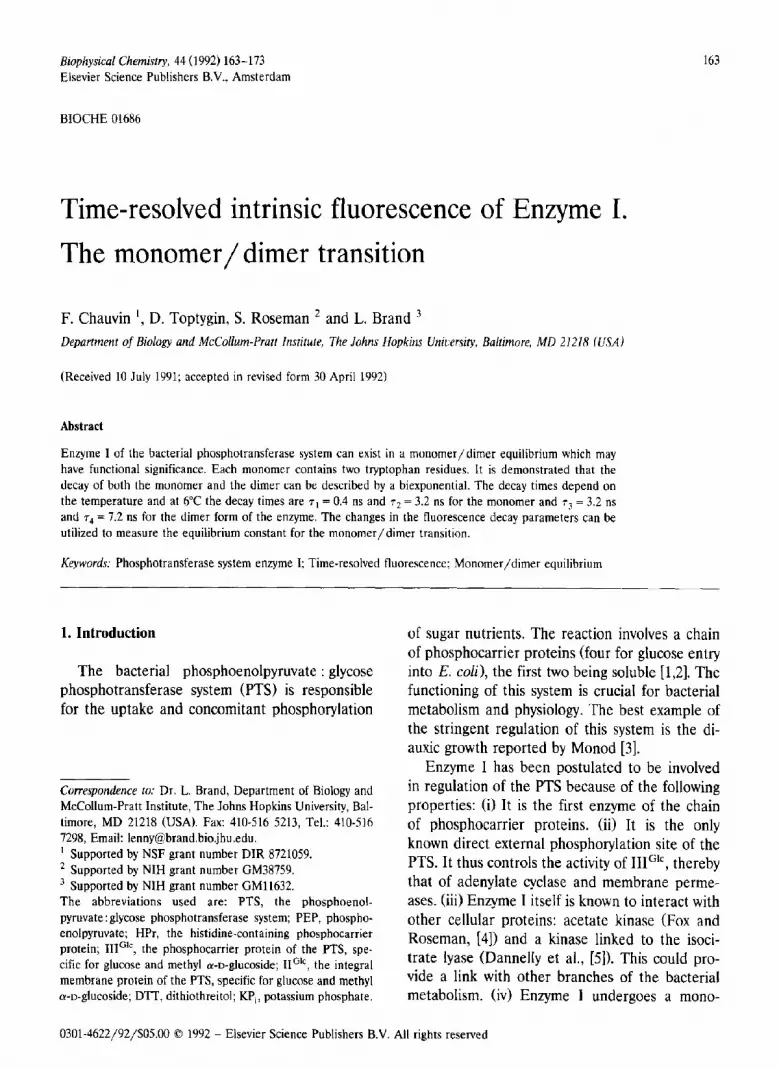
In order to characterize the fluorescence in- tensity decay of Enzyme I, we used conditions where the population of protein molecules was as homogeneous as possible. Figure 1 shows the fluorescence intensity decay of phospho-Enzyme I. The phosphorylation degree was kept at 100% as the measurement was made in the presence of 2 mM PEP. The protein concentration was 1 mg/ml, the temperature was 6°C. These experi- mental conditions were chosen so that the dimer proportion was high: f, N 90%. The value of the equilibrium constant used to calculate fd was 3.1 x lo6 M-‘, Chauvin et al. (unpublished re- sults).
I.0 autocorrelation
0.1 1\,-- 0.0
-0.3
Fig. 1. The fluorescence intensity decay of predominantly dimer of Enzyme 1. The ttyptophan intensity decay of Enzyme I was recorded for a sample containing a high dimer proportion (90%). The data were collected and analyzed as described in Section 2. The left panel presents an analysis in terms of a sum of hvo exponentials, the right panel, in terms of a sum of three exponentials. For each panel, the data and the model are superimposed. The residuals of the fit and the autocorrelation of the fit are shown. The x2 of the fits are 0.9998 and 0.953 for a two exponential versus a three exponential model, respectively. Enzyme I was in 10 mM KP,, 100 mM KCI, 2 mM PEP, 5 mM M&l,, 1 mM EDTA, 0.2 mM DTT, at pH 6.5. The temperature was 6”C, the protein concentration, 1 mg/ml. The sample was preincubated for 2 hours before the measurement. The time calibration was 0.042 ns per
channel; 800 channels were used.

166 F. ChaulG et al. /Biophy,s. Chem. 44 11992) 163-173
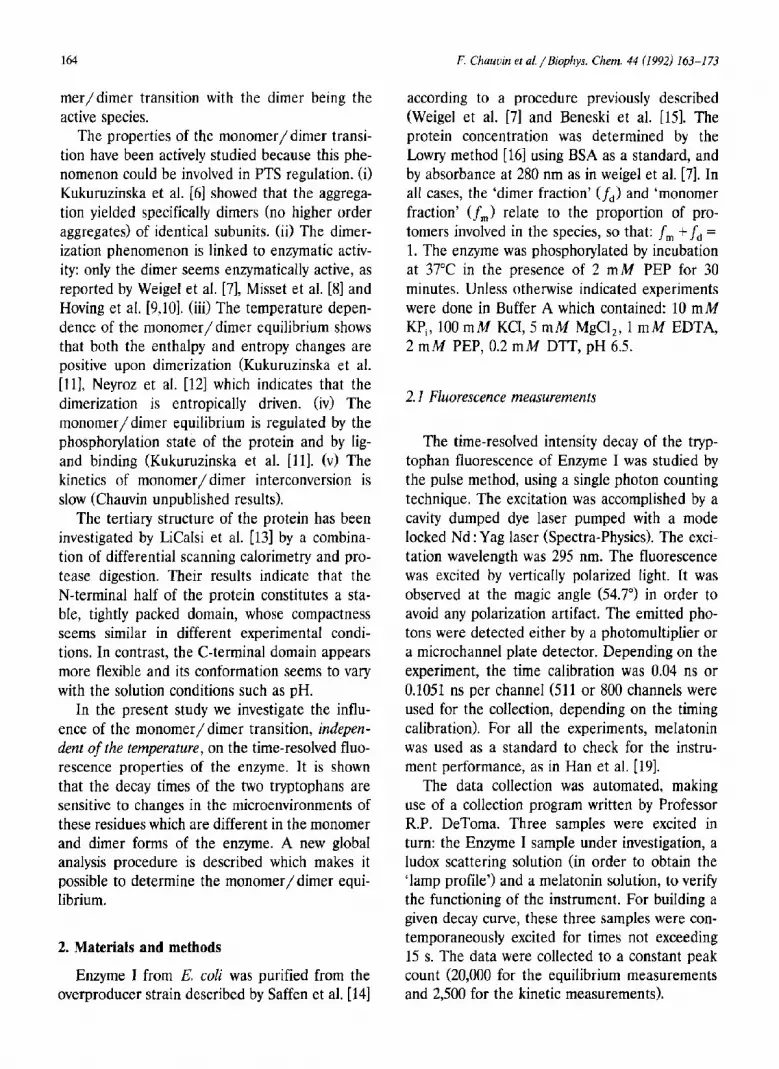
Table 1
Tryptophan intensity decay as a function of the dimer content
fd @$ am Ttn X2 (7) (%) (%) ;;Is, (%o) (ns) ;&I ss, (ns)
90 _ 18.5 3.1 81.5 7.2 0.998 6.83 90 12 0.07 17 3.3 71 7.2 U.Y53 6.80 50 24.5 2.1 75.5 7.0 1.35 6.56 50 12 0.54 23 3.3 65 7.2 1.02 6.59
Enzyme I was in 10 mM KPi, 100 mM KCI, 5 mM MgCI,, 1 mM EDTA, 2 mM PEP, 0.2 mM DTT, pH 6.5. The measurement was made at 6°C. For the 90% dimer sample, the protein concentration was 1 mg/ml. It was 20 &ml for 50% dimer. The solutions were preincubated for 4 hours at 6°C prior to the measurement
The highlighted parameters are those that were considered as satisfactorily describing the data: the model for 90% dimer is a double exponential. A triple exponential decay is required for the 50% dimer. The value of the long lifetime did not vary significantly over this change of dimer fraction. However, the value of T,,,~~~~,,, in the case of a double exponential fit is very sensitive to the dimer content: 3.1 ns at 90% versus 2.1 ns at 50%. The value of the avcragc lifetime were calculated using
The left panel shows that the data can be analyzed according to a sum of two exponentials. The fit was good: x2 was 0.998. The residuals of the fit and the autocorrelation of the residuals were randomly distributed around 0. The analysis yielded the following lifetime values: T,,,,,~ = 3.1 ns and T,~,,~ = 7.2 ns. Their contributions to the zero-time fluorescence were 18.5 and 81.5% re- spectively. The right panel shows an analysis of
auiocorrelotion
time, n*ec
the same data according to a sum of three expo- nentials. The fit was only marginally improved. There was no significant change in the residuals or autocorrelation. The analysis yielded values for the two main lifetimes that were ~~edium = 3.3 ns and along = 7.2 ns. Their contributions to the zero-time fluorescence were 17% and 71% re- spectively. Note that these values are very similar to those obtained by the double exponential anal-
autocorrelaiion
time, nfec
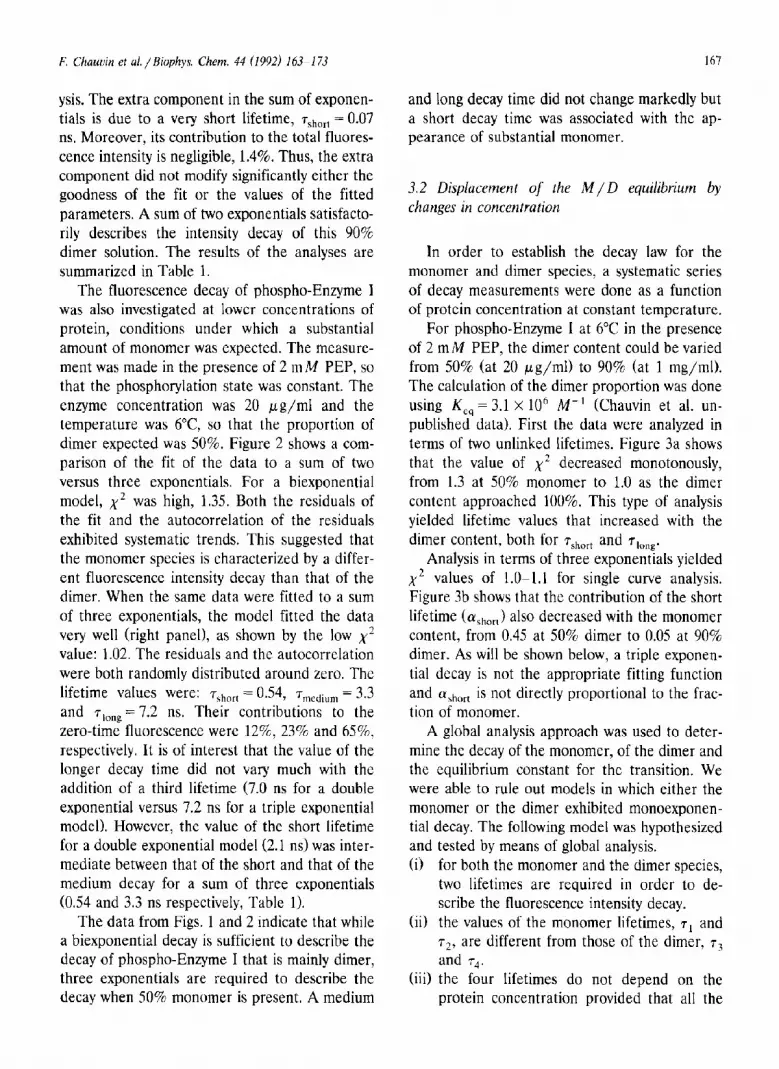
Fig. 2. The fluorescence decay of a monomer/dimer mixture of Enzyme I. The dimer content was 50%. Data collection and analysis were as in Fig. 1. The left panel shows an analysis in terms of a sum of two exponentials. The ,y2 was 1.35. The right panel shows the anaIysis in terms of a sum of three exponentials. The model fits the data, both the residuals of the fit and the autocorrelation of the residuals are randomly distributed around zero. The x2 is 1.02. Enzyme I was in the same buffer as in Fig. 1. The temperature was 6°C. The protein concentration was 20 &g/ml. The time calibration and number of channels were as in
Fig. 1.
F. Chauuin et al. /Biophys. Chcm. 44 (1992) 163-l 73 167
ysis. The extra component in the sum of exponen- tials is due to a very short lifetime, T,,,~~, = 0.07 ns. Moreover, its contribution to the total fluores- cence intensity is negligible, 1.4%. Thus, the extra component did not modify significantly either the goodness of the fit or the values of the fitted parameters. A sum of two exponentials satisfacto- rily describes the intensity decay of this 90% dimer solution. The results of the analyses are summarized in Table 1.
The fluorescence decay of phospho-Enzyme I was also investigated at lower concentrations of protein, conditions under which a substantial amount of monomer was expected. The measure- ment was made in the presence of 2 mM PEP, so that the phosphorylation state was constant. The enzyme concentration was 20 ,ug/mI and the temperature was 6”C, so that the proportion of dimer expected was 50%. Figure 2 shows a com- parison of the fit of the data to a sum of two versus three exponentials. For a biexponential model, x2 was high, 1.35. Both the residuals of the fit and the autocorrelation of the residuals exhibited systematic trends. This suggested that the monomer species is characterized by a differ- ent fluorescence intensity decay than that of the dimer. When the same data were fitted to a sum of three exponentials, the model fitted the data very well (right panel), as shown by the low x2 value: 1.02. The residuals and the autocorrelation were both randomly distributed around zero. The lifetime values were: 7,hort = 0.54, T,,~~“~, = 3.3
and Tiong = 7.2 ns. Their contributions to the zero-time fluorescence were 12%, 23% and 650/o, respectively. It is of interest that the value of the longer decay time did not vary much with the addition of a third lifetime (7.0 ns for a double exponential versus 7.2 ns for a triple exponential model). However, the value of the short lifetime for a double exponential model (2.1 ns) was inter- mediate between that of the short and that of the medium decay for a sum of three exponentials (0.54 and 3.3 ns respectively, Table 1).
The data from Figs. 1 and 2 indicate that while a biexponential decay is sufficient to describe the decay of phospho-Enzyme I that is mainly dimer, three exponentials are required to describe the decay when 50% monomer is present. A medium
and long decay time did not change markedly but a short decay time was associated with the ap- pearance of substantial monomer.
3.2 Dispfucemenl of the M/D equilibrium by changes in concentration
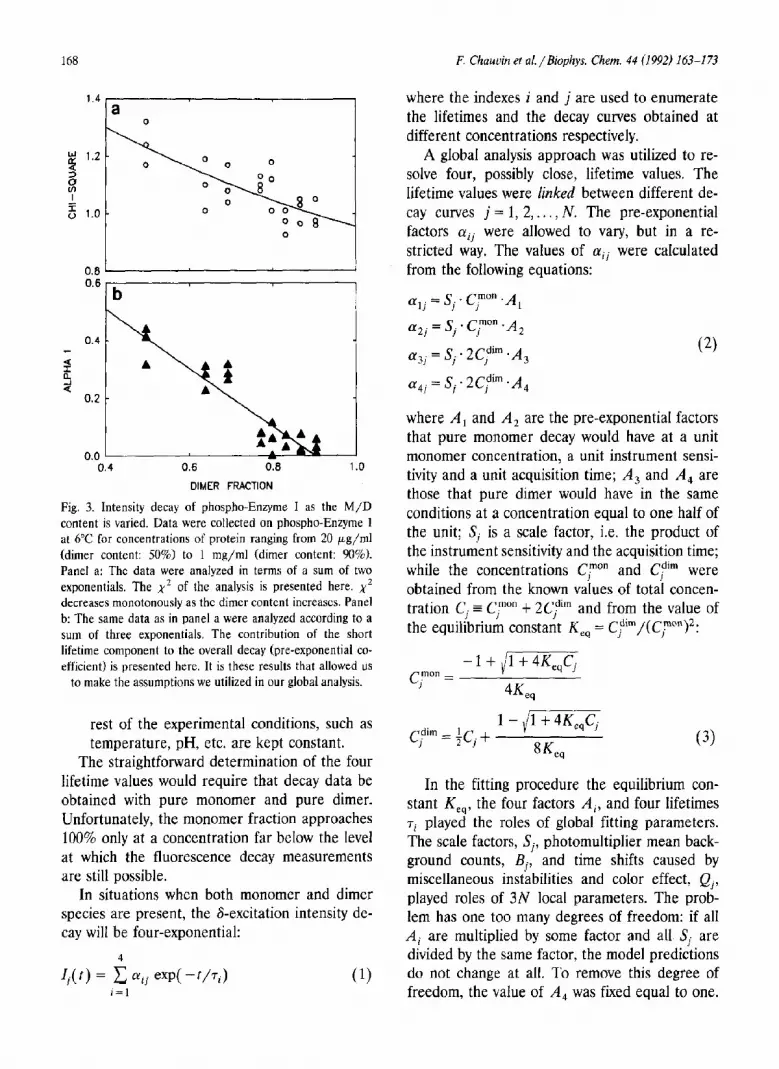
In order to establish the decay law for the monomer and dimer species, a systematic series of decay measurements were done as a function of protein concentration at constant temperature.
For phospho-Enzyme 1 at VC in the presence of 2 m M PEP, the dimer content could be varied from 50% (at 20 pg/ml) to 90% (at 1 mg/ml). The calculation of the dimer proportion was done using K,, = 3.1 X 10’ M-’ (Chauvin et al. un- published data). First the data were analyzed in terms of two unlinked lifetimes. Figure 3a shows that the value of x2 decreased monotonously, from 1.3 at 50% monomer to 1.0 as the dimer content approached 100%. This type of analysis yielded lifetime values that increased with the dimer content, both for ~~~~~~ and ‘T,~“~.
Analysis in terms of three exponentials yielded x2 values of 1.OSl.l for single curve analysis. Figure 3b shows that the contribution of the short lifetime (aShort) also decreased with the monomer content, from 0.45 at 50% dimer to 0.05 at 90% dimer. As will be shown below, a triple exponen- tial decay is not the appropriate fitting function
and a\hort is not directly proportional to the frac- tion of monomer.
A global analysis approach was used to deter- mine the decay of the monomer, of the dimer and the equilibrium constant for the transition. We were able to rule out models in which either the monomer or the dimer exhibited monoexponen- tial decay. The following model was hypothesized and tested by means of global analysis. 6) for both the monomer and the dimer species,
two lifetimes are required in order to de- scribe the fluorescence intensity decay.
(ii) the values of the monomer lifetimes, 7, and r2, are different from those of the dimer, TV and r4.
(iii) the four lifetimes do not depend on the protein concentration provided that all the
168 F. Chauuin et al. / Biophys. Chem. 44 (1992) 163-173
1.4 a
0
0.8 1 0.6
(b
I
0.0 L 0.4
DIMER FRACTION
Fig. 3. Intensity decay of phospho-Enzyme I as the M/D content is varied. Data were collected on phospho-Enzyme 1 at 6°C for concentrations of protein ranging from 20 pg/ml (dimer content: 50%) to 1 mg/ml (dimer content: 90%). Panel a: The data were analyzed in terms of a sum of two exponentials. The x2 of the analysis is presented here. x2 decreases monotonously as the dimcr content increases. Panel b: The same data as in panel a were analyzed according to a sum of three exponentials. The contribution of the short lifetime component to the overall decay (pre-exponential co- efficient) is presented here. It is these results that allowed us
to make the assumptions we utilized in our global analysis.
rest of the experimental conditions, such as temperature, pH, etc. are kept constant.
The straightforward determination of the four lifetime values would require that decay data be obtained with pure monomer and pure dimer. Unfortunately, the monomer fraction approaches 100% only at a concentration far below the level at which the fluorescence decay measurements are still possible.
In situations when both monomer and dimer species are present, the S-excitation intensity de- cay will be four-exponential:
where the indexes i and j are used to enumerate the lifetimes and the decay curves obtained at different concentrations respectively.
A global analysis approach was utilized to re- solve four, possibly close, lifetime values. The Iifetime values were linked between different de- cay curves j=l, 2,..., N. The pre-exponential factors ‘yij were allowed to vary, but in a re- stricted way. The values of (Y;; were caIculated from the following equations:
cy = s.. C?“” 21 J J ‘A2
cyJj = sj - 2cpim ‘A, (2)
(y4j = Si. 2Cpim . A,
where A, and A, are the pre-exponential factors that pure monomer decay would have at a unit monomer concentration, a unit instrument sensi- tivity and a unit acquisition time; A, and A, are those that pure dimer would have in the same conditions at a concentration equal to one half of the unit; Si is a scale factor, i.e. the product of the instrument sensitivity and the acquisition time; while the concentrations Cjm’” and Cd’“’ were
J
obtained from the known values of total concen- tration Cj = C,?“” t 2CJgim and from the value of the equilibrium constant K,, = C,~m/(CJF’o”)2:
c;im = ;cj + 1-/m
8K (3) w
In the fitting procedure the equilibrium con- stant K,,, the four factors Ai, and four lifetimes 7i played the roles of global fitting parameters. The scale factors, Si, photomultiplier mean back- ground counts, Bj, and time shifts caused by miscellaneous instabilities and color effect, Q,, played roles of 3N local parameters. The prob- lem has one too many degrees of freedom: if all A, are multiplied by some factor and all Sj are divided by the same factor, the model predictions do not change at all. To remove this degree of freedom, the value of A, was fixed equal to one.
F. Chauoin et al. /Biophys. Chem. 44 (1992) 163-173 169
The remaining 3N t 8 parameters were allowed to run free.
Physically the fitting program consisted of three separate modules: (i) optimization module, (ii) parameter conversion module, and (iii> convolu- tion module. In the optimization module, the nature of the 3N + 8 model parameters did not matter. These parameters will be referred to as primary parameters. This module simply passed the current values of the primary parameters to the conversion module at each iteration step. The conversion module converted from the primary parameters K_, Ai, TV, Sj, Bj, Qj, to the 6N t 4 secondary parameters (Yij, TV, Bj, ej, according to eqs. [2] and [3]. Then for each j = 1, 2,. , . , N it called the convolution module and passed it the values of the secondary parameters associated with the given j. The convolution module convo- luted the sum of exponents from eq. (1) with the excitation profile, experimentally obtained indi- vidually for each decay curve number j. The background Bj was added, the result was shifted by Qj on the time scale to yield the model function. The derivatives of the function with respect to each secondary parameter were calcu- lated and returned to the conversion module together with the function. The conversion mod- ule converted from the derivatives with respect to the secondary parameters to those with respect to the primary parameters and returned them to the optimization module together with the model function.
The optimization module was based on the method of maximum likelihood, which has an advantage over the method of least squares whenever the background noise preceding the rising edge of the decay curve is small. The modu- lar structure of the software facilitated switching between one model and another because only the conversion module had to be modified. This structure also tolerates multilevel conversion or no conversion at all. The latter was used for single-curve analysis.
A global analysis of N = 16 decay curves, cor- responding to 8 different protein concentrations (two curves per concentration value) was done. The global x2 value with the 2 + 2 lifetime model was 1.12. Switching to 2 + 3 lifetimes did not
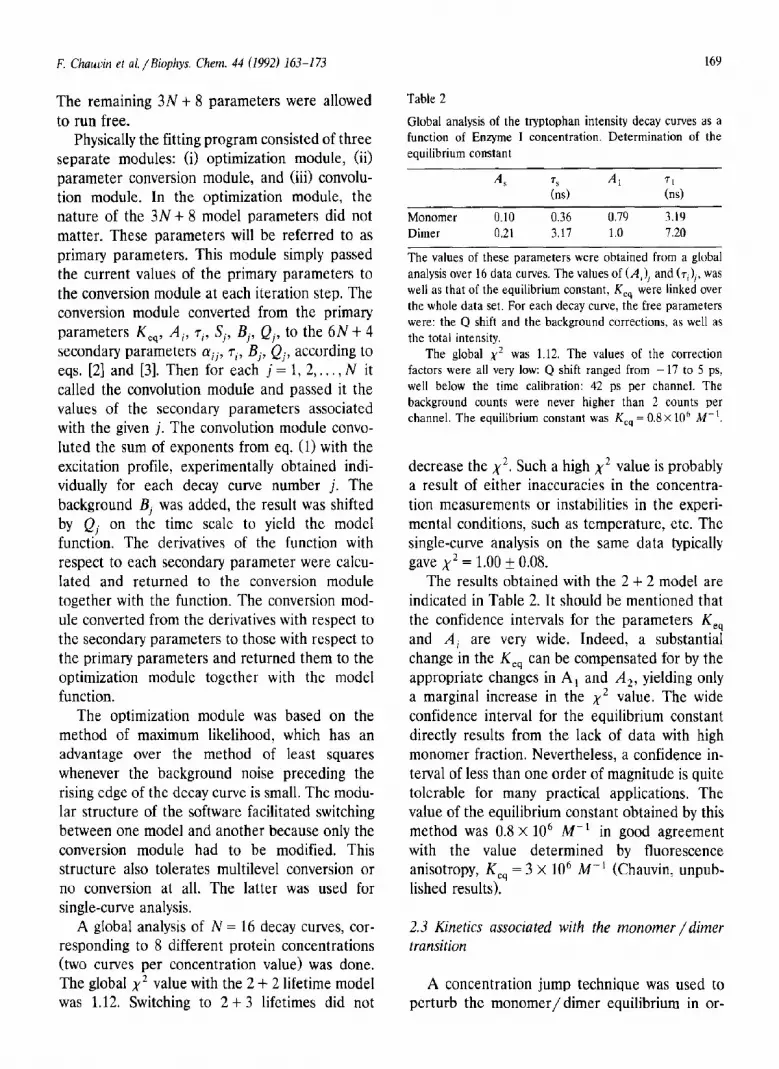
Table 2
Global analysis of the tryptophan intensity decay curves as a function of Enzyme I concentration. Determination of the equilibrium constant
AS 7s AI 71 (ns) (ns)
Monomer 0.10 0.36 0.79 3.19 Dimer 0.21 3.17 1.0 7.20
The values of these parameters were obtained from a global analysis over 16 data curves. The values of (A,), and (T,),, was well as that of the equilibrium constant, K,, were linked over the whole data set. For each decay curve, the free parameters were: the Q shift and the background corrections, as well as the total intensity.
The global x2 was 1.12. The values of the correction factors were all very low: Q shift ranged from - 17 to 5 ps, well below the time calibration: 42 ps per channel. The
background counts were never higher than 2 counts per channel. The equilibrium constant was Kcq = 0.8X 10h M-‘.
decrease the xza Such a high x2 value is probably a result of either inaccuracies in the concentra- tion measurements or instabilities in the experi- mental conditions, such as temperature, etc. The single-curve analysis on the same data typically gave x2 = 1.00 * 0.08.
The results obtained with the 2 + 2 model are indicated in Table 2. It should be mentioned that the confidence intervals for the parameters K,, and Ai are very wide. Indeed, a substantial change in the K,, can be compensated for by the appropriate changes in A, and A,, yielding only a marginal increase in the x2 value. The wide confidence interval for the equilibrium constant directly results from the lack of data with high monomer fraction. Nevertheless, a confidence in- terval of less than one order of magnitude is quite tolerable for many practical applications. The value of the equilibrium constant obtained by this method was 0.8 X lo6 M-’ in good agreement with the value determined by fluorescence anisotropy, K,, = 3 X IO6 M-’ (Chauvin, unpub- lished results).
2.3 Kinetics associated with the monomer /dimer transition
A concentration jump technique was used to perturb the monomer/dimer equilibrium in or-
170 F. Chauvin et al. / Biophys. Chem. 44 (I 992) 163-173
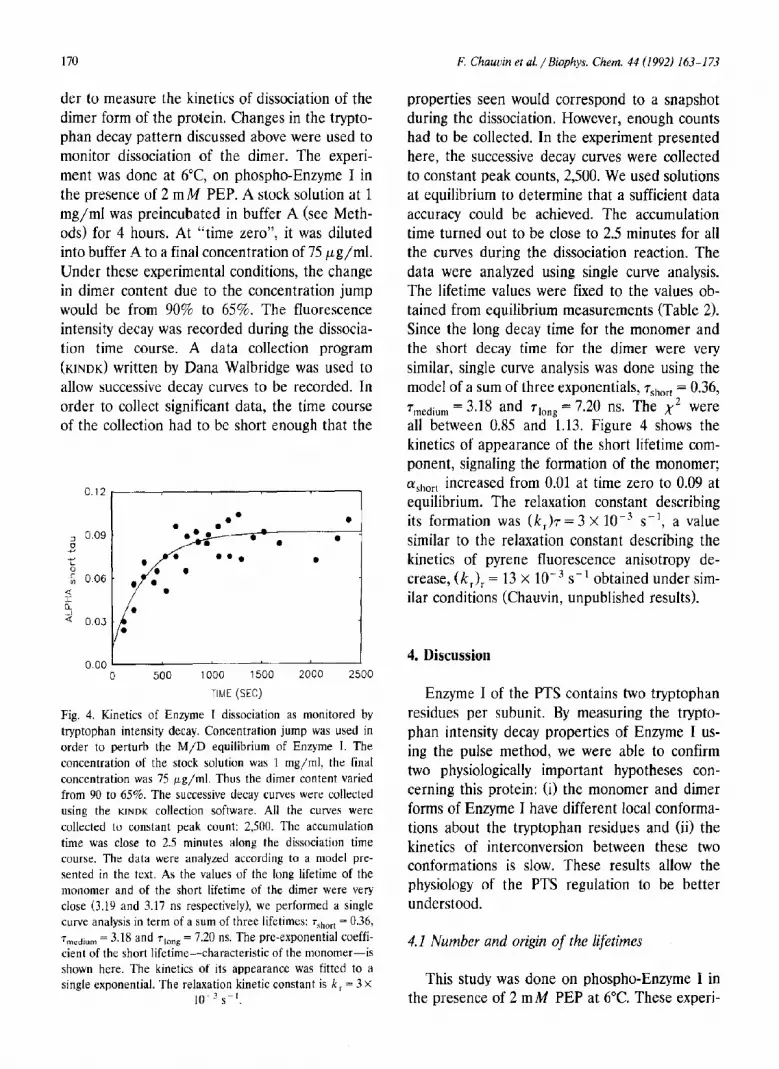
der to measure the kinetics of dissociation of the dimer form of the protein. Changes in the trypto- phan decay pattern discussed above were used to monitor dissociation of the dimer. The experi- ment was done at 6”C, on phospho-Enzyme I in the presence of 2 mM PEP. A stock solution at 1 mg/ml was preincubated in buffer A (see Meth- ods) for 4 hours. At “time zero”, it was diluted into buffer A to a final concentration of 75 pg/ml. Under these experimental conditions, the change in dimer content due to the concentration jump would be from 90% to 65%. The fluorescence intensity decay was recorded during the dissocia- tion time course. A data collection program (KINDK) written by Dana Walbridge was used to allow successive decay curves to be recorded. In order to collect significant data, the time course of the collection had to be short enough that the
O.‘* 3
0.00 1 I
0 500 1000 1500 2000 2500
TIME (SEC)
Fig. 4. Kinetics of Enzyme I dissociation as monitored by tryptophan intensity decay. Concentration jump was used in order to perturb the M/D equilibrium of Enzyme I. The concentration of the stock solution was 1 mg/ml, the final concentration was 75 pg/ml. Thus the dimer content varied from 90 to 65%. The successive decay curves were collected using the KINDK collection software. All the curves were collected to constant peak count: 2,500. The accumulation time was close to 2.5 minutes along the dissociation time course. The data were analyzed accol-ding to a model pre- sented in the text. As the values of the long lifetime of the monomer and of the short lifetime of the dimer were very close (3.19 and 3.17 ns respectively), we performed a single curve analysis in term of a sum of three lifetimes: 7short = 0.36, 7T,,,dium = 3.18 and along = 7.20 ns. The pre-exponential coeffi- cient of the short lifetime-characteristic of the monomer-is shown here. The kinetics of its appearance was fitted to a single exponential. The relaxation kinetic constant is k, = 3 X
properties seen wouId correspond to a snapshot during the dissociation. However, enough counts had to be collected. In the experiment presented here, the successive decay curves were collected to constant peak counts, 2,500. We used solutions at equilibrium to determine that a sufficient data accuracy could be achieved. The accumulation time turned out to be close to 2.5 minutes for all the curves during the dissociation reaction. The data were analyzed using single curve analysis. The lifetime values were fixed to the values ob- tained from equilibrium measurements (Table 2). Since the long decay time for the monomer and the short decay time for the dimer were very similar, single curve analysis was done using the model of a sum of three exponentials, ‘T,,,“~~ = 0.36, 7 medium = 3*18 and 710nc! = 7.20 ns. The x2 were all between 0.85 and 1.13. Figure 4 shows the kinetics of appearance of the short lifetime com- ponent, signaling the formation of the monomer; Ly short increased from 0.01 at time zero to 0.09 at equilibrium. The relaxation constant describing its formation was (k,)7= 3 X 10e3 s-l, a value similar to the relaxation constant describing the kinetics of pyrene fluorescence anisotropy de- crease, (k,), = 13 x 10-j s-l obtained under sim- ilar conditions (Chauvin, unpublished results).
4. Discussion
Enzyme I of the PTS contains two tryptophan residues per subunit. By measuring the trypto- phan intensity decay properties of Enzyme I us- ing the pulse method, we were able to confirm two physiologically important hypotheses con- cerning this protein: (i) the monomer and dimer forms of Enzyme I have different local conforma- tions about the tryptophan residues and (ii) the kinetics of interconversion between these two conformations is slow. These results allow the physiology of the PTS regulation to be better understood.
4.1 Number and origin of the lifetimes
This study was done on phospho-Enzyme I in the presence of 2 mM PEP at 6°C. These experi-
F. Chauain et al. / Biophys. Chem. 44 (1992) 163-l 73 171
mental conditions were also used for studies of the monomer/dimer transition by other tech- niques: elution gel chromatography (Kukuru- zinska et al. [61) and fluorescence anisotropy with a pyrene conjugate (Chauvin, unpublished re- sults). The conditions were chosen because they allowed both a high dimer fraction and a reason- ably high monomer fraction to be reached. When present at 1 mg/ml at 6°C 90% of the Enzyme I population was in the dimer form. A higher con- centration was not used so that inner filter effects and other problems associated with a high ab- sorbance could be avoided. The lowest concentra- tion of Enzyme I that would allow the collection of accurate data was 20 pg/ml. The monomer fraction was 50% under these conditions,
The data presented in Fig. 1 indicate that the dimer of Enzyme I exhibits two lifetimes. For a monomer/dimer mixture, at least one additional lifetime was required in order to describe the intensity decay (Fig. 2). This change in the trypto- phan decay pattern first suggested that the tryp- tophan environment was different in the monomer and dimer forms of the protein. It was not possi- ble, at any one temperature, to obtain solutions containing 100% dimer and 100% monomer. It was also shown that the decay times were temper- ature dependent and thus it was not reasonable to compare the decay patterns of monomer ob- tained at one temperature with those of the dimer obtained at another temperature. Based on the results of single curve analysis of decay data obtained at differing concentrations, it was possi- ble to formulate a reasonable global analysis pro- cedure based on a biexponential model for both the dimer and monomer decay. Note that the analysis presented on Fig. 1 is not in contradic- tion with this model, even though the intensity decay of a 10% monomer solution was satisfacto- rily analyzed in terms of a biexponential. Indeed, as A,, the pre-exponential factor for the decay of pure monomer at unit concentration is small (0.11, cyi is expected to be very small in these condi- tions, causing the third component of the decay to be undetectable.
The value of the lifetimes for the monomer and dimer species obtained by single curve- or global analysis can be compared. For solutions of
predominately dimer, rshorl = 3.1 and T,~,,~ = 7.2 ns from single curve analysis, ~~ = 3.2 ns and r4 = 7.2 from global analysis, Similar values can be extracted from the monomer/dimer mixture, 3.3 and 7.2 ns. For the monomer, the extra life- time in Fig. 2 is 7,hort = 0.54 ns. The global analy- sis indicates that the monomer species would exhibit two lifetimes: r, = 0.36 and TV = 3.2 ns. This fits with the decay presented in Fig. 2, 7 medium = 3.3 ns corresponds to T? = 3.19 ns and r3 = 3.17 ns, the long lifetime of the monomer and the short lifetime of the dimer, respectively.
For the dimer, the ratio of the pre-exponential coefficients was 0.23 from single curve analysis, a value similar to that obtained by global analysis
(a /Gng short = 0.21). For the monomer, it was 0.13 from global analysis.
The results presented here are in agreement with the properties of the fluorescence of En- zyme I published by Neyroz et al. [12]. They used high enzyme concentrations and magnesium was present in the buffers. We now know that these conditions favor dimer formation. Neyroz et al. [12] reported two lifetimes close to 3 and 7.5 ns for a mixture of phospho- and dephospho-En- zyme I at 6°C. under these conditions. Han et al. [19] studied Enzyme I at lower concentration (0.1 mg/ml), in the absence of magnesium. A signifi- cant amount of monomer is expected under these conditions. Han et al. [19] observed three life- times, whose values were: 0.7, 3.8 and 7.1 ns. The notion that both the dimer and monomer forms of the enzyme exhibit biexponential tryptophan decay is thus reasonable based on single curve analysis of data obtained under different condi- tions and confirmed by global analysis of a data set obtained as a function of protein concentra- tion.
What is the origin of the biexponential decay of both the monomer and dimer forms of the protein? Each monomer of the enzyme contains two tryptophan residues. It is tempting to assign one decay to one tryptophan residue. This idea while not proven is supported by the data avail- able. Neyroz et al. [12] showed that each decay time is associated with a unique emission spec- trum. This supports the idea that the microenvi- ronment of the two tryptophan residues are dif-

172 F. Chouuin et al. /Biophys. Chem. 44 (1992) 163-I 73
ferent. Han et al. [19] working with a specific pyrene conjugate of Enzyme I, reported a differ- ent efficiency of energy transfer for the two tryp- tophan residues. This suggests that the tinique lifetimes originate from tryptophan residues that are located at different distances from the pyrene probe.
This study indicates some of the problems encountered in the analysis of fluorescence decay data. Whether single curve or global analysis methods are used, it is of key importance to use the correct fitting function. Unfortunately this fitting function may not be known during the early phases of an investigation. In this situation empirical anaIysis in terms of a sum of exponen- tial terms may give excellent fits to the data but yield decay parameters (N’S and T’S) with no physical meaning. This type of analysis may nev- ertheless provide important clues leading to the correct fitting function with subsequent recovery of decay parameters with true physical meaning. For example empirical analysis of the type shown in Fig. 3b indicated that the short decay time was associated with the monomer species and helped lead to the development of the fitting function involving the quadratic equilibrium equation and four rather than three exponential decay curves. Analysis in terms of three exponentials yields a good fit because two of the actual decay times are so close in value that they cannot be resolved by a simple analysis program. Once the correct decay parameters had been determined by the global program based on the equilibrium expressions, these decay times could be fixed in the triple exponential decay analysis shown in Fig. 4 and the change in ashort with time could be used to estimate the relaxation constant for monomer formation.
Studies of the domain structure uf Enzyme I showed that the C-terminal domain can have a flexible structure, whereas the N-terminal domain is tighter in its conformation (LiCalsi et al. [13], Furthermore, these authors hypothesized that this C-terminal domain is involved in dimerization. The two tryptophan probes are located in the C-terminal domain. Thus, our results support the hypothesis that a conformational change associ- ated with the monomer/dimer transition occurs in the C-terminal domain.
Acknowledgements
We Thank Professor Robert DeToma for aid in the design of the pulse fluorometer and Pro- fessor Julien Davis for helpful discussions. Dana Walbridge wrote the program KINDK.
References
1
2
N.D. Meadow, D.K. Fox and S. Roseman, Annu. Rev. Biochem. 59 (1985) 497-542. S. Roseman and N.D. Meadow, J. Biol. Chem. 265 (1990) 2993-2996.
3
4
J. Monod, Ph.D. thesis (Hermann, Paris, 1942). D.K. Fox and S. Roseman. J. Biol. Chem. 261 (1986) 13487-13497.
5
6
I
H.K. Dannelly, H.C. Reeves and S. Roseman, American Society for Microbiology (1991) 238, (Abstracts). M.A. Kukurizinska, M.A., W.F. Harrington and S. Rose- man, J. Biol. Chem. 257 (1982) 14470-14476. N. Weigel, E.B. Waygood, M.A. Kukuruzinska, A. Nakazawa and S. Roseman, I. Biol. Chem. 257 (1982) 14461-14469.
8
4.2 Correlation with Enzyme I function
It has been shown here that the kinetics of dissociation of the dimer into the monomer form of the protein is slow and takes place on the minute time scale. This is in agreement with the kinetics of dissociation measured by changes in time-dependent emission anisotropy of a pyrene conjugate.
9
10
11
12
13
14
15
G. Misset, M. Brouwer and G.T. Robillard, Biochemistry 19 (1980) 883-890. H. Hoving, J.S. Lolkema and G.T. Robillard, Biochemistry 20 (1981) 87-93. H. Hoving, J.H. Koning and G.T. Robillard, Biochemistry 21 (1982) 3128-3136. M.A. Kukuruzinska, B.W. Turner, G.K. Ackers and S. Roseman, J. Biol. Chem. 259 (1984) 11679-11681. P. Neyroz, L. Brand and S. Roseman, J. Biol. Chem. 262 (1987) 15900-15907. C. LiCalsi, T.S. Crocenzi, E. Freire and S. Roseman, J. Biol. Chcm. 266 (1991) 19519-19527.
E.W. Saffen, K.A. Presper, T.L. Doering and S. Roseman, J. Biol. Chem. 262 (1987) 16241-16253. D.A. Beneski, A. Nakazawa, N. Weigel, P.E. Hartman and
S. Roseman, J. Biol. Chem. 257 (1982) 14492-14498.

F. Chauvin et al. / Biophys. Chem. 44 (1992) 163-I 73 173
16 O.H. Lowry, N.J. Rosebrough, A.L. Farr and R.J. Randall, J. Biol. Chem. 193 (1951) 265-275.
17 M.G. Badea and L. Brand, Time-resolved fluorescence measurements, in: Methods in enzymology, eds. C.H.W. Hirs and S.N. Timasheff (Academic Press, New York, NY, 1979) p. 378.
18 J.R. Knutson, J.M. Beechem and L. Brand, Chem. Phys. Lett. 102 (1983) 501-507.
19 M.K. Han, J.R. Knutson, S. Roseman and L. Brand, J. Biol. Chem. 265 (1990) 1996-2003.
20 CF. Bemasconi, Relaxation kinetics (Academic Press, New York, NY, 1976).


![Time-Resolved Fluorescence Anisotropy of Bicyclo[1.1.1]pentane/Tolane-Based Molecular Rods Included in Tris( o -phenylenedioxy)cyclotriphosphazene (TPP)](https://img.dokumen.tips/doc/110x75/634bab57bb899b358c0a75fd/time-resolved-fluorescence-anisotropy-of-bicyclo111pentanetolane-based-molecular.jpg)


