Embed Size (px)
Citation preview
S1
Supporting Information
Time Resolved Electrochemical Quantification of Azanone (HNO)
at Low Nanomolar Level
Sebastián A. Suárez†, Damian E. Bikiel
†, Diana E. Wetzler
‡, Marcelo A. Martí
†‡ and Fabio Doctorovich
†
† Departamento de Química Inorgánica, Analítica y Química Física / INQUIMAE-CONICET, Facultad
de Ciencias Exactas y Naturales, Universidad de Buenos Aires, Ciudad Universitaria, Pab. II, Buenos
Aires, Argentina.
‡ Departamento de Química Biológica, Facultad de Ciencias Exactas y Naturales, Universidad de
Buenos Aires, Ciudad Universitaria, Pab. II, Buenos Aires, Argentina.
S2
MATERIALS AND METHODS
Chemicals. AS and TSHA solutions were freshly prepared for each set of measurements and
kept on ice. The donor concentration was checked before each measurement by UV-vis following its
absorbance. Milli-Q grade water was used in all experiments; nitrogen and argon of high purity were
used for anaerobic experiments.
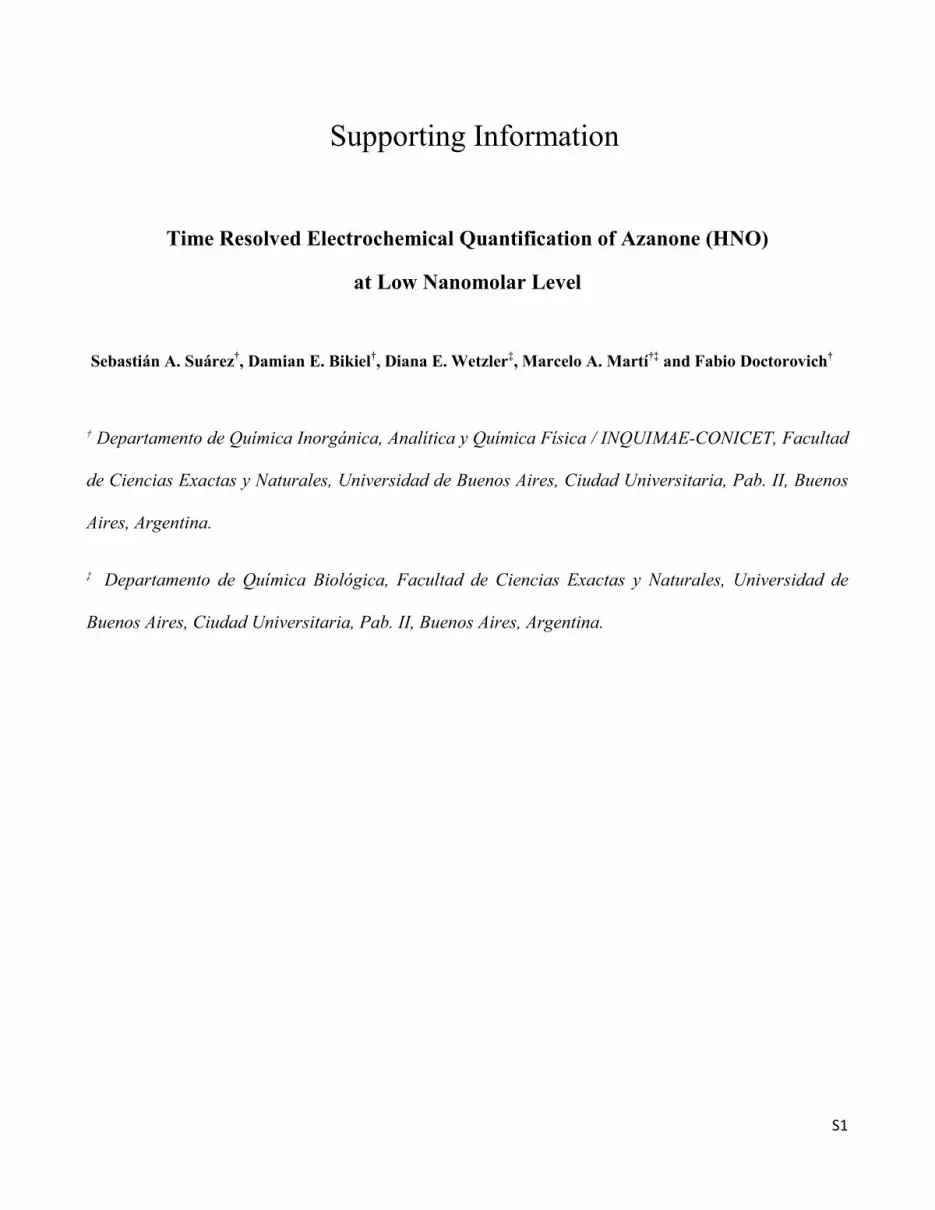
Instruments. Cyclic voltammetries for the cobalt-porphyrin modified electrodes or for the bare
gold electrodes used as controls were performed using the corresponding electrode as the working
electrode. In aqueous solution, a KCl saturated Agº/AgCl electrode was used as the reference electrode
and a platinum wire as the counter electrode (supporting electrolyte was KNO3 0.1 M). UV-Vis spectra
were recorded with a HP 8453 spectrometer in a septum sealed 1 cm path quartz cell.
Reference
WorkCounterAg/AgCl
Pt
Gold electrodemodified with porphyrin
Figure S1 - Three-electrode system used in all measured systems
Preparation of anaerobic media. To perform the described measurements in anaerobic (i.e
oxygen free) media, we firstly distilled a sodium dithionite containing deareated miliQ water under
Argon atmosphere. Deaeration of all solutions was accomplished by passing a stream of high-purity
argon through the solution for 10-20 min. All solutions were later handled in septum sealed flasks
under slight Argon overpressure to avoid oxygen diffusion.
Experiments under air atmosphere. In this case, we used miliQ water equilibrated with
atmosphere oxygen.
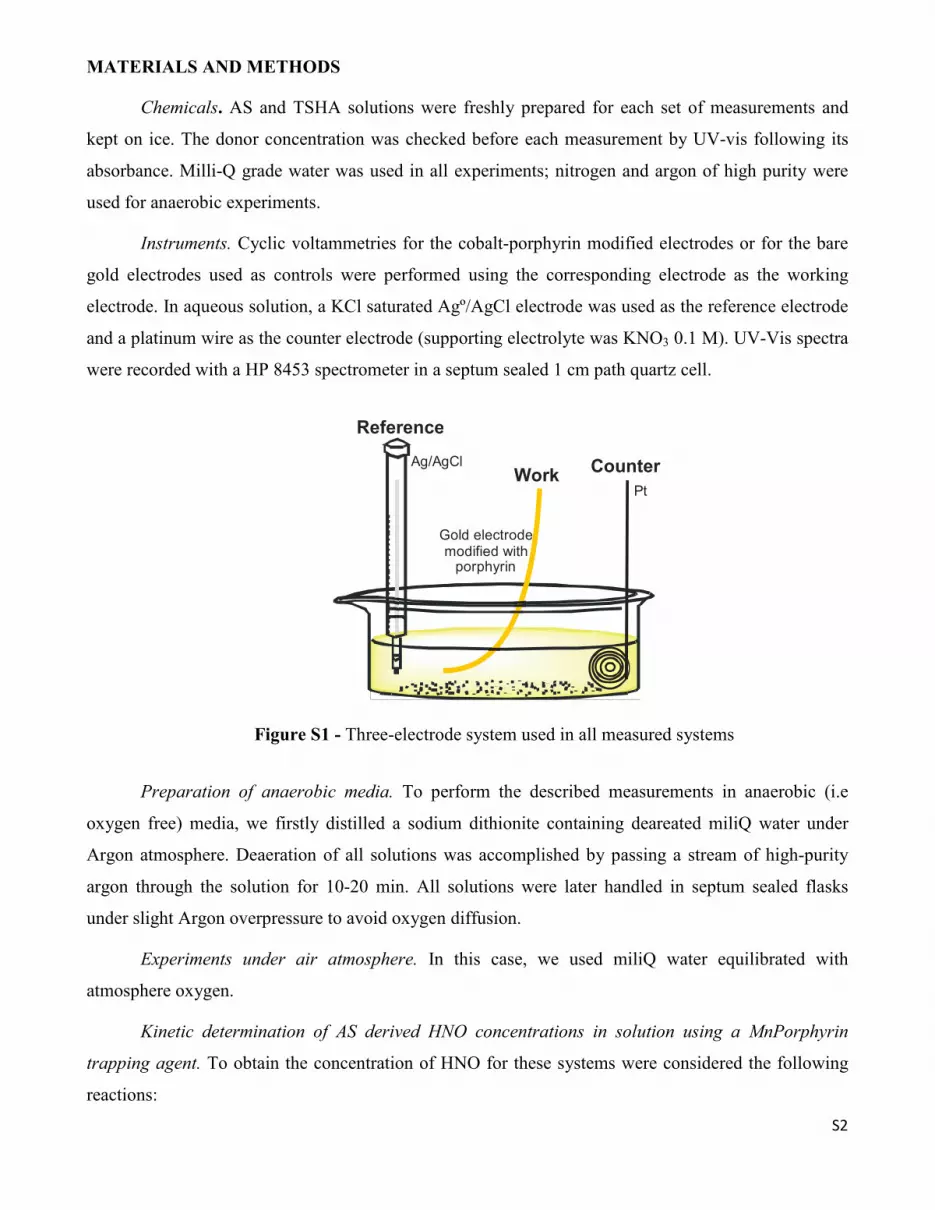
Kinetic determination of AS derived HNO concentrations in solution using a MnPorphyrin
trapping agent. To obtain the concentration of HNO for these systems were considered the following
reactions:
S3
Where the reaction (1) represents the donor decomposition characterized by first order rate constant k1,
(2) the reaction of HNO with the metalloporphyrinate (MnIIITPPS) characterized by rate constant kon,
and (3) represents bimolecular HNO dimerization, characterized by rate constant k2. Reaction (1) was
considered as an irreversible reaction because its inverse rate is negligible with respect to reactions (2)
at the initial rate condition. Reaction (2) is irreversible. Donor decomposition obeys first order kinetics,
described by k1 (k1(AS) = 8 x 10⁻⁴ s-1),1,2,3,4,5 the reaction with the porphyrin is characterized by a kon
(kon(HNO) = 4 x 10⁴ M-1s-1)1 while dimerization is a second order rate reaction depicted by k2 (k2 = 8 x
106 M-1s-1)6,7,8
Therefore, in order to quantify [HNO] by kinetic determinations of the reaction with MnIIITPPS, as
previously described by Schoenfisch and coworkers,9 the nitrosyl porphyrin formation rate must be
measured and then [HNO] can be calculated from eq. 4 (obtained by rearrangement of eq. 2) shown
below:
Kinetic simulations of HNO reactions in the presence Co(P) modified electrode.
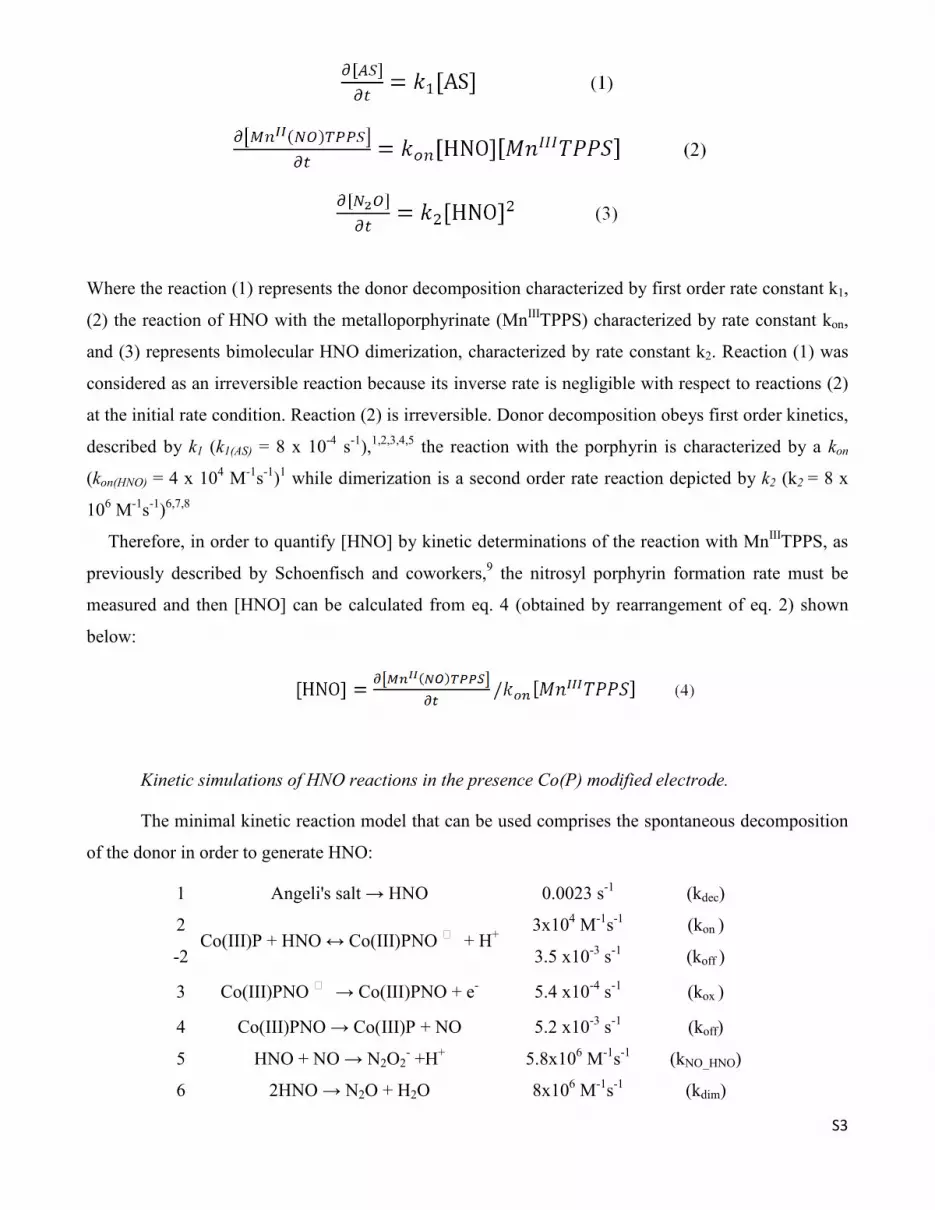
The minimal kinetic reaction model that can be used comprises the spontaneous decomposition
of the donor in order to generate HNO:
1 Angeli's salt → HNO 0.0023 s-1 (kdec)
2 Co(III)P + HNO ↔ Co(III)PNO F + H+
3x10⁴ M-1s-1 (kon )
-2 3.5 x10⁻³ s-1 (koff )
3 Co(III)PNO F → Co(III)PNO + e- 5.4 x10⁻⁴ s-1 (kox )
4 Co(III)PNO → Co(III)P + NO 5.2 x10⁻³ s-1 (koff)
5 HNO + NO → N2O2- +H+ 5.8x10⁶ M-1s-1 (kNO_HNO)
6 2HNO → N2O + H2O 8x10⁶ M-1s-1 (kdim)
S4
For the reactions 1, 2, 5 and 6, the corresponding kinetic rate constants are known. HNO and
NO are released from the Co(P) (back reactions 2 and 4 respectively), these rate constants are not
known for the present cobalt porphyrin, however, they can be reasonably approximated for the same
reactions with other Co porphyrins known in the literature adopting values of ca. 1 x10⁻³ s-1. These
three rate constants (-2, 3 and 4) were allow to ride and obtained by the simulation (Matlab 2009b).
The current observed should be related to the species that suffers the redox process, which
according to our model is [Co(III)PNO]-. Writing down the system of differential equations for the
model and solving it numerically, the profiles for each one of the species involved can be obtained. By
sampling different values of kox (3), we reproduced the current profile as the concentration profile for
[Co(III)PNO]-. The difference between the concentration of [Co(III)PNO]- as a function of time and
I(t) is due to a multiplicative factor (3.1x10⁻³ s-1), including F, the active area of the electrode and the
fact that we employed volumetric concentrations instead of surface concentrations for the electrode
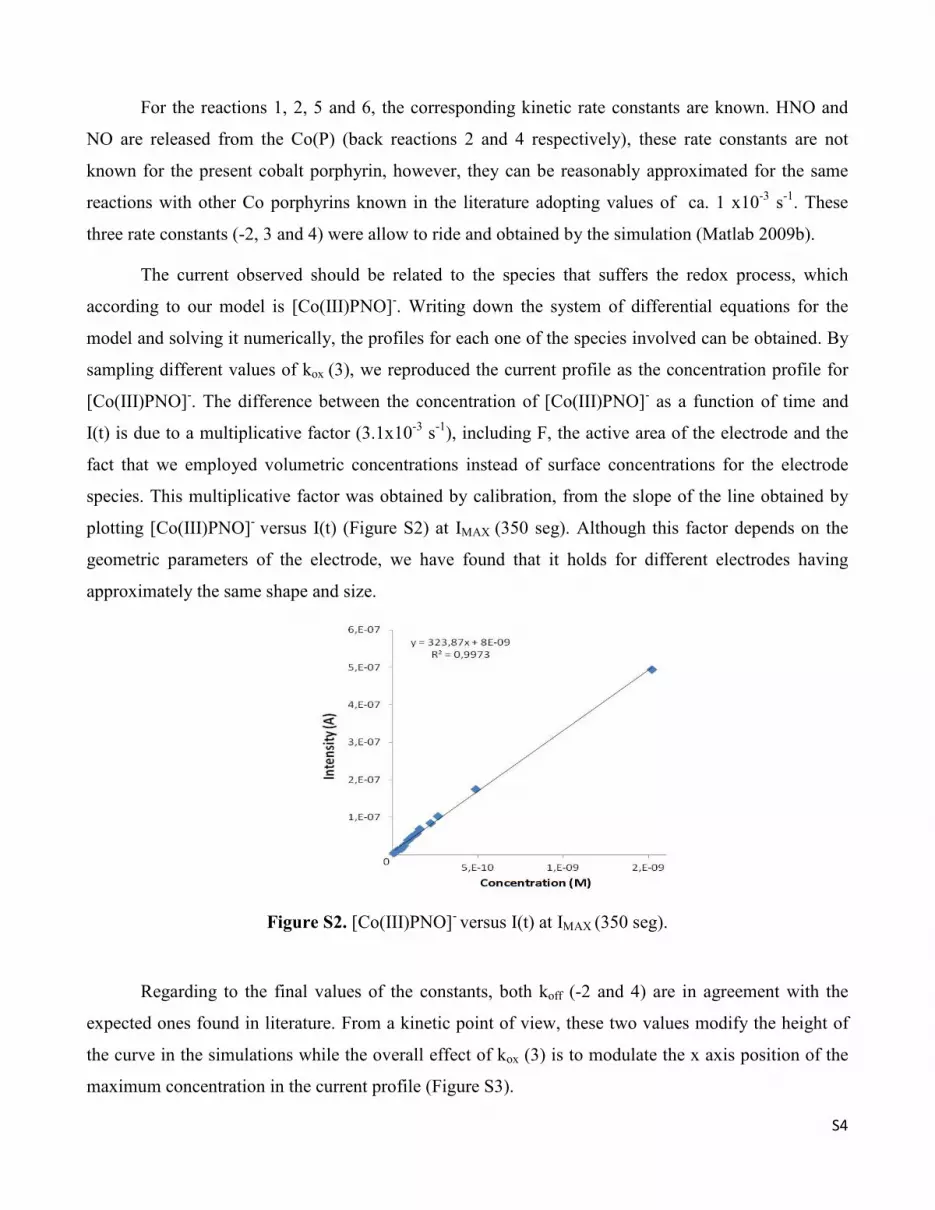
species. This multiplicative factor was obtained by calibration, from the slope of the line obtained by
plotting [Co(III)PNO]- versus I(t) (Figure S2) at IMAX (350 seg). Although this factor depends on the
geometric parameters of the electrode, we have found that it holds for different electrodes having
approximately the same shape and size.
Figure S2. [Co(III)PNO]- versus I(t) at IMAX (350 seg).
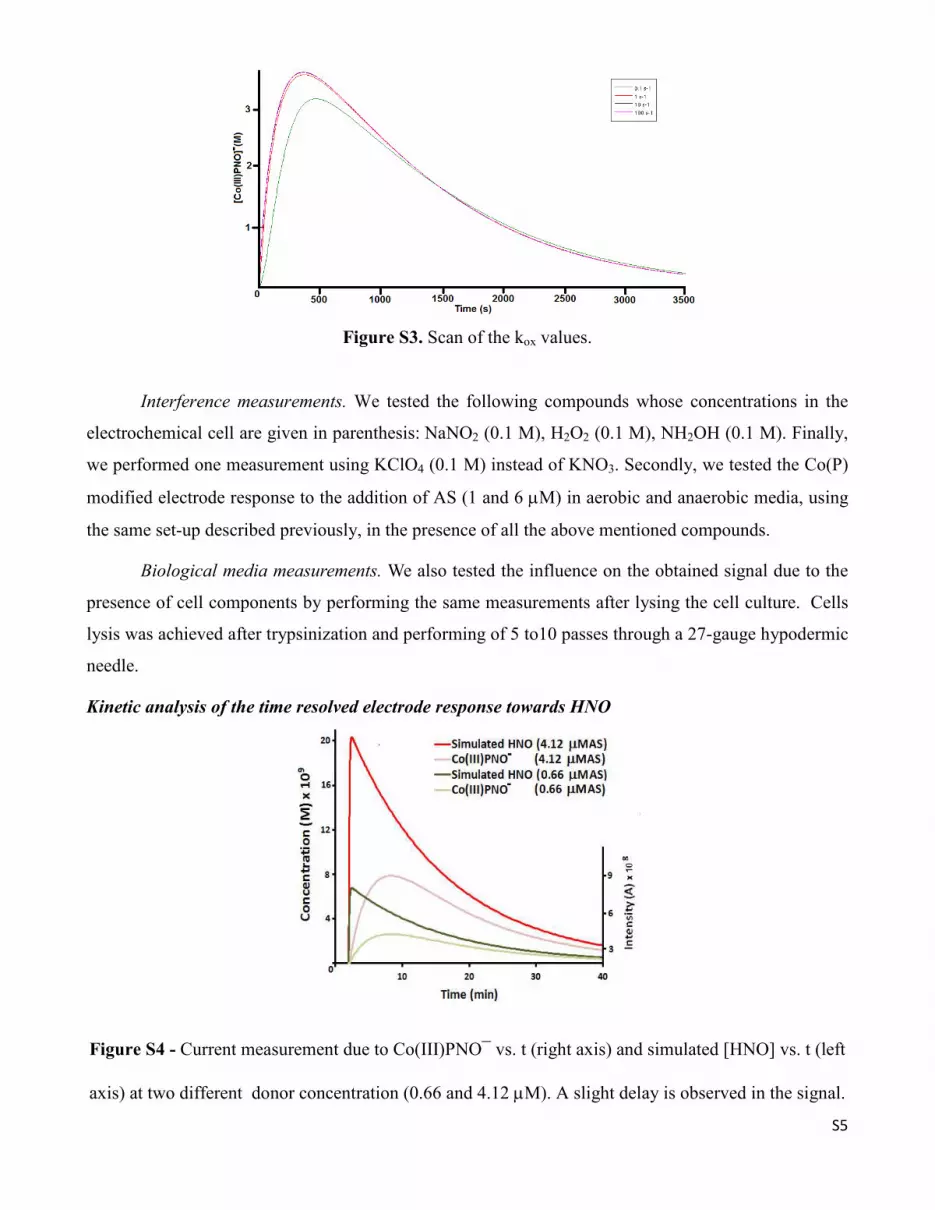
Regarding to the final values of the constants, both koff (-2 and 4) are in agreement with the
expected ones found in literature. From a kinetic point of view, these two values modify the height of
the curve in the simulations while the overall effect of kox (3) is to modulate the x axis position of the
maximum concentration in the current profile (Figure S3).
S5
Figure S3. Scan of the kox values.
Interference measurements. We tested the following compounds whose concentrations in the
electrochemical cell are given in parenthesis: NaNO2 (0.1 M), H2O2 (0.1 M), NH2OH (0.1 M). Finally,
we performed one measurement using KClO4 (0.1 M) instead of KNO3. Secondly, we tested the Co(P)
modified electrode response to the addition of AS (1 and 6 µM) in aerobic and anaerobic media, using
the same set-up described previously, in the presence of all the above mentioned compounds.
Biological media measurements. We also tested the influence on the obtained signal due to the
presence of cell components by performing the same measurements after lysing the cell culture. Cells
lysis was achieved after trypsinization and performing of 5 to10 passes through a 27-gauge hypodermic
needle.
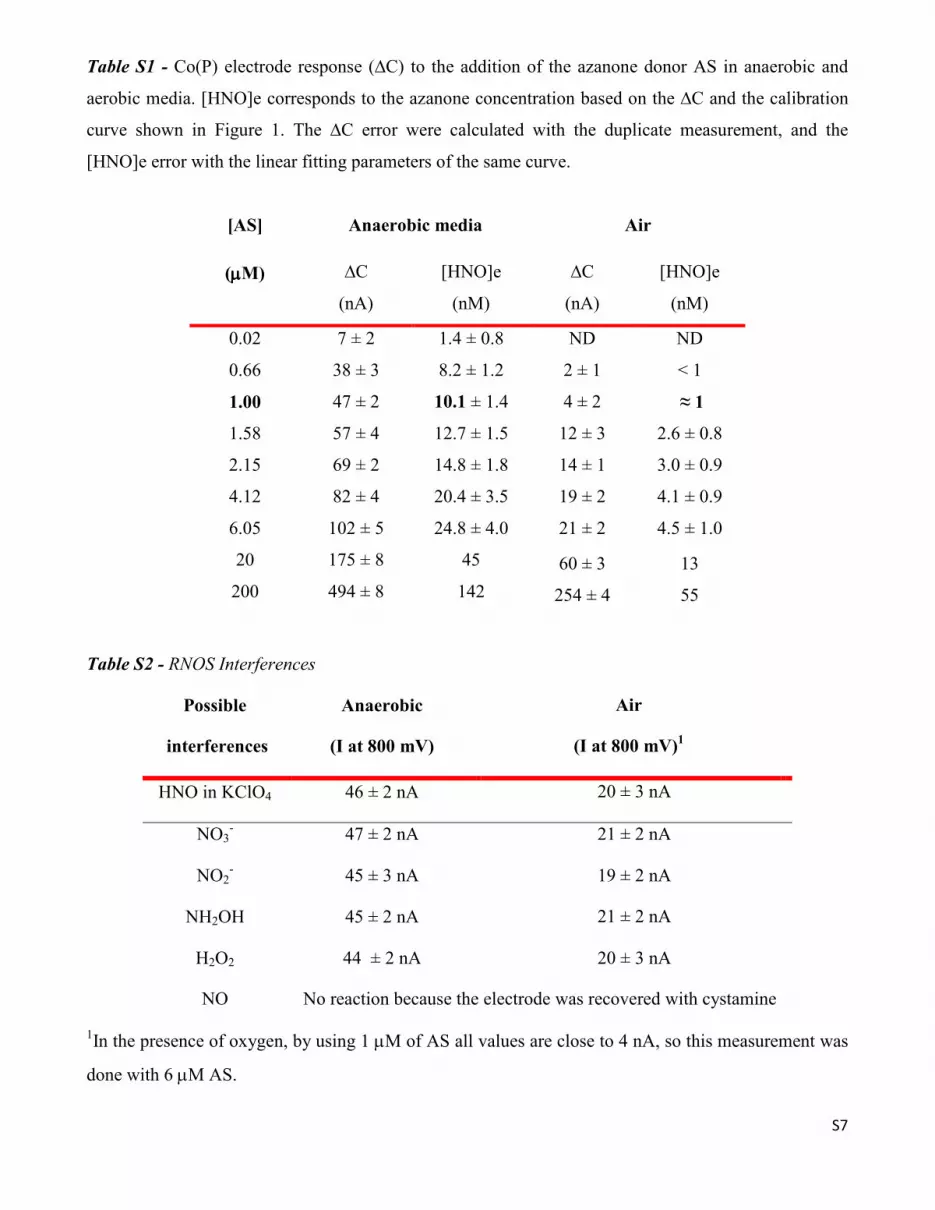
Kinetic analysis of the time resolved electrode response towards HNO
Figure S4 - Current measurement due to Co(III)PNO‾ vs. t (right axis) and simulated [HNO] vs. t (left
axis) at two different donor concentration (0.66 and 4.12 µM). A slight delay is observed in the signal.

S6
TSHA decomposition rate
Figure S5 - Measured the electrode response to a solution of 3.4 µM TSHA (black) and simulated (red)
Reaction of MnIII
TPPS with AS
Figure S6 - Spectral changes observed for the reaction of 2 µM [MnIIITPPS]3- (black line) with 2 µM
AS to yield [MnII(P)NO] 2- (grey line).
S7
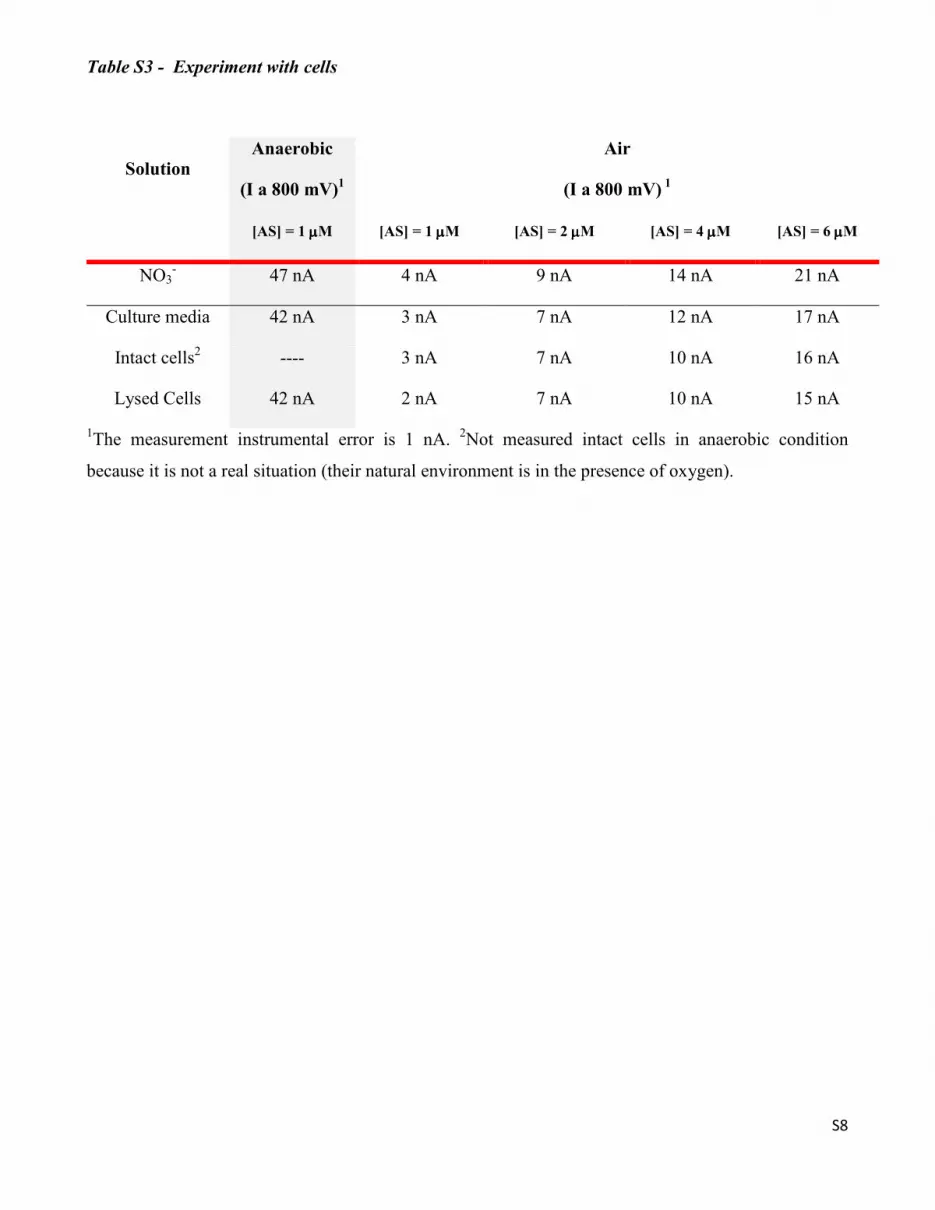
Table S1 - Co(P) electrode response (∆C) to the addition of the azanone donor AS in anaerobic and
aerobic media. [HNO]e corresponds to the azanone concentration based on the ∆C and the calibration
curve shown in Figure 1. The ∆C error were calculated with the duplicate measurement, and the
[HNO]e error with the linear fitting parameters of the same curve.
[AS] Anaerobic media Air
(µµµµM) ∆C
(nA)
[HNO]e
(nM)
∆C
(nA)
[HNO]e
(nM)
0.02 7 ± 2 1.4 ± 0.8 ND ND
0.66 38 ± 3 8.2 ± 1.2 2 ± 1 < 1
1.00 47 ± 2 10.1 ± 1.4 4 ± 2 ≈ 1
1.58 57 ± 4 12.7 ± 1.5 12 ± 3 2.6 ± 0.8
2.15 69 ± 2 14.8 ± 1.8 14 ± 1 3.0 ± 0.9
4.12 82 ± 4 20.4 ± 3.5 19 ± 2 4.1 ± 0.9
6.05 102 ± 5 24.8 ± 4.0 21 ± 2 4.5 ± 1.0
20 175 ± 8 45 60 ± 3 13
200 494 ± 8 142 254 ± 4 55
Table S2 - RNOS Interferences
Possible
interferences
Anaerobic
(I at 800 mV)
Air
(I at 800 mV)1
HNO in KClO4 46 ± 2 nA 20 ± 3 nA
NO3- 47 ± 2 nA 21 ± 2 nA
NO2- 45 ± 3 nA 19 ± 2 nA
NH2OH 45 ± 2 nA 21 ± 2 nA
H2O2 44 ± 2 nA 20 ± 3 nA
NO No reaction because the electrode was recovered with cystamine
1In the presence of oxygen, by using 1 µM of AS all values are close to 4 nA, so this measurement was
done with 6 µM AS.
S8
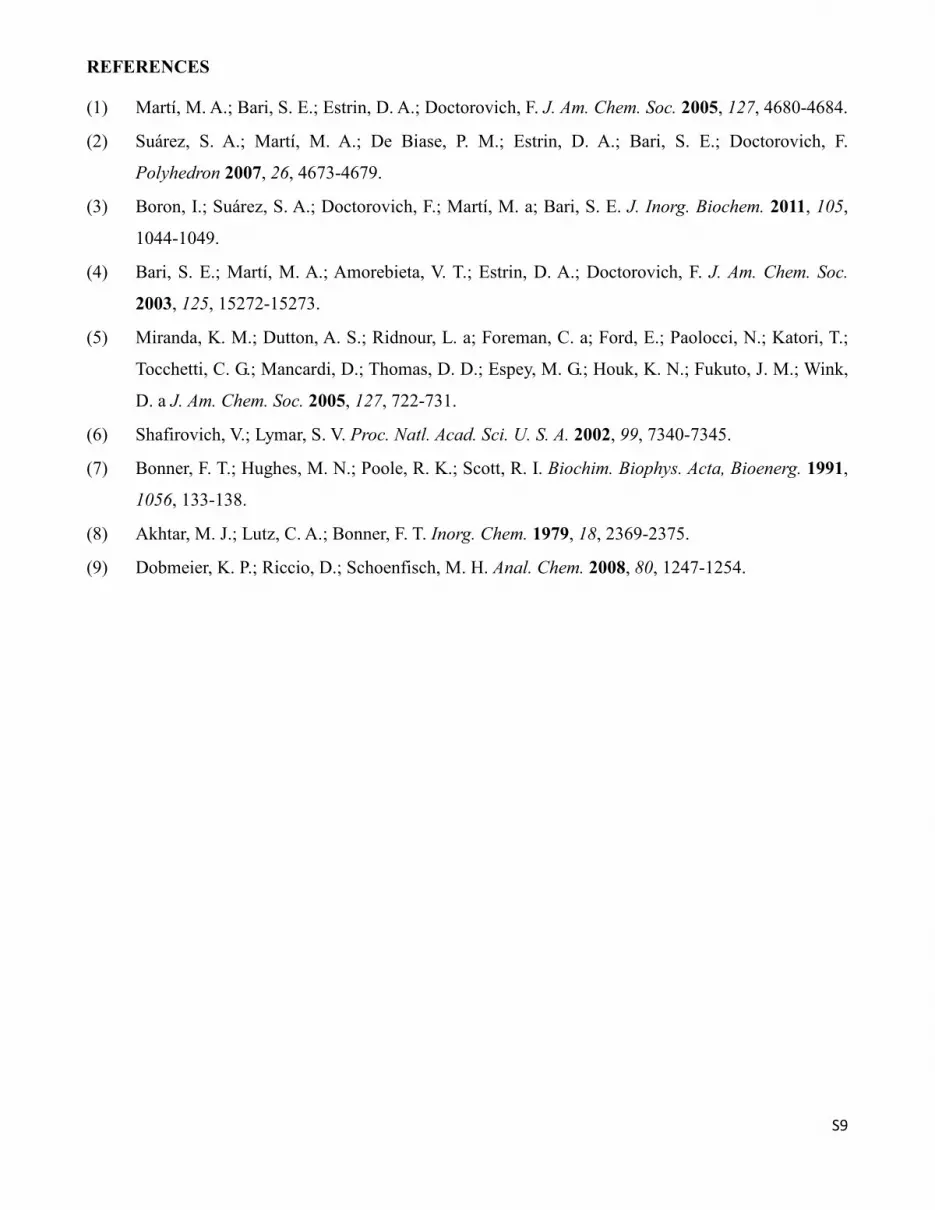
Table S3 - Experiment with cells
Solution Anaerobic
(I a 800 mV)1
Air
(I a 800 mV) 1
[AS] = 1 µµµµM [AS] = 1 µµµµM [AS] = 2 µµµµM [AS] = 4 µµµµM [AS] = 6 µµµµM
NO3- 47 nA 4 nA 9 nA 14 nA 21 nA
Culture media 42 nA 3 nA 7 nA 12 nA 17 nA
Intact cells2 ---- 3 nA 7 nA 10 nA 16 nA
Lysed Cells 42 nA 2 nA 7 nA 10 nA 15 nA
1The measurement instrumental error is 1 nA. 2Not measured intact cells in anaerobic condition
because it is not a real situation (their natural environment is in the presence of oxygen).
S9
REFERENCES
(1) Martí, M. A.; Bari, S. E.; Estrin, D. A.; Doctorovich, F. J. Am. Chem. Soc. 2005, 127, 4680-4684.
(2) Suárez, S. A.; Martí, M. A.; De Biase, P. M.; Estrin, D. A.; Bari, S. E.; Doctorovich, F.
Polyhedron 2007, 26, 4673-4679.
(3) Boron, I.; Suárez, S. A.; Doctorovich, F.; Martí, M. a; Bari, S. E. J. Inorg. Biochem. 2011, 105,
1044-1049.
(4) Bari, S. E.; Martí, M. A.; Amorebieta, V. T.; Estrin, D. A.; Doctorovich, F. J. Am. Chem. Soc.
2003, 125, 15272-15273.
(5) Miranda, K. M.; Dutton, A. S.; Ridnour, L. a; Foreman, C. a; Ford, E.; Paolocci, N.; Katori, T.;
Tocchetti, C. G.; Mancardi, D.; Thomas, D. D.; Espey, M. G.; Houk, K. N.; Fukuto, J. M.; Wink,
D. a J. Am. Chem. Soc. 2005, 127, 722-731.
(6) Shafirovich, V.; Lymar, S. V. Proc. Natl. Acad. Sci. U. S. A. 2002, 99, 7340-7345.
(7) Bonner, F. T.; Hughes, M. N.; Poole, R. K.; Scott, R. I. Biochim. Biophys. Acta, Bioenerg. 1991,
1056, 133-138.
(8) Akhtar, M. J.; Lutz, C. A.; Bonner, F. T. Inorg. Chem. 1979, 18, 2369-2375.
(9) Dobmeier, K. P.; Riccio, D.; Schoenfisch, M. H. Anal. Chem. 2008, 80, 1247-1254.


