Embed Size (px)
Citation preview

E L S E V I E R Journal of Photochemistry and Photobiology B: Biology 31 ( 1995 ) 101-112
Joernalet J J
AND
B ~ I ~ O I . D O Y
Steady state and time-resolved fluorescence properties of metastatic and non-metastatic malignant cells from different species
Asima Pradhan ..1 Prabir Pal ", Gilles Durocher "* Luc Villeneuve b,. Antonia Balassy b F6ridoun Babai b, Louis Gaboury b,., Louise Blanchard t,
• Laboratoire de Photophysique Moldculaire, Ddpartement de Chimie, Universiti de Montrdal, C.P. 6128, Succ. Centre-ville, Montrial, Que. H3C 3.I7, Canada
b Ddpartement de Pathologic, Universitd de Montrgal, C.P. 6128, Succ. Centre-ville, Montreal, Que. H3C 3J7, Canada
Received 7 November 1994; accepted 19 May 1995
Abstract
Steady state and time-resolved fluorescence spectroscopy were employed to study the fluorescence from non-metastatic, metastatic and non-tumorigenic cell lines from different species. Excitations at 310 nm and 350 nm were used to monitor tryptophan and reduced nicotinamide adenine dinucleotide (NADH) fluorescence respectively. Subtle and consistent differences were observed between different categories of cell lines. It was found that the tryptophan to NADH fluorescence intensity ratio is higher in metastatic cell lines than in non-metastatic and normal cell lines. The fluorescence decay of the tryptophan residue in different cell lines was best described by triple exponential kinetics, whereas lhe NADH fluorescence decay was best described by mainly double and, in some cases, triple exponential kinetics. The average fluorescence lifetimes for tryptophan were in the range 2.5-3.7 ns. The average lifetime of NADH was lower (by a factor of approximately three) in metastatic cells than in non-metastatic ceils and this finding is consistent for cell lines from different origins (rat or human). Correcting the Iluorescence intensity for the average fluorescence lifetime of each species and for the volume of each cell line, it was shown that the ~'oncentrations of tryptophan and NADH are consistently higher in malignant metastatic cancer cells than in non-metastatic cells.
,(eywords: Steady state fluorescence; Time-resolved fluorescence; Metastatic and non-metastatic malignant cells; Tryptophan; NADH
l . Introduction
Fluorescence spectroscopy has been widely used to char- acterize the structure and environment of fluorescing and non- fluorescing biological molecules. Intrinsic fluorescence, in i~articular, has the advantage over extrinsic fluorescence of an unperturbed environment during investigation, especially :n complex systems such as biological cells and tissues. Bio- ogical tissues and cells are heterogeneous systems with sev- ,:ral molecules in different environments depending on the ;tate of the tissues and cells, and cellular fluorescence pro- ¢ides a sensitive index of the functional state of a living cell
i l l . Over the past few years, steady state fluorescence spec-
:roscopy has been used by Alfano and coworkers [2--6], Deckelbaum et al. [7], Feld and coworkers [8] and Anders- ~on et al. [9] as a diagnostic tool and a probe to determine
* Corresponding authors. ' Present address: Department of Physics, liT Kanpur, Kanpur 208016,
[ndia.
1011-13zl.4/95/$09.50 © 1995 Elsevier Science S.A. All rights reserved ~SDI 101 1 - 1 3 4 4 ( 9 5 ) 0 7 1 7 8 - 4
the molecular constituents and their environments in diseased and healthy cells and tissues. Recently, Glassman and coworkers [10,11] reported the steady state and time- resolved fluorescence properties of non-malignant and malig- nant tissues of the gynaecological tract. Distinct differences in the fluorescence properties of malignant tissue and non- malignant tissue were observed. Differences in intrinsic flu- orescence have been observed between malignant and normal tissues and cells and have been ascribed to various molecules. Tryptophan, tyrosine, nicotinamide adenine dinucleotide reduced form (NADH), collagen and elastin are the major contributors to the emission observed.
Tryptophan and tyrosine are UV-fluorescing amino acids present in cells, and tryptophan plays an important role in the photolysis of proteins and enzymes in the UV region. Tryp- tophan has been shown to be the dominant emitting fluoro- phore in tissues compared with tyrosine [5,6,12]. NADH appears to be an important molecule in biomedical and bio- chemical research. Oxidation and reduction processes in cells are assisted by NADH. It constitutes a natural probe of the active site of different dehydrogenase enzymes in vitro

102 A. Pradhan et aL / Journal of Photochemistry and Photobiology B: Biology 31 (1995) 101-112
[ 13,14 ]. Much interest has been devoted to the time-resolved spectroscopic study of NADH [ 15-18 ] and tryptophan [ 19- 24]. The main advantage is that the fluorescence lifetime is mainly independent of the probe concentration. A consider- able amount of information may be obtained about the con- formational heterogeneity of the fluorophore and also the interaction of the fluorophore with the biological system. However, time-resolved studies of the intrinsic fluorescence of different fluorophores present in living cell systems are rare .
The malignant tissues and cells studied so far have not been classified according to their invasive properties, but may have been invasive in nature since they were obtained from mastectomies and post-mortems. During the course of the malignant process, metastasis in the major factor responsible for the death of cancer patients. The general mechanism of metastasis is still a matter of debate and controversy, and any increase in our understanding of the process would enable more effective approaches in the treatment of metastatic tum- ours. In this context, the analysis by non-invasive spectro- scopic methods of non-tumorigenic and tumorigenic (both metastatic and non-metastatic) cell lines could provide us with a molecular signature which may lead to the identifica- tion of metastasis-specific cellular constituents. It is thus important to distinguish between metastatic and non-meta- static cells and normal cells.
In this paper, we report the steady state and time-resolved fluorescence properties of normal, metastatic and non-meta- static cells obtained from different malignancies in rats and humans. Comparison has been made between these cells, and it is shown that the average fluorescence lifetime of NADH is consistently higher in the non-metastatic cell lines of dif- ferent origins (rat or human).
sulphide in Fisher rats (F344). A non-metastatic revertant cell line, SMFDA, was obtained after 49 passages in culture and three freeze-thaw cycles [ 26]. The human tumorigenic small lung cancer cells (SCLC417) and non-small lung can- cer cells (NSCLC358), as well as the normal human bron- cheolar epithelial cells (NBE4E6E7), were a generous gift from Dr. Jean Vialet of the Montreal General Hospital, Department of Oncology. The average cell sizes are 12 p,m, 19/zm and 20/zm respectively. All cells were grown accord- ing to the donors' specifications. Briefly Da, Ai, CRL1769, Bd, Bg (average cell sizes, 20/xm, 12/.tm, 10/zm, 23/zm and 12 p,m respectively) and K1735 were grown in Dulbecco minimal essential medium (DMEM) supplemented with 10% inactivated foetal bovine serum (FBS) with 1% anti- biotics (penicillin, 1000 U ml-~; streptomycin, 1000 p,g ml-~; gentamycin, 10 /zg ml -~) and passaged weekly. Human SCLC, NSCLC and NBE cells were grown in SIT (RPMI 1640, N-2-hydroxyethylpiperazine-N'-2-ethenesul- phonic acid (HEPES), antibiotics, 30 nM sodium selenite, 50/zg ml-~ insulin and 10/zg ml- ~ transferrin), R5 (RPMI 1640, FBS 10%, HEPES 10/zM and antibiotics) and KSFM c (kenaticocyte-SFM (GIBCO), BPE, E6F and cholera toxin at 10 /zg ml -~) media respectively. Adherent cells were grown to 90%-100% confluency and non-adherent cell lines were grown in suspension to a concentration of 3-5 million cells per millilitre before each experiment. Adherent cells were lifted with a 0.25% solution of trypsin. All cells were washed twice in phosphate-buffered solution (PB S) and kept at the same density at 0 °C until the experiment was performed at room temperature (23 °C) with the hour. Cells (50-75 million per millilitre) were packed in 2 mm path length quartz cuvettes for the experiment. Cell viability was always over 90% in all experiments as evaluated by trypan blue exclusion.
2. Experimental section 2.2. Steady state spectroscopy
2.1. Cell lines and culture conditions
The murine melanoma cell lines K1735C11 (low meta- static variant) and KI735M1 (high metastatic variant) were a gift from Dr. Victor A. Hogan of the Michigan Cancer Foundation, Detroit. The K1735C11 cell line was derived from the in vitro cloning of the fifth passage of a culture of melanoma tumour, co-induced with UV and croton oil in C3H/HEN mice, and the K1735M1 clone was isolated from the culture of a pulmonary metastase obtained after intra- venous (i.v.) inoculation of the parent tumour cells [25]. The average cell sizes are 16 tzm and 15/zm respectively. The SMFAI92 (tumorigenic and metastatic), SMFDA92 (low tumorigenicity and non-metastatic), RMSBG92 (met- astatic) and RMSBD91 (non-metastatic) cell lines were a gift from Dr. Feridoun Babai of the University of Montreal, Pathology Department. The SMFAI92 cell line was cloned from a cell line derived from an abdominal lymph node met- astatic nodule of a rhabdomyosarcoma induced by nickel
Corrected fluorescence spectra were measured on a Spex Fluorolog-2 spectrofluorometer with an F2T11 special con- figuration. The wavelengths of excitation were 310 and 350 nm and the emission was scanned in the ranges 320-550 nm and 40(0600 nm respectively. The excitation spectra were recorded for the 340 nm emission and the 450 nm emission. The fluorescence was collected in both front face and right angle geometries.
Spectra were recorded from rat rhabdomyosarcoma meta- static and non-metastatic cell lines of two different rats (repeated six times at different passages of Ai, Da and of Bg, Bd). The fluorescence of high and low metastatic cells was measured twice for the murine skin melanomas (K 1735C 11 / M1). The selected normal counterparts (CRL1769) for rat rhabdomyosarcoma cells were analysed three times for con- sistency. Only one measurement of human lung carcinoma cells with high and low metastasis was performed with a normal counterpart. Emission spectra measurements made at various times after cell collection showed no significant dif-

A. Pradhan et al. / Journal of Photochemistry and Photobiology B: Biology 31 (1995) 101-112 103
ferences. The excitation and fluorescence spectra were all corrected for the spectral response of the spectrometer.
2.3. Time-resolved spectroscopy
Fluorescence decay profiles were recorded on a multi- plexed time-correlated single-photon counting fluorometer (Edinburgh Instruments, model 299T). Details of the instru- mental set-up have been described elsewhere [27]. All the measurements were performed with front face excitation. The fluorescence decays were fitted to single, double or triple exponential functions by the method of iterative convolution. The quality of fit was judged by the reduced )(2 value, by visual inspectiotl for systematic deviations in the weighted residuals and by the Dutbin-Watson (DW) parameter. For
the UV (tryptophan) fluorescence decay, the excitation wavelength was 310 nm and the emission was monitored at 340 nm. For the visible (NADH) fluorescence decay, the excitation wavelength was 350 nm and the emission was monitored at 440 nm.
3. Results
3. I. Steady state spectroscopy
The typical fluorescence and fluorescence excitation spec- tra of rat rhabdomyosarcoma metastatic (Bg) and non-met- astatic (Bd) cells and normal skeletal muscle cells are shown in Fig. 1. The sharp peaks in the steady state fluorescence
t~O00C
u iO000(~
5oooc
lnOn-mlt • .met
! !
300 350 400 E~'cltation Wavelength (rim)
1 5 0 0 0 0 0
250
1 61oooooo
7
50000C o
/ ' ~ ~non-met /. "~. ' ' .met
' t . . . ~ - - C °rmal
, , .
270 290 310 330 Excitation Wavelength (nm)
80000
l E
u 6 0 0 0 0 7
-~ 40000
o' 20000
Inon-met / ~ " ' "met
l I i 400 450 500 550 600
Emission Wavelength (nm)
2000001 ~, .mn~-met
1500001 . ~ ~, --normal
: I \ d
oooo r
- ol , , , • . . . . . - " 320 360 400 440 480 520
Emission Wavelength (nm)
8000 - - non-met j . . . . . . met I ,'.",' ~".;. .... normal I
6000 o e
' I \ L J 4000
Oi i i i ! i i 320 360 400 440 480 520
Emission Wavelength (nm)
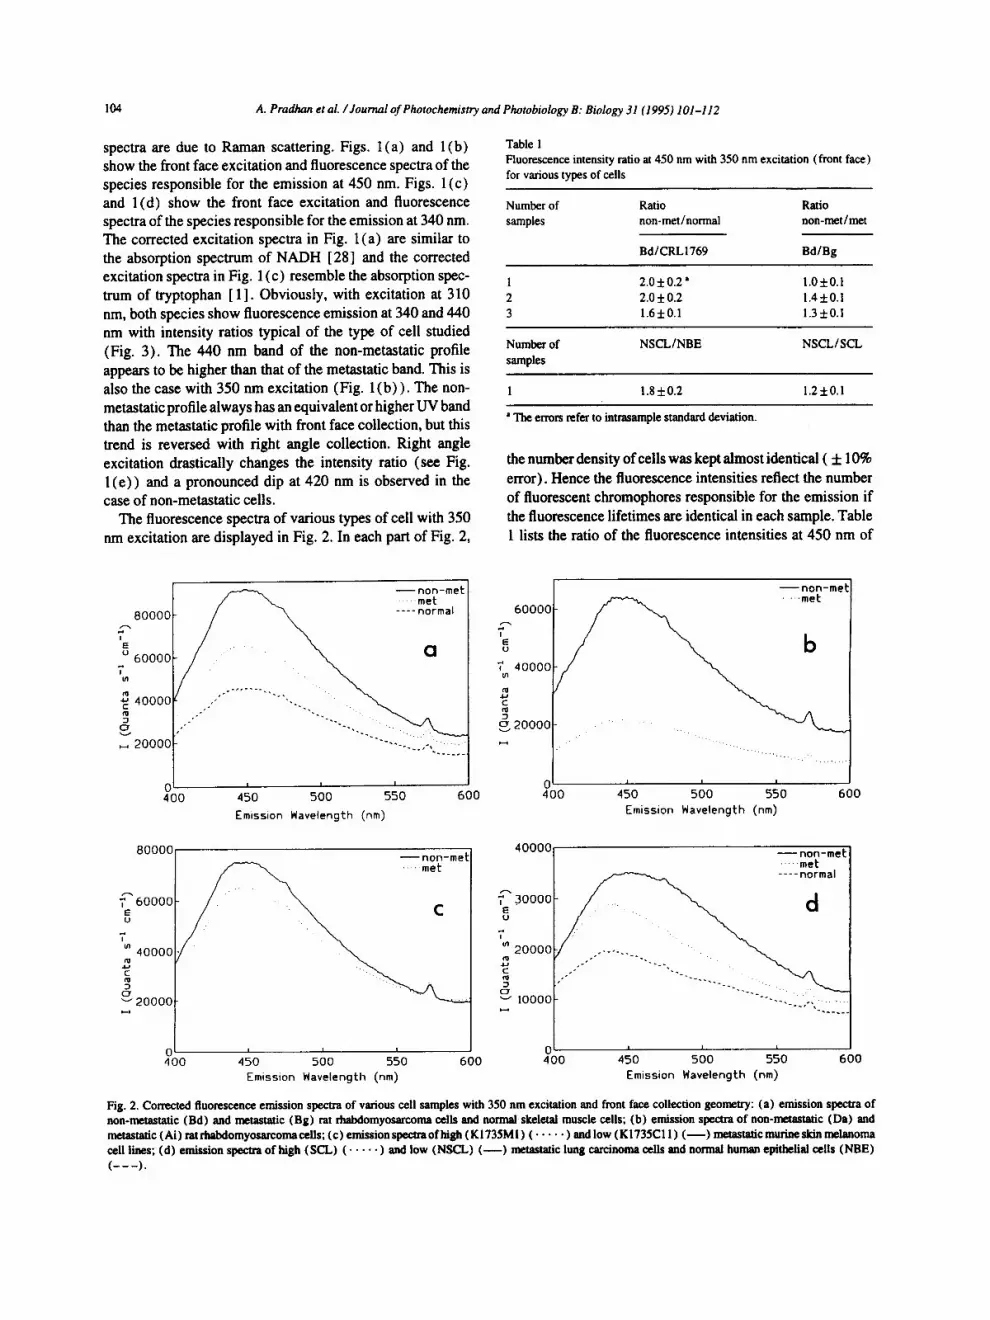
Fi 8. 1. Conrected fluorescence excitation and emission spectra of noa-a~tastatic (Bd) and n~tastatic (BB) rat rhabdomyosarcoma cells and normal skeletal muscle cells in different exlx~irrrJItal coadifions: (a ) excitation spectra for a front face collection 8eon~t~ (~. , -450 nm); (b) emission spectra for a front face collection Beomntty (~c -350 nm); (c) ¢xcitntio, spectra for a front face collection geomc, try (~f f i340 nm); (d) emission spectra for a front face collection geometry (~,c ffi 3]0 nm); (e) emission spectra for a right angle collection geo~try ( ~ c = 310 nm).
104 A. Pradhan et al. /Journal of Photochemistry and Photobiology B: Biology 31 (1995) 101-112
spectra are due to Raman scattering. Figs. l (a) and l(b) show the front face excitation and fluorescence spectra of the species responsible for the emission at 450 nm. Figs. 1 (c) and 1 (d) show the front face excitation and fluorescence spectra of the species responsible for the emission at 340 nm. The corrected excitation spectra in Fig. 1 (a) are similar to the absorption spectrum of NADH [28] and the corrected excitation spectra in Fig. 1 (c) resemble the absorption spec- trum of tryptophan [ 1]. Obviously, with excitation at 310 nm, both species show fluorescence emission at 340 and 440 nm with intensity ratios typical of the type of cell studied (Fig. 3). The 440 um band of the non-metastatic profile appears to be higher than that of the metastatic band. This is also the case with 350 nm excitation (Fig. l (b) ) . The non- metastatic profile always has an equivalent or higher UV band than the metastatic profile with front face collection, but this trend is reversed with right angle collection. Right angle excitation drastically changes the intensity ratio (see Fig. l ( e ) ) and a pronounced dip at 420 nm is observed in the case of non-metastatic cells.
The fluorescence spectra of various types of cell with 350 nm excitation are displayed in Fig. 2. In each part of Fig. 2,
Table 1 Fluorescence intensity ratio at 450 nm with 350 nm excitation (front face) for various types of cells
Number of Ratio Ratio samples non-met/normal non-met/met
Bd/CRLI769 Bd/Bg
1 2 .0±0 .2" 1.0±0.1 2 2 .0±0.2 1.4±0.1 3 1.6±0.1 1.3±0.1
Num~rof NSCL/NBE NSCL/SCL samples
1 1.8±0.2 1.2±0.1
'Theerrom~tointrasample~andard~viation.
the number density of cells was kept almost identical ( + 10% error). Hence the fluorescence intensities reflect the number of fluorescent chromophores responsible for the emission if the fluorescence lifetimes are identical in each sample. Table 1 lists the ratio of the fluorescence intensities at 450 nm of
400 600
--non-met 'iiiiii. =me
• i .......... "'IL.L:.L
I | I
450 500 550
Emission Wavelength (nm)
--non-met
60000
I E u
T 40000
C
°..0_.,20000
0 400
- - n o n - m e t .... met
I I I
450 500 550 600
Emission Wavelength (nm)
80000
7 60000 E U
7 m 40000
C
O v 2 0 0 0 0
80000
I E
u 60000 7
~ 40000
20000
I I
400 450 500 550 600 Emission Wavelength (nm)
40000
7 30000 E U
7 m 20000
C
o ~" I0000
--non-met ..... met
....... "',IL2L.Z
0 I I L
400 450 500 550 600 Emission Wavelength (rim)
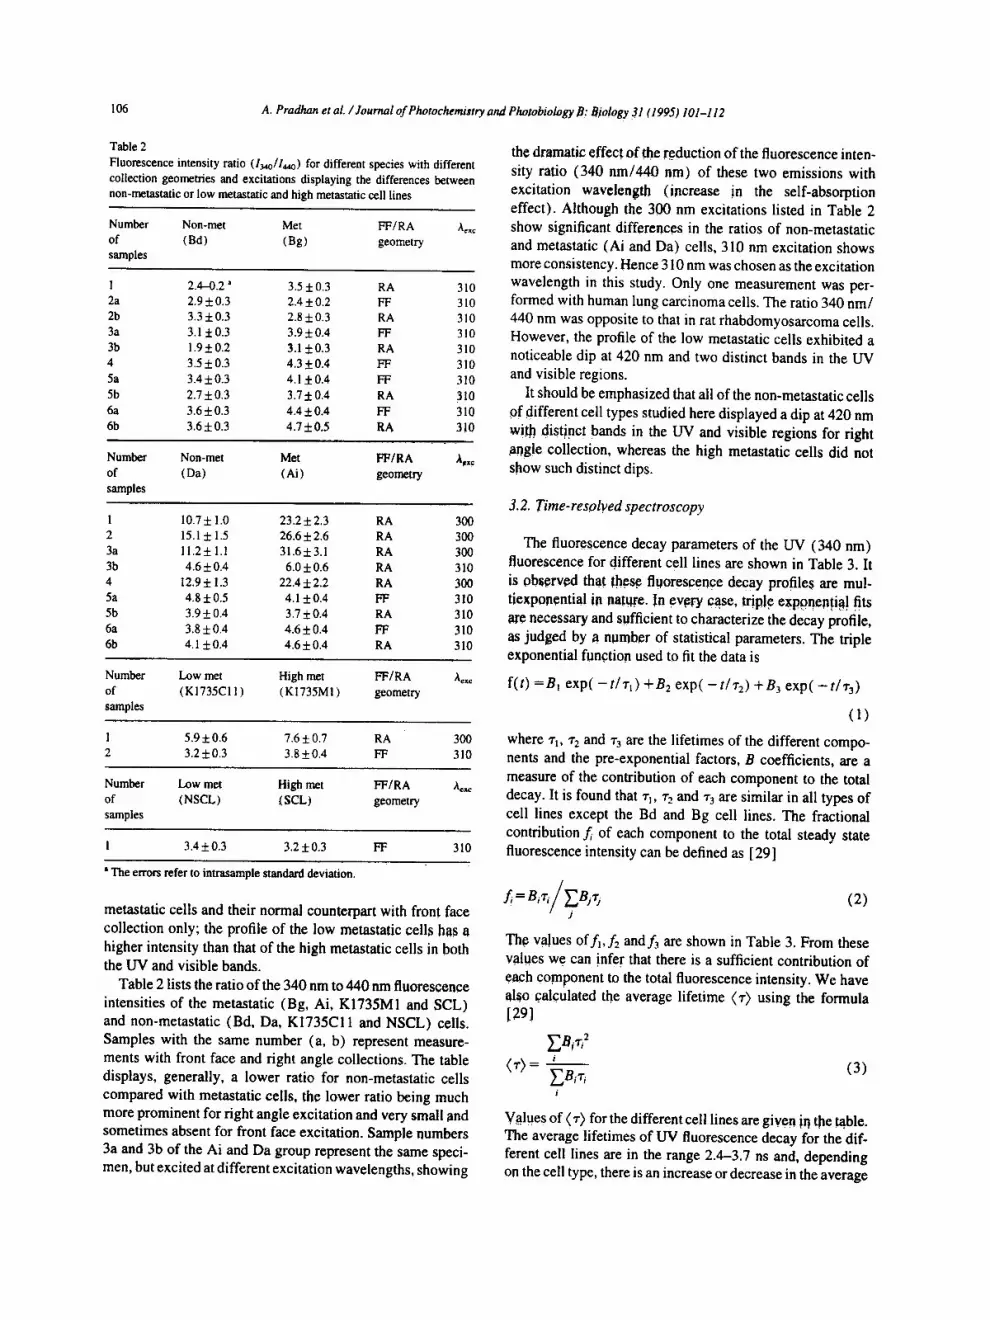
Fig. 2. Corrected fluorescence emission spectra of various cell samples with 350 nm excitation and front face collection geometry: (a) emission spectra of non-metastatic (Bd) and metastatic (Bg) rat rhabdomyosarcoma cells and normal skeletal muscle cells; (b) emission spectra of non-metastatic (Da) and metastatic (Ai) rat rhabdomyosarcomacells; (c) emission spectra of high (KI735M!) ( . . . . . ) and low (K1735C11 ) ( - - ) metastatic murine skin melanoma cell lines; (d) emission spectra of high (SCL) ( . . . . . ) and low (NSCL) ( - - ) metastatic lung carcinoma cells and normal human epithelial cells (NBE) ( - - - ) .

A. Pradhan et al. / Journal of Photochemist~ and Photobiology B: Biology 31 (1995) 101-112 105
200000
7 150000 E u
7 I00000
v 50000
0 320
200000
7 150000 E U
7 m 100000
c
0 50000
- -non -me t met
I
360
Cl
. . . . • . . . . . . . . . . . . . • . . . . . . . . . . . . . . . . . . . .
I I I !
400 440 480 520
Emission Wavelength (nm)
- -non-met • met
25000
20000 I E U
7 15000
10000
5000
325
20000
7 15000 E u
7 m IOOOO
c
3 0 v 5000
I I I I I 0 I
320 360 400 440 480 520 320 360 Emission Wavelength (nm)
- -non -me t met
b
I l i I
365 405 445 485
Emission Wavelength (nm)
- - n o n - m e t met
I i I I
400 440 480 520 Emission Wavelength (nm)
I00000[ - -non-met
- "::r ma '
°°°°° F \
- 20000 " " , i i ~ i i i i i
320 360 400 440 480 520
Emission Wavelength (nm)
Fig. 3. Comparison of the corrected fluorescence emission spectra excited at 310 nm of various cell samples with different collection geometries: (a) emission spectra of non-metustatic (Da) and metastatic (Ai) rat rhabdomyosarcoma cells with front face collection geometry, (b) same samples with right angle collection geometry; (c) emission spectra of high (KI735MI) ( . . . . . ) and low (K1735CI 1 ) ( - - ) metastatic murine skin melanoma cell lines with front face collection geometry; (d) same samples with right angle collection geometry; (e) emission spectra of high (SCL) ( . . . . . ) and low (NSCL) ( - - ) metastatic lung carcinoma cells and normal human epithelial cells (NBE) ( - - - ) with front face collection geometry.
the non-metastatic (Bd) to the metastatic (Bg) cells and of the non-metastatic (Bd) to the normal (CRL1769) cells in each cell category. As can be seen from Fig. 2 and Table 1, the fluorescence of the non-metastatic cells is always stronger at 450 nm than that of the metastatic cells by an average factor of 1.3 and is also stronger than that of the normal cells by an average factor of 1.9
Typical curves of rat rhabdomyosarcoma metastatic (Ai) and non-metastatic (Da) cells with 310 nm excitation and front face collection are displayed in Fig. 3(a). The profiles are similar and consistent with the Bd and Bg cell profiles (Fig. 1 (d)) with higher intensity of both UV and visible
bands for the Da cells. Fig. 3(b) displays the profiles of Ai and Da cells with 310 nm excitation and fight angle collection and, as in Fig. 1 (e), there is a noticeable peak shift towards higher wavelength and lower intensity in the case of non- metastatic cells compared with metastatic cells at fight angle collection.
Figs. 3(c) and 3(d) show the profiles of murine skin melanoma high and low metastatic cells with front face and fight angle collection respectively. The profiles are again similar to the respective metastatic and non-metastatic pro- files of the rat rhabdomyosarcoma cells. Fig. 3(e) displays the corresponding profiles of lung carcinoma high and low
106 A. Pradhan et al. / Journal of Photochemistry and Phatobiology B: Biology 31 (1995) 101-112
Table 2
Fluorescence intensity ratio (134o/144o) for different species with different collection geometries and excitations displaying the differences between non-metastatic or low metastatic and high metastatic cell lines
Number Non-met Met FF/RA of (Bd) (Bg) geometry samples
Aexc
1 2.4-0.2 ' 3.5 ± 0.3 RA 310 2a 2.9±0.3 2.4±0.2 FF 310 2b 3.3 ±0.3 2.8 ±0.3 RA 310 3a 3.1 +0.3 3.9±0.4 FF 310 3b 1.9±0.2 3.1 ±0.3 RA 310 4 3.5±0.3 4.3+0.4 FF 310 5a 3.4±0.3 4.1 ±0.4 FF 310 5b 2.7±0.3 3.7+0.4 RA 310 6a 3.6 ± 0.3 4.4 ± 0.4 FF 310 6b 3.6±0.3 4.7+0.5 RA 3!0
Number Non-met Met FF/RA )t~ c of (Da) (Ai) geometry samples
1 10.7±1.0 23.2±2.3 RA 3 ~ 2 15.1±1.5 26.6±2.6 RA 3 ~ 3a 11.2±1.1 31.6±3.1 RA 3 ~ 3b 4.6±0.4 6.0±0.6 RA 310 4 12.9±1.3 22.4±2.2 RA 3 ~ 5a 4.8±0.5 4.1±0.4 FF 310 5b 3.9±0.4 3.7±0.4 RA 310 6a 3.8±0.4 4.6±0.4 FF 310 6b 4.1±0.4 4.6±0.4 RA 310
Number Low met High met FF/RA A~ c of (K1735C11 ) (KI735MI) geometry samples
1 5.9 + 0.6 7.6 ± 0.7 RA 300 2 3.2±0.3 3.8±0.4 FF 310
Number Low met High met FF/RA A~ of (NSCL) I( SCL ) geometry samples
I 3.4±0.3 3.2+0,3 FF 310
• The errors refer to intrasample standard deviation.
metastatic cells and their normal counterpart with front face collection only; the profile of the low metastatic cells has a higher intensity than that of the high metastatic cells in both the UV and visible bands.
Table 2 lists the ratio of the 340 nm to 440 nm fluorescence intensities of the metastatic (Bg, Ai, K1735M1 and SCL) and non-metastatic (Bd, Da, K1735C11 and NSCL) cells. Samples with the same number (a, b) represent measure- ments with front face and right angle collections. The table displays, generally, a lower ratio for non-metastatic cells compared with metastatic cells, the lower ratio being much more prominent for right angle excitation and very small and sometimes absent for front face excitation. Sample numbers 3a and 3b of the Ai and Da group represent the same speci- men, but excited at different excitation wavelengths, showing
the dramatic effect of the .reduction of the fluorescence inten- sity ratio (340 nm/440 nm) of these two emissions with excitation wavelength (increase jn the self-absorption effect). Although the 300 nm excitations listed in Table 2 show significant differences in the ratios of non-metastatic and metastatic (Ai and Da) cells, 310 nm excitation shows more consistency. Hence 310 nm was chosen as the excitation wavelength in this study. Only one measurement was per- formed with human lung carcinoma cells. The ratio 340 nm/ 440 nm was opposite to that in rat rhabdomyosarcoma cells. However, the profile of the low metastatic cells exhibited a noticeable dip at 420 nm and two distinct bands in the UV and visible regions.
It should be emphasized that all of the non-metastatic cells of different cell types studied here displayed a dip at 420 nm wi~ distinct bands in the UV and visible regions for right ar~g!e collection, whereas the high metastatic cells did not show such distinct dips.
3.2. Time-resolved spectroscopy
The fluorescence decay parameters of the UV (340 nm) fluorescence for different cell lines are shown in Table 3. It is observed that thes.e fluorescence decay profiles are mul- tiexponential in nat tllre. In evt~ry ~ e , triple exPonen~i~] fits are necessary and sufficient to characterize the decay profile, as judged by a number of statistical parameters. The triple exponential fun.ction used to fit the data is
f(t) =Bi e x p ( - t / r l ) +B2 exp(- t /¢2) +B3 exp(- t /¢3)
(1)
where rl, z2 and r3 are the lifetimes of the different compo- nents and the pre-exponential factors, B coefficients, are a measure of the contribution of each component to the total decay. It is found that cj, ¢2 and % are similar in all types of cell lines except the Bd and Bg cell lines. The fractional contribution f, of each component to the total steady state fluorescence intensity can be defined as [29]
f, = B,¢,/EBj (2) ./
Th~ values offl,f2 and f3 are shown in Table 3. From these values we can infer that there is a sufficient contribution of each component to the total fluorescence intensity. We have also calculated the average lifetime (¢) using the formula [29]
E B ¢ ~ 2
(¢>= E a , z ' (3)
i
V a.lues of (¢) for the different cell lines are given irt the ~ble. The average lifetimes of UV fluorescence decay for the dif- ferent cell lines are in the range 2.4-3.7 ns and, depending on the cell type, there is an increase or decrease in the average

A. Pradhan et al. /Journal of Photochemistry and Photobiology B: Biology 31 (1995) 101-112
Table 3 UV (340 nm) fluorescence decay parameters" for different metastatic and non- or low metastatic cell lines
107
Type of "rz (ns) r2 (ns) "r 3 (ns) B~ B., B3 ft f.~ fa (~') (ns)
cell ( + 0 . 0 5 ) ( 5:0.1 ) (5 :0 .5 )
CRL1769 0.65 3.2 7.1 0.65 0.29 0.06 0.22 0.49 0.29 3.7
, normal)
]~d 0.17 2.3 6.1 0.93 0.05 0.02 0.39 0.28 0.33 2.7
non-met) ~g 0.45 2.9 6.8 0.73 0.21 0.06 0.22 0.45 0.33 3.6
met)
1735C 11 0.45 2.5 6.2 0.57 0.32 0.11 0.15 0.45 0.40 3.7
low met) ~. 1735M 1 0.37 2.5 6.3 0.68 0.23 0.09 0.18 0.42 0.40 3.7
met )
i )a 0.35 2.6 6.5 0.73 0.20 0.07 0.20 0.41 0.39 3.7
non-met) Ai 0.14 2.5 6.4 0.96 0.03 0.01 0.45 0.30 0.25 2.4
met )
NBE 0.13 2.2 5.8 0.94 0.04 0.02 0.40 0.29 0.31 2.5
normal ) NSCL 0.19 2.5 6.1 0.93 0.05 0.02 0.44 0.29 0.27 2.5
low met) :~CL 0.17 2.2 6.0 0.90 0.07 0.03 0.32 0.35 0.33 2.7
met)
The values of X 2 for these data are in the range 1.0-1.3. All B values are normalized [27].
tuorescence lifetime on going from non-metastatic to meta- :~tatic cell lines.
Table 4 shows the fluorescence decay parameters of the ¢isible (440 nm) fluorescence of different types of cell lines. These decays are also multiexponential in nature. Two and, n some cases (for Bd and NSCL), three exponential fits are
necessary to obtain the best fit. Here X 2 values (in the range 1-2 ) are not as good as in the case of UV fluorescence decays. Higher X 2 values for fluorophores present in biological sys- tems have been reported in the literature [30]. The f values indicate that the majority of the fluorescence originates from the shortest component. The average lifetime data of visible
'Fable 4 , / is ible (440 nm) fluorescence decay parameters I for different metastatic and non- or low metastatic cell lines
,?ell "r I (ns) T2 (ns) I" 3 (ns) Bt Bz B3 f l f2 f,i (,r) (rig) ~ype ( + 0 . 0 5 ) ( + 0 . 1 ) ( + 0 . 5 )
CRL 1769 0.32 3.5 - 0.99 0.01 - 0.88 0.12 - 0.7 normal)
] d 0.23 1.4 6.6 0.94 0.05 0.01 0.64 0.21 0.14 1.4 non-met)
-~g 0.30 3.6 - 0.99 0.01 - 0.93 0.07 - 0.53 met )
( 1735C 11 0.39 3.7 - 0.98 0.02 - 0.83 0.17 - 0.95 low met )
• ;1735M1 0.36 3.3 - 0.99 0.01 - 0.86 0.14 - 0.78 met )
)a 0.45 4.2 - 0.97 0.03 - 0.76 0.24 - 1.3 non-met)
~,i 0.30 4.1 - 0.997 0.003 - 0.96 0.04 0.47
met )
qBE 0.33 3.6 - 0.99 0.01 - 0.95 0.05 - 0.48 • normal)
'4SCL 0.34 2.1 7.7 0.92 0.7 0.01 0.58 0.28 0.14 1.9 low met )
:;CL 0.32 5.9 - 0.99 0.01 - 0.90 0.10 - 0.85 met )
' Values of X 2 for these data are the best obtained and are in the range I-2 . All B values are normalized [27] .
108 A. Pradhan et al. /Journal of Photochemistry and Photobiology B: Biology 31 (1995) 101-112
(440 nm) fluorescence decay indicate that there is an impor- tant decrease in the (r) values between the non-metastatic and metastatic cell lines. This is consistent for the cell lines obtained from different sources. Moreover, for the human cell lines, the absolute lifetime values are slightly higher.
4. Discussion
4.1. Steady state fluorescence
The fluorescence profiles displayed in Figs. 1-3 exhibit two bands ascribed to different molecules according to earlier investigations [5,6]. The 340 nm band may be attributed to tryptophan and tyrosine and, as mentioned earlier, tryptophan is the dominant emitting molecule. The 450 nm band may be attributed to NADH, elastin and collagen. However, it is well known that elastin and collagen are extracellular components that are present in the connective tissue. In cells, they are not present in significant amounts to contribute much to the 450 nm band. NADH should be the more dominant fluorophore here [28]. The fluorescence intensities of both tryptophan and NADH are higher in non-metastatic cells than in meta- static cells, as observed from the excitation and emission spectra. It is well known that metastatic cells are smaller in size than non-metastatic cells [26] and this has been con- firmed for the cells studied here (see Section 2.1). Larger cells may have a larger number of molecules and this may be the reason for the higher intensity, but it may also be due to an increase in the fluorescence lifetime. Both corrections must be taken into account.
As observed in Figs. 1 (d) and 1 (e), the fluorescence inten- sity of non-metastatic cells is higher than that of metastatic cells with front face collection, but lower with right angle collection. It is well known that right angle collection can cause self-absorption effects in such highly concentrated solutions as cells in PBS. This, together with the conspicuous dip in the right angle collection, proves that the self-absorp- tion effect dominates in non-metastatic cells. This is due to the NADH molecules (with an absorption band peaking at 350 nm, which is the maximum in the fluorescence emission of tryptophan residues) which may re-absorb the tryptophan fluorescence. This fluorescence re-absorption is higher in non-metastatic cells than metastatic ceils. This can be clearly observed in Fig. 1 (e).
NADH appears to be an important molecule for investi- gation since it monitors changes that may occur in its envi- ronment in different cell types. Although some studies have shown an increase in NADH in neoplastic tissues compared with normal counterparts [ 31-33 ], others report a decrease in NADH content in $440 transformed fibroblasts [34] or colonic neoplastic cells [ 35 ]. It has also been noted that the amount of NADH in normal cells decreases on going from the logarithmic phase to the stationary phase [ 34].
It is observed here that changes occur in the fluorescence intensity of molecules on going from normal to non-meta-
static to metastatic cells. The intensity of the 450 nm emission attributed to NADH is highest in non-metastatic cells. The increase in the NADH fluorescence intensity may be due either to an increase in the number of NADH molecules or a change in the photophysical properties, such as the fluores- cence lifetime in the non-metastatic cell environment. Studies on human breast tissues have shown that, even if the fluores- cence intensities of malignant tissues (metastatic) are stronger than those of normal tissues, the fluorescence life- times are shorter, indicating that the concentration of NADH is the main factor controlling the fluorescence intensity var- iation between these tissues [ 12].
4.2. Time-resolved fluorescence
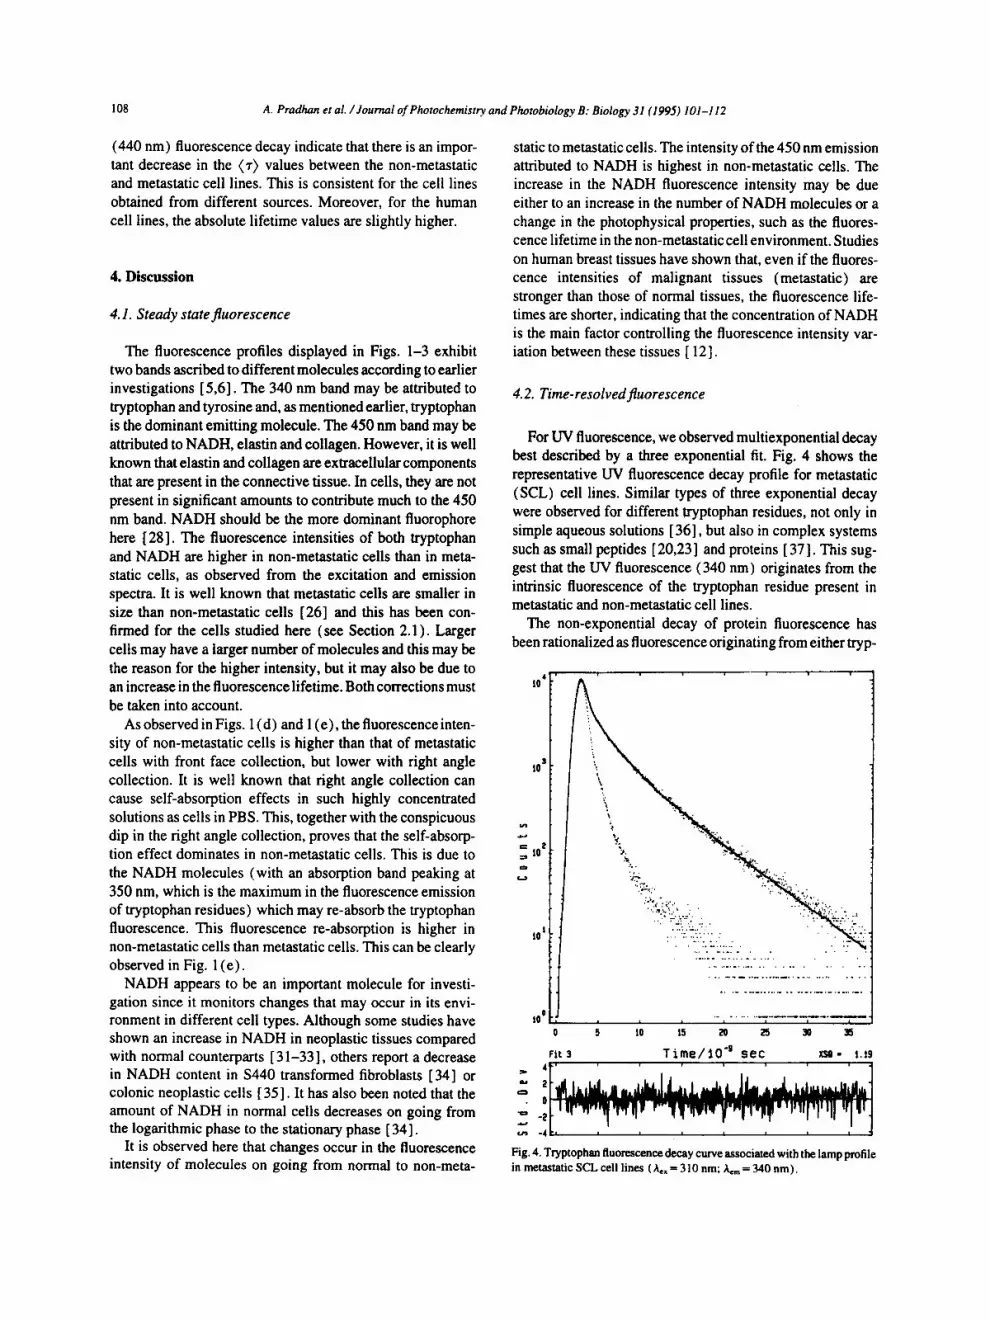
For UV fluorescence, we observed multiexponential decay best described by a three exponential fit. Fig. 4 shows the representative UV fluorescence decay profile for metastatic (SCL) cell lines. Similar types of three exponential decay were observed for different tryptophan residues, not only in simple aqueous solutions [36], but also in complex systems such as small peptides [ 20,23 ] and proteins [ 37 ]. This sug- gest that the UV fluorescence (340 nm) originates from the intrinsic fluorescence of the tryptophan residue present in metastatic and non-metastatic cell lines.
The non-exponential decay of protein fluorescence has been rationalized as fluorescence originating from either tryp-
]0 +
= iO 2 \ .
to s .
t o °
0 5 tO
Fit 3
.. '.,~:~,.. :°.
. . . . ~ y - . . ~ •
• ..'" :-'2:'~: .~ .
. . . " ; . . . . . ~ . . . : • . °''.-'....." .
:' " ~ '
. . . . 1
T i m e / l O "s s e c xsa. t.t9 4
Fig. 4. Tryp tophan f luorescence decay curve associated with the l amp profile in metastat ic SCL cell lines ( , ~ ffi 310 nm; ~ ffi 340 n m ) .

A. Pradhan et al. / Journal of Photochemistry and Photobiology B: Biology 31 (1995) 101-112 109
lophyl residues in different environments or one tryptophyl residue and multiple conformations of the molecule [ 20,37 ]. However, it has been found that the non-exponential decay of isolated tryptophan analogues in aqueous and organic sol- vents may be fitted well to a sum of two or three exponentially decaying components [36]. Thus the intrinsic non-exponen- Tiality of tryptophan makes the protein and cell fluorescence more difficult to interpret. Recently, it has been shown that ~:he multiexponential decay originates from the fluorescence of different rotational conformers of the indole ring around :he C,,--C~ bond of the alanyl side-chain [23,24].
The values of ~'1, ~'2 and % obtained for metastatic and non- -netastatic cell lines are similar to those reported in the liter- ature for isolated tryptophan analogues in various media [36]. Thus it would be more realistic to say that these expo- nential decays of the tryptophan residue in metastatic and non-metastatic cells mainly originate from the different =onformers and species of triptophan. The shortest (~'1) and intermediate (~'2) lifetimes are ascribed to three conformers of the zwitterion form of tryptophan (one of these being temporally unresolved), and the longer lifetime (%) is assigned to the tryptophan anion [36]. The average lifetime ((~')) values obtained from different cell lines are not very different. The small variation may be due to the different environmental perturbation in the tryptophan conformers. As the cell systems are complex in nature at this stage, it is very difficult to make any quantitative conclusions about the nature of these small perturbations. Nonetheless, it is known that, when the tryptophan residue moves from an aqueous to a lipid phase, a blue shift of the fluorescence spectral maxi- mum (from 350 nm to around 340 nm) and an increase in the fluorescence intensity (IF) and lifetime (I"F) occur. This increase in IF and ~'F results from a reduction in the non- radiative deactivation processes that involve interactions with water [ 19,20]. In all the cell lines studied here, the fluores- cence maximum peaked at 340 nm, which confirms that the tryptophan residue is, on average, isolated from water. This may be the reason why the average fluorescence lifetimes are nearly identical, as discussed above, in all these cell lines. Table 5 shows that the ratio of the relative fluorescence inten- sity over the average lifetime (IF~ ( I") ) is still generally higher for non-metastatic cell lines. However, if we use the assump- tion that the concentration of tryptophan varies with the recip- rocal of the cell volume, then the quantity I F / ( ' r ) V becomes proportional to the concentration of tryptophan. The last col- umn in Table 5 indicates a higher concentration of tryptophan in cancerous metastatic cell lines than in non-metastatic cell lines.
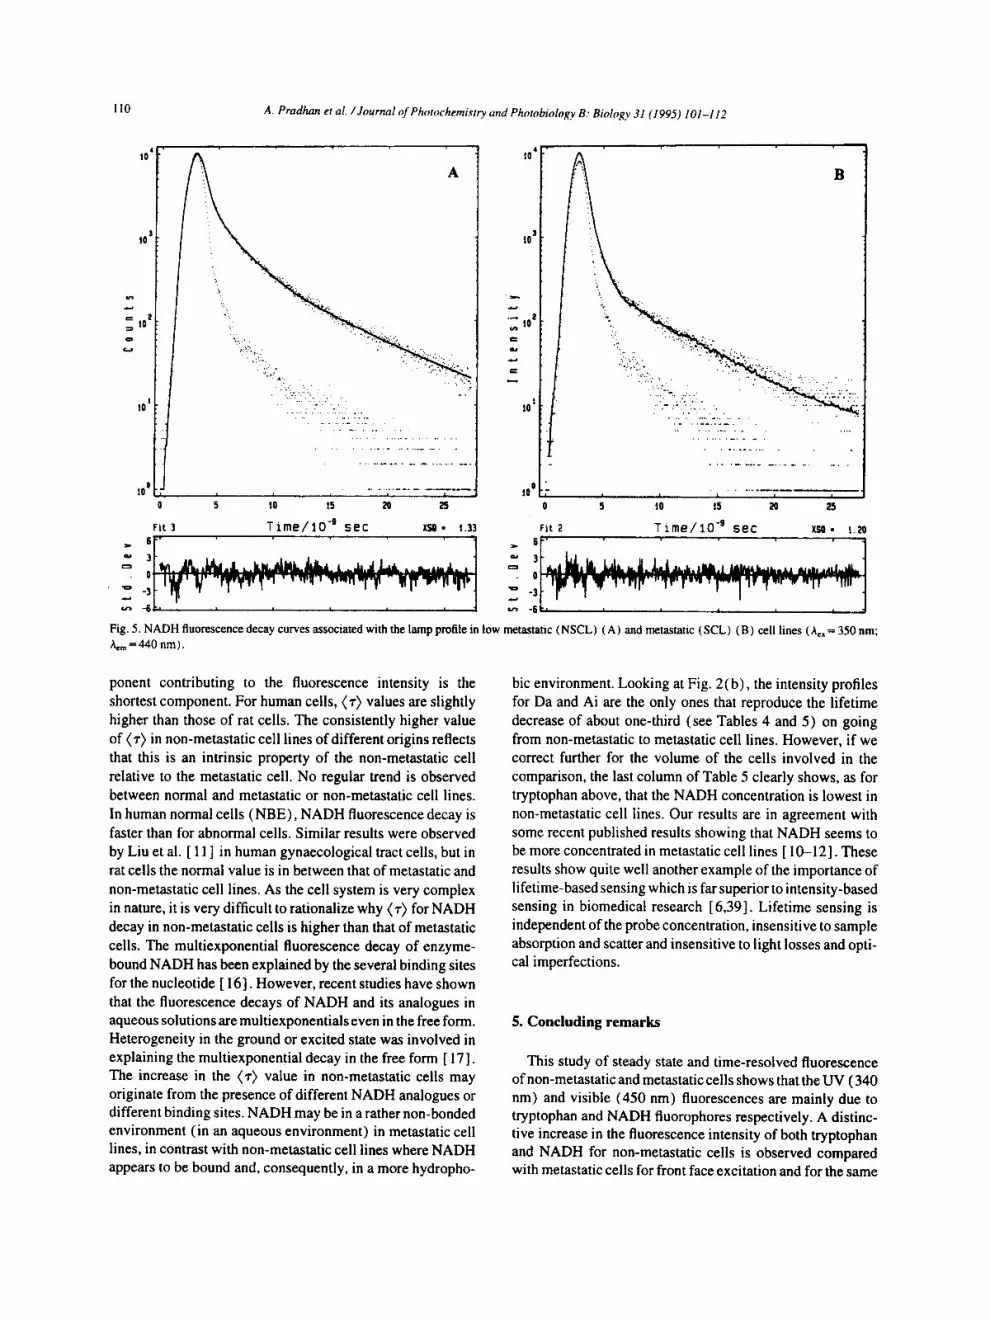
The visible fluorescence (450 nm) decay kinetics of dif- ferent metastatic and non-metastatic cell lines are non-expo- nential in nature and can be fitted best by a two or three exponential decay. This visible fluorescence has already been ascribed to NADH. Fig. 5 shows representative NADH flu- orescence decay profiles for non-metastatic (NSCL) and metastatic (SCL) cell lines. Time-resolved studies of NADH fluorescence in microscopic biological samples are not usu-
Table 5 Correction of the relative fluorescence intensity (front face excitation) for average lifetime and cell volume for the tryptophan (TRYP) and NADH- like emission in various non-metastatic and metastatic cell lines
1~ ( ~.> l d ( r) a " 1F/ ( r) v ~ (ns) (ns -~) (/zm) (102ns -I/~m -3)
TRYP CRL1769 (normal) 100 3.7 27 10 5.1 Bd (non-met) 170 2.7 63 23 0.96 Bg (met) 170 3.6 47 12 5.2
Da (non-met) 150 3.7 41 20 0.97 Ai (met) 87 2.4 36 12 4.0
K1735Cll (low met) 150 2.7 41 16 1.9 KI735CMI (met) 168 3.7 45 15 2.5
NBE (normal) 60 2.5 24 20 0.56 NSCI (non met) 90 2.5 36 19 1.0 SCL (met) 62 2.7 23 12 2.5
NADH CRL!769 (normal) 42 0.7 60 10 11.4 Bd(non-met) 92 1.4 66 23 1.0 Bg (met) 64 0.53 125 12 13.2
Da (non-met) 64 1.3 49 20 1.2 Ai (met) 22 0.47 47 12 5.1
Ki735C11 (low met) 74 0.95 78 16 3.6 KI735MI (met) 65 0.78 83 15 4.6
NBE (normal) 18 0.48 37 20 0.87 NSCL (non-met) 35 1.9 18 19 0.28 SCL (met) 29 0.85 34 12 3.8
• Cell diameter as reported in Section 2.1. b Relative fluorescence intensity corrected for both the fluorescence lifetime (~-) and the cell volume (V) of the various cell lines.
ally available. This is particularly disadvantageous when we consider the sensitivity of the fluorescence decay time to chemical and environmental factors of interest, such as the local pH, cation concentration, oxygen and polarity, to name a few. Recently some time-resolved studies of protein-bound NADH [ 13] and pure NADH analogues in water and organic solvents [ 14-18] have appeared in the literature, and show that NADH decay is multiexponential in nature even in the pure form. The average lifetime is small and varies in the range 0.2-1 ns depending on the different physical and chem- ical factors. Two decay components exist for NADH in water (approximately 0.3 and 0.7 ns) and these may be due to the intrinsic photoproeesses of the dihydronicotinamide ehro- mophore [ 18 ] and possibly to intramolecular interaction fol- lowing the folding of the dinucleotide [38]. The average lifetime in water at 20 °C is about 0.4 ns, with the first com- ponent having a much higher statistical weight. In non-aque- ous media [18] and when NADH is bound to a dehydrogenase [ 13], the second component (~2) increases up to 1.0 ns and, very often, a third component appears with a longer lifetime.
Our results (Table 4) show that the average lifetimes for NADH fluorescence decay are always higher for the non- metastatic cell lines. Thefvalues indicate that the main tom-
110 A. Pradhan et al. /Journal of Photochemist~ and Photobiology B: Biology 31 (1995) 101-112
tO 4
10 3
~ tO z
o
IO t
A
10 o d
0
Fit 3
. . . . . .
.. -..- - .!.,.:..
I I I i I
5 tO t5 20 25
T i m e / l O "e s e c xso. ~.33
5 . . . . . . ]
; } '' - 6h , , , , , 4
t0 4
tO 3
tO t
10 0 I I I I I
5 t0 t5 20 25
Fit 2 T i m e / l O "s sec xsn • t.20 5 ' ' ' ' . . . . ' . . . . '
• .;[ ,pr I "r,'r.-,r, 7 I, '+'+t
Fig. 5. NADH fluorescence decay curves associated with the lamp profile in low metastatic (NSCL) (A) and metastatic (SCL) (B) cell lines (kc~ = 350 nm; kern =440 nm).
ponent contributing to the fluorescence intensity is the shortest component. For human cells, (~') values are slightly higher than those of rat cells. The consistently higher value of (z) in non-metastatic cell lines of different origins reflects that this is an intrinsic property of the non-metastatic cell relative to the metastatic cell. No regular trend is observed between normal and metastatic or non-metastatic cell lines. In human normal cells (NBE), NADH fluorescence decay is faster than for abnormal cells. Similar results were observed by Liu et al. [ 11 ] in human gynaecological tract cells, but in rat cells the normal value is in between that of metastatic and non-metastatic cell lines. As the cell system is very complex in nature, it is very difficult to rationalize why (~) for NADH decay in non-metastatic cells is higher than that of metastatic cells. The multiexponential fluorescence decay of enzyme- bound NADH has been explained by the several binding sites for the nucleotide [ 16]. However, recent studies have shown that the fluorescence decays of NADH and its analogues in aqueous solutions are multiexponentials even in the free form. Heterogeneity in the ground or excited state was involved in explaining the multiexponentiai decay in the free form [ 17 ]. The increase in the (~') value in non-metastatic cells may originate from the presence of different NADH analogues or different binding sites. NADH may be in a rather non-bonded environment (in an aqueous environment) in metastatic cell lines, in contrast with non-metastatic cell lines where NADH appears to be bound and, consequently, in a more hydropho-
bic environment. Looking at Fig. 2(b), the intensity profiles for Da and Ai are the only ones that reproduce the lifetime decrease of about one-third (see Tables 4 and 5) on going from non-metastatic to metastatic cell lines. However, if we correct further for the volume of the cells involved in the comparison, the last column of Table 5 clearly shows, as for tryptophan above, that the NADH concentration is lowest in non-metastatic cell lines. Our results are in agreement with some recent published results showing that NADH seems to be more concentrated in metastatic cell lines [ 10-12]. These results show quite well another example of the importance of lifetime-based sensing which is far superior to intensity-based sensing in biomedical research [6,39]. Lifetime sensing is independent of the probe concentration, insensitive to sample absorption and scatter and insensitive to light losses and opti- cal imperfections.
5. Concluding remarks
This study of steady state and time-resolved fluorescence of non-metastatic and metastatic cells shows that the UV (340 nm) and visible (450 nm) fluorescences are mainly due to tryptophan and NADH fluorophores respectively. A distinc- tive increase in the fluorescence intensity of both tryptophan and NADH for non-metastatic cells is observed compared with metastatic cells for front face excitation and for the same
A. Pradhan et al. /Journal of Phowchemistry and Photobiology B: Biology 31 (1995) 101-112 111
number density of cells. However, in right angle geometry, the re-absorption effect dominates the non-metastatic fluo- rescence. The fluorescence intensity increase in non-meta- static cells may be interpreted by an increase in the concentration of the chromophores or an increase in the flu- orescence lifetime of the chromophores.
In all cases studied in this work, the tryptophan residues ~,;eem to be isolated from water and there are no particular Irends in the average lifetime for tryptophan decay between metastatic and non-metastatic cells. However, from the NADH decay, it is found that the non-metastatic cells con- ,:istently show higher average lifetimes (~') than metastatic and normal cells; this seems to be an intrinsic property of ~hese cells which can be used for characterization. This may be due to a more hydrophobic environment of NADH in non- :netastatic cell lines. By taking into account the fluorescence ifetime "corrections" to the fluorescence intensity and also 'he cell volume of the various cell lines, the NADH concen- ration seems to increase consistently on going from non- netastatic to metastatic cell lines.
The abovementioned characteristics obtained from steady ~tate and time-resolved spectroscopic studies may be useful ~s a diagnostic tool to separate metastatic from non-metastatic :ells.
Acknowledgments
G.D. acknowledges the financial assistance of the Natural ~ciences and Engineering Research Council of Canada (NSERC) and the fonds "FCAR" (Qu6bec) in the form of grants. This work was supported by a grant from Theratech- aologies Inc., Montr6ai, Canada.
References
[ 1 ] S. Udenfriend, Fluorescence Assay in Biology and Medicine, Vols. 1 and 2, Academic Press, New York, 1969.
[2] R.R. Alfano, G.C. Tang, W. Lain, D.S.J. Choy and E. Opher, Fluorescence spectra from cancerous and normal human breast and lung tissues, IEEE J. Quantum Electron., 23 (1987) 1806-1811.
[3] G.C. Tang, J. Chen, R.R. Alfano, A. Pradhan, S.J. Wahl, W. Sha and C.H. Liu, Pulsed and CW laser fluorescence spectra from cancerous, normal and chemically treated normal human breast and lung tissues, Appl. Opt., 28 (12) (1989) 2337-2342.
[4] C.H. Liu, G.C. Tang, A. Pradhan, W. Sha and R.R. AIfano, Effects of self-absorption by hemoglobins on the fluorescence spectra from normal and cancerous tissues, Lasers Life Sci., 3 (3) (1990) 167.
[5] R.R. Alfano, B.B. Das, J. Cleary, R. Prudente and E. Celmer, Light sheds light on cancer-distinguishing malignant tumors from benign tissues and tumors, Bull. NYAcad. Med., Ser. 2, 67 (2) ( 1991 ) 143- 150.
[6] A. Pradhan, B.B. Das, K.M. Yoo, R.R. Alfano, J. Cleary, R. Prudente and E. C.elmer, Time-resolved UV photoexcited fluorescence kinetics from cancerous and non-cancerous breast tissues, Lasers Life Sci., 4 (4) (1992) 225.
[7] L.I. Deckelbaum, J.K. Lain, H.S. Cabin, K.S. Clubb and M.B. Long, Discrimination of normal and atherosclerosis aorta by laser induced fluorescence, Lasers Sug. Med., 7 (1987) 330-335.
[8] R.E. Petras, R.R. Kortum, L. Tong, M. Fitzmaurice, M. Feld and M. Sivak, Fluorescence spectroscopy of colonic adenomas: implications for an endoscopic laser diagonostics system, Gasirointest. Endosc., 35 (1989) 181-182.
[9] P.S. Andersson, A. Gustafson, U. Stenram, K. Svanborg and S. Svanberg, Diagnosis of arterial atherosclerosis using laser induced fluorescence, Laser Med. Sci., 2 ( 1987 ) 261-270.
[I0] W.S. Glassman, CH. Liu, G.C. Tang, S. Lubicz and R.R. AIfano, Ultraviolet excited fluorescence spectra from non-malignant and malignant tissues of the gynecological tract, Lasers Life Sci., 5 (1992) 49-58.
[ I I ] C.H. Liu, B.B. Das, W.L.S. Glassman, G,C. Tang, K.M. Yoo, H.R. Zhu, D.L. Akins, S.S. Lubicz, J. Cleary, R. Poudente, E. Celmer, A. Caron and R.R. Alfano, Raman, fluorescence and time-resolved light scattering as optical diagnostic techniques to separate diseased and normal biomedical media, J. Photochem. Photobiol. B: Biol., 16 (1992) 187-209.
[12] A. Pradhan, Fluorescence spectroscopic properties of normal and abnormal biomedical materials, Ph.D. Thesis, The City University of New York, 1991.
[13] J.R. Lakowicz, H. Szmacinski, K. Nowaczyk and M.L. Johnson, Fluorescence lifetime imaging of free and protein-bound NADH, Biochemistry, 89 (1992) 1271-1275.
[ 14] H. Schneckenburger and K. K6nig, Fluorescence decay kinetics and imaging of NAD(P)H and flavin as metabolic indicators, Opt. Eng., 31 (1992) 1447-1451.
[15] A. Gafni and T. Brand, Fluorescence decay studies of reduced nicotinamide adenine dinucleotide in solution and bound to liver alcohol dehydrogenase, Biochemistry, 15 ( ! 976) 3165-3 ! 71.
[ 16] J.C. Brochon, P. Wahl, J.M. Jullon and M. Inatsuba, Pulse fluorimetry study of beef liver glutamate dehydrogenase reduced nicotinamide adenine dinucleotide phosphate complexes, Biochemistry, 15 (1976) 3259-3265.
[ 17] AJ.W.G. Visser and A.V. Hock, The fluorescence decay of reduced nicotinamides in aqueous solution after excitation with a UV-mode- locked argon laser, Journal, 33 ( 1981 ) 35-40.
[ 18 ] G. Krishnamoorthy, N. Periasamy and B. Veukataraman, On the origin of heterogeneity of fluorescence decay kinetics of reduced nicotinamide adenine dinucleotide, Biochem. Biophys. Res. Commun., 144 (1987) 38%392.
[19] A.G. Szabo and D.M. Rayner, Fluorescence decay of tryptophan conformers in aqeuous solution, J. Am. Chem. Soc., 102 (1980) 554- 563.
[20] A.S. lto, A.M.D. Castrucci, V.J. Houby, M.E. Hadley, D.T. Krajcarski and A.G Szabo, Structure-activity correlations of melanotropin peptides in model lipids by tryptophan fluorescence studies, Biochemistry, 32 (1993) 12 266-12 272.
[21] M.C. Chang, J.W. Petrich, D.B. McDonald and G.R. Fleming, Non- exponential fluorescence decay of tryptophan, tryptophylglycine and glycyltryptophan, J. Am. Chem. Soc., 105 (1983) 3819-3824.
[22] J. Chen, F. Gai and J.W. Petrich, Single exponential fluorescence decay of the non-natural amino-acid 7-azatryptophan and the non- exponential fluorescence decay of tryptophan in water, J. Phys. Chem., 98 (1994) 2203-2209.
[23] K.J. Willis and A.G. Szabo, Conformation of parathyroid hormone. Time-resolved fluorescence studies, Biochemistry, 31 (1992) 8924- 8931.
[24] J.B.A. Ross, H.R. Wyssbrod, R.A. Porter, G.P. Schwartz, C.A. Michaels and W.R. Laws, Correlation of tryptophan fluorescence intensity decay parameters with H-I NMR-determined rotamer conformations - - (tryptophan 2)oxytocin, Biochemistry, 31 (1992) 1585-1594.
[ 25 ] H. Watanahe, I.R. Nabi and A. Raz, The relationship between mobility factor receptor internalisation and the long colonic capacity of murine melanoma cells, Cancer Res., 51 ( 1991 ) 2699-2705.
112 A. Pradhan et al. / Journal of Photochemistry and Photobiology B: Biology 31 (1995) 101-112
[26] F. Babai and A. Royal, Rat myoblastic sarcoma cell lines. A model for the study of invasion, metastasis and myogenic differentiation, Lab. Invest., 70 (6) (1994) 907-915.
[27] B. Zelent, T. Ganguly, L. Farmer, D. Gravel and G. Durocher, Studies on the photophysical properties of some 2,7-dimethoxycarbazoles in various environments by steady-state and time-resolved spectroscopic methods. 1. Synthesis, absorption and fluorescence spectra at room temperature, J. Photochem. Photobiol. A: Chem., 56 ( 1991 ) ! 65-18 I.
[ 28 ] E.L. Wehry, Modern Fluorescence Spectroscopy, Vol. 2, Plenum, New York, 1976.
[29] T. Ganguly, L. Farmer, W. Li, J.Y. Bergeron, D Gravel and G. Durocher, Photophysics ofa 2,7-dimethoxy-N-methylcarbazole-based polysiloxane, Macromolecules, 26 (1993) 2315.
[30] D.B. Bivin and MI. Khoroshev, Fluorescence lifetime measurements on some tryptophan-containing diketopiperazines, J. Photochem. Photobiol. A: Chem., 78 (1994) 209-214.
[31] W. Lohmann, T. Nickel, E. Schmidt and M Ibrahim, Native fluorescence of plasma from patients with acute leukemias, Naturwissenshaften, 75 (7) (1988) 365-367.
[32] W. Lohmann, J. Mussman, C. Lohmann and W. Konzel, Native fluorescence of the cervix uteri as a marker for dysplasia and invasive carcinoma, Eur. J. Obstet. Gynecol. Reprod. Biol., 31 (3) (1989) 249-252.
[33] W. Lohmann, C. Lohmann, J. Mussman and W. Konzel, Native fluorescence of unstained cryo-sections of the cervix uteri compared with histological observations, Naturwissenshaften, 76 (3) (1989) 125-127.
[34] J.P. Schwartz, J.V. Possoneau, G.S. Johnson and I. Pastan, The effect of growth conditions on NAD+/NADH ratio in normal and transformed fibroblasts, J. Biol. Chem., 249 (1974) 4138.
[35] R.R. Kortum, R.P. Rava, R.E. Petras, M. Fitzmanrice, M. Sivak and M.S. Feld, Spectroscopic diagnosis of colonic dysplasia, Photochem. Photobiol., 53 (6) ( 1991 ) 777-786.
[36] E. Gudgin, R. Lopez-Deigado and W.R. Ware, Photophysics of tryptophan in H20, D20 and in non-aqueous solvents, J. Phys. Chem., 87 (1983) 1559-1565.
[37] J.B.A. Ross, K.W. Romslang and L. Brand, Time-resolved fluorescence and anisotropy decay of the tryptophan in adrenocorticotropin-(1-24), Biochemistry, 20 ( 1981 ) 4361-4369. M.A. Couple, F. Merola, P. Tane, D. Garzella, A. Delboulbe, T. Hara and M. Billardon, First use of the UV super-ACO free electron laser: fluorescence decays and rotational dynamics of the NADH co-enzyme, Rev. Sci. lnstrum., 65 (5) (1994) 1485-1495. J.R. Lakowicz, P.A. Koen, H. Szmacinski, I. Gryczynski and J. Kusba, Emerging biomedical and advanced applications of time-resolved fluorescence spectroscopy, J. Fluor., 4 ( 1 ) (1994) 117-135.
[38]
[391


